Annual Report 2025
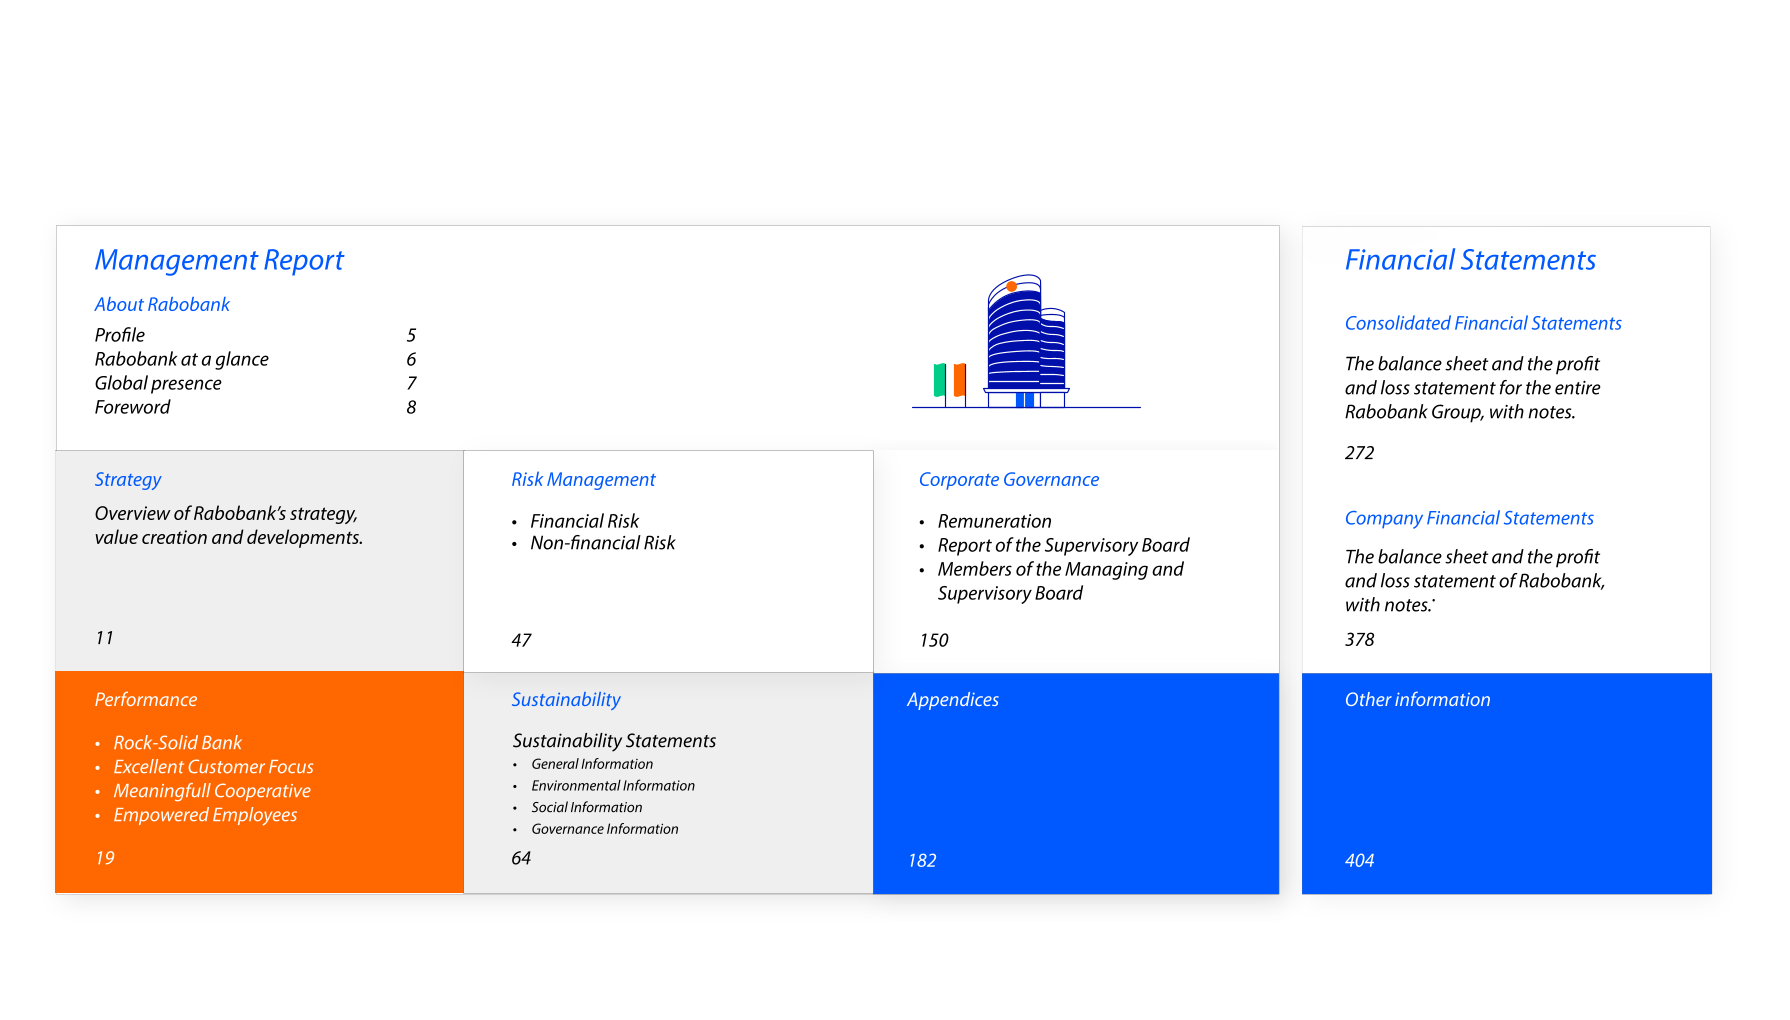
Contents
About Rabobank

Profile
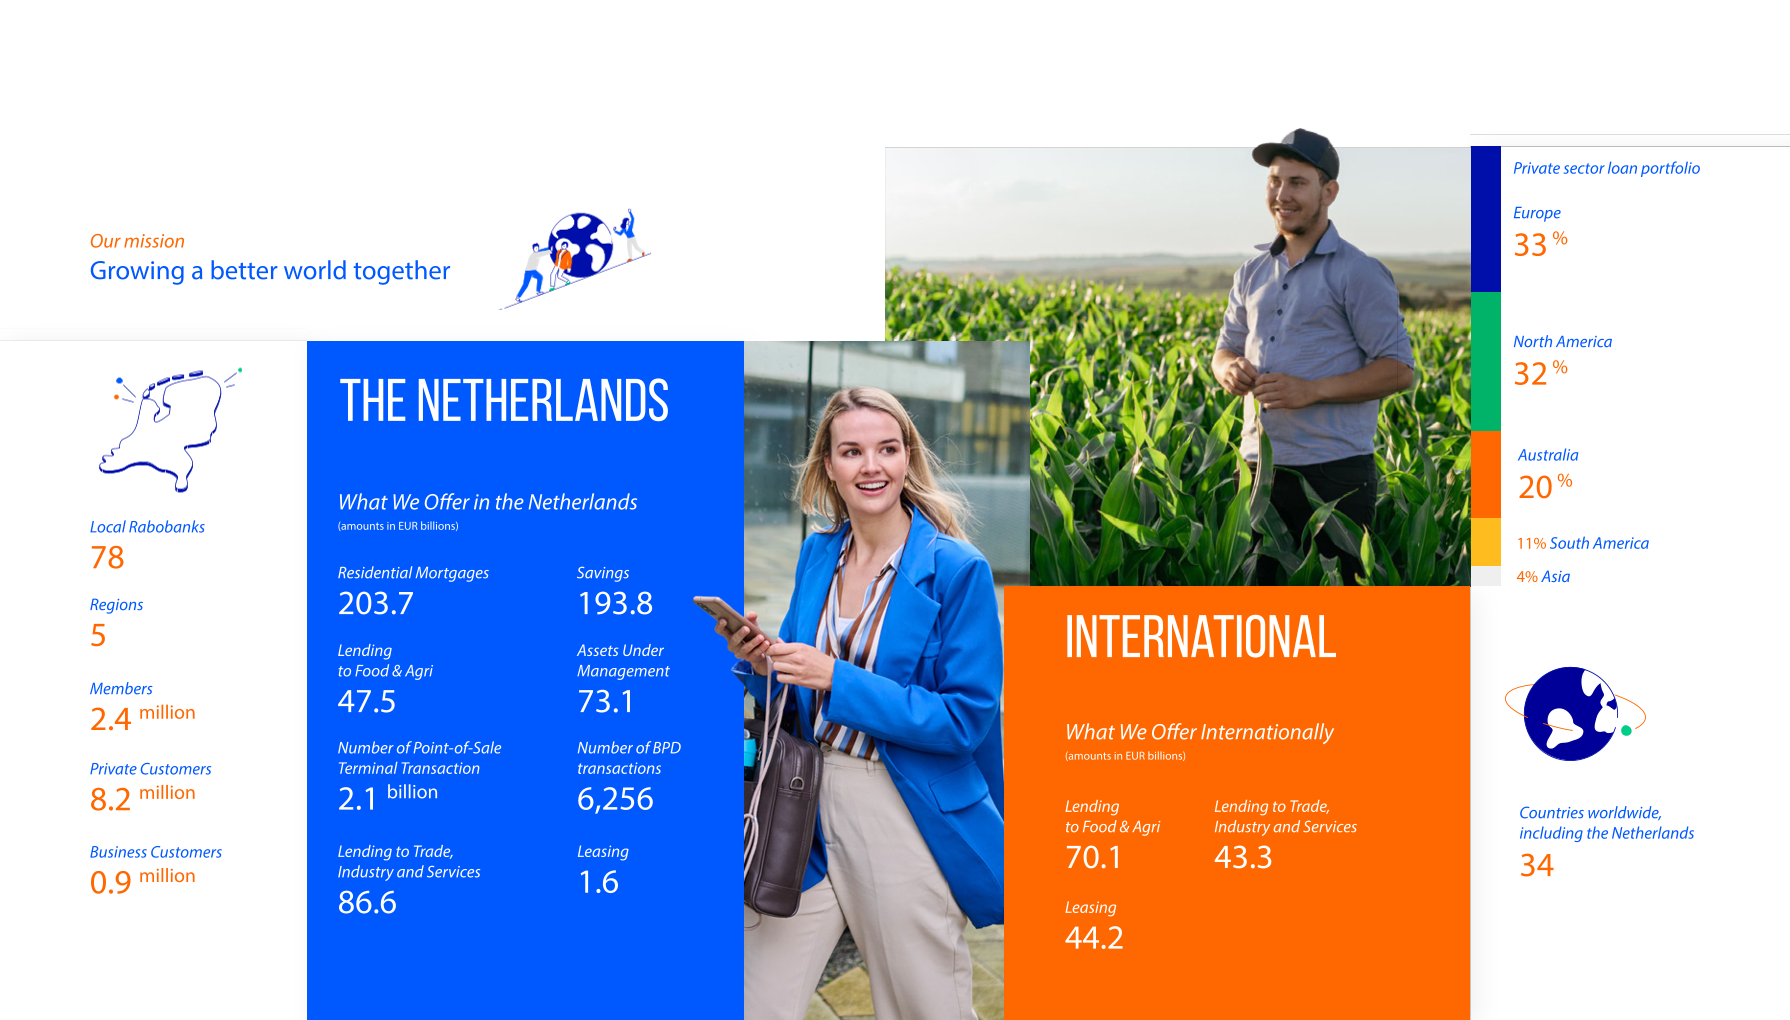
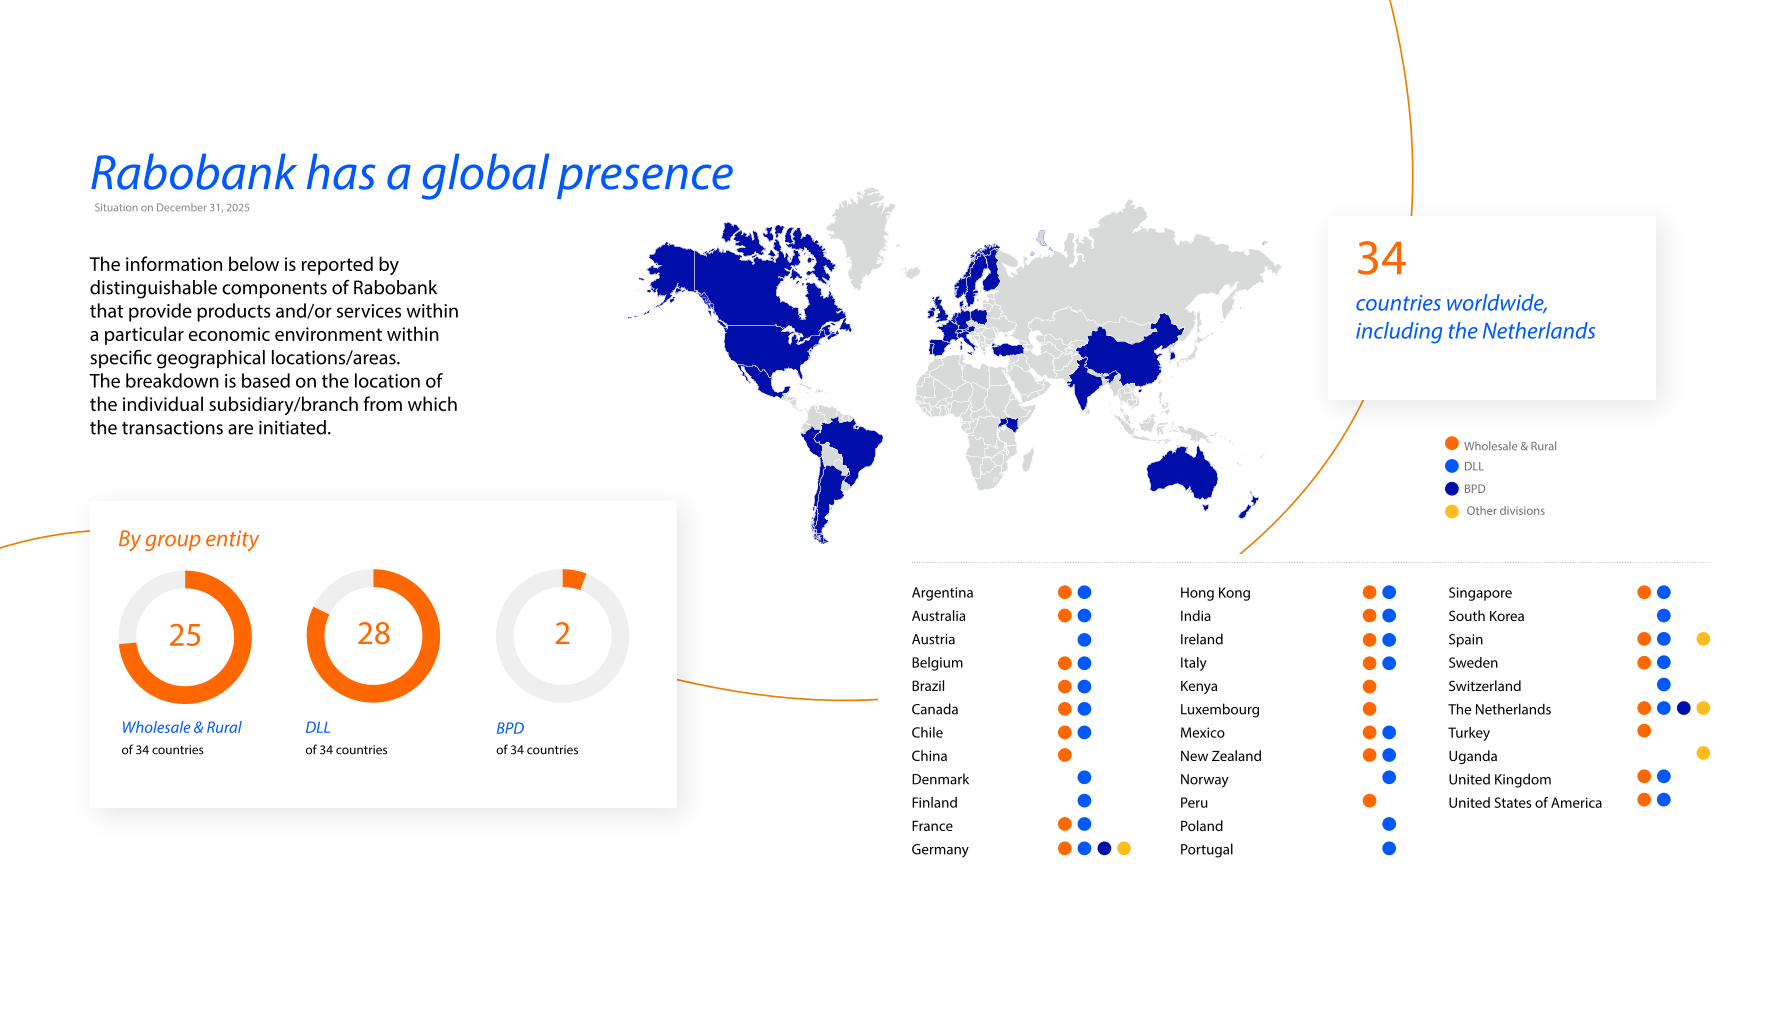
Rabobank is an international cooperative bank with Dutch origins. For over 125 years, collaboration has been at the heart of everything we do. Today, we employ more than 48,000 colleagues across 34 countries. In the Netherlands, we offer financial products and services to both private and commercial customers. Worldwide, we focus on the Food & Agri sector. Our guiding principle is that together, we accomplish far more than we ever could individually.
Who We Are
Rabobank is more than just a bank. We are a cooperative – that is what sets us apart from other banks. We are a bank without shareholders, but with members and client councils. More than 2.3 million of our customers are already members. Our local presence enables us to collaborate closely with our members and customers. They tell us what is going on and what people’s concerns are, helping us to understand what matters. By listening closely, we can identify the best ways to leverage our knowledge, global network and financial solutions to support their goals. Partly thanks to our members, we aim to contribute to a more sustainable food and energy system and financially healthy communities, to gradually build a better world.
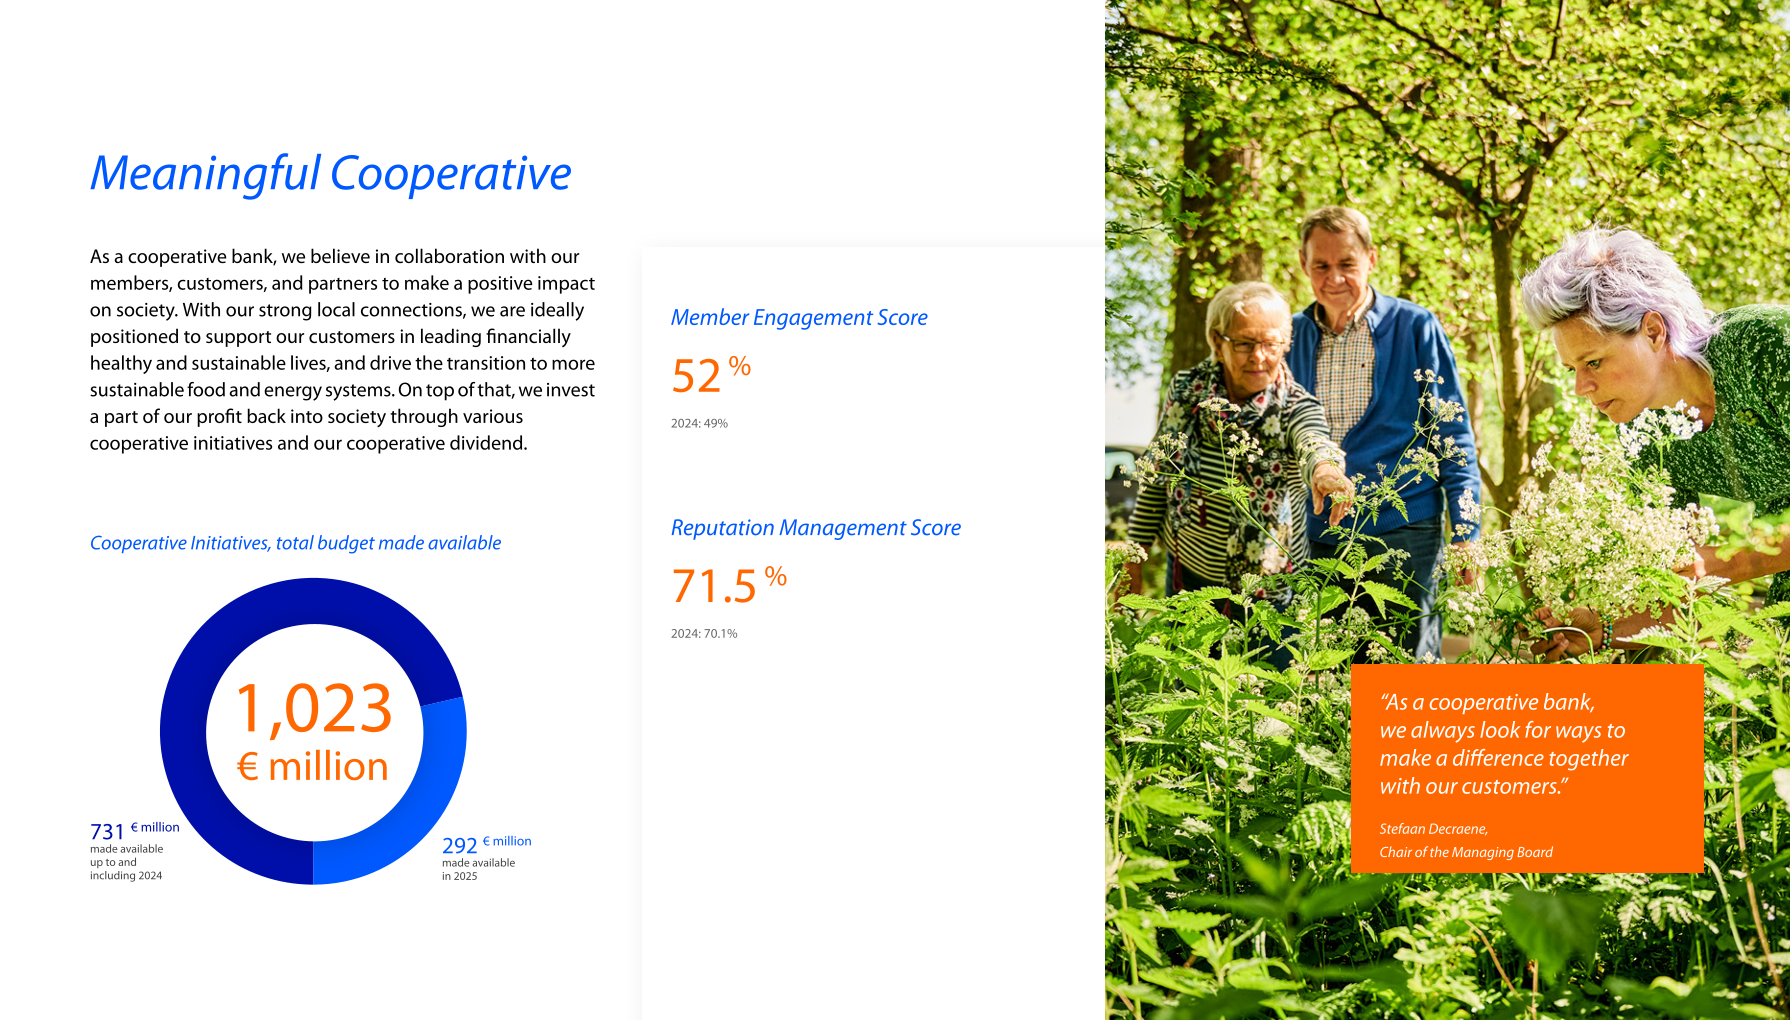
As a meaningful cooperation, we invest part of our profit back into society through cooperative initiatives and our cooperative dividend.
We are a bank without shareholders, but with members and client councils
What We Do
We now operate in 34 countries, with over 48,000 employees. In the Netherlands, we serve retail and corporate customers with a wide range of financial products and services. Globally, we focus on entrepreneurs and companies in the food and agriculture sectors. The Rabobank Group also includes BPD, Obvion and DLL, providing our customers with housing and leasing solutions.
Our Governance
Rabobank is a cooperative bank. It has a strong connection with society and organizes customer services as closely to its customers as possible. Customers of Rabobank in the Netherlands can become a member of Rabobank. Many of our customers become members because they feel involved in their local community. Alongside other Rabobank members and employees, they share their ideas and insights on the optimal ways to leverage Rabobank's expertise, networks, and financial solutions. By now, more than two million customers have become a member of Rabobank.
Member Involvement
Since Rabobank was founded in the Netherlands at the end of the 19th century, members form the foundation of Rabobank. Members play an important role in the bank’s governance and their input gives guidance to Rabobank’s development and social contribution. The members have a say in the governance of Rabobank and are represented in a staggered manner.
Rabobank at a Glance
Foreword

Recently, on a cold winter day, I found myself standing among hundreds of colorful bouquets of roses at Termeulen Roses in Almere, a family business that has been cultivating these flowers with dedication for nearly three decades. Visits like these – listening, stepping into the greenhouse, meeting the people behind the company – are among the moments of my work that I value most. A bank can only truly be meaningful if we really understand who our customers are, what drives them, and where their concerns lie.
At Termeulen Roses, I once again saw something I have often noticed among entrepreneurs: down-to-earth determination. Investing step by step, using energy efficiently, caring for people and product alike. These entrepreneurs made use of our SME sustainability contribution to make their operations more energy-efficient – precisely the kind of practical progress whose impact you can feel on the grounds, in the greenhouse, and in the surrounding community. As a cooperative bank, we can make this possible because part of our profit flows back into society – more than one billion euros since 2023 – and because our solid financial foundation enables us to genuinely strengthen customers and communities.
At the same time, our cooperative identity involves more than simply returning financial resources to society. What makes us unique is that our members are also our customers and therefore our primary stakeholders. This means that in everything we do, we strive to act in their long-term interest.
Through our products and services, we aim to empower our customers, help them look ahead, and contribute to solutions for the social challenges of today and tomorrow. It is precisely this long-term perspective and intrinsic drive to create value for people, businesses, and communities that has formed the core of Rabobank for more than a century.
Resilience and progress
We are proud to present our Annual Report for 2025, a year in which Rabobank once again achieved strong results. On February 10 of this year, we announced our figures: a net profit of nearly five billion euros. In a world that is becoming increasingly volatile – marked by geopolitical tensions, economic uncertainty, and rapid transitions – we continued to perform solidly. If I had to choose two words to characterize Rabobank over the past year, they would be resilience and progress.
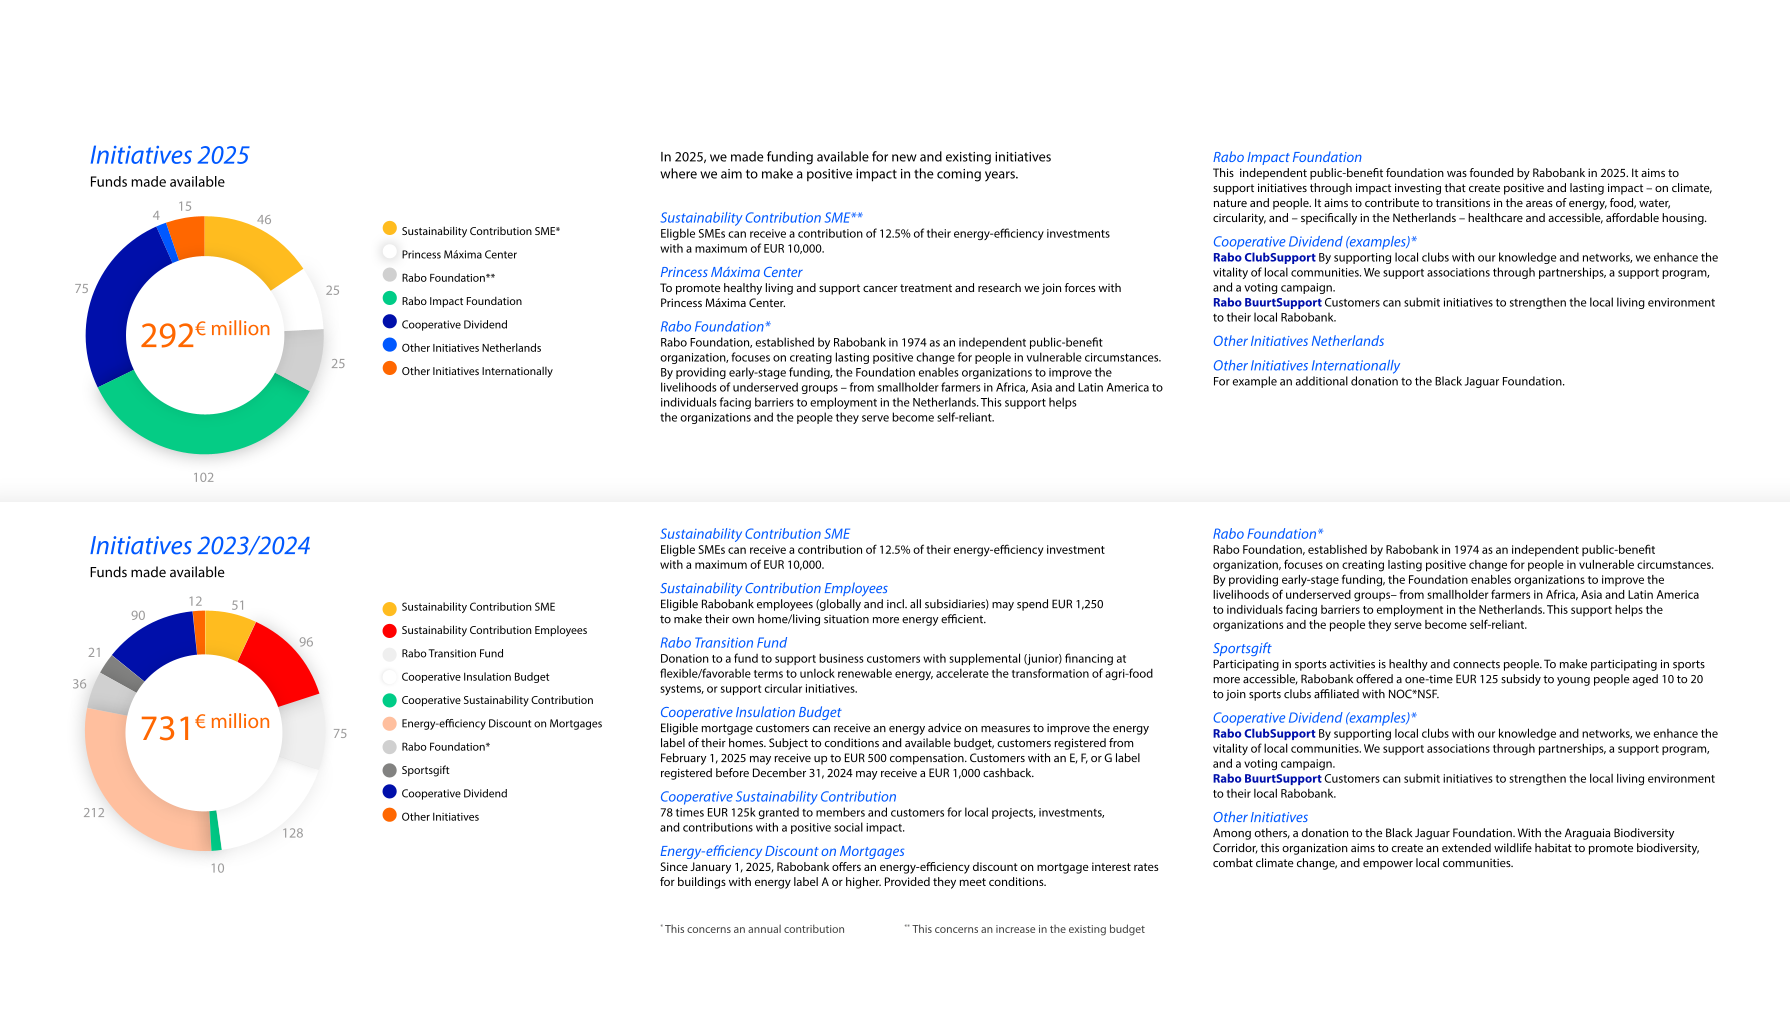
Thanks to our strong financial position and cooperative foundation, we were able to continue supporting customers while again allocating a substantial portion of our profit to social initiatives. In 2025 alone, we invested EUR 292 million in society through our cooperative programs. A highlight was the launch of the independent Rabo Impact Foundation, with which we are creating long-term impact in areas where traditional financing falls short, supported by an initial contribution of EUR 102 million.
In addition, we began a three-year partnership with the Princess Máxima Center for Pediatric Oncology, valued at EUR 60 million, to support research and the construction of a new innovation wing. These investments make the essence of our cooperative model tangible: the better Rabobank performs, the greater the difference we can make together in and for society.
Even more customer-focused in the Netherlands
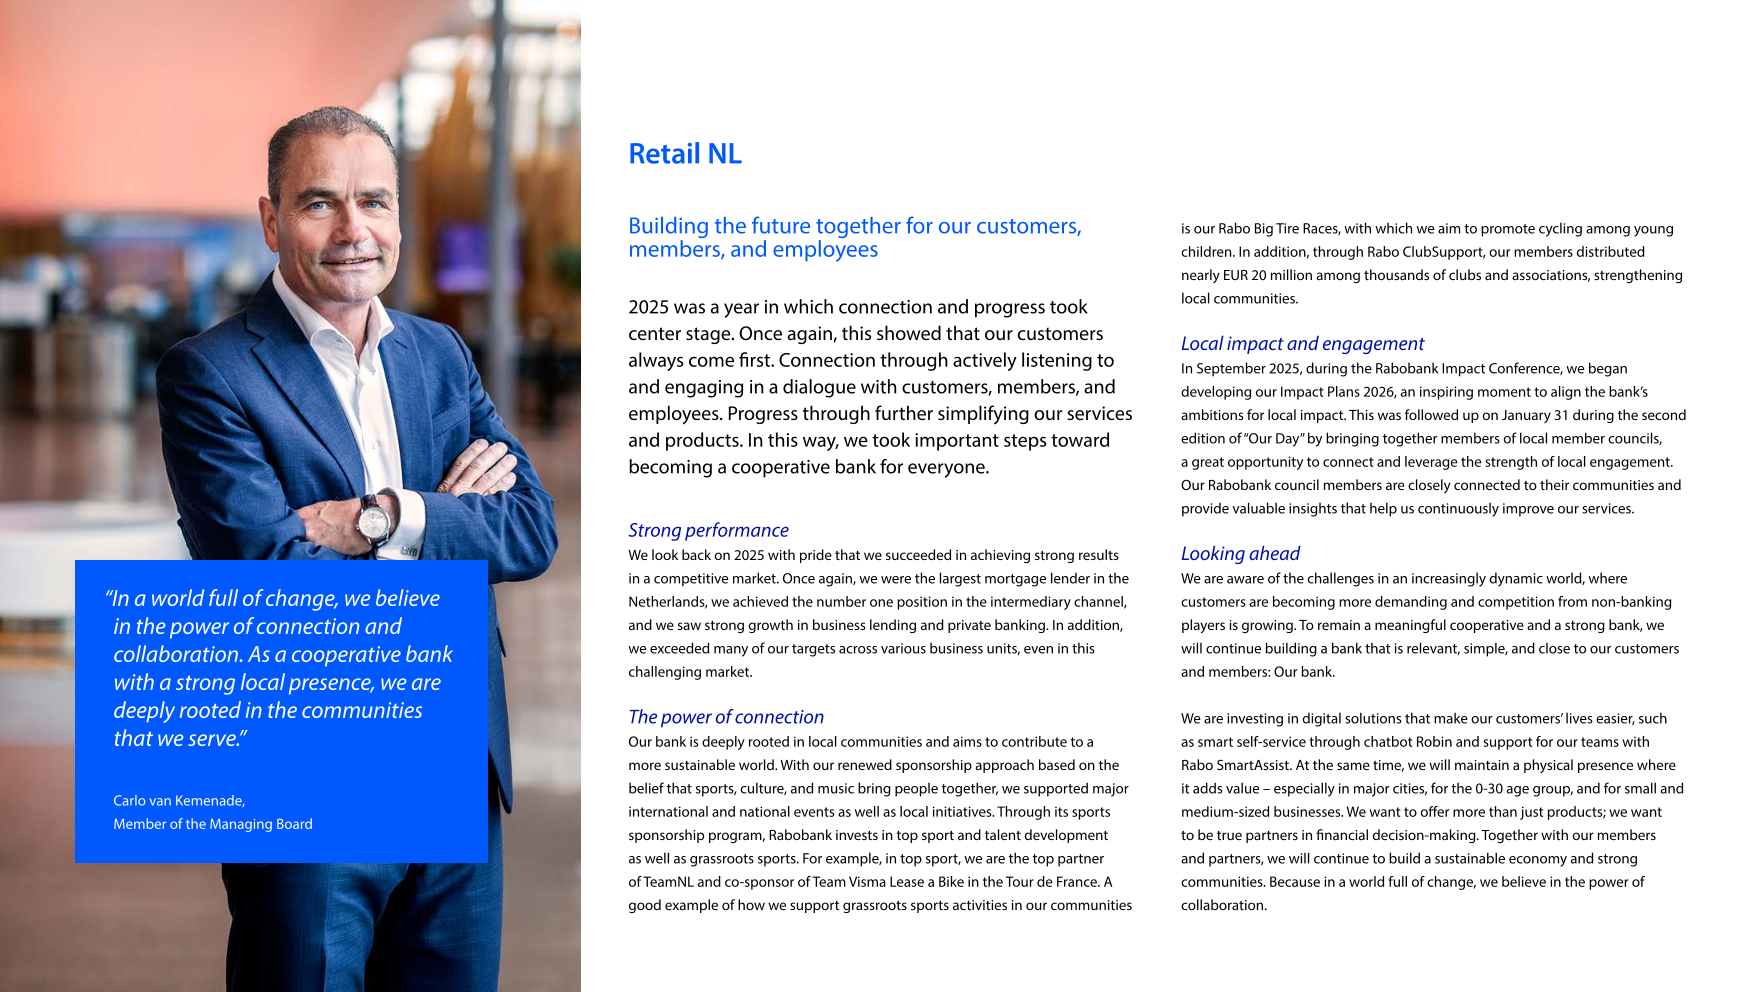
In our home market of the Netherlands, we further strengthened our position over the past year. Once again, Rabobank was the country’s largest mortgage lender. In 2025, we helped nearly 58,000 households purchase or improve their homes. We also secured the number one position in the intermediary channel, and our business lending activities saw strong growth. These results are partly due to the even more customer-focused structure of Retail NL, in which all Dutch activities for private individuals and businesses have been consolidated.
This allows us to respond more quickly to what customers need – from the housing market to business growth ambitions.
Wholesale & Rural: steady course in a turbulent world
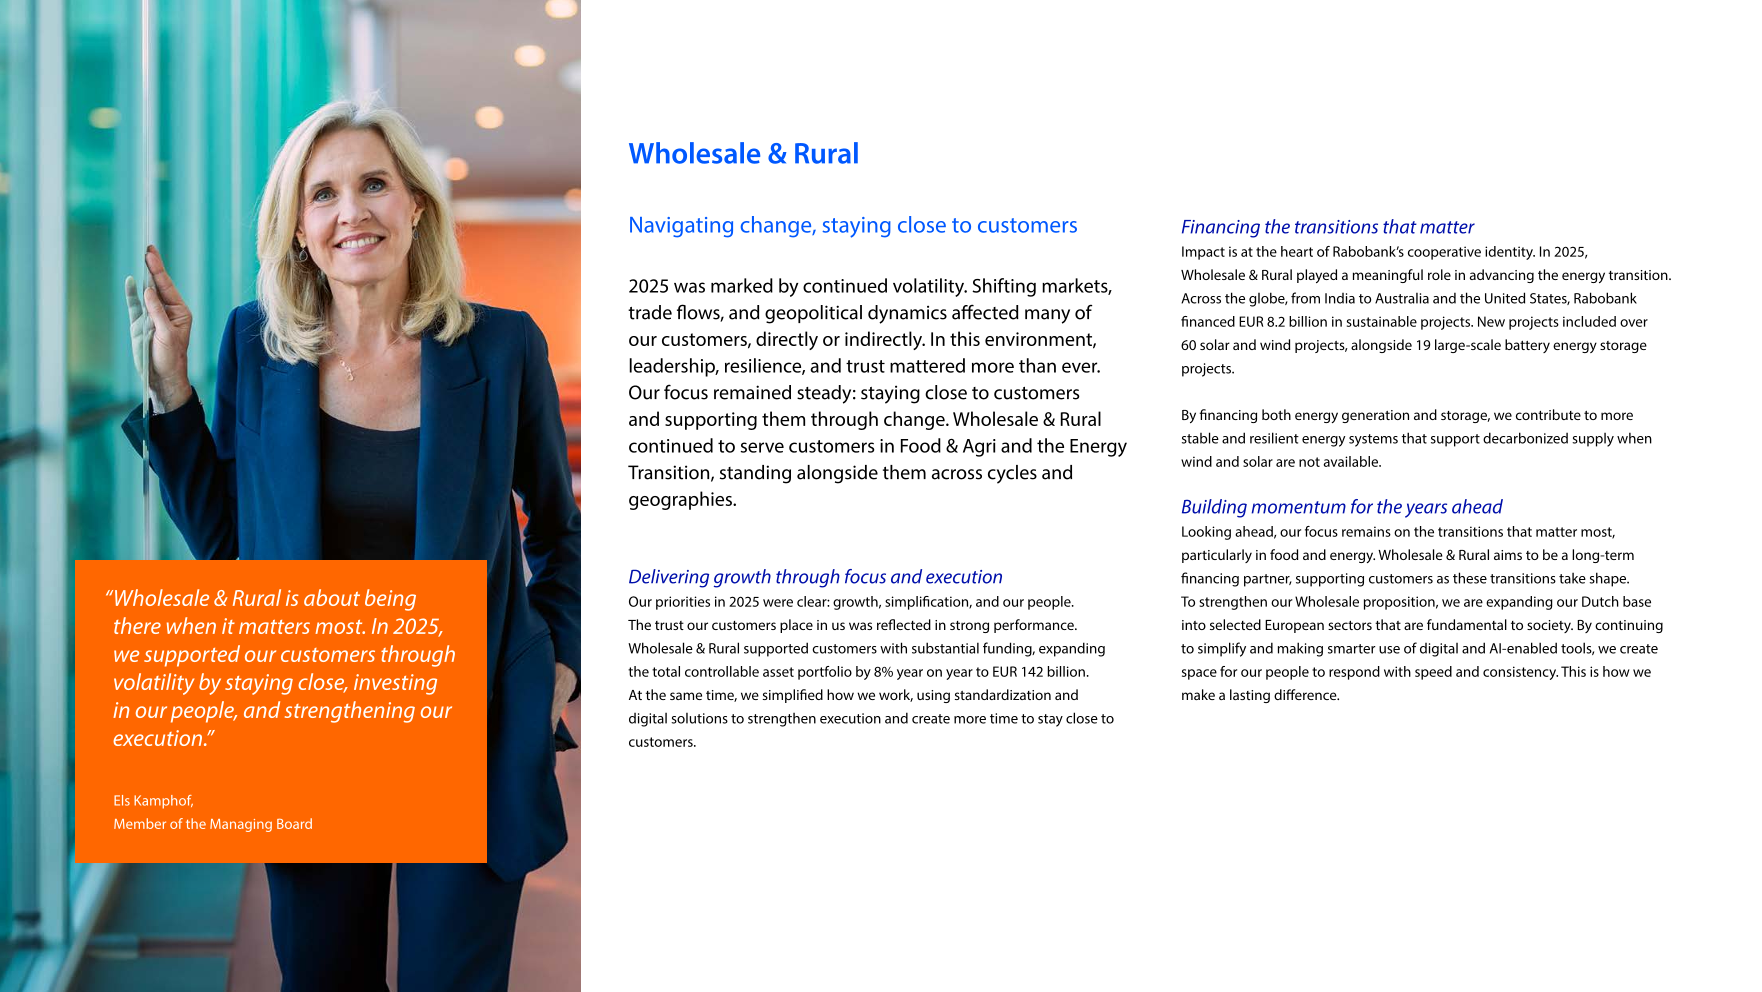
Rabobank also delivered a strong international performance. Our ambition to be the Food & Agri Bank of choice worldwide was further realized, although 2025 was a challenging year for many of our customers. Volatility, complex markets, and limited predictability called for a bank that stays close to its customers and performs consistently.
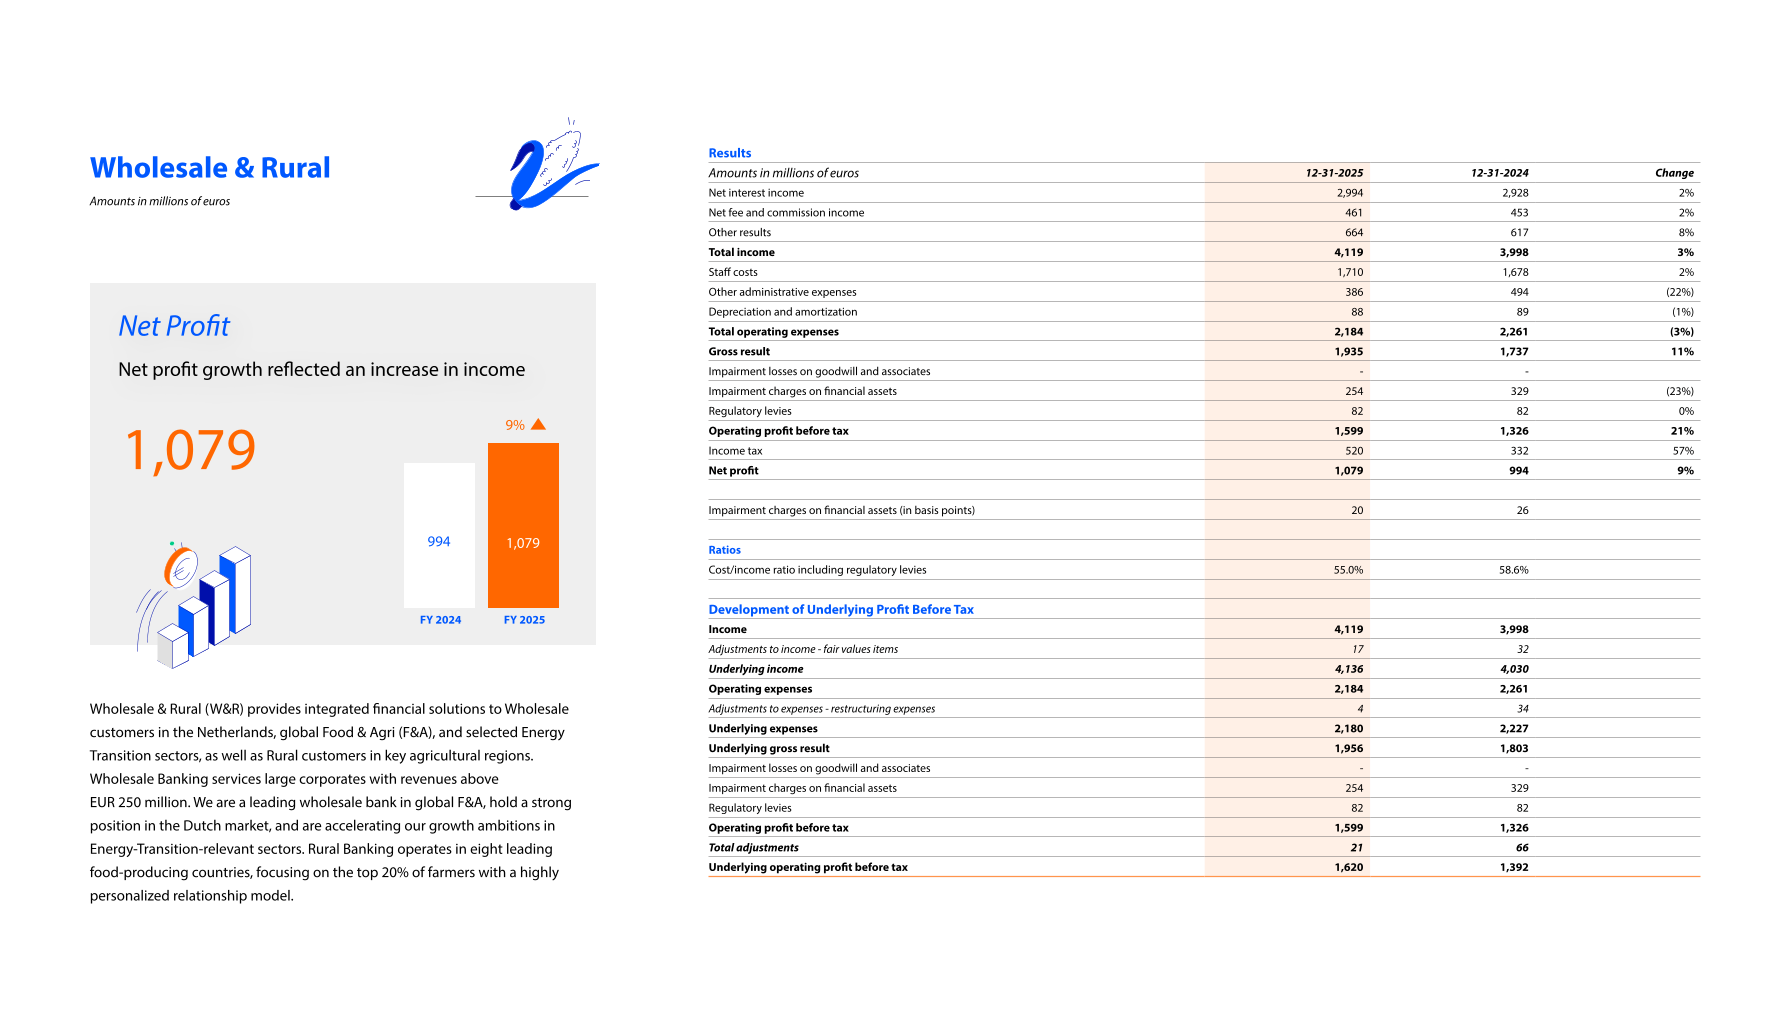
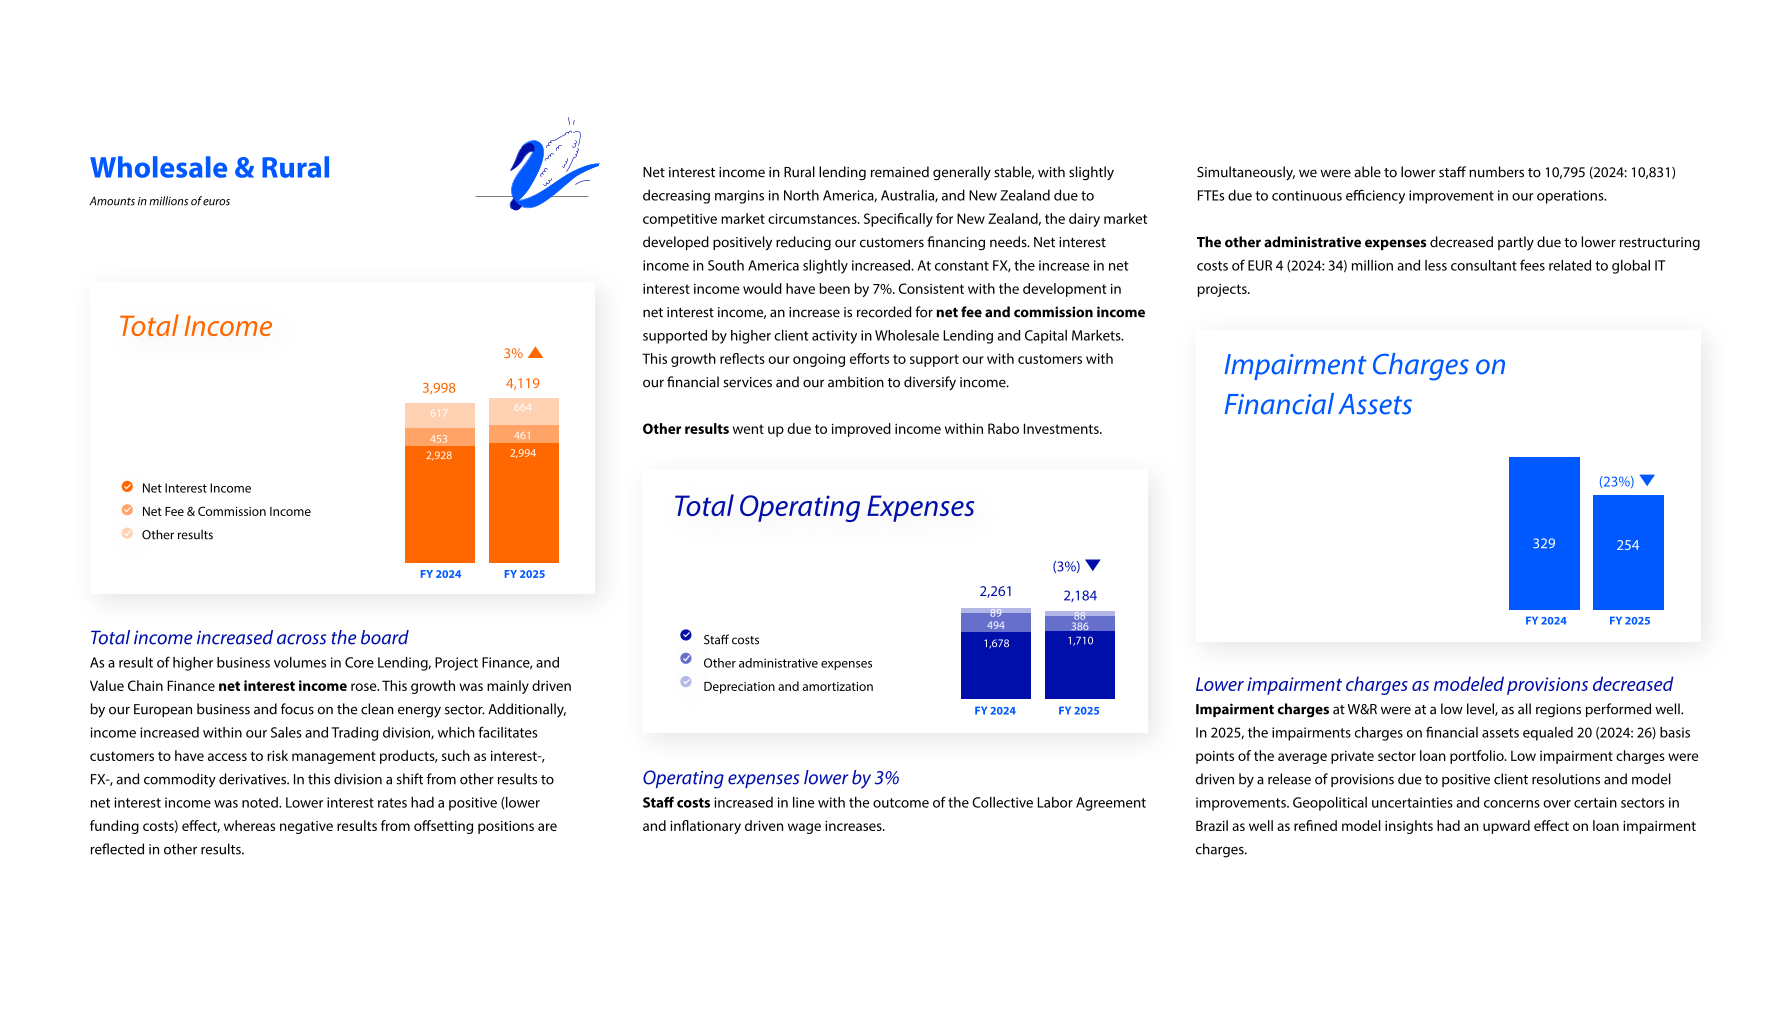
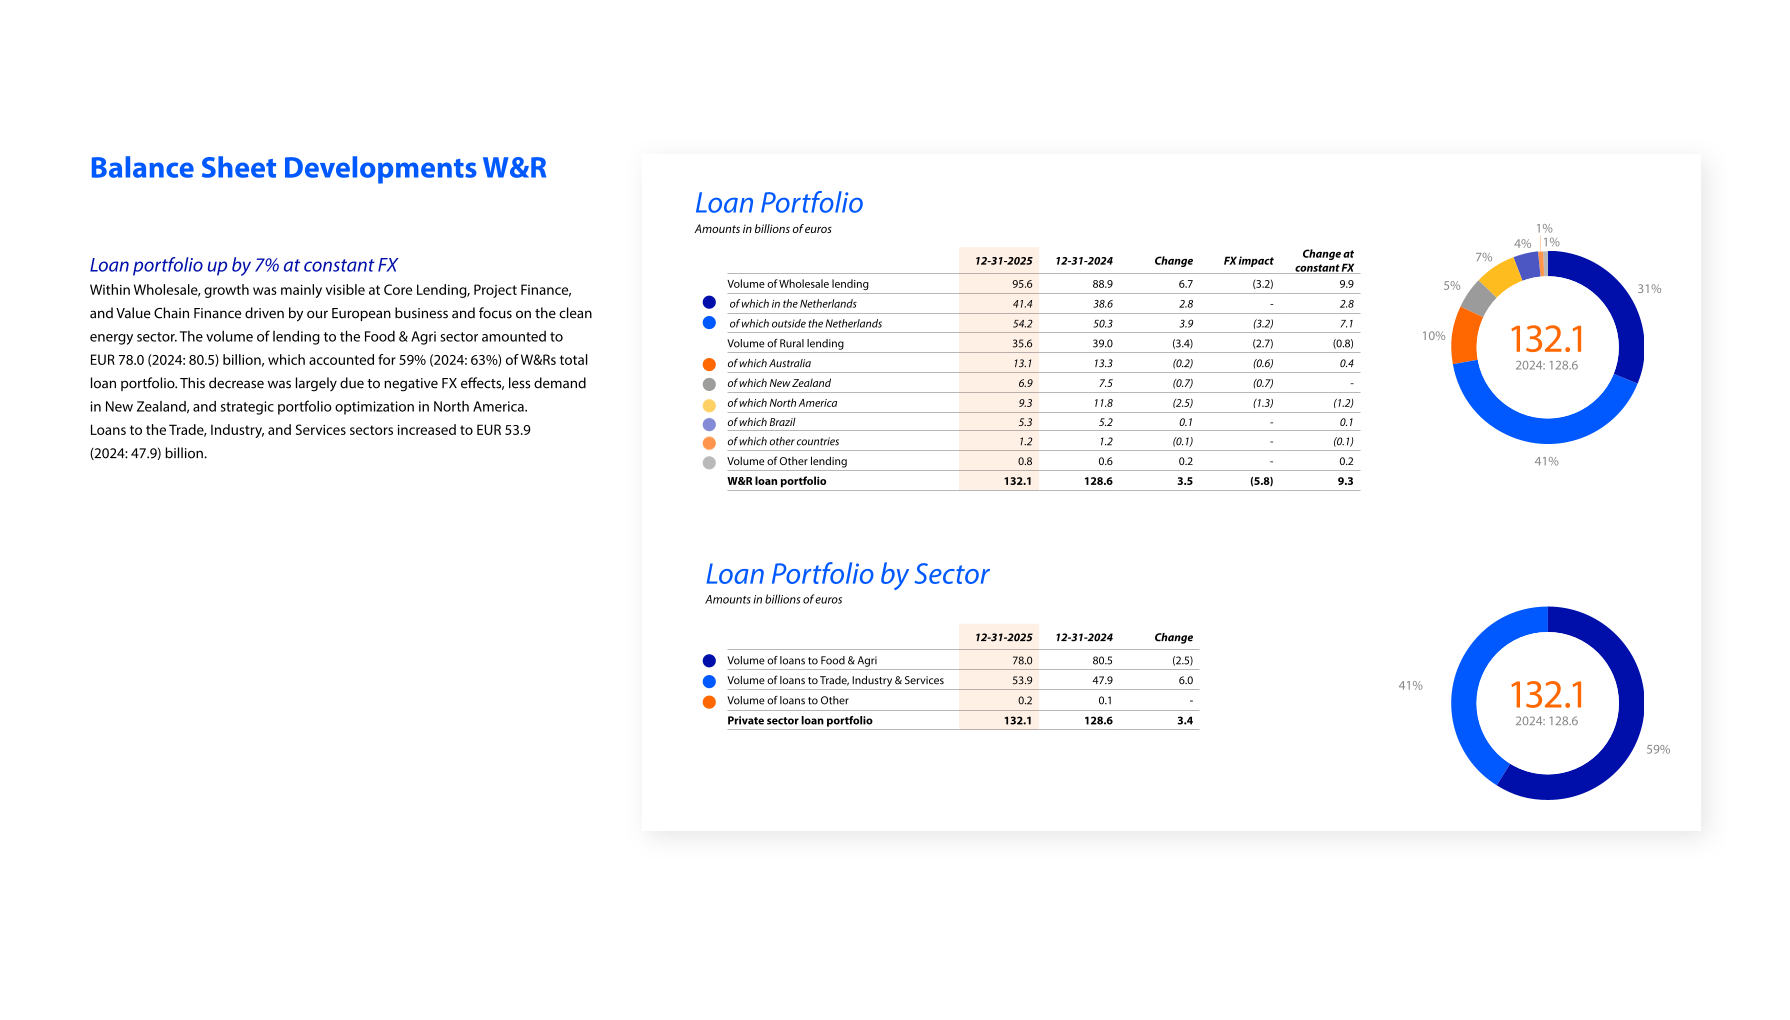
Our Wholesale & Rural division rose to that challenge. The portfolio grew by EUR 4 billion to EUR 132 billion in loans worldwide. Of this, 59% supports the Food & Agri value chain – precisely where the food transition is most urgent.
The energy transition also accelerated: outstanding sustainable project financing increased to over EUR 8 billion, including dozens of solar and wind projects and nearly twenty large-scale battery storage projects.
Remaining close to customers made a tangible difference. We helped companies continue their operations, secure financing for growth, and navigate necessary transitions. Our sector expertise and long-term commitment proved essential in an uncertain world.
In a world that is becoming increasingly volatile – marked by geopolitical tensions, economic uncertainty, and rapid transitions – we continued to perform solidly.
DLL: partner and accelerator
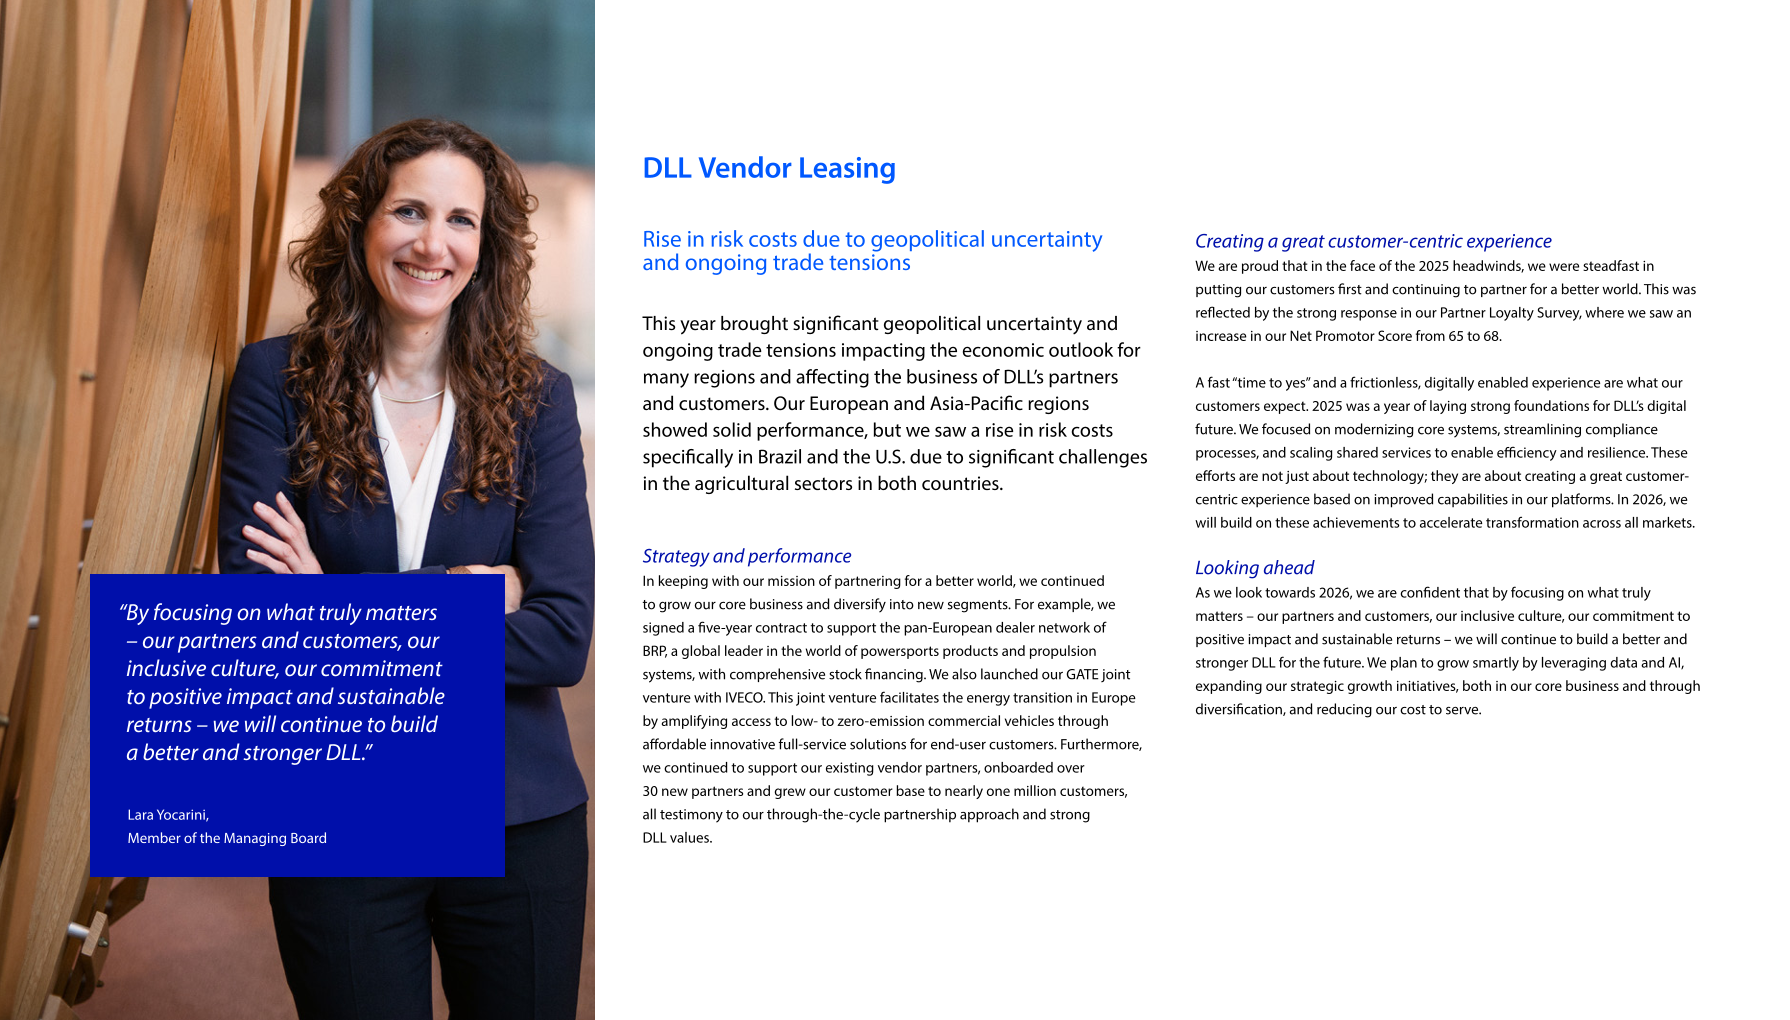
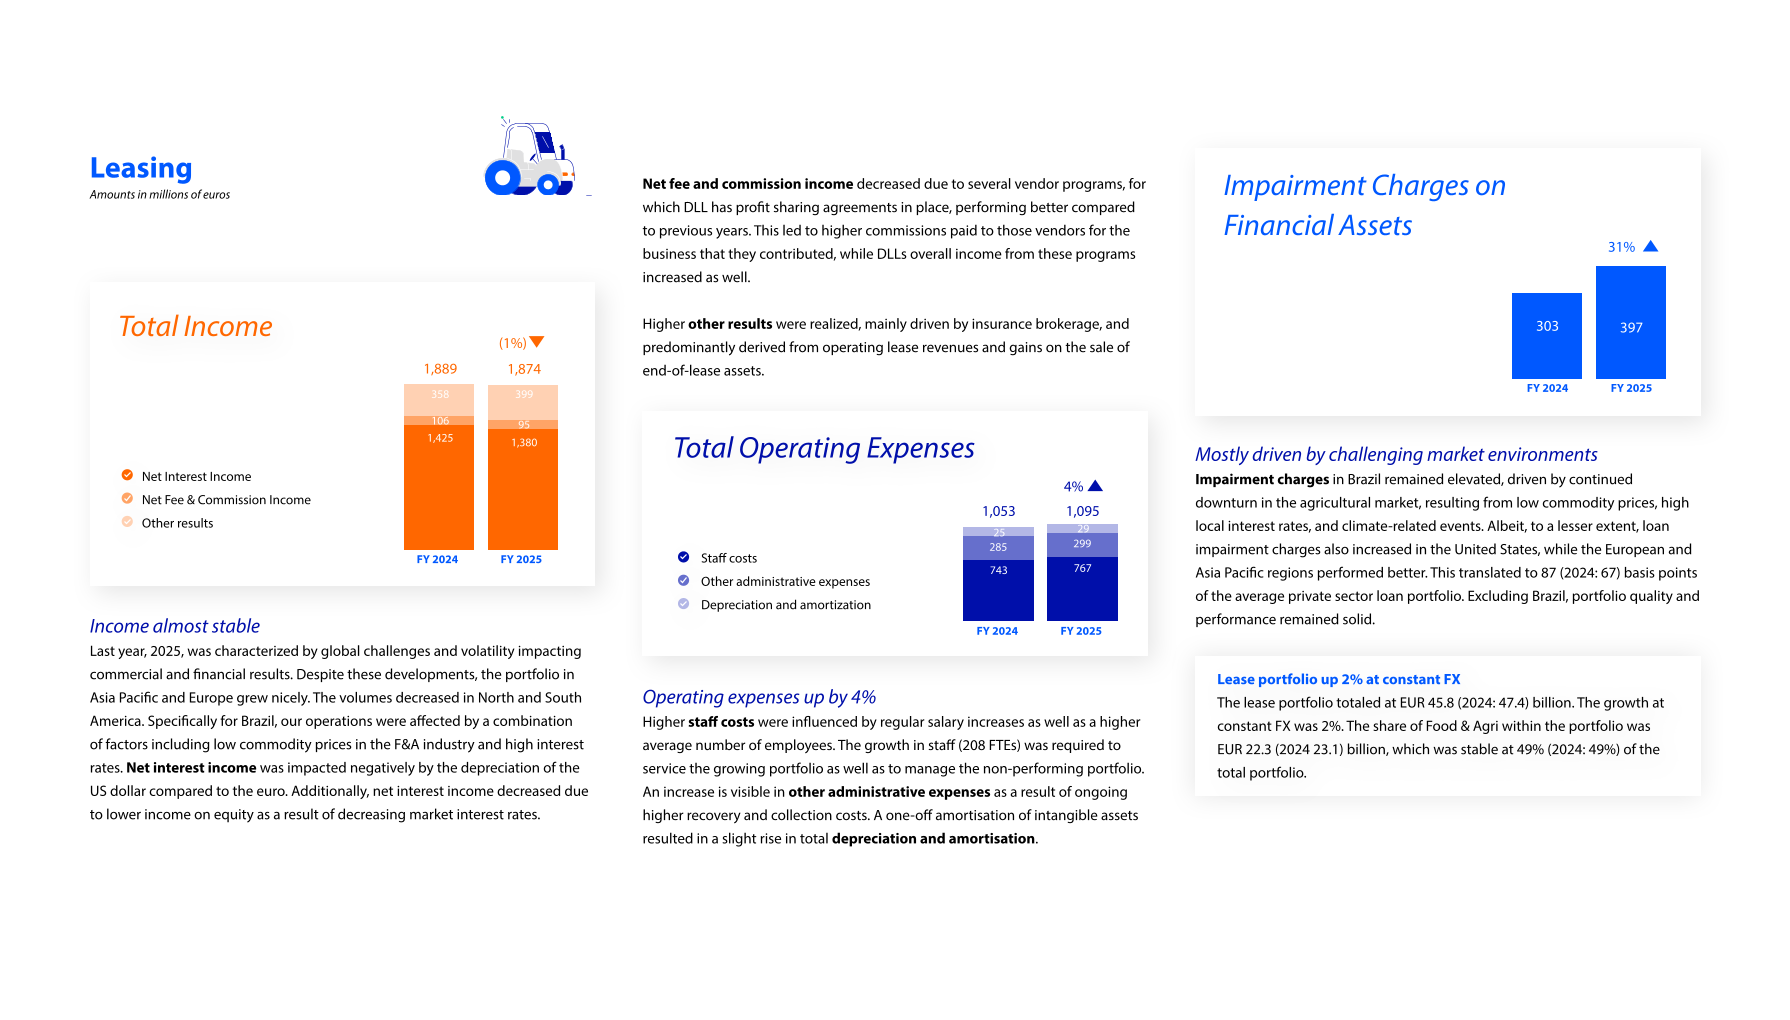
Our subsidiary DLL also operated in a turbulent environment. While Europe and Asia-Pacific delivered solid results, geopolitical unrest and tensions in the agricultural sector in Brazil and the United States led to higher risk costs. Nevertheless, DLL remained true to its core: being a partner to vendors and dealers to support their customers.
This was confirmed in the annual Partner Loyalty Survey, where the Net Promoter Score rose from 65 to 68. At constant FX rates, the lease portfolio grew by 2%, and DLL expanded its activities in both existing and new segments.
For example, a five-year contract was concluded with Bombardier Recreational Products for pan-European inventory financing. With more than 30 new partners and nearly one million customers, DLL continues to build a stronger and future-proof organization.
Cooperative initiatives: listening, connecting, acting
Our mission, Growing a better world together, remains the guiding principle in everything we do. As a cooperative bank without shareholders but with members, we can truly contribute to a better society. In the Netherlands, we strengthen the financial health of households through initiatives such as the National Coalition for Financial Health and social collections practices. And through the Rabo Impact Foundation, mentioned earlier, we are taking steps in areas of high social urgency: energy and food systems, water safety, circularity, and – specifically in the Netherlands – healthcare and affordable housing.
We remain in continuous dialogue with our customers and members, including during the National Dialogue. These conversations provide valuable insights into what is happening in society and the economy, and where Rabobank can make a difference.
AI as a driver of our cooperative strength
Within the bank, 2025 also saw a subtle yet profound shift: the way we work was redefined by the rapid rise of artificial intelligence (AI). Repetitive processes were further automated, and colleagues increasingly received support from AI applications that accelerate analysis and improve decision-making. At the same time, it became clear that human skills—creativity, critical thinking, collaboration, and empathy—are more important than ever. This combination of technological progress and strengthened human capabilities made us more agile and efficient, and helped us serve customers better and in a more personal way. AI has become not just a tool, but a driver of our cooperative strength.
We will continue on the path we have set: simplifying where possible, scaling where it adds value, and working even more closely with customers – in Retail NL, in Wholesale & Rural, and at DLL.
Urgency and responsibility in an unstable world
The world has become more unstable. This requires us to be, to use a fine Flemish word, performant: strong, efficient, productive, and at the same time close to customers and society. Our results in recent years give us the strength to carry that responsibility with conviction: a reliable partner for more than nine million Dutch customers and a cooperative that continues to return its dividend to society – financially as well as through knowledge and networks.
Looking ahead: simplicity, scale, and proximity
We will continue on the path we have set: simplifying where possible,
scaling where it adds value, and working even more closely with customers
– in Retail NL, in Wholesale & Rural, and at DLL. We will continue to invest in digitalization, data-driven operations, and operational excellence to make the customer journey simpler, faster, and more reliable. And we will continue, as in Almere, to visit customers on site. Listening, providing advice, and building solutions together – for today and for the long term.
As I stood among those bouquets of roses at Termeulen Roses, I was struck by how resilient such an apparently fragile product can be. Behind every flower lies craftsmanship, adaptability, and daily care. It is an apt metaphor for the year behind us – and for the course we will continue to pursue.
With the same dedication and calm with which a grower nurtures roses, we will continue building a bank that truly matters: firmly rooted in society, moving with the world around us, and always focused on sustainable growth.
Stefaan Decraene
Chair of the Rabobank Group Managing Board
Strategy

Trends, Developments and Outlook
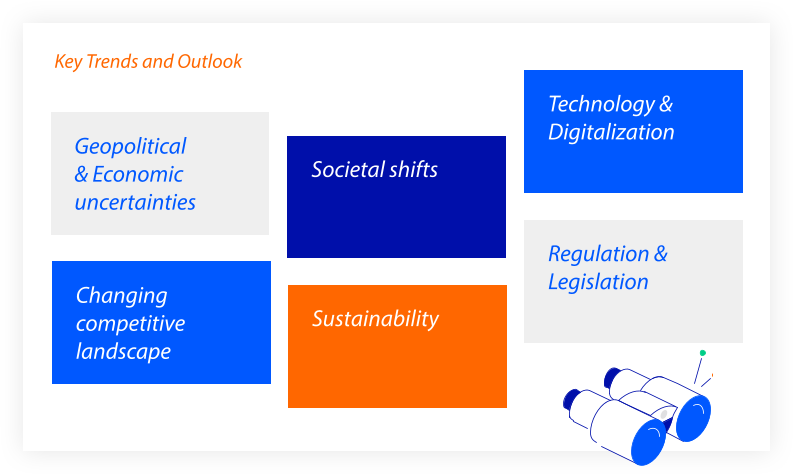
The world around us is changing at a rapid pace, redefining the future of financial services. Banks are navigating shifting geopolitical dynamics, rapid technological advancements, changing customer expectations, intensifying competition, evolving regulation and legislation, and growing sustainability demands. To strengthen our resilience and prepare for the future, we monitor key trends and their implications for our strategy. This chapter highlights six key trends shaping the financial industry.
Geopolitical & economic uncertainties
Geopolitical tensions continue to disrupt markets and reshape trade and supply chains, contributing to a more fragmented global economy. Inflation has largely normalized from its peak in 2022, and monetary policy eased further in 2025. Although baseline forecasts suggest moderate growth and further monetary easing in the year ahead, these projections are subject to a backdrop of heightened geopolitical uncertainty. The U.S.-China rivalry is set to intensify this year, driving trade realignment, supply chain diversification, and tighter investment controls. U.S. allied countries are strengthening their trade and investment ties with the U.S., signaling a shift in the global economy. At the same time, regulatory fragmentation and monetary policy divergence add complexity for global businesses. Persistent conflicts, from Russia-Ukraine to the Middle East, continue to weigh on international security.
Governments face mounting fiscal pressure: the imperative to invest in defence, climate measures, and digital infrastructure coincides with rising costs of ageing societies and higher debt-service burdens. Central banks are reassessing their roles as balance sheet normalization and expanded mandates blur lines with fiscal policy. Global forums (such as G20 and G7) are showing signs of strain as sovereignty and strategic autonomy gain prominence, particularly in Europe, where defense spending is on the rise. Businesses should prepare for continued geopolitical realignment, governance challenges, and market volatility, requiring resilience and strategic flexibility.
Changing competitive landscape
Over the past years, banks have benefited from favorable market conditions such as peaks in global wealth and strong revenue margins driven by higher interest rates. As these advantages fade, banks are facing slower growth and growing pressure on profitability. As a result of the less favorable conditions, we expect that the competitive landscape within the financial sector will not only be shaped by macroeconomic developments, but also by the accurate deployment of value-driven strategies, suitable for more challenging conditions. Examples of these strategies may include a move from customer segmentation to (hyper)individualization, capital efficiency, technological advancements, and M&A. We expect that banks will continue looking for further economies of scale, cut costs, and access advanced technology. Furthermore, the rise of Banking-as-a-Service (BaaS) will continue to fuel the growth of innovative platforms, including FinTechs and Neobanks, often in partnership with traditional players. The expansion of non-bank competitors like Tech giants intensifies the already fierce competition. Given the changing dynamics within the financial landscape, traditional banks should be agile and proactive, adapting their strategies to withstand mounting pressure from embedded finance and technology-driven challengers.
Societal shifts
Generational shifts are reshaping society and business. By 2030, Millennials and Gen Z will make up more than 70% of the global workforce. Combined with aging and the lower birth rates, this trend will continue to increase pressure on labor markets, welfare systems, and financial services. For the banking industry, this means adapting to serve diverse segments simultaneously: elderly customers, younger generations, and immigrants. Banks must rethink retirement planning and post-retirement support for a population living longer, while also meeting the expectations of younger customers who prioritize digital-first experiences, sustainability, and social values. At the same time, the future of work is being changed by rapid technological advancements. Building AI literacy will become essential - not only for technical roles, but across all functions. Customers expect full control over their personal data and demand that banks handle this information with transparency, trust, and care. Building frameworks for privacy and identity management will be important to maintain confidence and meet regulatory and societal expectations. Lastly, organizations face a stronger demand for wellbeing, flexibility, and a life-centric approach.
To retain employees, customers, and partners, banks must foster innovation, embrace inclusivity, and build resilience.
Sustainability
Natural disasters are increasingly impacting the world. Extreme weather events and biodiversity loss are tangible, impacting communities and economies globally. Climate resilience, water scarcity and quality, and land degradation are significant environmental issues. Urban areas are increasingly confronted with heat challenges, food insecurity and inequality. Energy challenges relate to grid reliability and battery availability. On the one hand technological innovation can unlock solutions and accelerate progress ranging from clean-energy adoption and enhanced risk detection to carbon capture and emissions-reduction technologies. On the other hand, developments in the EU regarding regulations and commitments, the transition of the Net-Zero Banking Alliance (NZBA) from a membership “commitment” to a non-membership “framework”, delays in the Omnibus Directive and a pushback in the US on ESG regulations imply a less regulatory driven incentive for sustainability. Businesses confirm that the business case for sustainability has strengthened, due to supply chain impacts and risk management. The majority of CEOs plans to maintain or expand their sustainability commitment. This business perspective requires tangible strategies and business solutions, beyond compliance, to remain competitive. Yet public messaging remains cautious, due to greenwashing risks and increase in climate litigation.
Technology & Digitalization
The financial sector is experiencing rapid digital transformation driven by advancements in artificial intelligence, cloud computing, and blockchain. AI is increasingly applied to improve risk management, fraud detection, and customer personalization, while generative AI is streamlining operations and software development. In addition, discussions around protectionism, security, EU sovereignty, and technological independence are becoming increasingly important as institutions seek to balance innovation with strategic autonomy. Cloud adoption continues to accelerate, enabling scalability and cost efficiency. However, the heavy dependence on US vendors warrants a resilience-focused approach. Blockchain, decentralized finance, and tokenization are transforming payment systems. Open banking and API-driven ecosystems are increasing collaboration between traditional institutions and FinTech, creating new revenue streams and competitive dynamics. At the same time, cybersecurity and digital trust remain critical priorities as regulatory pressures and geopolitical risks intensify. The growing use of AI and generative AI is heightening focus on ethical use, bias mitigation, and transparency, as stakeholders expect banks to manage algorithms responsibly. Institutions that embed data analytics, AI, and cloud into their strategies will gain agility and resilience, while those that lag risk losing relevance in an increasingly digital-first market. Meanwhile, agentic AI is emerging as a proactive technology, enabling autonomous decision-making and risk anticipation, and is poised to play a major role in the years ahead. Quantum computing is also on the horizon, with the potential to disrupt current encryption standards and require new cryptographic approaches to secure financial data. Competition and emerging technologies will continue to test operational resilience and change financial service delivery, increasing customer experiences and workforce expectations. Maximizing revenues and optimizing cost efficiency will be prioritized. Maintaining customer trust through secure digital services, digital inclusion and intelligent AI solutions will be crucial.
Regulation & Legislation
In 2025, the regulatory landscape evolved significantly. The EU advanced Basel III reforms through the Capital Requirements Regulation (CRR III) and Credit Requirements Directive (CRD VI), introducing new credit and operational risk standards. Supervisory bodies strengthened risk-based, data-driven oversight, issuing crypto asset market abuse guidelines and tightening expectations on sustainable finance disclosures, while simultaneously pursuing simplification through the European Omnibus agenda. Looking ahead, global financial regulation is expected to fragment as national authorities prioritize domestic competitiveness over global harmonization, creating complexity for cross-border firms. Industry outlooks highlight stablecoins and tokenized deposits as near-term disruptors, prompting banks to make strategic decisions on issuance, custody, and processing. The European regulatory agenda will be shaped by technological innovation, with supervisory priorities shifting toward digital assets and AI governance. New frameworks are likely to emerge to address risks from tokenized deposits, stablecoins, and algorithmic decision-making. Operational resilience and cybersecurity will remain top priorities under Digital Operational Resilience Act (DORA), requiring solid IT risk management and third-party oversight. As regulatory demands intensify, supervisors are increasing monitoring and enforcement to close compliance gaps. Institutions must adapt processes to maintain service quality, meet new standards, and track evolving requirements. Political uncertainty and geopolitical tensions add further complexity, while rising compliance pressure risks slowing operations. Proactive engagement with supervisors, and attention to rating agencies, prosecutors, and investor expectations, remain critical for navigating this environment.
Group Strategy
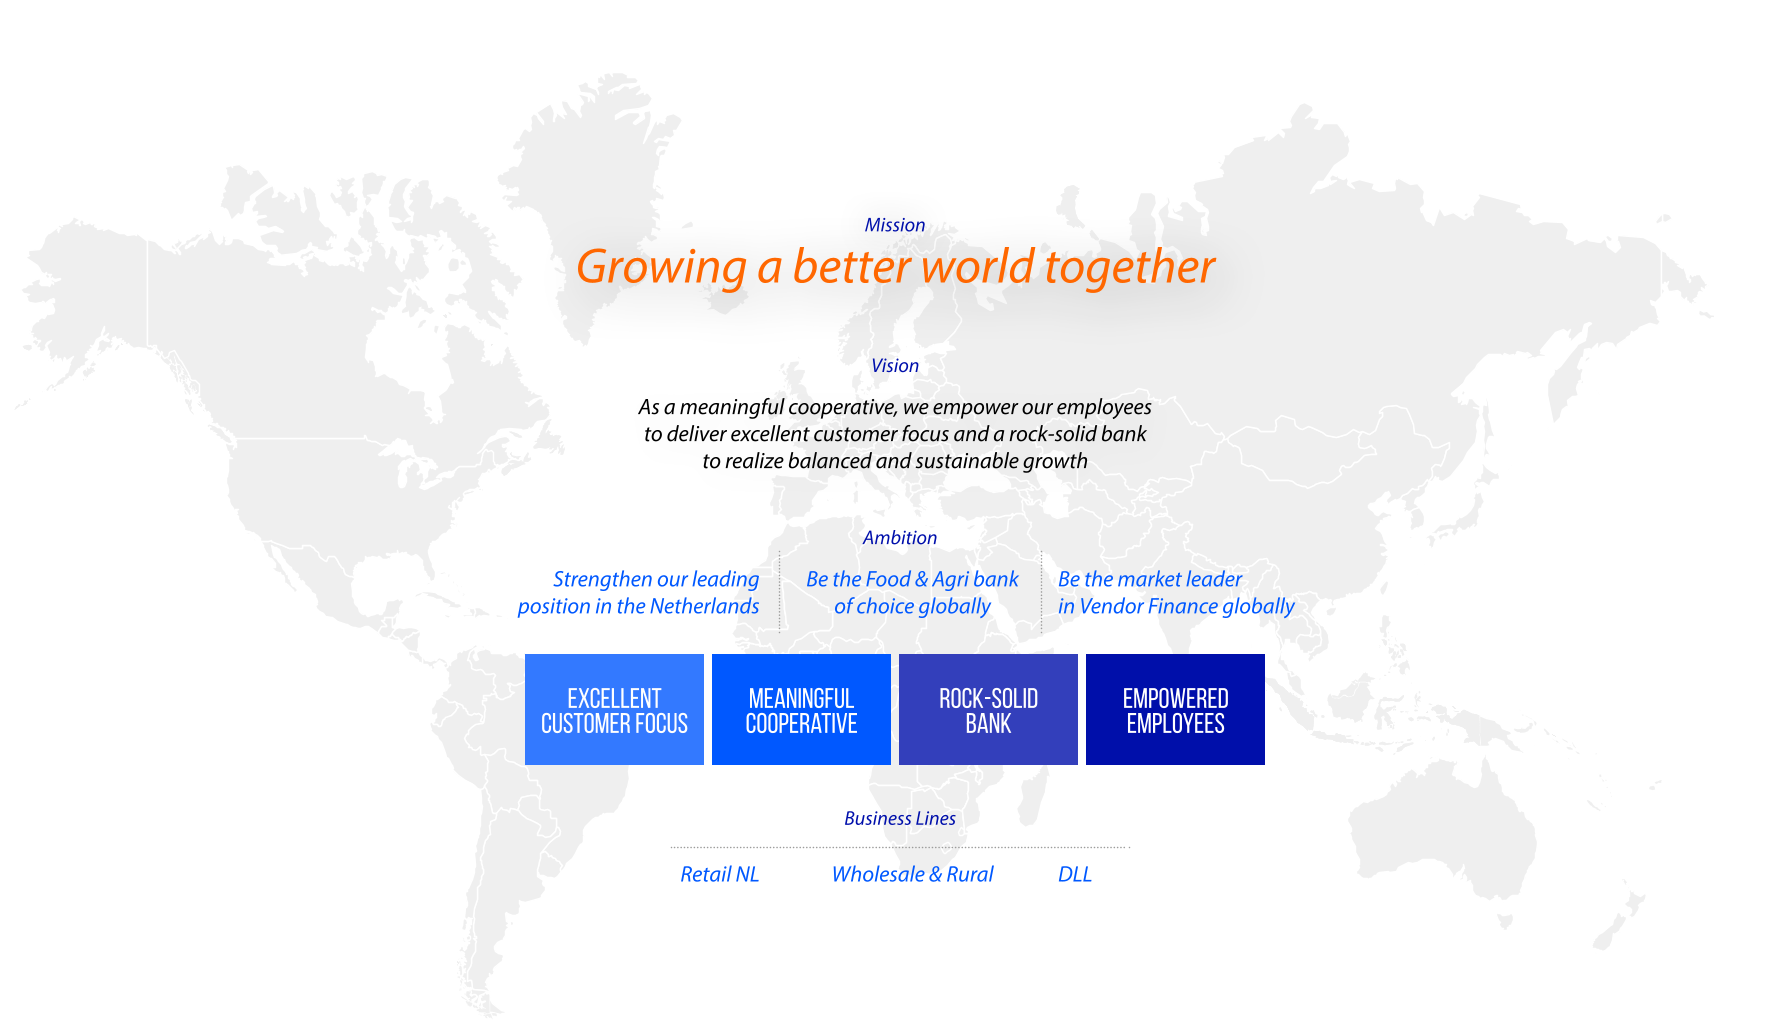
Rabobank is a unique bank, with strong cooperative roots. We activate local networks, contribute to communities, and support social transitions. Our mission, 'Growing a better world together', drives our ambition to strengthen our leading position in the Netherlands, be the Food & Agri bank of choice globally, and be the global market leader in vendor finance. Our strategy is built on a cooperative foundation with four strategic drivers: Excellent Customer Focus, Meaningful Cooperative, a Rock-Solid Bank, and Empowered Employees. Our mission, vision, values, behaviors, and distinctive cooperative stakeholder engagement are fundamental to how we operate and create value for our members and customers.
Our Mission
For over 125 years, collaboration has been at the heart of what we do. Our guiding principle is that together, we accomplish far more than we ever could individually. And we will continue to do so because we believe that the future is also cooperative. Every generation faces its own challenges, both big and small. Seeking solutions that inspire people to join forces.
We are a bank without shareholders, but with members. Over 2.3 million customers in the Netherlands are members, representing a broad cross-section of society. On a global level, we cooperate with our customers in advisory boards and local client councils. They mean a lot to us, because they tell us what is going on and help us to understand what truly matters. As a meaningful cooperative and a rock-solid bank, we continuously invest a substantial amount back into society through our cooperative dividend and various cooperative initiatives. With the support of our members, we are able to contribute to sustainable food and energy systems and foster financially healthy communities.
Making the way we live and do business more sustainable is the challenge of our time. We know change is needed and we want to contribute. To us that means we act on climate, value nature, and enable people. We leverage our knowledge, global network, and financial solutions to help customers achieve their goals, grow sustainably and provide solutions for challenges they cannot solve individually. In this way, we support our customers to transition to a more sustainable future and improve the society we live in on different levels. This is what makes Rabobank unique and how we are growing a better world together.
Growing a better world together
Our Vision
We envision a future where our role as a cooperative bank is pivotal in driving positive change. We work closely together with our members and customers and actively invest in both our global and local networks to ensure that our efforts lead to enduring, positive impacts on communities and the environment. Our commitment to innovation, growth and sustainability is at the core of our efforts. With our vision being:
“As a meaningful cooperative, we empower our employees to deliver excellent customer focus and a rock-solid bank to realize balanced and sustainable growth”.
To realize our vision, driving positive change and building a resilient, sustainable future, we have set clear ambitions that align with our drivers and strategic goals. These ambitions are steps in our journey to stimulate balanced, sustainable growth, ensuring that our efforts benefit our members and customers and contribute to growing a better world together.
Our Ambitions
Strengthen our leading position in the Netherlands
We are the leading Dutch domestic retail bank in the Netherlands. We aim to maintain and strengthen our leading position in the Netherlands by being a lifelong partner, deepening our relationships, offering relevant digital products and services, and continuing to distinguish ourselves through our cooperative approach.
We focus on clear priorities that drive balanced growth and operational excellence, creating long-term value for our customers and society. This includes creating additional value for young customers (ages 0-30) and (starting) entrepreneurs, while expanding our market share in Private Banking, Insurance & Pensions. We are committed to simplifying our operations by ensuring IT standardization and continuity, digitizing customer journeys, reducing service costs through operational excellence and balancing the risk, return and sustainability triangle. Our regained market leadership in mortgages and starting entrepreneurs (SMEs and ZZP) demonstrates that we have the right capabilities, people and ambition to deliver on our goals.
Be the Food & Agri bank of choice globally
With our strategy, we aim to strengthen and expand our position as the preferred bank in the Food & Agri sector globally, and continue to grow in line with our sustainability agenda. We actively facilitate and finance the food system transition and support the sector in reducing its carbon footprint. By leveraging our Food & Agri expertise, global food supply chain presence, extensive network, and high-quality products, we ensure long-term relationships with our customers and society.
One of our key priorities is to continue to grow our primary customer base globally in Food & Agri. We will leverage the strong global platform we have built in Food & Agri to accelerate our growth in the future clean energy system, support our mission and net-zero ambitions and expand from our Dutch base into selected European sectors that are fundamental to society, such as built environment and technology. At the same time, we are harmonizing and simplifying our operating model, optimizing customer journeys and further embedding sustainability practices throughout our business.
Be the market leader in vendor finance globally
Our purpose is clear: partnering for a better world. We want to maintain our leading position as the global vendor finance partner by enabling sustainable business growth through point-of-sale financial solutions. With our industry specialization and asset and risk expertise we strive to add value to vendors, dealers and users of equipment and technology. DLL is well-positioned to grow by expanding existing partner and customer relationships and building new ones. We continue to enhance our product portfolio with lifecycle asset management, usage-based and servitization offerings, while actively supporting the circular, energy and food system transitions to help customers seize market opportunities in new asset classes.
Our priorities are to grow our business smartly and sustainably in our vendor, dealer and direct channels, simplify to optimize our cost-to-serve, accelerate our digital transformation, and enhance our product and service offerings in partnership with the ecosystems we operate in. With this we continue to deliver sustainable growth and long-term value for our partners and customers worldwide.
Four Drivers
Excellent Customers Focus – ‘We are client driven and prioritize our customers.’
Our strategy begins with a clear focus on understanding and prioritizing our customers. We are committed to delivering outstanding customer experiences. Leveraging our strong local presence enables us to understand the demands and needs of our members and customers. We want to be a trusted banking partner for life, attract new customers and stay relevant by offering innovative financial services that improve the customer experience and expand our value-added propositions. We aim to provide high quality customer advice, seamless digital services, optimal customer and product journeys, while pursuing balanced growth. To generate additional non-interest related business, we will focus on deepening our customer relationships, strengthening our market share through competitive propositions, and promoting our enhanced digital services.
Meaningful Cooperative – ‘We are a cooperative and connect society.’
As a cooperative bank, we want to make a meaningful difference for society and contribute to a more sustainable world. We are ambitious to further strengthen our cooperative way of working and strive to be a positive force for our members, our customers, and the communities we serve. We continuously invest a substantial amount back into society through various cooperative initiatives and our cooperative dividend. Thanks to our local connection, at the heart of society, we are ideally placed to contribute to sustainable food and energy systems, and financially healthy communities. That’s why we act on climate, value nature and enable people to make the way we live and do business more sustainable.
Rock-Solid Bank – ‘We are professional and simplify.’
We aim to provide stability in an unstable world and safeguard operational resilience. We grow in a balanced, profitable and sustainable way, ensuring we create value for present and future generations. We deliver operational excellence, uphold compliance, and balance risk, return, and sustainability impact while simplifying our operating model and reducing our cost-to-serve. At the same time, we ensure we remain in control through group-wide portfolio management, a comprehensive customer view and robust technology and infrastructure. We are committed to become a better bank, build a stronger foundation for growth and shape a future-ready organization, to stay successful and be able to invest in our customers, people, and society in the future.
Empowered Employees – ‘We take responsibility and ownership.’
We want all our colleagues to be proud to call Rabobank a great place to be. We foster a culture where our people enjoy their work, feel valued and safe. We encourage our employees to take responsibility, unleash their potential and develop skills for the future by harnessing technology. This helps us build a future-ready organization and workforce, deliver the best for our members and customers, and society. Our cooperative mindset is deeply rooted in our traditions and conveyed by our colleagues every day.
Sustainability embedded in our strategy
We want to, need to, and are committed to 'Growing a Better World Together'. That is why we help our customers, with our industry knowledge, networks, and financial solutions, to be resilient and transition to a more sustainable future. We also help to move ‘the system’ in a more sustainable direction. This is about increasing positive impact and reducing negative impact. Which to us is part of growing a better world together.
From a sustainability perspective, reducing our climate impact, balancing food and energy within planetary boundaries, and enabling people, are our main priorities. In our own organization, with our customers and in our communities, we aim to drive developments that can contribute to make a more sustainable life and business affordable, available, and accessible. We aim to act in line with our beliefs, commitments and regulations and do this in a science-based way. In addition to having our foundation in order, from human rights to good governance, our focus from an environmental perspective will be on the following topics.
Facilitating key transitions
We focus on two transitions: the energy transition and the food system transition. Everyone needs food and energy. Since both the food and energy systems are currently not yet future proof, we want to contribute to accelerate the needed transitions, making sustainably produced food and energy become the norm.
Food system transition - “Facilitate the food system transition towards a future-proof system based on responsible production and consumption of food”.
We are committed to contribute to a future-proof food system. That is a system that revolves around making the food supply chain more secure and resilient: in nature, in farming and in business models. A system that can lead to making sustainably produced nutritious food affordable, available and accessible. We work with the entire value chain: from farm to fork and fork to farm.
Energy transition - “Facilitate the energy transition towards a future-proof system based on responsible energy production, distribution and consumption”.
We are committed to contribute to a future-proof energy system. That is a system that will strongly revolve around energy saving and using low or no carbon instead of fossil sources: from energy company to small enterprise, from multinational to farm or family home. Green energy should also become affordable, available, and accessible. We work with the entire energy system: from producer to consumer.
Performance


Rock-Solid Bank

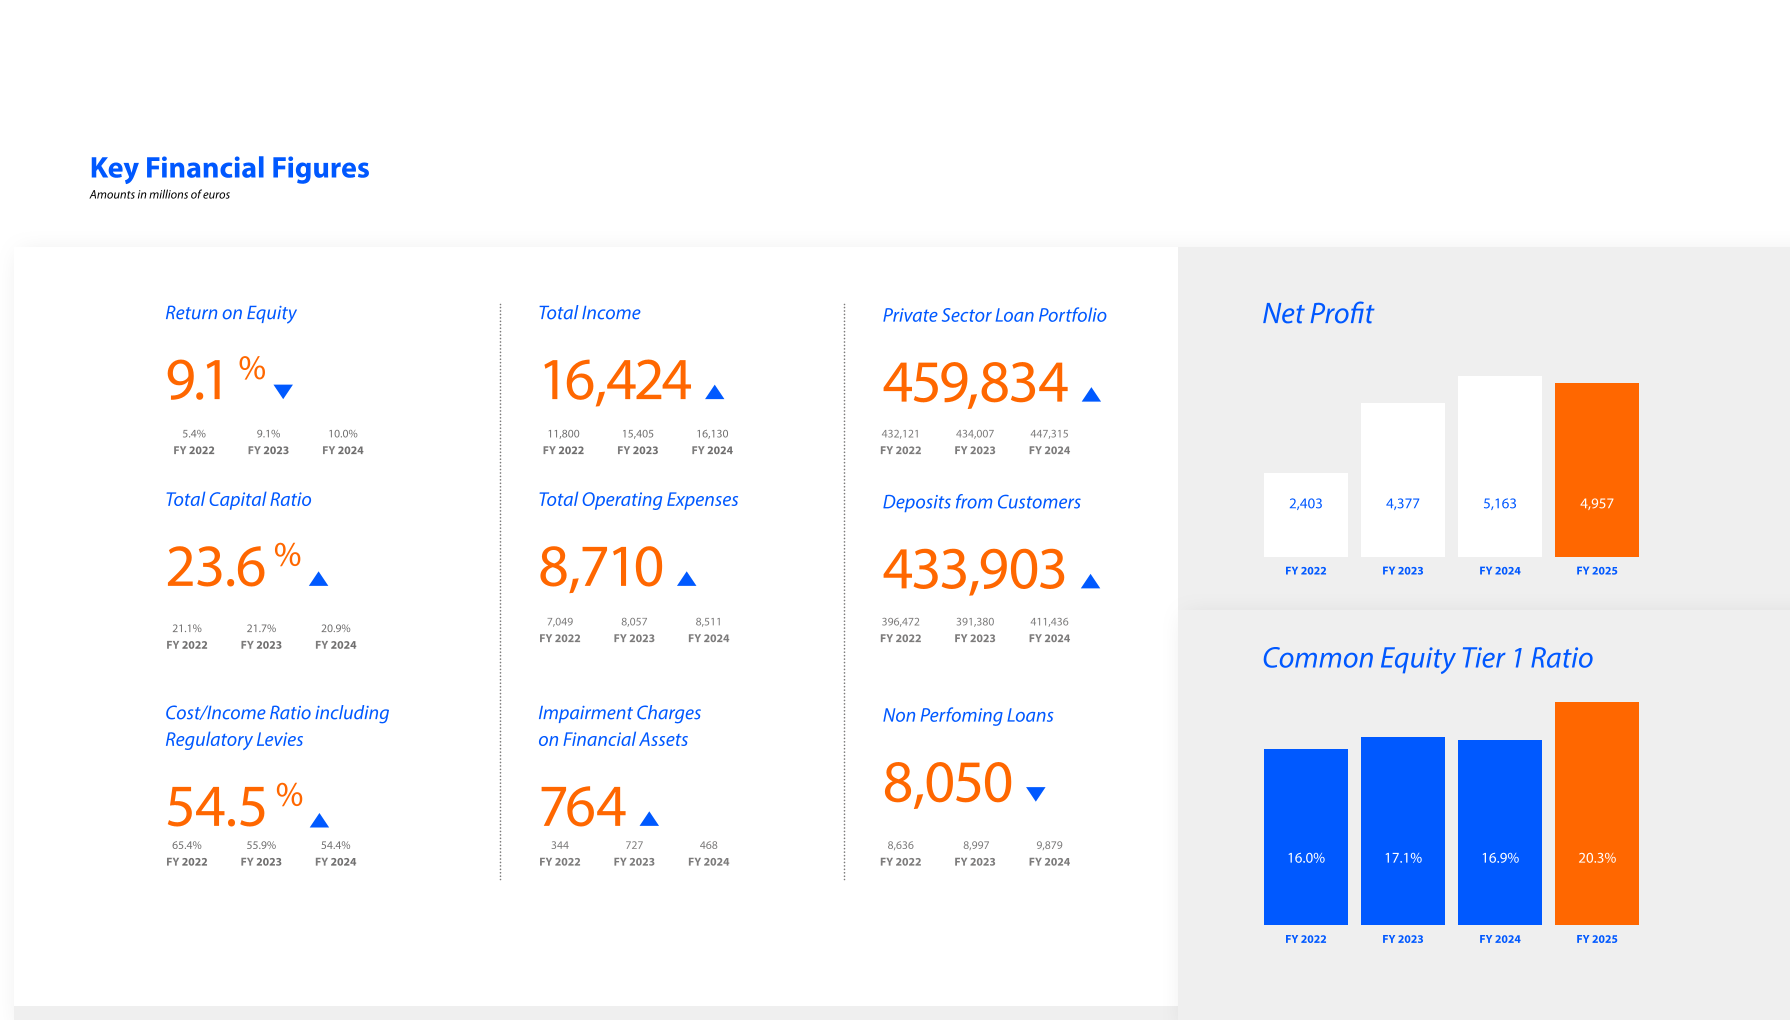
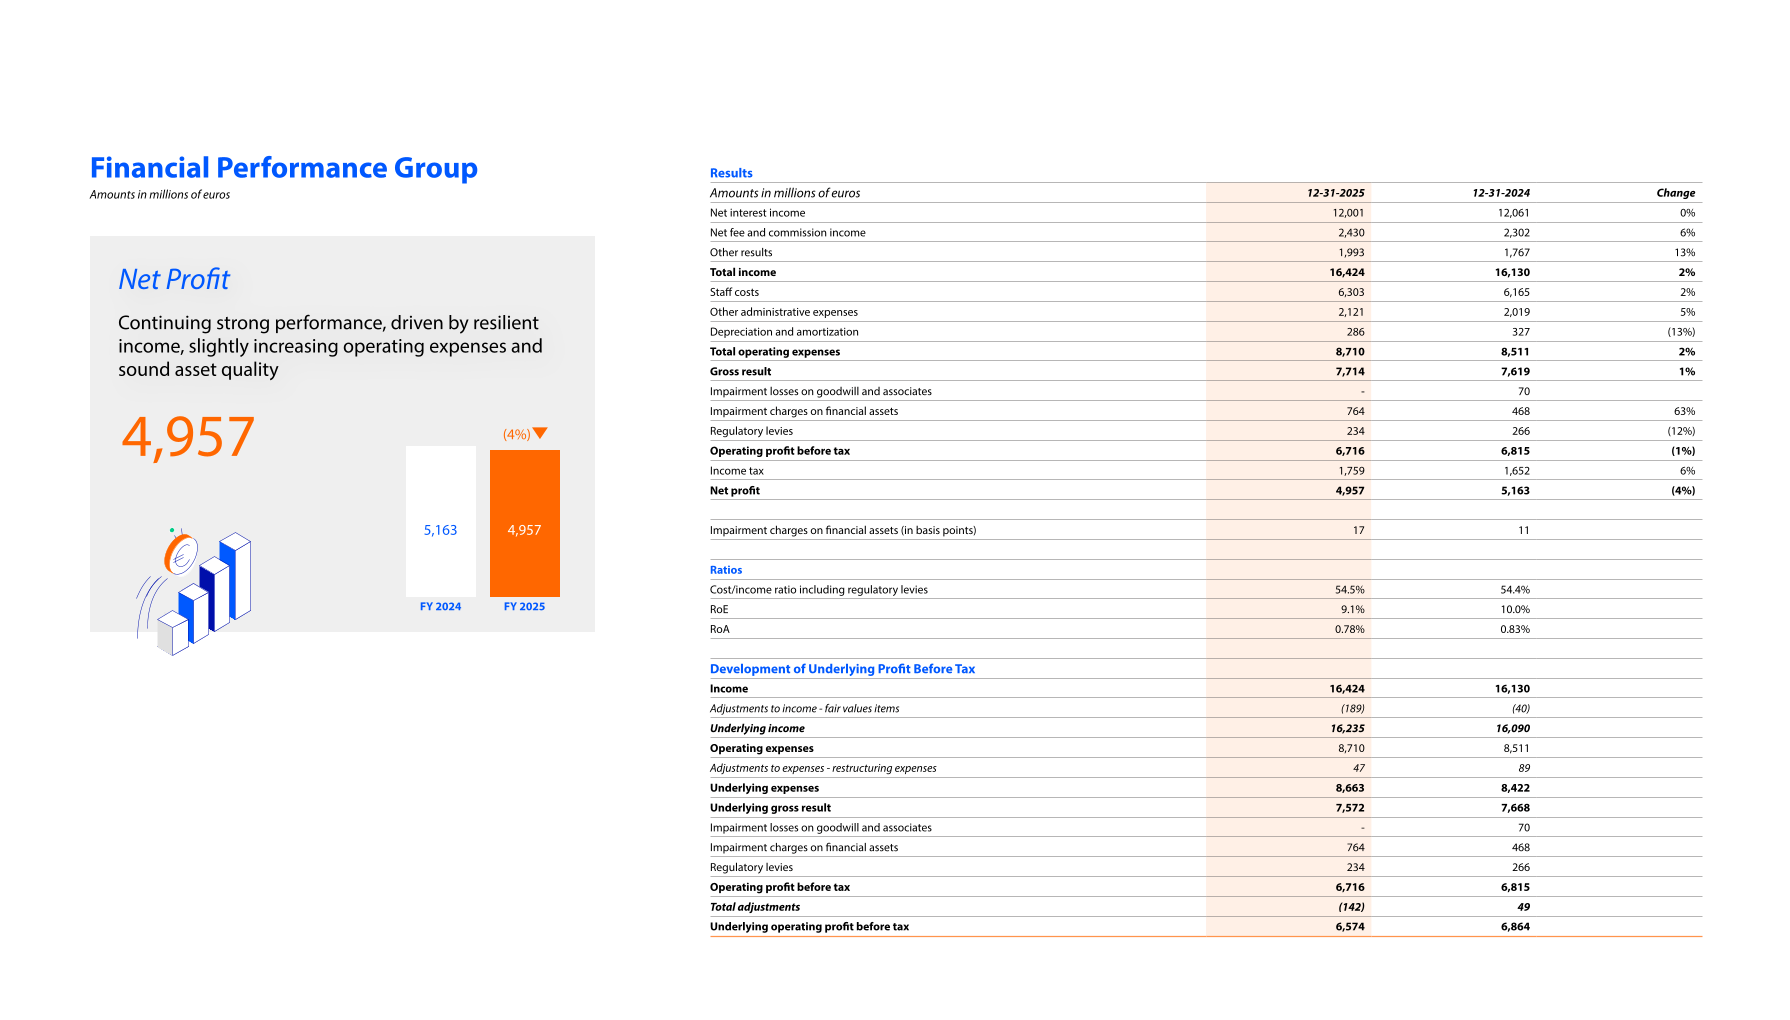
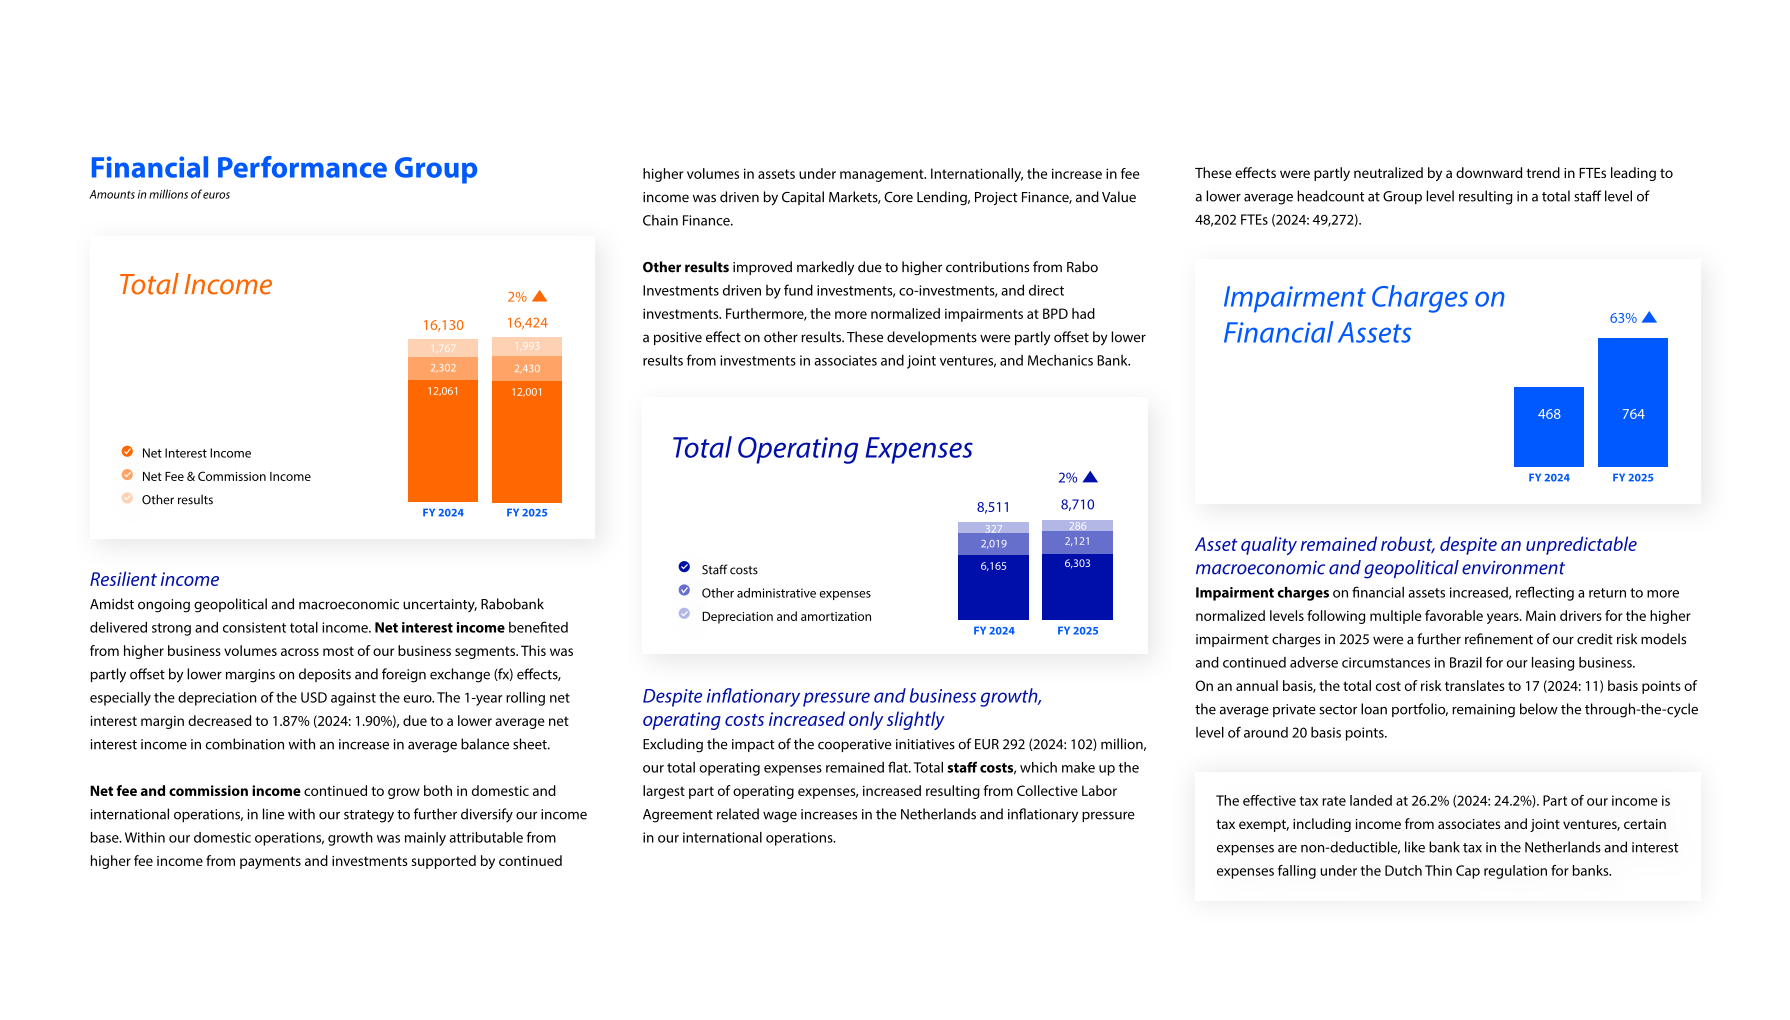
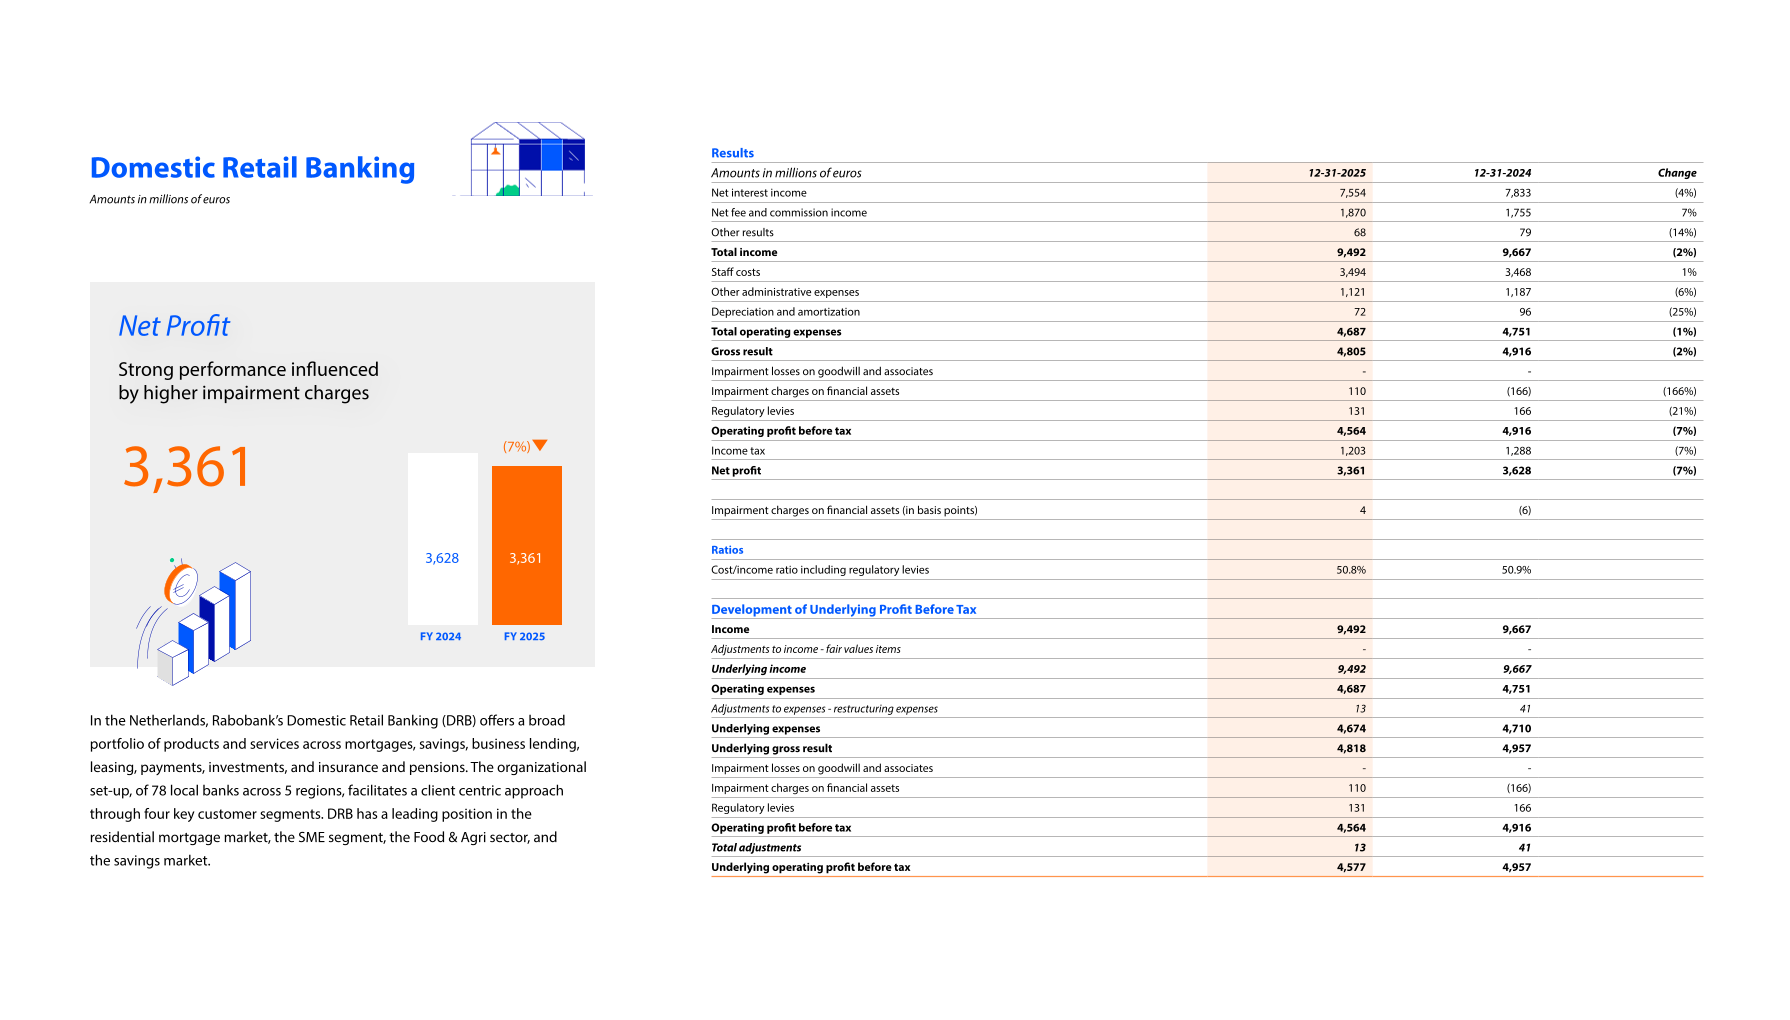
Over 2025, our net profit amounted to EUR 4,957 million. This continuing strong performance is driven by resilient income, slightly higher operating expenses and sound asset quality.
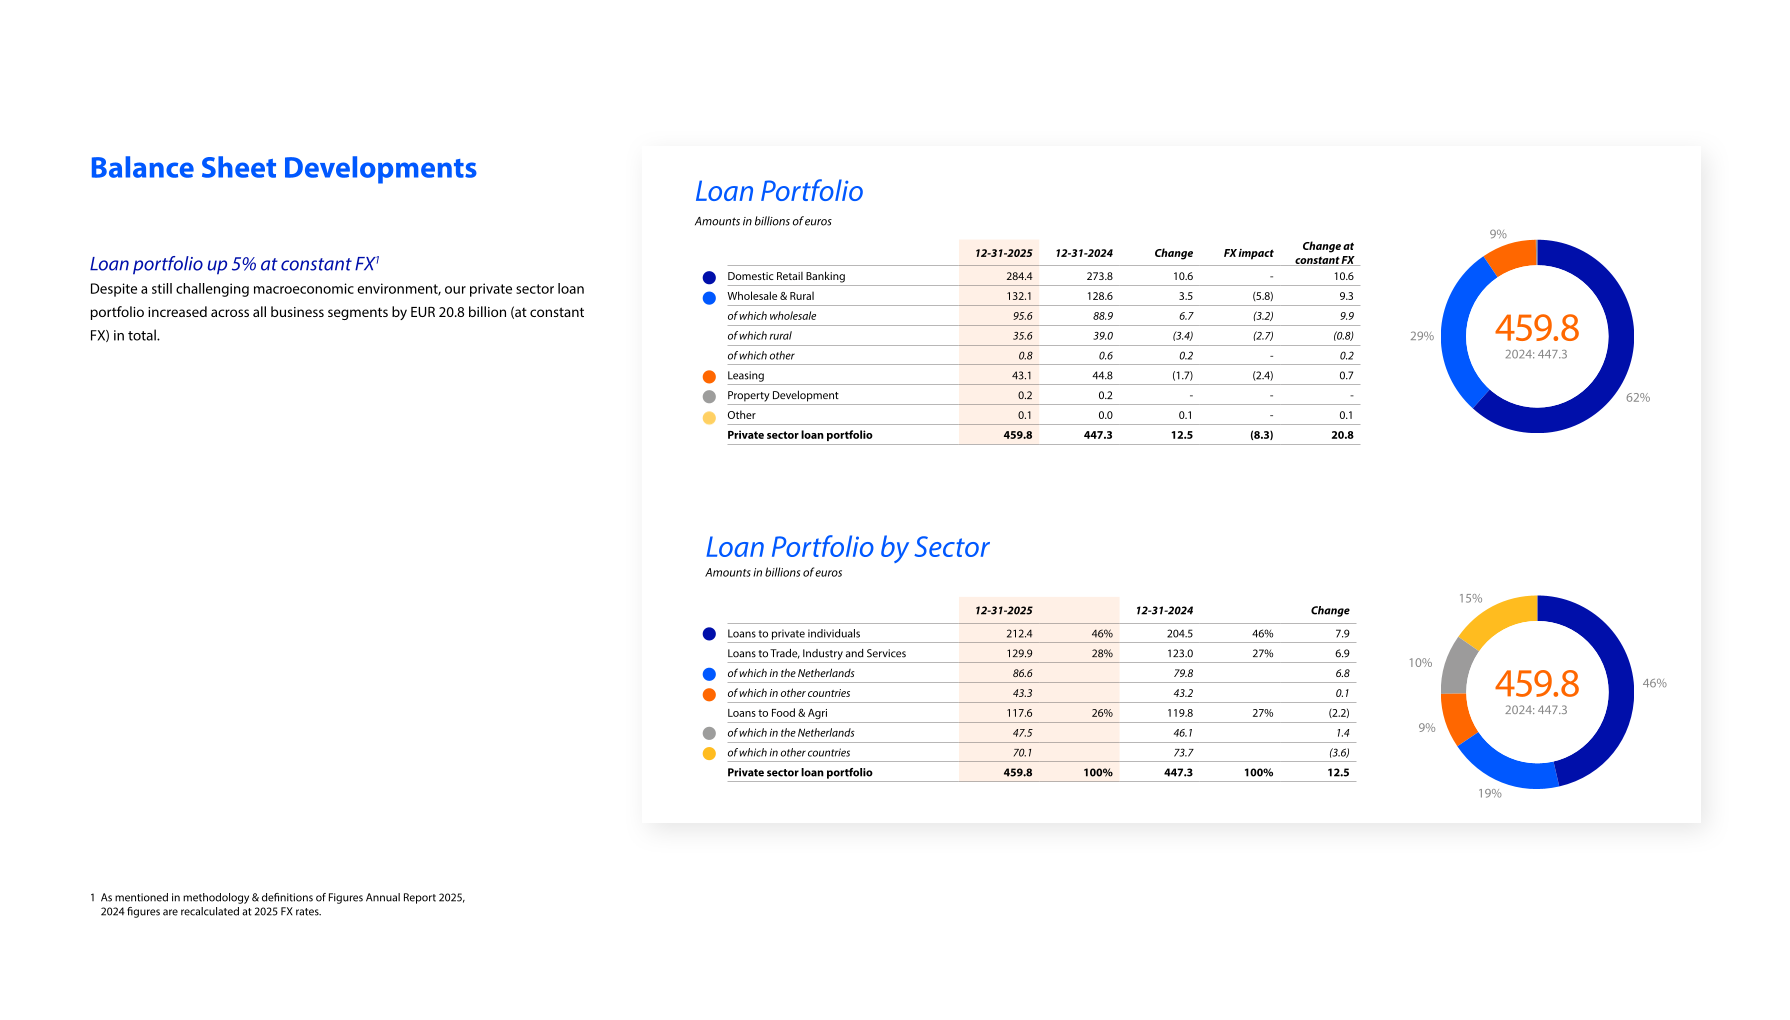
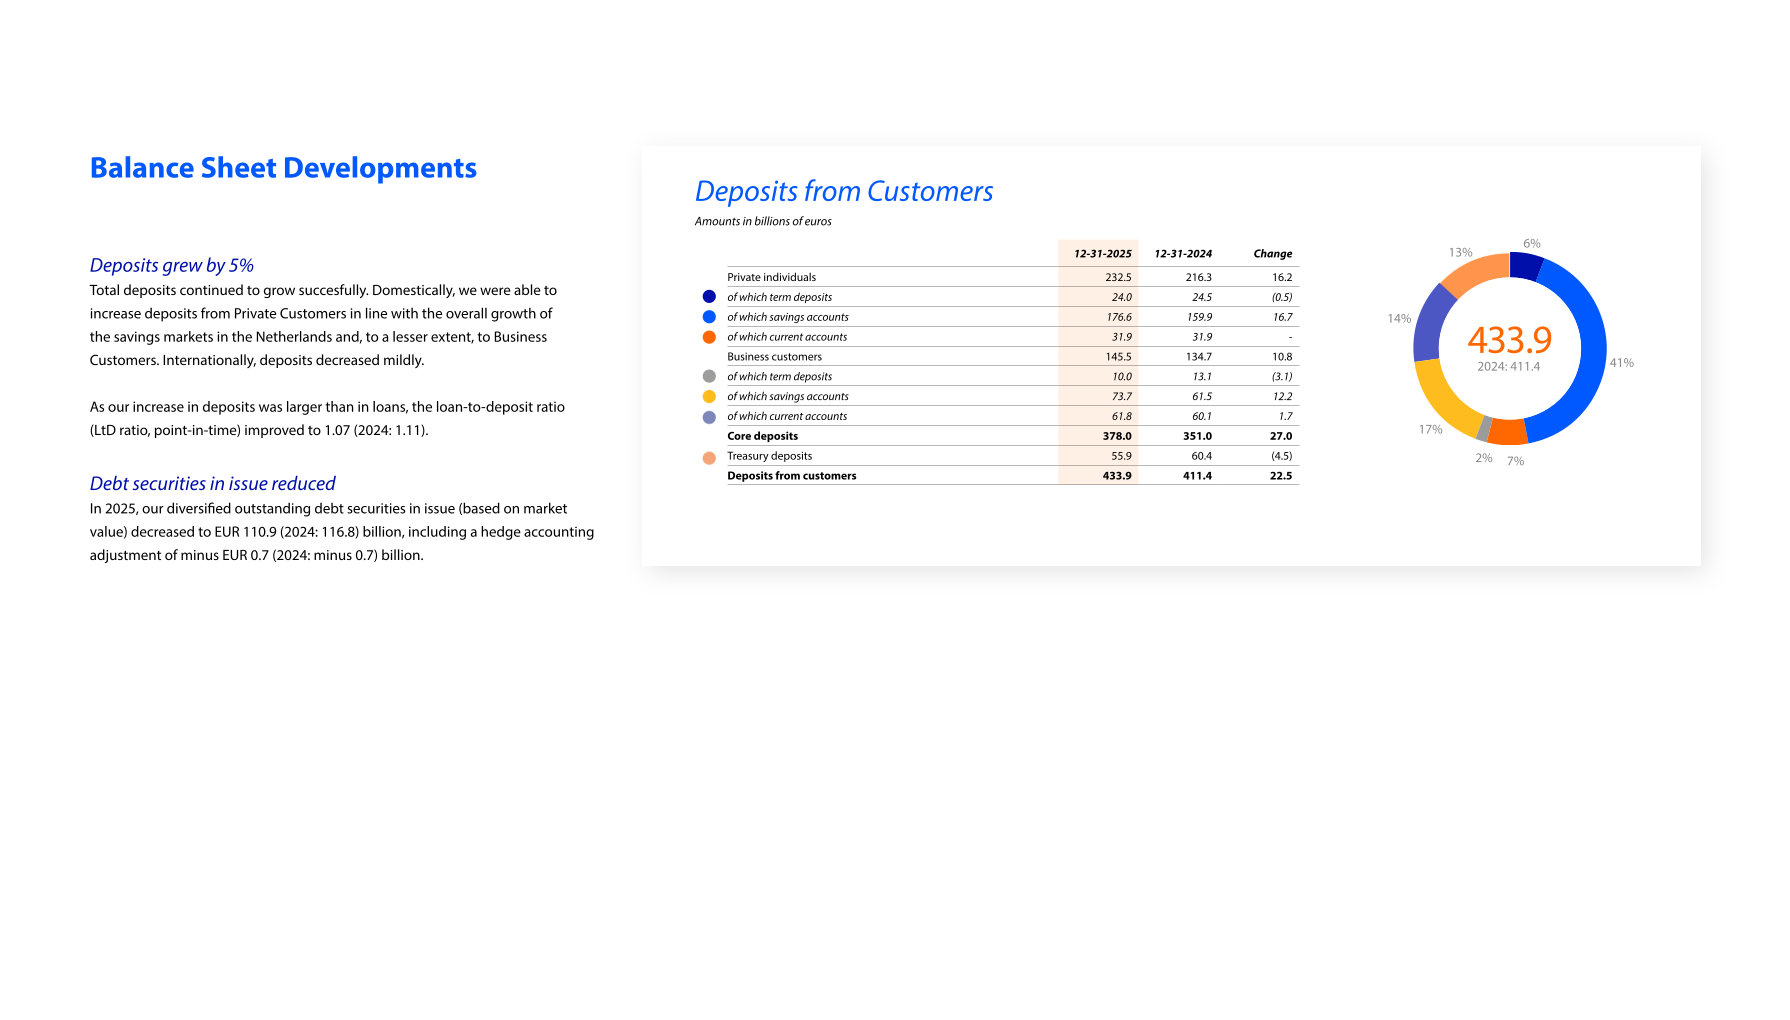
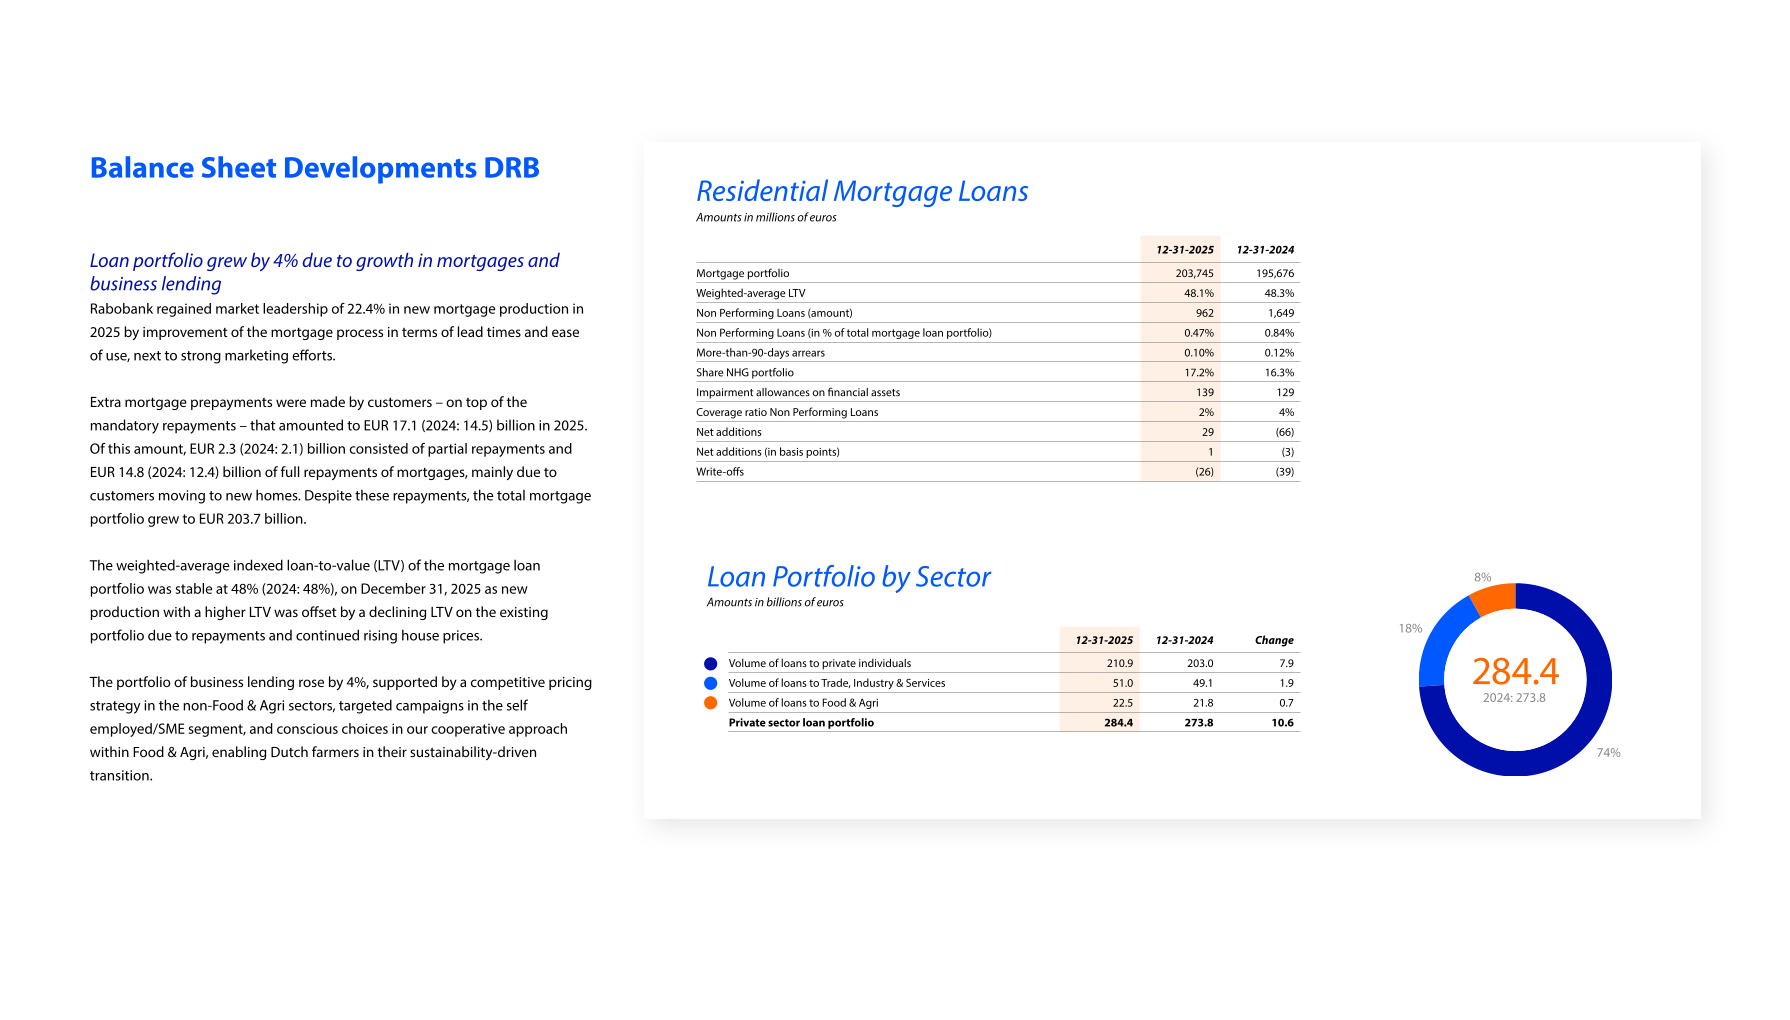
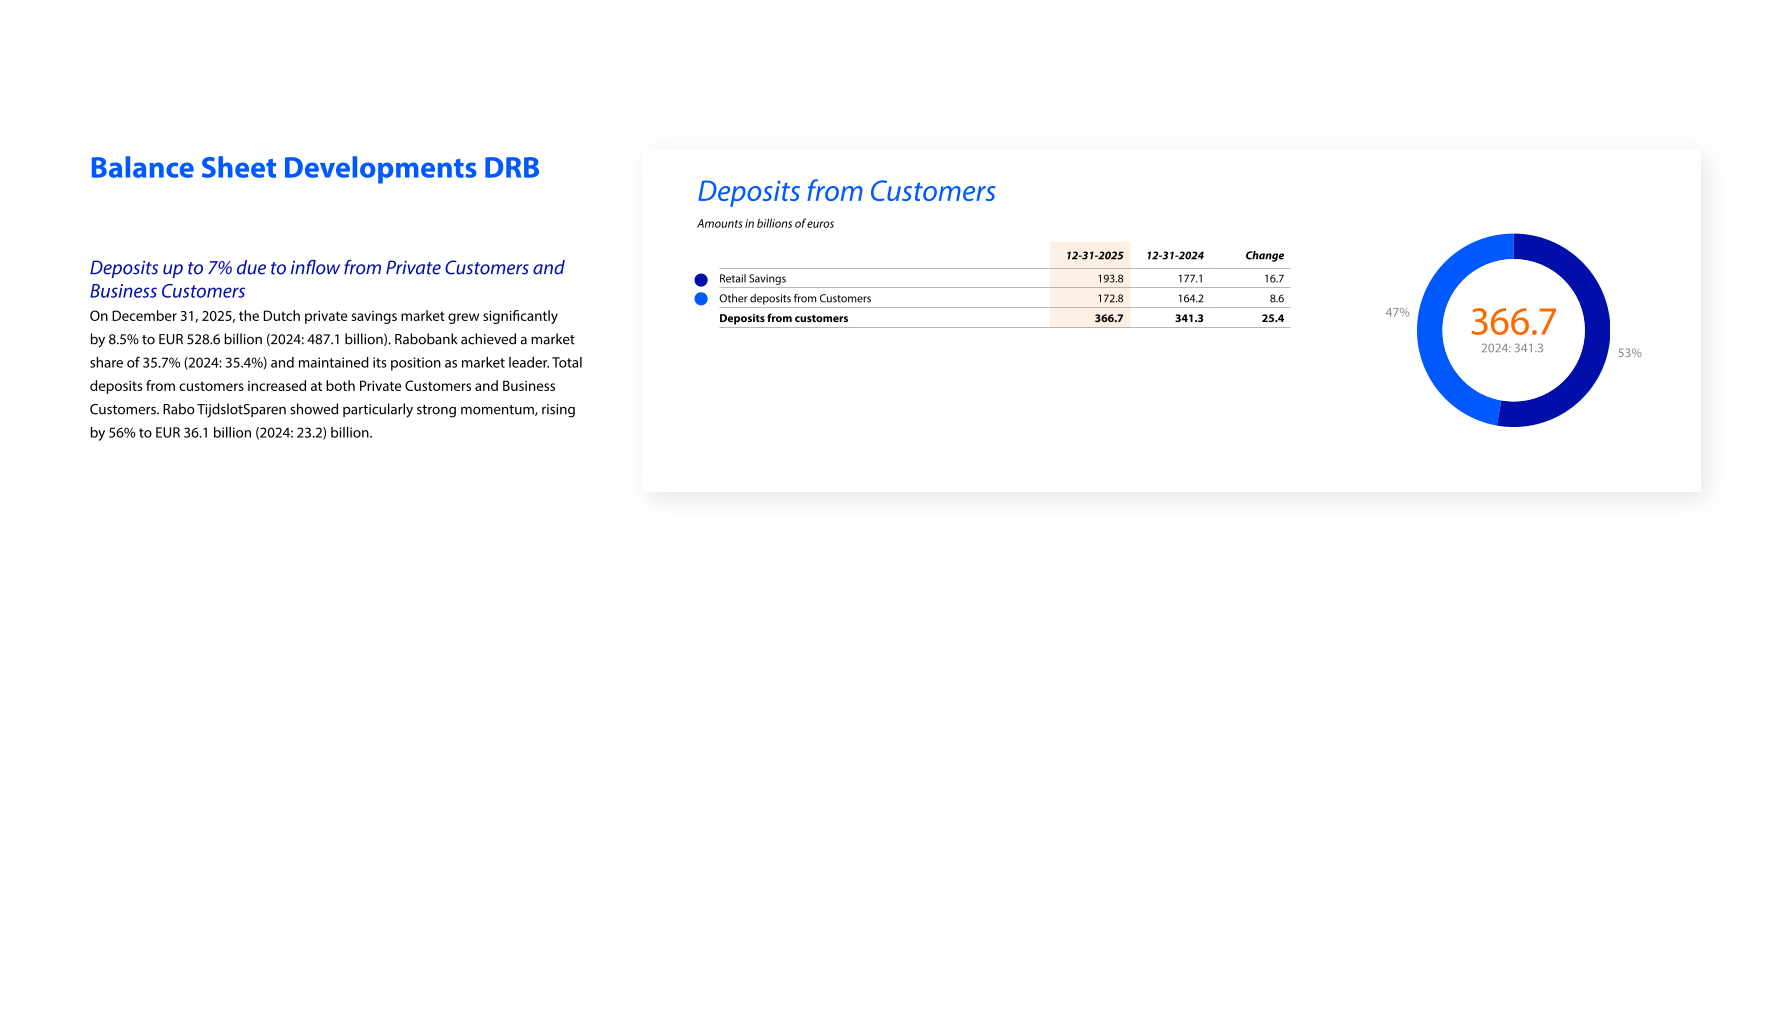
Within Domestic Retail Banking (DRB), deposit margins decreased. However, the impact of this decrease on net interest income was mitigated by ongoing strong growth in deposit volumes of EUR 25.4 billion, and continued growth of DRB's loan portfolio by EUR 10.6 billion. Wholesale & Rural (W&R) expanded its loan portfolio by EUR 9.3 billion, while our leasing portfolio ended EUR 1.1 billion higher than last year (both at constant exhange rates).
Excluding the impact of our cooperative initiatives, our operating expenses remained largely unchanged over 2025, as the reduction in average FTEs (2% lower in comparison to 2024) offset the wage increases stemming from the Collective Labor Agreement.
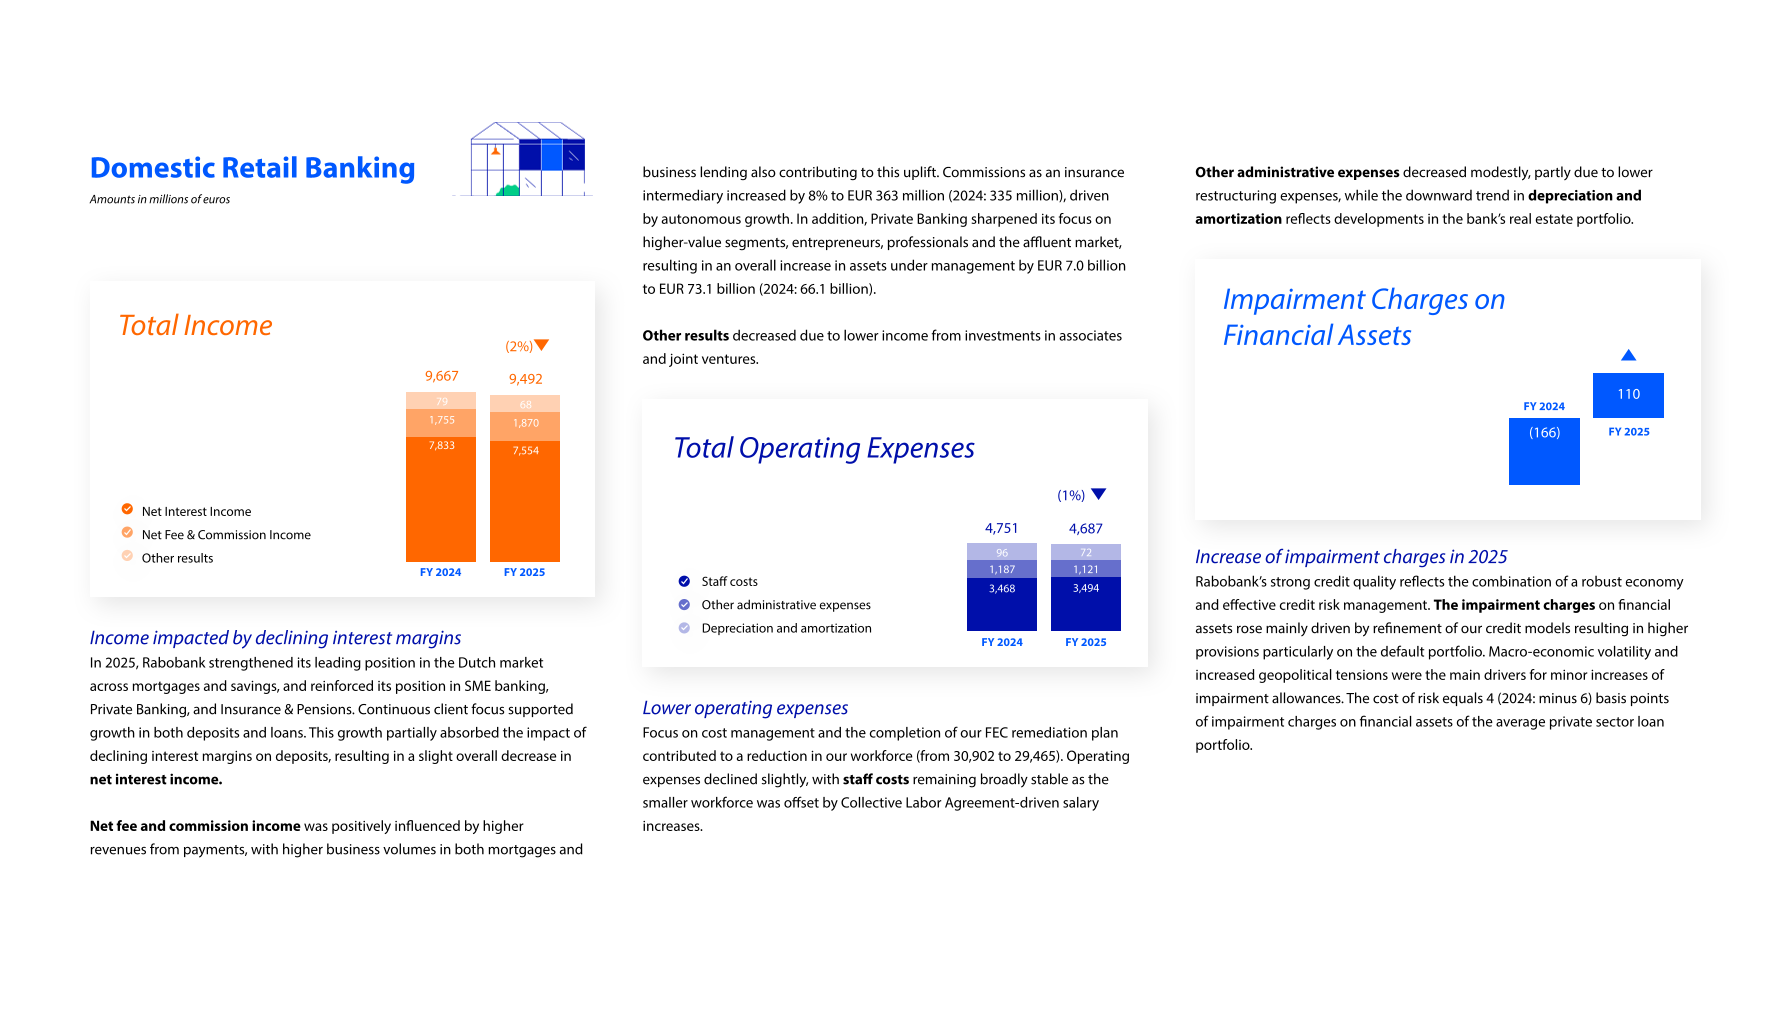
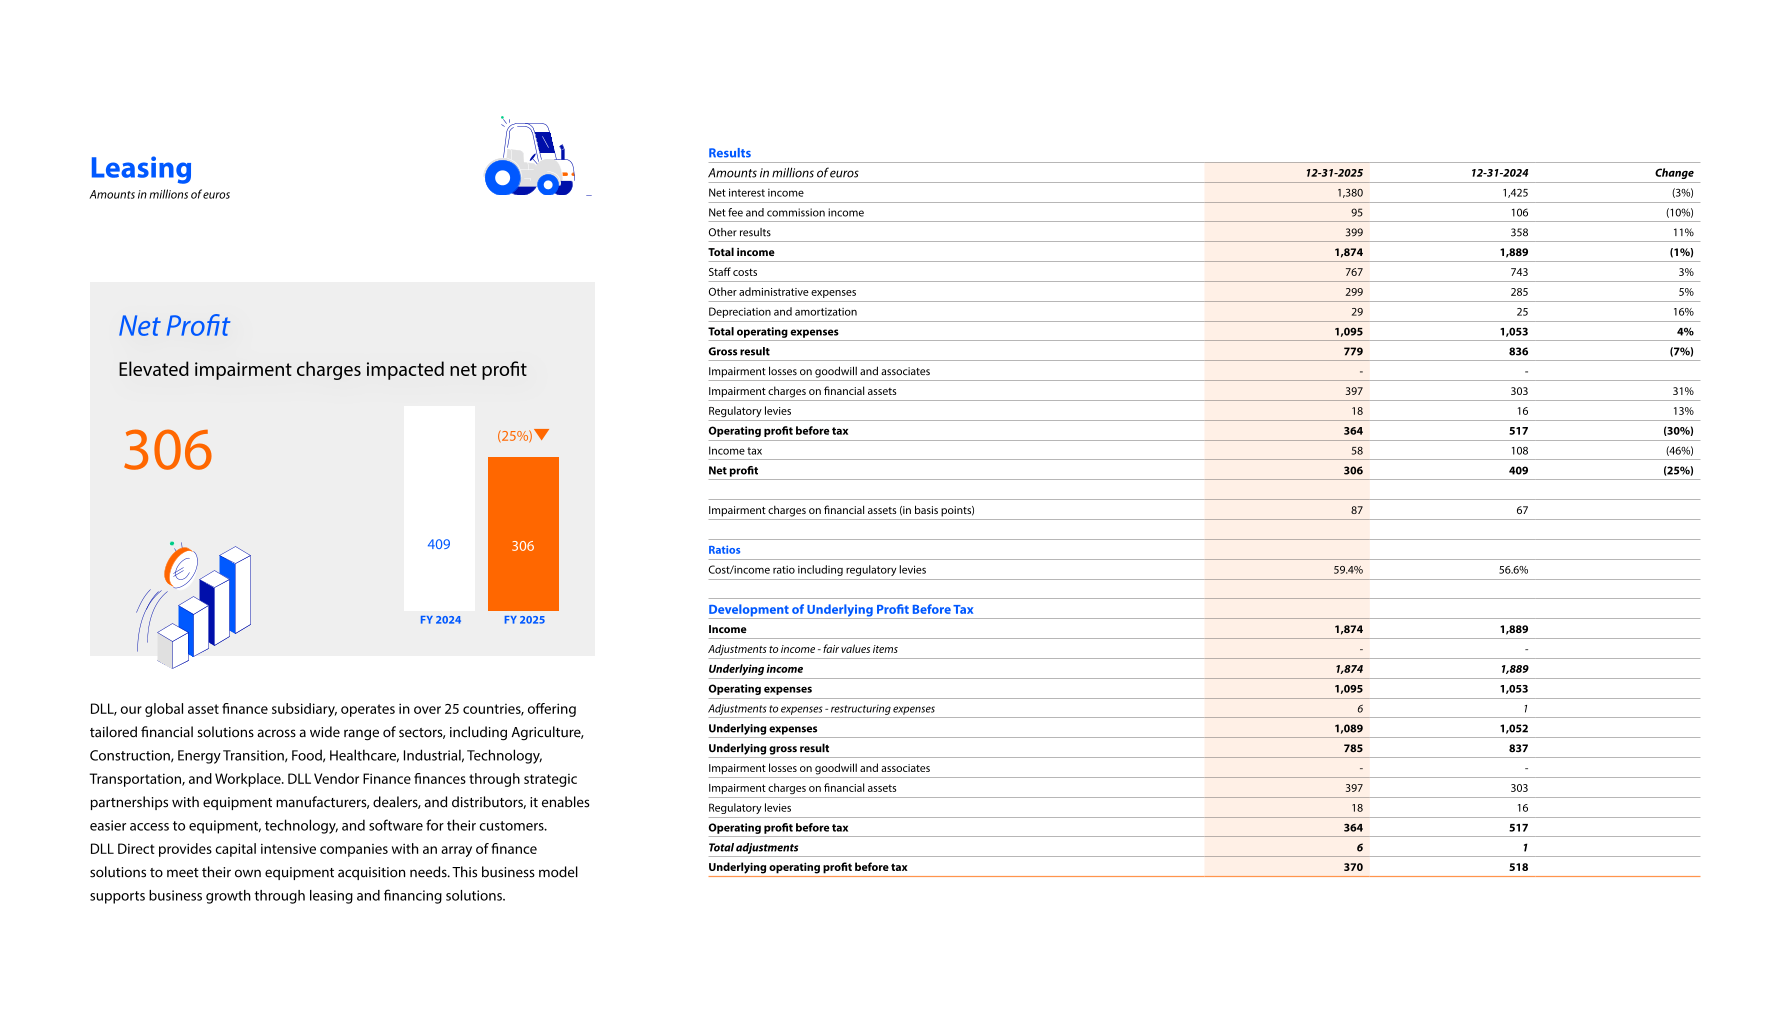
Loan impairment charges amounted to EUR 764 (2024: 468) million, reflecting a return to more normalized levels following several favorable years. Main drivers for impairment charges in 2025 were macroeconomic volatility and adverse circumstances in Brazil for our leasing business.
Rabobank’s cost/income ratio remained stable at 54.5% (2024: 54.4%) reflecting expenses keeping pace with our moderate income growth. Return on Equity stood at 9.1% (2024: 10.0%).
Our CET1 ratio jumped to 20.3% from 16.9%. This improvement was principally driven by an expected drop in risk-weighted assets due to the implementation of the Capital Requirements Regulation 3 as of January 2025 and the addition of profit to our retained earnings. This robust capital position enables us to support our growth strategy and our positive impact on society.

Capital Management
Balance sheet
| Amounts in billions of euros | 12-31-2025 | 12-31-2024 |
|---|---|---|
| Cash and cash equivalents | 62.8 | 84.9 |
| Loans and advances to customers | 472.3 | 454.5 |
| Financial assets | 35.6 | 23.7 |
| Loans and advances to banks | 33.1 | 27.0 |
| Derivatives | 19.6 | 23.4 |
| Other assets | 15.5 | 15.8 |
| Total assets | 638.9 | 629.3 |
| Deposits from customers | 433.9 | 411.4 |
| Debt securities in issue | 110.9 | 116.8 |
| Deposits from banks | 10.2 | 12.4 |
| Derivatives | 12.9 | 17.4 |
| Financial liabilities | 2.5 | 2.8 |
| Other liabilities | 12.6 | 15.1 |
| Total liabilities | 583.0 | 575.9 |
| Equity | 55.9 | 53.4 |
| Total liabilities and equity | 638.9 | 629.3 |
Equity Increased
Our equity increased to EUR 55.9 (2024: 53.4) billion. This reflects the addition of the lion’s share of net profit to retained earnings, a redemption of capital securities, and negative FX effects in other comprehensive income. Our equity on December 31, 2025, consisted of 79% (2024: 77%) reserves and retained earnings, 12% (2024: 13%) Rabobank Certificates, 7% (2024: 9%) Capital Securities, and 1% (2024:1%) other non-controlling interests. A simplification of the legal structure of the Rabobank Certificates was implemented.
| Amounts in millions of euros | |
|---|---|
| Equity at the end of December 2024 | 53,444 |
| Net profit for the period | 4,957 |
| Other comprehensive income | (903) |
| Payments on Rabobank Certificates | (449) |
| Payments on Capital Securities issued by Rabobank | (195) |
| Redemption of Capital Securities | (1,000) |
| Other | (3) |
| Equity at the end of December 2025 | 55,851 |
Capital Ratios
| Amounts in millions of euros | 12-31-2025 | 12-31-2024 |
|---|---|---|
| Reserves and retained earnings | 44,323 | 40,942 |
| Expected distributions | (1) | (2) |
| Rabobank Certificates | 6,909 | 6,909 |
| Regulatory adjustments | (2,598) | (3,685) |
| Common Equity Tier 1 capital | 48,633 | 44,164 |
| Capital securities | 3,980 | 4,972 |
| Regulatory adjustments | (75) | (73) |
| Additional Tier 1 capital | 3,905 | 4,900 |
| Tier 1 capital | 52,538 | 49,063 |
| Part of subordinated debt treated as qualifying capital | 4,056 | 5,671 |
| Regulatory adjustments | (90) | (89) |
| Tier 2 capital | 3,966 | 5,582 |
| Qualifying capital | 56,504 | 54,646 |
| Risk-weighted assets | 239,223 | 261,452 |
| Common Equity Tier 1 ratio | 20.3% | 16.9% |
| Tier 1 ratio | 22.0% | 18.8% |
| Total capital ratio | 23.6% | 20.9% |
| Common Equity Tier 1 ratio of Coöperatieve Rabobank U.A. solo (issuer level) | 20.7% | 16.6% |
Maintaining a Strong Capital Position
On December 31, 2025, our Common Equity Tier 1 (CET1) ratio amounted to 20.3% (2024: 16.9%). This is well above our >14% ambition. The main driver of our CET1 ratio development was a decrease of RWA, additionally an increase in CET1 capital due to the addition of net profit to retained earnings also had a positive impact. Risk-weighted assets (RWA) decreased by EUR 22.2 billion (from EUR 261.5 billion to EUR 239.2 billion) mainly due to the implementation of CRR 3 (also known as Basel IV). Our leverage ratio on December 31, 2025, was 7.7% (2024: 7.3%), which is well above the minimum leverage ratio of 3% required by the Basel guidelines and CRR. Our total capital ratio increased to 23.6% (2024: 20.9%) as a result of decreased RWA and the increase in CET1 capital, partly compensated by a reduction of the eligible amount of outstanding AT1 and
Tier 2 instruments. Rabobank deems a 20% total capital ratio appropriate.
Risk-weighted assets
In 2025, total RWA decreased to EUR 239.2 (2024: 261.5) billion mainly due to the introduction of CRR3. The main driver is lower LGD input parameters for Foundation – IRB models (minus EUR 14.5 billion). Additionally, the EAD declined due to lower credit conversion factors (CCF) for Foundation – IRB models (minus EUR 8.6 billion). Some other impacts had a combined impact of minus EUR 1.7 billion. On the other hand, RWA increased due to business development (EUR 8.2 billion). FX effects had a downward impact of around EUR 5.5 billion. Rabobank conducts a comprehensive assessment of its capital adequacy from both regulatory and internal economic standpoints. This dual approach ensures that the organization holds sufficient capital to mitigate potential adverse effects stemming from its risk profile. The results of these assessments confirm that Rabobank maintains a sound capital position.
Regulatory Capital
The regulatory (Pillar 1) capital requirement is 8% of our RWA. This requirement represents the minimum amount of capital which we are required to hold. Our regulatory (required) capital landed at EUR 19.1 (2024: 20.9) billion on December 31, 2025, of which 86% is related to credit and transfer risk, 12% to operational risk, and 2% to market risk.
Regulatory Capital by Business Segment
| Amounts in billions of euros | 12-31-2025 | 12-31-2024 |
|---|---|---|
| Domestic Retail Banking | 6.4 | 6.1 |
| Wholesale & Rural | 8.7 | 9.2 |
| Leasing | 2.6 | 2.6 |
| Property Development | 0.4 | 0.4 |
| Other | 1.0 | 2.6 |
| Rabobank | 19.1 | 20.9 |
MREL Eligible Capital Buffer
We aim to protect senior creditors and depositors against the unlikely event of a bail-in. We therefore hold a large buffer of equity, subordinated debt, and non-preferred senior debt that will absorb initial losses in the event of a bail-in. On top of that, a buffer consisting of MREL eligible preferred senior debt is available.
The MREL requirement was established to ensure that banks in the EU have sufficient own funds and eligible liabilities to absorb losses in the event of a potential bank failure. The MREL requirement for Rabobank is set at a consolidated level, as determined by the SRB. Our binding MREL requirement as of December 31, 2025 is 27.9% of RWA (including the stacked Combined Buffer Requirement (CBR)) and 7.5% of Leverage Ratio Exposure.
As of January 1, 2026 the MREL requirement is 27.7% of RWA (including the stacked CBR) and 7.4% of Leverage Ratio Exposure.
The subordinated MREL buffer is defined as qualifying capital plus the (amortized part of) Tier 2 capital instruments with a remaining maturity of at least one year and non-preferred senior bonds with a remaining maturity of at least one year. The buffer increased from EUR 78.6 billion to EUR 79.1 billion, which corresponds to 33.1% (2024: 30.1%) of RWA. A buffer of 1.9%- points of MREL eligible preferred senior bonds was available on top of that.
MREL Eligible Capital Buffer
| Amounts in billions of euros | 12-31-2025 | 12-31-2024 |
|---|---|---|
| Qualifying capital | 56.5 | 54.6 |
| Non-qualifying grandfathered additional Tier 1 capital | 0 | 0 |
| Amortized Tier 2 >1 year remaining maturity | 0.7 | 1.4 |
| Non-preferred senior bonds > 1 year remaining maturity | 21.9 | 22.5 |
| MREL eligible capital and non-preferred senior bonds buffer | 79.1 | 78.6 |
| MREL eligible preferred senior bonds> 1 year remaining maturity | 4.5 | 9.1 |
| Overall MREL eligible buffer | 83.7 | 87.7 |
| Risk-weighted assets | 239.2 | 261.5 |
| MREL eligible capital and non-preferred senior bonds buffer / risk-weighted assets | 33.1% | 30.1% |
| Overall MREL eligible buffer / risk-weighted assets | 35.0% | 33.5% |
Risk Management

Introduction

This Risk Management section provides a comprehensive overview of how Rabobank identifies, assesses, and manages risks in an increasingly complex global environment. It begins by outlining the Risk Management Framework, explaining how risk governance, culture, and strategy work together to support the bank’s mission and strategic priorities. The report then details the three lines of responsibility, the bank’s risk appetite, and the role of ESG factors.
The subsequent chapters dive into the specific categories of risk. The Financial Risk chapter covers business risk, credit risk, funding and liquidity risk, and market risks in both the banking and trading books. It highlights portfolio performance, capital adequacy, liquidity metrics, and the impact of macroeconomic, geopolitical, and environmental developments. The Non‑financial Risk chapter describes how Rabobank manages operational risks, including cyber threats, transformation challenges, data management, and resilience, as well as compliance risks such as AML, sanctions, fraud, and data privacy. Additional sections cover model risk, including the progress on regulatory models, IFRS9 developments, and the growing importance of AI risk management.
Together, these chapters provide a transparent view of Rabobank’s risk profile, the measures taken to remain within the defined risk appetite, and the bank’s ongoing efforts to balance risk, return, and sustainability in support of long‑term value creation.
Liquidity Coverage Ratio
182
%
2024: 175%
Impairment chargesOn financial assets
€ 764
million
2024: 468 million
Earnings at risk
€ (708)
million
2024: (557) million
Risk Management Framework
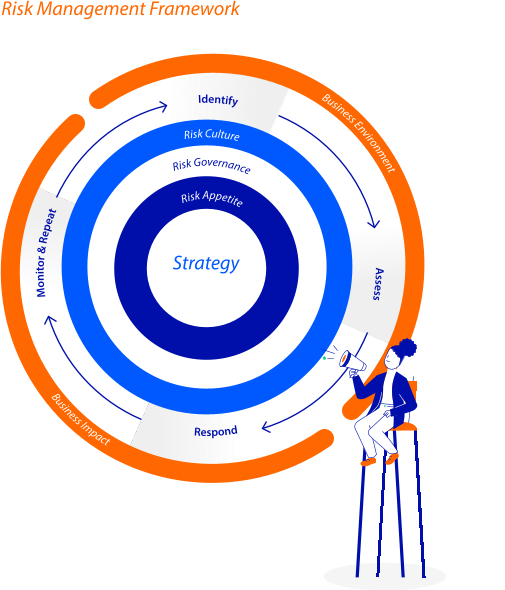
Our risk management and control model is underpinned by common principles, a solid risk culture, clear Group governance structure, and advanced risk management processes across the identified risk types. This section sets out how Rabobank Group manages its risks on a day-to-day basis, explains how the risk management function is embedded within the organization based on the “three lines of responsibility” risk governance model. The section also provides qualitative and quantitative risk disclosures for business risk, credit risk, funding & liquidity risk, market risk in the banking book, market risk in the trading book, operational risk, compliance risk, and model risk.
Every day, we make informed risk decisions as we engage with new and existing customers, extend credit, enter into interest rate and leasing contracts, make equity investments, form partnerships, and provide various customer services. We monitor risk metrics effectively, and with proactive risk management, we manage to serve our customers across different segments and sectors while satisfying our stakeholders.
This controlled approach supports our continued prosperity as a bank. Our business model and solvency levels demonstrate resilience in a challenging macroeconomic and geopolitical environment. The transition to a low-carbon economy not only represents a great opportunity and is fully aligned with our business strategy, but also a risk which is why we embedded ESG factors in our risk management framework and models (as a risk driver).
We implement risk activities and establish controls to manage material risks within a robust risk management framework, aligned with our conscious risk-taking approach. We continuously assess the effectiveness of this framework and adapt to the latest developments and requirements. Ultimately, our risk management activities are designed to help achieve the ambitions of the bank, our customers, and stakeholders, all within the boundaries of our risk appetite.
Managing Risks
Our risk management activities are seamlessly integrated in our strategy design and execution. While new strategic initiatives can create opportunities, it is essential to balance the anticipated return against the associated risk and take into account the sustainability impact.
We monitor external developments to identify emerging risks and key threats to our strategic plans.
We conduct regular, comprehensive top-down and bottom-up risk assessments to identify various types of risks and perform specific stress tests to evaluate the potential impact of adverse scenarios.
An integrated overview of these risks and the measures taken to address them is periodically reviewed by the Managing Board and Supervisory Board.
Risk Governance
Our internal governance ensures transparent and consistent three lines of responsibility across Rabobank. Our risk governance framework supports the achievement of our strategic priorities and is based on regulatory guidelines and market practices. Global policies facilitate the execution of the business strategy, adherence to the risk appetite, and oversight of risks, ensuring a consistent approach across the Group.
The business, including its support functions, owns, takes, and manages risk, return, and sustainability.
Risk and Compliance (second line within CRO function), challenges and advises on risk-taking activities and monitors the risk profile.
Audit (third line) provides independent assurance and insights on the quality and effectiveness of internal controls, risk management, compliance, and governance within the bank.
The risk management framework covers both existing and emerging risks including ESG risks via the main risk types:
Financial risks: business risk, credit risk, liquidity risk, market risk in the banking book and market risk in the trading book.
Non-financial risks: operational risk, compliance risk, and model risk.
Risk identification, materiality assessment and classification allow for a clear understanding of risks and promote a common understanding of risk management. The risk appetite is determined for all material risks, which are managed in alignment with the risk profile and our strategic priorities.
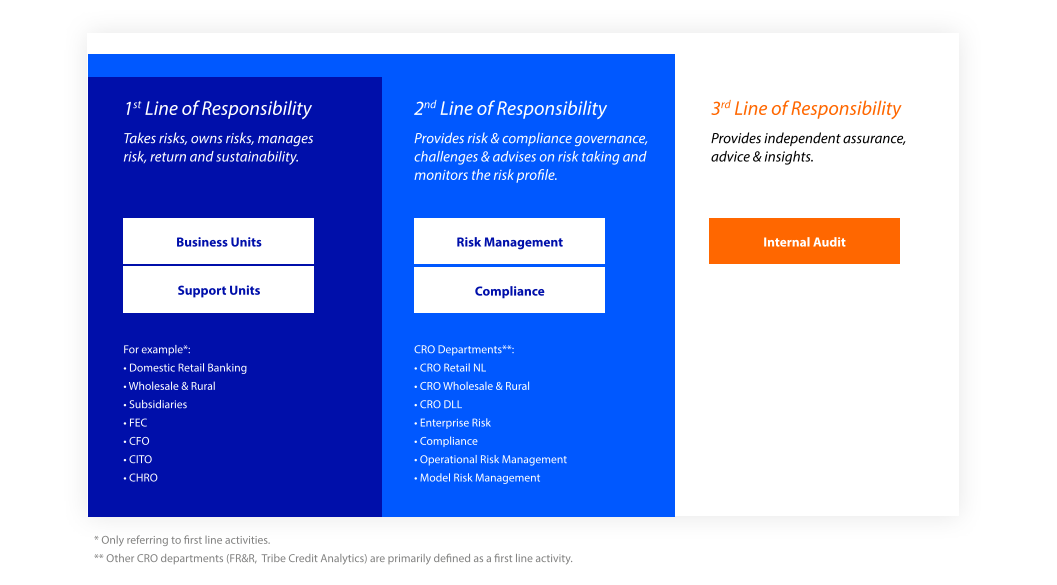
Three Lines of Responsibility
The Three Lines of Responsibility framework defines clear roles for managing risks and compliance across the organization.
The first line consists of business and support units responsible for day-to-day risk management.
The second line, the Compliance and Risk (CRO) department, operates according to internal governance and charters to oversee and guide risk processes. This approach ensures clarity, collaboration, and efficiency in handling risks per type, fostering proactive and responsible behavior. By understanding and respecting each role, the model supports doing the right thing for customers and achieving effective risk management aligned with Rabobank’s mission of Growing a better world together.
The third line, internal Audit, provides independent assurance and insights on the quality and effectiveness of internal controls, risk management, compliance, and governance within the bank.
Risk Culture
Rabobank’s Risk Culture approach is aimed at ensuring a sound Risk Culture and Risk Maturity. Various instruments have been introduced and set in motion to steer the aspired Risk Culture, to assess, challenge and report the actual status and to reflect and act if interventions are required or desired. With the Risk Culture approach, a consistent way-of-working across the globe has been introduced, leading to insights to determine actions, better reporting and sharing of best practices. Leadership commitment, strong behavioral risk management and an enabling work environment are key drivers to set and steer a sound Risk Culture.
Risk Strategy
Our mission 'Growing a better world together', underlines our cooperative roots and emphasizes our dedication to enabling our customers to achieve their ambitions.
Rabobank’s risk strategy articulates the risk priorities the bank needs to manage as a precondition for achieving its strategic plan. The risk strategy is based on (a) protecting profit and profit growth; (b) maintaining a solid balance sheet and (c) protecting the bank's identity and reputation. It is used as the starting point to further define the risk appetite on individual risk type level. Rabobank reviews its risk strategy annually when updating its Risk Appetite Statement but has kept its high-level risk strategy stable for several years now.
Risk Assessment
To effectively deliver on our risk strategy, it is crucial to understand the risks Rabobank faces. Our structured approach to risk identification and assessment ensures that both current and potential future risks to Rabobank’s mission, vision, and strategic priorities are identified.
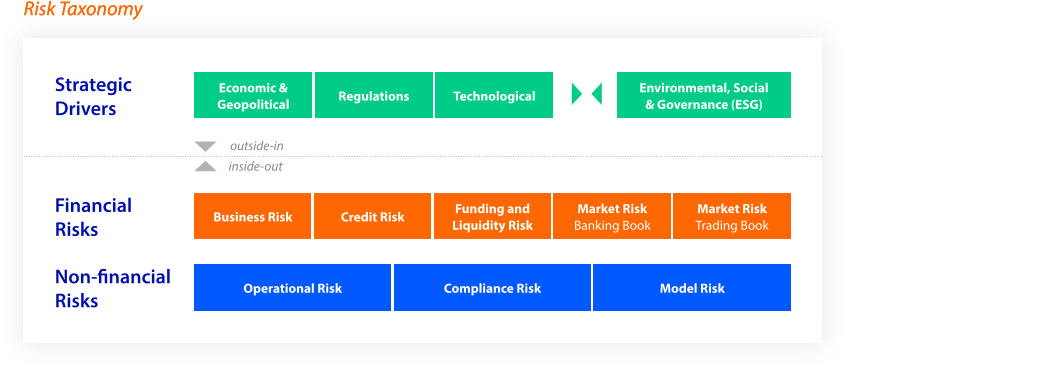
Our Risk Taxonomy is divided into three dimensions. More specifically:
Strategic drivers: major developments that threaten to disrupt the assumptions and outcomes at the core of Rabobank's strategy, but could also provide opportunities for future growth. These are factors that may lead to financial and non-financial risks.
Financial risks: risks that we consciously accept in order to benefit from the premium that the market offers for taking on risks (risks for which we have a risk appetite).
Non-financial risks: risks for which we have no appetite, but which are tolerated within limits because they are inherent to the operation of the bank.
ESG Risk as a strategic driver
ESG is one of the identified strategic drivers. The consequences (physical risk) of climate and nature change (such as rising average temperatures, extreme weather events and biodiversity loss) and the risks related to a shift towards a climate-neutral economy (transition risk) are central in our mission and strategy. We are committed to the Paris Climate Agreement goals. We are a signatory to the Net-Zero Banking Alliance, the Dutch Financial Sector Climate Commitment, the Finance for Biodiversity Pledge, and the Taskforce on Nature-related Financial Disclosures. Rabobank is committed to the United Nations Guiding Principles (UNGP) on Business and Human Rights and OECD guidelines on Responsible Business Conduct and we consider it a shared responsibility to act on climate, to value nature, and to enable people in the transition.
At Rabobank, we optimize our business between risk, return, and sustainability impact. We create value together with our customers: each opportunity must contribute to a sustainable future and fit our strategy. Our risk management framework covers both existing and emerging risks via the main risk types. We have adopted a full end-to-end approach to ESG risks embedded across every aspect of the bank. We continued to mature our approach on integrating the risk of climate change by developing climate risk management tools, processes, and capabilities and implementing them in our policy framework, risk assessment, and business processes.
Please refer to the Sustainability Statements for an in-depth view on how our risk management framework manages risks and opportunities between our ambition, commitments, strategy, and business model.
The impact of ESG risk drivers is assessed for each of the risk types in the risk taxonomy as illustrated below:
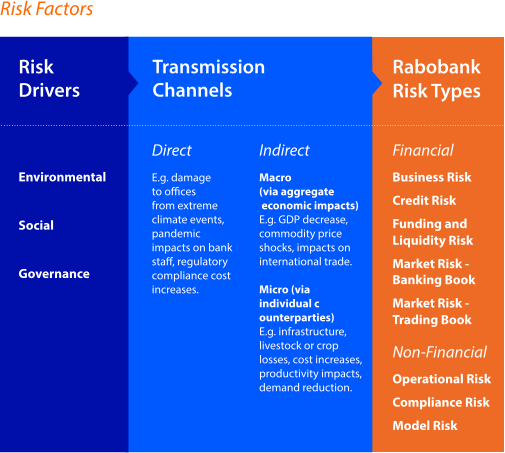
In addition to the traditional outside-in perspective on risks Rabobank faces, the inside-out perspective is assessed via the double materiality assessment of impacts which the bank and its customers or suppliers might have on a wide array of ESG topics.
Capital Risk Profile
ICAAP
Rabobank has fully integrated ESG risks in its Internal Capital Adequacy Assessment Process (ICAAP). Material ESG risks are taken into account in all steps of this process, including in risk identification, risk appetite and risk management. As part of the Risk Identification and Assessment (RIA) process, Rabobank has identified the main ESG risk drivers via a double materiality assessment and these ESG drivers are assessed to have a material impact on Credit Risk, Business Risk, Operational and Compliance Risk. In the ICAAP, the impact of ESG on the actual/current, forecasted and stressed positions of these risk types are considered.
ILAAP
ESG risks can affect funding and liquidity, for example through cyber-attacks, reputational or strategic developments, potentially contributing to (deposit) outflows or credit rating downgrades. From a liquidity perspective, ESG is currently not assessed as a standalone material risk type; however, ESG-related developments are considered as potential drivers alongside other liquidity risk drivers and are embedded in the liquidity risk framework. Funding and Liquidity Risk covers ESG impacts in economic and normative key risk indicators (KRIs). Short-term liquidity risk indicators (e.g., LCR, LST) take ESG into account by considering that shifts from non-sustainable to sustainable assets could potentially affect the credit quality and market liquidity of certain non-sustainable assets. Where relevant, less liquid or lower-rated assets may be treated more conservatively in the liquidity buffer (e.g., through eligibility considerations or higher haircuts). Long-term liquidity risk indicators (e.g., NSFR) account for ESG impacts through potential effects on loan performance, which may require more stable funding for underperforming or non-performing exposures. Similarly, bonds that are not eligible for short-term liquidity metrics may require more stable funding in longer-term measures.
Risk Appetite
Our Risk Strategy produces a set of Risk Appetite Statements that are directly linked to the medium-term planning 2026-2028 (MTP) and our strategic pillars: Excellent Customer Focus, Meaningful Cooperative, Rock-Solid Bank, and Empowered Employees. These pillars establish the high-level boundaries within which our risk appetite operates. We define our risk appetite by risk type, specifying the level of risk we are willing to accept to achieve our business objectives. This overall maximum level of risk exposure is used in business activities to evaluate the desired risk profile against the risk-return sustainability profile of a given activity.
At an aggregated level, the risk appetite is articulated for capital and liquidity, aligning with the risk management priorities set by the Risk Strategy. The Managing Board is responsible for approving the Risk Appetite Statement (RAS) for the entire Group annually. This process cascades down, with each subsidiary's board having its own risk appetite. Our risk appetite is embedded across Rabobank through principles, policies, standards, risk indicators, limits, and controls including employment of early warning limits enabling monitoring and proactive risk management of potential risks before they escalate.
A combination of breach management processes and risk governance ensures an adequate and timely response to risks that are pressuring or have exceeded our risk appetite. The risk appetite is reviewed and updated at least annually to incorporate internal or external events with a material impact. Entity-specific Risk Appetite Statements further detail the group risk appetite. In 2025, our Group Risk Appetite Statement was categorized per identified main risk type and further specified with qualitative Risk Appetite Statements and quantitative risk appetite indicators.
Group Risk Appetite Statement
| Topic | Definition | Group Risk Appetite |
|---|---|---|
| ESG: Environmental, Social and Governance | The risk of loss (including financial and non-financial impact) resulting from inadequate or failed internal processes, people and systems or from external events, including, but not limited to, legal risk or information and communication technology (ICT) risk, but excluding strategic and reputational risk. | Rabobank is embedding assessments of ESG risks into its risk management framework. Our ambitions, commitments, regulatory and supervisory requirements are the drivers to embed ESG risk into our business model and strategy, governance and risk appetite, risk management and disclosures. Rabobank has no risk appetite for doing business with a customer or a business partner who knowingly causes or contributes to the violation of internationally recognized human rights.As part of our mission of ‘Growing a better world together’, we help protect our customers, members and society from financial economic crime. We are committed to preventing, detecting and responding to bribery, corruption, and other financial economic crime misconduct including money laundering and sanctions. |
| Business Risk | The risk of losses due to changes in the competitive environment or events which damage the franchise or operating economics of a business. | Rabobank is a strongly capitalized bank, with prudent buffers above regulatory requirements, to protect senior bond holders against the (unlikely) event of a bail-in. We do this against efficient costs and with sufficient flexibility for (re)allocation of capital between different portfolios, products and geographies. We achieve a solid performance, with limited volatility in earnings, based on a well-diversified asset portfolio in terms of products, sectors and geography. Rabobank prices its risk well, allocate sufficient capital to growth themes, and migrates to more effective (digital) services. Rabobank’s operational efficiency is competitive: we do the right things well and are conscious of the risks we take. |
| Credit Risk | The risk that a bank, borrower or counterparty will fail to meet its obligations in accordance with agreed terms. | Rabobank maintains a profitable credit portfolio, with a controlled risk profile to limit the impact of impairment charges on the profitability and reputation of the bank. Rabobank manages concentrations in the credit portfolio with clear limits per country, sector, portfolio and one-obligor, to ensure a low risk profile on concentration risk. |
| Funding and Liquidity Risk | The risk that Rabobank cannot fund itself for the increases in and/or rollovers in assets and meet obligations as they come due, without incurring unacceptable losses. | In order to optimize funding availability and funding costs for our customer requirements, Rabobank has high quality and robust liquidity buffers and a diversified global funding base in terms of retail and wholesale funding as well as in terms of investors, instruments, maturities, countries and currencies. Rabobank has access to sufficient liquidity to timely meet contractual or contingent obligations and to be able to survive stressed liquidity conditions without changing its business model. |
| Market Risk in the Banking Book | The risk of changes in value or earnings of non-trading banking books resulting from interest rate risk, credit spread risk or FX/commodity price risk. | Following the bank's strategy and the transformation role as retail bank, Rabobank accepts a significant level of interest rate risk, as this may be an important driver for the bank’s profit. However, losses due to changes in interest rates should not threaten the financial stability of the bank. Due to our strategy with a rock-solid balance sheet including sustainable funding sources and adequate liquidity buffer assets, Rabobank accepts limited credit spread risk in the banking book. Rabobank aims for a limited FX Translation Risk impact of exchange rate movements on the Rabobank Group CET1 ratio. |
| Market Risk in the Trading Book | The risk of changes in the value of the trading portfolio where market risks occur, resulting from price changes in the market. | Rabobank aims to be modestly exposed to market movements in its trading environment and to market appetite in its underwriting business. |
| Operational Risk | The risk of loss (including financial and non-financial impact) resulting from inadequate or failed internal processes, people and systems or from external events, including, but not limited to, legal risk or information and communication technology (ICT) risk, but excluding strategic and reputational risk. | Rabobank acts in compliance with the letter, intent, spirit and purpose of prevailing rules and regulations. Rabobank has a low tax risk appetite with regard to non-adherence with rules and regulations on communication to customers and stakeholders with specific focus on areas identified as requiring key focus such as adherence to tax rules and design / delivery of products to customers. We protect the identity and reputation of Rabobank and safeguard the trust customers and investors have in Rabobank. We live up to our community commitments, we do what we say, and avoid customers, business and risks that could damage our reputation and unique identity. |
| Compliance Risk | The risk of impairment of Rabobank’s integrity, which can damage the rights and interests of our customers as well as the reputation and trustworthiness of Rabobank, leading to legal claims or regulatory sanctions and/or financial loss. | Rabobank does not accept being willfully or negligently involved in Financial Economic Crime. Although it is accepted that it is not possible to eliminate these risks completely, Rabobank will have mitigating controls in place in line with the laws and regulations as reflected within the Bank’s policies.Rabobank maintains a limited risk appetite for client relationships that may involve money laundering, terrorist financing or other criminal activity. This means that while some residual risk may exist due to the complexity of global financial systems, Rabobank expects these risks to be minimized through robust controls. Customers or transactions that present a material risk in these areas must be subject to enhanced due diligence, and where necessary, declined or terminated. Any actual or suspected involvement in such activities must be promptly escalated and investigated, with appropriate remediation measures taken.Rabobank maintains a limited risk appetite for customer relationships that may involve sanctions violations and proliferation financing. Rabobank has no appetite for volitional sanction violations. This means that while some residual risk may exist due to the complexity of global financial systems, Rabobank expects these risks to be minimized through robust controls, proactive monitoring, and timely escalation. Relationships or transactions that present a material risk in these areas must be subject to enhanced due diligence, and where necessary, declined or terminated. Any actual or suspected involvement in such activities must be promptly escalated and investigated, with appropriate remediation measures taken.Given the nature of Rabobank’s business, it is impossible to eliminate all bribery and corruption risks. In line with a risk-based approach (‘’RBA’’), Rabobank has controls in place to prevent, detect and mitigate these risks; and where it knows or reasonably suspects that Rabobank, through its employees or third parties could be involved in bribery and corruption, Rabobank has no risk appetite for establishing or maintaining a relationship. Where a customer has been convicted of bribery or corruption, the bank will assess whether the resulting legal, reputational, or control risks can be mitigated, and a customer exit will be pursued if those risks cannot be managed. |
| Model Risk | The potential loss or other adverse consequences an institution may incur, as a consequence of wrong decisions based on the output of internal or external models (i.e., models purchased or used from an external party), due to errors in the design, implementation or use of such models. | Rabobank is committed to the responsible use of models that are reliable, robust and sustainable. Model risk is the potential for financial, regulatory or reputational harm to the bank or its stakeholders due to incorrect outputs caused by deficiencies in model design, implementation or incorrect use. |
Financial Risk
The following chapter offers a more detailed overview of the risk profile for each primary risk Financial Risk type.
Business Risk
Rabobank operates in a global environment and thus, external developments and risks, as described in the chapter Trends, Developments and Outlook are relevant for the management of financial and non-financial risks. In the global environment, our business is optimized between risk-return and sustainability impact.
Decreasing volumes, (commercial) margins, fees, commission, other income, or increasing (operating) costs caused by unexpected or temporary developments may lead to losses. Business risk is largely managed and measured through analyses of the most relevant risks for Rabobank’s business model. These analyses support management in the assessment, impact evaluation, and management of risks. The MTP process is key for managing business risk. In the MTP process, management sets the course of business for the coming year(s) based on different scenarios. Rabobank updated its scenario approach to determine the amount of business risk capital. These scenarios provide both a basis for the calculation and quantification of the required capital, and qualitative insights into the impact on Rabobank’s volumes, margins, cost, fees, and commissions under a broad range of possible developments. The implementation of Basel IV improved our business risk position with a significant improvement of the capital position.
Risk Profile Performance
Credit Risk
Portfolio credit risk refers to the risk of losses due to a customer or counterparty or group of customers or counterparties defaulting on its payment obligations towards Rabobank, considering diversification, concentration, and correlation effects across the portfolio and macroeconomic environment.
In 2025, the quality of our credit portfolio remained strong. The Non-Performing Loans (NPL) ratio declined to 1.4%, the loan impairment charges amounted to EUR 764 million, amply within the bank's risk appetite. Robust asset quality is mainly a result of Rabobank’s prudent underwriting policies and strategic focus on the Dutch market, vendor finance, the international F&A sectors and banking for the energy transition.
The credit quality of our loan portfolio remained robust in DRB and W&R, with heightened Credit Risk within DLL, driven mostly by continued adverse developments in the Brazil portfolio. Stage 2 exposure declined, but remained at elevated levels due to previous regulatory treatment of interest-only mortgage customers and model updates. Persistent geopolitical tensions, coupled with ongoing economic uncertainty and the growing impact of climate-related events, highlight the importance of sustained vigilance and adaptive risk management.
Credit Portfolio
The private sector loan portfolio is related to Dutch mortgages to Private Individuals (45%), Business Lending in the Netherlands (17%), Wholesale & Rural (29%), DLL (9%).
Loan impairment charges of EUR 764 million (17 basis points at an annualized rate) are higher compared to 2024 (EUR 468 million) and below the through-the-cycle range of around 20 basis points. The impairment charges mainly originate from stage 3 impairments within DLL and Rural. Availability of more recent loss data warranted a re-assessment, increasing the stage 3 provisions. Management adjustments cover (interest-only) mortgages (EUR 86 million), geopolitical risks (EUR 128 million), climate & environmental risks (EUR 88 million), and an addition to the Corporate Acquisition Finance (CAF) portfolio (EUR 38 million).
Stage 2 ratio decreased to 12.5% (2024: 14.1%), amounting to an exposure of EUR 64.9 billion (2024: 69.6 billion). The decline is mostly driven by model implementations, and higher house prices for the Dutch mortgage portfolio.
Rabobank closely monitors the developments of the NPL total coverage ratio – which encompasses the NPL coverage ratio, NPL collateral ratio, and the prudential backstop – to ensure adequacy of the provisioning levels and sufficiency of the capital buffers. The NPL total coverage ratio of 93.3% (2024: 94.9%) remains high compared to other banks.
The NPL coverage ratio increased to 20.2% (2024: 16.1%), driven by the re-assessment of stage 3 provisions. The increase was partially offset by write-offs of fully provisioned customers. These write-offs improve asset quality and reduce the NPL coverage ratio. Differences in NPL coverage ratios between banks reflect differences in portfolio composition, collateralization (including valuation rules and enforceability), accounting standards, write-off policies and loan impairment policies.
Private Sector Loan Portfolio - Credit Risk
| Year-end 2025 | Year-end 2024 | |||||
|---|---|---|---|---|---|---|
| Business Units | DRB Private Individuals | DRB Business Loans | Wholesale & Rural | Leasing | Private sector loan portfolio | Private sector loan portfolio |
| Total exposure (EUR mln)1 | 205,211 | 79,188 | 132,051 | 43,384 | 459,834 | 447,316 |
| Stage 1 (%) | 81.8% | 83.5% | 93.0% | 78.8% | 85.9% | 83.9% |
| Stage 2 (%) | 17.7% | 13.5% | 5.3% | 17.7% | 12.5% | 14.1% |
| Stage 3 (%) | 0.5% | 3.0% | 1.7% | 3.5% | 1.6% | 2.0% |
| Impairment charges (EUR mln) | 25 | 85 | 255 | 399 | 764 | 468 |
| Stage 1 net additions (EUR mln) | 6 | 18 | (88) | 13 | (51) | 40 |
| Stage 2 net additions (EUR mln) | 57 | 52 | 45 | (27) | 127 | (239) |
| Stage 3 net additions (EUR mln) | (34) | 43 | 341 | 447 | 797 | 770 |
| Recoveries (EUR mln) | (4) | -28 | (43) | (34) | (109) | (103) |
| Provisions (EUR mln) | 155 | 877 | 1,024 | 575 | 2.631 | 2,615 |
| Stage 1 (EUR mln) | 16 | 93 | 171 | 89 | 369 | 451 |
| Stage 2 (EUR mln) | 115 | 193 | 167 | 105 | 580 | 490 |
| Stage 3 (EUR mln) | 24 | 591 | 686 | 381 | 1,682 | 1,674 |
| NPL coverage ratio (%) | 2.5% | 24.2% | 20.8% | 24.2% | 20.2% | 16.1% |
| NPL total coverage ratio (%) | 103.8% | 94.1% | 94.7% | 82.6% | 93.3% | 94.4% |
| PD (%) | 0.6% | 1.9% | 1.1% | 3.1% | 1.2% | 1.1% |
| LGD (%) | 7.9% | 21.8% | 31.5% | 31.8% | 19.5% | 18.6% |
- Total exposure denotes outstanding loan amount net of expected credit losses for the respective sub portfolio.
Residential Real Estate
The Dutch mortgage portfolio is characterized as low risk, as reflected by a low NPL coverage ratio of 2.2% (2024: 4.3%) and loan impairment charges of 1 basis point (2024: minus 3 basis points). This favorable risk profile is supported by prudent underwriting criteria, robust housing prices, and structural housing shortages. Average house prices increased by 8.6% in 2025 (2024: 8.7%), and Rabo Research expects prices to increase further in 2026 and 2027.
The Dutch mortgage portfolio with a total exposure of EUR 204 billion continues to perform well. The portfolio shows a decreased loan-to-value (LTV) ratio of 48.1% (2024: 48.3%) and an increased share of National Mortgage Guarantees (NHG) of 17.2% (2024: 16.3%). The share of Interest-Only Mortgages (IOM) decreased to 46.8% (2024: 49.2%), in line with our portfolio de-risking strategy. On January 22nd 2026, Rabobank announced stricter norms on IOM lending, effective May 11th 2026.
Commercial Real Estate
One of Rabobank's financing strategies is focused on the Dutch Market for Commercial Real Estate (CRE), with a particular emphasis on lower-risk subsectors that contribute to addressing key societal challenges, such as the housing shortage and energy transition. Our CRE portfolio remains stable at approximately EUR 23 (2024: 22.7) billion , accounting for 5% (2024: 5%) of the private sector loan portfolio. In 2025, a significant risk transfer transaction of around EUR 1 billion was closed to support our ambition to grow our CRE lending in the Netherlands in a risk-controlled way. The asset quality of the CRE portfolio is strong with a stage 2 ratio below 2% and NPL ratio below 1%.
Asset quality of Rabobank's CRE portfolio remains robust. The average LTV of the portfolio is 49%, with less than 2% of the exposure having an LTV above 80%.
Funding and Liquidity Risk
Funding and liquidity risk arises when Rabobank Group is unable to obtain sufficient liquidity to meet contractual or contingent obligations on time or cannot sustainably maintain a well‑diversified funding base to support its assets and off‑balance‑sheet activities without incurring unacceptable losses.
Rabobank's funding and liquidity management framework is equipped with adequate liquidity positions to meet expected and unexpected cash flows and collateral needs without affecting either daily operations or the financial stability of the bank. This is supported by a stably funded balance sheet, sufficient and high-quality liquidity buffers, a diversified funding profile, a limited structural currency mismatch, and liquidity measures managed to target and well within risk limits. The objective is to maintain Rabobank Group’s ability to fund assets and meet any contractual financial obligations as and when they fall due without unacceptable losses under any circumstances.
The importance of a healthy balance sheet and prudent funding and liquidity risk management is fully embedded in Rabobank’s strategy, budgeting, procedures, and measurements. The liquidity and funding risks are managed centrally by Group Treasury, under the responsibility of the Asset-Liability Committee (ALCO) during business-as-usual and/or the Liquidity Crisis Team (LCT) during stress periods.
Rabobank has an extensive set of normative and economic risk indicators and market indicators which prudently cover Rabobank's funding and liquidity risk. The metrics, which are considered crucial for risk management and balance sheet utilization, are included in the bank’s Risk Appetite Statement (RAS).
Funding Profile
The funding and liquidity risk framework focuses on stable funding consisting of funds entrusted by customers and long-term wholesale funding. Rabobank takes various measures to avoid becoming overly dependent on a single source of wholesale funding. These include the balanced diversification of financing sources regarding maturity, currencies, investors, geography and markets, a high degree of unsecured funding (and therefore limited asset encumbrance), and an active and consistent investor relations policy.
Our funding mix consists of three building blocks: customer deposits, issued debt, and equity. Our sizeable and stable retail deposit base can be seen as the anchor of the funding mix, and the amount of stable retail customer funding increased further in 2025. The deposit base is complemented by centrally sourced Treasury deposits from large corporate and financial institutions.
In addition to deposits, Rabobank attracts funding through the issuance of debt instruments. This includes the issuance of preferred senior (PS) and non-preferred senior (NPS) instruments, driven by capital requirements (Tier 2/MREL). Rabobank maintains a prudent maturity profile of its debt instruments to maintain a reliable funding base while adding to the flexibility of the bank’s balance sheet in terms of volume, tenor, and currency when compared to customer-related deposits. The following table shows a breakdown of our issued debt.
| Amounts in billions of euros | December 2025 | December 2024 | Change |
|---|---|---|---|
| Issued debt | 118.2 | 126.4 | (8.2) |
| Of which short term debt securities | 29.4 | 28.2 | 1.2 |
| CD/CP | 26.5 | 25.3 | 1.2 |
| ABCP | 2.9 | 2.9 | 0.0 |
| Of which long term debt securities | 88.8 | 98.2 | (9.4) |
| Senior preferred | 30.3 | 34.8 | (4.5) |
| Senior non-preferred | 23.2 | 23.6 | (0.4) |
| RMBS and ABS | 6.5 | 8.5 | (2.0) |
| Covered Bonds | 22.8 | 22.8 | 0.0 |
| Subordinated debt securities | 6.0 | 8.5 | (2.5) |
In 2025, the amount of issued debt decreased by EUR 8.2 billion to EUR 118.2 billion. Long-term debt securities decreased by EUR 9.4 billion. The changes in issued debt reflect funding management in view of the uncertain macroeconomic outlook, market conditions in Q4 2025, the maintenance of an adequately diversified funding profile, and MREL requirements. Funding and Liquidity is managed centrally, which means that individual locations adhere to the strategic principles of maintaining a stable, diversified, and optimized funding mix at the Group level while seeking their own funding and minimizing local liquidity gaps. The strategic principle of stable funding also applies to the currency-specific level. Rabobank’s funding and liquidity risk indicator levels (see Table below) are well within our risk appetite and comply with regulatory requirements. The Loan-to-Deposits (LtD) ratio measures the reliance on wholesale funding. It is defined as Total Loans over Total Deposits, based on a specific definition of loans and deposits. During 2025, the LtD remained stable around 107%. Asset Encumbrance (AE) is the result of providing assets as collateral for certain liabilities. It poses risks to unsecured creditors who are unable to benefit from the liquidation of encumbered assets in the event of insolvency. The ratio is stable around 9% and well within the target.
Balance Sheet Risk
| 2025 | 2024 | Change | |
|---|---|---|---|
| Net Stable Funding Ratio (NSFR) | 135% | 135% | 0.4% |
| Loan-to-Deposit Ratio (LtD) | 107% | 110% | (3.0%) |
| Asset Encumbrance Ratio | 8.4% | 9.2% | (0.8%) |
Short-term Liquidity Resilience
Another key component of funding and liquidity management is to maintain substantial high-quality liquid assets (HQLA)/Liquidity Buffer. These assets can be used as collateral for central banks in repo transactions or can be sold directly in the market to generate liquidity immediately.
In addition, Rabobank has securitized a portion of the mortgage and SME loan portfolio internally, which means it can be used as collateral for the central bank. The outstanding amount of retained collateral has increased by EUR 6.9 billion (market value) in 2025 to improve Rabobank’s capacity to absorb liquidity outflows. Since this concerns retained securitizations, it is not reflected in the consolidated balance sheet.
Our liquidity buffer consists of cash at central bank and qualifying securities in the different Treasury books with High Quality Liquid Assets (HQLA).
Liquidity Buffer Composition
| Amounts in billions of euros | 2025 | 2024 | Change |
|---|---|---|---|
| Cash and central bank receivables | 57.7 | 80.6 | (22.9) |
| Level 1 assets | 31.7 | 22.7 | 9.0 |
| Level 2 assets | 3.7 | 3.3 | 0.4 |
| Core Buffer (HQLA) | 93.1 | 106.6 | (13.5) |
The liquidity buffer has sufficient capacity to cover the net outflows in a stress scenario, as reflected by the LCR and internal stress test results. Throughout 2025, Rabobank’s liquidity buffer remained at a prudent level and the LCR was managed above regulatory limits and internal targets.
Liquidity Coverage Ratio
| 2025 | 2024 | Change | |
|---|---|---|---|
| Group LCR | 182% | 175% | 6.9% |
Detailed plans have been drawn up for contingency funding to ensure the bank is prepared for potential crisis situations. Periodic operational tests are performed on these contingency funding plans. The liquidity stress test assesses whether Rabobank maintains sufficient liquidity buffers to mitigate funding and liquidity pressures, ensuring the bank can meet severe outflows and continue supporting its customers under defined stress scenarios. Unweighted counterbalancing capacity equals EUR 235.4 billion, with EUR 197.2 billion in weighted counterbalancing capacity.
Risk Profile Performance
In 2025, Rabobank remained rock-solid from a funding and liquidity perspective. The liquidity buffer remained high close to 62% of the buffer is held in cash at central banks. Rabobank managed Rabobank Group LCR and NSFR comfortably above the internally defined risk limits and therefore well above the regulatory minimum requirements throughout 2025. The USD balance sheet is of strategic importance for Rabobank. Specific monitoring and reporting of the USD funding and liquidity position is in place, including a USD-specific LCR and NSFR.
Rabobank integrates sustainability risk into its liquidity and funding management framework. Sustainability risks, like cyber threats or strategic challenges may lead to deposit outflows and/or credit rating downgrades. These impacts are reflected in both economic and normative key risk indicators (KRIs). Short-term liquidity indicators (e.g., LCR, LST) help monitor investor behavior, signaling shifts towards sustainable assets, and higher default rates for non-sustainable exposures. Non-liquid or lower-rated assets are excluded from the liquidity buffer or subject to higher haircuts. Long-term indicators (e.g., NSFR) incorporate sustainability considerations through loan performance, requiring more stable funding for underperforming or non-performing loans. Non-LCR eligible bonds also carry higher stable funding requirements under NSFR.
Sustainable Finance
The sustainable finance context is characterized by fast market developments from both a regulatory and a geopolitical perspective. Rabobank leverages the EU Taxonomy and other sources such as subsidy schemes and market principles to help us define and steer on sustainable finance. Sustainable finance has been included in the medium-term planning process, balance sheet management and strategic choices on risk/return/sustainability trade-offs. Steering on risk/return/sustainability trade-off will further mature over time.
Since 2016, Rabobank has its Sustainable Funding Framework (SFF) in place to support the bank’s sustainability efforts. Green instruments in various formats can be issued from the SFF, including secured and unsecured bonds, commercial paper, certificates of deposit and wholesale deposits. The SFF eligible green asset criteria are based on the technical screening criteria for substantial contribution of the EU Taxonomy. Since 2016, Obvion issues green RMBS on stand-alone green bond frameworks.
Our sustainable funding ambitions are on a best-effort basis and are dependent on data availability, sustainable asset availability, financial market circumstances, investor demand and market- and regulatory developments.
Market Risk in the Banking Book
Market Risk in the Banking Book is the risk of changes in value or earnings of non-trading banking books resulting from interest rate risk, credit spread risk or FX/commodity price risk.
Rabobank manages its balance sheet in order to protect the asset and liability positions against interest rate risk in the banking book (IRRBB), credit spread risk in the banking book (CSRBB) and FX & Commodity (Price) Risk in the banking book.
IRRBB
In the context of easing inflation and increased geopolitical tensions during 2025, the yield curve steepened. Changes in interest rates impact the bank’s economic value and earnings. To respond to changing interest rates, an IRRBB strategy with potential changes of duration is in place. Prepayment risk assumptions and hedging are monitored continuously and reviewed to reflect, among other things, interest rate movements and current housing market activity. Declining interest rates can lead to margin compression for non-maturing deposits.
To monitor balance sheet exposure, a set of validated risk metrics is in place that measure interest rate risk from the perspectives of earnings and economic value, including Earnings-at-Risk, Modified Duration, Supervisory Outlier Test on Economic Value of Equity (EVE SOT) and Supervisory Outlier Test on Net Interest Income (NII SOT). Exposure was managed within defined internal risk appetite limits and regulatory requirements in 2025.
Interest Rate Risk in the Banking Book
| 2025 | 2024 | Change | |
|---|---|---|---|
| Modified Duration (%) | 2.9% | 3.5% | (0.6%) |
| Earnings at Risk (millions) | (708) | (557) | 151 |
| EVE SOT (%) | 7.2% | 8.4% | (1.2%) |
| NII SOT | (2.4%) | (1.7%) | (0.7%) |
Risk Profile Performance
In 2025, IRRBB positioning remained fairly stable. Movements are related to regular strategic Treasury positioning and responding to higher savings volumes within risk appetite limits.
Credit Spread Risk in the Banking Book (CSRBB)
Credit spread risk in the banking book (CSRBB) refers to the risk that is driven by changes in the market perception of the price of credit risk, liquidity premium and potentially other components of credit-risky instruments introducing fluctuations in the price which are not explained by IRRBB or by expected credit/(jump-to-) default risk.
In line with its CSRBB strategy—focused on maintaining a robust balance sheet, sustainable funding sources, and an adequate liquidity buffer—Rabobank accepts only a limited level of credit spread risk in the banking book. The exposure aligns with the strategy defined by the ALCO committee and managed within defined risk levels, where the main driver stems from securities held within the HQLA portfolio. The bank employs a centralized approach to manage its exposure to CSRBB, supported by a set of risk indicators that monitor developments at an aggregated level. These indicators primarily focus on the impact on Economic Value and Earnings and is reported monthly to ALCO and Risk Committee.
FX & Commodity Price Risk (Banking Book)
Rabobank’s international operations and cross-border activities expose it to foreign exchange rate risk. A portion of the bank’s capital and funding flows occur across borders and involve multiple currencies. In the banking book, commodity price risk arises from Structured Inventory Products business, though the resulting exposure is economically minimal.
FX Translation Risk (FXTR) is the risk that FX fluctuations will adversely affect the translation of assets and liabilities of operations --denominated in foreign currency-- into the functional currency of the parent company. The functional currency for CRUA is the euro. Translation Risk impacts Rabobank’s equity position, risk-weighted assets, and capital ratios. Rabobank manages its FXTR with regard to its Common Equity Tier 1 (CET1) ratio by deliberately taking positions and/or hedges to reduce this risk on a foreign currency basis.
FX & Commodity (Price) risk (Banking Book)
| 2025 | 2024 | Change | |
|---|---|---|---|
| FX Basis Impact CET1 Ratio | (5.4) | (11.6) | (53%) |
Rabobank aims not to be exposed to non-structural FX exposures; Currency Risk in the Banking Book is immaterial and Rabobank complies with the 2% Open Currency Position (OCP) de-minimis threshold. Rabobank also aims not to be exposed to Commodity (Price) Risk in its Banking Books.
Risk Profile Performance
In 2025, IRRBB positioning remained fairly stable. Movements are related to regular strategic Treasury positioning within risk appetite limits . Rabobank’s CSRBB profile has been growing due to an increase in high-quality debt securities holdings (overwhelmingly EUR AAA rated securities) to optimize the asset allocation within Rabobank’s liquidity buffer; the position has been managed within risk appetite. We expect this trend to continue in 2026.
The impact of exchange rate fluctuations on Rabobank's consolidated CET1 ratio remained within the established risk appetite parameters throughout 2025 and will be maintained within the bank's risk appetite.
Market Risk in the Trading Book
Market Risk in the Trading Book is the risk of changes in the value of the trading portfolio when market risks occur, resulting from price changes in the market.
The main risks that Rabobank is exposed to within the trading environment are interest rate risk (including basis risk), credit spread risk, commodity risk, and currency risk.
We aim for a modest exposure to market movements in our trading environment, with customer risk redistribution and dynamic management by hedging as part of our strategy. Market risk in the trading environment is monitored at least daily. The main risk indicators used to measure overall market risk in the trading book are:
Event Risk: based on loss estimates generated from extreme but plausible moves in risk factors by using sensitivity, hypothetical, and historical stress scenarios. For Rabobank, event risk in the trading environment is mostly driven by interest rates, cross currency and credit-related scenarios.
Value at Risk (VaR): based on a historical simulation that uses one year of historical data. Interest rate risk and credit spread risk are the main contributors to VaR.
Market Risk in the Trading Book
| Amounts in millions of euros | 2025 | |
|---|---|---|
| VAR (1 day, 97.5%) | Event Risk | |
| Average | 3.0 | 29 |
| Highest | 5.1 | 39 |
| Lowest | 1.9 | 21 |
Rabobank works with an extensive set of complementary parameters and controls to monitor market risk in the trading book.
The main risk indicator for the loan underwriting business is the stress limit, for which shocks are applied, that depends on credit risk scores, and the market categorization of the debt, to generate potential loss in case of very severe market price movements. The bank has a stringent loan underwriting and approval process for every deal, to account for potential market stress factors, current market conditions, and absolute exposure levels.
In 2025, Financial Markets were dominated by the US economic policy on trade tariffs targeting trade partners across the globe, raising concerns about the global economic outlook. The uncertainty contributed to increased market volatility in mainly global stock and bond markets and to a shift in investment flows from U.S. dollar-denominated assets towards European markets. This also affected U.S. Treasury bonds and led to a depreciation of the U.S. dollar against major currencies, including the euro. Further, yields on European sovereign bonds increased over concerns on fiscal policy changes and increased defense spending. Central banks continued to lower interest rates in 2025 in line with market expectations.
Rabobank's trading desk adapted well to market uncertainties. In general, the trading desks managed risks diligently given the increased volatility.
Loan underwriting market activity remained low due to the uncertainty surrounding trade tariffs with primary markets ceasing activity in April. Both primary and secondary markets gained momentum after the partial policy reversal and further tariff agreements and recovered to pre-disruption levels with robust issuance across both Investment Grade and Leveraged segments.
Looking ahead, we expect geopolitical tensions and uncertainty around trade restrictions to remain the main themes for the next year. These factors could further negatively impact domestic growth and increase inflation, leaving central banks with a limited scope for monetary policy adjustments. The current low-risk exposure strategically positions the bank to handle future uncertainties related to interest and credit risk factors. The risk profile is expected to remain well within the set risk appetite.
Non-financial Risk
The following chapter offers a more detailed overview of the risk profile for each primary risk Non-financial Risk type.
Operational Risk
Operational risk involves failures in how an organization operates. It is tied to internal breakdowns or external shocks that interrupt normal operations.
Operational risk is defined as the risk resulting from inadequate or failed internal processes, people and systems or external events, including, but not limited to, legal risk or information and communication technology (ICT) risk, but excluding strategic and reputational risk as they are an inevitable part of Rabobank's business activities. Rabobank manages these operational risks within the boundaries set by our risk appetite as appropriate to the complexity and size of our organization and proactively monitors the risks and takes action where needed. Managing operational risks is an integral part of the way we do business supported by risk and control activities.
Transformation Risk in the organization
The organization continued to pursue significant transformation initiatives in 2025 aimed at enhancing operational efficiency and customer experience. This transformation risk continues to pose challenges to people, processes, and IT, which was actively managed through robust project governance, frequent risk assessments, and close monitoring of change impacts.
Product Governance
Product governance remained a priority to safeguard customers and the organization from emerging risks. Our products must fit our customers' needs and align with Rabobank's sustainability vision. Regular product lifecycle reviews are performed to ensure adherence with regulatory requirements and internal standards, supporting responsible innovation and minimizing risk exposure.
Operational Resilience
Global cyber threats remained elevated in 2025, driven by persistent geopolitical tensions and vulnerabilities within supply chains. Emerging technologies, including the misuse of generative AI, introduced additional complexity to the risk landscape. Rabobank remains committed to safeguarding customer data, ensuring uninterrupted service availability, and maintaining trust. To achieve these objectives, Rabobank continues to leverage innovation to strengthen threat defences and enhance resilience in an increasingly complex digital environment.
Rabobank strengthened its operational resilience across four critical areas in 2025. Business Continuity Management (BCM) was reinforced through quality enhancement of Group wide Business Continuity Plans and integrated scenario analyses to address geopolitical and environmental challenges. Information Security was boosted by enhanced controls, proactive intelligence monitoring, and advanced technologies to counter increasingly sophisticated cyber threats and generative AI misuse. Information Technology improvements included institutionalizing a method for measurement and steering of the IT portfolio rationalization and standardizing processes, while maintaining agility to manage emerging risks from GenAI and quantum computing. Finally, Third-Party Risk Management increased focus on external supplier dependencies, concentration risks and the impact of geopolitical tensions on vendor availability.
Enhancements in our Data Management framework further strengthened our delivery of safe and available banking products to our customers, while safeguarding customer data.
Risk Profile Performance
Additional progress was made in managing operational risks during 2025. The overall profile remains elevated but stable for newly reported incidents. Remediation programs are in place to continue to lower the operational risk profile. The majority of Rabobank's operational risk losses in 2025 were related to Execution, Delivery and Process Management.
Compliance Risk
Compliance oversees the risk of impairment of Rabobank’s integrity. Safeguarding Rabobank’s integrity is essential to protect the rights and interests of our customers as well as the reputation and trustworthiness of Rabobank.
Rabobank is committed to comply with all applicable laws and regulations, and to uphold the spirit of the law. This principle is foundational to our operations and informs every aspect of our decision-making. Our robust Compliance Framework provides the structures and processes that enable effective management of compliance risks.
Financial Economic Crime
As a financial gatekeeper, Rabobank holds a pivotal responsibility in preventing, detecting, and reporting financial crime. We have strong controls against money laundering, terrorist financing, sanctions violations, and bribery. Through active participation in various industry forums, we engage with regulators to promote a risk-based, proportionate, and customer-focused implementation of all AML Regulations.
DNB Instruction and Remediation
Following the completion of the remediation of compliance deficiencies related to the Dutch Anti-Money Laundering and Anti-Terrorist Financing Act (‘Wet ter voorkoming van witwassen en financieren van terrorisme’), Rabobank has continued to embed and maintain robust, operationally effective controls within its day-to-day business processes. In consultation with public stakeholders such as DNB and the Ministry of Finance, we apply these measures proportionately to ease administrative burdens for our customers.
Sanctions
Rabobank adheres to all applicable sanctions regimes established by governmental authorities and international bodies, ensuring compliance across its services and operations. Stringent monitoring, risk assessments and robust internal controls are in place for ensuring compliance with sanction regulations and to ensure proper reporting to DNB and/or the Financial Intelligence Unit (FIU) and other local competent authorities. Rabobank monitors developments in conflict areas and implements new, applicable sanction packages, including additions to existing restrictive measures, as they are released. The sanctions landscape is expected to remain highly volatile and complex. Rabobank is in close contact with DNB and the Dutch Ministry of Finance regarding sanctions developments.
Fraud
Rabobank remains vigilant in addressing evolving fraud risks driven by technological innovation, geopolitical developments, and market uncertainty. Emerging technologies such as AI and deepfakes introduce new complexities, while upcoming regulations shape our approach. We strengthen fraud detection, enhance our risk and control framework, and promote awareness among employees and customers. Our team of experts ensure timely compliance and effective preventive measures. Collaboration is key to our strategy. We work together with other financial institutions and through Public-Private Partnerships to manage fraud risk and make a positive contribution to society.
Anti-Corruption and Anti-Bribery
Rabobank is committed to contributing to a sustainable society by operating with integrity and aligning with economic, social, and ecological responsibilities. Rabobank complies with all relevant anti-bribery and corruption laws and regulations and strives to enhance our anti-bribery and corruption framework. Rabobank prohibits any form of bribery or corruption where it has actual knowledge or reasonable grounds. Rabobank employees are encouraged to report suspicions of misconduct or irregularities, including criminal offences such as bribery and corruption, via the (whistleblowing) reporting channels in accordance with the Rabobank’s Global Policy on Whistleblowing.
Transaction Reporting
We are improving our transaction reporting framework to meet evolving global requirements. In 2025, we implemented changes related to Hong Kong Monetary Authority and Canadian derivatives reporting. We are supporting ESMA’s simplification efforts under the Markets in Financial Instruments Regulation (MiFIR), European Market Infrastructure Regulation (EMIR) and Securities Financing Transactions Regulation (SFTR) to reduce the reporting burden for both supervisors and market participants, as well as similar Financial Conduct Authority initiatives in the UK.
Data Privacy
Rabobank aims to protect personal data and safeguard privacy. In 2025, we updated our Global Privacy Policy Framework and Global Policy on Record Keeping, strengthening compliance and aligning with upcoming regulatory changes. This policy framework governs the responsible use of personal data in digitalization, including artificial intelligence, supporting our position as a data-driven bank. The Anti-Money Laundering Regulation (AMLR) will bring new mandatory requirements for processing personal data, and we are embedding Privacy by Design principles throughout the AMLR implementation. Rabobank continues to strengthen its data protection and privacy practices. In 2025, Rabobank implemented a new privacy management platform which serves as a foundation for more robust privacy implementation and oversight. Continuous monitoring of external developments, regular employee training, and maintaining technical and organizational measures ensure that we adapt to new risks and safeguard the trust placed in us by our customers and stakeholders.
Treating Clients Fairly
Treating Clients Fairly (TCF) is a priority for Rabobank. We focus on providing adequate advice, execution-only services, responsible lending, clear product information, preventing discrimination, ensuring accessibility, and learning from customer feedback. Sustainable products for our customers and ESG requirements form an integral part of our products and services to customers. The European Accessibility Act (EAA) was implemented on 28 June 2025. Additionally, to maintain access to responsible consumer credit for Dutch consumers, Rabobank partnered with ABN AMRO to integrate Alfam’s activities into Rabobank.
Furthermore, Rabobank is proactively compensating certain customers after not consistently adjusting interest rates on certain consumer credit products in line with the reference rate indicated by the Dutch Financial Services Complaints Tribunal (Kifid). The bank has issued letters to the remaining customers currently entitled to compensation. For customers who may become entitled in the future, activities will be integrated in standard business operations. A residual provision of EUR 3.5 million remains.
Greenwashing
In 2025, Rabobank focused on embedding the Global Greenwashing Standard into day-to-day practices and strengthening oversight to meet evolving regulatory expectations. Rabobank continued to embed strong governance and rigorous controls over external communications, reflecting its proactive commitment to transparency and stakeholder trust. Growing scrutiny from regulators and NGOs further validated the importance of these measures, reinforcing our determination to maintain adequate standards.
Rabobank remains focused on addressing regulatory divergence and evolving sustainability requirements across the diverse jurisdictions in which it operates, including various EU initiatives aimed at simplifying sustainability-related regulations.
Risk Profile Performance
Further progress was made in managing compliance-related risks during 2025. The overall compliance risk profile has improved with a positive outlook for 2026. Notable progress has been made in the remediation of highest risks. Risk step-downs for Sanctions Violation, Data Privacy, and External Fraud were achieved in 2025, additional remediation milestones are planned in 2026 to further reduce risk.
Model Risk
Model Risk is the risk of incorrect model design, improper implementation of a correct model, or inappropriate application of a correct model.
Models are now embedded in Rabobank’s DNA, powering processes, products, and services to deliver customer-centric solutions and enable data-driven decisions. In an ever-changing environment, models are not just tools, they are strategic assets that help us stay relevant and ahead of the game.
With opportunity comes responsibility. Managing model risk is critical for sound decision-making, financial stability, and regulatory compliance. Our comprehensive Model Risk Management framework spans the full lifecycle, from initiation and development to independent validation and governance, ensuring models are reliable androbust, and are used responsibly.
We continue to invest significantly in:
Strengthening controls and mitigating risks while simplifying
Advancing regulatory compliance
Steering model strategy to enable sustainable innovation
2025 Highlights
On the credit models, significant progress was made on the Return to Compliance (RtC) program, along with the overall regulatory obligations. Key milestones included the go-live of IPRE and the completion of onsite IMIs for the Residential Mortgages, Retail SME and Rural rating systems. Following receipt of the final decision letter, the go-live of the Residential Mortgages rating system is planned for Q1 2026. Pending receipt of final decision letters, go-live for the Retail SME and Rural rating systems is planned for 2026. The IFRS9 Corporate model went live, while the implementation of other IFRS9 models is ongoing. The Residential Mortgages Early Warning Signal (EWS) model went live in Q1 2025. New EWS models have been developed for Rural and for the smaller segment within the Corporate portfolio, and the Residential Mortgages EWS model has been enhanced to broaden its scope of application. All three of these models are planned to go live in 2026.
On compliance models, the models within the remediation RNL scope along with most other compliance models were validated enabling the closure of the FEC Remediation program.
AI Risk
In 2025, the CRO domain laid the foundation for robust AI risk management by updating policies, in alignment with EU AI Act requirements, establishing solid AI risk governance. Over the next three years, the focus will be on embedding integrated AI risk management into the bank’s DNA. Key milestones include integrating AI as a cross-enterprise risk driver and implementing shared tooling for risk oversight. The roadmap also emphasizes strong cross-domain collaboration, consistent practices across business lines, and strategic funding to support the full AI lifecycle. Integral and integrated AI risk management will ensure responsible AI innovation and sustained regulatory compliance across the organization.
Sustainability

Interview with our Chief Sustainability Officer

Before we deep dive into the turbulent year of 2025, from your vantage point as Rabobank’s Chief Sustainability Officer, what are you most proud of?
“As a cooperative bank, we believe sustainable living and working should be affordable, available and accessible. We aim to play our part in achieving this. For us, this means we pursue our three sustainability aspirations: act on climate, value nature, and enable people to future proof their activities, homes, and businesses. From an organizational perspective, our focus is on ensuring that these aspirations are taken into account in our business decisions. That’s why I am proud that over the past year, we’ve matured in how we balance risk, return, and sustainability. It will keep evolving and it’s never truly ‘finished’, but sustainability is now part of our strategic and commercial considerations and decisions – especially on climate. Leveraging financed emissions as a progress indicator has been instrumental in the progress we made.”
“We made progress across all three aspirations. On Nature, we have a sharper view of material topics – land-use, water, and pollution – across the regions and sectors where we cooperate across bank functions such as risk, data analytics, and relationship managers. We also advanced our nature‑metric development. Metrics are vital to assess nature‑related impacts and risks – ours and our customers’ – and build resilience from there. Our progress on the Brazil land‑use strategy deserves highlighting. It is a regional strategy to complement our global deforestation and land-use policy. The strategy focuses on land-use change risks, strengthens monitoring, and accelerates product development.
It’s a good example of linking ambition to real-economy action and portfolio management. And I want to mention our new five-year partnership with WWF, which is shaped around redirecting financial flows to protect nature from further deforestation and negative land conversion.”
“On People, we launched a bank-wide vision that clarifies how we consider human rights in each of our roles: as employer, as procurer, and as financial services provider. And we performed a group-wide saliency assessment, to identify where human rights could potentially be most at risk in our role as a financial services provider. In this stage our focus will be on addressing human rights risks in the context of labor exploitation, livelihood and lands and social inclusion.”
“There is much more, and I can’t mention everything, but I am really proud of our sustainability community. It’s an employee community that organizes sustainability focused webinars, workshops, film screenings to inspire and activate. With over 7,500 members, it’s the largest community in the bank.
To me that indicates the high level of interest in the topic of sustainability
and the motivation to keep driving it.”
What shifts did you observe in the external landscape over the past year?
“In 2025, we have seen both the frequency and severity of extreme weather events increase. Skepticism around the feasibility of limiting global warming to 1.5°C is growing. Geopolitical instability is increasingly putting human rights at risk. In addition, it’s quite obvious that the international landscape has reached new levels of complexity. In the US, we are witnessing significant changes in the context in which we operate, including regulatory changes. In the EU, sustainability-related regulations have been revised, with reduced ambition levels. And especially in the climate area, we see international commitments wavering. The Net-Zero Banking Alliance (NZBA) ceasing its operations in October of last year, is the most prominent example. It is important in this situation that we keep navigating with the right compass toward the future and continue delivering on our sustainability aspirations.”
“On the other hand, disclosure requirements such as the CSRD remain in place. Nature related disclosure requirements are developing, and commitments to the OECD Guidelines for Multinational Enterprises on Responsible Business Conduct and UN Principles for Responsible Banking have not changed. Supervisory expectations and requirements, for example on addressing the risks associated with climate change, are evolving. Additionally, it is my experience and expectation that when governments and international commitments step back, other stakeholders step up. NGOs obviously will not walk away from their societal role. And innovation, science and finance, will redirect their efforts towards areas that offer potential and opportunity. Areas like the energy transition and adaptation to climate change impact. We believe that sustainability is a driver of competitiveness: customers that adapt will be stronger, and we must be ready to help them. We feel supported in our thinking by the fact that sustainable finance as well financing of renewable energy is increasing."
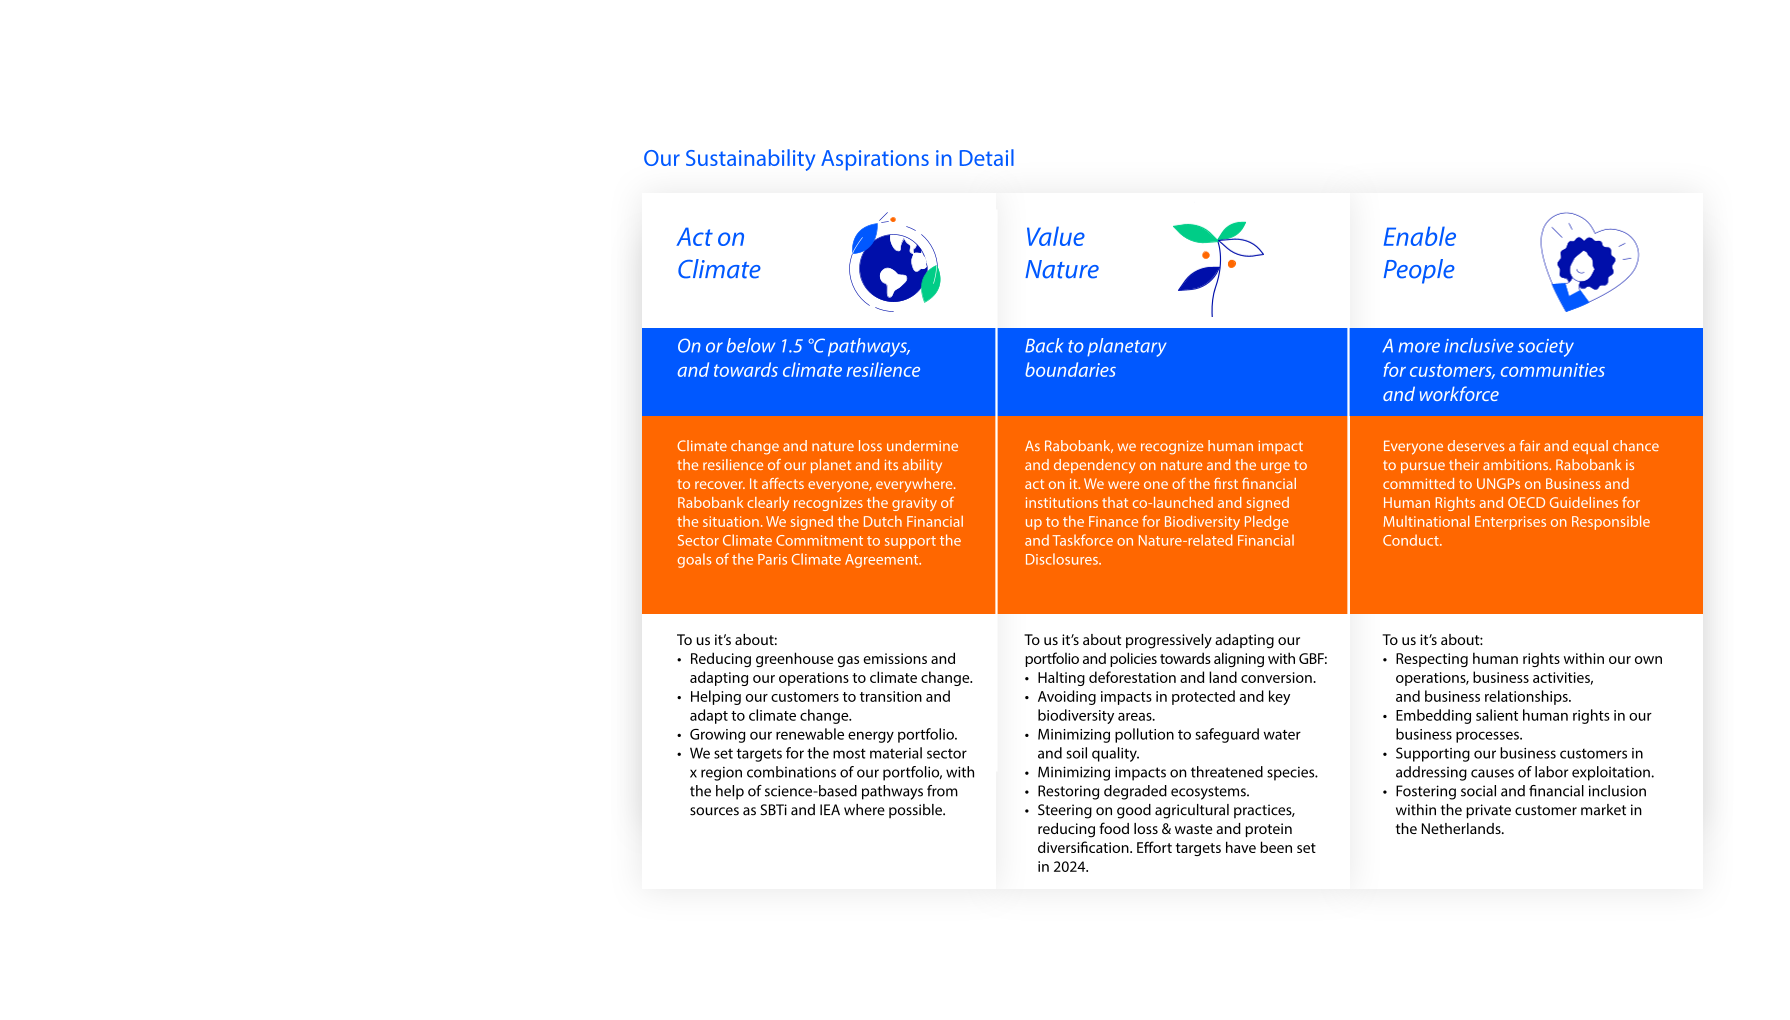
“It is important in this situation that we keep navigating with the right compass toward the future and continue delivering on our sustainability aspirations.”
How does this context influence Rabobank’s strategy – what stays the same, and what evolves?
“What stays the same is who we are. We are a bank that is expected to be a stable factor in the Dutch economy and international food and agricultural sectors. What is more, we are a cooperative. We don’t have shareholders; we have members and client councils – more than 2.3 million customers are member. By listening closely, we try and use our knowledge, network, and financial solutions to support their goals and advance our sustainability ambitions. So, we allocate funds through cooperative initiatives and our cooperative dividend that help address societal changes."
"From a sustainability perspective, our north star is unchanged: we act on climate, value nature, and enable people. We have voiced this on numerous occasions over the course of 2025. We will continue to be clear about what we will – and won’t – finance. And we’ll keep aiming for real‑economy impact through our products and services: better terms for front‑runners, sustainable investments, and blended‑finance solutions that help make financed activities future‑ready and more competitive.”
“We can’t deny though, that in a world of shifting politics and rising skepticism, we need to reposition sustainability. Sustainability is not just about compliance, it is about competitiveness. Acting on sustainability builds our customers and our bank’s resilience and determines our ability for future growth. Regarding the unfolding, 1.5-degree global warming debate; as a sailor, I see our ambitions as a lodestar, a constant beacon that gives you direction. We aren't thinking of changing or lowering our ambitions – after all, an overshoot was always projected – but the winds are shifting and we are preparing for higher levels of global warming. We’ll need to redistribute our actions and efforts among mitigation and adaptation. Done right, that’s a win-win – customers improve long‑term resilience and we improve risk profiles and, over time, portfolio composition. That way, our sustainability ambitions serve as that star on the horizon guiding us closer to where we need to be."
What’s in store for 2026? What steps do we still have to take?
“What hasn’t changed is the science: climate change and nature loss are still happening and impacts are being felt more clearly all the time: droughts, floods and supply‑chain disruptions will keep affecting activities and businesses – from coffee producers in Brazil to farmers in Australia – and that reality ultimately flows through to banks' results as well. As a result, I expect that financing adaptation and resilience will move from niche to core banking, and we will lean into that shift with solutions that strengthen customers’ business models.”
“Within this context, I think the sustainability space benefits from to motivational targets that guide transformation and support growth. Adapting to climate- and nature-related risks can lead to opportunities. Nature based solutions alongside new technologies, smarter infrastructure, value-chain innovations, and increased attention for human rights, can lift productivity and reduce risks and losses. Our role is to support this.”
“We will need to continue explaining our role. To be clearer about what we can and cannot do. Policy-based acceptance and risk criteria sit within our sphere of influence. At the same time, financing a customer does not mean that a customer is already 100% future proof; most will still need to transition to some extent. We can support with the right products and propositions, but we cannot force adoption – customers decide, and our job is to support them to navigate their challenges and opportunities and make informed decisions.“
“Acknowledging that our influence is, in a way limited, is sometimes at odds with our sustainability ambitions. So monitoring is essential. We will need to continue, improve and expand how we monitor impacts, through financed emissions and – the still evolving – nature metrics and people indicators. Internally, we will continue to equip colleagues to move from compliance to competitiveness – in day-to-day operations and in customer engagement – so that sustainability informs decisions on capital allocation, portfolio composition and risk appetite, and is part of our ongoing dialogue with our customers.”
“In sum, I am proud of what we’ve achieved, but humble about what remains. The road ahead demands realism and momentum, and above all cooperation. We won’t please everyone on pace, but – as a cooperative bank – we want to do this together – with customers, peers, civil society and policymakers – and we will play our role in accelerating the transition.”
“The road ahead demands realism and momentum, and above all cooperation.”
Sustainability Statements

General Information

Disclosure Requirement (DR)
| Topical standard | Section | ||
|---|---|---|---|
| Basis for preparation | |||
| BP-1 | General basis for preparation of Sustainability Statements | General basis for preparation of sustainability statements | |
| BP-2 | Disclosures in relation to specific circumstances | Disclosures in relation to specific circumstances and Appendix 1: Methodology & definitions sustainability statements | |
| Governance | |||
| GOV-1 | The role of the administrative, management and supervisory bodies | The role of the Managing Board and Supervisory Board | |
| GOV-2 | Information provided to and sustainability matters addressed by the undertaking’s administrative, management and supervisory bodies | Information provided to and sustainability matters addressed by Rabobank's Managing Board and Supervisory Board | |
| GOV-3 | Integration of sustainability-related performance in incentive schemes | Integration of sustainability-related performance in incentive schemes | |
| GOV-4 | Statement on due diligence | Appendix 1: Methodology & definitions sustainability statements | |
| GOV-5 | Risk management and internal controls over sustainability reporting | Risk management and internal controls over sustainability reporting | |
| Strategy | |||
| SBM-1 | Strategy, business model and value chain | Sustainability embedded in our strategy | |
| SBM-2 | Interests and views of stakeholders | Interests and views of stakeholders | |
| SBM-3 | Material impacts, risks and opportunities and their interaction with strategy and business model | Material impacts, risks and opportunities and their interaction with our strategy and business model | |
| Impact, Risk and Opportunity Management | |||
| IRO-1 | Description of the process to identify and assess material impacts, risks and opportunities | Description of our processes to identify and assess material impacts, risks and opportunities | |
| IRO-2 | Disclosure requirements in ESRS covered by the undertaking’s sustainability statement | Disclosure requirements in ESRS covered by our sustainability statements | |
Basis for Preparation
This section highlights how Rabobank’s Sustainability Statements have been prepared in line with the principles of the ESRS.
General Basis for Preparation of Sustainability Statements
Rabobank's Consolidated Sustainability Statements (hereafter Sustainability Statements) have been prepared in accordance with European Sustainability Reporting Standards (ESRS) as adopted by the European Union (EU). The Sustainability Statements have been prepared on the basis of the policies set out in this section.
Rabobank's Sustainability Statements include the sustainability information of Coöperatieve Rabobank U.A. and its consolidated subsidiaries. The scope of consolidation of the Sustainability Statements is the same as for the Consolidated Financial Statements as included in Note 2.2 to Rabobank's Consolidated Financial Statements, unless otherwise indicated.
The information provided in Rabobank’s Sustainability Statements includes information on the material impacts, risks and opportunities in connection with Rabobank’s own operations, and direct and indirect business relationships in the upstream and/or downstream value chain. Rabobank’s material impacts, risks and opportunities are assessed following the double materiality principle. For more information on the double materiality assessment, see the Description of Our Processes to Identify and Assess Material Impacts, Risks and Opportunities. In preparing these Sustainability Statements, management has exercised its judgement in making estimates and assumptions concerning the future. Actual results may differ from those estimates and assumptions.
Disclosures regarding policies, actions, targets, and metrics concerning our own operations, and our upstream and downstream value chain are presented in the appropriate sections of the Sustainability Statements.
Sustainability is an on-going practice that responds to and may trigger changes in the company’s strategy, business model, due diligence, activities, business relationships, operating, sourcing, and selling practices that could be relevant for stakeholders. The Sustainability Statements may therefore not include every impact, risk and opportunity or additional entity-specific disclosure that individual stakeholders may consider important in their own assessments.
Disclosures in Relation to Specific Circumstances
Estimation and outcome uncertainty
In the metrics disclosed in Rabobank's Sustainability Statements, we use estimates, and assumptions. The metrics disclosed as part of ESRS E1-6 climate change contains downstream value chain data. The information on the value chain estimation applied, and sources of estimation and outcome uncertainty, are presented in Appendix 6: Methodology Financed Emissions. The main estimation and outcome uncertainty can be summarized as follow:
The majority of our customers emissions are related to Food & Agri sectors, where emissions data and science-based decarbonization pathways are scarce. More than half of these emissions are non-CO₂ emissions, which are impossible to fully abate; there will always be residual emissions from for example livestock activities. The implication is that non-CO₂ emissions will not be net-zero in 2050.
Our absolute emissions target is sensitive to balance sheet fluctuations and therefore does not provide a completely accurate picture of our customers’ GHG reduction performance. The emissions intensity targets we have set for sector x region combinations on the other hand, do not say anything about the total amount of GHG gasses being emitted. The implication is that despite progress on the intensity-based targets our absolute emissions could still increase.
Among the main challenges Rabobank and other banks face is the lack of customer-reported GHG emissions data. Therefore, we have to use proxy indicators (see bullet below) to estimate the majority of client emissions. Over time methodologies will improve, more data will become available and bottom-up (company specific) numbers will replace top-down (sector) estimates. This means that data may need to be restated in future and comparisons over time will be difficult until methodologies and regulations are more settled.
In Rabobank we use the PCAF standard for accounting and disclosing financed emissions. The availability, specificity and accuracy of the data we use to make these calculations varies widely per sector. Therefore, the financed emissions overview presented in this report should be interpreted as our "estimates on a best effort basis", in accordance with PCAF methodology, using the current information and data we have at hand. Where possible, we have used client-reported GHG emissions. The average data quality score of our in scope portfolio for scope 1 and 2 is 3.6. The average data quality score of our in scope portfolio for scope 3 is 3.8.
For the gender pay gap calculation as part of ESRS S1-16, we use an estimated variable pay. Further information is presented in the own workforce section of the Appendix 1: Methodology & Definitions Sustainability Statements.
Changes in preparation or presentation of sustainability information
Rabobank’s Sustainability Statements present comparative information, when available or when already disclosed in the prior year. In the reporting period FY2025, Rabobank updated the methodology used to calculate the gender pay gap by refining the estimate of variable pay. The gender pay gap is calculated as the difference between the average gross hourly pay of male and female employees, expressed as a percentage of the average gross hourly pay of male employees, in line with ESRS S1-16.
The change was implemented to improve the accuracy of the disclosure with new information. This change is in line with with ESRS 1 requirements and enhances the comparability and transparency of the disclosed metric. As a result of this change, the gender pay gap reported for FY2024 and FY2023, is not fully comparable with figures reported for prior periods. Prior-period figures have been restated using the updated methodology to ensure comparability. The restated prior-period figures are presented in the ESRS S1 Own workforce metrics section of the Sustainability Statements. Rabobank applies the updated methodology consistently across reporting periods going forward.
No other substantial changes nor material errors occurred compared to the previous reporting period.
Incorporation by reference
Rabobank incorporates information by reference to the Sustainability Statements for the following other sections (for ESRS relevant disclosures requirements) of Rabobank's Annual Report:
| ESRS disclosure requirements | Incorporation by reference |
|---|---|
| ESRS 2 GOV-1 - The role of the administrative, management and supervisory bodies ESRS 2 GOV-3 - Integration of sustainability-related performance in incentive schemes | Corporate Governance |
| ESRS 2 SBM-1 - Strategy, business model and value chain | Strategy |
| ESRS 2 SBM-3 - Material impacts, risks and opportunities and their interaction with strategy and business model | Strategy Risk Management |
| Methodology and definitions for the general disclosures (ESRS 2) and topical disclosures (ESRS E1, E2, E3, E4, S1, S2, S3, S4, and G1) | Appendix 1: Methodology & Definitions Sustainability Statements |
| ESRS E1-3 - Actions and resources in relation to climate change policies | Appendix 2: Sector x Region Analyses |
| EU Taxonomy Regulation as referenced from ESRS E1 - Climate change | Appendix 3: EU Taxonomy Tables |
| ESRS 2 Appendix B - List of datapoints in cross-cutting and topical standards that derive from other EU legislation | Appendix 5: Datapoints that derive from other EU legislation |
| ESRS E1-6 - Gross scopes 1, 2, 3 and total GHG emissions, specific for the emissions from our customers (scope 3 category 13 and 15) | Appendix 6: Methodology Financed Emissions |
| ESRS E1-4 - Targets related to climate change mitigation and adaptation | Appendix 7: Climate Target Setting |
Time horizons, transitional provisions, and data collection
In general, we assess material impacts, risks and opportunities over the short, medium and long term. Since sustainability-related matters often materialize over time, the nature of these topics warrants more forward-looking reporting. For forward-looking information on Rabobank’s material impacts, risks and opportunities in the Sustainability Statements, we consistently apply the definitions provided by ESRS:
1 year as short term;
Between 1 year and 5 years as medium term; and
More than 5 years as long term
Where our time horizons deviate from these general guiding principles, this is disclosed when reporting on the specific topic or risk tool used.
Disclosures in relation to incorporation by reference, transitional provisions and use of phase-in provisions in accordance with Appendix C of ESRS 1, and data collection of sustainability information are presented in Appendix 1: Methodology & Definitions Sustainability Statements.
Governance
The following section explains in more detail how Rabobank has set out its governance processes to overlook and manage its sustainability activities.
The Role of the Managing Board and Supervisory Board
Rabobank's sustainability governance consists of the Supervisory Board, Managing Board, Sustainability Implementation Management Team and Risk Management Committee Group. Internal rules are available for each body and committee which provide the mandate, responsibilities, scope, hierarchical relationships, membership, authority levels, and modalities of these bodies and committees. The management and supervisory bodies, as referred to under the ESRS, are Rabobank's Managing Board and Supervisory Board.
For the general Corporate Governance, composition and diversity of the Managing Board and Supervisory Board, please refer to the members of the Managing and Supervisory Board section of the Corporate Governance of Rabobank's Annual Report and our section metrics and targets of our own workforce in these Sustainability Statements.
Supervisory Board
The Supervisory Board (SB) is responsible for supervising and advising the Managing Board (MB) on all relevant business matters, including sustainability. This encompasses the responsibility of supervising and advising the MB on (the implementation of) the sustainability strategy, ensuring new developments align with Rabobank's strategy and purpose. Additionally, the SB oversees the MB's stakeholder engagement. Sustainability topics are also discussed and prepared in SB committees (e.g., the Cooperative and Sustainability Committee).
Managing Board
The MB is responsible for setting and implementing the bank’s corporate strategy, including business, risk and sustainability strategies. The MB is responsible for adequately embedding sustainability impacts, risks, opportunities and dependencies within the corporate strategy, setting the risk management framework and overseeing its implementation. The MB is responsible for the implementation of the laws, regulations and commitments necessary to comply with sustainability regulations, expectations and aspirations.
The MB meets in principle on a weekly basis. The MB is assisted by the Company Secretary, who ensures that proper procedures are followed and that the obligations under relevant legislation and the Articles of Association are complied with. Together with the Company Secretary, and based on input from the Chief Sustainability Officer (CSO), the Chair sets a rolling agenda on matters (including sustainability) to discuss during the MB meetings. This rolling agenda is group-wide, with allocated MB and topic owners and includes sustainability reporting, the double materiality assessment (DMA) and other material sustainability topics as recurring agenda items.
Sustainability Implementation Management Team
The Sustainability Implementation Management Team (IMT) consists of the Sustainability leads from key domains and departments and is chaired by the CSO. The CSO reports to the Chair of the MB. The IMT reports and is accountable to the MB and ensures the implementation of Rabobank's sustainability vision, ambitions, strategy, roadmap, regulations and commitments across Rabobank Group. It also provides advice to the MB on decision-making regarding sustainability strategy and ambitions. Responsibilities of the IMT include guidance of and alignment of the sustainability activities within Rabobank. The approval of policies is not within the scope of the IMT. Sustainability policies are discussed and aligned in the IMT but follow the regular approval processes via RMC Group and MB. The IMT provides advice to the RMC Group on the approval of these policies.
Risk Management Committee Group
The Risk Management Committee Group (RMC Group) is mandated by the MB to establish and maintain the risk management framework, including risk management policies and risk limits, oversee the implementation of the risk management framework, assess the management of risks and act as the guardian of the risks taken by Rabobank Group. The RMC Group is chaired by the Chief Risk Officer (CRO) and includes MB members and members of senior management of relevant domains. The RMC Group is entrusted with the oversight of the bank’s Risk Appetite Statement (RAS). As part of its oversight, the RMC Group receives updates on Rabobank's risk management approach to ESG, including the bank's approach to stress testing and its integration into existing risk management processes.
Business Units
Business unit management teams, under the oversight of the MB, are primarily responsible for implementing and further detailing the strategy within their business unit, including relevant sustainability and risk aspects, and provide advice and proposals on the strategic considerations involved. Their sector & region plans incorporate these elements in alignment with group policies and guidance.
The business domain members of the MB are primarily responsible for managing sustainability impact, risk, opportunities and dependencies in their respective domains as part of their role in managing overall customer and business performance.
Information Provided to and Sustainability Matters Addressed by Rabobank's Managing Board and Supervisory Board
Supervisory Board members gain knowledge and expertise with regard to sustainability topics via several permanent education sessions. During 2025, 3 out of 7 permanent education sessions were focused on sustainability. Managing Board members regularly attend these permanent education sessions. The topics discussed align largely with the impacts, risks and opportunities that result from the double materiality assessment and topics deemed important by internal and external stakeholders. Furthermore, the MB members have direct access to relevant sustainability expertise within their domains, and they are informed and consulted on the most relevant sustainability topics through the IMT and RMC.
Integration of Sustainability-related Performance in Incentive Schemes
The remuneration of the Managing Board and Supervisory Board is limited to fixed pay; members are not eligible for variable compensation as part of their regular remuneration package. More information is available in the Remuneration section in the Annual Report.
Statement on Due Diligence
Rabobank's Statement on Due Diligence is presented in Appendix 1: Methodology & Definitions Sustainability Statements.
Risk Management and Internal Controls over Sustainability Reporting
When preparing information for the Sustainability Statements, data quality reviews are performed, plausibility checks are executed and where possible alignment with external data is ensured. The Sustainability Statements are submitted to internal experts for review and are approved by senior management (including the Managing Board, the Audit Committee of the Supervisory Board and the full Supervisory Board) prior to publication. This to mitigate the risks of material misstatement. In addition, information is provided to our external auditor enabling them to perform their limited assurance engagement. Since sustainability reporting is still developing, we are also still developing and improving our risk management and internal control procedures with regard to the Sustainability Statements.
Strategy
The following section explains in more detail how Rabobank’s approach to sustainability aligns with its mission to ‘Grow a better world together’ and how sustainability is embedded in Rabobank’s overall group strategy.
As described in our overall group strategy, it is Rabobank’s mission to Grow a better world together. Our group strategy cascades from our mission to our ambition to our four drivers (Excellent Customer Focus, Meaningful Cooperative, Rock-Solid Bank, Empowered Employees), values and strategic priorities. In the Strategy section, we explain our group strategy in more detail.
Essentially, our sustainability aspirations (elaborated on in the Sustainability section) define our long‑term sustainability ambitions, while the material topics resulting from the double materiality assessment (elaborated on in the Outcome Double Materiality Assessment) anchor these ambitions in the most relevant impacts, risks and opportunities across our value chain. To help realize our aspirations and concurrently address material topics, we apply a generic approach to all three of our sustainability aspirations (act on climate, value nature, enable people).
Policy development to provide our strategy with guardrails
Acceptance requirements are requirements an in scope customer or business partner must meet to be able to (continue to) receive financing from or do business with Rabobank. The acceptance requirements are set at customer and business partner-level or at ‘activity’ level. Acceptance criteria are described in each of the individual topics and are summarized in Rabobank’s lists of non-accepted customers and non-accepted activities, which can be found at the end of our sustainability policies briefing document.
Identifying climate and nature sectors to prioritize strategy execution
Based on the identify and assess-step of our approach and the outcomes of the double materiality assessment, we prioritize sector x region combinations (19 for climate, 12 for nature) and develop plans for each. These are specific plans with which we aim to achieve climate and other targets and manage the relevant sustainability impacts, risks and opportunities. The levers (help customers transition, help move the system, optimize our portfolio for sustainability) are used to classify the types of actions in the plans.
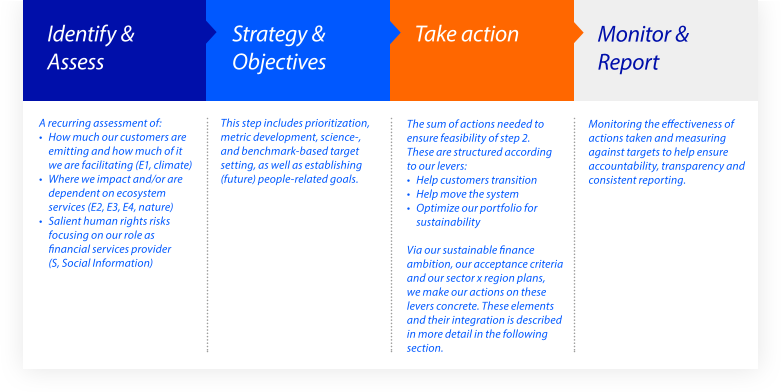
Sustainability is embedded in Rabobank’s strategic steering cycle
Sustainability (including each of the above elements, our sustainable finance ambition, acceptance requirements and transition plans) is integrated into how we steer the bank. We balance risk, return and sustainability impact and use a six‑step strategic steering cycle to connect our ambitions and material topics to planning and portfolio steering across Rabobank.
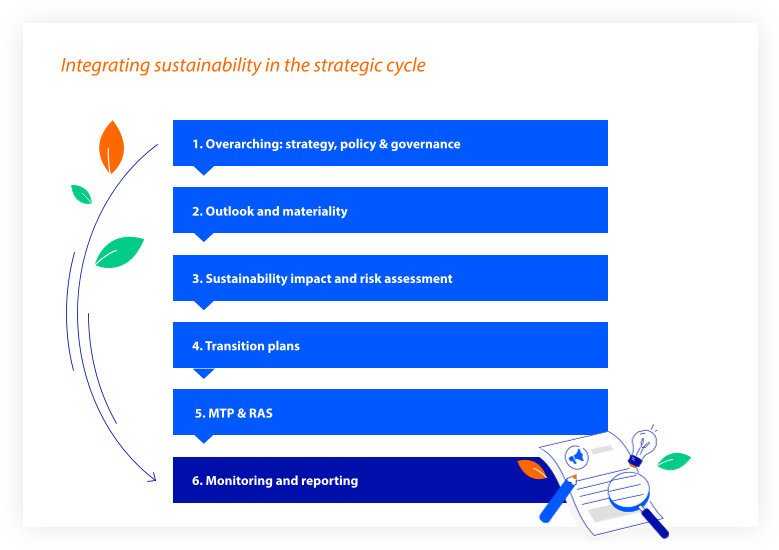
1. Overarching: strategy, policy & governance
Our mission and sustainability ambitions are embedded in our decision‑making. Theme and sector policies set requirements for in scope customer and business partners on climate, nature and people topics. Our governance model assigns clear roles and responsibilities to ensure consistent execution and oversight.
2. Outlook and materiality
Each year we assess key external developments and perform a double materiality assessment to determine which impacts, risks and opportunities are most relevant to our business model and value chain. These insights inform prioritization and are disclosed in the ESRS topical standards of these Sustainability Statements.
3. Sustainability impact and risk assessment
We assess climate, nature and people‑related impacts, risks and opportunities across customers and portfolios and use these insights to inform customer engagement, underwriting and risk management. Customer‑level sustainability acceptance, performance and ESG‑risk insights are applied consistently in the customer journey and aggregated to support underwriting decisions, pricing and risk appetite limits, and portfolio steering.
Our heatmaps and scenario analyses program helps us understand how climate‑ and nature‑related developments may affect customers and portfolios over time. These insights inform actions across the bank and are also reflected in IFRS 9 through climate‑environmental adjustments (via a Risk Adjustment Factor and management adjustments). This approach ensures that our expected credit loss estimates incorporate the forward‑looking effects we observe. ESG risk scores and climate‑nature data support day‑to‑day credit decisions and customer dialogue.
4. Transition plans
Our sector x region plans outline how sectors can transition in line with sustainability ambitions and changing external conditions. These plans help determine portfolio priorities, shape customer dialogues and identify transition levers at the sector and regional level. Transition plans are updated as new insights emerge and support a consistent forward‑looking view across the bank.
5. Medium‑Term Plan (MTP) & Risk Appetite Statement (RAS)
We integrate sustainability into strategic steering through KPIs, portfolio targets and risk‑appetite limits. In the MTP, sustainability KPIs, sustainable‑asset targets and portfolio‑wide metrics (e.g., financed emissions) steer portfolio composition and the balance between risk, return and sustainability impact. In the RAS, sustainability‑related risk indicators and limits link strategic objectives to clear guardrails for acceptable risk and desired portfolio direction.
6. Monitoring and reporting
We monitor sustainability performance at the customer, portfolio and bank level to stay in control of developments and to support informed decision‑making. At the customer level, we use structured sustainability assessments to identify changes in sustainability performance and to determine where additional engagement may be needed. At the portfolio level, we track indicators such as sustainable finance volumes, financed emissions, the distribution of energy‑label data and developments in climate‑ and nature‑related risk exposures. This monitoring helps us understand how our portfolio is progressing, where risks may emerge and where targeted actions can support our sustainability ambitions. We report on our sustainability progress through this Annual Report, and other external disclosures.
Sustainable Finance as a Means to Deliver on our Strategy
With the scale of capital required for the energy and food systems transitions, Rabobank sees a strategic opportunity and a need to mobilize larger volumes of sustainable finance. Our sustainable finance product offerings help us manage our portfolio and intend to support our customers in their transition. In recognition of its strategic importance, sustainable finance is being integrated in our medium‑term planning process, balance sheet management, and our broader risk, return and sustainability decision framework.
An ambition level1 has been set at EUR 83 billion in 2030 for sustainable assets (2025: EUR 63,9 billion; 2024: EUR 48,5 billion)2. In addition, Rabobank raises sustainable funding - such as Green Bonds and Green Residential Mortgage Backed Securities (RMBS) - to further support the bank's sustainability aspirations. We report yearly on the exposures we classify as sustainable assets, and sustainable funding, along with the rationale behind the exposure reported. Rabobank reports the outstanding sustainable finance exposure (i.e. drawn amounts).
Sustainable Finance
| Amounts in millions of euros | YE2025 | YE2024 |
| Project Finance | 7,387 | 6,439 |
| RVO Green Loans | 2,761 | 2,870 |
| Sustainable Morgages Rabobank / Obvion | 43,126 | 30,400 |
| Sustainability-linked Loans | 4,654 | 3,902 |
| LMA Green Loans | 1,899 | 1,027 |
| DLL Sustainable assets | 4,030 | 3,815 |
| Total | 63,857 | 48,453 |
Sustainable Funding
| Amounts in millions of euros | YE2025 | YE2024 |
| Rabobank Green, Social and Sustainability Bonds and Deposits | 7,097 | 8,088 |
| Obvion Green, Social and Sustainability Bonds | 2,500 | 2,000 |
| Rabo Green Savings | 3,426 | 3,325 |
| DLL Sustainable Funding | 569 | 701 |
| Total | 13,592 | 14,114 |
As can be noted in the overview above, Rabobank's sustainable finance includes project finance for renewable energy, green loans that align with the LMA Green Loan Principles or the RVO Green Projects Scheme (Groenregeling), mortgages aligned with the EU Taxonomy substantial contribution criteria and Sustainability‑Linked Loans aligned with the LMA Sustainability-linked Loan Principles. Sustainable funding covers Rabobank green bonds and green money market instruments, Obvion green Residential Mortgage-Backed Securities and Rabo Groen Bank B.V. Green Savings. The detailed methodology of what we consider sustainable finance can be found in the Methodology & Definitions Sustainability Statements-section.
- Our sustainable finance ambition is best effort and dependent on among others data availability, sustainable asset availability and market- and regulatory developments.
- The ambition level has been adjusted upward from EUR 75 billion to EUR 83 billion to reflect the fact that DLL Sustainable Finance is now included in the scope of the reported sustainable finance figures.
Interests and Views of Stakeholders
The interaction with our stakeholders serves as both input and output for our business model. We distinguish direct stakeholders (customers, members, investors and employees) and indirect stakeholders (NGOs, public service bodies, communities, governing and supervisory bodies, other banks, the media and regulators).
Stakeholder Engagement
We aim to engage in strategic, constructive, and proactive dialogues with our stakeholders. As a bank of systemic importance, we engage with many stakeholders, who are important to us. For example, based on our communication with members, we develop and enhance our products and services, while ensuring compliance with laws and regulations.
Among the ways we engage with stakeholders is the method of appreciative inquiry dialogue. This method is applied to highlight and inquire economic, ecological, and societal issues from different perspectives. We leverage structured dialogues for multiple purposes: to achieve a common local, regional, and/or national approach; to explore themes that are important to our members, customers and other stakeholders/society as a whole; and to translate the outcomes - where possible - into input for our strategy, further exploring insights per theme, creating connections within chains and/or regions and engaging in dialogues with employees.
In addition, we engage with environmental and/or social welfare organizations on numerous topics, with a variety of stakeholders through several member/client councils, customer feedback platforms, customer and employee surveys, and through participation in initiatives that are being launched in the sectors in which we are involved. Our Managing Board members meet with customers, members, employees, politicians, NGOs and other stakeholders to discuss our strategic progress, receive their feedback on our contribution to society and discuss developments in the financial sector, both generally and specifically in relation to Rabobank.
Creating value for stakeholders
As a result of our activities, we have direct and indirect impact with possible favorable and/or unfavorable outcomes for one or more of our stakeholders.
Customers
We engage actively with our customers and create positive satisfaction through services such as financing and everyday banking and by sharing our knowledge through our research publications, our networks, our innovations and (digital) products. Our customers and other parties in the Food & Agri (F&A) value chain have a positive impact on the availability of food. However, F&A activities can also have a negative impact on the environment (by way of nitrogen and carbon emissions). We encourage our customers to reduce this negative impact as much as possible and to contribute to creating a regenerative ecosystem. We support them in these efforts e.g., by providing access to funding, sustainability-linked and green loans.
Members
Member involvement is crucial for us as a cooperative bank. By providing feedback, our members motivate us to execute our strategy and support us in the challenges we encounter along the way. We offer our members forums through which they can advise us on multiple topics, as well as vote on the designation of our cooperative dividend. Our members also influence our strategy through the General Members' Council. We monitor value creation for our members through the member engagement score.
Employees
We want to provide our employees with a great working environment and give them the opportunity to excel. With this in mind, our employees receive a wide range of training and development opportunities, with which we aim to create higher job satisfaction and employee engagement in the long term. The reason we attach so much importance to employee engagement is that we are convinced that there is a strong link between employee well-being and customer satisfaction: happy people create happy customers. Increasing diversity, equity and inclusion in our workforce helps improve our decision-making and ethical perspective. Furthermore, we believe it improves our services to customers. Ensuring that Rabobank remains a future-fit and agile organization also means that we need to keep attracting and retaining talent. At the same time, we will not be able to provide employment for all our current employees in the future. We try to minimize redundancies as much as possible by, for example, repositioning employees through internal secondments, re-skilling, and upskilling. It is important to us that employees who leave Rabobank, quickly succeed in finding employment elsewhere or are able to start a business. This is something we aim to facilitate through support.
Society
Our institutional role as a bank means that, on the one hand, we have an impact on economic and financial stability, and, on the other hand, we are subject to geopolitical developments and systemic risks. This, in turn, affects society. We drive economic growth in the long term through our banking activities in the transitions and topics that are important to us and our stakeholders. These investments can have a positive effect on well-being in the long term. Our local regions also have a business agenda that is based on all relevant dimensions of "sustainable well-being". Through banking activities and - for example - through our cooperative dividend, we have an impact on (social) safety, engagement, social contacts, financial resilience, and diversity and inclusion. Possible negative effects of our business are cases of fraud, low pay, and labor rights issues within our value chain. In the interaction with our customers and business partners, we monitor possible negative effects. If we encounter possible negative effects, we engage (e.g., through dialogues and engagement strategies) and monitor changes. If we continue to encounter possible negative effects, we can take measures (including ending the relationship).
Material Impacts, Risks and Opportunities and their Interaction with our Strategy and Business Model
Strategy and risk management framework
Our sustainability aspirations (act on climate, value nature, enable people) and the sustainability risks have been incorporated in the Group Strategy and risk management framework. Various climate targets have been set, see the Metrics and Target section of the Climate Change Mitigation and Adaptation chapter. Nature-related effort targets are included in the Nature chapter. The sustainability policies have been established to outline the business principles Rabobank wishes to adhere to regarding sustainability in accordance with our mission and vision (please refer to the Strategy section).
Rabobank assesses its risk drivers annually. Strategic drivers are a possible source of risk impact but could also result in opportunities. Sustainability is identified as a strategic risk driver and therefore forms an important part of the assessment. It is subsequently analyzed through a Double Materiality Assessment (DMA) which evaluates financial and impact materiality. This approach ensures that sustainability related risks and opportunities are systematically identified and incorporated in our risk management framework.
This is outlined in the Integrating our sustainability approach within Rabobank's overall group strategy section.
Integration of sustainability matters into the overall (risk) management process
The risks at portfolio level are managed through intensity-based emission targets, risk appetite setting, pricing, and acceptance & underwriting criteria.
Climate Targets: Physical emission intensity targets have been set for sector x region combinations. In the Dutch F&A portfolio, we use absolute financed emission targets which is in alignment with the Dutch Financial Sector Climate Commitment. Please refer to the Environmental chapter for more details.
Risk Appetite Setting: Various sustainability related metrics have been included in the Risk Appetite Statement. This includes sector limits, exposures to sensitive sectors, sustainable assets, energy labels and compliance with sustainability policies.
Pricing: The translation of ESG risk pricing into loans, products and services is part of the ESG risk model vision roadmap and will develop over time. Pricing is already integrated via RAROC (Risk Adjusted Return on Capital) targets derived from the medium-term planning process and vulnerable sectors where necessary and applicable. To encourage our customers to make the transition, we have put pricing incentives in place in the form of lower interest rates for customers with certain eco-labels (Impact Loans), sustainability KPIs (sustainability linked loans) or with concrete sustainability investments (Green Loans).
Acceptance Criteria and Underwriting Criteria: Underwriting criteria can incorporate specific sustainability metrics. Examples are compliance with sustainability policies, energy labels for commercial real estate, and criteria related to international energy transition customers.
Our portfolio and sustainability
Determining where we have the most impact and dependency on our environment starts with analyzing our portfolio. In the Dutch market, we have a large market share in the residential mortgage market and we are a big lender to Food & Agri (F&A) customers. Internationally, the bulk of our activities is focused on F&A. Regionally, our activities are mainly concentrated in North and South America, Europe, Australia, and New Zealand. Within the F&A sector, Commodities, Animal Protein, Dairy and Fresh Produce are most prominently represented in our portfolio. Details on our products, markets, revenues and more can be found in the Financial Statements. We report a breakdown on the segments we service in the note Segment Reporting as included in our Financial Statements.
Connectivity between the Sustainability Statements and the Financial Statements
The connectivity between the sustainability statements and the financial statements is explicitly reflected in the area of credit risk and non-financial risk. ESG risks are translated into IFRS impairment allowances through multiple channels. The impairment allowances are captured in the IFRS 9 ECL models. For further information on this, please refer to Rabobank's Consolidated Financial Statements Note 4.3.9.
Impact, Risk and Opportunity Management
In line with the ESRS standards, this section outlines the sustainability‑related impacts, risks, and opportunities. It provides an overview of how we identify, assess, and manage material topics, ensuring transparency in our Sustainability Statements.
Description of Our Processes to Identify and Assess Material Impacts, Risks and Opportunities
As part of our double materiality assessment (DMA), we assessed our impact on people, society and environmental-related matters (impact materiality), and the impact on Rabobank arising from environmental, social and governance risks and opportunities (financial materiality). With this assessment, we determined which impacts, risks and opportunities are material to us and which sustainability topics are material for reporting purposes.
Our DMA considered our value chain (upstream and downstream) in addition to our own operations, and consisted of the following three main steps:
Understanding our value chain and identifying our environmental, social and governance topics (sustainability topics).
Assessment and determination of the material impacts, risks and opportunities related to sustainability.
Management response, including validation, approval and reporting.
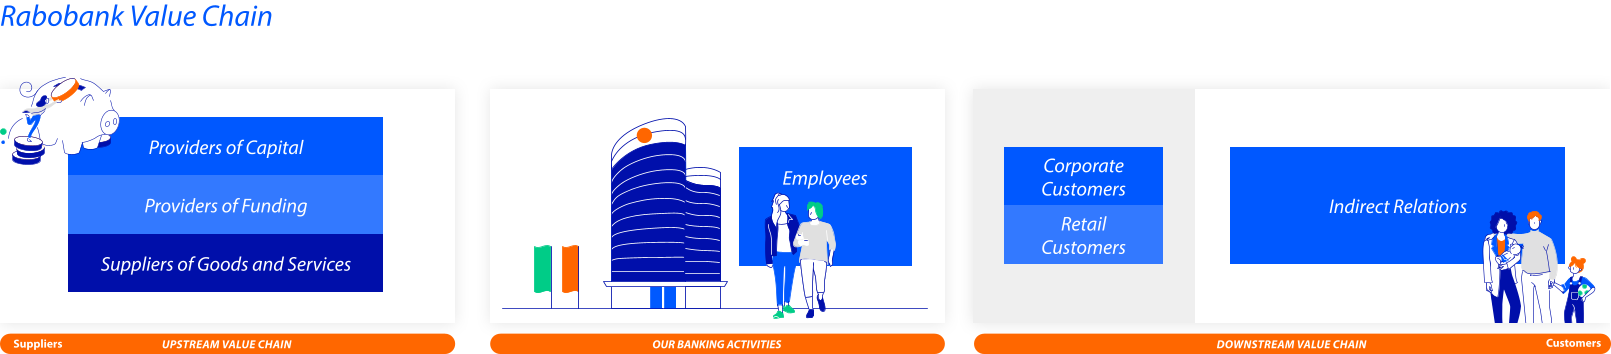
Understanding our value chain and identifying our environmental, social and governance topics
Rabobank considers funding and savings, and procurement and vendor management as its upstream value chain. Its own operations relate to its own business activities as a bank and its downstream value chain comprises financial services provided to its direct customers and indirect relations. When defining Rabobank’s material impacts, risks and opportunities (IRO), we plotted the material topic within our value chain. The views of Rabobank's likely affected stakeholders are considered during this assessment. We consider our customers, members, investors and employees as our direct stakeholders, and society (NGOs, public service bodies, communities, and governing and supervisory bodies) as our indirect stakeholders.
Assessment and determination of the material impacts, risks and opportunities
related to sustainability topics
Impact materiality
When assessing and determining sustainability topics from an impact perspective, we consider actual or potential, positive or negative impacts on people or the environment over the short, medium or long term. We consider impacts connected to our own operations and upstream and downstream value chain, including through our products and services, as well as through our business relationships. Within our impact assessment, we focus on assessing the drivers of the sustainability related impacts.
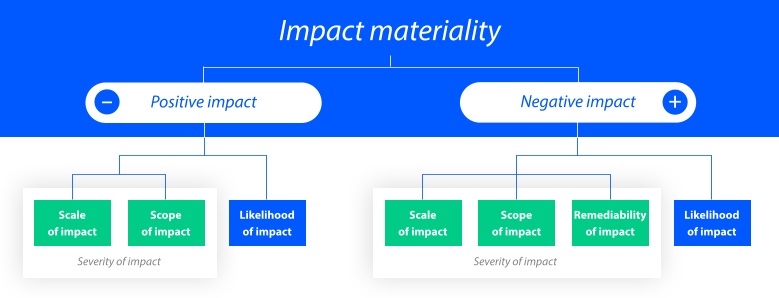
For the assessment criteria and thresholds, and data sources and estimates related to impact materiality, refer to Appendix 1: Methodology & Definitions.
Financial materiality
The financial materiality of risks and opportunities is assessed based on a combination of the likelihood of occurrence and the potential magnitude of the financial effects over the short, medium or long term. We consider the average of three types of risk: financial, reputational and regulatory risks. The risk rating scales used are aligned with our Risk Control Framework and Global Standard on Risk Identification and Assessment.
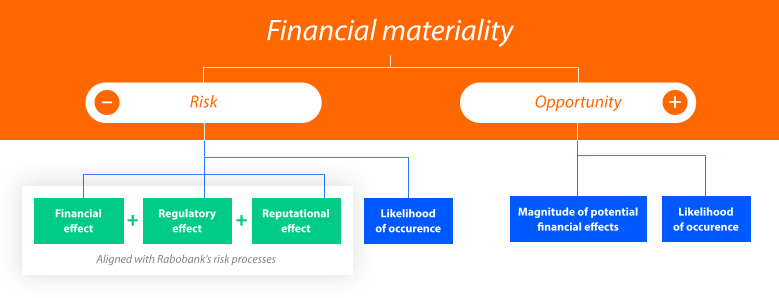
For the assessment criteria and thresholds, and data sources and estimates related to financial materiality, refer to Appendix 1: Methodology & Definitions.
Management response, including validation, approval and reporting
Decision-making process and internal control procedures
The DMA is executed within CRO Enterprise Risk, and with the collaboration of Group Sustainability, Finance, and various other departments. The Sustainability Implementation Management Team (IMT) and Group Risk Management Committee (Group RMC) endorsed the outcome of the DMA. The outcome of the DMA has been discussed within the Managing Board and Supervisory Board and the Managing Board approved the material topics resulting from the DMA.
The DMA process is embedded in Rabobank's Risk Control Framework and Rabobank's Global Procedure on Double Materiality Assessment, as part of Rabobank's Global Policy on Risk Management. For the integration of sustainability topics in the (risk) management process, refer to Risk Management.
Process updates compared to prior year
For our Sustainability Statements, we executed the double materiality assessment in accordance with ESRS. This year, we identified 11 material sustainability topics (2024: 12 material sustainability topics).
We aligned our DMA process with Rabobank’s risk management framework, including risk identification and assessment processes. Which resulted in an increased materiality threshold to EUR 250 million (2024: EUR 240 million). In addition, we refined our material impacts, risks and opportunities which resulted in updated IRO descriptions for the topics of Water, Land degradation / Land-use change and Information- and safety-related impacts for consumers and/or end-users, and the removal of Affordable housing as entity-specific topics.
Water (ESRS E3): Based on our analysis, this topic is no longer deemed material from a risk perspective. Water-usage risk is captured under climate change adaptation. Water remains material from a negative impact perspective.
Land use (ESRS E4): This topic is no longer deemed material from a positive impact nor an opportunity perspective. Although our initiatives have or aim to have positive impact, their scope and impact are concentrated and insufficient to mitigate negative effects. This topic remains material from a negative impact and risk perspective.
Information- and safety-related impacts for consumers and/or end-users (ESRS S4): In addition to the financial risk, our material negative impact has also been considered to be material.
Affordable housing (entity-specific): Although this topic is considered of high importance for Rabobank, on a consolidated level the severity level is below threshold. Nevertheless, our high ambitions are important and reported as part of our impact on consumers and end-users.
Disclosure Requirements in ESRS Covered by Our Sustainability Statements
For every material sustainability topic, we disclose the material information in relation to the material impacts, risks and/or opportunities assessed to be material. Therefore, our Sustainability Statements comply with the material and relevant disclosure requirements of the ESRS topical standards. For the disclosure requirements complied with in preparing the Sustainability Statements, refer to the general, environmental, social and governance information sections, where the reference to paragraphs is made in a content index. Within Rabobank's Sustainability Statements, we disclose the material information prescribed within a material disclosure requirement, if that information is relevant due to its significance in relation to the material topic, or when the disclosure of such information meets the users' decision-making needs.
For Rabobank's definitions of its material sustainability topics, refer to Appendix 1: Methodology & Definitions. For the datapoints that derive from other EU legislation as listed in appendix B of ESRS 2, please refer to Appendix 5: Datapoints that derive from other EU legislation.
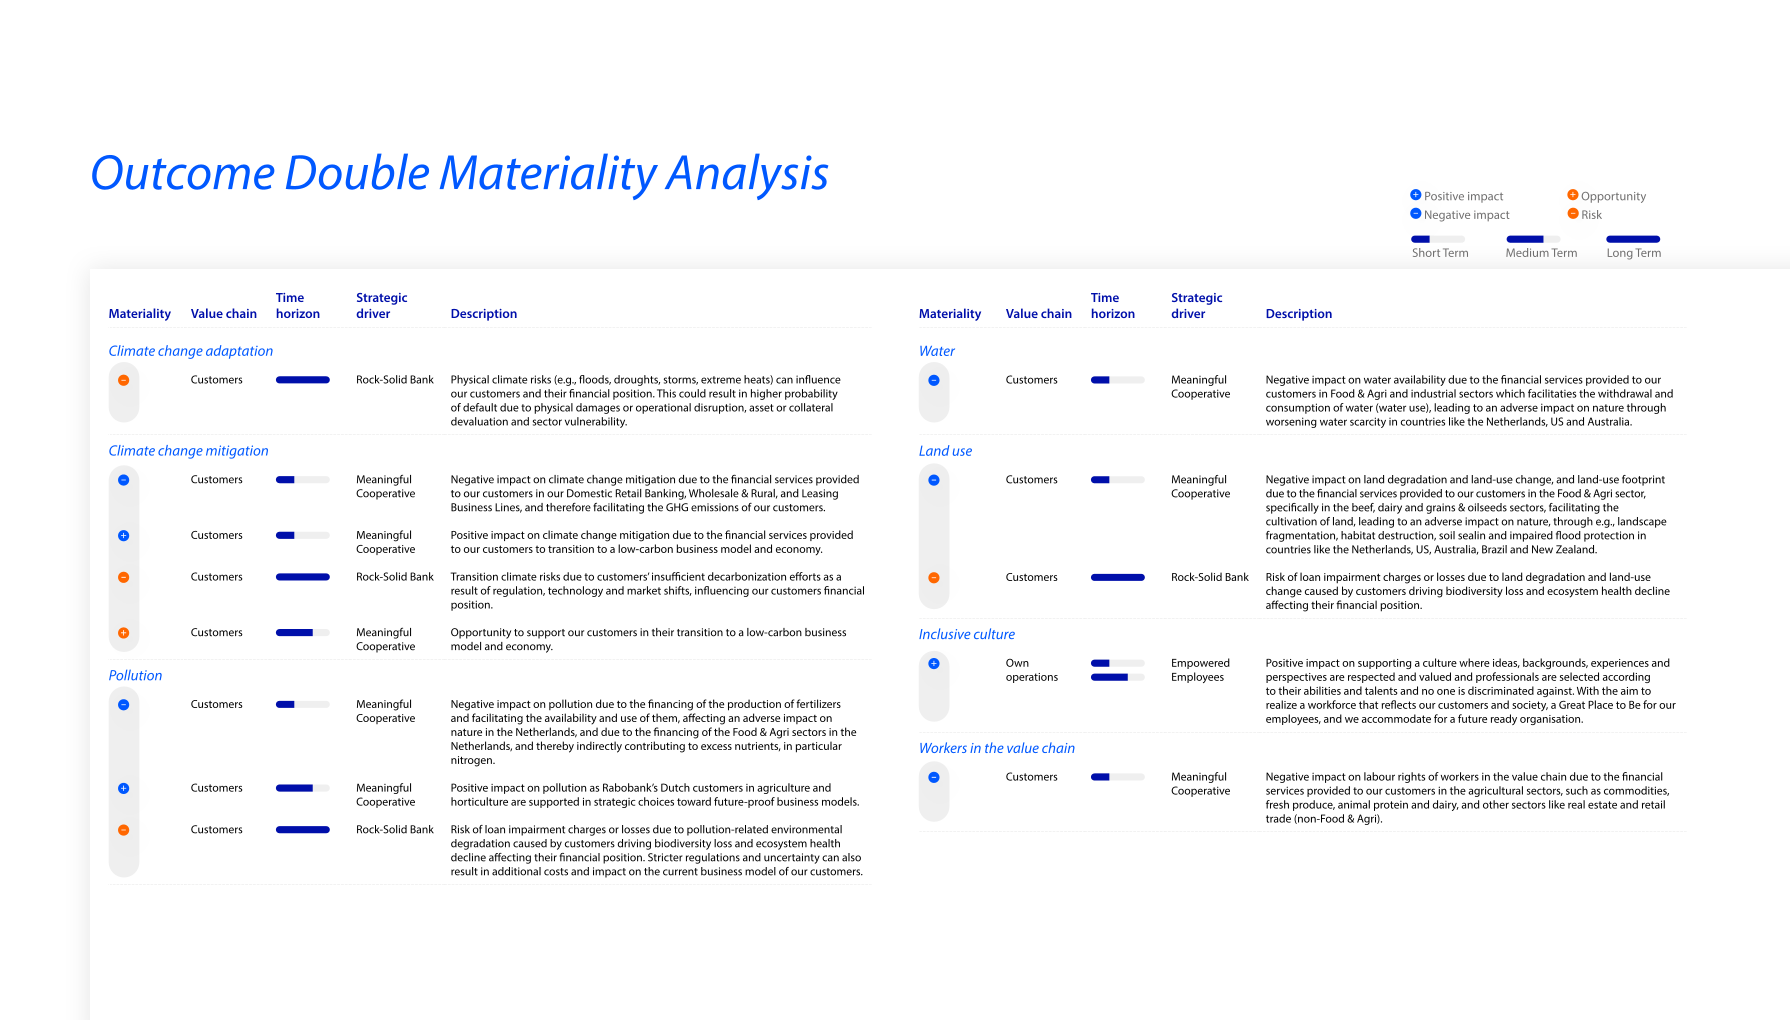
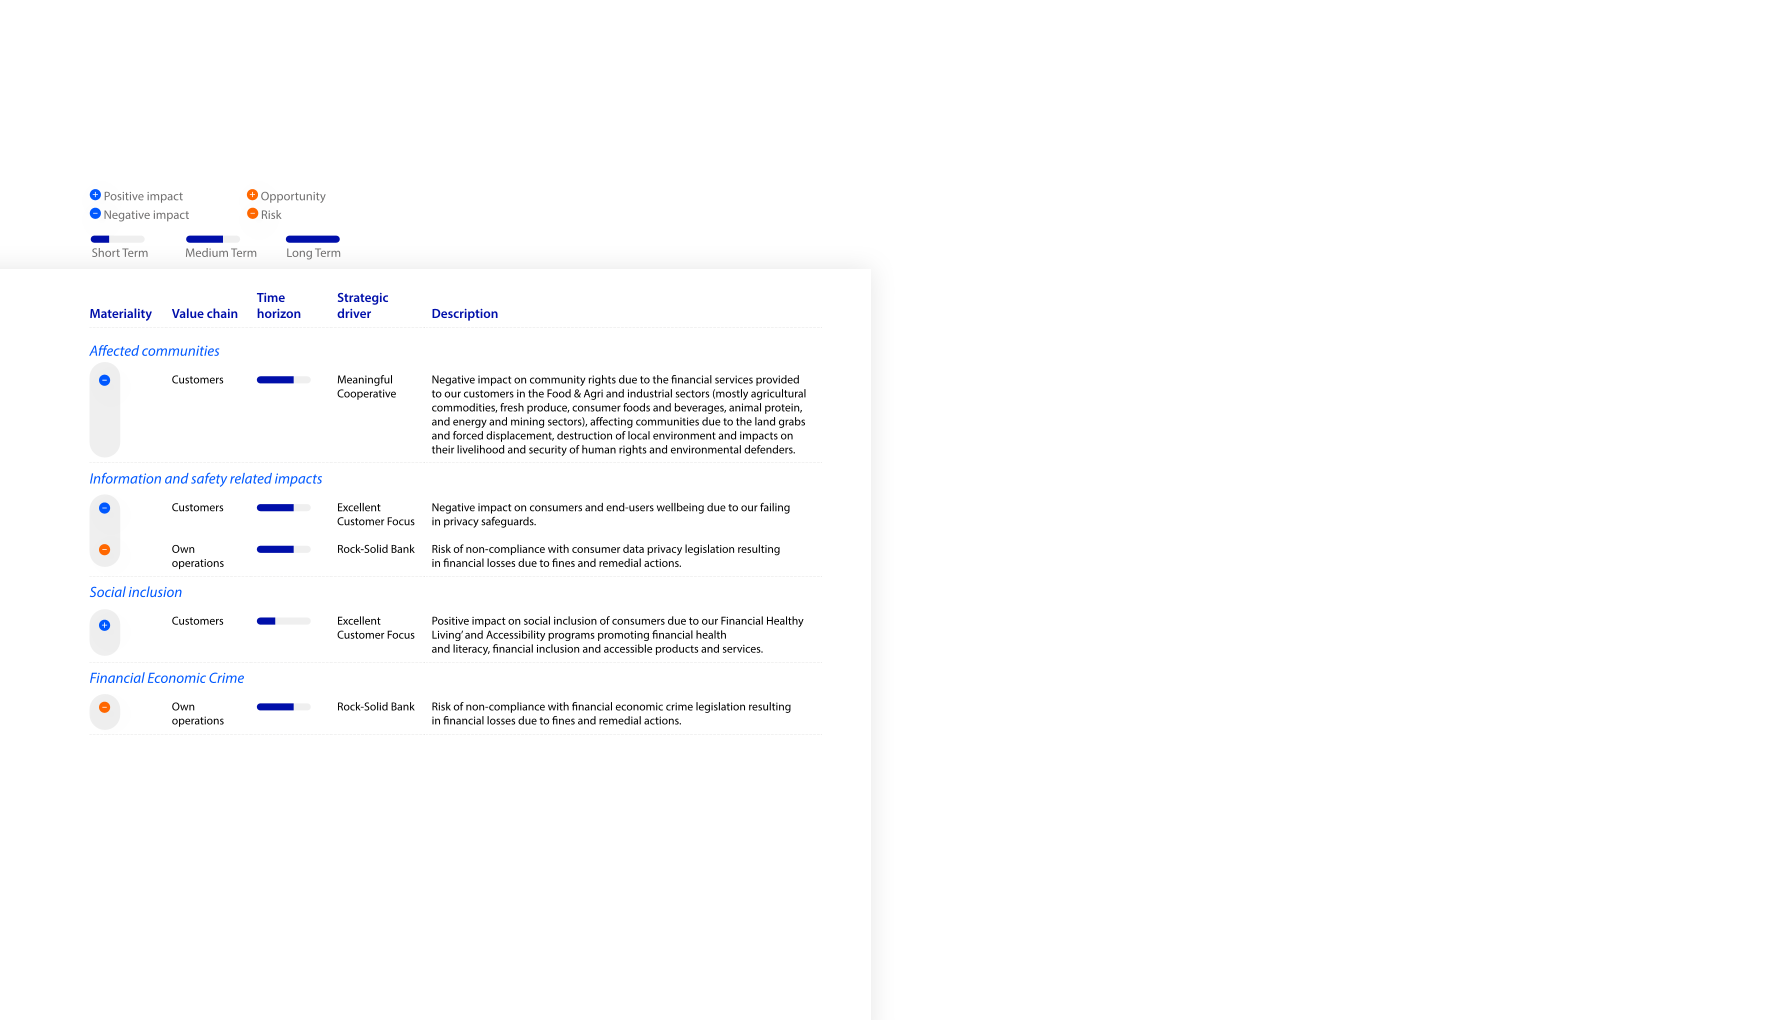
Sustainability Policies
At Rabobank, we aim to embed sustainability in our policies in line with regulations and commitments, and Rabobank’s own ambitions. Rabobank has a Policy Document Management (PDM) framework in place that defines requirements relating to the development and structure of policies. This section elaborates upon the setup of the sustainability policies and the integration in the customer credit journey. In the following sections, in which we describe the 11 material sustainability topics resulting from the DMA, we explain in more detail which aspects of the Theme and Sector policies are most relevant for each material topic.
Sustainability policies (Theme and Sector policies)
Rabobank’s sustainability policies distinguish between impacts within our direct control and those that are indirectly created through our relationships with customers (excluding private individuals) and business partners (business partners include suppliers and ‘non-supplying business partners’ such as intermediaries and donation receiving parties). We therefore set requirements for our own activities (Rabobank’s own activities) and for our in scope customers and business partners (acceptance requirements and performance monitoring), to the extent applicable. They are developed to support our business decision-making and are reviewed and updated as necessary. Acceptance requirements and performance monitoring are established per ‘theme’ and ‘sector’. In total, we have established sustainability policies on 4 Themes and 6 Sectors. These documents are all included in the Global Standard on Sustainability Acceptance and Performance. The sustainability policies apply to the Consolidated Coöperatieve Rabobank U.A. (together referred to as ‘Rabobank or ‘the bank’), unless explicitly stated otherwise. If an entity, business line or department can temporarily not comply with the sustainability policies, the management of each entity, business line or department must apply for a waiver. Waivers are required when all or parts of sustainability policies cannot be implemented by the deadline set and/or when elements of the (relevant) sustainability policies conflict with applicable laws or regulations, in which case local laws or regulations shall prevail.
Sustainability in the Customer Credit Journey
The sustainability policies are implemented as part of our customer credit journey (customer acceptance and performance). Within the credit journey we assess (a) the sustainability performance of our customers which includes compliance with the Rabobank sustainability policies, (b) whether specific financing facilities can be classified as sustainable finance, and (c) the impact of ESG factors on customer creditworthiness, having regard to applicable local legislation.
This involves the following steps:
The analysis contains a risk assessment, determines the material topics, actions taken and mitigants. For potentially high-risk wholesale customers, an in-depth sustainability assessment is required. For customers in climate sensitive sectors, a specific environmental risk analysis will be performed.
The outcome determines the engagement agenda with the company and a reputational/litigation risk assessment. The sustainability risk assessment should be explicitly included in the credit risk analysis. This concerns impact on the business model (market environment, competitive position), financial analysis (revenues, required investments and impact on cost levels) and the asset valuation.
Through the credit risk analysis, the ESG impact on the credit risk parameters is established indirectly (credit risk classification, Probability of Default (PD) and Loss Given Default (LGD)).
The Global Standard on Product Governance details how the needs and objectives of customers are taken into account in the development of new products and changes to existing products, as well as a thorough assessment of the risks the new/changed product could pose to customers. The Standard also provides requirements for event-triggered and periodic product reviews. Within product governance, specific sustainable products are approved and assessed. This includes (a) a target market assessment including sustainability factors and objectives; and (b) a separate assessment of sustainable products and inclusion in the product books.
Reputational risk assessments can be conducted and can originate from non-compliance with sustainability policies and from incorrectly classifying loans as “sustainable” (greenwashing risk). The sustainability policies are published on the corporate website and as such publicly available. Please refer to the section Interests and Views of Stakeholders, included in these Sustainability Statements, for an explanation on how interests of key stakeholders are taken into account in setting the sustainability policies.
Environmental Information

Disclosure Requirement (DR)
| Topical standard | Section | ||
|---|---|---|---|
| Climate Change Mitigation and Adaptation | |||
| ESRS 2 GOV-3 | Integration of sustainability-related performance in incentive schemes | General information - Integration of sustainability-related performance in incentive schemes | |
| E1-1 | Transition plan for climate change mitigation | Transition plan for climate change mitigation | |
| ESRS 2 SBM-3 | Material impacts, risks and opportunities and their interaction with strategy and business model | Material impacts, risks and opportunities and their interaction with our strategy and business model | |
| ESRS 2 IRO-1 | Description of the processes to identify and assess material climate-related impacts, risks and opportunities | Description of the processes to identify and assess material climate-related impacts, risks and opportunities | |
| E1-2 | Policies related to climate change mitigation and adaptation | Policies related to climate change mitigation | |
| E1-3 | Actions and resources in relation to climate change policies | Actions and resources in relation to climate change policies | |
| E1-4 | Targets related to climate change mitigation and adaptation | Targets related to climate change mitigation | |
| E1-5 | Energy consumption and mix | Not material | |
| E1-6 | Gross Scopes 1, 2, 3 and Total GHG emissions | Gross GHG Emissions | |
| E1-7 | GHG removals and GHG mitigation projects financed through carbon credits | Not material | |
| E1-8 | Internal carbon pricing | Not material | |
| E1-9 | Anticipated financial effects from material physical and transition risks and potential climate-related opportunities | Not disclosed considering the phased-in transitional provisions | |
| Pollution | |||
| ESRS 2 IRO-1 | Description of the processes to identify and assess material pollution-related impacts, risks and opportunities | Description of the processes to identify and assess material pollution-related impacts, risks and opportunities | |
| E2-1 | Policies related to pollution | Policies related to pollution | |
| E2-2 | Actions and resources related to pollution | Actions and resources in relation to pollution | |
| E2-3 | Targets related to pollution | Targets related to pollution | |
| E2-4 | Pollution of air, water and soil | Not material | |
| E2-5 | Substances of concern and substances of very high concern | Not material | |
| E2-6 | Anticipated financial effects from pollution-related impacts, risks and opportunities | Not disclosed considering the phased-in transitional provisions | |
| Water | |||
| ESRS 2 IRO-1 | Description of the processes to identify and assess material water and marine resources-related impacts, risks and opportunities | Description of the processes to identify and assess material water-related impacts, risks and opportunities | |
| E3-1 | Policies related to water and marine resources | Policies related to water | |
| E3-2 | Actions and resources related to water and marine resources | Actions and resources in relation to water | |
| E3-3 | Targets related to water and marine resources | Targets related to water | |
| E3-4 | Water consumption | Not material | |
| E3-5 | Anticipated financial effects from water and marine resources-related impacts, risks and opportunities | Not disclosed considering the phased-in transitional provisions | |
| Land use | |||
| E4-1 | Transition plan and consideration of biodiversity and ecosystems in strategy and business model | Transition plan and consideration of land use in strategy and business model | |
| ESRS 2 SBM-3 | Material impacts, risks and opportunities and their interaction with strategy and business model | Not material | |
| ESRS 2 IRO-1 | Description of processes to identify and assess material biodiversity and ecosystem-related impacts, risks and opportunities | Description of the processes to identify and assess material land use-related impacts, risks and opportunities | |
| E4-2 | Policies related to biodiversity and ecosystems | Policies related to land use | |
| E4-3 | Actions and resources related to biodiversity and ecosystems | Actions and resources in relation to land use | |
| E4-4 | Targets related to biodiversity and ecosystems | Targets and impact metrics related to land use | |
| E4-5 | Impact metrics related to biodiversity and ecosystems change | Targets and impact metrics related to land use | |
| E4-6 | Anticipated financial effects from biodiversity and ecosystem-related risks and opportunities | Not disclosed considering the phased-in transitional provisions | |
Climate Change Mitigation and Adaptation
Strategy
Transition Plan for Climate Change Mitigation
Our climate goal
Rabobank1 remains committed to aligning its activities with 1.5ºC pathways by 2050 and to helping customers successfully navigate their transition to a sustainable pathway. We measure and disclose our progress annually with the publication of the Gross GHG emissions in our Sustainability Statements. Ultimately, our ability to fulfil our 2050 climate ambitions depends on how successful our customers are in reducing their GHG emissions. We will try to use our financing, networks and knowledge to help them make climate-smart choices for their homes and businesses. But we are conscious of the fact that government policies, technological developments, market conditions, consumer sentiment and many other factors also influence the overall progress.
Reducing our own emissions
Our starting point is to take mitigating actions to reduce CO₂e emissions from our own operations. Note that the emissions resulting from our own operations (Scope 1 and Scope 2) are low compared to the emissions that result from our customers' activities (Scope 3, financed emissions). We disclose the emissions resulting from our own operations voluntarily, as this topic is not deemed material from a double materiality perspective. Please refer to the EU Taxonomy section in the Annual Report for information on aligning economic activities with criteria established in the Commission Delegated Regulation 2021/2139. We aim to mitigate the CO₂e emissions from our own operations, such as the emissions resulting from energy purchased to heat or cool our offices, or from our lease fleet and business travel. Our approach involves mindful travel decisions, electrifying our lease fleet, and enhancing the energy efficiency of our office buildings.
Reducing our financed emissions
The vast majority of our emissions results from our customers' activities (Scope 3, category 13 and 15) i.e., our financed emissions. To address those, we leverage our generic four-step approach (outlined in the Sustainability Embedded in our Strategy-section):
We build our understanding (through data collection and analysis) how much our customers are emitting and how much of it we are facilitating. At Rabobank, we use the Partnership for Carbon Accounting Financials (PCAF) standard for accounting and disclosing financed emissions.
We identify science-based sectoral decarbonization pathways that provide guidance on the rate at which customers in a given sector need to reduce their GHG emissions, and set emission-reduction targets for the most material sector x region combinations in our portfolio.
We develop sector x region level implementation plans to achieve the targets set. The sector x region level implementation plans also address climate-related physical risks, and as such address the topic of climate change adaptation.
We assess the effectiveness of our actions to also ensure accountability, transparency and consistent reporting.
Within Rabobank, the Finance domain is the owner of financed emissions calculations and reporting. Benchmarking and target setting are included in our policy framework. The sector x region based approach is integrated into our business strategy and financial planning (please refer to the Material Impacts, Risks and Opportunities and Their Interaction with Strategy and Business Model for more detail).
Net-Zero Banking Alliance
Over the past year, the NZBA transitioned away from a member-based alliance and established its guidance as a framework. As a result of the vote outcome, the NZBA ceased its operations in October 2025. NZBA's Guidance for Climate Target Setting for Banks has helped banks set 1.5°C-aligned, sector-specific climate targets for the first time. This Guidance and supporting implementation resources remain the most widely used global banking framework focused specifically on setting decarbonization targets. It will continue to be available for any bank to use and to reference without becoming a member or making a public commitment.
Rabobank began its carbon footprinting work before the NZBA’s inception. The NZBA’s efforts provided an impetus for this work and helped us to further develop our climate approach. Over the past years, we have been integrating our climate approach in the strategic steering cycle of the bank. Despite the transition of the NZBA from a membership “commitment” to a non-membership “framework", Rabobank’s obligations (due to the Dutch Financial Sector Climate Commitment and UN Principles for Responsible Banking Commitment) and ambitions to set, disclose, and execute credible climate targets remain. We will continue to pursue our climate-related ambitions leveraging the best available science, pathways and frameworks.
Focus and targets for 19 prioritized sector x regions
To achieve our 2050 goal, we set GHG emissions reduction targets for 19 prioritized sector x region combinations in our portfolio. During 2025, we worked together with the NVB to improve the comparability in the GHG emissions reduction targets between financial institutions. Please refer to the Targets Related to Climate Change Mitigation section. These targets cover a significant majority of the financed emissions of our portfolio (61%). We published GHG emission-reduction targets for the prioritized sector x region combinations in our portfolio for the first time in our 2022 Road to Paris report and expanded on them in our 2024 Road to Paris addendum. Both have been approved by the Managing Board. We consider these aspects of the combined 2022 Road to Paris report and the 2024 Road to Paris Addendum to be the backbone of our climate approach.
The absolute financed emissions metric (Mt CO₂e) is sensitive to balance sheet fluctuations and therefore does not provide a completely accurate picture of our customers’ GHG reduction performance. Therefore, in most cases we use a physical emissions intensity metric (kg CO₂e/kg product), except for our Dutch F&A portfolio, where we use absolute financed emissions targets which is in alignment with the Dutch Climate Agreement. In our view, the physical emissions intensity metric is the better metric in terms of providing an indicator of the real-economy changes to the emissions profile of a given sector. In addition, the physical emissions intensity metric provides a clearer picture in line with our focus on helping our customers to transition to more carbon-efficient practices.
2030 progress indicator
We have introduced a 2030 financed emissions progress indicator to regularly check our progress towards our overarching climate goal. This figure, based on our 2024 portfolio as a reference, represents on a like-for-like basis (i.e., no portfolio growth) our current “best estimate” of where we will be on our journey to Paris in 2030. It incorporates many assumptions, including estimated current GHG emissions for segments of our portfolio without reported customer data (which constitutes the majority of our loan portfolio), estimated GHG-reduction pathways for our 19 prioritized sector x regions and estimated attribution factors. The financed emissions progress indicator provides insight into whether our strategic interventions, including customer support, stakeholder engagement, and portfolio alignment, are contributing to measurable decarbonization, as we believe there is a correlation. It serves as a directional tool to assess the effectiveness of our sustainability approach, as further elaborated in the next section.
Based on the data available to us, our most recent models estimate that the progress indicator of our 2030 financed emissions for our total like-for-like on-balance sheet lending portfolio (CO₂ and non-CO₂ emissions combined) will be approximately 29 MtCO2e for customer Scope 1 & 2 emissions. This breaks down into approximately 16 MtCO₂ emissions and 13 Mt non-CO₂ emissions. This is lower than our 2024 estimate of 32 MtCO2e. The change is due to a combination of data improvements and the continuing decarbonization of our lending portfolio. These outcomes do not account for future portfolio growth. Given the bank’s role in supporting our customers in the energy and food systems transitions, we anticipate growth in our on-balance sheet lending portfolio, which will inherently have an upward effect on financed emissions.
- Note that Rabobank is not excluded from the EU Paris-aligned benchmarks.
Material Impacts, Risks and Opportunities and their Interaction with our Strategy and Business Model
Type of climate-related risk
Rabobank assesses climate-related ESG drivers as part of its Risk Identification and Assessment process (RIA). We assess the impact of these ESG drivers on each risk type within our Risk Taxonomy. These climate- and nature-related ESG drivers are assessed to have a material impact on credit risk, business risk, operational- and compliance risk.
Scenario Analysis and Resilience
Rabobank conducts climate- and nature-related scenario analyses to understand how different futures could affect our business model and strategy. These analyses are essential for steering towards our sustainability commitments, meeting regulatory expectations and ensuring that our strategy remains resilient to climate change and varying policy developments.
In 2025, Rabobank performed a comprehensive program of scenario analyses across short-, medium-, and long-term horizons. These analyses covered both physical risks, such as extreme weather events, and transition risks, such as policy changes and carbon pricing. In addition, Rabobank executed over many scenario analyses in 2024 and 2025, alongside group-wide resilience and stress testing, underscoring our commitment to managing climate- and nature-related risks across the balance sheet. They provide insights that guide strategic decisions, inform capital allocation, and guide management actions, including targeted adaptation measures for sectors most exposed to climate risks.
Resilience analysis
Our resilience analysis focused on long-term climate pathways developed by the Network for Greening the Financial System (NGFS). In 2025, Rabobank assessed our business model against three NGFS scenarios: Net-Zero 2050, Fragmented World, and Nationally Determined Contributions (NDC). Two quantitative analyses supported this assessment:
Credit Loss Scenario Analysis - This analysis provides insight into how physical and transition risks could affect the financial performance of climate-sensitive portfolios. It projects expected credit losses under each scenario using the same methodology applied in provision calculations.
Financed Emissions Scenario Analysis - This analysis projects Rabobank’s financed emissions for 2030, 2040, and 2050 under all three scenarios, accounting for uncertainty in global climate developments. The scope and methodology align with financed emissions projections in our MTP and cover climate-relevant exposures in the balance sheet.
The purpose of this analysis is to determine whether Rabobank’s business model and strategy remain resilient under different climate futures. The results confirmed that our business model is resilient, while highlighting pockets of risk in certain sectors that require targeted actions and adaptation measures. The results are included in sector x region plans and ICAAP, to support our transition commitments for 2030 and 2050.
Climate Stress Test
In addition to long-term resilience analysis, Rabobank performs climate stress tests to evaluate short- and medium-term impacts under adverse conditions. Our 2025 stress test applied the adverse NGFS scenario “Disaster and Policy Stagnation” alongside a baseline scenario. The stress test methodology relied on NGFS assumptions and short- to medium term projections up to 5 years. The stress test covered the entire Rabobank Group and included detailed assessments for rural sectors in Australia/New Zealand and the United States, incorporating material ESG risks such as credit, operational, and business risk. The outcomes provided valuable insights into transmission channels at both macro and micro levels. Such as GDP shifts, carbon pricing, and commodity price changes at the macro level, and borrower credit quality, collateral values, and sector-specific stress factors at the micro level. It quantified the potential impact on profit and capital and identified specific vulnerabilities and pockets of risks in our portfolio.
The stress test is used to identify short-term management actions where needed, supporting near-term resilience.The outcomes are integrated in key internal processes such as ICAAP and transition planning.
Portfolio Climate and Nature scenario analyses
Beyond group-wide scenario analyses, Rabobank performs scenario analyses across individual risk type e.g., credit risk, business risk, and operational risk. This approach ensures that climate- and nature-related risks are assessed where they matter most in our portfolio and operations.
For credit risk, we analyze how physical risks such as flooding, drought, and foundation damage, as well as transition risks like carbon pricing and nitrogen policies, affect borrower repayment capacity and collateral values. For business risk, we assess how sustainability regulations, financed emissions limits, and deforestation policies could impact Rabobank’s business model and growth opportunities. For operational risk, we include ESG-related scenarios such as supply chain disruptions due to extreme weather and compliance risks linked to sustainability obligations.
Beyond these risk-type programs, Rabobank executed an extensive range of targeted analyses across multiple portfolios and regions. These included assessments of extreme heat, riverside and coastal flooding, heavy precipitation, droughts, water scarcity, wildfires, and cyclones, as well as transition risks linked to greenhouse gas and nitrogen policies. We also analyzed financed emissions trajectories, second-round transition impacts under Fit-for-55, and nature-related risks. Examples from recent years include combined flooding and foundation damage risks in Dutch mortgage and Commercial Real Estate portfolios, drought and transition risk in beef portfolios in the United States and Australia, and nature-related risk scenarios at group level.
This structured approach demonstrates the breadth and depth of Rabobank’s scenario analysis program.
These climate-and nature-related risk scenario analyses are integrated into our strategic steering via our transition plans and ICAAP process.
Impact, Risks, and Opportunity Management
Description of the Processes to Identify and Assess Material Climate-related Impacts, Risks and Opportunities
Climate Change Mitigation

Impact
As part of our double materiality assessment, we assessed our negative impact on climate change mitigation due to the financial services provided to our customers in the Food & Agri, industrial and real estate sectors, to be material. Specifically, through our Wholesale & Rural, Dutch business customers, leasing and loans to consumers portfolios, we are facilitating the GHG emissions of our customers. To address climate change mitigation, we identified 19 sector x region combinations in our portfolio that are most material from a financed emissions perspective. These sector x region combinations are embedded in our transition plan for climate change mitigation and we have set GHG emissions reduction targets for each. Within our Sustainability Statements, we also report upon our financed emissions per asset class and business unit, including these 19 sector x region combinations, as required by Disclosure Requirement ESRS E1-6.
We have also identified our positive impact on climate change mitigation to be material due to the financial services provided to our customers to transition to a low-carbon business model and economy.
Risk
From a climate-related transition risk perspective, we have identified the risk of insufficient decarbonization efforts taken by our customers as a result of regulation, technology and market shifts, influencing our customers financial position. We have identified a financial (credit) risk that the transition to a low-carbon economy, driven by regulation, technology and market shifts, can render carbon-intensive business models obsolete, affecting borrowers’ revenues and asset values. This can result in stranded assets in carbon-intensive sectors, regulatory tightening (e.g., carbon pricing, emission caps) increasing operational costs and market shifts reducing demands for high-emission products. From a financial (business) perspective, we have identified the risk of losses due to customers’ insufficient decarbonization efforts which makes them prone to reputational damage, regulatory penalties and decreased market value affecting the competitive environment, e.g., decreasing volumes, (commercial) margins, fees, commission, other income, or increasing (operational) costs.
Opportunity
Specially within Wholesale & Rural, Dutch business customers and our leasing portfolio, we identified opportunities to support our customers in their transition to a low-carbon business model and economy, as it affects our customers’ needs for financial services that we can provide to support decarbonization measures.
Climate Change Adaptation

The impact of climate change is already substantial and we will face more extreme weather and climate change events (such as hurricanes, droughts, flooding, forest fires, reduced crop yields, and increased scarcity of drinking water). Efforts to reduce vulnerability to climate change impacts are referred to as adaptation actions.
While we continue to contribute to mitigating climate change, we also want to help our customers adapt to climate impacts. We see adaptation as a pathway to resilience. Without sufficient adaptation, risk to both our customers and ourselves will rise. Adaptation can reduce the impact of physical risks, and is as such an essential part of the risk management strategy. The mirror image is opportunity. Scaling up adaptation finance can help prevent, prepare for, and respond to climate caused events and make communities, economies and natural systems more resilient.
Following our contribution to UNEP FI’s target-setting guidance for climate adaptation finance (launched in November 2023), we continued cooperating with UNEP FI (in 2024 focusing especially on sectoral deep-dives), and in 2025 on their Practical guidance on implementing adaptation and resilience (finalized and launched in August 2025).
Using our generic four-step approach (outlined in the Sustainability Embedded in our Strategy section) we structured key elements from available guidance (including from UNEP FI (NGFS). We subsequently aim to:
Create insight into the resilience of our portfolio to climate-related and other environmental risks.
Identify prioritized sector x region combinations (climate related physical risks are already included in the sector x region plans).
Increase internal knowledge and awareness around the topic of adaptation, and, based on sector x region prioritization, engage with relevant stakeholders, to assess actions already in place. Relevant to underline is that adaptation requires sector-, region-, and customer-specific knowledge, as exposure and vulnerability to physical climate risks differ. That is why we started involving and engaging areas of expertise on a central level and from there, we will start involving departments and colleagues on the decentralized level. We also dedicate time and effort to actions related to the ‘system change’ lever (e.g. participating in the Platform for Sustainable Finance and continuation of our collaboration with UNEP FI).
Keep track of the resilience of our portfolio, and disclose accordingly.
Rabobank adopts an iterative approach. Choices need to be revisited as data guidance and methodologies advance. This is in line with available guidance that advocates a ‘progressive pathway to impact’. Consequently, to date we have not set adaptation-related (group level) targets.
Risk
From a financial (credit) perspective, we have identified increasing physical climate risks. Climate risk events (e.g., floods, droughts, and storms) can damage assets, disrupt supply chains and reduce productivity across sectors. This weakens the financial position of our customers, especially those in sensitive sectors.This could result in higher probability of default due to physical damages or operational disruption, asset or collateral devaluation, sector vulnerability, and underinsurance or lack of resilience planning among borrower We have also identified financial (business) risks. The risk of losses due to climate change related events such as extreme heat, river line flooding, coastal flooding, heavy precipitation, drought, wildfires, cyclones, windstorms and water scarcity (the only chronic event) affecting the competitive environment (e.g., decreasing volumes, (commercial) margins, fees, commission, other income, or increasing (operating) costs).
Climate-related physical risks and climate-related transition risks are identified as strategic drivers in our Risk Taxonomy. As part of our Risk Framework, we perform stress testing scenario analysis and risk resilience analysis (outlined in the section Scenario Analysis and Resilience).
The described climate resilience analysis is a forward-looking assessment of the potential impacts of a set of distinct long-term climate scenarios, encompassing both transition and physical risks, on the viability and resilience of our business model. Within this assessment, we assume:
Our business model is reflected by our balance sheet portfolio mix and (ESG) Medium-Term Planning (MTP) projections.
Long term means the horizon is until 2050, given our net-zero ambition.
Climate scenarios are represented by three Network for Greening the Financial System (NGFS) scenarios (Net-Zero 2050, Fragmented World and Nationally Determined Contributions).
Potential impacts of the climate scenarios are represented by Financed Emissions and Expected Credit Loss (ECL) impacts.
Forward-looking assessment to determine whether the development of Financed Emissions and ECL has impact on our business model in each scenario.
We conducted in-depth analyses on ‘water availability’ in our exposures in Beef and Grains & Oilseeds in the U.S., Australian, as well as Dutch mortgage and commercial real estate portfolio. Dryer summers and wetter winters due to climate change are expected to exacerbate the risk of floods and foundation problems in buildings across the Netherlands. We established the relevance of this risk in the short to medium term and the potential increase in the longer term. These risks can potentially diminish collateral values, reduce their marketability, and affect the customers’ cash flows by decreasing rental income or increasing repair costs.
For the real estate portfolios, we assessed water-related risks and established an ESG risk score based on these factors at the facility or customer level. This score will be continuously enhanced with new events (e.g., natural occurrences) and more granular data. The score will be used to capture ESG risks in our risk models and to manage ESG risk at the facility or customer level.
Policies Related to Climate Change Mitigation
In the section Sustainability policies, an explanation is included on the sustainability policies. The Global Standard on Sustainability Acceptance and Performance covers three policies relevant to managing our material impacts, risks and opportunities related to climate change and biodiversity loss mitigation:
Climate Policy: sets acceptance requirements for in scope customers and business partners of Rabobank and as such aims to decrease our customers' negative impact on the climate and mitigating our climate-related financial risks. The performance monitoring criteria help identify and assess downstream customer-linked risks. The climate policy stipulates that Rabobank will accept customers or business partners that:
Submit their climate-related performance to Rabobank if they are required to report according to the Corporate Sustainability Reporting Directive (CSRD), from the first year CSRD applies to them onward.
Are willing to enter into a dialogue with Rabobank regarding staying, or becoming aligned with a 1.5°C pathway.
Are willing to enter into a dialogue with Rabobank regarding their possibilities of measuring actual greenhouse gas emissions data or alternative information about their progress to become 1.5°C aligned.
Energy Policy: sets our acceptance requirements at the customer and business partner level and at activity level and defines performance monitoring activities on a customer level (these are elaborated upon in the 'Our Stance on Energy section'.
The Deforestation and Land Conversion Policy which is elaborated on in the "Policies related to land use"-section in the Land Use-chapter.
Overall, our policies support our business decision-making at all levels and provide a frame of reference for how we want to deal with business opportunities and risks in the context of direct and indirect sustainability impacts. These group-wide policies apply to in scope customers and business partners whose activities have potential and actual material impacts on sustainability related matters. Potential and actual material impacts include responsibility and control over their value chains. Our policies contain acceptance requirements (mandatory) and performance monitoring criteria following a risk-based approach.
The following sector initiatives, commitments and frameworks relate to these policies:
Partnership for Carbon Accounting for Financials
Net-Zero Banking Alliance (in 2025, NZBA transitioned away from a member-based alliance and established its guidance as a framework)
Taskforce on Climate-related Financial Disclosures
Financial Institutions Commitment to the Dutch Climate Agreement
The Global Standard on Sustainability Performance Management (applicable to all core activities) is used to guide climate targets. It also includes the criteria those targets need to fulfil:
alignment with Rabobank's strategy;
consistent target setting with clear responsibilities.
Our Stance on Energy
In our view, our role is not to finance the entire energy system, but to make clear choices about what we support and what we avoid. We prioritize financing e.g. renewable energy, electrification, efficiency, flexibility and emerging low-carbon technologies—and we limit or exclude financing activities that risk locking the energy system into a high-emissions pathway. Through these choices, Rabobank supports a transition that aligns with 1.5°C target (using the IEA NZE scenario and SBTi guidance).
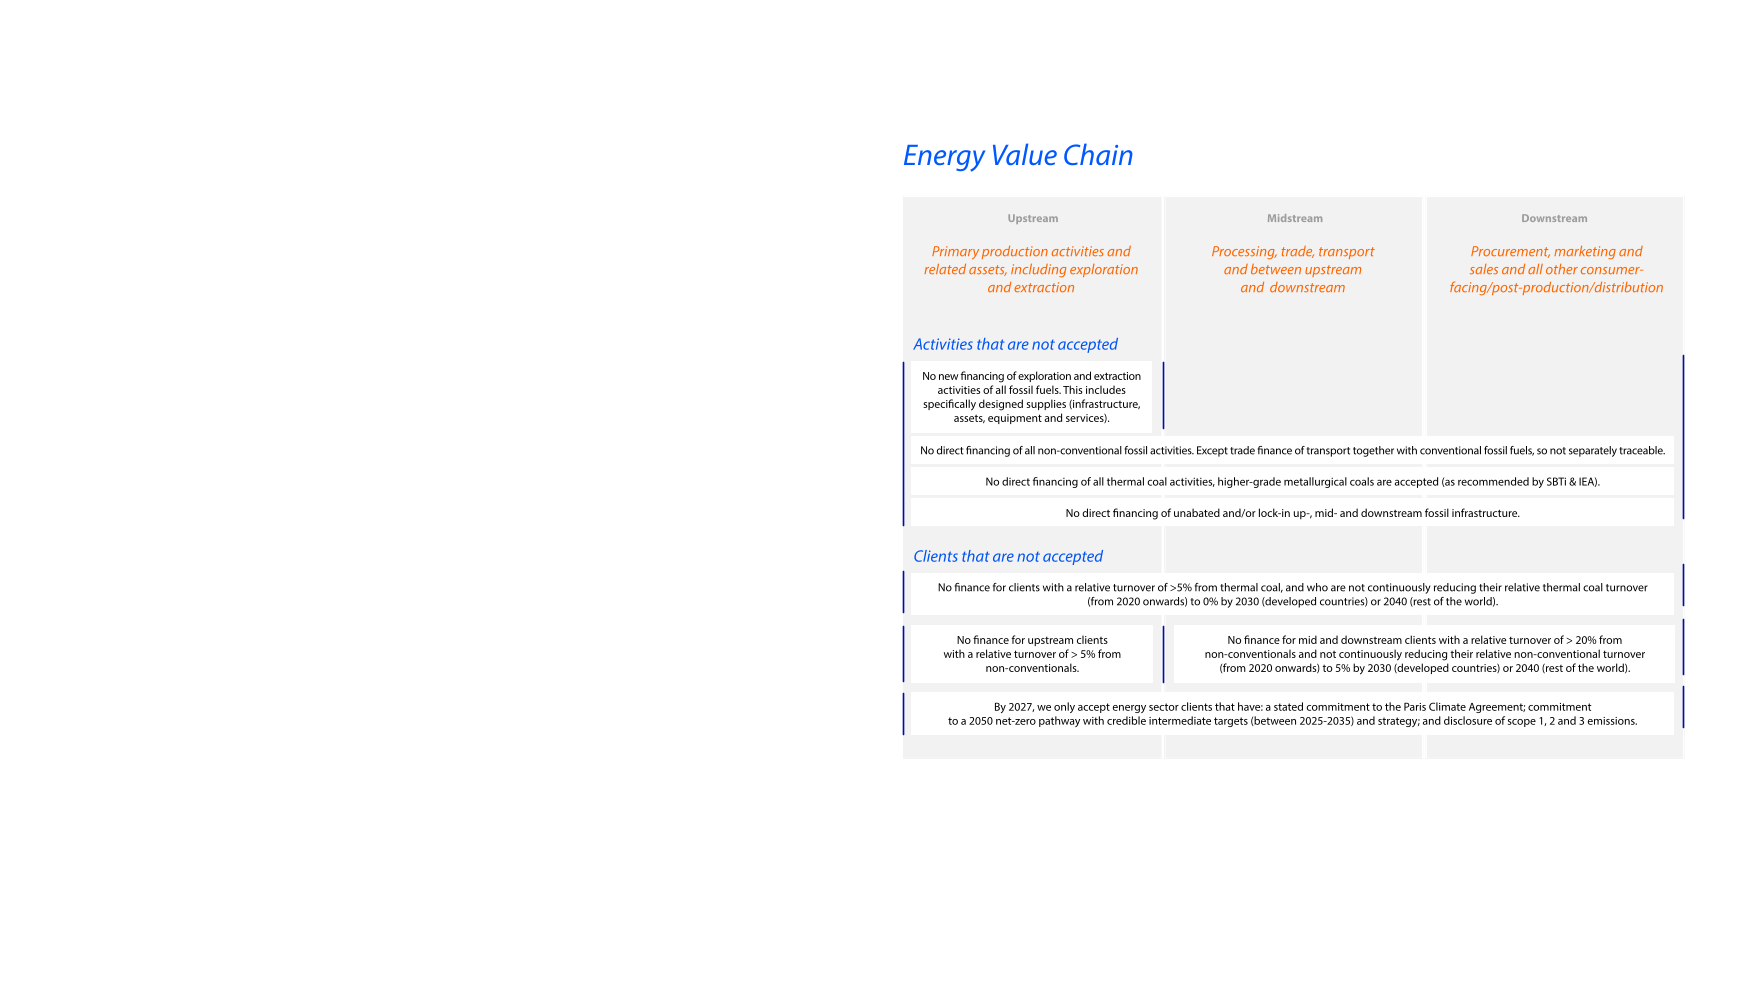
Our energy portfolio
Our energy portfolio, primarily focused on clean energy, makes up 3% of the private loan portfolio. Approximately 80% of project finance supports renewable projects like wind, solar, storage, and related infrastructure, with clean energy financing doubling in the past three years. Most oil and gas exposure is in short-term Trade & Commodity Finance (TCF), shaped by global demand and energy security, which cannot shift overnight.
Rabobank aims to reduce traded oil and gas financing by 20% by 2030 (vs. 2022), with gas forming a larger share and oil financing declining more steeply. This approach balances the need to cut fossil fuel use for the 1.5°C target while maintaining stable supply chains during the transition.
Our energy policy-based requirements
Alongside our oil and gas target, Rabobank enforces strict fossil fuel boundaries to prevent locking energy systems into high-emissions pathways. These are elaborated on in the adjacent visual. In sum, we apply limitations to fossil infrastructure to avoid creating new assets that would be inconsistent with a net-zero future. Credible net-zero scenarios highlight the role of carbon capture and storage, hydrogen, ammonia and energy system conversion technologies. In these well-defined areas, Rabobank sees a constructive role for banks: financing solutions that are necessary for a net-zero system, provided they are implemented responsibly and do not prolong the life of high-carbon assets or creates unacceptable impact on people or nature.
Actions and Resources in Relation to Climate Change Policies
Climate change mitigation and climate change adaptation (as climate related phyical risks are part of our Risk Taxonomy, climate and nature scenario analyses, and included in our sector x region plans) are being integrated in the strategic steering cycle of the bank. Within Rabobank Group’s Sustainability department, a dedicated climate team has been in place since 2022. This team works closely with Finance, Risk, our dedicated climate risk teams and RaboResearch’s Sustainability & Data Analytics team in areas such as footprint measurement, target setting and monitoring as well as on onboarding sustainability in business-as-usual processes. In addition, the team works closely with commercial business lines.
As the context and characteristics of sector x region combinations differ, our actions differ per sector x sector region as well. In the Sector x Region Analyses section, we offer a more elaborate overview of our prioritized sector x region combinations, that addresses the rate of GHG emission decrease, compared to the relevant decarbonization pathway, factors that influence that rate, and the actions Rabobank is undertaking to support the transition. Exceptions are Traded Oil & Gas (as the pathway is clear cut; reducing traded oil and gas financing by 20% by 2030 (vs. 2022)), Project Finance (as approximately 90% of project finance already supports renewable projects), Commercial Real Estate Wholesale and Transport Wholesale (as the Retail NL parts of these portfolios are most material). In this section, we suffice with listing a number of common denominators in the actions throughout all sector x region combinations and of actions that transcend the sector x region level.
In the “help customers transition” lever, emphasis is placed on actions that relate to:
Customer engagement.
Knowledge sharing; carbon workshops, exploring sustainable energy investments, etcetera.
Developing and offering pricing incentives for an improved energy label in our real estate portfolio.
In the “system change” lever, emphasis is placed on:
Working with sector specific partners to improve data availability and quality.
Advocating for governmental, long-term climate policies
In the “portfolio optimization” lever, emphasis is placed on:
Risk Appetite Statement, e.g., changing our risk appetite for customers who are not compliant with our sustainability policy, sector-specific limits, etcetera.
Leveraging our capital allocation processes, e.g., increased appetite for financing the energy transition.
Performance monitoring of customers and business partners regarding having (or working towards) a plan that captures actions to become1.5°C aligned.
Please note that our actions, including certain product offerings, have the potential to help customers transition to improved carbon efficiency, but are dependent on customer interest and on factors outside our influence. The actions, as referred to within this section, through which we manage climate change mitigation, are on-boarded in our business as usual processes and activities. The expected outcomes (achieved or expected GHG emission reductions) and time horizons of our actions cannot always be disclosed at this point in time.
Metrics and Targets
Our starting point is to identify how much of our emissions result from our own operations, and how much result from our customers' activities (financed emissions). This is our GHG inventory, and is disclosed in the accompanying infographic and financed emissions table. In the next step we identify science-based sectoral decarbonization pathways that provide guidance on the rate at which customers in a given sector need to reduce their GHG emissions as well as setting emission reduction targets for the most material sector x region combinations in our sector x regions targets table.
Gross GHG Emissions
Rabobank's material impact is on the GHG emissions from our customers (Scope 3 emissions, category 13 and 15). Operational GHG emissions (Scope 1 and 2 emissions, and Scope 3 upstream emissions) are also relevant.
Operational GHG Emissions
While our operational GHG emissions account for only a small portion of our total carbon footprint, we are committed to minimizing these emissions wherever possible. With over 48,000 employees, offices in 35 countries, and two datacenters in the Netherlands, our operational GHG emissions mainly consist of energy consumption in our offices, fuel use / electricity consumption in our company vehicles and fuel use / electricity consumption associated with employee travel (business travel/commuting).
Emission reduction compared to base year (2018) = -54%
Tonnes of CO2 per FTE = 1.5 (FY2024: 1.4)
Scope
When we refer to our operational GHG emissions, we mean Scope 1 (emissions in company facilities and company vehicles), Scope 2 (emissions from purchased electricity, steam, heat and cooling), and Scope 3 Upstream activities (emissions from purchased goods and services, capital goods, fuel- and energy-related activities, transportation and distribution, waste generated in operations, business travel, employee commuting and leased assets). Currently, we report on our emissions in Scope 1, Scope 2, and some emissions in Scope 3 (i.e., paper consumption, fuel- and energy-related activities, business travel and employee commuting). The emissions of leased assets (leased facilities and leased cars) are reported in scope 1 and scope 2. A dedicated working group has been established to gain greater insight into the remaining upstream operational GHG emissions within Scope 3.
Benchmarking & target setting
For the largest categories within our operational GHG emissions, we have benchmarked our emissions against recognized decarbonization pathways and set 2030 targets that are in line with those pathways.
Operational GHG Emission Reduction Targets
| In tonnes of CO2 | Reference scenario | Base year | FY 2025 | FY 2024 | 2030 target |
| Company facilities (offices) | CRREM | 83,177 | 14,774 | 17,634 | 14,958 |
| Company facilities (datacenters) | SBTi | 15,164 | 4,647 | 6,003 | 5,762 |
| Company vehicles | IEA | 21,742 | 12,230 | 11,629 | 8,916 |
| Business air travel | IEA | 34,411 | 17,623 | 28,156 | 20,921 |
| Other | 6,153 | 24,436 | 5,710 | N.a. | |
| Total | 160,647 | 73,711 | 69,132 | N.a. |
For the category “Other”, the target-setting process is still under development. It mainly consists of business travel by car, paper consumption, employee commuting and fuel- and energy-related activities. Employee commuting and fuel-and energy-related activities are new categories in our 2025 reporting, these categories were not yet included in the 2024 and 2018 figures.
Rabobank Key Actions
Company vehicles: We aim for a 100% electric vehicle fleet; our leasing policy allows only electric cars.
Business air travel: Our business travel policy follows a digital‑first approach and requires train travel on all Western European high‑speed rail routes (under 600 km).
Considering the magnitude of the CO₂e emissions from our operations, we do not consider this to be material for Rabobank.
Emissions from our customers
This year we are able to report financed emissions for 98% (FY 2023: 99%) of the relevant (73% of our total assets (FY 2023: 73%)) on-balance sheet assets. We increased the bottom-up coverage (combined client reported-emissions and client assessed-emissions) of our financed emissions calculations to 21% in 2024 from15% in 2023 (from a financed emissions perspective). In addition, Rabobank works to expand the scope of sectors where customers are enabled to calculate their emissions and provide reported emissions by making carbon calculators available.
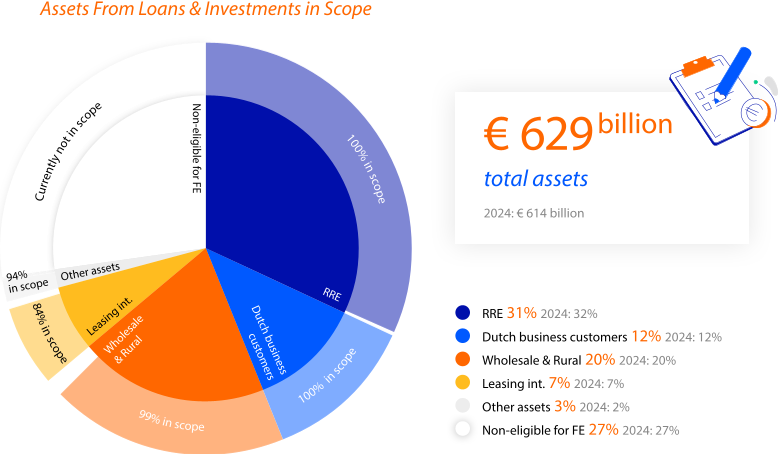
A decrease in financed emissions and an increase in avoided emissions
We will focus our reduction efforts on our customers’ scope 1 & 2 emissions, as this is where we have more influence. In our most recent GHG inventory, we observed a 10% decrease in our financed emissions (Scopes 1 and 2) on a comparable basis, from 46.9 Mt CO₂e to 42.0 Mt CO₂e. This decrease is driven by a combination of factors: 1. improved data quality, including both bottom-up data from clients’ own reports and carbon calculators, as well as top-down estimate data, which improved accuracy and reduced emissions by 3.2 Mt CO₂e; 2. a shift in portfolio mix towards lower GHG-intensive sectors, reducing emissions by 1.9 Mt CO₂e; and 3. sector- and system-level decarbonisation efforts, resulting in a reduction of
0.9 Mt CO₂e. These reductions offset an increase in financed emissions driven mainly by growth in lending portfolio, amounting to 1.1 Mt CO₂e.
In the Rural portfolio, we have noted a reduction in emissions intensity across a range of sectors compared to previous years, resulting in a cumulative decrease of 2.0 Mt CO₂e. The most substantial reductions were observed in the Animal Protein, Fresh Produce, and Farm Inputs sectors. Additionally, changes in portfolio composition contributed to a further decline in financed emissions, with a decrease of 1.5 Mt CO₂e, primarily driven by reduced exposure in the Commodities and Dairy sectors. Among our Dutch business customers, the Non-Food & Agri (Non F&A) sector remained stable, with only a marginal decrease in financed emissions attributable to slightly lower outstanding balances. Within the Food & Agri (F&A) sectors, modest increases in emissions intensities were identified in the Animal Protein and Dairy sectors; however, these were offset by a reduction in portfolio size for both sectors. The Fresh Produce sector demonstrated improved emissions intensities, accounting for the majority of the drop in financed emissions. The Commercial Real Estate (CRE) portfolio experienced growth, and its lower emissions intensities contributed positively to the overall reduction in financed emissions. The scope 1 & 2 financed emissions for our Wholesale portfolio decreased by 1.5 Mt CO₂e to 9.4 Mt CO₂e. This is mainly due to the aforementioned improved data for top-down estimates and growth in sectors with lower intensities.
The methodology used to calculate our financed emissions is disclosed in Methodology Financed Emissions. The overview of Rabobank's financed emissions per asset class and business unit provides insight into our Scope 3 categories. Category 13 downstream leased assets is presented as part of the leasing international business unit. The remainder of the table presents a breakdown of category 15 investments. Rabobank does not base the GHG emissions on net revenue but on outstanding assets.
Avoided emissions refer to the greenhouse gas emissions that would have occurred without renewable energy projects. These emissions are primarily avoided through wind, solar, and geothermal projects that replace fossil‑fuel‑based electricity generation. These large‑scale, complex projects fall within our Project Finance renewables portfolio, which forms the scope for our avoided‑emissions calculations. In 2024, our total avoided emissions increased by 17% to 7.0 Mt CO2e (+1 Mt CO₂e) compared to 2023, driven by projects moving from construction to operational status and growth of the portfolio. Wind and solar projects now contribute equally to total avoided emissions. Our total renewables portfolio stands at EUR 8.3 billion, of which EUR 6 billion are projects in scope with eligible sectors (wind, solar and geothermal) with positive outstanding on balance. This is a 42% growth and includes projects in construction phase. Out of these only operational projects are included for avoided emissions scope representing EUR 4.0 billion. The projects in cosntruction show strong pipeline for future growth. As grids in most countries get greener over time, avoided emissions are expected to be lower but as we see growth in the portfolio and more projects become operational, we expect avoided emissions to continue rising.
During 2025, the NVB has published templates for the disclosure of Financed emissions and GHG targets. The use of these templates by banks in the Netherlands will improve comparability between financial institutions. We have based our disclosures on these templates. The versions of the tables displayed below show a breakdown of Rabobank's total balance sheet, the scoping of the financed emissions exercise and the translation to the sector x region combinations for which the bank has set targets within the private sector loan portfolio.
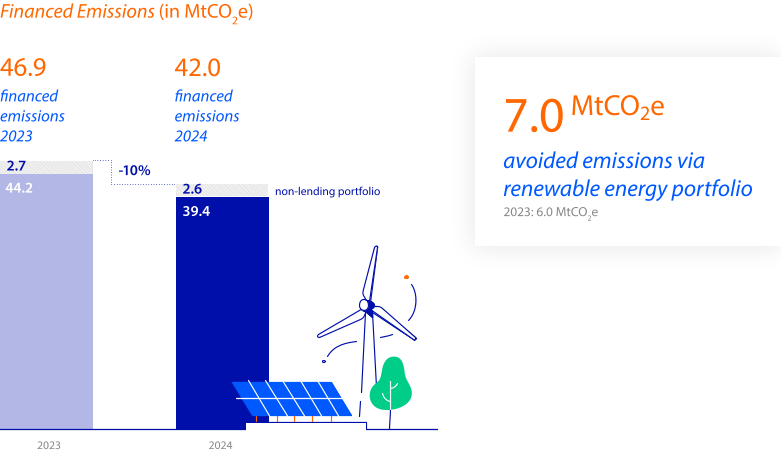

Methodology Financed Emissions Interpretation Pointers
On the commitments we made
Rabobank supports the Paris Climate Agreement’s goals and formalized that support by signing the Dutch Financial Sector Climate Commitment and our membership of the Net-Zero Banking Alliance (2021 - 2025).
Both Commitments share the core belief that the role of banks is not to scrub emissions from their own balance sheets,
but to enable customers to make transitions that will have impact in the real economy.Rabobank shares this belief; we can contribute best to a future- proof food system by actively participating in it,
with customers and other stakeholders, rather than turning away from regions, sectors, that are not yet future-proof.
This applies especially to the Food & Agri sector which we believe has both emissions reduction- and
CO₂ removal-potential.
On the targets we have set
Following the most recent IPCC report (also referred to by NZBA), we commit to a net-zero CO₂ emissions portfolio and “substantially” reduced non-C02 GHG emissions by 2050.
We have set (a) an overarching bank-level target of having our portfolio 1.5-aligned by 2050, expressed in absolute emissions metrics (MTCO₂e) and (b) preliminary targets for 19 sector x region combinations, expressed in emissions intensity metrics (kg CO₂e/kg product).
We have pledged to have “all our operational and attributable GHG emissions from our lending and investment portfolios align with pathways to net-zero by mid-century, or sooner, including CO₂ emissions reaching net-zero at the latest by 2050, consistent with a maximum temperature rise of 1.5°C above pre-industrial levels by 2100”.
On the challenges we face
The majority of our customers emissions are related to Food & Agri sectors, where emissions data and science-based decarbonization pathways are scarce. More than half of these emissions are non-CO₂ emissions, which are impossible to fully abate; there will always be residual emissions from for example livestock activities. The implication is that non-CO₂ emissions will not be net-zero in 2050.
Our absolute emissions target is sensitive to balance sheet fluctuations and therefore does not provide a completely accurate picture of our customers’ GHG reduction performance. The emissions intensity targets we have set for sector x region combinations on the other hand, do not say anything about the total amount of GHG gasses being emitted. The implication is that despite progress on the intensity-based targets our absolute emissions could still increase.
Among the main challenges Rabobank and other banks face is the lack of customer-reported GHG emissions data. Therefore, we have to use proxy indicators (see bullet below) to estimate the majority of client emissions. Over time methodologies will improve, more data will become available and bottom-up (company specific) numbers will replace top-down (sector) estimates. This means that data may need to be restated in future and comparisons over time will be difficult until methodologies and regulations are more settled.
In Rabobank we use the PCAF standard for accounting and disclosing financed emissions. The availability, specificity and accuracy of the data we use to make these calculations varies widely per sector. Therefore, the financed emissions overview presented in this report should be interpreted as our "estimates on a best effort basis", in accordance with PCAF methodology, using the current information and data we have at hand. Where possible, we have used client-reported GHG emissions. PCAF's data quality scores (score 1-5) are used to qualify the level of precision of the estimates we disclose per PCAF asset class. Data with PCAF scores 1/2, (verified and unverified respectively) company-level reported emissions data, represent the highest data quality and results in the most accurate emissions estimates. This is followed by physical activity-based emissions (PCAF score 3), and PCAF scores 4/5, given for an economic activity-based emissions approach. The average data quality score of our in scope portfolio for scope 1 and 2 is 3.6. The average data quality score of our in scope portfolio for scope 3 is 3.8.
According to the NZBA framework, banks’ GHG reduction targets should include customers’ scope 1, 2 & 3 emissions “where relevant and data is available”. There is considerable discussion surrounding the viability of banks disclosing and setting targets for customer scope 3 emissions, due to the enormous variety and complexity of supply chains involved. For Rabobank, customer scope 3 emissions are predominantly an issue in the F&A sector, where we have considerable overlap between scope 3 emissions of Wholesale customers and scope 1 & 2 emissions of our farming customers. We will disclose Wholesale customer scope 3 emissions as they become available, but we will focus our reduction efforts on our farming customers’ scope 1 & 2 emissions, as this is where we have more influence.
Although we are fully committed to fulfil our 2050 climate ambitions, we are dependent on other stakeholders in achieving their goals. This is also acknowledged by the Commitments that state: “We will only succeed if our customers and other stakeholders also play their part.” And, “We make this Commitment with the expectation that governments will follow through on their own commitments to ensure the objectives of the Paris Agreement are met.”
Financed Emissions metrics FY2024
| Scope 1 & 2 | Scope 3 | ||||||||||
|---|---|---|---|---|---|---|---|---|---|---|---|
| Balance sheet line item | Sub-sector for target setting | Outstanding or gross carrying (EUR million year) | Amount in FE scope | Absolute financed emissions (Megaton CO2e) | Economic emission intensity (ton CO2e/EUR 1 mn) | Data quality score PCAF | Coverage rate sector (%) | Absolute financed emissions (Megaton CO2e) | Economic emission intensity (ton CO2e/EUR 1 mn)2 | Data quality score PCAF | Coverage rate sector (%) |
| Cash and balances at central banks | 84,874 | ||||||||||
| Loans and advances to banks | 27,035 | ||||||||||
| Other financial assets | 23,732 | 14,778 | 2.6 | 188.7 | 4.12 | 94% | 1.1 | 140 | 4.0 | 82% | |
| Derivatives | 23,430 | ||||||||||
| Loans and advances to customers | 454,485 | ||||||||||
| Government clients | 1,347 | ||||||||||
| Reverse repurchase transactions and securities borrowing | 15,908 | ||||||||||
| Interest rate hedges and impairments | (12,215) | ||||||||||
| Private Sector Loan Portfolio | 449,745 | 443,636 | 39.4 | 90.4 | 3.55 | 98% | 160.4 | 889 | 3.84 | 100% | |
| Loans to private individuals | 203,129 | ||||||||||
| Of which sole proprietorships (transferred to Dutch Business Customers) | 7,299 | ||||||||||
| Loans to private individuals for FE purposes | 195,830 | 195,830 | 1.2 | 6.4 | 3.4 | 100% | n/a | n/a | n/a | n/a | |
| Of which in sector x region combinations | Residential real estate | 196,014 | 1.2 | 6.4 | 3.4 | 100% | |||||
| Dutch business customers | 71,749 | ||||||||||
| Of which sole proprietorships (transferred from Private individuals) | 7,299 | ||||||||||
| Dutch Business customers for FE purposes | 79,048 | 78,569 | 8.7 | 110 | 4.6 | 100% | 22.1 | 358 | 4.1 | 100% | |
| Of which in sector x region combinations | Horticulture, retail Netherlands | 2,611 | 2.3 | 872 | 5.0 | 100% | 1.2 | 473 | 4.0 | 100% | |
| Pig farming, retail Netherlands | 970 | 0.5 | 541 | 5.0 | 100% | 0.5 | 470 | 4.1 | 100% | ||
| Dairy, retail Netherlands | 9,292 | 2.9 | 309 | 4.4 | 100% | 1.6 | 171 | 3.8 | 100% | ||
| Energy, retail Netherlands | 841 | 0.1 | 127 | 5.0 | 100% | 0.3 | 363 | 4.0 | 100% | ||
| Commercial real estate, retail Netherlands | 18,096 | 0.2 | 11 | 3.5 | 100% | 0.1 | 73 | 4.1 | 100% | ||
| Transport and storage, retail Netherlands | 4,288 | 1.1 | 251 | 5.0 | 100% | 1.6 | 380 | 4.1 | 100% | ||
| Wholesale & Rural | 129,552 | 123,619 | 25.6 | 209 | 3.0 | 99% | 138.3 | 1120 | 3.7 | 100% | |
| Of which in sector x region combinations | Dairy, rural New Zealand | 4,206 | 1.8 | 417 | 4.0 | 100% | 0.7 | 158 | 4.0 | 100% | |
| Dairy, rural Australia | 1,113 | 0.5 | 422 | 3.7 | 100% | 0.2 | 153 | 3.7 | 100% | ||
| Dairy, rural United States | 2,189 | 3.0 | 1,387 | 3.4 | 100% | 0.6 | 272 | 3.4 | 100% | ||
| Beef, rural Australia | 3,667 | 1.3 | 361 | 3.5 | 100% | 0.5 | 131 | 3.5 | 100% | ||
| Beef, rural United States | 1,335 | 2.0 | 1.533 | 3.3 | 100% | 3.8 | 2,843 | 3.3 | 99% | ||
| Beef, rural Brazil | 359 | 1.7 | 4.857 | 3.6 | 100% | 0.2 | 606 | 3.8 | 100% | ||
| Soy, rural Brazil | 3,580 | 0.8 | 221 | 3.6 | 100% | 0.9 | 252 | 4.0 | 100% | ||
| Traded oil and gas | 4,311 | 0.8 | 180 | 2.2 | 100% | 27.9 | 6,478 | 3.3 | 100% | ||
| Energy, wholesale | 2,342 | 0.7 | 298 | 2.5 | 100% | 5.7 | 2,443 | 3.8 | 100% | ||
| Project finance, wholesale | 7,614 | 1.0 | 127 | 2.4 | 100% | 4.0 | 522 | 4.4 | 100% | ||
| Commercial real estate, wholesale | 6,050 | 0.0 | 6 | 3.5 | 82% | 0.1 | 69 | 4.4 | 100% | ||
| Transport and storage , wholesale | 2,037 | 0.2 | 114 | 2.1 | 100% | 0.9 | 457 | 3.8 | 100% | ||
| Leasing international | 47,906 | 45,618 | 3.9 | 101 | 3.8 | 84% | n/a | n/a | n/a | n/a | |
| Of which private sector loan portfolio | 45,306 | ||||||||||
| Of which in sector x region combinations | Tractors | 11,184 | 1.5 | 131 | 3.0 | 100% | |||||
| Transport | 1,752 | 0.5 | 266 | 4.0 | 100% | ||||||
| BPD and Other | 200 | ||||||||||
| Investments in associates and joint ventures | 2,062 | 1,443 | 0.0 | 0.1 | 1.0 | 100% | 0.1 | 83 | 2.0 | 100% | |
| Other assets | 13,635 | ||||||||||
| Total | 629,253 | 459,857 | 42.0 | 93.2 | 3.6 | 98% | 161.7 | 889 | 3.8 | 95% |
Financed Emissions metrics FY2023
| Scope 1 & 2 | Scope 3 | ||||||||||
|---|---|---|---|---|---|---|---|---|---|---|---|
| Balance sheet line item | Sub-sector for target setting | Outstanding or gross carrying (EUR mn year) | Amount in FE scope | Absolute financed emissions (Megaton CO2e) | Economic emission intensity (ton CO2e/EUR 1 mn) | Data quality score PCAF | Coverage rate sector (%) | Absolute financed emissions (Megaton CO2e) | Economic emission intensity (ton CO2e/EUR 1 mn)2 | Data quality score PCAF | Coverage rate sector (%) |
| Cash and balances at central banks | 90,539 | ||||||||||
| Loans and advances to banks | 26,456 | ||||||||||
| Other financial assets | 20,441 | 11,153 | 2.7 | 271.0 | 2.8 | 89% | 0.6 | 120 | 4.0 | 75% | |
| Derivatives | 21,992 | ||||||||||
| Loans and advances to customers | 439,262 | ||||||||||
| Government clients | 1,225 | ||||||||||
| Reverse repurchase transactions and securities borrowing | 15,415 | ||||||||||
| Interest rate hedges and impairments | (14,287) | ||||||||||
| Private Sector Loan Portfolio | 436,910 | 429,510 | 42.6 | 104 | 3.6 | 99% | 163 | 950 | 3.8 | 100% | |
| Loans to private individuals | 202,038 | ||||||||||
| Of which sole proprietorships (transferred to Dutch Business Customers) | 8,204 | ||||||||||
| Loans to private individuals for FE purposes | 193,834 | 193,787 | 1.6 | 8.3 | 3.5 | 100% | n/a | n/a | n/a | n/a | |
| Of which in sector x region combinations | Residential real estate | 193,787 | 193,787 | 1.6 | 8.3 | 3.5 | 100% | n/a | n/a | n/a | n/a |
| Dutch business customers | 69,895 | ||||||||||
| Of which sole proprietorships (transferred from Private individuals) | 8,204 | ||||||||||
| Dutch Business customers for FE purposes | 78,099 | 78,099 | 9.1 | 116 | 4.7 | 100% | 24.4 | 390 | 4.0 | 100% | |
| Of which in sector x region combinations | Horticulture, retail Netherlands | 2,517 | 2.4 | 934 | 5.0 | 100% | 1.3 | 507 | 4.0 | 100% | |
| Pig farming, retail Netherlands | 1,129 | 0.6 | 518 | 5.0 | 100% | 0.6 | 505 | 4.0 | 100% | ||
| Dairy, retail Netherlands | 9,832 | 3.0 | 304 | 4.7 | 100% | 1.7 | 177 | 3.8 | 100% | ||
| Energy, retail Netherlands | 951 | 0.2 | 178 | 5.0 | 100% | 0.3 | 351 | 4.0 | 100% | ||
| Commercial real estate, retail Netherlands | 16,534 | 0.3 | 16 | 3.6 | 100% | 0.1 | 96 | 4.0 | 100% | ||
| Transport and storage, retail Netherlands | 3,978 | 0.9 | 216 | 5.0 | 100% | 1.6 | 399 | 4.0 | 100% | ||
| Wholesale & Rural | 122,639 | 113,324 | 29.7 | 263 | 2.9 | 100% | 138.6 | 1271 | 3.7 | 100% | |
| Of which in sector x region combinations | Dairy, rural New Zealand | 4,479 | 1.7 | 380 | 3.7 | 100% | 0.7 | 166 | 3.7 | 100% | |
| Dairy, rural Australia | 1,077 | 0.5 | 494 | 3.8 | 100% | 0.2 | 184 | 3.8 | 100% | ||
| Dairy, rural United States | 2,703 | 3.0 | 1,101 | 4.0 | 100% | 0.6 | 222 | 4.0 | 100% | ||
| Beef, rural Australia | 3,669 | 1.6 | 444 | 3.9 | 100% | 0.8 | 230 | 3.9 | 100% | ||
| Beef, rural United States | 1,636 | 4.9 | 3,014 | 4.0 | 100% | 6.0 | 3,667 | 4.0 | 100% | ||
| Beef, rural Brazil | 359 | 1.6 | 4,575 | 3.6 | 100% | 0.2 | 451 | 4.0 | 100% | ||
| Soy, rural Brazil | 2,966 | 0.7 | 227 | 3.6 | 100% | 0.9 | 293 | 4.0 | 100% | ||
| Traded oil and gas | 2,897 | 1.1 | 397 | 2.2 | 99% | 25.7 | 8,995 | 3.3 | 99% | ||
| Energy, wholesale | 1,769 | 0.3 | 161 | 1.4 | 100% | 3.1 | 1,727 | 3.4 | 100% | ||
| Project finance, wholesale | 5,119 | 0.2 | 50 | 4.0 | 92% | 1.2 | 249 | 4.0 | 92% | ||
| Commercial real estate, wholesale | 4,792 | 0.0 | 11 | 3.2 | 98% | 0.1 | 61 | 4.0 | 100% | ||
| Transport and storage , wholesale | 1,579 | 0.3 | 175 | 2.5 | 92% | 0.4 | 297 | 3.9 | 92% | ||
| Leasing international for FE Purposes | 44,737 | 44,300 | 3.9 | 94 | 3.7 | 94% | n/a | n/a | n/a | n/a | |
| Of which private sector loan portfolio | 42,237 | ||||||||||
| Of which in sector x region combinations | Tractors | 11,902 | 1.6 | 131 | 3.0 | 100% | n/a | n/a | n/a | n/a | |
| Transport | 1,756 | 0.4 | 249 | 4.2 | 100% | n/a | n/a | n/a | n/a | ||
| BPD and Other | 100 | ||||||||||
| Investments in associates and joint ventures | 1,793 | 1,190 | 0.0 | 0.20,2 | 1.0 | 100% | 0,2 | 200.1 | 5.0 | 100% | |
| Other assets | 13,313 | ||||||||||
| Total | 613,796 | 441,853 | 46.9 | 108 | 3.6 | 99% | 163.9 | 921 | 3.8 | 99% |
Targets Related to Climate Change Mitigation
Wherever possible, we use science-based decarbonization pathways aligned with the 1.5°C warming scenario (such as the pathways provided by IEA, SBTi or CRREM) to help set targets for our sector x region combinations. These decarbonization pathways are based on carbon or GHG emissions budgets: the amount of GHG emissions allocated to a given economic sector in a given region help determine the future rate of decarbonization needed to reach net-zero by 2050. In DLL's own methodology, DLL derived the reduction target based on IEA projections (IEA provides decarbonization pathways aligned with the 1.5°C warming scenario), market developments, and asset-uptake for the portfolio.
In most cases, we use a physical emissions intensity metric as this is, in our view, the better metric to provide an indicator of the real-economy changes to the emissions profile of a given sector. ESRS E1-4 requests the disclosure of absolute targets. However, intensity metrics and targets fit the profile of a bank better, hence we do not have, nor disclose, absolute targets (except for our Dutch F&A portfolio). This approach is in line with ESRS 1 Paragraph 33.
Achieving the sector x region targets mentioned in this report depends on many factors within and outside our direct control. As a bank, we focus on supporting our customers in prioritized sectors to transition to more emission-efficient practices. This transition depends on many factors, including but not limited to governmental policy and technology improvements. Achieving the targets will also require joint efforts together with customers and other stakeholders to support the transition of our customers, as well as governments following through on their own commitments to ensure that the objectives of the Paris Agreement are met.
Our progress on our climate targets in 2025
The table on the next page provides an overview of the near- (2030) and long-term (2050) greenhouse gas reduction targets that we have set for the 19 sector x regions in our portfolio that we have identified as most material from a financed emission perspective.
Table explanation
Rabobank’s sector x region targets are designed to align our lending portfolios with the Paris Agreement, while supporting customers in their transition to a low-carbon economy. The table indicates the relative size (Coverage) of the sector x region, its contribution to our 2024 financed emissions inventory (Absolute financed emissions), the target metric (Metric), the 2020 – unless otherwise indicated - baseline value for that metric (Base year), the science-based decarbonization reference pathway (Scenario/pathway), the near-term goal (Target 2030), the long-term goal (Target 2050) and the most recent performance indicator (Year of reference value). In the table, “0” values indicate that the number is lower than the 0.1. A “n.a.” indicates that we are not currently able to measure a value, or disclose a target (although we continue to measure performance in the relevant US sector x regions, we no longer set GHG emissions reductions targets for those, due to regulatory changes).
2024 Results
In 2024, we were able to calculate target performance measures for 14 of 19 sector x regions (compared to 15 of 19 sector x regions in 2023). For the remaining sectors, we will continue to work on obtaining the required customer and asset data to be able to measure performance. Of the 14 sector x regions, we can currently measure (subject to data and methodological limitations), we consider 11 to be on-track towards their 2030 targets (Horticulture, Pig Farming, Dairy NL, Dairy NZ, Dairy Australia, Beef Australia, Soy Brazil, Energy/ Power Retail NL, Energy/Power Wholesale, Energy/Power Project Finance, DLL Leasing Tractors). For a full overview of sector-related progress, please refer to the sector x region analyses in the appendix.
Cross-Sector Challenges and Forward Priorities
Rabobank recognizes that several challenges are interconnected across regions and sectors:
Data and Technology: Data availability and quality remain critical, particularly for complex supply chains. Expanding granular emissions data and scaling proven technologies are top priorities.
Regulatory and Infrastructure: Regulatory uncertainty—especially around nitrogen and biodiversity, along with grid capacity and infrastructure constraints, pose risks for real estate, transport, and agricultural portfolios.
Systemic Coordination: Achieving sector targets, especially in real estate, depends on stronger collaboration among municipalities, energy providers, construction firms, and policymakers.
Rabobank’s sector x region targets
| Sector | Region | Outstanding (€ mn) | % of in scope portfolio FY24 | Sector coverage (%) | Absolute financed emissions (Mt CO2e) | Base year | Metric | Base year value | Year of reference | Year of reference value | Target 2030 (in value) | Scenario |
|---|---|---|---|---|---|---|---|---|---|---|---|---|
| Horticulture | Retail Netherlands | 2,611 | 1% | 100% | 2.28 | 2020 | Absolute financed emissions | 5.1 | 2024 | 2.28 | 2.2 Mt reduction | DCA (CEG)1 |
| Pig Farming | Retail Netherlands | 970 | 0% | 100% | 0.52 | 2020 | Absolute financed emissions | 0.8 | 2024 | 0.52 | > 0.3 Mt reduction | DCA1 |
| Dairy | Retail Netherlands | 9,292 | 2% | 100% | 2.87 | 2020 | Absolute financed emissions | 4.1 | 2024 | 2.87 | > 0.8 Mt reduction | DCA1 |
| Rural New Zealand | 4,206 | 1% | 100% | 1.75 | 2020 | tCO2e/t | 1.2 | 20232 | 0.80 | 1.053 | SBTi FLAG | |
| Rural Australia | 1,113 | 0% | 100% | 0.47 | 2020 | tCO2e/t | 1.18 | 2024 | 1.01 | 1.053 | SBTi FLAG | |
| Rural United States | 2,189 | 0% | 100% | 3.04 | 2020 | tCO2e/t | 0.87 | 2024 | 1.05 | SBTi FLAG | ||
| Beef | Rural Australia | 3,667 | 1% | 100% | 1.33 | 2020 | tCO2e/t | 25.3 | 2024 | 21.70 | 22.793 | SBTi FLAG |
| Rural United States | 1,335 | 0% | 100% | 2.05 | 2020 | tCO2e/t | 17.3 | 2024 | 19.01 | SBTi FLAG | ||
| Rural Brazil | 359 | 0% | 100% | 1.74 | 2020 | tCO2e/t | 40.66 | 2024 | n.a. | 35.723 | SBTi FLAG | |
| Soy | Rural Brazil | 3,580 | 1% | 100% | 0.79 | 2020 | tCO2e/t | 0.80 | 2024 | 0.60 | 0.393 | SBTi FLAG |
| Residential Real Estate | Netherlands | 196,.014 | 43% | 100% | 1.25 | 2020 | kg CO2/m2 | 26.21 | 2024 | 18.92 | 11.2 | CRREM 2.0 |
| Commercial Real Estate | Retail NL + Wholesale | 24,147 | 5% | 100% | 0.22 | 2020 | kg CO2/m2 | 45.1 | 2024 | 33.76 | 16.8 | CRREM 2.0 |
| Transport | Retail NL + Wholesale | 6,325 | 1% | 100% | 1.31 | 2020 | Mt CO2/billion tkm | 0.03 | 2024 | n.a. | 0.02 | IEA NZE |
| Energy/Power | Retail Netherlands | 841 | 0% | 100% | 0.11 | 2020 | kg CO2/kWh | 0.21 | 2024 | 0.18 | 0.11 | IEA NZE |
| Wholesale | 2,342 | 1% | 100% | 0.70 | 2020 | kg CO2/kWh | 0.0 | 2024 | - | 0.14 | IEA NZE | |
| Project Finance | 7,614 | 2% | 100% | 0.97 | 2020 | kg CO2/kWh | 0.0 | 2024 | - | 0 | IEA NZE | |
| Oil & Gas | Traded Oil & Gas | 4,311 | 1% | 100% | 0.77 | 2022 | USD bn on-balance exposure | 3.9 | 2024 | 3.40 | 3.1 | IEA NZE |
| DLL Leasing | ||||||||||||
| Tractors | International | 11,184 | 2% | 100% | 1.46 | 2020 | tCO2e/asset | 5.9 | 2024 | 5.05 | 5.6 | Own methodology4 |
| Transport | International | 1,752 | 0% | 100% | 0.47 | 2022 | tCO2e/asset | 7.1 | 2024 | 10.59 | 5.7 | Own methodology4 |
- DCA: Dutch Climate Agreement / CEG: Convenant Energytransitie-Glastuin
- Due to data issues, preventing us from using bottom-up client specific data for reporting purposes, we cannot present the 2024 performance.
- Note that the pathway and portfolio intensity numbers are aligned in emissions boundaries, but the values in the SBTi FLAG pathways are derived in a methodologically different way (the FLAG sector-region default value comes from a top-down model, our portfolio intensity value comes from a bottom-up calculator, with carbon footprints calculated based on primary data collected from a subset of our clients). This makes direct comparison difficult.
- The own methodology of DLL has been verified by an external party.
EU Taxonomy
EU Taxonomy Disclosure under Article 8 and Disclosures Delegated Act
The EU Taxonomy is a common classification system for sustainable economic activities allowing financial and non-financial companies to report, based on a common definition, economic activities that can be considered environmentally sustainable.
The EU Taxonomy Regulation sets out the overarching conditions that an economic activity must meet to qualify as environmentally sustainable.
Generally, an economic activity can be qualified as sustainable if it makes a substantial contribution to one of the six environmental goals of the EU Taxonomy, does not do significant harm to the other five and holds to a minimum level of social safeguards to indicate compliance with human and labor rights standards, preventing activities that breach key social principles. The EU Taxonomy has created criteria specific to the economic activities in its scope to evaluate compliance with these overarching conditions. EU Taxonomy alignment can be determined if an activity meets all applicable criteria.
Rabobank annually discloses its green asset ratio (GAR), based on eligible and aligned assets on the balance sheet. Eligibility indicates that an activity is in scope of the EU Taxonomy. Consequently, eligible activities are tested against the economic activity-specific technical screening criteria (TSC) on substantial contribution (SC) and do no significant harm Criteria (DNSH). In addition, the undertaking carrying out the economic activity should comply with the minimum social safeguards (MS). If these criteria are met, the activity can be classified as aligned.
In 2025, in the context of the first Omnibus package, the European Commission presented Commission Delegated Regulation (EU) 2026/73, amending the existing requirements of the EU Taxonomy. For Rabobank’s reporting on 2025, this new delegated act provided three scenarios:
Rabobank may continue to report without applying the amended Article 8 requirements;
Rabobank may apply the amended requirements;
Rabobank may choose not to disclose the detailed reporting templates if it does not claim any activities as being associated with economic activities that qualify as environmentally sustainable under articles 3 and 9 of the Taxonomy Regulation.
Rabobank has opted to disclose information on the EU Taxonomy according to the amended requirements of the new delegated act. In doing so, Rabobank chooses to align with the amended regulation, and take advantage of the option to present more focused disclosures. These amendments affect the detailed templates that Rabobank discloses and changes the calculation of the KPIs related to the Taxonomy Regulation.
Key changes in layout
In this section, we provide information on the key changes applied in this revised layout and the merits of these revisions.
Redesign of key metrics
In a major change from prior year disclosures, the concept of the Green Asset Ratio is revised through the redefinition of the denominator which going forward includes only those items that fall into scope of the evaluation against EU Taxonomy criteria.
Removal of certain templates
From FY2023 Rabobank started reporting on exposures to nuclear and fossil gas sectors in accordance with the complementary climate delegated act (EU 2022/1214), amending Delegated Act EU 2021/2178. Rabobank no longer reports these templates on the basis of the requirements of the new delegated act. Exposures to these activities in preceding reports were immaterial and mainly indirect. Rabobank now only reports in the summarizing fields on these activities in template 2.
In addition, as indicated in the new delegated act, the reporting on Fees and Commission income and Trading Book flow related to the EU Taxonomy has been deferred to 2028 (reporting over FY 2027). At that time, Rabobank will (re-) introduce these if material, as allowed for in the new Delegated Act.
Materiality
The consideration on materiality as presented in the new delegated act may already be applied to certain templates within the reporting framework. A credit institution may omit assessing KPIs when the cumulative value of the net turnover generated by the activities covered by those KPIs is below 10% of total net turnover of the credit institution. The turnover generated by these activities for Rabobank is below this threshold. On this basis, we have opted to exclude specific detailed reporting on Assets under Management and financial guarantees. Rabobank will report these KPIs as non-assessed KPIs.
Rabobank notes that the nature of the assets under management is such that they represent a globally diversified portfolio of underlying investments, covering both corporate holdings and sovereigns and supra-nationals. As a result of this, the relevance of EU Taxonomy criteria on Assets under Management is limited.
Simplification of overall layout
Prior year reporting was split across several columns for each of the 6 objectives defined in the Taxonomy. As of now, a more condensed format has been adopted in accordance with the new delegated act that aggregates the data to fewer columns. This provides a more legible overview of taxonomy eligibility and alignment. Similarly, the number of rows of the template has been condensed to provide a more focused overview of the exposures assessed under the regulation.
Summary of KPIs
In this chapter, Rabobank discloses tables summarizing its GAR and related figures. Additionally, Rabobank provides explanations on the effect of the regulatory changes on the reported figures. The full detailed EU Taxonomy templates can be found in Appendix 5 of this report. In addition to the comparative KPIs as disclosed in 2024, Rabobank has provided a recalculation of the 2024 KPIs according to the requirements of the amended delegated act. Both tables can be found below.
The tables show a summary of Rabobank's EU Taxonomy KPIs. As a credit institution, Rabobank reports several KPIs under the EU Taxonomy, unless deemed non-material:
The Green Asset Ratio (GAR) stock. This KPI shows the alignment of Rabobank’s stock of assets on the balance sheet date.
The GAR flow. This KPI shows the alignment of Rabobank assets that have originated within the reporting year.
The Financial guarantees KPI. This KPI shows the alignment of the stock of off balance financial guarantees held by Rabobank on the balance sheet date.
The assets under management KPI. This KPI shows the alignment of the stock of assets under management of Rabobank on the balance sheet date.
Rabobank reports these KPIs from two perspectives, based on i) the turnover of our counterparties, and ii) the capital expenditures (CapEx) of our counterparties, except for our residential mortgage portfolio, where this distinction does not apply.
Summary of KPIs as disclosed by credit institutions under Taxonomy Regulation (2025)
| in EUR million | Turnover | KPI | CapEx | KPI | % coverage (over total assets) | Non assessed exposures (% of covered assets Turnover-based) | Non assessed exposures (% of covered assets Capex-based) |
|---|---|---|---|---|---|---|---|
| Green asset ratio (GAR) stock | 34,066 | 15.06% | 34,090 | 15.08% | 35% | 0% | 0% |
| GAR (flow) | 5,495 | 13.70% | 5,581 | 13.91% | 0% | 0% | |
| Financial guarantees | 100% | 100% | |||||
| Assets under management | 100% | 100% |
Summary of KPIs as disclosed by credit institutions under Taxonomy Regulation (2024 as disclosed )
| in EUR millions | Turnover | KPI | CapEx | KPI | % coverage (over total assets) | Assets excluded from the numerator of the GAR (article 7 (2) and (3) and section 1.1.2. of Annex V) (%) | Assets excluded from the denominator of the GAR (article 7 (1) and (3) and section 1.2.4. of Annex V) (%) |
|---|---|---|---|---|---|---|---|
| Green asset ratio (GAR) stock | 23,958 | 4.61% | 24,242 | 4.67% | 81% | 38% | 19% |
| GAR (flow) | 3,638 | 3.05% | 3,835 | 3.01% | |||
| Financial guarantees | 0 | 0.08% | 3 | 0.57% | |||
| Assets under management | 422 | 0.87% | 237 | 0.49% |
Summary of KPIs as disclosed by credit institutions under Taxonomy Regulation (2024 according to new delegated act)
| in EUR millions | Turnover | KPI | CapEx | KPI | % coverage (over total assets) | Non assessed exposures (% of covered assets Turnover-based) | Non assessed exposures (% of covered assets CapEx-based) |
|---|---|---|---|---|---|---|---|
| Green asset ratio (GAR) stock | 23,958 | 10.91% | 24,242 | 11.04% | 34% | -% | -% |
| GAR (flow) | 3,638 | 8.82% | 3,835 | 9.30% | -% | -% | |
| Financial guarantees | 0 | 0.08% | 3 | 0.57% | -% | -% | |
| Assets under management | 422 | 0.87% | 237 | 0.49% | -% | -% |
The amendments to the EU Taxonomy requirements have further effects on the disclosed KPIs. Most notably, while the amount of aligned assets remains constant, the KPIs themselves have increased in the like-for-like comparison between the KPIs disclosed in the 2024 annual report and the amended table. This is caused by adjustments to the denominator of the GAR. Specifically, assets that cannot become Taxonomy aligned have been excluded from the denominator. In the prior year table these assets were listed as assets excluded from the numerator of the GAR (article 7 (2) and (3) and section 1.1.2. of Annex V). Specifically this concerns:
Financial assets held for trading
On-demand interbank loans
Exposures to undertakings that are not obliged to publish non-financial information pursuant to Article 19a or 29a of Directive 2013/34/EU (exposures to non-CSRD counterparties)
Derivatives
Cash and cash-related assets
Other categories of assets (such as goodwill)
This change has a significant impact on Rabobank's GAR, as Rabobank has large exposures to non-CSRD counterparties, both SMEs and non-EU counterparties. (EUR 217 billion in 2024 reporting) Rabobank's reported GAR stock for FY2024 was around 4.6% from both the turnover and capex perspectives. As a result of the amended requirements, the GAR for 2024 is 10.9% for turnover and 11.0% for CapEx.
The impact on the GAR flow of this amendment is slightly smaller, with the flow KPI moving from 3,1% to 8,8% for turnover and from 3,0% to 9,3% on CapEx. This difference is caused by the impact of reverse repurchase loans. During the 2024 reporting cycle it was not possible for Rabobank to make a granular determination of the impact of these positions at counterparty level. The full position was included in the financial counterparties field of template 1. For 2025 this position is divided between CSRD counterparties (included in the denominator) and non-CSRD counterparties (non-covered assets). As these positions usually mature very quickly, the balance at year-end will be almost fully included in the flow template as well. This dampens the effect of the reduction in the denominator.
For FY2025 Rabobank's GAR stock is 15.0% for turnover and 15.1% for CapEx. Rabobank’s GAR stock and the increase compared to 2024, taking into account the new delegated act, are mainly driven by the residential mortgage portfolio. Key drivers of this increase in aligned assets are a high rate of inflow of new mortgages and a significant uptake on efforts to improve energy efficiency and label availability for customers with an existing mortgage. In this chapter Rabobank further explains how the eligible and aligned assets of the bank are determined and have developed in 2025.
Rabobank performs the EU Taxonomy assessment with the scope of the full consolidated statement of financial position for Rabobank. The composition of Rabobank’s portfolio has remained stable in 2024, with no significant changes to the relevant ratios for the EU Taxonomy. Results are disclosed using gross carrying amounts based on regulatory reporting data. The use of gross carrying amounts is required under the EU Taxonomy. In the financial statements, net amounts are presented which reconcile on an underlying basis with the tables above and those in the Annex.
Developments in EU Taxonomy Eligibility
The eligibility of Rabobank’s portfolio in 2025 follows a similar pattern to the eligibility reported in the 2024 annual report. The residential mortgage portfolio is the largest source of eligible assets. Business lending only accounts for a small fraction.
The residential mortgage portfolio is eligible by definition under the EU Taxonomy as it reflects real estate activities, for which TSC are available. For the business lending portfolio eligibility is dependent on the underlying customer's economic activities. For these customers, Rabobank based its assessment on the eligibility disclosures in their respective annual reports. This covers the regulatory requirement for financial undertakings to report on their customers EU Taxonomy eligibility based on actual information.
The eligibility of Rabobank’s business lending portfolio is limited in 2025. Out of EUR 313 billion of business lending assets, EUR 22 billion falls under covered assets and qualifies for further assessment on eligibility and alignment. This amount was reduced due to the new delegated act, as financial corporation counterparties are now split between covered and non-covered assets, in line with non-financial corporates. Currently, EUR 5.6 billion of this portfolio is eligible. This EUR 5.6 billion is contained within the Wholesale portfolio of the bank. A number of reasons for the limited portion of assets that are eligible can be identified:
A significant portion of the exposures are to corporate customers that do not reside in the EU. These customers are not subject to EU Taxonomy reporting requirements.
A further portion of the exposures within the EU are not to entities that are required to report under the CSRD. The EU Taxonomy implies direct reporting obligations only for the large public interest EU companies with over 1000 employees, which is a relatively small portion of Rabobank’s business lending portfolio. While this further decreases the scope of the Taxonomy, it does not impact reporting on Rabobank’s portfolio for the current year. It may further limit available reports in the following years.
As a final point, it is noted that currently, a large portion of the exposures is to counterparties whose economic activities are not yet described in the EU Taxonomy. For example, Rabobank has a significant portfolio in the agricultural sector, for which no screening criteria are described. Due to this, these sectors are also not eligible under the EU Taxonomy.
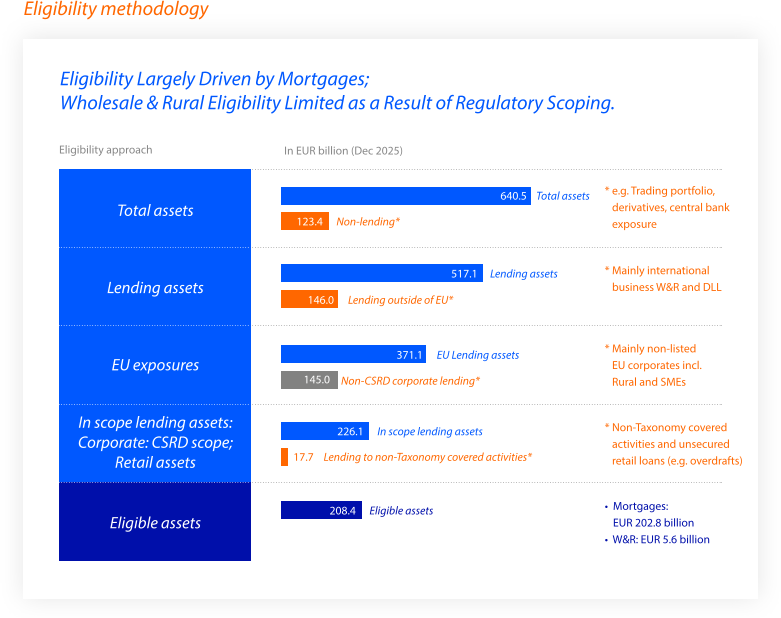
EU Taxonomy Alignment of Our Portfolio
Methodology on Alignment of Our Residential Mortgage Portfolio
The largest eligible portfolio on Rabobank’s balance sheet is the residential mortgage portfolio. As Rabobank’s counterparties (i.e. private individuals) have no obligation to report on their EU Taxonomy alignment, Rabobank is required to perform its own assessment of this portfolio. This section elaborates on Rabobank’s methodology to determine EU Taxonomy alignment of the residential mortgage portfolio under economic activity 7.7, acquisition and ownership of real estate, for the environmental objective of climate change mitigation. Rabobank has reviewed the draft Commission Notice on interpretation and implementation of provision of the Disclosures Delegated Act issued by the European Commission (17 December 2025) and incorporated conclusions drawn therein. This does not lead to material change in approach and does not have a significant impact on the KPIs reported by Rabobank.
Substantial contribution
The substantial contribution for the mortgage portfolio is determined based on the energy efficiency of the building. The threshold level of energy efficiency is further dependent on the year in which a permit for the building was applied for, as this threshold changed as of December 31, 2020.
Rabobank currently does not possess data on building permits and thus uses the building year for this indicator. Rabobank is comfortable with this choice as the actual building year falls after the permit is granted. With this approach, a potential overstatement of the GAR is prevented.
For buildings built before December 31, 2020, Rabobank includes all buildings with a definitive EPC Label of A as prescribed in the requirements for substantial contribution to the climate change mitigation objective.
For buildings built after December 31, 2020, the EU Taxonomy imposes a stricter energy performance threshold. The building should have a primary energy demand (PED) of at least 10% lower than the norm for near-zero energy buildings (NZEB).
Do no significant Harm (DNSH)
To determine adherence to the DNSH criteria, it is required to perform a physical climate risk assessment. Rabobank has screened the residential mortgage portfolio in the Netherlands to identify which physical climate risks may affect the portfolio during its lifetime. For purposes of the physical climate risk assessment, the expected lifetime is capped at 30 years, since no accurate climate projections for the relevant physical climate risks beyond 30 years are currently available.
Where a risk applies to the Dutch residential real estate sector based on the screening exercise, a further climate risk and vulnerability assessment is performed to assess the materiality of the physical climate risks on the economic activity.
Rabobank has performed climate risk screening and has evaluated hazards based on spatial occurrence and their potential impact on mortgage assets. Based on this screening, Rabobank has concluded that the risks in scope for materiality analysis are as included in the table below. In this table an explanation is also included pertaining to the further analysis of the portfolio based on these risks. The materiality threshold is derived from a scientific literature review, data availability, and internal expert judgment. It represents a combination of a severity from an event with potential to damage a building and a relevant probability of that event occurring within the next 30 years.
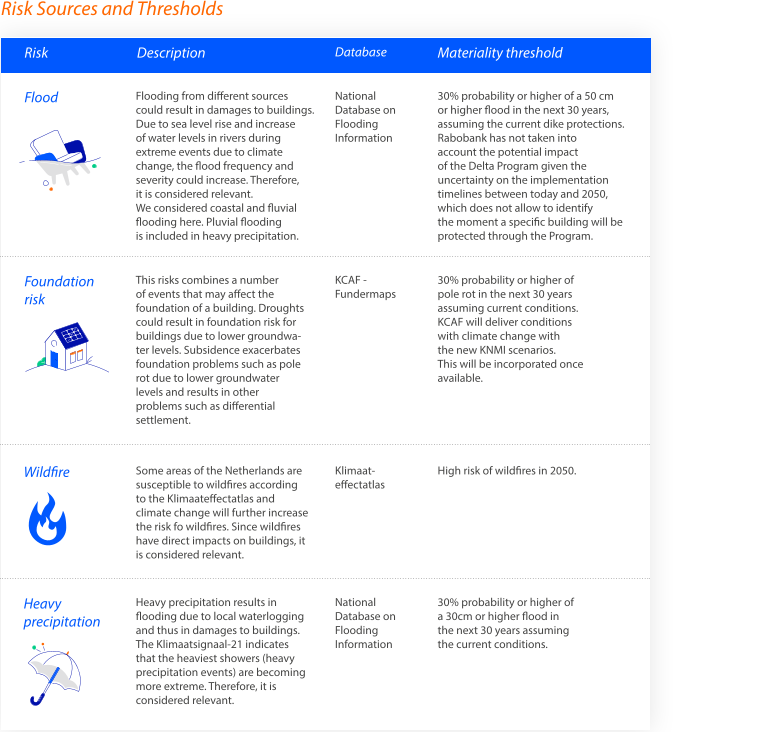
Within the datasets used, government-level adaptation solutions have been applied to reduce the risk of the underlying event. For example, the dataset on flooding includes the Dutch dike infrastructure as a mitigating factor. Rabobank does not consider government-level adaptation solutions if they are part of a plan or policy that has not yet been materialized. Due to data limitations, Rabobank currently has not included the effect of potential building-level adaptation solutions that can reduce the identified physical climate risk.
Minimum Social Safeguards
In November 2024, the European Commission finalized its commission notice on the interpretation and implementation of the disclosures delegated act. In this notice, draft guidance from December 2023 was made final. This notice provides a set of questions and answers on topics related to the EU Taxonomy interpretation, among which is the application of the minimum social safeguards (MS) to retail customers.
Rabobank has taken note of this guidance and updated its interpretation and implementation of the EU Taxonomy accordingly. The commission states that while the MS need not be verified for private individuals, it is required to assess the MS for providers of services and goods related to the financing provided. Rabobank interprets this guidance to not apply to economic activity 7.7, the acquisition and ownership of real estate, as this concerns existing real estate, where private individuals perform the economic activity and no providers of goods or services are involved, as these are existing buildings.
The results of our evaluation of the alignment of our mortgage portfolio is as follows:
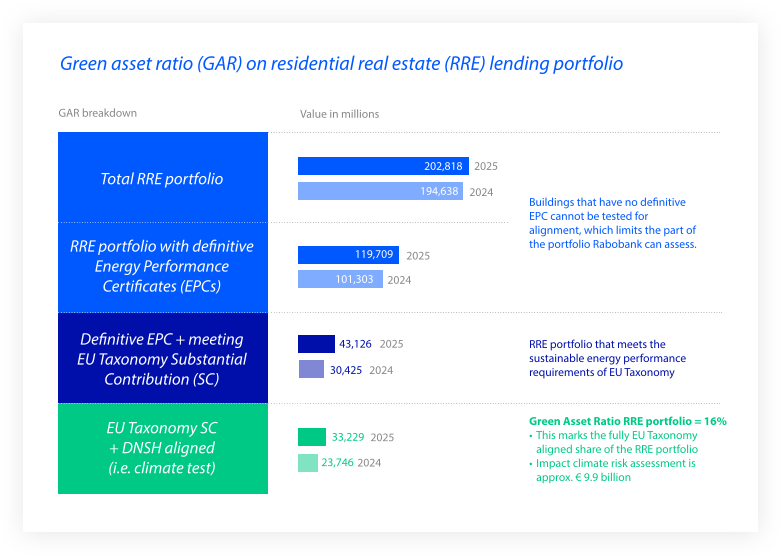
Outlook and Challenges
There are a number of challenges and limitations to determining the alignment of Rabobank’s mortgage portfolio:
For a substantial number of properties in Rabobank’s portfolio there is no sufficient basis to evaluate the substantial contribution criteria for the objective of climate change mitigation. The EU Taxonomy substantial contribution criteria for activity 7.7 pertain to the energy performance of buildings. Evidencing of these criteria relies on definitive EPCs. This poses limitations to determine EU Taxonomy alignment of those buildings, considering a large part of the Dutch residential real estate stock does not have a valid EPC. As a consequence of higher energy prices and a general market sentiment towards a more sustainable future, there is a considerable trend to improve the energy efficiency in the Dutch housing market. However, these energy-efficiency improvements will only be visible to Rabobank when the home owners apply for an updated EPC.
Rabobank is offering incentives for customers to improve the energy efficiency of their homes and allows them to obtain a new EPC label for free. Furthermore, there are several sustainability initiatives that Rabobank may undertake in its residential mortgage portfolio that are not likely to become aligned for EU Taxonomy purposes. These initiatives can, however, make a contribution to improving the sustainability performance of the Dutch housing stock.
For example, the Cooperative Insulation Budget. Under this initiative Rabobank mortgage customers who met the eligibility criteria received an advice on their options for increasing the energy-efficiency of their homes, a maximum of EUR 500 contribution to insulate their home and an updated energy label, increasing the availability of definitive labels for the portfolio. In 2025, Obvion launched a similar insulation initiative under the name 'Energiebespaarpakket', which focuses on helping customers with label F and G transition to a more sustainable home, further expanding this initiative in 2026.
In addition to the impact of our efforts to facilitate customers improving the energy performance of their housing and choices in origination, Rabobank continued to incrementally improve its data sourcing strategy and interpretations to enhance insights on Taxonomy aligned assets. Such efforts do not translate into step changes but incrementally contribute to a longer-term perspective.
Rabobank is dependent on the availability of data on climate events to perform risk analysis. The availability of this data has limitations. For instance, projection data for 2050 for heavy precipitation and foundation risk are not available currently. There is also no data on building-level adaptation measures. Rabobank expects data improvements that will enhance the accuracy of its climate-risk capabilities over the coming years.
Rabobank will strive to further improve its climate-risk assessment, incorporating new iterations of data sources as they become available.
Methodology and description on alignment in business lending
The alignment of Rabobank’s portfolio outside of residential mortgages is limited. To assess alignment of its corporate customers Rabobank has to rely on direct disclosures by its customers. Our non-financial counterparties have disclosed their alignment in terms of capital expenditures (CapEX), operational expenditures and turnover. As a financial institution Rabobank is to report its Taxonomy KPIs based on the turnover and capital expenditures KPIs of its customers. The turnover KPI shows the alignment level of the economic activities that a customers generates revenue with, while the CapEx KPI shows the alignment level of the investments made by customers.
Nuclear and Gas
As a result of the Delegated Act amending the EU Taxonomy and the subsequent Commission Notice as regards economic activities in certain energy sectors, additional disclosure requirements were introduced with respect to nuclear energy and fossil gas. This requires financial institutions to include indicators of involvement with the relevant sectors and eligible exposures in a set of mandatory templates. Under the amended delegated act, a summarized disclosure on these activities can now be found summarized in template 2.
For the customers in scope of the mandatory disclosure, we have evaluated exposures to the nuclear energy and fossil gas sectors on the basis of their EU Taxonomy disclosures. Rabobank notes that the main driver for the GCA balance in template 2 results from financial institution counterparties. The disclosures by these customers reflect their portfolio and thus often include exposures to either fossil gas or nuclear energy related activities.
Trading Portfolio
Under the current status of the EU Taxonomy Regulation, Rabobank is not required to disclose quantitative information on the trading portfolio. Based on regulatory reporting, the main components of the Rabobank trading portfolio are derivatives and debt securities held with central government counterparties. As such, the trading portfolio is not materially in scope for alignment assessment under the EU Taxonomy.
Outlook
Over the coming year, Rabobank will continue to work towards improving the disclosure of EU Taxonomy alignment of its portfolio. This will entail improving data quality and availability to overcome the limitations noted above and to acquire further data required to determine the alignment of eligible customers.
Stimulating sustainable living remains a key part of Rabobank’s strategy concerning the energy transition. Rabobank does so by offering knowledge and financing opportunities that will help its customers in the transition to more sustainable homes. This strategy correlates directly with increasing the EU Taxonomy alignment of the mortgage portfolio.
Nature
The resilience of food systems, clean water and sustainable livelihoods depends on healthy ecosystems, making nature integral to the long‑term resilience of our customers and our portfolio. Accordingly, we support the Kunming‑Montreal Global Biodiversity Framework (GBF) vision for 2050. For Rabobank, this means balancing food and energy within planetary boundaries. By 2030, we aim to embed nature into core banking and governance and align our portfolio and policies with GBF 2030 targets. By addressing nature-related impacts, risks and opportunities we aim to increase the resilience of our customers. Our full nature vision and approach is available here.
At Rabobank, we follow IPBES drivers as an approach to overall materiality of nature related themes. As such, we focus on drivers of ecosystem degradation and biodiversity loss. Based on our double materiality assessment, we currently focus on three interdependent and connected topics: pollution, water, and land use (including soil/land degradation, deforestation and land use change/conversion which are elaborated on in the sections below). Our bank-wide approach addressing the aforementioned topics, consists of four interdepended steps that we have elaborated upon in the Sustainability Embedded in our Strategy-section.
When working on our objectives, we include nature in our steering and decision making and use the Mitigation Hierarchy (a commonly used framework to reduce and manage negative impacts on nature) as our guide.
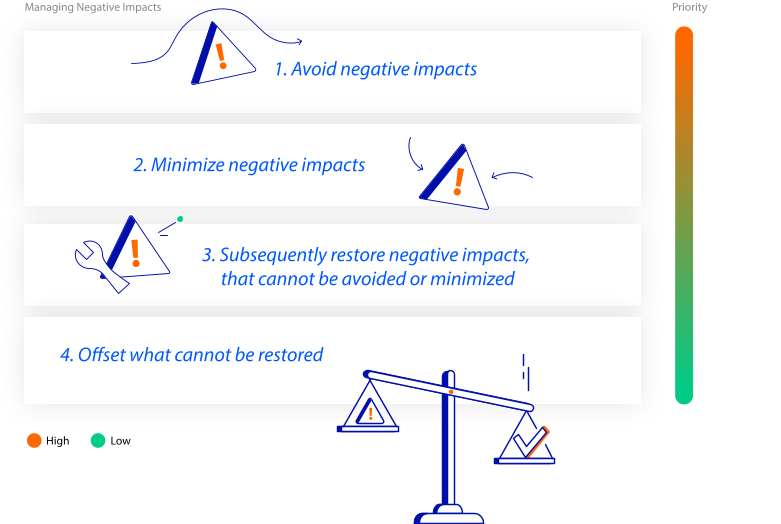
Nature efforts
Our initial set of Nature efforts, disclosed for the first time in our 2023 Annual Report (page 81), focused on building awareness, strengthening governance, and integrating nature considerations into risk management and customer engagement. By the end of 2025, the majority of these efforts have been achieved. Progress includes strengthened governance and accountability, and enhanced internal knowledge on the topic of nature through bank-wide training programs and recurring senior management sessions. In addition, we advanced key enablers for nature risk and impact management, including expanded portfolio insights (e.g., dependency assessments and heatmaps) and improved availability of geospatial/collateral data for rural customers. One aim was partially achieved: the sustainability scoring of Dutch dairy customers is predominantly based on Biodiversity Monitor data, while data from the Open Soil Index (OBI) has not yet been fully connected.
Looking ahead, we have updated our nature efforts for the period 2026–2027. These new efforts are structured under our three levers: Customer, System, and Portfolio. While the focus of our efforts remains consistent, embedding nature into our core business and processes, the updated efforts place greater emphasis on practical support for customers, measurable outcomes, and collaboration. For example, through our efforts to finance sustainable transitions in the food and agriculture sector, supporting Dutch farmers in adopting agroforestry practices, and further developing tools and frameworks that help us and our customers understand and manage nature-related risks and opportunities. The updated efforts can be found in the table below.
Customer | Portfolio | System |
|---|---|---|
| 1. Further include nature in our business transition plans and engage with our customers to help them with sustainable finance solutions | 4. Further enhance ESG risk analytics to identify and quantify nature related risk for integration into risk management | 7. We aim to contribute to systemic change through strategic networks & partnerships, championing the nature agenda to create long-term resilience for customers |
| 2. Finance the sustainability transition of our Dutch F&A customers (focus on customers in livestock) with €3bn between 2023 till 2030 | 5. Implement a Green Loan Framework addressing nature-related objectives | 8. We aim to set up a public-private foundation and deliver implementation frameworks to start applying True Value Language |
| 3. Support Dutch farmers towards agroforestry systems, contributing to the Dutch national 25,000 ha in 2030 agroforestry goal | 6. Further enhance nature metrics and data to provide insights that support our customers | 9. Further enhance knowledge & awareness on the topic of Nature i.e. by roll out of bank wide nature trainings and senior management sessions. |
Impact & dependency analysis
We performed a top-down, modelled nature footprint analysis for the majority of Rabobank’s private sector loan portfolio of December 2022, which represents 63% of Rabobank’s total assets. We applied the BioScope biodiversity impact tool, which uses Exiobase, a multi-regional input-output model, combined with ReCiPe, which converts various drivers such as resource exploitation and emissions into biodiversity footprints. BioScope is an internally recognized and widely used tool to identify the most important impacts on biodiversity associated with businesses and financial products. Outcomes show that most of the impact of our private loan portfolio on nature is due to the effect of land use. The analysis also indicated that most of Rabobank’s customers’ impact on nature occurs at farm level in the Animal Protein, Grains & Oilseeds and Dairy sectors. Additionally, we performed a dependency analysis (based on 2022 figures, using ENCORE), which also covers 63% of our total assets. From this update, we have learned that approximately 85% of the covered assets is ‘highly’ to ‘very highly’ dependent on one or more ecosystem services. Water availability, soil quality and climate regulation are among the ecosystem services we are most dependent on.
Based on our impact and dependency analysis, we have on-boarded the topic of nature in 12 sector x region plans in 2025. These are specific implementation plans developed to achieve relevant sustainability targets and manage sustainability impacts, risks and opportunities for the particular sector x region combinations. This sector x region level based approach is integrated in our business strategy and financial planning (please refer to the Material Impacts, Risks and Opportunities and Their Interaction With Strategy and Business Model for more detail).
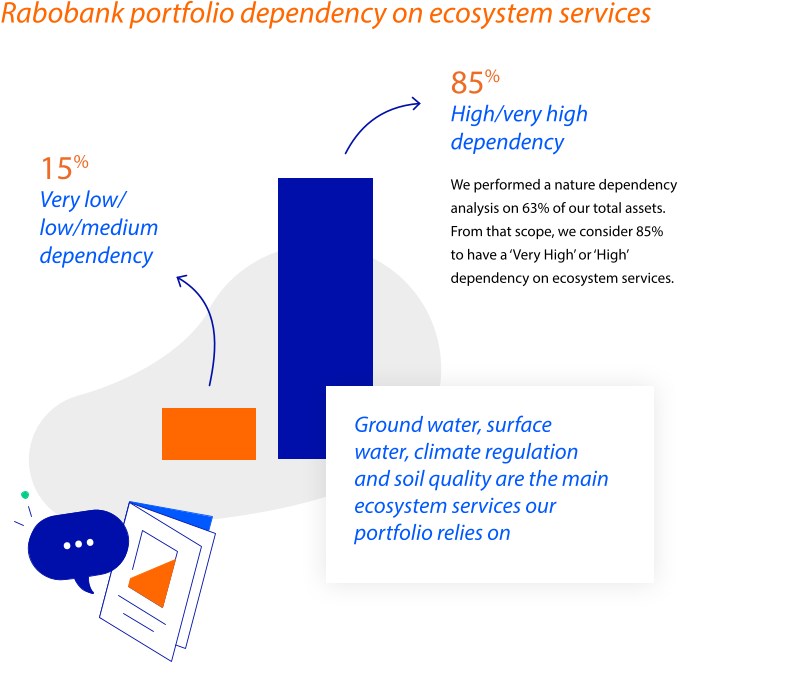
Pollution

Pollution is a key driver of biodiversity loss and ecosystem degradation, affecting soil health, water quality and the functioning of ecosystems. For Rabobank, this topic is material due to our exposure to Food & Agriculture sectors, particularly in the Netherlands, where nutrient surpluses — notably nitrogen — exert pressure on ecosystems and protected areas. In addition, we also keep working on Impact, Risk and Opportunity management for other pollution related topics, including crop protection. Our ambition aligns with the Kunming‑Montreal Global Biodiversity Framework (GBF), particularly Target 7.
Impact, Risk and Opportunity Management
Description of the processes to identify and assess material pollution-related impacts, risks and opportunities
Pollution negatively impacts biodiversity by contaminating ecosystems, and disrupting ecological processes. Addressing pollution is crucial to maintain healthy ecosystems and preserve biodiversity. As part of our double materiality assessment, we identified the following material pollution-related impacts and risks within our downstream value chain.
Impact
We considered the pressures on nature, response on nature and state of nature, to assess our impact. For pressures on nature, we considered human activities that directly or indirectly change the state of nature, through land use (change), water use and pollution. Actions taken by stakeholders to reduce pressures and to improve the state of nature are considered to identify the response on nature. The state of nature refers to the ecosystem’s health in a specific location resulting from reduced or increased pressures and responses on nature. We performed a top-down, modelled nature footprint analysis, that we elaborated on in the first part of the Nature-section.
We assessed our negative impact on pollution to be material. We have a negative impact on pollution due to the financing of the production of fertilizers and facilitating the availability and use of them, affecting an adverse impact on nature in the Netherlands, and due to the financing of the Food & Agri sectors in the Netherlands, and thereby indirectly contributing to excess nutrients, in particular nitrogen. This can have an adverse impact on nature in the Netherlands.
We have also identified the potential positive impact on pollution to be material, due to our Vision for agrifood 2040, affecting the better protection of nature as our Dutch customers in agriculture and horticulture are supported in strategic choices toward future-proof business models.
Risk
Exposures in the Dutch livestock Dairy and Animal Protein (Pork, Poultry, and Beef) sectors, are considered vulnerable due to nitrogen uncertainty. Using heatmap analysis, a bottom-up scenario analysis was employed, focusing on financial strength and sustainability. This analysis provides insights into the necessary transitions, the potential increased risks from nitrogen-related requests, and the financial capacity of customers to make these transitions. These insights lead to sector and portfolio specific additional provisioning through a management adjustment.
From a financial (credit) risk perspective, we have identified the risk of loan impairment charges due to pollution-related environmental degradation, such as air and water contamination, soil degradation, and bioaccumulation of toxins, caused by customers driving biodiversity loss and ecosystem health decline affecting their ability to repay their loans. Stricter regulations and uncertainty can also result in additional costs and impact the current business model. Most notable example is nitrogen for dairy, veal and pig farming. From a financial (business) risk perspective, we have identified the risk of losses due to pollution caused by customers driving biodiversity loss and ecosystem health decline affecting the competitive environment, e.g., decreasing volumes, (commercial) margins, fees, commission, other income, or increasing (operating) costs.
Policies related to pollution
Specifically for pollution’s sub-topic, nitrogen in the Dutch Food & Agri (F&A) sector, the policy "Beleid en Instructie Stikstof Veehouderij" (Policy and Instruction Nitrogen Livestock Farming) effective until November 10, 2025 applied. This policy outlines Rabobank’s approach to financing applications in the livestock sector, particularly concerning nitrogen emissions. The policy applies to various livestock sectors in the Netherlands, including cattle, calves, and goats. Specific criteria (e.g. proximity to Natura 2000 areas) and exemptions (e.g., existing nitrogen permits) are detailed. The policy's key components include:
Assessment of applications to ensure they contribute to the sustainability and profitability of the livestock sector. The necessity and urgency of the financing, including nitrogen-reduction strategies, are part of this assessment.
Review of certain financing requests (especially those involving significant expansion) by the Engagement Committee for Nitrogen (ECV). This committee ensures uniform decision-making and monitors the impact of the financing on nitrogen emissions.
Decision-making based on an analysis of the environmental impact and the financial stability of the applicant. The ECV meets weekly to review applications and make strategic decisions.
The policy “Nieuw Beleid en Instructie Natuurvergunningen” (New Policy and Instruction Nature permits) applies as per November 10, 2025. This applies to livestock sectors specifically and all sectors if the investment goal is new construction or renovation. The policy relates to customers who have to deal with Natura 2000 area permits.
The Global Standard on Sustainability Acceptance and Performance addresses our material impacts related to pollution, mainly via the Nature Policy. This policy section describes how we monitor the performance of our customers and business partners. More specifically, we do not accept customers or business partners that: “cause or intentionally contribute to a reduction in the population of endangered species (on the IUCN Red List of threatened species)”; which could be a result of polluting activities.
At activity level, we do not accept pollution-related activities:
Production of, or trade in, products containing Polychlorinated Biphenyls (PCBs) or other Persistent Organic Pollutants (POPs) that are subject to international bans or phase outs as listed by the Stockholm Convention;
Production of, or trade in, Ozone Depleting Substances (ODS) that are subject to international bans or phase outs as listed with reduction targets and phase out dates by the Montreal Protocol.
With regard to Performance monitoring, we can request supporting information on our accepted customers’ and business partners’ controls and progress that demonstrate they are aware of the key environmental impacts at their production/operational sites, by having an environmental plan addressing these impacts, e.g., land use change, water, soil, agrochemicals, pollution.
Furthermore, we also have a sector policy addressed at Agrochemical producers, specifically directed at ‘synthetic crop protection’. In this policy, we do not accept customers that do not have transition plans to phase out Highly Hazardous Chemicals.
Actions and resources in relation to pollution
Nature, including the topic of pollution, is being integrated into the strategic steering cycle of the bank step by step. Please refer to the Material Impacts, Risks and Opportunities and their Interaction with Strategy and Business Model for more detail.
Specifically for the sub-topic of nitrogen in the Netherlands, Rabobank established financing propositions with a budget of EUR 3 billion (available until 2030) to support farmers in their strategic choices towards a more future-proof business model (or a combination thereof): extensive farming, innovation, relocation, conversion, or cessation. In our Vision for agri-food 2040 , we envision a Dutch agricultural sector that has progressed its transition to producing food more sustainably by 2040. This overall vision is being translated into sector-specific visions, which in turn are translated into the relevant policies. Ecologic, economic, and environmental (including Natura 2000 area proximity) elements are included in our underwriting criteria.
Our actions and resources to manage our material impacts and risks related to the sub-topic of nitrogen in the Netherlands are visible in the following areas:
Financing: by year-end 2024, we provided EUR 452 million financing supporting transition pathways. By year-end 2025, this amount increased to EUR 1,206 million. Most of our financing flowed towards the extensification of farming pathway (84%). Pathways related to broadening the business model, innovation and relocation represent 6%, 9% and 1% of financing respectively.
We use various indicators linked to nitrogen (soil nitrogen surplus and ammonia (NH3) emissions) to benchmark customers in the Dutch dairy sector. We do this for the majority of Dutch dairy customers (>EUR 1 million).
The broader topic of pollution is included in our group-wide nature approach. To this end, Rabobank’s dedicated nature team works closely with Finance, Risk, and RaboResearch’s Sustainability & Data Analytics team in areas such as impact and dependency analyses, metric development, and onboarding sustainability in business-as-usual processes, while also collaborating with commercial business lines.
The actions, as referred to within this section, through which we manage pollution, are on-boarded in our business-as-usual processes and activities. The expected outcomes and time horizons of our actions cannot always be disclosed at this point in time.
Metrics and Targets
Targets related to pollution
At present, Rabobank has no time-bound and outcome-oriented targets and results in place for pollution. We are in the process of identifying suitable metrics. For more information on the nature approach's effort targets and the progress we made to track the effectiveness of our policies and actions, please refer to the table in the introduction of this nature section.
Water

Water is essential for ecosystem health, food production, and plays a critical role in sustaining biodiversity. For Rabobank, water is a material topic due to our significant financing activities in Food & Agriculture and other water‑dependent sectors, particularly in regions facing increasing water stress. Water use and availability can affect both freshwater ecosystems and the resilience of food systems and livelihoods. Our ambition aligns with the Kunming‑Montreal Global Biodiversity Framework (GBF), notably Targets 2 and 11, which focus on restoring freshwater ecosystems and maintaining ecosystem services.
Impact, Risk and Opportunity Management
Description of the processes to identify and assess material water-related impacts, risks and opportunities
Water is essential for all life on earth. It sustains ecosystems, supports human health, and influences biodiversity. Simultaneously, human actions and climate change are disrupting natural water cycles, putting freshwater ecosystems under increasing pressure. As part of our double materiality assessment, we identified the following material water-related impact within our downstream value chain.
Impact
We considered the pressures on nature, response on nature and state of nature, to assess our impact. For pressures on nature we considered human activities that directly or indirectly change the state of nature, through land use (change), water use and pollution. Actions taken by stakeholders to reduce pressures and to improve the state of nature are considered to identify the response on nature. The state of nature refers to the ecosystem’s health in a specific location resulting from reduced or increased pressures and responses on nature. We performed a top-down, modelled nature footprint analysis, that we elaborated on in the start of the Nature-section.
The negative impact on water availability, due to financing of and financial service provisioning to Rabobank's customers in the Food & Agri and industrial sector which facilitates the withdrawal and consumption of water (water use), leading to an adverse impact on nature through worsening water scarcity in countries like the Netherlands, USA and Australia.
Based on our double materiality assessment, this topic is no longer deemed material from a risk perspective. Water-usage risk is captured under climate change adaptation.
Policies related to water
In our Global Standard on Sustainability Acceptance and Performance our Nature Policy is the main policy on the material impacts, risk and opportunities related to water. In this policy, we mention that we can collect supporting information of customers and business partners demonstrating that they: “are aware of the key environmental impacts at their production/operational sites, by having an environmental plan addressing these impacts, e.g., land use change, water, soil, agrochemicals, and pollution.” However, no specific water-related acceptance requirements are included in the Nature Policy.
Actions and resources related to water
Nature, including the topic of water, is being integrated into the strategic steering cycle of the bank step by step. Please refer to the Material Impacts, Risks and Opportunities and their Interaction with Strategy and Business Model for more detail.
Rabobank’s Sustainability department includes a dedicated Nature team that collaborates closely with Finance, Risk, and RaboResearch’s Sustainability & Data Analytics teams. Key areas of focus include impact and dependency analyses on the topic of water, development of sustainability metrics, and integrating sustainability into core business processes. The team also works in partnership with commercial business lines and the Rabobank Water Team, which was established during 2025.
In 2025, Rabobank launched its Water Vision 2030, recognizing water as a vital resource. Our Water Vision 2030 supports the EU Water Framework Directive, which provides the legal foundation for protecting and restoring Europe’s waters, and the European Water Resilience Strategy, which calls for a systemic shift towards water-smart economies and resilient ecosystems. The Water Vision is led by a dedicated Rabobank Water Team and supported by a broader ‘Water Squad’ to ensure effective implementation.
Actions include:
Through cooperative initiatives, Rabobank currently allocates EUR 15 million directly and indirectly in water-related solutions, aiming to increase this in the future of which EUR 10 million via our subsidiary BPD to invest in grey water systems and EUR 5 million through the Rabobank Water team.
Investing in knowledge, through a partnership with Wetsus, a European Water Technology Institute, where we continue to build on our water knowledge.
We support the WaterBank, a Dutch Cooperative initiative, which gives residual water a second life.
With these initiatives, we are helping customers reduce their water footprint and build resilience. In addition we:
Assess the freshwater use of our larger (exposure > EUR 1 million) business customers in its sustainability assessment tools. The Relationship Manager (the assessor) engages with the customer and for such customers that are active in water stressed regions, this engagement is part of the risk assessment. This is part of the performance criteria of our Nature policy.
Will launch a bank-wide training on the topic of fresh water. The training provides participants with a basic understanding of the Impacts, Risks and Opportunities around fresh water. This module will be fully available in Q1 2026.
The actions, as referred to within this section, through which we manage water, are on-boarded in our business-as-usual processes and activities. The expected outcomes and time horizons of our actions cannot always be disclosed at this point in time.
Metrics and Targets
Targets related to water
At present, Rabobank has no time-bound and outcome-oriented targets and results in place for water. For more information on the nature approach's effort targets and the progress we made to track the effectiveness of our policies and actions, please refer to the table in the introduction of this nature section.
Land Use

Land use is a broad topic covering land use change (e.g. deforestation and land conversion of natural ecosystems), land and soil degradation, land management practices, with potential impacts on biodiversity and climate regulation and sensitive locations, such as Protected Areas. It is considered a key driver of biodiversity loss and climate change. For Rabobank, this topic is material due to our significant exposure to Food & Agriculture (F&A) sectors, which depend on healthy ecosystems and are linked to land conversion risks.
Our ambition aligns with the Kunming-Montreal Global Biodiversity Framework (GBF), particularly Target 1 (Halting deforestation and land conversion), Target 2 (Restoring degraded ecosystems) and Target 3 (Avoiding impacts in protected and key biodiversity areas). We aim to progressively adapt our portfolio and policies to prevent land conversion and promote more sustainable practices.
Impact, Risk and Opportunity Management
Transition plan and consideration of land use in strategy and business model
Land use is part of our overall nature approach which entails embedding nature into all our core banking processes and governance and progressively adapting our portfolio and policies toward alignment with the Global Biodiversity Framework 2030 targets, in line with the best practices and based on the best available science. Please refer to the introduction section in this chapter for more details on our nature approach. Moreover, the Global Standard on Sustainability Acceptance and Performance applies, which is complemented with region-specific business (impact) strategies. The first region-specific business (impact) strategy that we have developed, and are implementing, is focused on Brazil. This is elaborated on in the Actions and resources in relation to land use-section.
Description of the processes to identify and assess material land use-related impacts, risks and opportunities
Land use is considered by science to be the biggest driver of biodiversity loss; this includes deforestation and land conversion. Soils support life on land and water, nutrient cycling, food production, pollution remediation, and climate regulation. As part of our double materiality assessment, we identified the following material land use-related impact within our downstream value chain.
Impact
To assess our impact on nature, we consider the pressures on nature, the state of nature and responses. The pressures are human activities that directly or indirectly impact the state of nature. For Rabobank, the most material pressure categories are land use (change), water use and pollution. The state of nature refers to the ecosystem’s health in a specific location, for example the vegetation type and whether this resembles native vegetation. The responses are actions taken by our customers to reduce pressure and improve the state of nature.
The Nature prioritization assessment, using BioScope (elaborated on in the first part of the Nature-section) indicates land use as the largest pressure on biodiversity loss, mostly driven by the sector's primary agricultural activities in our portfolio. The impact of land use is large because agriculturally used land for cropping or grazing typically provides less habitat to species than native vegetation. Note that land use as a pressure on nature is different from land use change, with the latter referring to the conversion of land from native vegetation to non-native land use types.
While land use change – which also entails deforestation - is not part of the assessment based on BioScope, it has been assessed with other data sources and customer-level data and is classified as material in the double materiality assessment. Water use is material in water-stressed areas where water use for irrigation competes with the availability of the water for freshwater ecosystems. The physical risks related to drought and water scarcity are often also material in these areas.
Risk
Progress is made in strengthening Rabobank’s understanding and management of nature-related risks. Based on our heatmap analyses, we conducted various environmental risk scenario analyses including high-level macro impact of land use policy change. From a physical risk perspective, the effects of land-use change are covered in drought scenario analyses. The first land use metrics have been defined for risk management, building on this work, further land use metrics will be included over time.
From a financial (credit) risk perspective, we identified the risk of loan impairment charges due to land degradation/land-use change caused by customers driving biodiversity loss and ecosystem health decline affecting their ability to repay their loans.
Policies related to land use
Our Global Standard on Sustainability Acceptance and Performance includes Nature Policy and Deforestation and Land Conversion Policy requirements addressing land use topics.
For selected midstream customers and business partners in sector x regions that are prioritized from a deforestation and land conversion perspective (excluding palm oil):
We do business with large midstream customers sourcing unprocessed raw materials from priority sector x regions, if they have a strategy in place towards no deforestation, even if legally authorized. This strategy must extend to both direct and indirect suppliers.
For upstream customers:
In sector x regions that are prioritized from a deforestation and land conversion perspective, we do not provide loans or finance for deforestation and land conversion purposes, even if legally authorized.
We do not do business with upstream customers (not just those who are active in prioritized sector x regions) or business partners whose lands have been illegally deforested or converted after January 1, 20181.
Specifically for upstream customers in Brazil:
We do not accept lands in the Amazon biome as new collateral, which have been deforested after January 1, 2018, even if done legally.
In addition, our sector-specific Arable Agriculture and Forestry policy (the sectors in scope are cocoa, coffee, cotton, palm oil, soy, sugarcane, tea and forestry (including pulp and paper) states that:
Being a Roundtable on Sustainable Palm Oil (RSPO) member for upstream customers is mandatory, this is a acceptance requirement. RSPO sets globally recognized standards that include No Deforestation, No Peat, No Exploitation (NDPE). We use this – among other sources – to monitor that our customers’ production does not cause or contribute to deforestation, new plantings on peatland and exploitation, and that they have mechanisms in place to identify, avoid and resolve land tenure conflicts with local communities or Indigenous peoples, all as detailed in the RSPO. Membership in RSPO entails a commitment to continuous progress toward full certification.
Being a Round Table on Responsible Soy Association (RTRS) member is a performance requirement. RTRS sets a standard for responsible soy production.
We can request supporting information on our accepted customers’ and business partners’ controls and progress in the upstream value chain that demonstrate that they are making progress in certifying the company and/or its products according to the relevant sector initiatives.
Actions and resources in relation to land use
Nature, including the topic of land use is being integrated into the strategic steering cycle of the bank step by step. Please refer to the Material Impacts, Risks and Opportunities and their Interaction with Strategy and Business Model for more detail.
We have outlined our acceptance criteria in the “Policies related to land use”. Please note that our Global Standard on Sustainability Acceptance and Performance is a global standard. And although it does include region-specific elements,
A global standard cannot effectively take into account the different local realities in regulatory contexts and market maturity. As a consequence, a global standard that overarchingly outlines what we require from our customers and what we do not allow, can be complemented with region-specific business (impact) strategies. The first region-specific business (impact) strategy we developed, and are implementing, is focused on Brazil.
Brazil
The Brazil land use strategy focuses on accelerating the transition of the food and agricultural system towards a deforestation‑free and land‑use‑change‑free future. The strategy follows the mitigation strategy and is based on four pillars: 1. improving data accuracy, 2. incentivizing our customers, 3. supporting high‑impact projects, and 4. contributing to broader system transformation.
Increasing data accuracy. This entails enhancing data collection, monitoring, analysis and response system. Examples of actions related to this element include comprehensive staff training, leveraging satellite imagery to monitor customer-owned land, and dashboard development.
Efforts to help our customers, which entail developing propositions and financial structures to:
Incentivize our customers not to use legal deforestation rights. An example is the Responsible Commodities Facility (RCF) which was developed and negotiated with other counterparties (MFF, IDB, Agri3, UK Retailers (Tesco, Sainsburys and Waitrose)) and aimed at promoting the responsible production and trade of deforestation- and conversion-free soy in Cerrado biome in Brazil by providing financial incentives to farmers committed to environmental preservation. For the 2025/26 season, the RCF will finance around 280 farms, producing 240,000 tons of soy and conserving around 90,000 hectares of native vegetation (of which 28,915 hectares is excess native vegetation).
Support forest acquisition and/or reforestation efforts. An example is the Forest Code Acceleration Loan, a long-term financing solution, offering loans up to 20 years, designed to support forest acquisition and/or reforestation efforts. This structure enables customers to meet Forest Code requirements early, without straining their cash flow. By extending the payment horizon, we align environmental compliance with financial sustainability. This product is conditioned to the additionality of acquiring and protecting more forest than the legislation requires, closing the existing gap and going beyond legislative requirements.
Support projects to convert or recover degraded land into sustainable agricultural and forestry systems. Examples are Ecoinvest, a BRL 350 million innovative blended finance structure backed by Brazil’s National Fund on Climate Change. The program supports projects that restore degraded land and convert it into sustainable agricultural and forestry systems, reducing pressure for new land clearing. Rabobank was selected by the National Treasury as one of the few banks to operate credit line (BRL 200 million from the government and BRL 150 million from Rabobank). Disbursements are expected to begin in Q1 2026. And AGRI3 Fund (created by the United Nations Environment Program (UNEP) and Rabobank, with support from IDH – The Sustainable Trade Initiative and the Dutch development bank FMO), which combines long-term financing with technical assistance. It is a blended finance solution that allows us to extend the term from 7 to 10 years and it is aimed at financing the restoration of degraded pastures, reforestation, forest protection, and sustainable farming projects.
Supporting impact projects. In addition to making impact in cooperation with our customers, we invest in projects to enable restoration and conservation. Examples are our share in Biomas, announced during COP27, in Egypt (together with other Brazilian companies such as Suzano, Marfrig, Santander, Itaú Unibanco and Vale) and focused entirely on the restoration, conservation and preservation of forests in Brazil. In April 2025, Biomas’ first reforestation project took place, with an investment of R$55 million in 1,200 ha of a property of Veracel Celulose in the South of Bahia. And our philanthropic partnership with the Black Jaguar Foundation, a non-profit organization working to restore the Araguaia Corridor, connecting the Amazon rainforest and the Cerrado savanna across central Brazil. Their objective is to realize the longest biodiversity corridor on Earth by planting over 1.7 billion native trees, in collaboration with local communities (for seed collection) and farmers. The Black Jaguar Foundation is a boots-on-the-ground organization in Brazil aiming to restore 1 million hectares of nature, bringing back rich biodiversity, creating wildlife habitat, combating climate change, and strengthening local communities. Rabobank supports the Black Jaguar Foundation in reaching its goals.
Contributing to system change. This entails engaging with different stakeholders, including NGOs, public and private sectors, having speaker roles in various forums, and establishing strategical partnerships to accelerate the transition of the food and agricultural system toward a deforestation‑free and land‑use‑change‑free future. Examples include:
Our participation in the 30th UN Climate Change Conference (COP30), in Belém, Brazil was shaped by three priority topics: reduce deforestation and land conversion, accelerate regenerative agriculture and taking efforts to act on our sustainability aspiration 'value nature'. We actively participated in panels, dialogues and coalitions and engaged with key players, like NGOs, governments and customers. In addition we advocated for system change, including long-term policy coherence and implementation.
WBCSD engagement : Rabobank is officially joining the LAB (Landscape Accelerator Brazil) partnership and participant of the Action Agenda Regenerative Landscapes.
Brazil Coalition of Climate, Forest and Agriculture: Rabobank is a formal partner in this coalition. The coalition proposal for climate transition has been officially launched on NYCW backed on three main pillars: Food Systems, Sustainable Commodities and Nature-Based Solutions.
IPAM - An internationally recognized Amazonian institution expert in sustainability studies in tropical agriculture.
A partnership has been established with Rabo Brazil, focused on developing financial solutions linked to payments for environmental services, valuation of natural capital, and training of the commercial team.Fundação Dom Cabral – Rabo Brazil is sponsoring this multi-stakeholder initiative led by a renowned business school to introduce an innovative business model aimed at advancing sustainability in agriculture through three key components: 1) development of a Regenerative Agriculture Sustainability Index to assess and promote sustainable practices, 2) mobilization of financial instruments tied to environmental performance, 3) creation of a digital platform to integrate data and services, enhancing transparency, accessibility and stakeholder engagement.
Fundação Getúlio Vargas – Rabo Brazil is sponsoring a leading Agriculture Institute for an applied research initiative aimed at developing, refining, and updating methodologies for measuring greenhouse gas (GHG) emissions in Brazilian tropical agriculture, with a particular focus on integrating technical measurement with economic analysis.
Actions and resources in other regions
In the Netherlands, the Vision for agri-food 2040 applies (although not a region-specific business (impact) strategy exclusively focused on land use). In it, we envision a Dutch agricultural sector that has progressed its transition to producing food sustainably by 2040. This overall vision is being translated into sector-specific visions, which in turn are translated into, e.g., underwriting policy. Ecologic, economic, and environmental (including Natura 2000 area proximity) elements are included in our underwriting criteria. The environmental element revolves around the location of the agricultural business, and the adequacy of the location for the intended agricultural use. In addition in the Netherlands we continue leveraging:
The Open Soil Index (Open Bodem Index). This is a tool we co-developed with insurance company a.s.r. and water supply company Vitens to provide farmers with a better picture of the development of the soil and soil quality in the Netherlands. Ultimately, the goal is to make the soil more fertile, with the result that agricultural entrepreneurs and the drinking water supply benefit from this.
The Biodiversity Monitor for Dairy Farming and for Arable Farming. The monitors provide insight into the actions that farmers can take to improve biodiversity on their farms and beyond. Additionally, these monitors can provide insights into new farm revenue models. Diversified revenue models could help convince and motivate farmers to manage their farms by protecting and enhancing natural capital, including biodiversity. The Biodiversity Monitor for Dairy Farming informs a pricing incentive scheme applicable to relevant financing products for (sustainable) frontrunners in the Dutch Dairy sector (for customers with more than EUR 1 million in financing and an A-score)
In Australia, in 2025 we engaged in the first land use pilot using collateral land polygons. In New Zealand, Rabobank, through Rabo Investments, has partnered with Nateva—New Zealand’s largest provider of permanent indigenous forest restoration—to offer farmers a new income opportunity via nature-based solutions. The initiative focuses on afforestation projects that generate voluntary carbon credits, which farmers can sell to local and international buyers, creating a long-term revenue stream while supporting climate mitigation and biodiversity restoration. Under a lease arrangement, eligible farmers receive 50% of the carbon credit value after costs, as Nateva manages the transition from exotic nurse crops to indigenous forests through active forest management.
The actions, as referred to in this section, through which we manage land use, are being on-boarded in our business-as-usual processes and activities. The expected outcomes and time horizons of our actions cannot always be disclosed at this point in time. In addition, we do not apply biodiversity offsets. Except for the actions disclosed in this section, we have not incorporated local and indigenous knowledge into biodiversity and ecosystems-related actions.
- As described in our deforestation and land conversion policy and taking into account local legislation and our contractual and fiduciary duties towards our customers.
Metrics and Targets
Targets and impact metrics related to land use
In addition to, having completed a first iteration of the assessment of our impact and dependency on nature, including land use, we are progressing towards land use related metrics. Leveraging satellite imagery and polygon information from the lands of our rural customers, we are in the process of defining and testing metrics. In addition, as we are advancing in implementing the Brazil land use strategy, specific land use related metrics start surfacing. Specific project related metrics are also being monitored, for example, in our philanthropic partnership with the Black Jaguar Foundation, we are considering the number of seedlings produced and, indirectly, their potential impact on restoration measured in hectares. For more information on the nature approach’s effort targets and the progress we made to track the effectiveness of our policies and actions, please refer to the table in the introduction of this nature section. At present, Rabobank has no time-bound and outcome-oriented targets and results in place for land use.
Social Information
Disclosure Requirement (DR)
| Topical standard | Section | ||
|---|---|---|---|
| Our own workforce | |||
| ESRS 2 SBM-2 | Interest and views of stakeholders | Strategy | |
| ESRS 2 SBM-3 | Material impacts, risks and opportunities and their interaction with strategy and business model | Impact, risk and opportunity management | |
| S1-1 | Policies related to own workforce | Policies related to inclusive environment | |
| S1-2 | Processes for engaging with own workers and workers’ representatives about impacts | Processes for engaging with our own workforce and workers' representatives about impacts | |
| S1-3 | Processes to remediate negative impacts and channels for own workers to raise concerns | Not material | |
| S1-4 | Taking action on material impacts on own workforce, and approaches to mitigating material risks and pursuing material opportunities related to own workforce, and effectiveness of those actions | Taking action on material impacts on our own workforce and the effectiveness of those actions | |
| S1-5 | Targets related to managing material negative impacts, advancing positive impacts, and managing material risks and opportunities | Targets on an inclusive environment | |
| S1-6 | Characteristics of the undertaking’s employees | Metrics of our own workforce | |
| S1-7 | Characteristics of non-employee workers in the undertaking’s own workforce | Metrics of our own workforce | |
| S1-8 | Collective bargaining coverage and social dialogue | Not material | |
| S1-9 | Diversity metrics | Metrics of our own workforce | |
| S1-10 | Adequate wages | Not material | |
| S1-11 | Social protection | Not material | |
| S1-12 | Persons with disabilities | Not material | |
| S1-13 | Training and skills development metrics | Not material | |
| S1-14 | Health and safety metrics | Not material | |
| S1-15 | Work-life balance metrics | Not material | |
| S1-16 | Compensation metrics (pay gap and total compensation) | Metrics of our own workforce | |
| S1-17 | Incidents, complaints, and severe human rights impacts | Processes for Engaging with Our Own Workforce and Workers' Representatives About Impacts | |
| Workers in the value chain and affected communities | |||
| ESRS 2 SBM-2 | Interest and views of stakeholders | Interest and views of stakeholders | |
| ESRS 2 SBM-3 | Material impacts, risks and opportunities and their interaction with strategy and business model | Material impacts, risks and opportunities and their interaction with our strategy and business model | |
| S2-1 | Policies related to value chain workers | Policies related to value chain workers and affected communities | |
| S2-2 | Processes for engaging with value chain workers about impacts | Processes for engaging with value chain workers and affected communities about impacts | |
| S2-3 | Processes to remediate negative impacts and channels for value chain workers to raise concerns | Processes for engaging with value chain workers and affected communities about impacts | |
| S2-4 | Taking action on material impacts on value chain workers, and approaches to managing material risks and pursuing material opportunities related to value chain workers, and effectiveness of those actions | Taking action on material impacts on value chain workers and affected communities, and effectiveness of those actions | |
| S2-5 | Targets related to managing material negative impacts, advancing positive impacts, and managing material risks and opportunities | Targets related to managing material negative impacts | |
| Workers in the value chain and affected communities | |||
| ESRS 2 SBM-2 | Interest and views of stakeholders | Interest and views of stakeholders | |
| ESRS 2 SBM-3 | Material impacts, risks and opportunities and their interaction with strategy and business model | Material impacts, risks and opportunities and their interaction with our strategy and business model | |
| S3-1 | Policies related to affected communities | Policies related to value chain workers and affected communities | |
| S3-2 | Processes for engaging with affected communities about impacts | Processes for engaging with value chain workers and affected communities about impacts | |
| S3-3 | Channels for affected communities to raise concerns | Processes for engaging with value chain workers and affected communities about impacts | |
| S3-4 | Targets related to managing material negative impacts, advancing positive impacts, and managing material risks and opportunities | Taking action on material impacts on value chain workers and affected communities, and effectiveness of those actions | |
| S3-5 | Taking action on material impacts on affected communities and effectiveness of those actions | Targets related to managing material negative impacts | |
| Consumers and End-users (Social Inclusion and Information and safety-related Impacts) | |||
| ESRS 2 SBM-2 | Interest and views of stakeholders | Interest and views of stakeholders | |
| ESRS 2 SBM-3 | Material impacts, risks and opportunities and their interaction with strategy and business model | Material impacts, risks and opportunities and their interaction with our strategy and business model | |
| S4-1 | Policies related to consumers and end-users | Policies related to consumers and end-users | |
| S4-2 | Processes for engaging with consumers and end-users about impacts | Processes for engaging with consumers and end-users about impacts | |
| S4-3 | Channels for consumers and end-users to raise concerns | Processes for engaging with consumers and end-users about impacts | |
| S4-4 | Taking action on material impacts on consumers and end-users and effectiveness of those actions | Taking action on material impacts on consumers and end-users, and approaches to managing material risks related to consumers and end-users, and the effectiveness of those actions | |
| S4-5 | Targets related to managing material negative impacts, advancing positive impacts, and managing material risks and opportunities | Targets related to advancing positive impacts, and managing material risks | |
Introduction
As a bank, we influence people’s lives in many ways – both positively and negatively, directly and indirectly. In our role as an employer, with a presence in 34 countries and over 49,000 employees worldwide, we have a direct responsibility for the rights and well-being of our workforce. This includes fostering a safe and inclusive working environment, protecting employee privacy, and addressing factors that may affect health and well-being. We also act as a corporate lender to business customers. In this role, we may be indirectly connected to human rights impacts arising from our business customers’ operations or their value chains. And as a financial services provider, we serve more than 8 million private customers in the Netherlands. Through the products and services that we offer – such as mortgages – we recognize our role with regard to the lives and well-being of our customers.
In each of our roles, that we elaborate on in this section, people are center stage. In our sustainability aspiration ‘Enable People’, Rabobank works towards:
Respecting human rights within our own operations, business activities, and business relationships.
Embedding salient human rights in our business processes.
Supporting our business customers in how to address possible causes of labor exploitation in high-risk sectors.
Fostering social (and financial) inclusion within the retail customer market in the Netherlands.
Rabobank affirms its responsibility to respect international human rights as set out in the United Nations' Guiding Principles on Business and Human Rights (the UNGPs) and the Organization for Economic Co-operation and Development (OECD) Guidelines for Multinational Enterprises on Responsible Business Conduct.
Our grievance mechanism landscape and remedy approach
Our responsibility to provide for or enable access to effective remedy for adverse human rights impacts is a common thread throughout the Social Information statements. As a bank operating in different roles, our responsibilities regarding grievance mechanisms and approaches to remedy vary accordingly, as described in the UNGPs. In 2025, as part of our People approach, we launched a bank-wide initiative to review our global grievance mechanism landscape and remedy approach. We assessed the effectiveness of our internal and external grievance mechanisms and remedy processes across our different roles. This enabled us to evaluate our effectiveness in meeting our human rights commitments and regulatory obligations, to identify potential areas for improvement and to create a shared vision for an effective, accessible, and people-centered remedy approach. Improvements from this initiative will be implemented over 2026 with the aim of aligning our grievance and remedy approach further with international standards and our commitments in our various roles.
Our Own Workforce

Strategy
Empowered Employees
The driver 'Empowered Employees' contains two ambitions: 'A Great Place to Be', and 'Future-Ready Organization’'. These ambitions are elaborated in the People@Work strategy. A Great Place to Be is explained as: ‘We want our employees to realize results, add value for our customers, and contribute to our goals. That is only possible if we offer them the best environment to work, develop, and grow. For us, this means a safe and supportive workplace, where people feel valued and can reach their full potential. Creating such a place requires not only an effortless employee journey and clear roles and responsibilities, but also diverse and inclusive teams that work together. We want Rabobank to be a great place to be and where people want to stay.’ The ambition 'Future-Ready Organization’ is explained as: ‘Rabobank needs a future-ready organization in order to be able to adapt and compete in an ever-changing business environment to deliver on customer expectations. Our future-ready organization is one that is equipped with the skills, knowledge, and adaptability to facilitate the key transitions: food system and energy. We support the organization in the qualitative, quantitative and structural shifts needed to build a future ready cooperative bank. We enable our people to grow, and through them, we enable the Rabobank to thrive.’
To support the ambitions of the People@Work strategy, there are three pillars: inclusive environment, work-life balance and developing people. Rabobank believes that these pillars are essential in creating and maintaining the 'Great Place to Be' and the ‘Future Ready Workforce’ it aims to realize.
By creating an inclusive environment, Rabobank promotes a culture where ideas, backgrounds, experiences and perspectives are respected and valued and professionals are selected according to their abilities and talents and no one is discriminated against. A diverse workforce – on an individual and team basis - allows Rabobank to foster the diversity of thought contributing to innovativeness, and creativity.
Work-life balance refers to the impact Rabobank has on its employees by helping them put hybrid working into practice and finding a joint optimal working balance, viable for the employee, the team and the organization. Rabobank wants to be an attractive employer for everyone as well as a high-performing organization.
To remain future fit as an employer and as an employee, Rabobank values the development of its employees, recognizing the benefits it brings to individuals, teams, the organization, and society as a whole. The objective of developing people is to build a future-ready organization and great place to be, through ongoing people development. Continuous development benefits employees, the Rabobank, and society.
Impact, Risk and Opportunity Management
Rabobank has assessed both the positive and negative impacts on its own workforce. Among the three pillars underpinning the People@Work strategy, the pillar 'Inclusive Environment' has been identified as material. The pillar positively impacts the Human Resources strategy in Rabobank's own workforce via procedures, policies and processes on the one hand, and behavior of employees and leadership on the other hand. While the other two pillars have not been classified as material to the overarching strategy, either from a positive or negative perspective, Rabobank continues to address them. In certain instances, fostering an inclusive environment may contribute to effectively managing these other pillars.
With approximately 75% of Rabobank’s employees based in the Netherlands, the impact of the bank’s workforce-related initiatives will be most strongly felt within the Dutch context. Therefore, the initiatives in the Netherlands have been deemed material for reporting purposes. However, Rabobank does not limit its efforts to the Netherlands, therefore, when available and relevant, numbers and explanations will be given for Rabobank in total, which includes employees working outside of the Netherlands.
Policies Related to Inclusive Environment
Rabobank publishes all HR policy documents in the Rabobank Policy House Portal, which is an online library that is available to all employees and includes all its global, regional and local policy documents. Relevant policies for inclusive environment are:
Global Policy on Diversity, Equity and Inclusion (DE&I)
Global Policy against Harassment and
Global Policy on Remuneration.
As Rabobank aims for a safe environment free of harassment, it has a Global Policy against Harassment to ensure that employees feel safe to speak up freely about concerns, work-related problems, undesired behavior, misconduct, and other irregularities. Rabobank strives to prevent and address harassment in all its forms. The Global Policy against Harassment contains information on why Rabobank has this policy, the scope of the harassment framework and the overarching principles to deal with harassment. Rabobank encourage resolving complaints through dialogue bilaterally between the employees involved and/or their line managers. The complainant procedure should be easily accessible. The policy is elaborated and refined in local policies and requirements. The procedure on how harassment complaints should be handled is defined in the Global Procedure against Harassment.
Rabobank has a Global Policy on Diversity, Equity and Inclusion (DE&I) that serves as a general umbrella for all global diversity, equity and inclusion initiatives. Furthermore, it serves as a guidance under which all regions, local banks and/or departments can create their own local DE&I procedures which comply with the DE&I Strategy and respect the Global Policy as well as local laws and regulations. As Rabobank believes that every employee should feel safe, valued and respected, the policy does not distinguish targets or actions for specific groups or on specific grounds. An exception is made for gender diversity as the Dutch law 'Wet Diversiteit in de Top' requires Rabobank to disclose and report on the goals set on gender diversity in senior management and the current state. However, this does not imply that Rabobank only focusses on this aspect of diversity.
The principles of the Group Remuneration Policy guarantee a conscientious, sound, and sustainable remuneration system. This remuneration policy contributes to sound and effective risk management that does not incentivize any risk-taking that is unacceptable to the bank. In addition, it is aligned with the bank’s business strategy, objectives, values and behaviors, and long-term interests. Rabobank Group promotes equal treatment of all employees and considers that all staff should be equally remunerated for equal work or work of equal value. More information and metrics on compensation can be found in the Remuneration chapter in the Corporate Governance section.
Furthermore, Rabobank commits to comply with Dutch and international legislation and regulations for the countries in which it is active.
Processes for Engaging with Our Own Workforce and Workers' Representatives About Impacts
The interests, views, and rights of people in our own workforce inform the Human Resource strategy and its pillars as well as its business model in several ways, such as through analyses on the engagement scan, conversations and input from the Works Council, the Employee Resource Groups (ERGs), Unions and Inclusion Agents. It is partly due to this interaction that impacts, risks and opportunities are derived, which co-determines the actions and allocated resources.
Employee Engagement Scan
Rabobank's employees are closely involved in our mission and committed to the strategic priorities of our bank. In order to constantly improve, Rabobank actively engages with its employees globally and seeks their valuable input on a range of topics. In addition, insights on employee engagement are discussed at all hierarchical levels within Rabobank. All managers are required to discuss the insights into employee engagement with their respective teams. Rabobank measures employee engagement globally each quarter using an engagement score survey, processed by an external company. The Engagement Score is based on the extent to which employees feel that they enjoy their work, their work gives them energy, they are proud to work for Rabobank, and they feel that they fit in at Rabobank. In total, 31,615 employees provided feedback in the Engagement Score in Q4 2025 (31,585 employees in Q4 2024). Besides the engagement score, other scores are used to measure inclusive culture, work-life balance and developing people.
Every quarter, the effectiveness of the engagement scan is assessed, for example by asking all employees the question 'My team has taken action based on the results of the previous Engagement Scan'. Overall, this process contributes to managing our (material) impact on inclusive culture, work-life balance and developing people and in relation to our own workforce by giving employees the opportunity to (anonymously) share their input.
Employee Voice
As part of the safe working environment, Rabobank offers its employees several ways to speak up freely about concerns, work-related issues, undesirable behavior (harassment) or whistleblowing cases. Rabobank aims to solve difficult situations at the workplace by starting conversations with colleagues or the managers. There are dedicated channels, including the assigned internal and external trusted persons, to offer a listening ear, guidance and advice in handling these situations. In addition, there are dedicated channels for example for employees to report or raise a complaint under the Global Policy against Harassment, the Collective Labor Agreement procedures or the Global Policy on Whistleblowing. Rabobank only reports on the figures that are related to the Rabobank employees working in the Netherlands in line with its material impact of DE&I.
The internal reporting channels on difficult HR-related situations in the Netherlands handled 734 new cases in 2025 (2024: 671), of which 589 concerned labor related issues (2024: 507),107 concerned harassment (2024: 68). Of the harassment cases, 23 (2024: 11) were related to discrimination. Cases are linked to themes based on the employee's report. If a complaint is submitted to a committee, the committee will assess it on its merits.
The Industrial Relations Disputes Committee (Geschillencommissie Arbeidsverhoudingen) dealt with 13 formal appeals in 2025 (2024: 6). The Social Plan Central Appeals Committee handled 14 formal appeals (2024: 3), and the Objections Committee Executives handled 1 formal appeal (2024: 0). The Local Harassment Committee Netherlands handled 14 reports (2024: 8). Under the Global Policy on Whistleblowing 13 new cases were reported regarding the Netherlands in 2025 (2024: 41).
As there is currently no registration of the financial settlement of the cases, Rabobank cannot report on the fines, penalties, and compensation for severe human rights issues and incidents connected to our own workforce. We currently have no internal registration of severe human rights issues and incidents in connection with our own workforce in the Netherlands, given that such complaints are not received. Based on our current procedures and operating practices, we are not aware of any such incidents.
Employee Resource Groups (ERGs)
Rabobank has seven globally operating ERGs that work to advance DE&I within our organization, providing support and advocacy for diverse groups. These ERGs aim to foster an inclusive and supportive environment and are designed to address the unique needs and challenges of diverse employee populations within the organization. The ERGs represent the following groups: women, LGBTQ+, and neurodiverse employees, employees with a bi- or multicultural background, young employees (=< 36 years old), senior employees (> 36 years old) and international workers, e.g., expats.
Inclusion Agents
An inclusion agent is an employee who voluntarily takes on an additional role alongside their primary function. They contribute to creating more awareness on DE&I in the organization and help improve inclusive collaboration. By 2025, the network of inclusion agents has grown to over 100 members worldwide. These agents facilitate a range of team sessions to raise awareness and promote equity and inclusion, driving meaningful conversations and change across the organization.
Trade unions and Works council
In the Netherlands, the Works Council plays a vital role in ensuring employee participation and protecting their interests within Rabobank. The Workers Council is mandated by the European and Dutch Works Councils Act. Rabobank carries out negotiations with trade unions on the collective labor agreement for the employees in the Netherlands.
Taking Action on Material Impacts on Our Own Workforce and the Effectiveness of Those Actions
To enlarge our positive impact on our workforce, actions and initiatives are in place. Below, we list some of the key initiatives and actions we have undertaken to create an inclusive environment for our people. These initiatives are just a few examples of Rabobank's ongoing commitment.
Updated Diversity, Equity & Inclusion strategy
Rabobank has updated its Diversity, Equity & Inclusion (DE&I) strategy to align with Rabobank’s Group and People strategy, as well as broader global developments in this area. The approach focuses on three key areas: inclusive collaboration, equitable employee journeys and a targeted approach on diversity taking into account local and regional legislation.
With inclusive collaboration, Rabobank promotes inclusive ways of working whether with colleagues or customers and supports leaders in creating fair and unbiased processes. This helps the bank manage increasing complexity and make better use of new technologies. With equitable employee journeys, Rabobank aims to provide fair opportunities and resources for all employees by reviewing the HR products, processes, and policies. Besides, we focus on increasing diversity during key moments in the employee journey, such as hiring and promotions. This helps the bank build teams that reflect the markets we serve and respond to the challenges of a shrinking workforce.
International Diversity Day
On May 21st, Rabobank celebrated International Diversity Day globally to promote and keep DE&I top of mind broadly in the organization. Rabobank chooses to align this celebration with the annual Unesco World Day to support and emphasize the importance and relevance of DE&I in society. Multiple lunches were organized internationally, and four in the Netherlands. The Managing Board participated in one of the lunches that was organized for over hundred employees. During this lunch, a business game was played to increase awareness by experiencing privileges that people have or biases that people are faced with. Globally, ten short lectures were broadcasted live, which touched upon several topics, like DE&I and GenAI and how to create inclusion in your team. Over 1,000 employees watched the lectures live.
E-learning Break the Bias
The Break the Bias e-learning module is offered to employees globally and aims to strengthen an inclusive environment for employees and customers. In this e-learning, employees will learn about the importance of recognizing and mitigating biases to create more inclusion.
Cultural Diversity Barometer
To broaden the scope of diversity, equity and inclusion within Rabobank from monitoring and steering on gender diversity to other aspects of diversity, Rabobank collaborated with Statistics Netherlands (CBS) in the Netherlands to gain insight into cultural diversity. CBS offers individual organizations with more than 250 employees the opportunity to use the Cultural Diversity Barometer to gain insight into the cultural diversity within their own organization. CBS analyzed Rabobank's organizational data to provide insights into cultural diversity within the boundaries of laws and regulations of the Netherlands to help organizations, like Rabobank, to monitor and steer on cultural diversity. The measurement is performed by CBS once a year. The scope is employees working for Rabobank, located in the Netherlands. Using this approach for monitoring cultural diversity contributes positively to the material impact on DE&I related to our own workforce as it creates awareness on the current state on cultural diversity on the organization and domain level and opens up the conversation on cultural diversity within management teams. However, as insight is generated on an annual basis, the barometer is currently insufficient for the quarterly steering cycle within Rabobank. Nonetheless, the insights provided by CBS drive action within management teams.
Fair and Equitable Compensation
Rabobank is committed to ensuring fair and equitable compensation for all employees and considers this principle fundamental in guiding pay-related decisions. To support this commitment, equal pay analytics have been developed that will help to identify and address potential systemic and individual pay equity issues. These actionable insights will contribute to achieving and sustaining pay equity across the organization. In line with our dedication to pay transparency, Rabobank also voluntarily discloses the adjusted gender pay gap.
Metrics and Targets
Targets on an Inclusive Environment
The internal monitoring metrics capture the employee perspective, as reflected in the engagement surveys, alongside company data related to the pillars of an inclusive environment.
A target has been set for two subjects with respect to an inclusive environment. These targets concern gender diversity in top management and the engagement scan score. For these targets and Rabobank's performance on them, refer to Metrics of Our Own Workforce.
Metrics of Our Own Workforce
To address our impact on inclusive culture, we disclose metrics on own workforce, diversity and compensation. For information on incidents and complaints, refer to Employee Voice. For the definitions and methodology of the metrics of our own workforce, please refer to Appendix 1: Methodology & Definitions Sustainability Statements. Rabobank updated the methodology used to calculate the gender pay gap by refining the estimate of variable pay, and include all active Rabobank employees within the consolidated group. For further details on the changes in preparation or presentation of sustainability information, please refer to our Basis for Preparation.
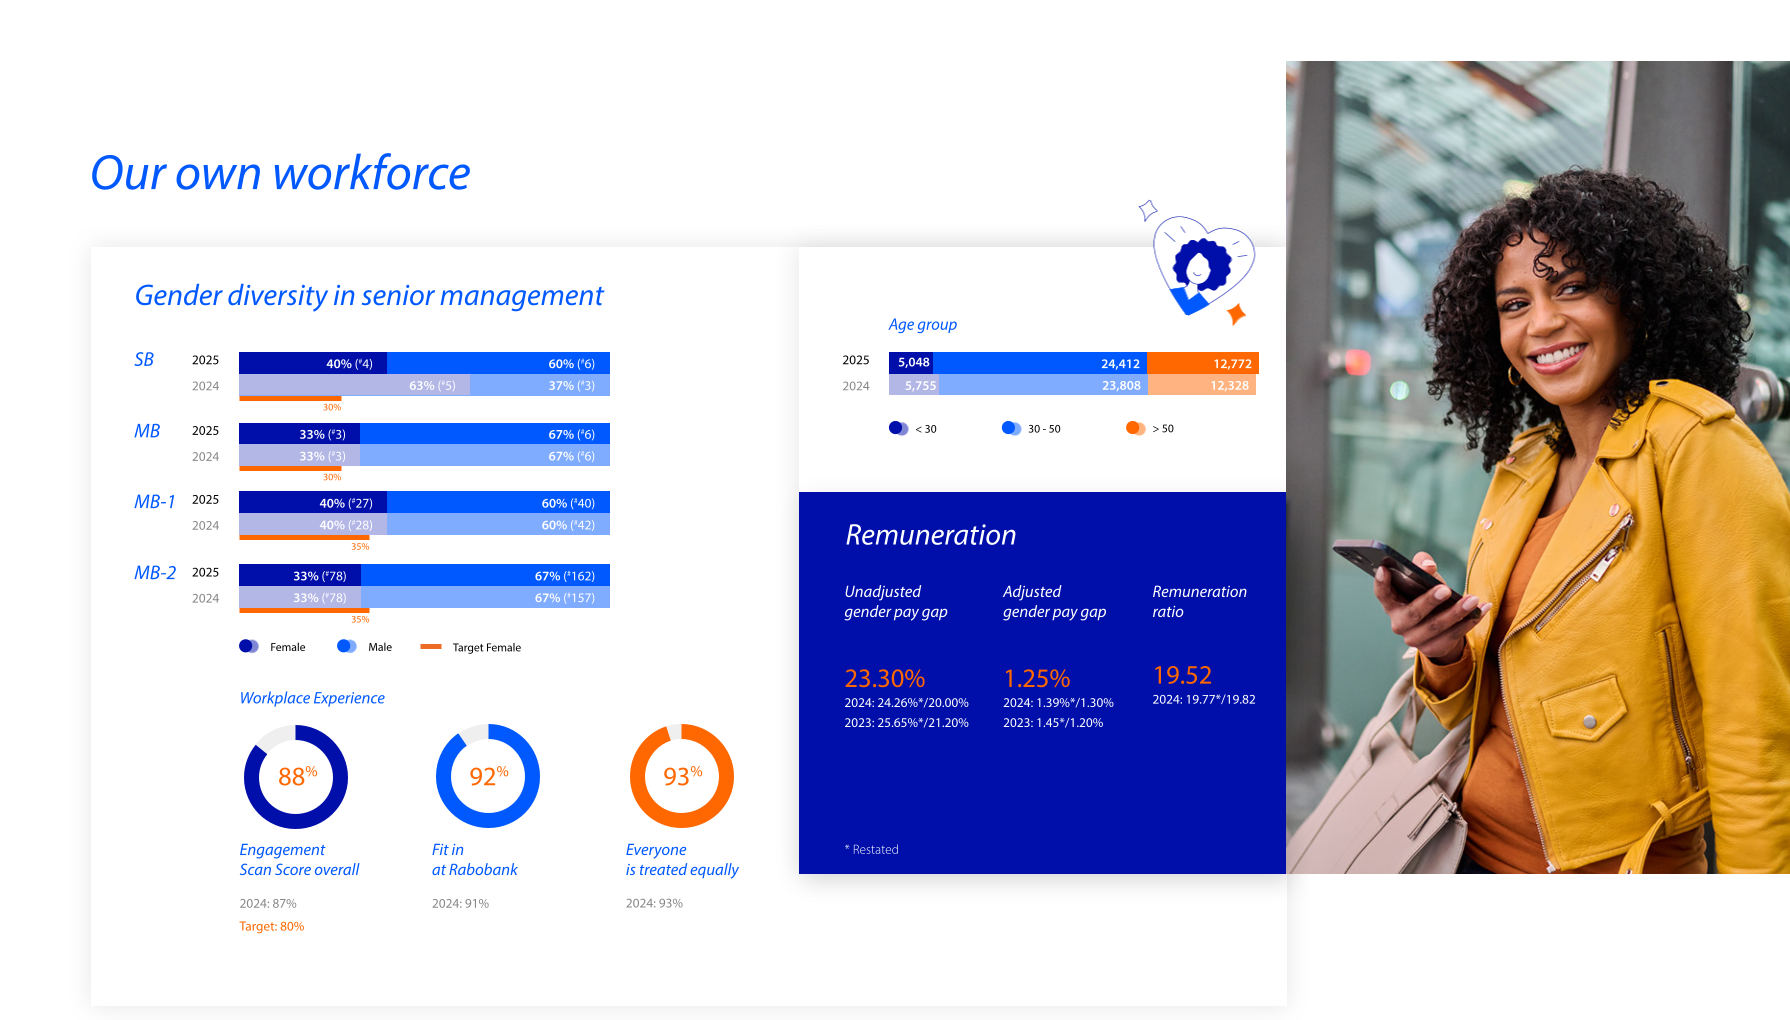
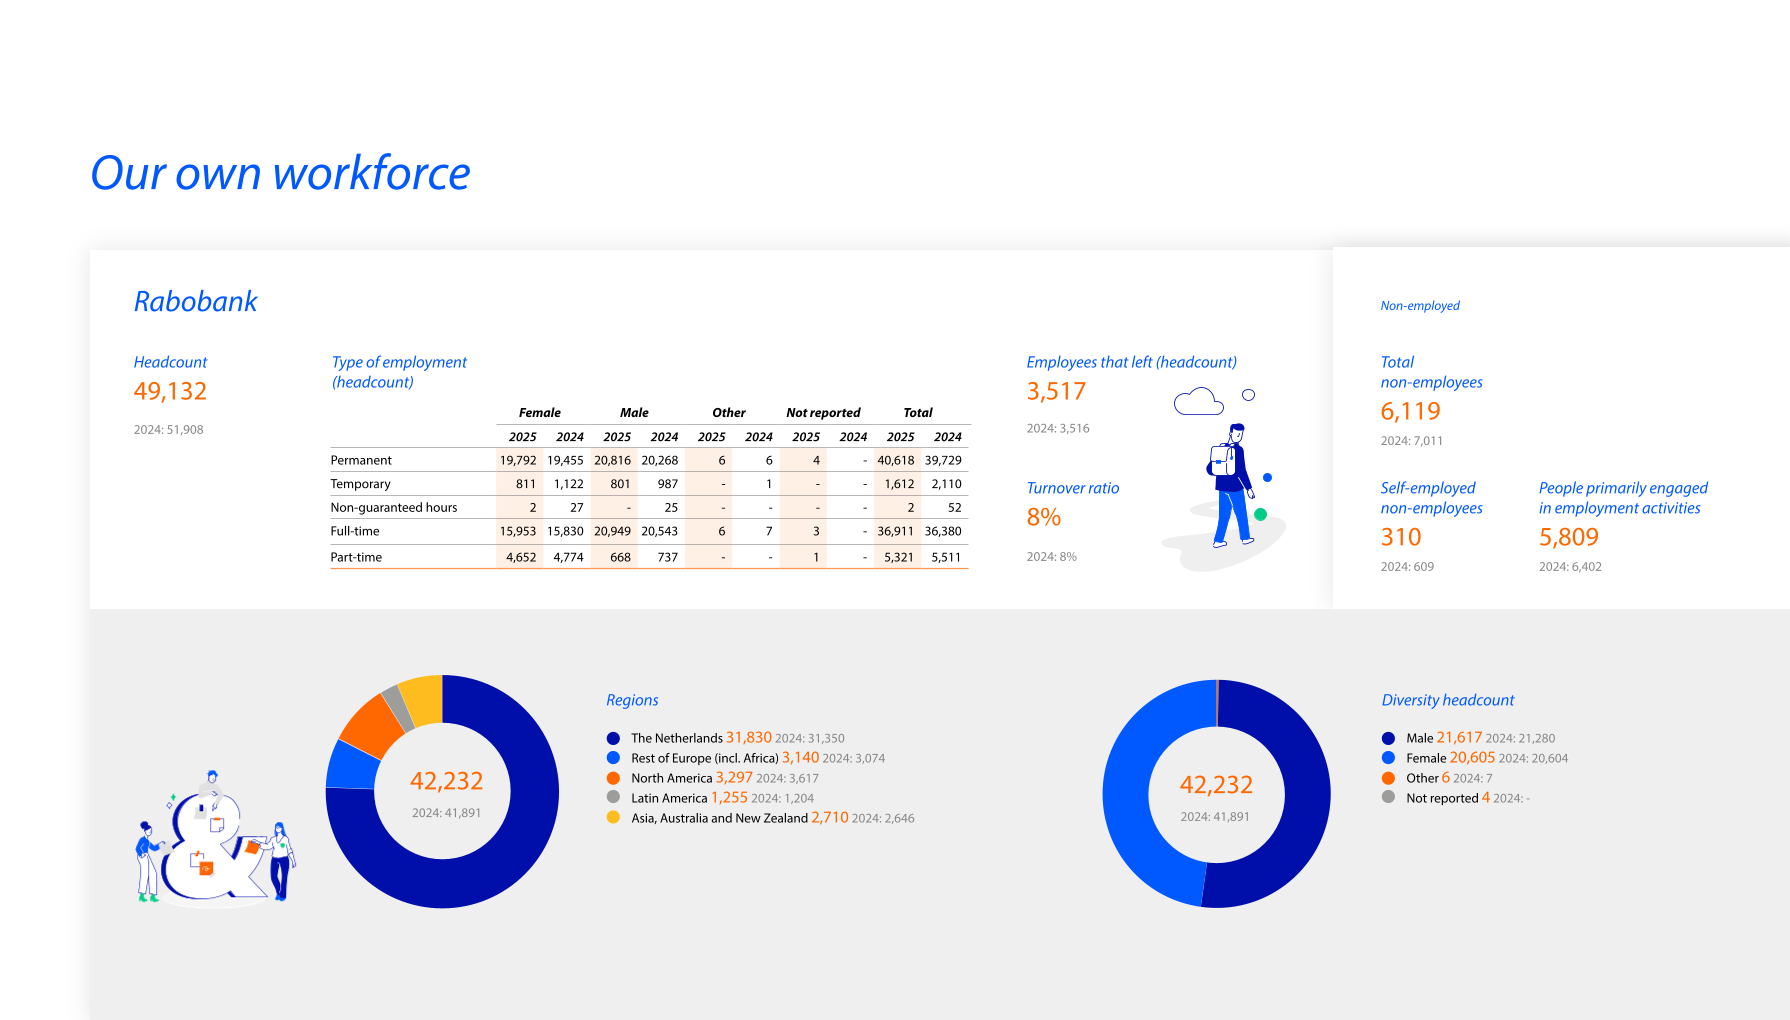
Workers in the Value Chain and Affected Communities

Strategy
As a financial institution, we can be linked to a wide range of adverse impacts for value chain workers and affected communities through our business customers' operations and value chains. This has been confirmed through our human rights saliency assessment as well as the double materiality assessment. The outcomes of the double materiality assessment concluded that labor rights of workers in the value chain and communities' rights are the bank's material topics for this Annual Report. We address these human rights risks through actions and approaches as set out in our People Approach.
Interests and Views of Stakeholders
Being a large financier in the food and agriculture sector, the rights of value chain workers and communities can potentially be adversely impacted by our activities.
In assessing the potential severity of our human rights impacts, we look at specific drivers of human rights risks that may contribute to a greater adverse impact on value chain workers and communities. In the food and agriculture sector, where many of our customers are active, these risk drivers include high labor intensity, highly seasonal driven, low-skill-low-pay activities, strong/pronounced gender segregation. Such factors heighten the risk of adverse impacts on working conditions including adequate pay, the occurrence of discrimination, and the prevalence of labor exploitation, including forced labor and child labor. For example, these risks are particularly relevant for vulnerable groups, such as migrant workers.
Within the food and agriculture sector, risk drivers for heightened risk of adverse impacts on communities are linked to specific activities and production methods, such as whether they have a significant footprint on land and resources. For instance, livelihoods can be threatened by environmental impacts including deforestation or pollution or by intensive water use. In certain regions, specific regional risk drivers come into play, such as varying levels of recognition and protection of the rights of local communities or human rights and environmental defenders. Large-scale commercial land use may exacerbate shortages of farmland accessible to local communities.
These risk drivers and potential and actual adverse impacts to rightsholders, being value chain workers and communities, could in turn also impact our business customers' operations. It could lead to reputational risks, operational risks - impacting their supply chain resilience in case of adverse human rights impacts deeper in their value chains - and/or legal risks, in case of non-compliance with local laws and regulations.
We are aware of these impacts and our people vision and approach, including our human rights due diligence process, are intended to address these impacts. This approach is guided by a set of design principles:
We prioritize areas where people face the greatest risks, and tailor our actions proportionately to the level of impact.
We are committed to addressing human rights within our own operations while also dedicating efforts to support our customers in doing the same.
We view this approach as an ongoing process – one that involves monitoring the perspectives of affected people and regularly updating our human rights assessments and approach in response to their evolving needs.
Material Impacts, Risks and Opportunities and their Interaction with Our Strategy and Business Model
In 2024, we performed a human rights saliency assessment focusing on our role as financial services provider (addressing our activities in relation to business customers and retail customers). When referring to financial services provider, we refer to the provision of products and services to over 8 million private customers in the Netherlands and to our role as corporate lender including leasing to business customers. Through this assessment, that focused on ‘risk to people’, not ‘risk to the bank’, we identified 1) where rightsholders are most at risk to be negatively impacted by Rabobank’s activities and 2) the salient human rights risks we are connected to through our business relationships, including our business customers’ value chains.
Thereby identifying the material impacts and risks connected to our business model (including our products and services) and our business customers. The outcomes of the saliency assessment were used as input for the double materiality assessment, whereas upstream activities are out of scope of this section of the Sustainability Statements. The saliency assessment on our role as financial services provider acts as a starting point for our activities under our People Approach, we explain our approach for the saliency assessment below.
Scope
As for the scope of the saliency assessment, workers in the value chain are defined as individuals performing work in entities that are in Rabobank's downstream value chain, regardless of whether the value chain entities have any direct contractual relationship with Rabobank. These include all workers that perform work within the operations of a respective value chain entity, regardless of the nature of the work they perform or their specific contractual relationship with the value chain entity (i.e., whether they are employed directly, contracted or sub-contracted through third parties on temporary or permanent basis by the respective value chain entity). Affected communities are defined as people or group(s) who are actually or potentially impacted (negatively or positively) in Rabobank's downstream value chains. Affected communities include all types of communities independent of their economic, social, cultural, ethnic, civil and political status. Affected communities include communities within the immediate sphere of Rabobank's activities and the wider sphere of its downstream value chain, such as indigenous peoples or human and environmental rights defenders. The different rightsholder groups of the saliency assessment are aligned with the global social sustainability topics as defined as part of the double materiality assessment approach. In addition, impacts on value chain workers or affected communities arising from the transition to a greener economy (the energy and mining sector) are also considered.
Process
To verify intermediate outcomes, we involved both colleagues and external stakeholders. For the selection of external stakeholders, we looked at their regional perspective, their area of expertise as well as those that could reflect on or act as credible proxies for potentially affected people in relation to our customers and their value chains.
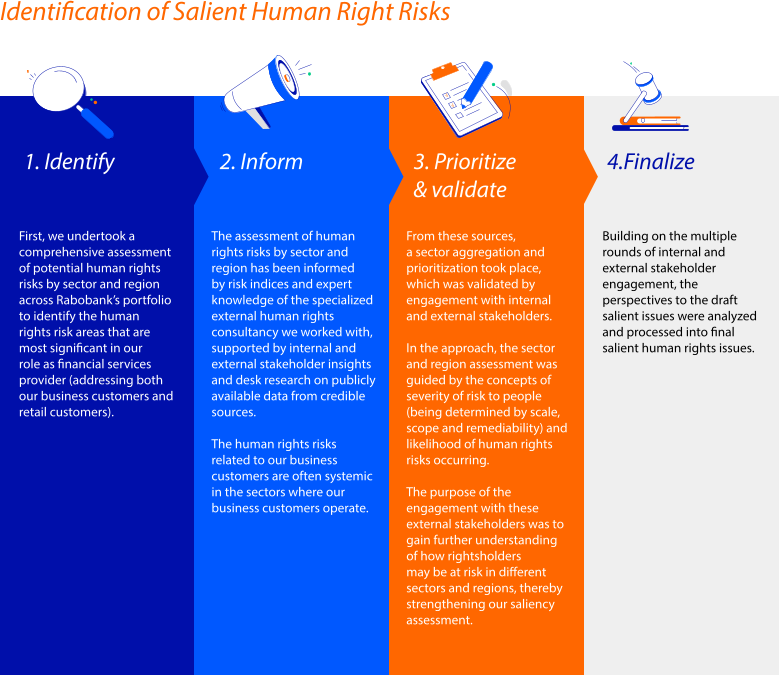
Results
Following these four steps of the saliency assessment, we identified the global salient human rights issues, which are categorized per rightsholder group. The saliency assessment also provided insights into the high-risk sectors where these salient issues occur. The list with high-risk sectors and the definitions for each salient issue are included in the Annex of the Global People Vision and Approach.
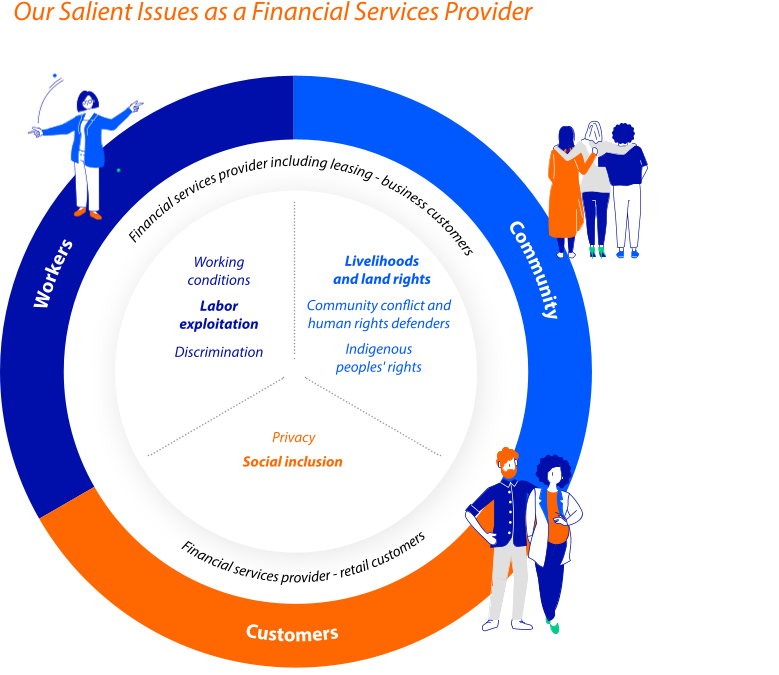
For workers in the value chain, the salient issues are related to (1) working conditions, (2) labor exploitation and (3) discrimination. For communities, (1) livelihood and land rights, (2) indigenous peoples' rights and (3) community conflict and human rights defenders are identified as the three salient issues. In the saliency assessment, we also identified salient issues in relation to our retail customers, the salient issues being (1) privacy and (2) social inclusion. For more information on privacy and social inclusion, please see the Sustainability Section 'Consumers and end-users'. The process and the results of the saliency assessment were endorsed by the IMT Sustainability in July 2024.
Impact, Risk and Opportunity Management
Policies Related to Value Chain Workers and Affected Communities
Rabobank has the responsibility to respect and uphold all international human rights (including labor and land rights) in line with international rules and regulations and our commitment to the UNGPs and the OECD Guidelines.
In the section Sustainability Policies, an explanation is included on the sustainability policies and our Global Standard on Sustainability Acceptance and Performance. In 2025, there were three policies relevant to manage our material impacts on workers in the value chain and communities; the Human Rights Policy, the Labor Rights Policy and the Land Governance Policy. The three policies do not reference specific groups of value chain workers or affected communities explicitly, except for indigenous peoples as a specific vulnerable group in certain communities.
These three policies have the aim to address the identification, assessment and management of potential and actual human rights risks at our business customers' level. Furthermore, they also address the responsibility for our business customers to cooperate in effective remediation of adverse impacts through legitimate processes, when relevant. In practice, we may engage with customers that do not yet fully meet all our requirements if they have an acceptable time-bound plan to do so.
Cases of non-compliance with these three policies, which may mean non-respect of the international human rights frameworks referenced such as the UNGPs, can come to our attention through different internal and external sources and channels. In 2025, two customers were determined to be non-compliant with Rabobank’s human rights and labor rights policy due to severe labor violations. We have engaged with both customers on the issues. The relationship with one customers is still under review due to ongoing court proceedings. The relationship with the second customer was been terminated in 2025.
Throughout the year, we have been supporting and equipping our business colleagues by offering them the tools and knowledge for customer engagement on human rights. For example, targeted ongoing presentations on our People approach, objectives, design principles and policies.
Policy Development and Implementation
As part of the Sustainability Policy Framework, we recently updated our Human Rights policy. This was approved in 2025, implementation was finalized in January 2026. The Human Rights policy replaces the abovementioned three policies. The new policy is:
Aligned with the format of all sustainability policies explained in the section Sustainability Policies: differentiation between acceptance and performance criteria.
Informed by our saliency assessment: We apply additional human rights requirements to customers operating in sectors with a high risk of adverse human rights impacts, particularly those engaged in high-risk activities within those sectors. This approach enables us to apply our policy proportionally; customers’ approach to how they comply with the requirements may vary in proportion to their size, specific activities, sector characteristics and geographic context. It also considers the customer’s level of responsibility and control over their value chains.
Strengthened with more stringent criteria for customers: As an example, we strengthened the criteria for remediation through legitimate judicial or non-judicial processes for actual adverse impacts customers have caused or contributed to. Another example is that we have included specific commitments covering the prohibition of modern slavery and the elimination of child labor, in line with relevant ILO conventions, for relevant customers active in high-risk sectors (using the saliency outcomes).
The Human Rights policy relies on the norms and principles of international recognized instruments, such as our UNGP commitment and the OECD Guidelines for Multinational Enterprises on Responsible Business Conduct, and highlights that certain rights and freedoms may be specific to certain individuals, groups or communities to which particular attention must be paid due to their higher risk of marginalization and vulnerability such as indigenous peoples, human and environmental rights defenders, workers (including own workforce, workers in the value chain, migrant workers and contract and subcontracted workers), women and children.
The human rights requirements in this policy are complemented by other policies and standards within the bank, which may entail additional or more stringent human rights requirements for customers and business partners, such as sector specific policies or policies on sanctions and privacy. The implementation of our policy and the assessment of our business customers against our policy criteria are key in our human rights due diligence.
Processes for Engaging with Value Chain Workers and Affected Communities about Impacts
As part of our due diligence process, the voices of value chain workers and affected communities help us to understand how our activities and that of our business customers could impact their human rights. Through our business customers, to whom we provide loans or other financial products, we are connected with potentially affected stakeholders (value chain workers or affected communities).
Our general process for engaging with these rightsholder groups is that we engage with credible proxies (organizations that can bring forward the voices of potentially affected value chain workers or affected communities). For instance, when executing human rights impact assessments, in the development of our approach for the strategic focus areas or in relation to urgent emerging topics such as conflict affected areas. A dedicated ‘People team’ within the Group Sustainability department engages throughout the year with credible proxies, where the frequency and formality of the approach differ per situation and motivation. Every year at the Annual UN Forum on Business and Human Rights in Geneva, we actively engage with credible proxies, for example, workers' organizations or representatives of human rights defenders, with a primary focus to gain a better understanding of the human rights risks to rightsholders in certain regions or countries, and risk drivers in the high-risk sectors in which our business customers are active. In addressing labor exploitation, one of our strategic focus areas, engagement with credible proxies and other experts, is relevant for the determination of our approach. We describe our approach for engagement in this context, in the next section.
Furthermore, we engage with our business customers, as we encourage them to enter into meaningful engagement with their stakeholders, including potentially affected people, to gain a better understanding of the human rights risks involved in their operations, value chain or sector. We encourage our customers, for instance, through our policies and in direct conversations and dialogues with them, to conduct effective stakeholder engagement in relation to the human rights most at risk in their sector or value chain. For example, we have been addressing labor exploitation risks in the Dutch horticulture sector by means of several sector dialogues, see the next paragraph.
Taking Action on Material Impacts on Value Chain Workers and Affected Communities, and the Effectiveness of those Actions
In 2024, we strengthened our focus on human rights by establishing a formal program of work with a dedicated team. The People Approach outlines our actions and deliverables for the coming years, which you can read more about in the Global People Vision and Approach. For 2025, our action plans and resources to manage our material impacts related to value chain workers and affected communities included the following specific areas:
Policy development and implementation (see the section 'Policies related to value chain workers and affected communities')
Addressing our strategic focus areas
Reviewing our grievance mechanism landscape and remedy approach
Addressing our strategic focus areas
From the eight global salient issues identified in our saliency assessment, three strategic focus areas have been prioritized. These are areas where we believe there is an opportunity to address human rights risks both at the customer and system level, and they are:
Labor exploitation
Livelihood and lands
Social inclusion
Addressing labor exploitation
Based on our saliency assessment, we know that labor exploitation is a risk both in the Netherlands, where our customers are active in sectors such as horticulture and animal protein (particularly in the processing phase such as in slaughterhouses) and internationally, in the food and agriculture sector.
In the Dutch horticulture sector, risk drivers such as high labor intensity and highly seasonal-driven work could heighten the risk of adverse impacts on working conditions, especially for the migrant workers the sector relies heavily on. That is why we conducted a series of interviews with internal (colleagues in various departments within Rabobank) and external stakeholders (e.g., human rights practitioners in other companies, peers, customers, representatives of sector associations) to broaden our knowledge and further understand what is in place within Rabobank and in the sector. We focused on the Dutch horticulture sector in 2025. Through several pilot projects, we gained experience with addressing the risks of labor exploitation and raising awareness for the issue. One example is our active participation in dialogues with relevant stakeholders from the Dutch horticulture sector, as explained in the interview with Arne Bac (see next page). We also organized knowledge sessions with our commercial colleagues to exchange ideas, best practices and challenges, especially in their interaction with our business customers.
Using these experiences, we are working towards the creation of a Decent Work strategy addressing the risks of labor exploitation in the Dutch horticulture sector, in particular in relation to migrant workers. This strategy outlines our current initiatives - for instance actions related to the importance of certification for labor agencies or housing - and our actions for the near future. We aim to support the Dutch horticulture sector in addressing these systemic risks and promoting collaboration within the sector and between relevant business partners, including labor agencies. We will follow this approach in other high-risk sectors such as the animal protein sector and international food and agriculture value chains.
In 2026, we aim to explore how to address the strategic focus area 'livelihood and lands'. For livelihood and lands, we focus primarily on local communities as potentially affected people through the activities of our business customers in our role as financial services provider. For social inclusion, we leverage the experience Rabobank has in the area of Financial Healthy Living as a starting point.

Reviewing our grievance mechanism landscape and remedy approach
The UNGPs, which Rabobank is committed to, include the responsibility for companies to enable access to effective remedy for adverse human rights impacts. The nature of this responsibility under the UNGPs depends on the company’s involvement, whether a company has (1) caused or (2) contributed to the adverse impact or (3) whether they are directly linked to the adverse impact. As a corporate lender, via our financing, we are often directly linked to the adverse impacts on value chain workers or affected communities, and our responsibility with regard to remediation differs from that of our business customers who might be causing or contributing to the impact. Therefore, in our new Human Rights Policy, we have stated a clear requirement on remedy, which was implemented in January 2026. Business customers must provide for or cooperate in remediation through legitimate judicial or non-judicial processes for actual adverse impacts on human rights, labor rights and/or land rights they have caused or contributed to.
In our efforts to assess Rabobank’s existing grievance mechanism landscape and remedy approach, as stated in the introduction of this chapter, we reviewed our approach in our role as financial services provider (addressing our activities in relation to business customers). The purpose of this review was to identify and address any gaps in our current grievance mechanisms and remedy approach, and align the current approach more closely with international standards, such as the UNGPs. Our grievance mechanisms include a general contact form on our website, a sustainability mailbox, and multi-stakeholder initiatives-driven mechanisms. Following this review, we are developing an 'enabling remedy strategy' for human rights grievances raised by rightsholders impacted by activities of our business customers.
Metrics and Targets
Targets Related to Managing Material Negative Impacts
At present, Rabobank has no time-bound and outcome-oriented targets and results in place for adverse human rights impacts in relation to value chain workers or affected communities. Part of the development of our People Approach is to assess whether we can develop meaningful indicators to measure whether our efforts also have a positive effect on the people most at risk from our activities and that of our customers and business partners. We will explore effort-based targets related to our strategic focus areas in 2026.
Consumers and End-users (Social Inclusion and Information and Safety-related Impacts)

Introduction
ESRS S4 relates to social impacts on consumers and end-users. For Rabobank, as a financial service provider, the scope is individuals using our products and services for personal use. Rabobank services a diverse range of individuals in the following business lines and entities:
Retail customers in the Netherlands form a large proportion of our individual customer base (approximately 8.2 million private customers). This includes provision of loans in the residential mortgage market and products and services in savings, payments, investment and insurance products.
Outside the Netherlands, (individual) savings accounts are also available in Australia and New Zealand.2
In addition, Rabobank services individuals via its wholly owned subsidiaries, including DLL, Obvion, BPD and Vista, that have activities in the Netherlands and abroad.
This chapter focuses on our efforts related to:
Financial Healthy Living, Accessibility, and Non-Discrimination in line with the material ESRS sub-topic of Social Inclusion. This topic is deemed material for Rabobank from a positive impact perspective for the downstream value chain (customers) access to products and services and responsible marketing practices. To be an inclusive bank, rooted in our slogan “Growing a better world together”, requires Rabobank taking shared responsibility in society and means ensuring that no one is directly or indirectly excluded.
Privacy, in line with the ESRS sub-topic of Information and Personal Safety Related Impacts. Privacy is deemed material for Rabobank from both a potential negative impact on society and external risks to the organization. For example, a data breach or cyber-attack could severely impact a large number of our individual customers by violating their privacy through a leak of their financial information, compromising their rights as well as causing emotional distress. These consequences could also lead to regulatory investigations and expose the bank to significant reputational damage.
Social Inclusion and Privacy are considered salient human rights for consumers at Rabobank. Refer to section Material impacts, risks and opportunities and their interaction with our strategy and business model for further details on the saliency assessment.
- Per the CSRD, the following definitions apply: Consumers are “individuals who acquire, consume or use goods and services for personal use, either for themselves or for others, and not for resale, commercial or trade, business, craft or profession purposes. ”. End users are “individuals who ultimately use or are intended to ultimately use a particular product or service”.
- The programs highlighted in this section focus on customers in the Netherlands, as this is where most of our retail customers are concentrated. Policies and Standards are globally applicable, including in Australia and New Zealand.
Interests and Views of Stakeholders
In section Interests and Views of Stakeholders, we explain how we take the interests and views of stakeholders, including consumers and end-users, into account in relation to our strategic direction and business model. The interests and views of consumers and end-users are embedded in our internal processes, as described in the section Processes for engaging with consumers and end-users about impacts below.
Material Impacts, Risks and Opportunities and their Interaction with our Strategy and Business Model
Social Inclusion
The cooperative values and behaviors expected from every employee and anyone representing Rabobank are described in our Code of Conduct (RaboCompass). One of our core values is being customer-driven: the interests of our customers come first. Another key value reflects our co-operative nature: what matters to the world around us matters to us. Today, financial well-being is under pressure due to inflation, energy poverty and income inequality. Rabobank has an institutional responsibility to address these challenges, particularly in the Netherlands, where we serve as both a provider of funds and a guardian of current accounts. With 9.1 million customers (8.2 million private customers and 0.9 million business customers) entrusting us with EUR 193.8 billion in retail savings, this role is fundamental to our purpose. (2024: 9.2 million customers with EUR 177.1 billion in retail savings).
Rabobank strives to be socially conscious in all of its business operations, with inclusion high on our agenda. Consumers and end-users rely on accurate and accessible information about our products and services. We pay particular attention to customers in vulnerable situations – those who, due to personal circumstances, may experience financial worries earlier, face challenges in understanding and processing information and/or be especially susceptible to harm. This vulnerability can include exposure to fraud, financial abuse and financial difficulties. Rabobank develops solutions to support these customers to manage their bank affairs, and to safeguard their personal data.
Social Inclusion aims to promote non-discrimination and support accurate and accessible products and services through responsible marketing practices that prioritize transparency, fairness and well-being of consumers. In the Netherlands, we advance this through three priority programs: Preventing Discrimination, Financial Healthy Living, and Accessibility. These priorities are embedded in our business propositions and daily customer interactions. By promoting inclusive practices, we contribute to a sustainable society where everyone has equal opportunities.
These programs are further explained in section Taking action on material impacts on consumers and end-users, and approaches to managing material risks related to consumers and end-users, and effectiveness of those actions
Privacy
Rabobank has a fundamental responsibility to protect all personal data entrusted to us. This data often provides insight into customer’s financial well-being, personal habits, preferences, and (financial) integrity. Rabobank processes personal data for a variety of purposes, including serving customers and safeguarding the integrity of the financial system. Misuse of this personal data can pose potential significant risks to the rights and freedoms of individuals. Given the nature of the services provided, inadequate processes could negatively impact individuals’ rights to privacy, the protection of their personal data, and non-discrimination. Potential non-compliance with consumer data privacy legislation resulting in remedial actions and financial fines is recognized by Rabobank as material.
Over the past years, Rabobank has established a robust privacy framework and organization. Accountability and responsibility are embedded within business functions, and compliance with privacy policies, standards and procedures is overseen by a dedicated Data Protection Officer (DPO), who reports directly to the Chief Compliance Officer of the Rabobank Group, supported by a team of Privacy Officers and Compliance Officers within the Compliance function.
Impact, Risk and Opportunity Management
Policies Related to Consumers and End-users
Treating Clients Fairly and Supporting Standards
The topics related to the material ESRS sub-topic of Social Inclusion are described in relevant Rabobank Global Standards. The overall objective of these global standards is to ensure that our principles, as described in our Code of Conduct (the Rabobank Compass), drive consistent and balanced outcomes for our customers. Global Standards are revised on a biennial basis1 or sooner if material developments occur, such as a change in regulations.
Treating Clients Fairly means putting the interest of our customers at the center of our decision-making, culture and behavior. The Global Standard on Treating Clients Fairly sets out the requirements in relation to procedures, processes and controls related to the development of products and services, information for customers and service provision (including responsible lending). The Standard addresses Social Inclusion elements such as accessibility and anti-discrimination considerations, financial education and strengthening the ‘financial difficulties’ guidance. A separate Standard is also in place for the protection of customers in relation to investment products and services.
The Global Standard on Complaints Handling sets out the minimum requirements regarding the way Rabobank registers, handles and responds to complaints. It also provides guidance on learning from complaints and using complaints to identify systemic problems, and adopting better practices. Rabobank aims to handle complaints in a timely, competent and fair manner, making corrections or providing remedy on a best-effort basis. We aim to ensure that the outcome of the complaint is in line with internationally recognized human rights. This is reflected in the way Rabobank makes the complaints handling process accessible to customers in vulnerable positions.
In alignment with the Treating Clients Fairly and Complaints Handling standards, employees are committed to upholding non-discriminatory conduct in all customer interactions.
Further, specific attention is required for customers in a vulnerable position in line with Treating Clients Fairly. To the best of its ability, Rabobank will look for solutions to help these customers to manage their bank affairs and safeguard their personal data.
The Global Standard and Global Procedure on Product Governance outline how customer needs and objectives are considered during product development alongside a thorough assessment of potential risks the product may pose to customers.
Rabobank’s Treating Clients Fairly requirements of the OECD Guidelines for Multinational Enterprises on Responsible Business Conduct into account, which include obligations related to fair business practices, responsible marketing and advertising, and the provision of quality, reliable goods and services. Rabobank’s Global Standards also address consumer protection and human rights for consumers and end users more broadly. Rabobank’s commitment to inclusiveness and equal treatment is pivotal in fostering a supportive environment.
Privacy Policy Framework
Rabobank is required to comply with GDPR and local privacy and data protection laws and regulations in all jurisdictions where we operate. Rabobank is also committed to meeting data privacy best practices in relation to the UN Guiding Principles on Business and Human Rights. This involves adhering to the foundational principles of respecting human rights of consumers and end users, which includes ensuring transparency, accountability, and safeguarding personal data.
To meet these obligations and commitments, Rabobank has established global Policies and Standards to manage risks related to privacy and data protection, including principles such as storage limitation (retaining personal data no longer than necessary). Our commitment to safeguarding personal data processed by us is described in our Code of Conduct (Rabo Compass). This value is translated into the Global Privacy Policy framework and related Global Standards, which underwent a regular update in 2025. The updates were aligned with our Binding Corporate Rules, reaffirming the technology neutrality of our policies (while also considering processing of personal data with Artificial Intelligence) and explicitly noting the risk of discrimination. The Global Policy on Privacy and Personal Data Protection serves as the cornerstone of the Global Privacy Policy Framework, detailing principles for lawful, fair and transparent personal data processing and emphasizing accountability, data minimization, accuracy and data protection to uphold individual privacy rights. Rabobank’s privacy statements are publicly available online and updated periodically.
All policy documents referenced in this section apply across Rabobank Group. Business line and entity management are responsible for developing supporting systems, processes, procedures, and controls and delivering appropriate training to implement and adhere to internal policies and standards, as delegated by the Managing Board. Compliance with these obligations is monitored through our risk and control framework.
For human rights policies refer to section Policies related to value chain workers and affected communities.
- The Global Standards on Treating Clients Fairly and Complaints Handling will be revised in 2026 in the biennial revision cycle.
Processes for Engaging with Consumers and End-users about Impacts
The respective business unit Management Teams are responsible for managing the strategic and tactical issues regarding the retail banking business.
Rabobank engages with and collects feedback from stakeholders through a variety of ways and frequencies, including proactive and regular outreach as well as ad-hoc engagements.
Direct Engagement
We actively engage with our consumers and end-users through various channels, including surveys, focus groups, and direct feedback mechanisms to understand their concerns and improve our practices. This engagement helps us understand their needs, preferences, and concerns, which are critical inputs for our product development and service delivery strategies.
Member Engagement
Rabobank Members’ Council members are an antenna in the local community. They form the link between the bank and its members and act as our sounding board and our sparring partners. We engage with these members to get their input on certain topics, for example non-discrimination, and housing and care.
Other Representative Bodies
In addition, Rabobank regularly engages in various dialogues with local Supervisory Bodies and Client Council members, about topics impacting their communities such as financial education, sustainability and local social issues.
Public and private parties
Rabobank collaborates with external parties to address societal challenges on financial health. We actively bring our knowledge and experience into collaborations with public and private parties, such as the Stichting Financieel Gezond Nederland (SFGN)1, Geldfit and Nibud2.
Rabobank works with peer banks and the Dutch Banking Association to enhance accessibility and to prevent (perceived) discrimination. An information website with explanatory videos (www.toegankelijkbankieren.nl) is available for our customers (especially older customers) and we have established national bank information points at various local municipalities. Rabobank also works together to formulate an industry baseline for the bank’s gatekeeper function, aimed at establishing principles that ensure attention to non-discrimination.
In case of legislative proposals related to privacy, Rabobank provides feedback to legislators via the Dutch Banking Association.
External Reports
At the end of September 2025, DNB and Ipsos I&O (commissioned by the Dutch Ministry of Finance) reported the results of follow-up studies on discrimination by banks3. DNB notes that banks have taken important steps toward a better approach to tackling discrimination but sees room for improvement.
Rabobank continues to work through its multi-disciplinary program on actions the bank can take to prevent our (future) customers, stakeholders, and employees from experiencing discrimination.
Complaints Handling Process
Rabobank manages all complaints and feedback in line with the Global Standard on Complaints Handling. There are procedures in place to handle complaints and requests in a timely, effective, fair and independent manner. Fairly also means that the bank will not treat a customer adversely for making a complaint.
Rabobank wants to learn from complaints and feedback received. Consumers can express a complaint via many channels including, in person at a Rabobank branch, by telephone, via an online form through our website, or by letter. In the Netherlands, consumers can file complaints and share general feedback via the webpage Help onze dienstverlening te verbeteren. Where possible, complaints are resolved by the first point of contact or a dedicated complaints handler. Where the complainant is not satisfied with the progress of the complaints procedure or the solution proposed, escalation to an independent unit is possible. If the complaint is not resolved to the satisfaction of the complainant or within 8 weeks after submitting their complaint, the complainant can seek an external review via a competent authority or Alternative Dispute Resolution e.g. Kifid, the Dutch Institute for Complaints related to financial services.
For customers who experience discrimination by Rabobank, the website also provides the option to share their experience with the national Discriminatie.nl portal or the Netherlands Institute for Human Rights.
In case of a privacy-related complaint, the complainant always has the right to register a complaint directly with the Data Protection Officer, or externally with the Data Protection Authority or the competent court.
Rabobank identifies root causes of complaints, as well as possible improvements, via periodic analysis of complaints received. Complaints are also considered an important source of information in the product approval and review process.
As part of our continuous learning approach, we monitor customer satisfaction with how complaints are handled.
To emphasize the importance of learning from complaints, reports on complaints management, including trends, lessons learned and potential improvements, are provided to senior management, the Compliance department and the Managing Board. The Compliance department also issues independent reports on the effectiveness of the complaints handling process.
The effectiveness of complaints handling controls - including both complaint registration and learning from complaints - is monitored by the first and second line at least annually.
In 2025, the Grievance Mechanism and Remedy Approach initiative4 assessed the complaints process for the Role of Retail Financial Service Provider, which is related to Consumers and End-Users, against the United Nations’ Guiding Principles on Business and Human Rights and OECD Guidelines. The assessment concluded that the overall process is mature, supported by well-designed procedures, effective governance and robust staff awareness of the topic. The mechanism is actively used by private customers and has delivered satisfactory remedy outcomes for complainants.
- Foundation for Financial Healthy Netherlands.
- Dutch National Institute for Family Finance Information.
- Report into Experienced Discrimination In Services Provided by Banks and Payment Institutions, dated July 2025
- See Our grievance mechanism landscape and remedy approach in Social Information Introduction.
Taking Action on Material Impacts on Consumers and End-users, and Approaches to Managing Material Risks Related to Consumers and End-users, and the Effectiveness of those Actions
Social Inclusion
Rabobank is committed to the United Nations’ Guiding Principles on Business and Human Rights. In the Netherlands, where most of our customers reside, we see how our transitions interlock and financial health becomes a larger issue. As a cooperative bank, whose mission is ‘Growing a better world together’, we work together with public and private organizations to help face these challenges. Our ultimate goal is to contribute to a more inclusive and financially healthy society for our customers and the wider communities.
In the Netherlands, Rabobank focusses on three key topics: Financial Healthy Living, Accessibility, and Non-Discrimination.
Financial Healthy Living
We have been promoting financial healthy living since 2018 through various campaigns. Key actions include:
Proactive Customer Service: Rabobank focuses on preventing financial distress and promoting financial awareness. Dedicated teams, such as Hulp bij Geldzorgen1, support customers facing financial difficulties and provide preventative assistance, including advice and resources from Rabobank as well as help of public and social partners. This team proactively contacts customers when usage patterns suggest potential financial stress, such as cash withdrawal on credit followed by deposits into daily banking accounts. These customers are then offered support through the Hulp bij Geldzorgen program. The next step in this program is to enhance early warning signals, enabling us to identify and assist more customers earlier in the process and prevent serious financial problems.
Geldfit Support: Geldfit, founded by the Dutch Debt Relief Route Foundation, helps individuals regain control over their finances. Rabobank actively collaborates with Geldfit and participates in its national youth campaign. Through this partnership, we aim to support customers by connecting them with specialists, including our Help with Money Worries team.
Rabobank App Features: The Rabo app includes an online financial health check and a ‘Rabobank Retrospective’ feature to help customers track their spending and savings. The check was developed in cooperation with Nibud.
Employee training: Rabobank provides training for customer-facing employees to better engage with customers on financial well-being. This includes e-learning programs and regular knowledge updates.
Local initiatives: Each region of Rabobank has a local director who stimulates local initiatives. As a figurehead in their Rabobank region, they act as the driving force and connectors of local initiatives. 14 Cooperative Directors at 'Kring' level are responsible for pioneering projects that have a positive impact on themes such as Financial Health, accessibility of services, energy equality and access to the housing market. Examples of projects that were successfully implemented this year include education programs such as bank for the classroom (education for young people about finances) and various local initiatives such as meetings for the elderly (safe financial aging), digital safety session, Fixbrigades (social employment linked to energy savings) and Smartbuilds (building/developing homes at temporary locations).
Rabobank is the project leader of social collection within the Stichting Financieel Gezond Nederland (former Nationale Coalitie Financiele Gezondheid). The project aims to recover outstanding payments through an approach that prioritizes the debtor’s individual circumstances and well-being, rather than relying on tactics focused solely on immediate debt recovery. It is based on the understanding that people often want to pay their bills but may be unable to do so due to various reasons such as financial worries or mental health issues. As part of this project, Rabobank offers tailored solutions and connects customers with voluntary or professional support to help address financial worries and arrears.
In 2025, special support on fraud prevention was developed as part of Geldfit for customers who have been victim of dating/ relationship fraud through messaging applications such as WhatsApp. This program educates customers about dating/ relationship fraud to help prevent repeat victimization and reduce the financial impact of these scams.
Rabobank considers it essential to foster broad access to affordable and sustainable housing. This commitment is reflected in the activities of our subsidiary BPD, which develops residential housing in the Netherlands and Germany. It is further supported by our investment in BPD Woningfonds and by initiatives such as Rabo SmartBuilds, both of which contribute to improving housing affordability, market accessibility and the availability of sustainable homes. Rabobank has invested EUR 2.0 billion in 2024 in BPD Woningfonds. In June 2025, Rabo SmartBuilds was transferred to BPD and Rabobank provided an additional EUR 400 million, bringing the total investment in Rabo SmartBuilds to EUR 500 million (2024: EUR 100 million).
Accessibility
Rabobank aims to be accessible to all customers, including those with disabilities, supporting a more inclusive society . This includes ensuring clear customer communications for example terms and conditions, accessible website information, and usable online banking and mobile apps for everyone.
In addition to the initiatives mentioned in Processes for engaging with consumers and end-users about impact, key actions include:
Education and resources geared towards customers in a vulnerable position. For example, Rabobank, in partnership with SeniorWeb, offers workshops and presentations on secure internet banking for those who struggle with digital banking. In addition, Rabobank also supports customers via Rabo Samen Bankieren.
Compliance with European Accessibility Act: Rabobank has completed the core implementation program for the European Accessibility Act, ensuring that the majority of digital and physical customer touchpoints meet the required accessibility standards of this Act.
Accessibility Improvements: The accessibility program is designed to address both digital and non-digital accessibility. It also includes a practice environment where customers can safely learn and practice online banking (eenvoudigbankieren.nl).
In 2025, Rabobank focused on further improvements within the Rabo Samen Bankieren program, aimed at strengthening support for customers in vulnerable positions and enhancing accessibility across service channels. The first phase of this approach includes:
Exploration of future service models: Rabobank is currently developing additional support formats, such as in-home assistance and group workshops, to further empower customers who face challenges with digital banking or financial self-reliance. These initiatives are part of the program’s long-term roadmap through to 2027.
Employee Training: Rabobank continues to invest in building accessibility awareness and competence across the organization. All customer-facing employees and product development teams receive mandatory core training on accessibility. In 2025, the training program was expanded with the rollout of role-based modules, tailored to specific functions. This supports deeper integration of accessibility into daily work and decision-making across the bank.
Accessible Communication: A writing style guide helps ensure communication is accessible and inclusive. In 2025, a learning bite was developed to support employees in applying these principles in daily communication, making accessibility more actionable and practical across teams.
The effectiveness and impact of these programs are tracked and monitored via our Net Promoter Scores which have shown improvement over the years, specifically related to customers in a vulnerable position. In addition, we have developed impact targets which are monitored by a management tool.
Non-discrimination
Our program focused on addressing (perceived) discrimination, with the aim of strengthening inclusion and ensuring equal treatment in our services
Rabobank has gathered experiences and insights in dialogue sessions with members, customers and employees. We use these insights, together with the complaint analysis and the analysis of policy and processes, to implement structural improvements in our services. Furthermore, we develop specific training courses for our employees to further increase awareness of non-discrimination. The external findings and internal analyses of 2024 form the basis for the ongoing roadmap to improve banking services and prevent (perceived) discrimination. This topic affects all parts of our organization - from the process of becoming a customer to mortgage applications, payment transactions, and loans and customer outreach for AML/CTF purposes.
The following actions are underway or have been completed:
Defining discrimination: The definition of discrimination used by the Netherlands Institute for Human Rights now serves as the basis to define discrimination in our relevant policies, including the Global Standard on TCF and Global Privacy Policy Framework.
Reviewing policies: Governance documents impacting our banking services, such as the Global Standard on Complaints Handling, have been assessed, and specific references to non-discrimination will be reviewed where applicable.
Improving customer communication: Various forms of communication, such as letters to customers and Rabobank webpages, have been reviewed to make them more inclusive and easier to understand.
Training colleagues: Through various training methods, such as Riskwise online learning, bias awareness in online learning, and team dialogues, we have begun sharing substantive knowledge and raising awareness of non-discrimination, including case studies discussed during team dialogues.
Enhancing monitoring: The complaints process has been adjusted to specifically monitor for complaints about all forms of discrimination including perceived discrimination. Additional monitoring activities through a structured risk monitoring framework are under development.
Grievance mechanism and remedy approach for our role as financial services provider to consumers
Rabobank is committed to the UNGPs, which emphasize the responsibility of companies to provide access to effective remedies for adverse human rights impacts. In line with this commitment, and as introduced earlier in this chapter, we have reviewed our existing grievance mechanisms and approach to remedy against the expectations applicable to our role as a financial services provider to consumers. As part of the Grievance Mechanism and Remedy Approach initiative, we conducted a review of the existing grievance mechanism and related procedures for this role and determined that they are effective and well-established. Enhancements are planned for 2026 to further align the procedure with the UNGP’s Effectiveness Criteria. Work will include improvements on language accessibility of the feedback channel used by our private customers, as well as translating the existing remedy practices we offer to customers into our procedure.
Information and Personal Safety Related Impacts
Information and Personal Safety related activities are embedded in our everyday work and regularly checked to ensure they continue to address the key impacts and risks.
Monitoring External Developments: Data privacy is an ongoing and evolving process, and therefore we constantly monitor and improve our data privacy practices. We closely follow external developments (such as Artificial Intelligence) and their impacts on our data processing activities and take the necessary actions where required. Ongoing compliance with changing data protection laws and regulations is ensured via regulatory adherence processes and monitoring of privacy risks and controls.
Privacy Impact Assessments are conducted to identify and manage potential risks to the rights and freedoms of individuals arising out of the processing of their personal data, as part of our privacy by design process. This is monitored regularly through specific privacy by design controls embedded in our risk and control framework.
Personal Data Breaches: Rabobank has policies, standards, and procedures in place to manage personal data breaches. In the event of a personal data breach, Rabobank will take measures to prevent recurrence and, if necessary, notify the Data Protection Authority. Rabobank has a policy to notify individuals in case of a breach of their personal data. To the best of its ability, Rabobank will manage potential impacts to the rights and freedoms of individuals in case of a personal data breach. Personal data breach management is regularly monitored through specific controls embedded in our risk and control framework. In 2025, we enhanced our personal data breach management process and transitioned to a new privacy management platform. This supports more effective personal data breach handling across the organization and improves reporting.
Fraud Monitoring: Rabobank closely monitors credit and payment products for potential losses due to fraudulent activities and informs customers proactively about fraud risks. By addressing these issues, the bank strives to minimize fraud and ensure a secure banking environment for all stakeholders.
Confidentiality, Availability and Integrity of personal data: Rabobank has policies, standards, and procedures in place to safeguard the confidentiality, integrity and availability of personal data via design and implementation of technical and organizational measures. Regarding its digital operational resilience, data management and continuity management, Rabobank follows the applicable laws, regulations and guidelines that apply to it as a financial institution. Rabobank continuously adapts to its changing environment (such as geopolitical tensions) and recalibrates measures where necessary.
Employee Training: We provide regular training to our employees to ensure they are equipped to uphold our standards.
Regular audits: We conduct regular audits and assessments to ensure compliance with our policies and standards.
- Help with Financial Worries
Metrics and Targets
Targets Related to Advancing Positive Impacts, and Managing Material Risks
Social Inclusion
Rabobank plays a leading role in the Stichting Financieel Gezond Nederland (SFGN), a collaborative initiative bringing together employers, financial institutions, and other public and private organizations to improve financial health across the country. A key focus of this partnership is customer engagement - educating and supporting individuals to better manage their finances and contribute to a financially healthy society. In addition, all partners take responsibility for promoting the financial well-being of their own employees.
Financial Healthy Living
Within SFGN, Rabobank is leading the social debt collection initiative, the initiative includes approximately 40 participating organizations.
Rabobank continues to support customers through Geldfit, providing financial advice and guidance. As part of the Geldfit youth campaign, Rabobank referred more than 2,083 young people to Geldfit in 2025 (2,200 in 2024).
The Nibud Financial Health Check offers users a financial health score and practical improvement tips. In 2025, 218,503 people used the check (326,364 in 2024).
Accessibility
Rabobank achieved its target Net Promoter Score of 17 (14 in 2024). Our objective was set out for two focus groups: customers with a physical disability and older customers. This score shows that our efforts are valued by our customers.
We organized a workshop attended by 65 customers, focused on secure online banking and helping seniors bank safely.
A webinar on practical tips for safe online payments via the RaboApp attracted 5,400 viewers, providing clear guidance to enhance digital security.
Rabobank ranked 8th in Sia Partners’ Global Mobile Banking Benchmark 2025, with accessibility as a key driver of this score making us the only Dutch bank in the global top 10 and reaffirming our strong digital strategy.
Six learning bytes were developed for our employees to deepen understanding of accessibility and inclusive digital services.
Three instructional videos, covering Online Banking with SeniorWeb, video calling via the Rabo App, and safety hub tips, were developed to support secure and confident digital banking.
Discrimination
In 2025, the (Perceived) Discrimination Program worked with business lines to implement advice where possible. From this analysis, the program revised customer letters and website texts. It also raised awareness within the organization through training on biases and RiskWise sessions.
These targets are closely connected to the objective of the Treating Clients Fairly Standard which aims for accessibility and adequate care for all customer groups.
As noted earlier in this section, Rabobank also uses complaints and other feedback received as an indicator of performance against its initiatives and service offering as well as to identify any lessons or improvements to be made.
Privacy
Rabobank continues to strengthen its data protection and privacy practices. During this reporting period, our focus was on transitioning to a new privacy management platform which serves as a foundation for more robust privacy implementation and oversight.
We track the effectiveness of our policies and activities through our risk control framework, which is fully embedded in our internal processes as disclosed in Information and Personal Safety Related Impacts. Employees play a key role in protecting personal data. To support them in this responsibility, we further enhanced our training programs, tailoring them to the needs of different target audiences across the bank.
Governance Information
Disclosure Requirement (DR)
| Topical standard | Section | ||
|---|---|---|---|
| Financial Economic Crime | |||
| ESRS 2 GOV-1 | The role of the administrative, supervisory and management bodies | The role and expertise of the Managing Board and Supervisory Board | |
| ESRS 2 IRO-1 | Description of the processes to identify and assess material impacts, risks and opportunities | Financial Economic Crime | |
| G1-1 | Business conduct policies and corporate culture | Financial Economic Crime policies and corporate culture | |
| G1-2 | Management of relationships with suppliers | Not material | |
| G1-3 | Prevention and detection of corruption and bribery | Prevention and detection of Financial Economic Crime | |
| G1-4 | Incidents of corruption or bribery | Incidents of corruption and bribery | |
| G1-5 | Political influence and lobbying activities | Not material | |
| G1-6 | Payment practices | Not material | |
Financial Economic Crime
Effective corporate governance ensures that we achieve our mission of ‘Growing a better world together’. In line with this mission, we take responsibility in protecting our customers, members, and society from Financial Economic Crime (FEC) with a robust governance framework. FEC risk management is embedded in our governance through policies, standards, and risk management. Acting as a gatekeeper to the financial system remains a top priority for Rabobank, and we strive to maintain full compliance with all applicable laws and regulations designed to combat FEC across the jurisdictions in which we operate.
Governance
The Role and Expertise of the Managing Board and Supervisory Board
The Managing Board and the Supervisory Board are committed to safeguarding the bank’s gatekeeper role in combatting FEC as well as ensuring compliance with the relevant rules and obligations.
Within the Managing Board, business directors (Retail NL, Wholesale & Rural, and DLL) of the Managing Board hold primary responsibility for managing FEC risk within their respective customer portfolios in their domains.
The Chief Financial Economic Crime Officer (CFECO) has specific FEC expertise and is responsible for managing FEC risk, including the implementation of an internal control framework, the execution of FEC risk assessments (including FEC SIRA) and managing and monitoring risks, controls, findings, incidents, actions and remediation.
The Chief Risk Officer (CRO) is primarily responsible for providing a risk and control governance framework, including the Global Policy on Financial Crime Compliance and related Standards, challenging and advising on risk taking, monitoring the risk profile, and the set-up of the Risk Management Committee structure which includes FEC risks.
The Supervisory Board has also established an ad-hoc Financial Economic Crime Committee who monitored progress, supported by reporting from Financial Crime Compliance and Audit Rabobank. More information about this committee can be found in the Report of the Supervisory Board. Fighting financial economic crime is and will remain a top priority for the plenary Supervisory Board.
Impact, Risk and Opportunity Management
Financial Economic Crime

FEC encompasses illegal activities carried out by individuals or groups to gain financial advantage through the misuse of financial services or markets. This includes money laundering, terrorist financing, sanctions breaches, and bribery and corruption.
Our materiality assessment of business conduct topics identifies bribery and corruption, within the broader context of FEC, as a material issue. FEC represents a significant risk, particularly from a financial and regulatory perspective, due to potential remedial actions and fines for non-compliance with FEC legislation. This risk underscores our ongoing commitment to strengthening a robust and future-proof execution of our gatekeeper role. Preventing financial economic crime is essential to safeguarding the integrity of Rabobank and the financial system as a whole.
Financial Economic Crime policies and corporate culture
The Compliance Charter sets out the roles and responsibilities for managing compliance risk across Rabobank. Compliance risk management is grounded in external standards including laws, regulations, and industry codes, and our own Code of Conduct (Rabo Compass), which describes the organization’s values and expected behaviors. These principles are further detailed in Compliance Policies and Standards. Alongside these formal controls, we recognize the importance of the human element (soft controls) in fostering a strong risk and integrity culture, which we actively monitor and challenge.
Rabobank is committed to upholding the highest standards of honesty and integrity in all global operations and business dealings. Every employee is required to adhere to the Rabo Compass, which sets out our values and behaviors and demonstrates what drives us in our work: being customer-driven, cooperative, professional, and taking responsibility. It provides guidance on how we engage with customers, business partners, colleagues, and society.
Our Global Policy on Financial Crime Compliance (FCC), supported by underlying Global Standards, forms the foundation of our FEC framework. These documents guide the identification, assessment, management, and remediation of FEC risks. The FCC Policy and related standards are accessible to all employees via Rabobank’s intranet, and compliance with these requirements is mandatory for all staff.
Rabobank reviews its policies and standards on a regular cycle. As part of this process, the Global Standard on Anti-Bribery & Corruption and the Global Standard on Sanctions were updated in 2025. The revised Anti-Bribery & Corruption Standard now addresses a broader scope of Third-Party Risk - beyond the previous focus on Business Partner Risk - aligning with industry best practices to assess bribery and corruption risks that may arise from both direct and indirect relationships. The revision also reinforces a risk-based approach to interactions with Public Officials across customers, employees, and third parties.
Looking ahead, the Global Standard on Anti-Money Laundering/ Counter Terrorism Financing (AML/CTF) will be updated to align Rabobank’s compliance framework with the EU’s forthcoming AML/CTF legislative package, including the Anti-Money Laundering Regulation and Sixth Anti-Money Laundering Directive, by 2027.
Prevention and Detection of Financial Economic Crime
To effectively prevent, detect, and address Financial Economic Crime (FEC) risks, Rabobank has implemented the following:
Risk and Control Framework:
An internal control framework which includes the managing and monitoring of FEC risks.
Implementation of FEC controls such as screening, customer due diligence (at onboarding and throughout the relationship), and transaction monitoring.
Monitoring for the effectiveness of controls (either preventative, detective or corrective) related to the identified risks.
The management and monitoring of findings, incidents, actions and remediation measures.
Annual FEC risk assessments (and additional assessments triggered by specific events) conducted across all regions, business lines, and subsidiaries. These assessments feed into the global Systemic Integrity Risk Analysis (SIRA), which provides critical insights into perceived risk levels across business lines, locations, and activities, enabling the formulation of a group-wide risk profile.
Training of employees:
All new employees complete the RiskWise Fundamentals global learning program during onboarding. This curriculum covers key topics such as fraud, privacy, security awareness, anti-bribery and corruption, and other areas related to FEC.
In addition, a mandatory role-based FEC training program is assigned to 61.1% of employees (61% in 2024). This program includes both basic and advanced online modules tailored to roles involving AML/CTF and sanctions.
The basic training target group includes employees in customer contact and support roles, FEC policy support, and those in the second and third lines of responsibility. Completing this program equips employees with essential knowledge on FEC themes, including risks (such as sanctions, geographic exposure, and customer profiles) and controls (such as transaction monitoring and adverse information screening), as well as Rabobank’s associated standards. These role-specific training programs ensure employees are prepared to protect both the organization and its customers from financial crime.
Employees in higher-risk FEC functions, such as those with direct customer portfolio responsibility or specialized FEC roles across all three lines, receive advanced online training. This includes practical risk scenarios and an assessment to demonstrate their ability to apply knowledge in mitigating FEC risks. Employees who have not yet completed advanced training are required to work under the supervision of a qualified senior colleague until training requirements are met.
FEC training is ongoing, with all employees expected to complete their assigned modules within 90 days. Completion is actively monitored. In addition to mandatory programs, tailored training and awareness initiatives are developed to address specific needs and promote continuous learning.
Members of the Managing Board are required to complete the online FEC training program.
The Managing Board and the Supervisory Board are offered FEC classroom education sessions.
Furthermore, an advanced anti-bribery and corruption training was developed in 2025 and has been incorporated in the FEC advanced training program.
Rabobank maintains records of training content, frequency, and participation, enabling us to monitor knowledge levels across the organization and take action where needed.
Whistleblowing:
Rabobank encourages employees to speak up about integrity or compliance concerns. Such concerns can be shared with management or with a compliance officer.
In addition, advice can be asked, or a report of suspicions of wrongdoing, can be made under the Global Policy on Whistleblowing (GPW). External individuals set out under the GPW can also lodge a report.
The provisions of this GPW ensure confidentiality for the person raising this concern, as well as protection from retaliation.
The GPW also facilitates anonymous reporting through the SpeakUp Platform or SpeakUp Hotline (contact details can be found in the above link to the GPW).
All reports raised under the GPW are registered in the dedicated Case Management System. A Whistleblowing Representative, independently positioned within Compliance, stays in contact with the reporter.
The Whistleblowing Committee (WBC), consisting of executive managers, keeps oversight of all reports made under the GPW.
The GPW also applies to suspicions on internal fraud such as bribery and corruption.
Metrics and Targets
Incidents of Corruption and Bribery
Total number of convictions and the amount of fines for violation of anti-corruption and anti-bribery laws during the reporting period is (0). As there were no convictions within the reporting period, no actions were required.
Managing Board Responsibility Statement
The Management Board of Cooperative Rabobank U.A. (Rabobank) hereby declares that, to the best of its knowledge:
The Financial Statements give a true and fair view of the assets, liabilities, financial position and profit of Rabobank, and the companies included in the consolidation.
The Management Report gives a true and fair view of the state of affairs on the reporting date, and of the course of affairs during the financial year at Rabobank and those affiliated entities whose information is included in the Financial Statements.
Information about internal control over financial reporting risk is provided in section Management Report on Internal Control over Financial Reporting.
Information about internal control over sustainability reporting risk is provided in section Sustainability Statements.
In light of and as set out in this report for the reporting year 2025, Rabobank manages operational and compliance risks in the manner and to the extent as described in this report. The Management Board is not aware that our internal risk management and control systems would not provide sufficient comfort that the operational and compliance risks faced by Rabobank, are effectively managed considering the risk appetite, where one should also consider the inherent limitations of such systems. Where breaches of the risk appetite occur, they are sufficiently managed. For further details, we refer you to the section on Risk Management.
In this context, the Management Report provides sufficient insight into failings in the effectiveness of the internal risk management and control systems.
The Management Report includes the principal risks as well as uncertainties, to the extent that they are relevant for Rabobank's continuity in the coming 12 months.
Managing Board
Stefaan Decraene, Chair
Bas Brouwers, CFO
Vincent Maagdenberg, CRO
Carlo van Kemenade, Member
Alexander Zwart, Member
Lara Yocarini, Member
Els Kamphof, Member
Janine Vos, Member
Philippe Vollot, Member
Management Report on Internal Control over Financial Reporting
The Management Board of Rabobank is responsible for establishing and maintaining adequate internal control over financial reporting. Management is also responsible for the preparation and fair presentation of the Consolidated Financial Statements. At the end of the period covered by this Annual Report, Rabobank’s management carried out an evaluation under the supervision and with the participation of its Chief Executive Officer (CEO) and Chief Financial Officer (CFO) of the effectiveness of the design and operation of its internal control over financial reporting. Rabobank’s internal control over financial reporting is a process designed to provide reasonable assurance regarding the reliability of financial reporting for the preparation of its financial statements for external purposes in accordance with generally accepted accounting principles.
All internal control systems, no matter how well designed, have inherent limitations. Due to these limitations, internal control over financial reporting may not prevent or detect misstatements. Also, future projections on the basis of any evaluation of the effectiveness of internal control are subject to the risk that the control measures may become inadequate because of changes in conditions, or that the degree of compliance with the policies or procedures may deteriorate.
Management has assessed the effectiveness of Rabobank’s internal control over financial reporting as of December 31, 2025, in accordance with the criteria set out in 2013 by the Committee of Sponsoring Organizations of the Treadway Commission (COSO), as defined in the Internal Control - Integrated Framework.
Based on that assessment, the Management Board of Rabobank concluded that the internal control systems provide reasonable assurance that the financial reporting does not contain material inaccuracies.
PricewaterhouseCoopers Accountants N.V., which audited the consolidated financial statements of Rabobank for the financial year ended December 31, 2025, also examined management’s assessment of the effectiveness of the internal control over financial reporting in Rabobank . The assurance report of PricewaterhouseCoopers Accountants N.V. is included in the section 'Other Information.'
Stefaan Decraene and Bas Brouwers
Utrecht, March 5, 2026
The above statement on internal controls should not be construed as a statement in response to the requirements of section 404 of the US Sarbanes-Oxley Act.
Corporate Governance

Corporate Governance and Member Influence
Our current cooperative governance structure has been in place since January 2016. Since the cooperative Rabobank was founded in the Netherlands at the end of the 19th century, members are the basis of Rabobank and have a say in and are represented in several tiers across the bank’s governance bodies. Rabobank in the Netherlands, including its local banks, and its foreign branches, representation offices and agencies operate as one cooperative bank with one banking license and one set of financial statements. In daily practice, the unique features of our member-based governance prove their value, strength, and flexibility. Moreover, member representatives in formal governance bodies are important for the social capital of Rabobank. These representatives ensure valuable connections and relationships with society for Rabobank.
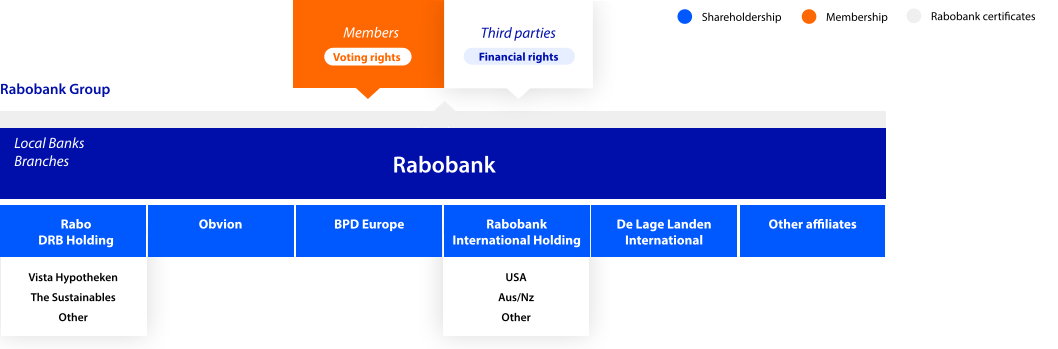
Rabobank Group Legal Structure
Rabobank Group means (i) Coöperatieve Rabobank U.A., including its local banks in the Netherlands and its foreign branches, representation offices and agencies (“Rabobank”), (ii) its subsidiaries and (iii) other entities in which Rabobank has a controlling interest, both in the Netherlands and worldwide. Based on applicable rules and regulations (for example if a foreign jurisdiction is involved) another definition may apply, depending on the circumstances at hand. Rabobank is a cooperative with excluded liability (“coöperatie U.A.”) and has its head office in Utrecht, the Netherlands. Its statutory seat is in Amsterdam, the Netherlands. Rabobank uses various trade names.
As a cooperative, Rabobank has members and does not have shareholders. Customers of Rabobank in the Netherlands have the opportunity to become a member of Rabobank. Members play an important role in Rabobank’s governance, as described below. At year-end 2025, Rabobank had approximately 2.3 million members. Membership does not entail making any capital contributions to Rabobank and does not entail having any claims on the equity of Rabobank. Any liability of members or former members to contribute to any deficit of Rabobank is excluded.
Rabobank has issued certificates (”Rabobank certificates”). These Rabobank certificates are part of the equity of Rabobank, but holders of the Rabobank certificates do not have any voting rights in Rabobank.
Rabobank has multiple Dutch and foreign subsidiaries with different legal forms. An overview of companies in which Rabobank holds a capital interest of 20% or more, is published on Rabobank’s website.
Member Influence in the Cooperative Governance of Rabobank
Rabobank is an organization with a decision-making process on both a local and a central level. The local organization preserves a local orientation as a distinguishing feature of Rabobank. The governance reflects the principle of the cooperative and bank being a single unit.
Members in the Netherlands
Members of Rabobank (individuals or legal entities) are grouped into departments (“afdelingen”), based on geographical criteria (local areas or “leefgebieden”). Currently, there are 78 local areas and accordingly, 78 departments. Within each local area there is also a local bank and a local director.
These local directors are mandated by the Managing Board to safeguard the local orientation and firmly anchor the local banks in these local areas. They serve as Rabobank’s representative (‘’boegbeeld’’) in the local area, as the main contact for the Local Members’ Council and Local Supervisory Body and also hold a position in the Dutch retail banking business.
The members belonging to the department are responsible for appointing, suspending and dismissing the members of the local members’ councils.
Local Members’ Councils
Each department has a local Members’ Council which consists of 30-50 members. Local Members’ Councils are the ‘eyes and ears’ and act as sparring partners of the local director on the customer services and the social performance in the local area. Determining the frameworks and conditions for the cooperative dividend is a unique responsibility reserved specifically for the local Members’ Council. Each year, up to EUR 75 million is made available nationwide for local and regional initiatives that contribute to the well-being of the community and to social transitions. It is up to the local Members’ Council to decide how this cooperative dividend will be spent. A local Members’ Council also has a number of formal tasks and responsibilities including the appointment (upon nomination by the local supervisory body), suspension and dismissal of members of the local Supervisory Body, including its representative in the General Members’ Council (“GMC member”).
Local Supervisory Bodies
Each department has a local Supervisory Body consisting of three to five members. The local Supervisory Body exercises cooperative supervision and focuses on both the local bank’s customer services and social performance. In the functional employer role, it shares with the local director's hierarchical manager, the local supervisory body approves the appointment of the local director. The local Supervisory Body aims to strengthen the ties between the bank and the local community.
Districts
The local areas are grouped into 14 districts (“kringen”). There is a cooperative director in each district who is the representative of Rabobank at the district level and plays a connecting role in the various ecosystems. The districts are currently organized in five regions.
Each district convenes at district meetings to discuss societal impact in that district and local areas. There are also combined district meetings within the regions, where Rabobank delegates and GMC members attend. Topics discussed in these meetings are General Members’ Council matters, regional performance, customer services, and social performance.
General Members’ Council
The General Members' Council fulfils the role of steward (“rentmeester”), in the sense that it contributes to passing on Rabobank to future generations and therefore values healthy economic and social returns. Each department is represented by a GMC member in the General Members’ Council. This council is the highest decision-making member body in the Rabobank governance structure. Each GMC member has one vote. Although GMC members are at liberty to exercise their right to vote, they also take local points of view into consideration. The General Members’ Council safeguards the bank’s continuity and acts as the custodian of collective and cooperative values . The General Members’ Council has a focus on the strategic framework, identity, material investments, main points of the budget and financial results of Rabobank. The General Members’ Council has the right to approve, adopt or to be consulted on these matters. This includes, for example, approving Rabobank’s strategic frameworks and major changes in Rabobank’s identity, adopting Rabobank’s annual accounts, and the right to be consulted on a material investment in (or entering into or severing any long-term cooperation with) another company. The members of the Supervisory Board of Rabobank are appointed by the General Members’ Council upon nomination by the Supervisory Board.
The General Members’ Council currently has three permanent committees: the Urgent Affairs Committee, the Coordination Committee, and the Staffing and Remuneration Committee.
Several strategic topics were discussed in 2025, such as sustainability, resilience, IT developments, diversity, equity & inclusion, as well as updates on performance within the Dutch Retail Banking, Wholesale & Rural, and DLL business lines. The General Members' Council also approved the report and recommendations from the governance evaluation. Additionally, important decisions were made to increase Rabobank's global impact, including support for the strategic framework of cooperative initiatives and the increase of the cooperative dividend in the Netherlands. The General Members' Council appointed three new members to the Supervisory Board of Rabobank in 2025.
Supervisory Board
The Supervisory Board is made up of at least seven natural persons. Two thirds of the number of members of the Supervisory Board must be members of Rabobank. The Supervisory Board performs the supervisory role and renders account to the General Members’ Council. In this respect, the Supervisory Board supervises the conduct of affairs by the Managing Board and the general course of business at Rabobank and its affiliated enterprise(s) and monitors compliance with laws and regulations and inter alia the achievement of Rabobank’s’ objectives and strategy. The Supervisory Board has the right to approve material decisions of the Managing Board. The Supervisory Board also has an advisory role in respect to the Managing Board. The Supervisory Board currently has five permanent committees that perform preparatory and advisory work for the Supervisory Board: a Risk Committee, an Audit Committee, a Cooperative & Sustainability Committee, an Appointments Committee and an HR and Remuneration Committee. The Supervisory Board may set up ad hoc committees.
Managing Board
The Managing Board of Rabobank is responsible for the management of Rabobank and, indirectly, Rabobank Group. Business issues, priorities and operational considerations are discussed in this board. The Managing Board members are involved in strategic and operational discussions, choices, and execution and will take decisions based on the specific knowledge and expertise that they each bring to the table. They will cooperate closely from a group-wide and ‘one bank’ perspective.
The Managing Board has the ultimate responsibility for defining and achieving the targets, strategic policy and associated risk profile, financial results and corporate social responsibility. In addition, the Managing Board is in charge of Rabobank Group’s compliance with relevant laws and regulations. Certain Managing Board members participate in material committees, e.g. the Asset Liability Committee Group, Risk Management Committee Group and Central Credit Committee Rabobank Group. The Managing Board renders account to the General Members’ Council. The Managing Board members are appointed by the Supervisory Board.
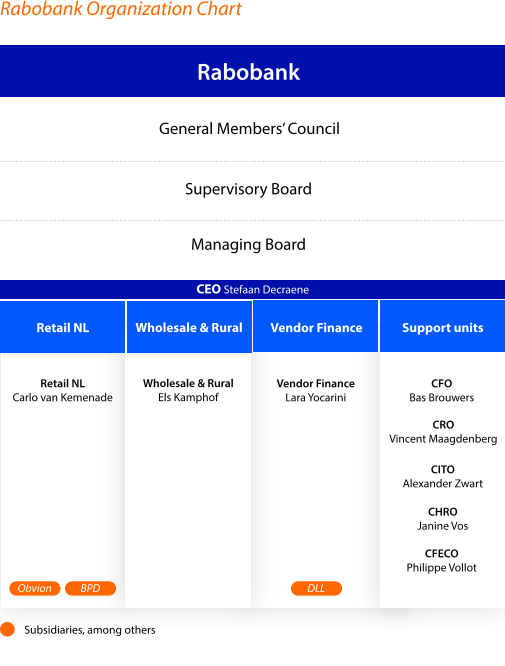
- List of trade names
- List of interests
Corporate Governance Codes
The Dutch Corporate Governance Code
The Dutch Corporate Governance Code, which was updated in March 2025, applies to listed companies and contains principles and best practice provisions for what is generally regarded as good corporate governance. Because of its cooperative structure, Rabobank is not required to comply with the Dutch Corporate Governance Code. Nevertheless, we have committed to comply with the code as much as possible. We depart from the code on only a few points, partly due to our cooperative structure. Please refer to www.rabobank.com for an overview.
The revision of the Corporate Governance Code in 2025, introduced the ‘Verklaring omtrent risicobeheer’ (VOR). The VOR requires companies to provide a clearly substantiated statement on the effectiveness of their internal risk management and control systems, specifically covering financial reporting risks, sustainability reporting risks, operational risks, and compliance risks. This enhances insight for stakeholders on how these key risk areas are identified, managed, and monitored. The statement is included in our Managing Board Responsibility Statement.
The Dutch Banking Code
The Banking Code aims to ensure stable, service-oriented, and reliable banks for stakeholders by setting out principles of conduct for Dutch banks in terms of corporate governance, risk management, audit, and remuneration. By complying with the Dutch Banking Code, Rabobank demonstrates what it stands for and what Rabobank wants to be held accountable for. A overview of Rabobank’s compliance with the principles of the Dutch Banking Code can be found on www.rabobank.com.
Governance Code for Cooperatives
Rabobank is a member of the Dutch Council for Cooperatives (NCR). As such, Rabobank adheres to the Governance Code for Cooperatives, which aims to contribute to improving the level of cooperative entrepreneurship, member engagement, and the collective ethos and mutuality. Rabobank adheres to virtually all the principles and rules, taking into account the fact that the bank as a financial institution encounters limitations as well as assurances with respect to some principles and rules. Material exceptions are that the NCR Code states that member control is related to the members' use and the extent of reciprocity. Within Rabobank that is not the case. Moreover, Rabobank is managed to make a profit, which is added to the general reserves of the bank. For an overview of Rabobank’s application of the NCR Code, please refer to www.rabobank.com.
Remuneration
For Rabobank an important part of our people strategy is being a 'Great place to be' and shaping a future-ready organization. This ensures that Rabobank is able to retain, develop, connect, and attract talent in a competitive labor market. We also aim to empower our employees and stimulate diversity and inclusion. Therefore, we offer our employees a fair and competitive total remuneration package (including pensions), an attractive working environment and opportunities for personal growth. Our global performance management system GROW, our worldwide learning and development opportunities and the provision of a personal development budget contribute to our employees’ professional and personal development in line with the bank’s mission of ‘Growing a better world together’.
Our Group Remuneration Policy is aligned with Rabobank's business and people strategy, our cooperative mission and our position in society.
Stakeholder involvement
As a cooperative it is in our genes to connect with a wide range of stakeholders. We consider society at large as a stakeholder for all aspects of our products, services and operations. This includes external and internal stakeholders such as our members, customers, regulators, investors, different interest groups, employee representative councils and last but not least, employees. Through various formal and informal networks and panels, including the Rabobank Dialogue Expertise Centre, we continuously reach out to these stakeholders to hear their opinions and seek input and feedback.
Our 2.3 million members are a special stakeholder group. These members are organized in Local Members’ Councils and with their diverse backgrounds are a reflection of society at large. The Local Members’ Councils are represented in the General Members’ Council (GMC). The GMC is involved in Board remuneration matters. A committee, consisting of delegates from the GMC, advises the GMC on remuneration for the members of the Supervisory Board and on the Remuneration Policy for the Managing Board. The Works Council is periodically informed about developments on remuneration and (via annual reporting) on pay levels and pay ratios within the Netherlands.
Our employees are another large and prominent stakeholder group with regard to the development of our Remuneration Policy. We engage with our employees through all kinds of channels. Employees in the Netherlands are organized via unions for negotiations on labor conditions and Works Councils represent the Rabobank employees on a broad range of social topics. Via regular conversations and meetings with our Works Council we obtain the views from our employees on our Remuneration Policy and actual practices.
Where relevant and possible, we will always ensure that the input received from our stakeholders is seriously considered in setting our remuneration policies. This can be a challenge when different stakeholders have different and sometimes conflicting interests. Changes in laws and regulations, compliance and risk ensure that we constantly balance between interests and legal frameworks. Therefore, a balanced view, taking into account all interests, is required to design a Remuneration Policy that is optimally aligned with the interests of different stakeholders. The remuneration principles below reflect a number of the key choices Rabobank has made in this respect.
Remuneration Principles
Strong governance and risk management
Our Group Remuneration Policy applies to all Rabobank Group employees at all levels and entities and is updated annually and adopted by the Managing Board. It adheres to all legal and regulatory requirements, including voluntary application of the Dutch Corporate Governance Code and its principles on remuneration.
Our Group Remuneration Policy:
is aligned with Rabobank Group's risk appetite;
supports robust and effective risk management focused on the long-term performance of Rabobank Group, including Environmental, Social and Governance( ESG) risks;
safeguards the interest of customers, society and investors by a number of specific regulations;
discourages employees from taking undesirable risks (such as irresponsible sales practices);
contributes to a strong capital position.
Internal alignment
The policy promotes fairness and consistency in our approach to remuneration. It promotes equal treatment of all employees and aims to reward equal work equally. This is achieved using the Korn Ferry Hay job evaluation methodology, which analyses and measures jobs, and assigns a job grade for each position. Remuneration levels are linked to the job grade. We closely monitor our internal pay relativities to ensure internal fairness. Our historical pay ratios between average remuneration for Rabobank employees in the Netherlands and our Chair of the Managing Board remain significantly below 20:1, which is considered an important measure by external stakeholders such as trade unions.
External alignment
We aim to reward at the median of the relevant markets for our broader employee base. This approach enables us to attract and retain the right talent with the right capabilities, at the right time and in the right markets at an appropriate cost. Our salary ranges are benchmarked every year against the general and the financial market in the Netherlands and outside the Netherlands against the relevant local market.
Modest approach with regard to variable remuneration
Our Managing Board members do not receive variable remuneration as part of their regular remuneration package. Only a limited number of employees in the Netherlands are eligible to receive variable remuneration and only in case there is a compelling business reason for doing so. Variable remuneration is capped at 20% of fixed remuneration and, only in exceptional cases, individual variable remuneration up to 100% of fixed remuneration is awarded. On average, variable remuneration to our employees in the Netherlands does not exceed 20% of the fixed remuneration. For our employees outside the Netherlands, variable remuneration is capped at 100% of fixed remuneration. Rabobank does not apply the Dutch law provision allowing variable remuneration up to 200% of fixed pay for employees outside the EEA.
This approach to variable remuneration reduces adverse incentives for employees. Variable remuneration is never guaranteed, and performance management processes ensure that it does not reward for failure or misconduct. Several risk mitigating measures are in place for all variable payments, such as ex-ante and ex-post testing and the ability to apply malus and claw back. For those employees eligible for variable remuneration, a risk-mitigating target is part of their individual objectives. In exceptional cases, a sign-on or a buyout may be awarded to new hires, to compensate for the loss of (deferred) variable remuneration at their previous employer.
Sustainable performance
The Group Remuneration Policy is focused on delivering long-term performance. Our cooperative identity and Environmental, Social and Governance (ESG) targets are reflected in our performance management approach. Any variable remuneration awarded is based on a balanced mix of performance objectives, subject to at least 50% non-financial performance objectives.
Total Reward
In addition to pay, Rabobank offers an attractive total rewards package. Rabobank aims to be a Great place to be for employees where people can realize results for our customers, Rabobank and society. Rabobank offers employees a wide range of opportunities for learning and development, attention for employee well-being, a good pension scheme, workplace flexibility (Rabo@Anywhere) and ample career opportunities.
Remuneration Practices 2025
Collective Labor Agreement (CLA) NL
At year-end 2025 30,884 employees, including Obvion (2024: 30,715), were employed under the terms of the (Dutch) Rabobank CLA. The remuneration includes fixed remuneration, the Employee Benefit Budget (which provides flexibility and choice of employment terms), a pension scheme, and fringe benefits. For 2025, a collective salary adjustment of 4.25% in April was agreed with the unions. Furthermore, all employees will be entitled to a 10% Employee Benefit Budget (EBB).
Executive positions (non-CLA)
The levels of management below the Managing Board are referred to as “executive positions”. At year-end 2025, globally 208 employees (2024: 208) were in an executive position. The fixed remuneration packages for executives are determined by job grades, based on Hay points. These job grades are linked to five executive salary ranges. The majority of executives receive fixed remuneration only. A small number of the executive positions are eligible for variable pay, dependent on the type of work and on the type of business in which they operate.
Identified Staff
The group of employees with a material impact on Rabobank’s risk profile is designated as Identified Staff. In addition to the specific performance management requirements, specific risk-mitigating measures have been established regarding variable remuneration for Identified Staff. This includes the payment of variable remuneration on a deferred basis which enables adequate consideration of the risks related to the underlying business activities. A deferral policy also applies to non-Identified Staff employees receiving variable remuneration above a certain amount. Generally, the payment of variable remuneration to Identified Staff is spread over a period of four years. For those employees identified as "Senior management", however, the deferral policy stretches to five years. As determined by regulation, variable remuneration is awarded in the form of cash and instruments (each 50%).
In 2025, 12 employees within Rabobank Group (all Identified Staff; 11 Rabobank, incl. MB members, and 1 DLL) (2024: 13; 12 Rabobank and 1 DLL) earned a total remuneration (including pension contributions) of between EUR 1.0 and 1.5 million, and 2 employees (Identified Staff, both Rabobank, incl. MB members) (2024: 2) earned a total remuneration (including pension contributions) of between EUR 1.5 and 2 million.
Variable pay
In 2025, the budgeted variable remuneration for Rabobank Group worldwide was EUR 282.7 (2024: 272.5) million, approximately 7.2% of the total amount reserved for remuneration (2024: 7.3%).
Pay ratio
The average remuneration for Rabobank Group employees at year-end was EUR 130,876 which resulted in a pay ratio of 1:12.1 between the average remuneration and the remuneration of the Chair of the Managing Board. This ratio increased slightly compared with the previous year.
Pay ratio
| In thousands of euros | 2025 | 2024 | 2023 | 2022 | 2021 | 2020 |
|---|---|---|---|---|---|---|
| Annual total compensation for the Chair of the Managing Board1 | 1,581 | 1,505 | 1,454 | 1,218 | 1,218 | 1,218 |
| Average annual total compensation for Rabobank Group employees2 | 130.8 | 125.1 | 119.2 | 107.0 | 107.4 | 108.2 |
| Pay ratio | 12.1 | 12.0 | 12.2 | 11.4 | 11.3 | 11.3 |
- The annual total compensation represents the sum of base salary and pension expense.
- In line with the Dutch Corporate Governance Code, the average annual total compensation of the employees is determined based on the total wage costs in the financial year and the average number of FTE during the financial year. These figures include both internal and external employees.
Managing Board
The Managing Board is responsible for the management of Rabobank Group. Its mandate centers on delivering customer value, driving a future-proof strategy, maintaining financial resilience, and safeguarding the bank’s cooperative identity across all operations. The Managing Board fosters a culture of active engagement, where each member contributes meaningfully to strategic and operational discussions and participates in collective decision-making. In doing so, the specific expertise of each member is fully leveraged to support the bank’s long-term success.
The remuneration policy of the Managing Board is designed to support the execution of Rabobank’s strategy, promote sustainable growth and reinforce the bank’s cooperative identity. It aims to attract and retain highly qualified executives, while ensuring that remuneration is aligned with Rabobank’s long-term sustainable interests, stakeholder expectations, and risk policy. As a cooperative bank, it is considered essential that cooperative principles are firmly embedded in our remuneration policy, with fair pay, a moderate pay philosophy and social responsibility being key elements reflected throughout. Changes to the Remuneration Policy are presented to the General Members' Council for adoption, following consultation and involvement of the GMC Staffing and Remuneration Committee.
Managing Board members are appointed for a period of four years and their individual remuneration is determined for that specific period. The remuneration and other terms of employment of the individual Managing Board members are set by the Supervisory Board, within the boundaries of the Managing Board remuneration policy and the Group Remuneration Policy. Determination of individual pay levels is guided by the principle of collective responsibility among Managing Board members. This encourages optimal use of the diversity and available competencies and experience, and leads to team members who help and support each other, by using knowledge, and skills where they are needed. Within this team culture, collaboration is strengthened and Managing Board members are encouraged to also move outside their own direct area of primary responsibility if they can provide added value there. Next to the collective responsibility of the Managing Board, the market value of the role and the skills and experience of the individual Managing Board members are taken into account in determining the individual remuneration.
To ensure fair and competitive remuneration, regular benchmarking is conducted against industry standards and market trends. Every two years, Managing Board positions are evaluated against peer groups consisting of a cross-industry group within the Netherlands and a pan-European banking group. These peer groups are selected based on factors such as geography, organizational size, talent market relevance, and the presence of a purpose-driven or cooperative foundation. In addition to an external market comparison, laws and regulations, pay philosophy, board composition, internal pay ratios, stakeholder expectations, internal- and societal developments are relevant in determining the remuneration levels of the Managing Board.
Total remuneration
The total remuneration of the Managing Board consists of both primary and secondary components, and includes the following elements:
The pay mix of the Managing Board is strictly limited to fixed salary, with no variable remuneration included.
A pension scheme based on a defined contribution pension plan. The maximum income for pension accrual (regulated by law) was EUR 137,800 as of January 1, 2025.
In addition, the members of the Managing Board receive an individual pension budget of 24% of their individual fixed annual income above the threshold of the maximum pensionable income.
A Mobility Policy is in place for all members of the Managing Board for the purpose of commuting and business travel.
Individual remuneration
As of January 2025, a salary increase of 4% was implemented for all Managing Board members. The following overview presents the individual remuneration of all Managing Board members for the year 2025.
Remuneration Managing Board 2025
| In thousands of euros | Fixed remuneration | Variable remuneration | Extraordinary items | Pension expense1 | Total Remuneration | Fixed portion of the total remuneration2 | |||
|---|---|---|---|---|---|---|---|---|---|
| Managing Board member | Base salary | Fees | Fringe benefits3 | One-year variable | Multi- year variable | ||||
| Stefaan Decraene, CEO4 | 1,255 | - | - | - | 78 | - | 326 | 1,659 | 100% |
| Bas Brouwers, CFO | 1,057 | - | - | - | - | - | 277 | 1,334 | 100% |
| Els Kamphof, Wholesale & Rural5 | 869 | - | - | - | 48 | - | 230 | 1,147 | 100% |
| Carlo van Kemenade, Retail NL | 978 | - | - | - | - | - | 252 | 1,230 | 100% |
| Vincent Maagdenberg, CRO6 | 869 | - | - | - | 43 | - | 224 | 1,136 | 100% |
| Philippe Vollot, CFECO7 | 1,416 | - | - | - | 122 | - | 374 | 1,912 | 100% |
| Janine Vos, CHRO | 869 | - | 2 | - | - | - | 227 | 1,098 | 100% |
| Lara Yocarini, Vendor Finance8 | 869 | - | - | - | 30 | - | 224 | 1,123 | 100% |
| Alexander Zwart, CITO | 869 | - | 2 | - | - | - | 226 | 1,097 | 100% |
| Total | 9,051 | - | 4 | - | 321 | - | 2,360 | 11,736 | 100% |
- The pension expense includes pension based on maximum pensionable salary cap and compensation for the maximum pensionable salary cap
- The remuneration of the Managing Board is limited to fixed pay, members are not eligible for variable compensation. Any variable remuneration reported relate to variable pay from a previous non-MB role, a buyout or sign-on. Therefore these variable remuneration amounts are not taken into consideration in the calculation of the fixed portion of the total remuneration.
- Fringe benefits vary and includes financial advisory services and discount on mortgage interest.
- As per his appointment in 2023 a buyout has been awarded to compensate for the loss of the deferred variable remuneration at the previous employer. The vested part has been taken into consideration as multi-year variable.
- The multi-year variable relates to the vested part of a deferred compensation from prior (non-MB) position.
- As per his appointment in 2023 a buyout has been awarded to compensate for the loss of the deferred variable remuneration at the previous employer. The vested part has been taken into consideration as multi-year variable.
- The role of Chief Financial Economic Crime Officer requires in-depth, international expertise in the field of financial economic crime, which is valued with an extended salary on base salary. As per his appointment in 2022 a buyout has been awarded to compensate for the loss of the deferred variable remuneration at the previous employer. The vested part has been taken into consideration as multi-year variable.
- The multi-year variable relates to the vested part of a deferred compensation from prior (non-MB) position.
Remuneration Managing Board 2024
| In thousands of euros | Fixed remuneration | Variable remuneration | Extraordinary items | Pension expense1 | Total Remuneration | Fixed portion of the total remuneration2 | |||
|---|---|---|---|---|---|---|---|---|---|
| Managing Board member | Base salary | Fees | Fringe benefits3 | One-year variable | Multi- year variable | ||||
| Stefaan Decraene, CEO4 | 1,193 | - | - | - | 76 | - | 312 | 1,581 | 100% |
| Bas Brouwers, CFO | 1.017 | - | - | - | - | - | 266 | 1,283 | 100% |
| Els Kamphof, Wholesale & Rural5 | 827 | - | - | - | 55 | - | 220 | 1,102 | 100% |
| Carlo van Kemenade, Retail NL6 | 701 | - | - | - | - | - | 180 | 881 | 100% |
| Vincent Maagdenberg, CRO7 | 827 | - | - | - | 42 | - | 214 | 1,083 | 100% |
| Philippe Vollot, CFECO8 | 1,374 | - | - | - | 119 | - | 358 | 1,851 | 100% |
| Janine Vos, CHRO | 827 | - | - | - | - | - | 216 | 1,043 | 100% |
| Lara Yocarini, Vendor Finance9 | 485 | - | - | - | - | - | 124 | 609 | 100% |
| Alexander Zwart, CITO | 827 | - | 2 | - | - | - | 215 | 1,044 | 100% |
| Former member | |||||||||
| Kirsten Konst, Business Customers10 | 200 | - | - | - | - | 344 | 53 | 597 | 100% |
| Mariëlle Lichtenberg, Private Customes11 | 200 | - | 1 | - | - | 650 | 53 | 903 | 100% |
| Total | 8,478 | - | 3 | - | 292 | 994 | 2,211 | 11,977 | 100% |
- The pension expense includes pensions based on maximum pensionable salary cap and compensation for the maximum pensionable salary cap.
- The remuneration of the Managing Board is limited to fixed pay, members are not eligible for variable compensation. Any variable remuneration reported relates to variable pay from a previous non-MB role, a buyout or sign-on. Therefore these variable remuneration amounts are not taken into consideration in the calculation of the fixed portion of the total remuneration.
- Fringe benefits vary and include financial advisory services and discount on mortgage interest.
- As per his appointment in 2023 a buyout has been awarded to compensate for the loss of the deferred variable remuneration at the previous employer. The vested part has been taken into consideration as multi-year variable.
- The multi-year variable relates to the vested part of a deferred compensation from prior (non-MB) position.
- Carlo van Kemenade has been appointed as MB member Retail NL as from April 4, 2024.
- As per his appointment in 2023 a buyout has been awarded to compensate for the loss of the deferred variable remuneration at the previous employer. The vested part has been taken into consideration as multi-year variable.
- The role of Chief Financial Economic Crime Officer requires in-depth, international expertise in the field of financial economic crime, which is valued with an extended salary on base salary. As per his appointment in 2022 a buyout has been awarded to compensate for the loss of the deferred variable remuneration at the previous employer. The vested part has been taken into consideration as multi-year variable.
- Lara Yocarini has been appointed as MB member Vendor Finance as from June 5, 2024.
- Kirsten Konst resigned as Managing Board member per April 4, 2024. She is entitled to a severance payment as disclosed under 'Extraordinary items’. Until January 1, 2025, she was appointed as Advisor to the Managing Board on sustainability, receiving the same remuneration level. After that, a notice period started in which the employee is entitled to six-months’ salary.
- Marielle Lichtenberg resigned as Managing Board member per April 4, 2024. She is entitled to a severance payment as disclosed under 'Extraordinary items’. Until June 1, 2024, she performed the transfer of her activities and completed some remaining tasks, receiving the same remuneration level. After that, a six-month notice period started. Her employment ended on December 1, 2024.
Individual Loans
The outstanding loans of the members of the Managing Board in office and the average interest rates on December 31, 2025 were as follows:
Outstanding Loans Managing Board
| In millions of eurosOn 31 December, 2025 | Outstanding Loans | Average Interest Rate (in %) |
|---|---|---|
| Bas Brouwers | 0.68 | 1.50 |
| Els Kamphof | 0.33 | 1.25 |
| Carlo van Kemenade | 0.88 | 1.96 |
| Janine Vos | 1.11 | 1.58 |
| Lara Yocarini | 0.06 | 1.08 |
| Alexander Zwart | 0.12 | 5.30 |
Members of the Managing Board not listed in the table have not received any loans, advances or guarantees at year-end 2025.
Supervisory Board
The compensation fee levels for Supervisory Board roles are adopted by the General Members’ Council. These fees are benchmarked every two years against a cross‑industry peer group in the Netherlands and a pan‑European banking peer group. The Supervisory Board may apply annual indexation to the fees. For 2025, the Supervisory Board decided to increase the compensation fees by 4%. The fee structure for 2025 is as follows:
Fee Structure Supervisory Board
| As of January 1, 2025 | |
|---|---|
| In euros | Fee |
| Chair | 239,096 |
| Member | 97,812 |
| Additional fees | |
| Supervisory Board deputy chair | 32,604 |
| Chair Audit Committee | 21,736 |
| Chair Risk Committee | 21,736 |
| Chair Cooperative Affairs Committee | 21,736 |
| Chair HR & Remuneration Committee | 10,868 |
| Chair Appointments Committee | 10,868 |
| Chair and member Financial Economic Crime Committee1 | 10,868 |
- Temporary committee
Supervisory Board members living abroad receive a compensation for each multi-day official SB meeting they are required to attend physically in the Netherlands. The compensation, as adopted by the General Members’ Council, serves to compensate for additional time commitments as well as travel and accommodation expenses. The amount is determined based on the member’s country of residence. Supervisory Board members residing in the Netherlands are reimbursed according to the standard per-kilometer rate.
Individual remuneration
Remuneration Supervisory Board 2025
| In thousands of euros | Fixed remuneration | ||||
|---|---|---|---|---|---|
| Supervisory Board member | Base fee1 | Additional fees2 | Attendance fees3 | Total remuneration | Fixed portion of the total remuneration4 |
| Marjan Trompetter (Chair) | 239 | 11 | - | 250 | 100% |
| Johan van Hall (Vice-Chair) | 98 | 65 | - | 163 | 100% |
| Sandra Berendsen | 98 | - | - | 98 | 100% |
| Driek Desmet5 | 72 | - | 28 | 100 | 100% |
| Miriam van Dongen | 98 | 21 | - | 119 | 100% |
| Matthew Elderfield | 98 | 33 | 36 | 167 | 100% |
| Brian Hirman6 | 28 | - | - | 28 | 100% |
| Gail Klintworth | 98 | - | 28 | 126 | 100% |
| Mark Pensaert | 98 | 11 | 6 | 115 | 100% |
| Bart Zegers7 | 28 | - | - | 28 | 100% |
| Former member | |||||
| Petri Hofsté8 | 16 | 1 | - | 17 | 100% |
| Total | 971 | 142 | 98 | 1,211 | 100% |
- Fee as a SB member of Rabobank
- Fee as a chair of a SB committee
- Attendance fee for SB members living outside the Netherlands
- SB members are not eligible for variable compensation
- Driek Desmet has been appointed as SB member as from April 9, 2025
- Brian Hirman has been appointed as SB member as from September 17, 2025
- Bart Zegers has been appointed as SB member as from September 17, 2025
- Petri Hofsté resigned as SB member as from March 3, 2025
Remuneration Supervisory Board 2024
| In thousands of euros | Fixed remuneration | ||||
|---|---|---|---|---|---|
| Supervisory Board member | Base fee1 | Additional fees2 | Attendance fees3 | Total remuneration | Fixed portion of the total remuneration4 |
| Marjan Trompetter (Chair) | 227 | 10 | - | 238 | 100% |
| Johan van Hall (Vice-Chair) | 93 | 31 | - | 124 | 100% |
| Sandra Berendsen5 | 5 | 5 | 100% | ||
| Miriam van Dongen6 | 25 | 25 | 100% | ||
| Matthew Elderfield | 93 | 19 | 56 | 168 | 100% |
| Petri Hofsté | 93 | 31 | - | 124 | 100% |
| Gail Klintworth | 93 | - | 44 | 137 | 100% |
| Mark Pensaert | 93 | 22 | 35 | 150 | 100% |
| Former member | |||||
| Arian Kamp7 | 88 | 20 | - | 107 | 100% |
| Pascal Visée8 | 88 | 10 | - | 98 | 100% |
| Total | 899 | 143 | 135 | 1,177 | 100% |
- Fee as a SB member of Rabobank
- Fee as a chair of a SB committee
- Attendance fee for SB members living outside the Netherlands
- SB members are not eligible for variable compensation
- Sandra Berendsen has been appointed as SB member as from December 11, 2024
- Miriam van Dongen has been appointed as SB member as from September 25, 2024
- Arian Kamp resigned as SB member as from December 11, 2024
- Pascal Visée resigned as SB member as from December 11, 2024
Individual Loans
The outstanding loans of the members of the Supervisory Board in office on December 31, 2025 and the average interest rates were as follows:
Outstanding Loans Supervisory Board
| In millions of euros | Outstanding Loans | Average Interest Rate (in %) |
| On 31 December, 2025 | ||
| Sandra Berendsen | 1.25 | 3.77 |
| Marjan Trompetter | 0.58 | 2.95 |
| Bart Zegers | 0.63 | 1.98 |
Members of the Supervisory Board not listed in the table had not received any loans, advances or guarantees at year-end 2025.
Report of the Supervisory Board
In 2025, the Supervisory Board functioned within a landscape marked by ongoing geopolitical tensions and greater (market) volatility. The global context demanded a high degree of organizational resilience, adaptability, and vigilance. In the Netherlands, the political and economic landscape continued to evolve, requiring Rabobank to remain agile and forward-looking. The Supervisory Board placed a strong emphasis on stress testing, recovery planning, and robust risk management, recognizing the importance of business continuity and resilience in an unpredictable world.
As a cooperative bank with the mission “Growing a better world together,” Rabobank’s Supervisory Board remained committed to creating societal impact, advancing sustainability objectives, and ensuring the effective functioning of cooperative governance. In 2025, the Supervisory Board supported the Managing Board in further developing the bank’s medium term plans, with a focus on sustainable growth and cost control. The Supervisory Board also prioritized its supervision on the integration of digital innovation, cybersecurity, and third-party dependency management into the bank’s management agenda.
Rabobank’s Supervisory Board, in alignment with the cooperative bank’s mission of “Growing a better world together,” maintained its dedication to generating societal impact, advancing sustainability objectives, and upholding the principles of effective cooperative governance.
The composition of the Supervisory Board and Managing Board evolved further in 2025. The Supervisory Board welcomed new members Driek Desmet, Brian Hirman, and Bart Zegers. Marjan Trompetter and Johan van Hall were reappointed. The Supervisory Board also reappointed Stefaan Decraene as Chair of the Managing Board and Janine Vos as Chief Human Resources Officer. A key structural development was the establishment of the Chief Operating Officer (COO) role within the Managing Board as of 1 January 2026, reflecting the bank’s ambition to strengthen group-wide operational excellence, data management, and resilience. The Supervisory Board decided to appoint Philippe Vollot as COO, recognizing his proven track record in Financial Economic Crime (FEC), operations, and transformation.
FEC remained a central focus for the Supervisory Board throughout 2025. With the completion of the FEC remediation program, Rabobank transitioned from remediation to a business-as-usual (BaU) approach for FEC. The Supervisory Board conducted a comprehensive review of its own FEC oversight, ensuring that the governance, committee structure, and reporting lines were fit for purpose for the BaU phase, while maintaining heightened attention as long as the DNB instruction remains in place. The Supervisory Board continued to monitor FEC closely, both through dedicated committee work and integration into the broader risk and audit agenda, and remains committed to robust oversight and continuous improvement in this critical area.
Also, the Supervisory Board spent considerable time discussing sustainability goals, regulatory requirements, and technological developments aligning with the bank’s strategy, policies, operations, reporting, risk management, and governance. The Supervisory Board focused on enhancing the bank's core organization, including risk management, technology, digitalization, credit models, data management, and compliance with regulations like the Corporate Sustainability Reporting Directive (CSRD) and the Digital Operational Resilience Act (DORA). The Supervisory Board observed that Rabobank continued to focus on and invest time and effort in these key topics and noted progress.
Key topics for 2025
For 2025, the Supervisory Board identified a number of key topics for their oversight activities. Each quarter, progress on these priorities was evaluated, and adjustments were made, as necessary. This dynamic approach ensured that the Supervisory Board remained responsive to emerging challenges and opportunities. In addition to regular supervisory matters, the Supervisory Review and Evaluation Process (SREP) planning cycle, the Internal Capital and Liquidity Adequacy Assessment Processes (ICAAP/ILAAP), the Integrated Risk Reports, Compliance and Financial Economic Crime (FEC) reporting, interim financial statements, and the annual financial statements and audit outcomes, the following key topics received specific and focused attention from the Supervisory Board.
Continuity in and composition of the Managing Board and Supervisory Board
In 2025, the Supervisory Board was a driving force behind several important changes and reappointments within both the Managing Board and the Supervisory Board itself. As the employer of the Managing Board, the Supervisory Board shaped the changes to the Managing Board in 2025. The Supervisory Board ensured that the composition and leadership of the Managing Board continued to meet the evolving needs of Rabobank. The focus remained on appointing leaders who are result-oriented, client-focused, and cooperative-minded, and who are able to inspire, motivate, and deliver impact. Through careful succession planning and targeted development, the Supervisory Board safeguarded both continuity and renewal within the Managing Board, supporting Rabobank’s long-term ambitions and values.
Within the Managing Board, Janine Vos was reappointed as Chief Human Resources Officer (CHRO) and member of the Managing Board for a new four-year term, effective 1 September 2025.
The Supervisory Board guided the further development of the Chief Operating Officer (COO) role, reflecting Rabobank’s ambition to enhance group-wide operational excellence, data management, and resilience and maintain strong focus on FEC risk management. Following a thorough selection and assessment process, the Supervisory Board resolved to appoint Philippe Vollot as COO, as of January 1, 2026. The Supervisory Board also reappointed Stefaan Decraene as Chair of the Managing Board for a new four-year term, effective 1 January 2026. The Supervisory Board expressed its confidence in Stefaan’s leadership and vision, recognizing his pivotal role in guiding Rabobank through a period of transformation and strategic renewal. His reappointment ensures stability at the top of the organization and provides a strong foundation for the further execution of Rabobank’s strategy in the years ahead.
On April 9, 2025, the Rabobank’s General Members’ Council appointed Driek Desmet as a member of the Supervisory Board, bringing valuable expertise in technology, data, innovation, digitization, and artificial intelligence. On September 17, 2025, the General Members’ Council appointed Brian Hirman and Bart Zegers as new members of the Supervisory Board, further strengthening the board’s diversity and cooperative governance experience. Marjan Trompetter was reappointed for a final term, ensuring continuity and consistent leadership within the Supervisory Board. On December 10, 2025, the General Members’ Council reappointed Johan van Hall for a new four‑year term. Petri Hofsté stepped down from the Supervisory Board on March 3, 2025, with careful attention paid to succession planning.
Throughout the year, the succession plan for both the Managing Board and the Supervisory Board remained a recurring theme, with a strong focus on diversity, continuity, and the alignment of competencies with Rabobank’s strategic ambitions.
As the employer of the Managing Board, the Supervisory Board is responsible for the appointment, evaluation, and ongoing development of its members. To ensure a consistent and structured approach, the Supervisory Board applies the bank‑wide GROW assessment framework to the Managing Board. This includes the annual objective‑setting cycle, two informal mid‑year discussions focused on progress and leadership effectiveness, and a formal end‑of‑year appraisal. The mid‑year conversations, conducted by individual Supervisory Board members, serve primarily to take a qualitative pulse on performance, collaboration, and team dynamics. The formal end‑of‑year appraisal is conducted by the Chair and Vice Chair of the Supervisory Board for the Chair of the Managing Board, and by the Chair of the Supervisory Board and the Chair of the Managing Board for the other Managing Board members. These assessments are informed by results achieved, 180‑degree feedback, leadership behaviors, and the Supervisory Board’s collective judgment. Through this structured and transparent process, the Supervisory Board ensures that the Managing Board operates effectively, upholds Rabobank’s values, and remains equipped to deliver on the bank’s ambitions.
Strategy, governance, and transformation
In 2025, the Supervisory Board contributed to the development and monitoring of Rabobank’s strategy. The Mid Term Plan (MTP) process was strengthened into an integrated planning cycle that links strategic deliberations to business planning and performance steering. The refined MTP framework explicitly integrates financial implications, the Risk Appetite Statement (RAS), sustainability objectives, and strategic workforce planning with emphasis on quantitative and qualitative capabilities needed, ensuring that strategic priorities, resource deployment, organizational capacity, and long‑term impact are aligned.
The Supervisory Board participated in scenario-based discussions, including opportunities for mergers and acquisitions, capital allocation, and the bank’s long-term vision for 2030 and beyond, taking into account geopolitical developments and the need for resilience.
As advisor, the Supervisory Board provided input to the Managing Board on strengthening a business‑driven and client‑focused approach across Wholesale & Rural and Retail NL, with particular emphasis on cost management, operational efficiency, and the integration of innovation and digitalization. This included the continued rollout of W&R Next, the further development of the urban strategy for Retail NL, and cooperative initiatives. For Retail NL, a dedicated growth plan for urban areas was developed, aimed at attracting younger customer segments and enhancing the end‑to‑end customer journey, a topic explored in greater depth during one of the Supervisory Board’s offsite sessions. The Supervisory Board also discussed stakeholder engagement and the role of urban communities in shaping strategic direction, ensuring that client focus remained a guiding principle throughout.
In its supervisory role, the Supervisory Board monitored transformation programs within Wholesale & Rural (W&R) and DLL, focusing on product standardization, team integration, and a unified global operating model. The Supervisory Board reviewed progress on these programs, including growth, cost management, and compliance with regulatory and risk management requirements. For DLL, the Supervisory Board oversaw the development of a 2030 vision, leadership changes, and responses to market conditions in Brazil and the United States, assessing the impact on portfolio, costs, and risk management.
Regarding governance, the Supervisory Board approved the Managing Board’s decision regarding the amendment of the Articles of Association of Coöperatieve Rabobank U.A., the accompanying amendments to the Local Rules, and revisions to the rules of the GMC Urgent Affairs Committee, the GMC Coordination Committee, and the GMC Staffing & Remuneration Committee. These proposals, as prepared by the Managing Board, were endorsed by the Supervisory Board and subsequently adopted by the GMC in June 2025.
The Supervisory Board also reviewed the implementation of new organizational structures and reporting lines, ensuring alignment with the bank’s strategic objectives. Throughout the year, the Supervisory Board evaluated progress on cooperative development, strategic initiatives, transformation, and governance through offsite sessions, benchmarking, and stakeholder meetings, supporting a streamlined, customer-oriented, and future-ready organization with attention to societal impact, sustainability, and cooperative value.
Building organizational resilience and performance
In 2025, the Supervisory Board reinforced its oversight of data management, innovation, and IT to strengthen organizational resilience and performance. Key oversight priorities included the focus on, among others, Identity and Access Management (IAM), cybersecurity, legacy system modernization, business continuity management (BCM), recovery, and the adoption of artificial intelligence (AI).
Organizational resilience was a central theme throughout the year. The Supervisory Board monitored the bank’s preparedness for geopolitical risks, cyber threats, and regulatory developments, including the implementation of the Digital Operational Resilience Act (DORA). Oversight extended to key controls, the control framework, and the transition to a new external auditor. The Supervisory Board also supervised stress testing, recovery planning, and third-party dependency management, challenging the Managing Board to maintain vigilance and embed resilience into the bank’s culture and operations.
In parallel, the Supervisory Board continued to focus on business performance, cost management, and fostering a balanced performance and risk culture. Cost management programs were closely tracked, while leadership development, diversity, and collaboration between business and IT remained high on the agenda. Through these efforts, the Board supported the Managing Board in promoting accountability, innovation, and continuous improvement across the organization.
The Supervisory Board was pleased with the alignment of the risk, performance, sustainability, and HR approach in the Medium Term Plans 2026-2028, further building on the business plans. This integrated approach effectively balances financial projections, risk appetite, sustainability implications, and strategic resource planning.
Sustainability
In 2025, the Supervisory Board embedded sustainability impact, risk, and return in an integrated manner across its oversight activities. Building on the strengthened Mid Term Plan (MTP) process, sustainability was explicitly incorporated into strategic and business planning, including quantified targets on financed emissions, sustainable assets, and sector‑ and region‑specific ambitions. The Supervisory Board monitored progress against these objectives and challenged the Managing Board to maintain a forward‑looking and regulatory‑compliant approach, ensuring that sustainability considerations, financial performance, and risk appetite remained closely aligned.
Governance and strategic developments regarding sustainability remained high priorities for the Supervisory Board and its committees. Sustainability is central to Rabobank’s mission and its role in transitions related to climate, food and agriculture, and financial inclusion. The Supervisory Board addressed sustainability from multiple perspectives, including strategy, business opportunities, portfolio decisions, governance, risk management, compliance, and reporting. The Supervisory Board also monitored the bank’s interactions with external stakeholders.
Throughout the year, the Supervisory Board reviewed updates from the Chief Sustainability Officer and monitored the implementation of the Corporate Sustainability Reporting Directive (CSRD). The Supervisory Board discussed proof points for measuring and steering sustainability, and the reporting approach for 2026. Deep dives were conducted into sustainability themes within Wholesale & Rural, Retail NL, and DLL, as well as global standards on sustainability acceptance and performance.
Knowledge development was actively supported through Permanent Education sessions, which covered climate adaptation, CSRD and ESG reporting, strategic drivers for ESG, and regulatory developments. These sessions enabled the Supervisory Board to maintain up-to-date expertise and oversight of key sustainability topics, regulatory requirements, and emerging trends. Throughout 2025, the Supervisory Board ensured that sustainability remained embedded in Rabobank’s decision-making processes, organizational culture, and long-term strategy.
Cooperative impact
Over recent years, the Supervisory Board has overseen the development and implementation of various initiatives to strengthen Rabobank’s cooperative identity. The Supervisory Board has supported ongoing evaluations of cooperative governance, drawing on feedback from members’ councils, the Supervisory Board, the Managing Board, and broad dialogues across all levels of the organization. These efforts have contributed to meaningful improvements in cooperative governance and cooperative impact at all levels of the bank.
Throughout 2025, the Supervisory Board was closely involved in the further development of the cooperative. The Supervisory Board discussed a wide range of topics, including the Cooperative Initiatives Strategic Framework, execution of the governance evaluation results, updates on cooperative governance and cooperative development, recalibration of membership, the Rabo for Society Hub, and the evaluation and preparation of “Onze Dag.” It also reviewed progress on impact plans and the bank’s cooperative banking activities, ensuring that cooperative principles remained embedded in strategy and decision‑making. In addition, the Supervisory Board monitored the establishment of the Rabo Impact Foundation and discussed related (governance) implications.
Regular engagement with the GMC and its Committees, participation in district meetings, local bank visits, and ongoing dialogues with members and customers enabled the Supervisory Board to remain directly connected to developments within the cooperative domain. These activities supported the continuous evaluation and enhancement of cooperative governance, ensuring that Rabobank’s cooperative identity remains central to its mission and strategy.
Financial Economic Crime: Transition to Business-as-Usual
In recent years, the Managing Board and the Supervisory Board have maintained a focus on Rabobank’s responsibilities in preventing and quickly detecting financial economic crime and ensuring compliance with applicable regulations. Under instruction from the Dutch Central Bank, Rabobank implemented remediation plans to address anti-money laundering and counter-terrorism financing requirements. The Supervisory Board’s temporary Financial Economic Crime Committee monitored progress, supported by reporting from Financial Crime Compliance and Audit Rabobank. FEC topics were regularly discussed at Supervisory Board meetings, overseeing controls, compliance culture, and reporting, supporting Rabobank’s ongoing efforts to meet regulatory obligations in the area of financial economic crime prevention.
In 2025, the remediation program was completed and Rabobank transitioned to a business‑as‑usual state for financial economic crime activities. The Supervisory Board subsequently reviewed its oversight approach, focusing on how FEC topics would be embedded within the regular committee structure and how ongoing regulatory compliance would be monitored. As part of this transition, the Supervisory Board decided to maintain the FEC Committee from 2026 onwards to oversee the validation of the completed remediation program, while integrating all other FEC‑related topics into the agendas of the Audit, Risk, and HR & Remuneration Committees. This ensures that oversight of financial economic crime remains a permanent and well‑embedded element of Rabobank’s governance framework.
The Supervisory Board’s Core Team Regulatory continued to fulfil its role regarding matters related to the criminal investigation by the Dutch Public Prosecutor (DPP), as did the full Supervisory Board. In this context, the Supervisory Board considered scenarios, risks, and strategic implications, and weighed the interests of all stakeholders of the Bank. The Supervisory Board emphasized the importance of following a thorough and well-considered process, especially when engaging with the relevant authorities. The Supervisory Board noted that no agreement was reached in 2025 with the DPP on an amicable end to its investigation, that the case will therefore most likely proceed to court, and monitored that Rabobank continues to cooperate with the authorities in an appropriate manner.
Other topics considered by the Supervisory Board
In addition to regular yearly agenda items and the key topics mentioned above, the Supervisory Board addressed and discussed a wide range of topics in 2025, including:
Business performance of Retail NL, W&R, and DLL, including growth, client satisfaction, and developments in the Netherlands and internationally, with specific attention to Rabo Investments
Overall financial performance, capital and liquidity position, interest rate developments, inflation, and cost management
Risk management and control, credit models, data, and digitalization
(Inorganic) Growth, capital deployment, and cooperative initiatives
Progress on IT projects and costs, finance, and risk projects
Progress on strategic transformations, regulatory and change programs, and the Interest Only Mortgages de-risking strategy
Progress on AI, specifically integrating AI into business processes, along with the mid-term impact on organizational structures and employees and creating new opportunities
HR-related issues, including culture initiatives, leadership programs, and strategic resource planning
Evaluation of the performance of the Managing Board and individual Managing Board members, and follow-up on appraisals
Offsites Supervisory Board and Managing Board
The Supervisory Board organized two offsite meetings to enhance strategic discussions, encourage reflection, and further strengthen collaboration.
The Spring offsite, with the Managing Board, focused on resilience, geopolitical developments, and Rabobank’s strategic positioning in key sectors. The program featured interactive sessions on risk preparedness and long-term resilience, complemented by dialogues with local Management that provided perspectives on business, market trends, and challenges. The Supervisory Board and Managing Board explored scenarios for geopolitical uncertainty, supply chain disruptions, and sustainability imperatives, fostering a shared understanding of strategic priorities. This offsite reinforced the importance of adaptability and cultural alignment in navigating external shocks and maintaining competitive advantage.
The Autumn offsite was dedicated to ‘Banking in the Metropolitan Context’. The Supervisory Board examined Rabobank’s role in urban banking, the energy transition, and Food & Agri, combining client visits, stakeholder dialogues, and thematic sessions to integrate internal and external viewpoints. Discussions centred on Rabobank’s societal role, strategic challenges, and opportunities for impact. Key themes included the need for cultural transformation, multi-year investments, and cooperative identity.
Overview Permanent Education sessions
In 2025, the Supervisory Board continued to invest in its own development and expertise through a comprehensive Permanent Education program. These sessions were designed to keep Supervisory Board members informed on the latest developments in governance, regulation, risk management, and strategic trends relevant to Rabobank and the broader financial sector, while also bringing in external perspectives to enrich discussions.
The program addressed a wide range of topics, including updates on tax developments and legal frameworks impacting the banking sector; insights into climate adaptation, nature-related risks, and Rabobank’s role in supporting environmental transitions; and peer analysis of sustainability reporting, ambition levels, legal disclaimers, and the implementation of the Corporate Sustainability Reporting Directive (CSRD).
Cybersecurity was a key focus, with discussions on emerging trends, real-world ransomware cases in the financial industry, and best practices for defense and resilience. The Supervisory Board explored strategic drivers for the bank, including Environmental, Social, and Governance (ESG) factors, and received updates on the Digital Operational Resilience Act (DORA) and ICT risk management.
Other sessions covered developments in crypto asset regulation and the emergence of central bank digital currencies, compliance, and anti-money laundering measures within the evolving regulatory landscape for financial crime prevention, and trends in financial markets, regulatory priorities, and market surveillance. The program also examined the competitive environment in banking and financial services, assessed geopolitical risks and scenario planning for 2030 and 2035, and provided deep dives into ESG regulations and commitments.
Additional topics included the impact and opportunities of generative artificial intelligence for banking operations and strategy, best practices and regulatory requirements for data protection and data governance, and principles of fair customer treatment, including consumer protection and fraud prevention.
Meetings and attendance
In 2025, the Supervisory Board convened nine times with the Managing Board, as part of the regular meeting schedule. Next to these regular meetings, the Supervisory Board held two off sites, and several dedicated Supervisory Board meetings with a specific topic and / or follow up on actual developments, in attendance of the relevant Managing Board members.
The Supervisory Board also had eleven private sessions (with or without the Chair of the Managing Board). These were mainly to discuss confidential and recruitment or appointment matters. More details on the meetings of the Supervisory Board and its committees are in the table below. For an overview of the composition of the Supervisory Board’s Committees, please refer here.
In addition to the permanent committee meetings, the temporary FEC Committee convened six times. These meetings were attended by Committee members Mark Pensaert and Matthew Elderfield, with Marjan Trompetter and Johan van Hall also participating.
Overview Supervisory Board and Committees in 2025
| Composition and Attendance Figures of the Supervisory Board and Its Permanent Committees, as of December 31, 2025 | ||||||
| Meeting | SB | Risk | Audit | CSC | R & HR | Appointments |
|---|---|---|---|---|---|---|
| Number of formal meetings | # 9 | # 9 | # 7 | # 5 | # 5 | # 6 |
| Sandra Berendsen | 9/9 | 5 | 7/7 | 5/5 | - | - |
| Driek Desmet | 6/6 | 5/5 | 4 | 2 | 1 | - |
| Miriam van Dongen | 9/9 | 8/9 | 7/7 (Chair) | 1 | 1 | - |
| Matthew Elderfield | 9/9 | 9/9 (Chair) | 7/7 | 3 | - | - |
| Johan van Hall | 9/9 (Vice Chair) | 5 | 7/7 | 5/5 (Chair) | 5/5 (Chair) | 6/6 |
| Brian Hirman | 3/3 | 2 | 1 | 1 | - | - |
| Petri Hofsté | -/2 | -/2 | -/2 | -/2 | - | - |
| Gail Klintworth | 9/9 | 8/9 | 5 | 5/5 | 5/5 | 6/6 |
| Mark Pensaert | 9/9 | 9/9 | 3 | 5/5 | - | - |
| Marjan Trompetter | 9/9 (Chair) | 9/9 | 7 | 5/5 | 5/5 | 6/6 (Chair) |
| Bart Zegers | 3/3 | 1 | 3 | - | 2 | 2 |
- All Supervisory Board members may attend Committee meetings at their discretion.
- Driek Desmet was appointed as Supervisory Board member during the GMC meeting in April 2025. He simultaneously joined the Risk Committee as of April 9, 2025.
- Brian Hirman and Bart Zegers were appointed as Supervisory Board members during the GMC meeting in September 2025.
- Petri Hofsté resigned as member of the Supervisory Board on 3 March 2025.
Contacts with stakeholders
Contacts with GMC and local banks
Members of the Supervisory Board attended the Combined District Assembly Meetings (“gecombineerde kringvergaderingen”) and the meetings of the General Members’ Council (GMC) to prepare for and discuss the topics on the GMC agenda. These included both formal items, such as updates on the bank’s performance, sustainability developments, statutory amendments, remuneration topics, and (re)appointments, and the regular reporting by the Chairs of the Supervisory Board committees on their committees’ activities.
The Chair and Vice‑Chair of the Supervisory Board also participated in meetings of the GMC Staffing & Remuneration Committee and the GMC Coordination Committee. The GMC’s Urgent Affairs Committee convened six times. These meetings, chaired by the Chair of the Supervisory Board, who also serves as Chair of the GMC and the Urgent Affairs Committee, and regularly attended by the Vice‑Chair, addressed confidential matters requiring timely advice or approval on behalf of the GMC. These meetings also provided an opportunity to jointly reflect on and refine the committee’s functioning, resulting in a mutually valued and effective collaboration.
Throughout the year, Supervisory Board members visited local banks to meet with local directors, Local Supervisory Bodies, Local Members’ Councils, and employees to discuss regional developments, the functioning of cooperative governance, and feedback from members and customers. These interactions played an important role in further strengthening the cooperative governance.
A substantial part of the Supervisory Board’s engagement in 2025 related to the follow‑up on the recommendations arising from the governance evaluation. The Supervisory Board valued the exchanges with the GMC and the Evaluation Steering Committee (“begeleidingscommissie”), discussing the findings, implementation priorities, and bank‑wide implications. This joint effort resulted in concrete actions aimed at strengthening communication, onboarding and education, diversity and composition, and the alignment between local and group governance.
The Supervisory Board expressed strong appreciation for the active and constructive stance taken by the GMC throughout this year, particularly the thoughtful challenge and feedback provided.
Contacts with customers
During 2025, each of the Supervisory Board members paid visits to Wholesale and Rural Client Advisory Boards globally and visited Rabobank offices and Wholesale and Rural customers abroad. These visits have provided insights into key strategic issues, opportunities, and the challenges our customers and the bank are facing worldwide. They provided input for the Supervisory Board in challenging and supervising the execution and development of several topics related to Rabobank’s strategy. In addition, the Supervisory Board visited customers in the Netherlands as part of the offsite, as referenced in paragraph 3 (Offsites Supervisory Board and Managing Board).
Contact with external supervisory authorities
Members of the Supervisory Board met regularly with representatives of supervisory authorities, both national and international, through a combination of formal meetings and more informal exchanges. These interactions contributed to a constructive and increasingly collaborative relationship with the supervisory authorities.
In 2025, discussions focused on Rabobank’s strategy and performance, the transition from FEC remediation to business-as-usual, geopolitical developments, climate and sustainability topics, mortgage lending, and board successions. This dialogue helped ensure transparency, early alignment, and mutual understanding of key developments affecting the bank.
Contact with Rabobank’s Works Councils
As a participant in the Three Councils Consultation (‘drieradenoverleg’), the Supervisory Board remains informed about the topics and debates discussed in the Rabobank Works Council. Members of the Works Council attend these meetings alongside members of the Managing Board, the Chief HR Officer, and representatives from the Supervisory Board. In addition, the Chair and Vice‑Chair of the Supervisory Board meet regularly with the Works Council’s Appointment and Dismissal Committee (, where they discuss all relevant matters relating to appointments and reappointments of both the Managing Board and the Supervisory Board. Supervisory Board members are regularly attending meetings of the Rabobank (European) Works Councils. The Supervisory Board values the constructive relationship and the high‑quality dialogue with the members of the Rabobank Works Council and the European Works Council.
Conflict of interest and independence
In 2025 there were no transactions in which there are conflicts of interest involving Supervisory Board members that are of material significance to Rabobank or the Supervisory Board members.
The Supervisory Board, in its current composition, continued to meet best practices provisions 2.1.7 thru 2.1.9 of the Dutch Corporate Governance Code, concerning requirements of independency.
In addition, the Supervisory Board strengthened its overall framework for managing conflicts of interest. This included updating governance documentation, formalizing expectations for Supervisory Board members, and embedding more structured processes to ensure that potential or perceived conflicts are identified and addressed consistently and transparently. These measures also help to mitigate potential risks arising from the revised governance structure relating to DLL.
Self-evaluation of the Supervisory Board
In the final quarter of 2024, the Supervisory Board conducted a self-evaluation, gathering input from both its own members and the Managing Board. The assessment confirmed a constructive culture, with open dialogue and mutual respect. The Supervisory Board was recognized for its effective engagement with key stakeholders and its commitment to maintaining a diverse and skilled composition. Areas identified for further development included strengthening expertise in technology and data, refining strategic focus, and enhancing communication of expectations.
Throughout 2025, the Supervisory Board continued to build on these insights, guided by a dedicated “Way of Working” action plan. This plan emphasized improved team dynamics, ongoing reflection on the Supervisory Board’s level of involvement, and enhanced collaboration with the Managing Board. Key actions included optimizing meeting effectiveness, streamlining document preparation and submission, and integrating external perspectives into strategic discussions. The Supervisory Board also prioritized structured agenda planning and considered how to further strengthen its oversight of IT governance and business performance.
A new self-evaluation was conducted in the last quarter of 2025, again involving both boards. The results reflected a positive baseline in core oversight and governance, with continued progress on previously identified themes. Both boards expressed appreciation for the open and constructive atmosphere, effective collaboration, and the Supervisory Board’s commitment to continuous improvement. New oversight priorities for 2026 were established after the Supervisory Board’s reflection on its role in December 2025.
Quarterly evaluation sessions throughout 2025 supported ongoing reflection and adjustment, helping to maintain high standards of governance and strategic guidance. This iterative approach has reinforced the Supervisory Board’s effectiveness and adaptability, ensuring it remains responsive to the evolving needs of the organization and its stakeholders.
Supervisory Board Committees
The responsibilities and duties of the Supervisory Board and its permanent committees are described in the respective Rules of Procedure as can be found on www.rabobank.com. These Rules were updated and amended in 2025.
Risk Committee
General responsibilities and duties
The Risk Committee prepares the Supervisory Board’s decision-making regarding the supervision of the integrity and quality of the bank’s development and implementation of the risk governance framework, risk control system, and risk appetite. This entails, among others, reviewing and effectively challenging the risk analysis scenarios and promoting risk awareness within a strong risk culture.
Meetings
In 2025, the Risk Committee held nine regular meetings. As in previous years, one of the meetings was a combined meeting of the Risk Committee and the Supervisory Board to discuss the ICAAP/ILAAP stress testing outcome. In addition to the regular Risk Committee meetings, the Risk Committee and Audit Committee convened five times for joint meetings.
Annual recurring topics
The Risk Committee reviewed quarterly Integrated Risk Reports, covering all financial and non-financial risk types. The CRO provided updates on geopolitical and macroeconomic issues via the Risk Dashboard. The agenda featured focused reports on specific non-financial risks such as Operational Risk and Information Security. Regular briefings included Rabobank’s model landscape, SREP, product governance, regulatory requirements (BCBS239 and DORA), IT risk profile, mortgage portfolio, and changes to global policies.
The Chief Information Security Officer gave regular reports, giving the Risk Committee deeper understanding of how information security risks, especially cybersecurity, were being managed. The Risk Committee also guided the Supervisory Board on approving key regulatory topics such as ICAAP/ILAAP, the Group Risk Appetite Statement—which aligned with Rabobank's medium-term plans and budget—the Rabobank Group Recovery Plan, and the Group Remuneration Policy.
To stay current on relations with (home state) supervisors, including findings and investigations, the Risk Committee received ongoing updates from Supervisory Relations. Throughout the year, they discussed in detail the results and follow-up actions from various on-site inspections.
The Compliance reports, State of Privacy reports, and Legal reports were tabled for discussion in the joint meetings of the Risk Committee and Audit Committee.
Year-specific topics and deep dives
In 2025, the Risk Committee had frequent discussion about regulatory and geopolitical developments, such as shifting US policies, trade tariffs, and global tensions, particularly those affecting credit, liquidity, and country risk, remained a consistent point of attention. Beyond these recurring topics, the development of the Rabobank Group Survival Plan was a notable focus. This included refining crisis management protocols, clarifying the formal roles and responsibilities of the Managing Board and Supervisory Board, and strengthening measures for business continuity, data center resilience, and liquidity risk.
The Risk Committee also reviewed and challenged the results of stress test scenarios in light of geopolitical developments, Rabobank’s real estate portfolio, and risk management approach.
Operational risk and control effectiveness received sustained attention in 2025. The Risk Committee monitored progress on remediation plans for IT and cyber risks, including third-party risks, and held deep dives on vulnerability management, ransomware recovery, identity and access management, and was updated regularly about a bank-wide program aimed at strengthening business continuity management.
The discussions also included deep dives of various topics:
Rabobank’s interest-only mortgage portfolio (de-risking measures, balancing regulatory requirements with client impact and duty of care, communications strategy)
(Highly) Leveraged Transactions
Business continuity
Rabobank’s real estate portfolio and market developments
Regional developments (Europe, Africa & Asia region)
Trends in Private Equity and Private Credit markets
Basel IV implementation
DLL’s risk profile and interventions to implement structural improvements
Risk culture
Information security, including ransomware recovery and vulnerability management
Audit Committee
General Responsibilities and Duties
The Audit Committee prepares the Supervisory Board’s decisions on all matters regarding the integrity and quality of Rabobank group’s financial and sustainability reporting, the effectiveness of Rabobank group’s internal control systems framework, the reporting and functioning of the external auditor, the reporting and functioning of Rabobank Group’s internal audit function and the functioning of the Rabobank group’s compliance and risk function. The Audit Committee submits recommendations to the Supervisory Board on matters referred to in the Rules of Procedure either on request or at its own initiative.
Meetings
In 2025, the Audit Committee convened seven times, held one working session in preparation of the discussion on the 2026 budget, and five combined meetings with the Risk Committee. The internal auditor and external auditor were present at every Audit Committee meeting, and the Chief Compliance Officer was present based on the agenda setting. In addition, the Audit Committee had a private session with each of the internal and external auditors. Ernst & Young will be the new external accountant as of the financial year 2026 and therefore was present from the Audit Committee meeting of December 2025 on, initially as observer.
Annual recurring topics
Every quarter, the Audit Committee discussed the financial performance of Rabobank Group and the sensitivities of the results. In those meetings the Audit Committee challenged, among other things, the development and steering on the performance of the group and the key indicators of the performance to achieve the objectives set for the year. Other topics of discussion and challenges tabled for the Audit Committee were updates on relevant developments in the financial markets, benchmark reporting, global tax developments, quarterly internal audit reports, and quarterly compliance reports. The revision of the Corporate Governance Code in 2025, introduced the ‘Verklaring omtrent risicobeheer’ (VOR). The Supervisory Board supervised the company’s design and operating effectiveness of the internal risk management and control systems, as well as the integrity and quality of financial and sustainability reporting. The Audit Committee prepared the Supervisory Board’s deliberations and decision-making hereon including the way of substantiating the VOR and external auditor follow‑up.
In preparation for the approval by the Supervisory Board of the budget and discussion of the Medium Term Plan, the Audit Committee discussed the financial performance and budgets of the businesses in more detail during a working session with the responsible CFOs of the group functions and business units including the CFO of DLL, and the Chief Sustainability Officer. Thereafter, the Audit Committee reviewed the budget, considering among other things, Rabobank’s ambitions, capacity for growth and risk appetite, sustainability impact goals and financed emissions limits, and other critical assumptions applied. An important topic discussed was the development of the returns on capital within the different business lines. Also, the cost developments were discussed.
The Audit Committee reviewed the Interim Report and the Annual Report including the financial statements, the press release, and the Impact Report. As part of the review of these reports and on the basis of audit reports of the internal and external auditor, the Audit Committee challenged the application of critical accounting policies and reporting topics that require considerable judgment and estimation, including loan impairments and top-level adjustments on model outcomes of impairment allowances, the evaluation of legal claims and provisions, and the development in tax and other positions. CSRD was reported for the first time and PwC submitted a ‘limited assurance’ on this. The Audit Committee noted that although this is compliant, further maturity of the reporting is needed.
Also, the Audit Committee reviewed the disclosure of non-financial key figures and the integrated reporting approach, including sustainability reporting. The Audit Committee has welcomed the fact that the bank has continued to progress its non-financial and sustainability reporting in the Annual Report and the Impact Report. The Audit Committee considered the management’s report on internal controls on financial reporting and paid specific attention to controls in respect of IT security, access management, loan classification, and loan impairments.
Annually, the Audit Committee discusses and advises the Supervisory Board on approval of the internal auditor’s audit plan and reviews the Internal Audit charter. With the support of the quarterly internal audit reports, the Audit Committee discussed the quality of the control environment of the bank, the progress in addressing audit findings, and the performance of the internal audit function. Based on the positive outcome and a discussion on the findings and actions agreed, the Audit Committee appreciates the performance, the development of the function and audit approach, and focus of the Audit quality and effectiveness of the function.
Furthermore, the Audit Committee reviewed and discussed the funding plan and discussed and advised the Supervisory Board to approve the updated Compliance annual plan.
The Audit Committee has approved the audit plan of the external auditor (PricewaterhouseCoopers Accountants NV (PwC)) and has discussed the audit reports of the external auditor on the half year report, the Annual Report, the COREP and FINREP reporting and the non-financial information. The Audit Committee has monitored the independence of the external auditor. The Committee appreciates the insightful reporting and discussion with the auditors as well as the response to the annual evaluation of the audit team and engagement.
Year-specific topics and deep dives
In 2025, the Audit Committee held several in-depth discussions on specific topics, including an update on the interest policy and the implementation of Basel IV. Deep dives were conducted into the financial and risk performance of group companies DLL and BPD.
Cooperative and Sustainability Committee
General responsibilities and duties
The Cooperative and Sustainability Committee advises the Supervisory Board on all matters regarding the cooperative structure, organization and identity of Rabobank and shall make the preparations for the requisite decisions of the Supervisory Board, consisting of:
the assessment of the Managing Board’s reports on the cooperative organization and operations of Rabobank.
the submission of advice on cooperative affairs to the Managing Board, either on request or on its initiative.
In addition, the Cooperative and Sustainability Committee advises the Supervisory Board on client-, stakeholder-, market-, or service-related topics (also in relation to the sustainability ambitions, visions, and strategy on the basis of the sustainability targets formulated by the business units), either at the request of the Managing Board or at its own initiative.
The Cooperative and Sustainability Committee assesses and advises the Supervisory Board on how Rabobank’s cooperative identity and sustainability ambitions translate into strategic direction, stakeholder expectations, and market developments. It reviews the Managing Board’s insights into the cooperative organization and activities to create impact and provides targeted guidance to ensure decisions remain aligned with Rabobank’s member‑driven foundation.
For sustainability, the Committee sharpens Board oversight by identifying material themes, elevating the quality of strategic discussions, and monitoring shifts in the bank’s external environment. It supports the Supervisory Board in steering and supervising the sustainability elements of Rabobank’s strategy, helping ensure that ambitions are grounded, measurable, and consistently executed across the organization.
Meetings
In 2025, the Cooperative & Sustainability Committee convened five times.
Year-specific topics and deep dives
Throughout the year, the Supervisory Board's Cooperative and Sustainability Committee focused on strengthening Rabobank’s cooperative foundations: simplifying governance, modernizing member engagement, and reinforcing a coherent national cooperative model.
The bank advanced toward a more structured and forward‑looking cooperative organization, supported by the rollout of impact plans across all regions and the conclusion of the multi‑year Governance Evaluation program, which was approved in the General Members’ Council meeting in April 2025, marking the end of governance evaluation and initiating the implementation thereof.
Rabobank sharpened its intended societal impact by implementing a unified, purpose‑driven framework. With the creation of the Rabobank Impact Foundation - an independent foundation - the cooperative initiatives gained a clearer strategic anchor—focused on measurable impact, strong governance, and long‑term relevance. The overarching direction emphasizes a modern interpretation of what a cooperative bank contributes to society.
Across all business lines, sustainability shifted further into the heart of our daily business.
Retail NL, DLL, and W&R deepened their transition agendas, strengthening client resilience and integrating climate and nature considerations into portfolio steering—even amid shifting international regulation and rising stakeholder expectations.
The Committee’s oversight centered on maintaining credible progress, improving data foundations, and ensuring Rabobank remains a cooperative leader navigating a rapidly evolving sustainability landscape.
Remuneration and HR Committee
General Responsibilities and Duties
The Remuneration & HR Committee (R&HR) prepares the Supervisory Board’s decision making on remuneration and general human resource and organizational issues, such as strategic workforce planning, risk culture, performance management, employee engagement, and other current people issues. In addition, the R&HR Committee considers, whilst assuring compliance with the relevant rules and legislation, the consequences of these topics for our risks and risk management, considering the long-term interests of our stakeholders and acceptance by societal practice, as well as Rabobank’s long-term business, risk appetite, performance, and control environment. The R&HR Committee cooperates with the Risk Committee to evaluate the incentives created by the remuneration system and directly supervises the remuneration of senior management staff who perform control duties.
The R&HR Committee advises the Supervisory Board on decisions related to the Rabobank Group Remuneration Policy and assesses the remuneration practice within Rabobank Group for the highest earning employees based on an annual report, which in addition to the fixed and variable remuneration also contains information about the relevant retention, exit and welcome packages within Rabobank Group. Furthermore, the R&HR Committee prepares a central, independent, internal assessment to review (at least once annually) the general principles governing the remuneration policy and its implementation. Rabobank continues to pursue a prudent, restrained, and sustainable remuneration policy.
Information on remuneration in general and on variable remuneration can be found in the Remuneration section of this Annual Report and in the Pillar 3 report.
Meetings
In 2025, the R&HR Committee convened five times.
Annual recurring topics
As every year, the R&HR Committee addressed the remuneration of individual Managing Board members, (risk) culture and the One Rabobank Culture Plan, the Remuneration Policy for executives, Strategic Workforce Planning, the People Strategy, reports on misconduct, fraud and integrity, and Employee Engagement.
The R&HR Committee prepared the evaluation of the individual members of the Managing Board, in close cooperation with the Chair of the Managing Board and following the yearly GROW-cycle, and made provisions for the proper documentation of the appraisals.
In addition, the R&HR Committee discussed the performance targets for the Managing Board and the group targets for Identified Staff (please see the section on Remuneration [LB2] in this Annual Report for more information). The Committee carried out preparatory work for the Supervisory Board regarding the total spend on variable remuneration with an underlying risk assessment for Rabobank Group, and for the individual variable remuneration of employees classified as Identified Staff.
Also, the R&HR Committee spent considerable time to the policies around Talent Management.
Finally, the R&HR Committee discussed the Remuneration section [LB3] of the annual report before submitting it to the GMC Staffing and Remuneration Committee.
Year-specific topics
During 2025, the R&HR Committee evaluated the remuneration policy for the Managing Board, based on benchmark research, and discussed this subject multiple times with the SB and the GMC Staffing and Remuneration Committee. As a result, an updated remuneration policy was adopted by the GMC in December 2025, which will allow to follow market developments for the coming years. The committee advised about a general indexation with 3,0% of the remuneration of the members of the Managing Board, and about indexation with 3% of the fees of the Supervisory Board, per 1 January 2026.
The committee advised about an updated appointment contract for SB-members, including a non-competition clause, which was signed by all members.
The committee also spent in-depth time on specific HR-related themes, such as the People @ Work Strategy, (Gen)AI and its impact on employees and productivity, new upcoming rules about Equal Pay, geo-political developments in relation to Diversity, Equity and Inclusion (DEI), Talent Management, Leadership, and Strategic Workforce Planning.
Appointments Committee
General Responsibilities and Duties
The Appointments Committee advises the Supervisory Board for its decision-making in relation to the composition of the Supervisory Board, the Managing Board, and higher senior management positions, and the related (re)appointments.
For vacancies in the Supervisory Board or Managing Board, first a job profile is adopted by the Supervisory Board, after advice from the Staffing and Remuneration Committee of the General Members Council. For each vacancy, the Supervisory Board takes the general profile of the Supervisory Board as a starting point. This profile (which was updated in 2025) describes the tasks and responsibilities, composition, competencies, and areas of experience of the Supervisory Board as a whole. The Supervisory Board's multi-year succession plan is based on this profile and is updated at least once a year by the Supervisory Board and discussed with the GMC Staffing and Remuneration Committee.
Following the job profile, a longlist of candidates is drawn up, usually with the support of an executive search agency. In several iterations, the Appointments Committee selects a small number of candidates for a first round of interviews with Supervisory Board members and most times the Chair of the Managing Board and the CHRO. If these interviews result in a mutually positive view, more interviews follow with other members of the Supervisory Board and depending on the position also of the Managing Board. For Managing Board members, external assessments may be part of the procedure. Once a candidate is selected, compliance and integrity checks are organized, and if no objections occur, the Fit and Proper procedure by the external supervisory authorities is initiated, and the Works Council is asked for advice (Managing Board members) or for a declaration of no objection (Supervisory Board members). In the case of a Supervisory Board member, also the GMC Staffing & Remuneration Committee is asked for advice before the candidate is nominated for (re)appointment. Members of the Managing Board are (re)appointed by the Supervisory Board; members of the Supervisory Board are (re)appointed by the General Members Council.
Meetings
In 2025, the Appointments Committee convened six times.
Annual recurring topics
As every year, the Appointments Committee has discussed and adopted an update of the succession plan of the Supervisory Board, after having asked the Staffing and Remuneration Committee of the General Members Council (GMC) for advice. This committee advised the Supervisory Board on all personnel changes in the Supervisory Board and was informed beforehand about changes in the Managing Board, based on the respective boards’ succession plans and profiles.
The Appointments Committee evaluated the ongoing suitability of the members of the Managing Board and the Supervisory Board and reported according to regulations to the Joint Supervisory Team of the ECB and DNB. Also, the Appointments Committee discussed the succession planning of the Managing Board, reviewing the talent pipeline available for immediate succession, as well as the succession in the longer term. Also, meetings were organized with groups of newly appointed top executives and promising talents of the bank.
The Appointments Committee monitored the outside interest positions of the members of the Managing Board and the Supervisory Board, which are registered by Compliance. As part of talent management and in the context of searching and assessing potential candidates for the Supervisory and the Managing Board, the Appointments Committee regularly addressed the subject of (gender) diversity.
Year-specific topics
In 2025, the Appointments Committee discussed the profile for the new position of Chief Operating Officer and prepared the selection of a suitable candidate for this position. After careful considerations and based on interviews and an external assessment, Philippe Vollot was nominated for this position.
The Appointments Committee proposed to reappoint Stefaan Decraene per January 1, 2026, a year before his first term came to an end. With this reappointment clarity was provided about the continuation of the commitment of Stefaan Decraene to Rabobank and the continuity of the current good results, under his leadership. Also, the reappointment of CHRO Janine Vos for her third term was discussed and prepared by the Appointments Committee. The Supervisory Board (re)appointed all of them after the preconditions had been met.
In 2025, the GMC (re)appointed five Supervisory Board Members after careful preparation by the Appointments Committee and nomination of the candidates to the GMC. The Appointments Committee prepared the nomination of SB-member Driek Desmet, who was already selected in 2024, to the GMC in April 2025, bringing an IT/digital/AI/Data profile to the Board. Also, the selection of two other new SB members was prepared. Both Brian Hirman and Bart Zegers were recruited from the internal Rabobank organization (both were SB-members of local banks) for the profile of an experienced Dutch entrepreneur with board experience at a local Rabobank and/or the GMC, and knowledge of and experience with societal transitions and inclusive society. After a careful selection process, they were nominated by the Supervisory Board for appointment by the GMC in September 2025.
The Appointments Committee advised on the reappointments of Marjan Trompetter (Chair of the Supervisory Board) and Johan van Hall (Vice-Chair of the Supervisory Board). For Marjan Trompetter, the reappointment by the GMC in September 2025 is the start of her last term at Rabobank, pursuant the Dutch Corporate Governance Code. Reasons for reappointment are that the composition of the Managing Board and the Supervisory Board has changed significantly in recent years. As a consequence, the level of banking, management, and cooperative experience (especially regarding Rabobank) has decreased. All stakeholders highly value the way Marjan Trompetter fulfils her tasks and duties, and she brings in depth knowledge and experience with Rabobank’s specific cooperative governance, also in her role as Chair of the General Members’ Council.
Johan van Hall was reappointed for a second term by the GMC in December 2025.
Financial Economic Crime Committee
General Responsibilities and Duties
The Supervisory Board's ad hoc Financial Economic Crime (FEC) Committee was established in the last quarter of 2020. The main tasks and responsibilities of the FEC Committee are to monitor and signal important developments with respect to Rabobank FEC compliance with AML/CFT laws and regulations, to advise on, to deepen and to prepare discussions and decision-making within the plenary Supervisory Board and other committees on this critical topic. The FEC Committee reports its findings to the Supervisory Board. The FEC Committee thus supports Rabobank’s full commitment to fulfil its gatekeeper role in society and to comply with the AML/CFT laws and regulations.
From January 1, 2023, the scope of the FEC Committee included the remediation activities of the group leading towards AML/CFT compliance of Rabobank with a focus on the DRB and Wholesale & Rural remediation activities in response to the Instruction from DNB. AML/CFT compliance is furthermore discussed in the Supervisory Board’s (joint Risk and) Audit Committees based on the reports of the compliance function and internal audit function.
The prime role of the FEC Committee is the review, challenge, and monitoring of the progress of the remediation based on a plan that contains an integrated approach for the DRB and Wholesale & Rural remediation activities. The FEC Committee also discusses the findings and opinions of FEC Compliance and internal audit as part of the quarterly progress update.
Meetings
In 2025, 6 meetings, including deep dive sessions, of the FEC Committee were convened. In addition to the CFECO, representatives of internal audit and FEC Compliance are present at all meetings of the committee, together with invited members of the Managing Board and members of the FEC management team.
Annual recurring topics
In the quarterly meetings, the focus is on monitoring and discussing the status and progress made with respect to the remediation, as well as the regular business operations. Topics on the agenda included the quarterly progress reports, reports from FEC compliance, and internal audit as well as business updates on FEC.
Year-specific topics
In 2025, the FEC Committee discussed and noted steady and thorough progress towards the completion of the FEC remediation program focusing on the achievement of milestones in the remediation plan, quality of the work performed, validation by FEC Compliance and internal audit, and the development of adequate management information. Furthermore, the set-up, including robust reporting, of the business as usual was discussed, including the development of the target operating model.
In addition, several deep-dive sessions with Supervisory Board, Managing Board, and subject matter experts were organized to support the FEC Committee’s understanding of dilemmas and issues related to FEC activities in Rabobank’s daily working environment. A deep dive was organized on Low Risk Portfolio, Payment Service Providers, AMLA regulatory developments, and Agentic AI solutions.
In conclusion
Proposal to the GMC and conclusion
In accordance with the relevant provisions of the Articles of Association of Rabobank, the Supervisory Board has reviewed Rabobank’s Annual Report 2025 and annual accounts, as well as other relevant, associated information. The Supervisory Board discussed these documents with the Managing Board, the internal auditor and external auditor (PwC) and took note of the unqualified external auditor’s report that PwC issued on the annual accounts in 2025[SR4] . The Supervisory Board advises the GMC to adopt the 2025 annual accounts.
Words of appreciation
The Supervisory Board extends its great appreciation and respect to the members of the Managing Board and all Rabobank employees for their dedication to Rabobank’s customers and other stakeholders. Notable progress has been made in several key areas, including remediation and regulatory delivery, simplification, a more efficient organizational structures, strengthening the cooperative framework, particularly in the context of the governance evaluation, and ongoing sustainability actions whilst achieving a high financial result.
Furthermore, the Supervisory Board is grateful for the continuous cooperation and support of the members of the bank and its customers. Special gratitude is extended to the members of the GMC for their support, challenge, dialogues, and commitment during the year.
Members of the Managing and Supervisory Board
Members of the Managing Board
Stefaan Decraene, Chair
Bas Brouwers, Chief Financial Officer (CFO)
Vincent Maagdenberg, Chief Risk Officer (CRO)
Els Kamphof, Director Wholesale & Rural
Carlo van Kemenade, Director Retail NL
Phillipe Vollot, Chief Operating Officer (COO)
Janine Vos, Chief Human Resources Officer (CHRO)
Lara Yocarini, Director Vendor Finance
Alexander Zwart, Chief Innovation & Technology Officer (CITO)

From left to right:
Alexander Zwart, Lara Yocarini, Bas Brouwers,
Phillipe Vollot, Els Kamphof, Carlo van Kemenade,
Stefaan Decreane, Janine Vos, Vincent Maagdenberg
Stefaan Decraene (S.L.G.)
(Male, 1964, Belgian nationality)
Appointed to the Managing Board with effect from January 1, 2023.
His current appoint term expires on January 1, 2030.
Stefaan Decreane is Chair of the Managing Board and is also responsible for Audit, Legal, Sustainability & Climate, Corporate Strategy Office, Communication & Corporate affairs, and the Corporate Secretary & Cooperative.
Bas Brouwers (B.C.)
(Male, 1972, Dutch nationality)
Appointed to the Managing Board with effect from January 1, 2016.
Bas Brouwers is Chief Financial Officer and responsible for Finance and Control, Treasury, Group Tax, Investor Relations, and Portfolio Management. His current appointment term expires on September 1, 2027.
Carlo van Kemenade (C.G.M.)
(Male, 1964, Dutch nationality)
Appointed to the Managing Board with effect from April 4, 2024.
Carlo van Kemenade is responsible for Retail NL: Housing, Wealth Management, Payments, Digital Customer Processes, Digital Platform, Insurance & Pension, Business Lending, and B2B Services. His current appointment term expires on April 4, 2028.
Vincent Maagdenberg (V.)
(Male, 1976, Dutch nationality)
Appointed to the Managing Board with effect from April 1, 2023.
Vincent Maagdenberg is Chief Risk Officer and responsible for Risk Management and Compliance. His current appointment term expires on April 1, 2027.
Els Kamphof (E.G.)
(Female, 1967, Dutch nationality)
Appointed to the Managing Board with effect from September 1, 2023.
Els Kamphof is Director Wholesale and Rural, and also responsible for Global F&A Knowledge and Rabo Partnerships. She is member of the Board of Directors of Rabobank International Holding B.V., and member of Rabobank North American Board. Her current appointment term expires on September 1, 2027.
Phillipe Vollot (P.G.R.)
(Male, 1967, French Nationality)
Appointed to the Managing Board with effect from October 1, 2022.
Philippe Vollot was during 2025 Chief Financial Economic Crime Officer and responsible for counteracting Financial Economic Crime and money laundering, and compliance to the Wwft. As from January 1, 2026, he is appointed as Chief Operating Officer. That appointment expires on January 1, 2030.
Janine Vos (B.J.)
(Female, 1972, Dutch nationality)
Appointed to the Managing Board with effect from September 1, 2017.
Janine Vos is Chief Human Resource Officer, and responsible for the Human Resource policies and practices. Her current appointment term expires on September 1, 2029.
Lara Yocarini (L.)
(Female, 1980, Dutch nationality)
Appointed to the Managing Board with effect from June 5, 2024.
Lara Yocarini is responsible for Vendor Finance. She is also CEO of De Lage Landen International B.V. Her current appointment term expires on June 5, 2028.
Alexander Zwart (A.G.J.M.)
(Male, 1973, Dutch nationality)
Appointed to the Managing Board with effect from December 1, 2023.
Alexander Zwart is Chief Innovation & Technolgy Officer, responsible for Technology, Innovation, Digital Transformation, and Data & Analytics. His current appointment expires on December 1, 2027.
Relevant additional positions of the Managing Board members (December 31, 2025)
| Stefaan Decraene |
| |
| Bas Brouwers |
| |
| Carlo van Kemenade |
| |
| Vincent Maagdenberg |
| |
| Philippe Vollot |
| |
| Janine Vos |
| |
| Alexander Zwart |
|
Members of the Supervisory Board12
Marjan Trompetter, Chair
Johan van Hall, Vice-Chair
Sandra Berendsen
Driek Desmet
Miriam van Dongen
Matthew Elderfield
Brian Hirman
Gail Klintworth
Mark Pensaert
Bart Zegers
From left to right
Mark Pensaert, Sandra Berendsen, Johan van Hall,
Driek Desmet, Bart Zegers, Marjan Trompetter,
Matthew Elderfield, Brian Hirman,
Miriam van Dongen, Gail Klintworth.

Marjan Trompetter (M.)
(Female, 1963, Dutch nationality)
Appointed to the Supervisory Board with effect from 2015.
Her current appointment term expires in 2027.
Johan van Hall (J.)
(Male 1960, Dutch nationality)
Appointed to the Supervisory Board with effect from 2021.
His current appointment term expires in 2029.
Sandra Berendsen (J.W.)
(Female, 1973, Dutch nationality)
Appointed to the Supervisory Board with effect from 2024.
Her current appointment term expires in 2028.
Driek Desmet (D.H.B.)
(Male, 1966, Belgian nationality)
Appointed to the Supervisory Board with effect from 2025.
His current appointment term expires in 2029.
Miriam van Dongen (M.R.)
(Female, 1969, Dutch nationality)
Appointed to the Supervisory Board with effect from 2024.
Her current appointment term expires in 2028.
Matthew Elderfield (M.)
(Male, 1966, British nationality)
Appointed to the Supervisory Board with effect from 2023.
His current appointment term expires in 2027.
Brian Hirman (B.P.R.)
(Male, 1969, Dutch nationality)
Appointed to the Supervisory Board with effect from 2025.
His current appointment term expires in 2029.
Gail Klintworth (G.A.)
(Female, 1963, British and South-African nationality)
Appointed to the Supervisory Board with effect from 2023.
Her current appointment term expires in 2027.
Mark Pensaert (M.R.C.)
(Male, 1964, Belgian nationality)
Appointed to the Supervisory Board with effect from 2020.
His current appointment term expires in 2028.
Bart Zegers (B.)
(Male, 1982, Dutch nationality)
Appointed to the Supervisory Board with effect from 2025.
His current appointment term expires in 2029.
Relevant additional positions of the Supervisory Board members (December 31, 2025)
| Marjan Trompetter (M.) |
|
|
| Sandra Berendsen (J.W) |
|
|
| Driek Desmet (D.H.B.) |
|
|
| Miriam van Dongen (M.R.) |
|
|
| Matthew Elderfield (M.) |
| |
| Brian Hirman (B.P.R.) |
|
|
| Gail Klintworth (G.A.) |
|
|
| Mark Pensaert (M.R.C) |
|
|
| Bart Zegers (B.) |
|
- The members of the Supervisory Board committees are listed in the Report of the Supervisory Board.
- Information about the profession, the main position, and the additional positions of Supervisory Board members can be found on https://www.rabobank.com/en/about-rabobank/profile/organisation/board/supervisory-board.html
Appendices

Appendix 1: Methodology & Definitions Sustainability Statements
In this appendix the methodology and definitions used in Rabobank's Consolidated Sustainability Statements are disclosed.
Methodology & Definitions related to General Information
| Defined term | ESRS reference | Definition & methodology |
|---|---|---|
| Administrative, management and supervisory bodies | All | The governance bodies with the highest decision-making authority in the undertaking including its committees. The governance structure of Rabobank consist of a two-tier board with a Managing Board and Supervisory Board. Rabobank does not have administrative bodies. |
| Transitional provisions and use of phase-in provisions in accordance with Appendix C of ESRS 1 | ESRS 2 - BP-2 | Transitional provisions are adopted within Rabobank’s Sustainability Statements. In the event that not all necessary information regarding Rabobank’s upstream and downstream value chain is available, we explain the efforts made to obtain the necessary information and the reasons why all the information could not be obtained. We disclose these specific circumstances in the disclosures to which they refer.As part of the Omnibus Simplification Package, we consider the Commission Delegated Regulation (EU) 2025/1416 of 11 July 2025 amending Delegated Regulation (EU) 2023/2772, regarding the postponement of the data of application of the disclosure requirements of Appendix C of ESRS 1 of Annex I to the ESRS.There are some omissions in Rabobank's Sustainability Statements, mostly related to phase-in provisions. We do disclose the specific circumstances that led to these omissions. |
| Data collection of sustainability information | ESRS 2 - BP-2 | The collection of sustainability information is coordinated centrally within Rabobank Group. Group Sustainability shares responsibility with Finance for collecting sustainability data. Other information is obtained from our automated central management information system. Data that is not recorded in the central system is collected through qualitative and quantitative questionnaires (which are based on internal business principles, policies and external guidelines applied by Rabobank Group) or received from external parties. The coordinator of the respective information is responsible for collecting and reporting the information. Finance and Group Sustainability perform plausibility checks after submission and ensure that appropriate actions are taken to optimize the data quality. More information on the methodologies and definitions used for indicators included in this 2025 Report is provided in the respective section. |
| Statement on due diligence | ESRS 2 - GOV-4 | Core elements of due diligence and reference to relevant sections in the Sustainability Statements:
|
| Sustainable assets | ESRS 2 - SBM-1 | The financing of economic activities, projects, and assets that can be classified as dark green, social finance, green finance, transition finance, and/or transition-effort finance.
|
| Sustainable funding | ESRS 2 - SBM-1 | Sustainable funding includes Rabobank Green, Social and Sustainability Bonds and Deposits, Obvion Green, Social and Sustainability Bonds, Rabo Green Savings (Rabo Groen Bank B.V.), and Rabo Green Deposits (Rabo Groen Bank B.V.).Sustainable funding includes funding products with a sustainability earmark and consists of :
|
| Impact materiality | ESRS 2 - IRO-1 | When assessing and determining ESG topics from an impact perspective, we consider actual or potential, positive or negative impacts on people or the environment over the short, medium or long term. We consider impacts connected to our own operations and upstream and downstream value chain, including through our products and services, as well as through our business relationships. Within our impact assessment, we focus on assessing the drivers of the sustainability related impacts.For actual negative impacts, we base materiality on the severity of the impact, while for potential negative impact, we base materiality on the severity and likelihood of the impact. Scale, scope and remediability are considered from a severity perspective. For the potential negative human rights impact, we consider severity of its likelihood.For positive impacts, we base materiality on the scale and scope for actual positive impact, and the scale, scope and likelihood for potential positive impacts. |
| Assessment criteria and thresholds of impact materiality | ESRS 2 - IRO-1 | The severity of the impact is determined based on scale and scope, and for negative impact also, the remediability. The scale of our actual and potential impact is assessed against a five-point scale; minimal, low, medium, high and absolute. The scope of our actual and potential impact is also assessed against a five-point scale; limited, concentrated, medium, widespread and total. The remediability of the impact is determined on a six-point scale. Very easy to remedy, relatively easy to remedy short-term, remediable with effort, difficult to remedy (mid-term), very difficult to remedy (long-term) and non-remediable/irreversible. The likelihood of occurrence is assessed against a five-point scale. Rare, unlikely, possible, likely and (almost) certain. We consider a topic to be material if the average severity of impact and likelihood of occurrence scores above the threshold of three. |
| Data sources and estimates of impact materiality | ESRS 2 - IRO-1 | For assessing impact materiality, we relied on several data sources and tools. The critical and most impactful data sources and tools used for assessing our impact are:
|
| Financial materiality | ESRS 2 - IRO-1 | The financial materiality of risks and opportunities is assessed based on a combination of the likelihood of occurrence and the potential magnitude of the financial effects over the short, medium or long term. We consider the average of three types of risk: financial, reputational and regulatory risks. The risk rating scales used are aligned with our Risk Control Framework and Global Standard on Risk Identification and Assessment. |
| Assessment criteria and thresholds of financial materiality for risks | ESRS 2 - IRO-1 | The potential magnitude of financial risk is material when the collective financial effects exceed EUR 250 million (2024: EUR 240 million) in one year, occurring during one of the time horizons (short, medium or long term). The potential magnitude of reputational and regulatory risk is assessed against a five-point scale. Low, medium low, medium, medium high and high. The likelihood of occurrence for risks is assessed consistently as the likelihood of occurrence of impacts. The combination of the likelihood of occurrence and the potential magnitude of financial, reputational and regulatory risk is considered in our risk assessment scoring. We consider a topic to be material if the average potential magnitude of our average risk and likelihood of occurrence score above the threshold of three. |
| Data sources and estimates of financial materiality for risks | ESRS 2 - IRO-1 | Environmental heatmaps are the starting point for climate and environmental risk identification across the globe for all sectors. The environmental heatmaps for sectors with material exposures and a higher gross risk level are classified as climate sensitive sectors as they deem to have a higher inherent risk. On portfolio basis, the residual risk is assessed and classified as vulnerable in case of higher residual risk. Sectors dealing with acute climate and environmental risks can also be classified as vulnerable sectors. Encompassing distinct physical and transition risks, acute and chronic events for both climate and nature scopes (namely water and pollution), the heatmaps are based on a climate scenario, which predicts approximately 2 degrees of warming by 2050. The environmental risk heatmaps are updated semi-annually, driven by evolving user requirements and improved datasets.The impact of the risk drivers is assessed for each risk type. These include financial risks such as credit risk, business risk, market risk in the trading book, and market risk in the banking book. We also consider non-financial risks such as operational- and compliance risk, and model risk. When evaluating the significance of sustainability topics for Rabobank, we found that most of these risk types are relevant. However, there are a few exceptions:
|
| Assessment criteria and thresholds of financial materiality for opportunities | ESRS 2 - IRO-1 | The potential magnitude of opportunities is assessed against a five-point scale. Low, medium low, medium, medium high and high. This aligns with our risk approach, ensuring that materiality is recognized when financed effects exceed EUR 250 million (2024: EUR 240 million). The likelihood of occurrence for opportunities is assessed consistently as the likelihood of occurrence of impacts and risks. We consider a topic to be material if the potential magnitude of the opportunity and likelihood of occurrence score above the threshold of respectively four and three. |
| Data sources and estimates of financial materiality for opportunities | ESRS 2 - IRO-1 | Criteria for assessing opportunities related to initiatives, programs or products are:
|
| Minimum disclosure requirements on policies | ESRS 2 MDR-P | Rabobank has a Policy Document Management (PDM) framework. The policy document structure, PDM cycle and Policy House Portal are therewith formalized. Rabobank recognizes global and local policy documents. Global policy documents are applicable to all core activities and special activities within Rabobank Group, unless otherwise determined in the policy document. The applicable approval body (Management Team of the policy document owner and/or Risk Management Committee) approves policy documents. The policy document owner is accountable for submitting the policy document, monitoring and the implementation plan (implementation approach, governance, scope/impact and training) to the approval body. Policy documents are uploaded on the Policy House Portal (PHP), after approval by the applicable approval body. PHP serves as single source for all policy documents. |
Methodology & Definitions related to Environmental Information
| Defined term | ESRS reference | Definition & methodology |
|---|---|---|
| Climate change adaptation | ESRS E1 | The process of adjustment to actual and expected climate change and its impacts. |
| Climate change mitigation | ESRS E1 | The process of reducing GHGemissions and holding the increase in the global average temperature to 1.5 °C above pre-industrial levels, in line with the Paris Agreement. |
| Climate target setting | ESRS E1-4 | For the more detailed methodology on climate target setting, we refer to Climate Target Setting Methodology. |
| Financed emissions | ESRS E1-6 | For the more detailed methodology on financed emissions, we refer to Methodology Financed Emissions. |
| GHG emissions for our own operations | Not material | The climate footprint is calculated according to the most recent directives of the Greenhouse Gas Protocol (GHG) and the associated CO2 conversion factors, originating from, amongst others, DEFRA and the IEA.The consolidated operating information for the climate footprint is January 1 to December 31 (FY2024: October 1 2023 to September 30 2024). In the reporting period FY2025, Rabobank updated the reporting period to align with its financial year. This change enhances the relevance of the disclosed metric but does not materially affect prior reported figures. Prior-period figures are comparable.The data regarding our internal business operations is mostly based on our automated central management information system and on invoices from our providers. In preparing the footprint, we made estimations, assumptions and extrapolations whenever data was unavailable or incomplete. Although we made these estimates and assumptions, based on the most careful assessment of current circumstances, activities, and available consumption data, the actual results may deviate from these estimates.Considering the magnitude of the operational GHG emissions, we do not consider this to be material for Rabobank. |
| Pollution of air, water, soil and living organisms | ESRS E2 | The direct or indirect introduction, as a result of human activity, of pollutants into air, water or soil which may be harmful to human health and/or nature, which may result in damage to material property, or which may impair or interfere with amenities and other legitimate uses of nature. |
| Water scarcity | ESRS E3 | The volumetric abundance, or lack thereof, of freshwater resources. Scarcity is human driven, it is a function of the volume of human water consumptionrelative to the volume of water resources in a given area. As such, an arid region with very little water, but no human water consumptionwould not be considered scarce, but rather arid. Water scarcityis a physical, objective reality that can be measured consistently across regions and over time. Water scarcityreflects the physical abundance of freshwaterrather than whether that water is suitable for use. For instance, a region may have abundant water resources (and thus not be considered water scarce) but have such severe pollution that those supplies are unfit for human or ecological uses. |
| Land degradation / land-use change | ESRS E4 | Land degradation refers to direct or indirect human-induced processes, that drive the decline or loss in biodiversity, ecosystem functions or their benefits to people and includes the degradation of all terrestrial ecosystems.Land-use refers to the human use of a specific area for a certain purpose (such as residential; agriculture; recreation; industrial, etc.). Influenced by, but not synonymous with, land cover.Land-use change refers to land uses can change over time due to both natural and human causes. Such changes can be represented by land use change categories (e.g., pasture to annual crop; forest land converted to cropland). |
Methodology & Definitions related to Social Information
| Defined term | ESRS reference | Definition & methodology |
|---|---|---|
| Rabobank headcount | ESRS S1 | The metrics of Rabobank's own workforce is presented in headcount and represent the consolidated Rabobank Group, excluding non-material subsidiaries. |
| Number of employees | ESRS S1 | The number of employees is reported on Rabobank Group (all the subsidiaries included). The number of employees of Rabobank Group is based on the scheduled weekly hours / default weekly hours. The baseline is the last day of the month situation and the following variables are taken into consideration:
|
| Employee Engagement Scan | ESRS S1 | Our Managing Board requires management information on how the organization is developing and how employees are feeling and realizing their goals. Monitoring work perception on a regular basis allows us to effectively manage and make adjustments in a timely manner. We have developed the Engagement Score for this purpose and can be used for external benchmarking.We measure and report employee engagement through the Engagement Score. HR has commissioned a specialized external data survey agency to collaborate on developing the scan. The survey consists of 23 questions/statements, supplemented by three opriotnal closed-ended questions provided by employees themselves. The way in which employees respond to these questions describes the extent to which they feel engaged in their work at that particular point in time. We based the score given in this report on 4 questions of the 23 questions to make it possible to benchmark results. |
| Diversity & inclusion of employees | ESRS S1 | Diversity: The differences that make people unique, such as, but not limited to, gender, ethnicity, age, sexual orientation and disabilities.Equity: Fair treatment, access and opportunity, while eliminating barriers that prevent groups or individuals from full participation.Inclusion: Creating an atmosphere where everyone is welcomed, respected, supported and valued. |
| Defined term | ESRS reference | Definition & methodology |
|---|---|---|
| Own Workforce | ESRS S1-6 | Our own workforce is defined as all employees plus contingent workers excluding outsourced staff, and regulator initiated staff. |
| Employees | ESRS S1-6 | Employees is defined as people who have a Rabobank employment contract. |
| Number of employees | ESRS S1-6 | The number of employees is reported in headcount at the end of the reporting period. |
| Gender | ESRS S1-6 | We define gender in our HR administration as male, female, other, non reported. |
| Regions | ESRS S1-6 | Regions are defined as a group of countries combined together. Within Rabobank we use the following regions; Europe, Africa, North America, South America, ASIA/Pacific (RANZ). |
| Type of employees | ESRS S1-6 | Type of employees is defined as permanent-, temporary-, non-guaranteed-, full-time-, part-time employees
|
| Permanent employees | ESRS S1-6 | Permanent employment is an employment relationship where an individual works for Rabobank and receives payment directly from them. This type of employment arrangement does not include a set end date. |
| Temporary workers | ESRS S1-6 | Temporary employees are people who fill a position for a short period of time. Rabobank might hire temporary employees directly or via contract with a staffing agency. |
| Non-guaranteed employees | ESRS S1-6 | Employed by the Rabobank without a guarantee of a minimum or fixed number of working hours. The employee may need to make themselves available for work as required, but the Rabobank is not contractually obliged to offer the employee a minimum or fixed number of working hours per day, week, or month. |
| Full-time employees | ESRS S1-6 | Employee with FTE >= 1 A full-time equivalent (FTE) is a unit of measurement used to figure out the number of full-time hours worked by a employees in Rabobank. A ratio defined in decimal (one decimal place) for standardizing workforce statistics. A value of 1.0 is equivalent to one full-time worker. Different countries have different default weekly hours: Argentina - Standard Hours - 40 = 1 FTE Australia - Standard Hours - 37,5 = 1 FTE Belgium - Standard Hours - 37,5 = 1 FTE Brazil - Standard Hours - 40 = 1 FTE Canada - Standard Hours - 40 = 1 FTE Chile - Standard Hours - 42 = 1 FTE China - Standard Hours - 40 = 1 FTE France - Standard Hours - 35 = 1 FTE Germany - Standard Hours - 39 = 1 FTE Hong Kong - Standard Hours - 40 = 1 FTE India - Standard Hours - 45 = 1 FTE Indonesia - Standard Hours - 40 = 1 FTE Ireland - Standard Hours - 36,25 = 1 FTE Italy - Standard Hours - 37,5 = 1 FTE Kenya - Standard Hours - 40 = 1 FTE Malaysia - Standard Hours - 40 = 1 FTE Mexico - Standard Hours - 40 = 1 FTE Netherlands - Standard Hours - 36 = 1 FTE New Zealand - Standard Hours - 37,5 = 1 FTE Peru - Standard Hours - 42 = 1 FTE Singapore - Standard Hours - 40 = 1 FTE Spain - Standard Hours - 39 = 1 FTE Türkiye - Standard Hours - 45 = 1 FTE United Kingdom - Standard Hours - 35 = 1 FTE United States of America - Standard Hours - 40 = 1 FTE |
| Part-time employees | ESRS S1-6 | Employee with FTE <1 A parttime equivalent (FTE) is a unit of measurement used to figure out the number of full-time hours worked by a employees in Rabobank. A ratio defined in decimal (one decimal place) for standardizing workforce statistics. A value of below 1.0 is equivalent to one full-time worker. |
| Turnover ratio | ESRS S1-6 | The turnover ratio is the average number of employees divided by the number of employees who left the Rabobank during the year. The number of employees who left the Rabobank is determined from the termination process within the HR system in which the terminiations with immediate rehire are excluded. |
| Defined term | ESRS reference | Definition & methodology |
|---|---|---|
| Non-employees / contingent workers | ESRS S1-7 | A non-employee is a person with a contract with the Rabobank to supply labour (self-employed) or a person provided by Rabobank primarily engaged in "employment activities" (NACE Code N78) |
| Number of non-employees / contingent workers | ESRS S1-7 | The number of non-employees / contingent workers is reported in headcount at the end of the reporting period. |
| People provided by Rabobank primarily engaged in employment activities | ESRS S1-7 | Within our HR administration the people provided by Rabobank primarily engaged in employment activities are labelled as a Worker Sub Type: Contractor from 3rd Party. |
| Self-employed people | ESRS S1-7 | Within our HR administration the self-employed people are labelled as a Worker Sub Type: Independent Contractor Direct or Independent Contractor from 3rd Party. |
| Defined term | ESRS reference | Definition & methodology |
|---|---|---|
| Top management level | ESRS S1-9 | Top management level is defined by Managing Board, Managing Board - 1 and Managing Board - 2. |
| Defined term | ESRS reference | Definition & methodology |
|---|---|---|
| Gender pay gap | ESRS S1-16 | The scope for the gender pay gap analysis is:
|
| Unadjusted gender pay gap | ESRS S1-16 | The unadjusted gender pay gap is calculated as the difference between the average gross hourly pay of male and female employees, expressed as a percentage of the average gross hourly pay of male employees. |
| Adjusted gender pay gap | Entity-specific metric | The adjusted gender pay gap is a model-based estimate of the percentage difference between the average hourly remuneration of men and women in comparable positions. Comparability is determined based on a set of relevant characteristics, such as:
|
| Highest paid individual fee | ESRS S1-16 | Highest pay based on a combination of fixed and variable pay. The pay is inclusive of allowances and employer pension contribution. The pay is exclusive of sign on, buy out, retention. |
| Median employee wages and salaries | ESRS S1-16 | The median employee refers to the middle value in the total set of wages and salaries within Rabobank. To calculate the median employee the highest paid individual is exceluded. Pay is based on a combination of fixed and variable pay. The pay is inclusive of allowances and employer pension contribution. The pay is exclusive of sign on, buy out, retention. |
| Ratio to median employee wages and salaries | ESRS S1-16 | Highest paid individual salararies and wages fee divided by the median employee wages and salaries. |
| Defined term | ESRS reference | Definition & methodology |
|---|---|---|
| Employee Voice | ESRS S1-17 | In our employee voice we define all reports mentioned to the following channels:
|
| Severe human rights complaints | ESRS S1-17 | We define severe human rights complaints as complaints which are recorded within our Case Management System in the category Criminal offences. |
| Defined term | ESRS reference | Definition & methodology |
|---|---|---|
| Labor rights of workers in the value chain | ESRS S2 | Labor rights of workers in the value chain are the fundamental rights of workers when performing their work in entities that are within Rabobank's upstream and downstream value chain. Labor rights are within in the immediate sphere of value chain entities, and simultaneously have a wider systemic aspect to them beyond the sole sphere of control of and the relations between value chain entities and workers. Labor rights of workers in the value chain include the rights to be free from all forms of modern slavery, including forced or compulsory labour; child (forced) labor; freedom of association and the right to collective bargaining; the right to non-discrimination in respect of employment and occupation, including gender equality, equal pay for equal value of work, and equal access to employment opportunities, regardless of race, color, sex, language, religion, political or other opinion, national or social origin, property, birth, age, gender, disability, and sexual orientation; the right to adequate housing, clothing, food, water and sanitation; and the right to social security and security of employment in line with international human rights and labor rights instruments and frameworks. |
| Communities' rights | ESRS S3 | Communities' rights are the economic, social, cultural, civil and political rights and freedoms enjoyed by individual community members, which may have a collective aspect to the community as a group. Communities' rights encompass all human rights and freedoms under international law and as set out in international human rights instruments, including the UN Declaration of Human Rights; the International Covenant on Civil and Political Rights; and the International Covenant on Economic, Social, and Cultural Rights. Communities' rights further encompass the individual and collective human rights and freedoms of specific individuals or groups within communities that may require special attention, including women; children; indigenous peoples; human and environmental rights defenders; ethnic, linguistic and religious minorities; persons with disabilities; and persons living in rural areas as further elaborated on in separate international human rights instruments. |
| Defined term | ESRS reference | Definition & methodology |
|---|---|---|
| Information and safety related impacts for consumers and/or end-users | ESRS S4 | Information and personal safety related impacts include impacts on consumers and end-users related to their right to privacy;
|
| Social inclusion of consumers | ESRS S4 | Social inclusion includes impacts on consumers and end-users related to
|
| Consumer | ESRS S4 | Consumers are individuals (i.e. private customers) who acquire, consume or use goods and services for personal use, either for themselves or for others, and not for resale, commercial or trade, business, craft or profession purposes. |
| End-users | ESRS S4 | Individuals who ultimately use or are intended to ultimately use a particular product or service. |
| Number of clients | ESRS S4 | We define the total of clients as all the clients of the local banks and Obvion. The clients of the local banks are identified by all the natural persons for particular clients and all the commercial groups for business clients. The total of Obvion is based on the total number of loans of Obvion and pension fund ABP. As a person can be registered with Rabobank and alos has a loan with Obvion, it is possible that there are clients recorded twice in the population. |
| Number of countries | ESRS S4 | We define the number of countries as all the countries in which a subsidiary or branch office is established. |
| Affordable housing in the Netherlands | ESRS 2 MDR-A for ESRS S4 | In the Netherlands, affordable housing is a mix of social rental, social purchase, mid-range rental and owner-occupied homes with prices up to EUR 420,000 for 2025(2024: EUR 405,000). This definition follows different guidelines from the Dutch government to express affordable housing (maximum rent or sale price). This gives a mix of:
|
| Affordable housing in Germany | ESRS 2 MDR-A for ESRS S4 | In Germany, affordable housing is when the cost for living space are not more than 30 percent of the households costs. This 30 percent threshold is the basis for our German definition of affordable housing and result in the following thresholds for sale prices for the different residential units:
|
Methodology & Definitions related to Governance Information
| Defined term | ESRS reference | Definition & methodology |
|---|---|---|
| Corruption and bribery | ESRS G1 | Corruption refers to the abuse of entrusted power for improper personal advantage. Corruption can take different forms that vary in severity; from a limited use of influence to institutionalized bribery. Corruption may be related to financial gain, and or to non-financial advantages (for example personal favor or assistance in return for (illegal) actions). Corruption may show itself in the form of bribery or as a conflict of interest.Bribery is a form of corruption and is commonly described as involving the offer, promise, giving, request, receipt, acceptance, or transfer of anything of value, either directly or indirectly, to or by an individual, to induce, influence, or reward the performance of a function or an activity with improper intent, in a commercial or public office setting. |
| Mandatory Basic FEC Training target | ESRS G1 |
|
| Mandatory Advanced FEC Training target | ESRS G1 |
|
| Incidents of Corruption and Bribery | ESRS G1 | The reported metric includes the convictions and the amount in fines for violation of anti-corruption and anti-bribery laws for 2025. |
Appendix 2: Sector x Region Analyses
Sector x Region Analyses
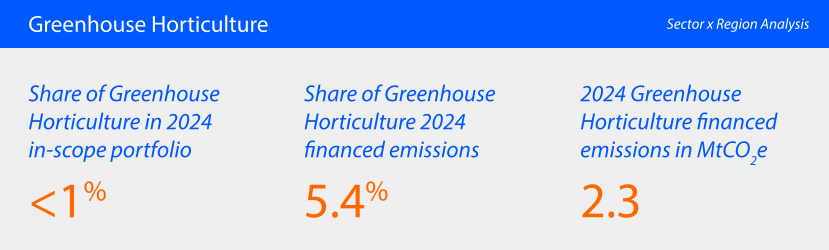
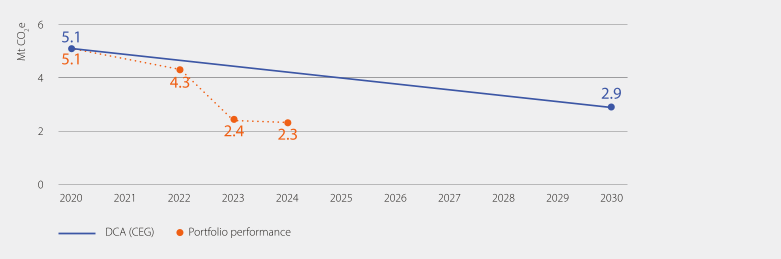
Sector Materiality
Our greenhouse horticulture portfolio focuses on high-tech vegetable and ornamental production, with a strong ambition to become climate neutral by 2040.
Climate Impact
Financed emissions decreased by 0.1 Mt to 2.3 Mt due to lower intensity levels. Portfolio growth added emissions, but intensity reductions offset this. The sector continues to make progress towards its 2030 reduction target and 2040 target of climate neutrality. Our portfolio is aligned with this trajectory, with room for additional energy transition investments.
Material Risks
Climate: Manageable due to strong profitability, the sector covenant to be climate neutral by 2040, available solutions (e.g., shift away from fossil-based Combined Heat and Power systems), alongside required investments and tightening regulations.
Nature: Sector lags on water quality targets. Emissions and pollution persist, though awareness and mitigation efforts are increasing.
People: Labor conditions remain a concern, particularly for seasonal workers. Sector-wide automation offers partial relief, but structural improvements are needed.
Market Developments
Several market developments are helping to decarbonize the Dutch greenhouse horticulture sector:
Energy transition: Greenhouse businesses are switching to cleaner energy sources like geothermal heat, residual heat, and heat pumps.
Innovation: Technologies such as automation, artificial intelligence, and precision farming help reduce emissions and make businesses less dependent on manual labor.
Circular practices: There is growing focus on reusing nutrients, protecting biodiversity, and growing crops without polluting the environment.
Several external factors are influencing the pace of these developments:
Government policy: CO₂ and energy tax, the second phase of the European Union Emissions Trading System (ETS2), and subsidies all play a big role. The sector covenant helps guide the sector and reduces uncertainty.
Infrastructure: Grid congestion and energy network limitations slow down progress.
Labor & social: The sector has started a joint effort to improve working conditions and make sure all businesses follow labor laws.
Rabobank Key Actions
The ‘Convenant Energietransitie Glastuinbouw’ stipulates that the greenhouse horticulture sector has the goal to be climate neutral in 2040. Rabobank aims to support the greenhouse horticulture sector in its transition to energy neutrality.
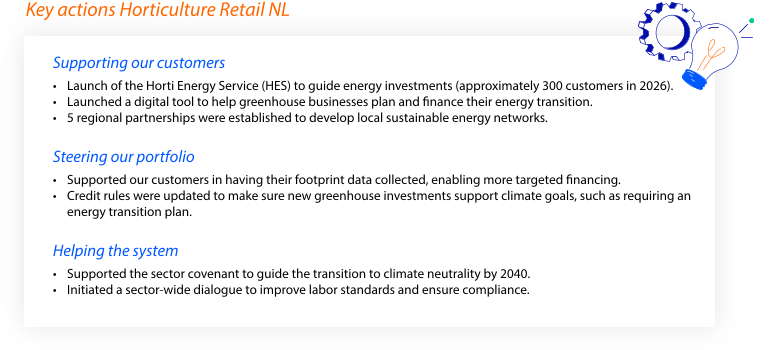
Sector Outlook/Reflection
Greenhouse horticulture is a technologically advanced sector with a clear climate ambition. Rabobank aims to support this transition not only through tailored financing, but also by embedding sustainability into credit policies, facilitating regional energy networks, and promoting social standards.
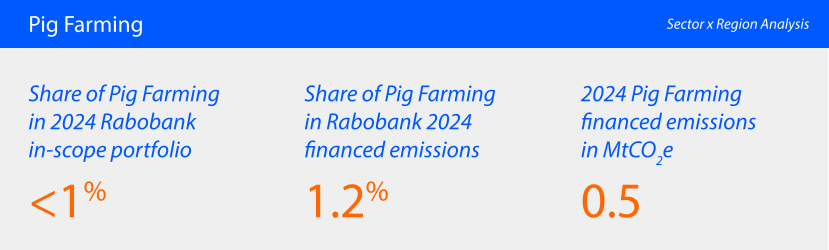
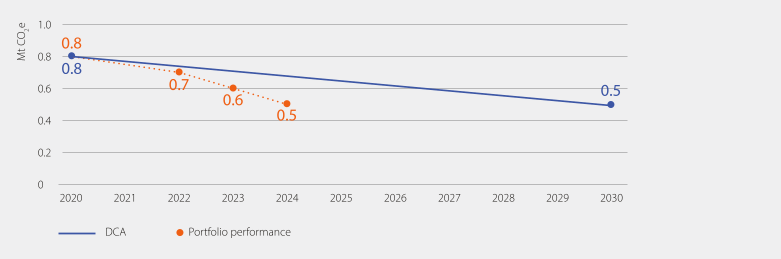
Sector Materiality
Our pig farming portfolio is primarily focused on closed housing systems with a strong emphasis on emission reduction, circular feed use, and improving animal welfare.
Climate Impact
Financed emissions decreased by 0.1 Mt to 0.5 Mt. The 2030 target of 0.3 Mt reduction is within reach, driven by fewer animals and smarter practices, such as climate-smart feed reformulation, daily manure removal and mono-manure digestion.
Material Risks
Climate: Medium transition risk. New permits are on hold, and it is unclear what rules will apply after 2030. Still, most farmers are financially strong enough to manage this for now.
Nature: There is a high risk of pollution, especially from ammonia near protected nature areas. The sector wants to process all manure and use mostly circular feed, but obtaining permits remains a big challenge.
Animal welfare under pressure. The sector is working toward better conditions, like no farrowing crates, keeping pigs’ tails long, and reducing live transport.
Market Developments
Several market developments are helping to decarbonize the Dutch Pig Farming sector:
Declining animal numbers: Government buyout schemes and stricter environmental rules are leading to a smaller pig population.
Low-carbon & circular Feed and Energy: Farmers are increasingly using leftover materials from the food industry as animal feed and generating their own energy (e.g., through manure digestion). This makes the system more circular and lowers its carbon footprint.
Animal welfare: Social and regulatory pressure is pushing for better living conditions for pigs, such as more space and natural behaviors.
Several external factors are influencing the pace of these developments:
Nitrogen ruling: New permits are on hold due to nitrogen rules, which prevents farms from making sustainable upgrades or changes.
Consumer preferences: A growing shift toward plant-based diets in Europe is reducing demand for pork.
Policy uncertainty: The lack of defined residual emission targets beyond 2030 creates uncertainty for long-term planning.
Data limitations: Limited access to environmental and sustainability data makes it difficult to track progress and steer investments effectively.
Rabobank Key Actions
Rabobank aims to supports the pig farming sector through targeted actions across customers, portfolio, and the wider system.
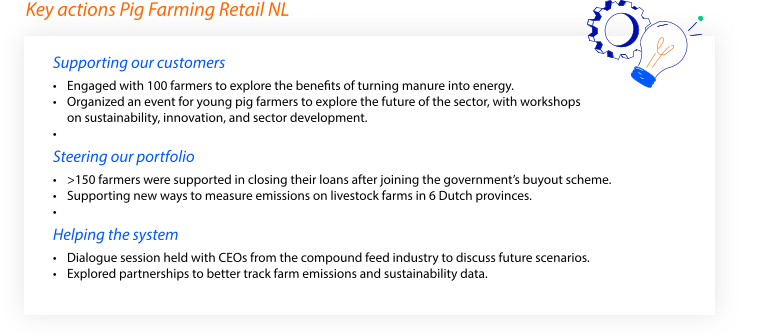
Sector Outlook/Reflection
The Dutch pig farming sector is shrinking due to stricter rules, fewer animals, and declining exports. This puts pressure on the entire chain, from farmers to slaughterhouses and feed producers. Many farms are scaling down or stopping, and Rabobank’s exposure is decreasing as a result. While this reduces emissions, it also reflects a structural shift. Because most remaining farmers are financially resilient and key emission reductions are already underway, fewer new actions are needed. Rabobank continues to support the sector with knowledge, data, and dialogue.
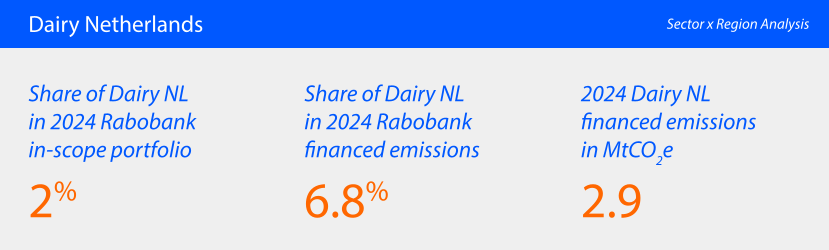
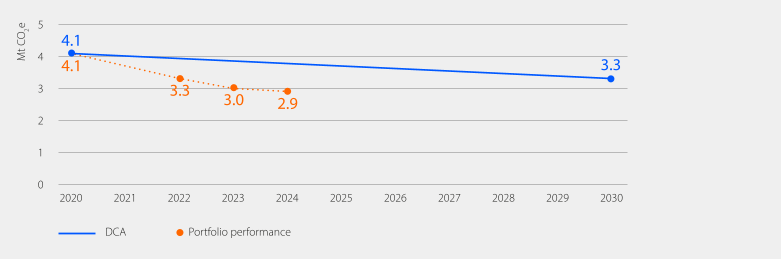
Sector Materiality
Our dairy portfolio mainly consists of dairy farms focused on milk production for regional and EU markets.
Climate Impact
Financed emissions declined by 0.1 Mt to 2.9 Mt mainly due to reduced portfolio size. This is mainly due to fewer cows and youngstock, better farm management practices and new technologies. Rabobank’s portfolio is aligned with the pathway, and no acceleration is currently required to stay on course.
Material Risks
Climate: The sector faces transition risks, such as stricter environmental policies and shifting market demands, which require changes in how farms operate.
Nature: There is high exposure to risks like biodiversity loss and declining water and soil quality. Rabobank monitors farm-level data on nitrogen (soil) surplus, grassland use, and protein self-sufficiency.
Pressure is growing to improve animal welfare. Sector goals include keeping calves with their mothers longer, ensuring pasture access when needed, and providing one cubicle per cow by 2028.
Market Developments
Several market developments are helping to decarbonize the Dutch Dairy sector:
Circular agriculture: There is a growing focus on circular practices, such as the use of non-human-edible feedstocks, recycling nutrients,and stimulating a lower livestock density per hectare (to balance the number of animals and hectares of farmland used).
Energy transition: Many dairy farms are becoming small energy producers, using solar panels, wind turbines, and biogas systems.
Innovation: New technologies like robots and precision feeding systems help lower emissions and make farms more efficient.
True value incentives: Dairy processors are starting to reward farmers who reduce their environmental impact, offering better prices for more sustainable practices.
Several external factors are influencing the pace of these developments:
Government policy: Stricter rules on nitrogen, water, and biodiversity—especially near protected Natura 2000 areas—are increasing pressure on farmers. At the same time, a halt on new permits makes it harder for them to implement sustainable practices.
Land availability and cost: High land prices and competition for land make it harder for farmers to switch to lower-intensity, more sustainable methods.
Value chain preferences: Retail's preferences shift to more sustainable, traceable, and animal-friendly dairy, even though total dairy consumption in the EU is expected to decline slightly.
Markets are shifting: the Netherlands will export less, due to a declining herd size. However, demand from e.g. Africa and Asia will remain, which expectedly be met by other countries.
Rabobank Key Actions
Rabobank aims to support the Dairy sector’s transition toward a more sustainable, climate-resilient, and socially responsible future.
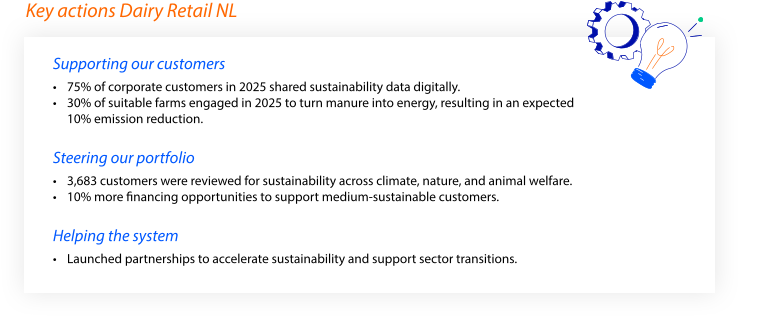
Sector Outlook/Reflection
The Dutch dairy sector is dealing with a complex sustainability challenge. Climate goals seem within reach. There is progress on nature-related issues, e.g. nitrogen emissions, though at a slower pace. This is mainly due to a halt in new permits following recent legal rulings, which has delayed key investments in sustainable infrastructure. Rabobank continues to support the sector through financing of land transactions and financing for business succession. However, broader progress depends strongly on government action.
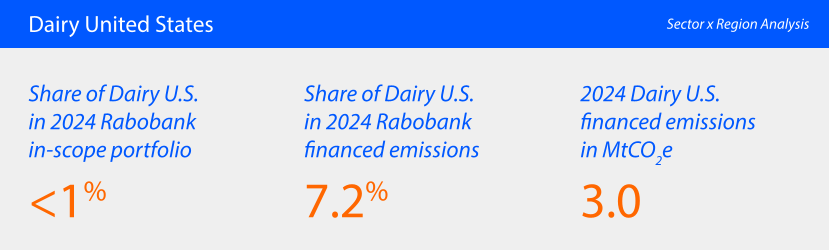
Sector Materiality
Rabobank’s U.S. dairy portfolio includes both producers and processors. We bank large cooperatives, and several of our customers supply major buyers of dairy products.
Climate Impact
Financed emissions remained stable at 3.0 Mt. Reported physical intensity reached 1.05 tCO2e/t based on part of the portfolio. The recent “Guaranteeing Fair Banking for All Americans” executive order and recently enacted state laws prevent external reporting of intensity targets.
Material Risks
Climate: Drought, wildfire, and extreme weather are key risks for dairy farms, affecting feed and water availability. Some states, like California, are introducing methane reduction rules, which may require farmers to understand and possibly change practices.
Nature: Dairy farming relies heavily on land and natural resources. Rabobank is working to understand what data is available, to increase insight into these dependencies and their impacts, with a strong emphasis on ensuring farmers maintain long-term, secure access to the land they cultivate.
Market Developments
Several market developments are helping to decarbonize the Dairy U.S. sector:
Feed and Herd Innovations: New feed additives (like Bovaer) and improved cow genetics could help reduce methane emissions from digestion and improve efficiency, but not yet clear how the additional costs can be distributed throughout the value chain.
Manure Management: Beyond emissions reduction, methane can be captured from manure using anaerobic digesters to produce renewable energy—power for farms or sale to the grid—creating both environmental and economic benefits.
Efficiency Carbon Tracking Tools: Tools are now available to help producers measure, understand, and benchmark their operational efficiency, supporting more targeted mitigation and reduction strategies.
Several external factors are influencing the pace of these developments:
Unclear Policy Landscape: Federal climate rules remain limited, but states like California are tightening emission standards, pushing farms toward new practices. Additionally, the recent “Guaranteeing Fair Banking for All Americans” executive order and recently enacted state laws prohibits influencing a customer’s lawful business activities.
Technology and Investment Gaps: Many emission-reducing solutions are still in early stages and lack financial support, slowing adoption. In addition, not yet clear how additional costs can be distributed throughout the value chain.
Industry Collaboration: Organizations like the Innovation Center for U.S. Dairy and the Dairy Sustainability Alliance are partnering with farmers and companies to drive progress toward net-zero greenhouse gas emissions by 2050.
Growing Market Expectations: Dairy buyers and processors increasingly ask for sustainability data, encouraging farms to take action even without regulation.
Rabobank Key Actions
Rabobank’s approach in the dairy sector in the U.S. has emphasized understanding emissions, physical risks, and supporting customer resilience.
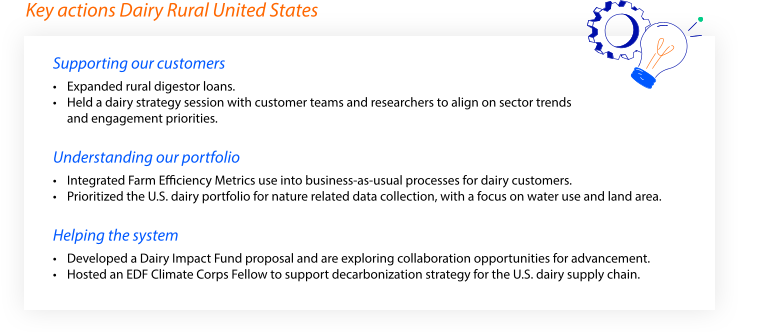
Sector Outlook/Reflection
The U.S. dairy sector is navigating a fragmented regulatory landscape and economic constraints. Rabobank recognizes that most emissions stem from biological processes that are difficult to mitigate without systemic change. Since 2022, our focus has been on building foundational data and supporting customers in understanding their efficiency and areas for improvement. Our influence is one part of a broader system. While we cannot drive change alone, we aim to be a reliable partner by improving emissions insights, supporting nature-related data infrastructure, and fostering collaboration with cooperatives, processors, and industry platforms. The path to a resilient dairy sector will require sustained effort, transparency, and shared responsibility.
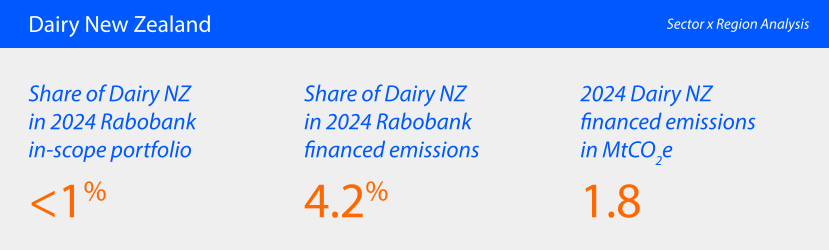
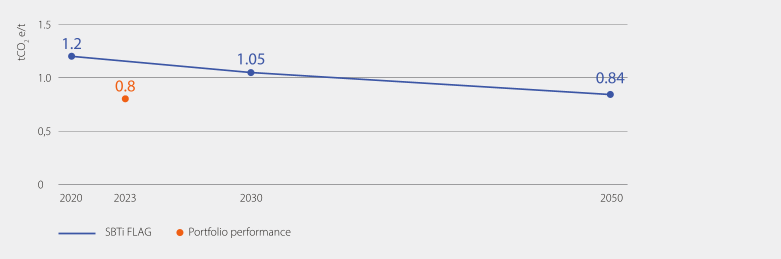
Sector Materiality
Rabobank’s New Zealand dairy portfolio primarily consists of rural, pasture-based farms, with around 80% of customers supplying to Fonterra, the country’s largest dairy processor and exporter.
Climate Impact
Financed emissions increased to 1.8 Mt due to rising sector intensities as revenues declined faster than emissions.
Material Risks
Climate: The risk from climate-related policy and market changes is moderate. The sector could be affected by new rules on carbon pricing and methane emissions. Also, more frequent droughts and heatwaves could impact milk production and animal health.
Nature: Risks include water pollution, and biodiversity loss. The sector is addressing these through regulations and voluntary actions. Rabobank is reviewing biodiversity impacts across its portfolio.
Market Developments
Several market developments are helping to decarbonize the NZ dairy sector:
Innovation and Technologies: The sector is investing in new ways to reduce methane emissions, such as improved animal feed, vaccines, and breeding techniques. These efforts are supported by public-private partnerships, which also help develop tools to make farms more climate-resilient.
Data and Monitoring: More farmers are using Farm Environment Plans, especially those working with Fonterra. These plans coupled with annual benchmarking of farm level GHG emissions help customers to set and prioritize actions to improve their emissions intensity as well as other environmental indicators.
Regenerative Practices: Farmers are starting to use more sustainable methods, like rotating animals and crops, and improving soil health. These practices can help store more carbon in the soil and support biodiversity.
Several external factors are influencing the pace of these developments:
Government Policy: New Zealand aims to cut methane emissions by 10% by 2030 and reach net-zero for other greenhouse gases by 2050.
Regulatory Landscape: The rules for farming and the environment are well-developed but can be complicated. Updates are being carried out to make them easier to follow, like the Freshwater Farm Plans.
Systemic Bottlenecks: Some farmers face barriers like unclear sustainability standards.
Rabobank Key Actions
Rabobank supports the New Zealand dairy sector’s transition through targeted actions at three levels: customer, portfolio, and system.
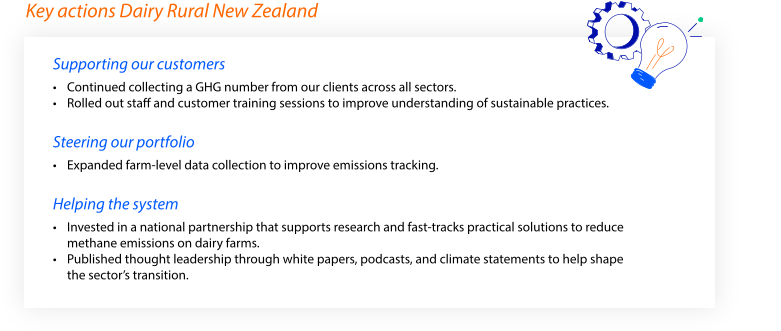
Sector Outlook/Reflection
The New Zealand dairy sector is making progress toward climate goals, supported by regulation and industry collaboration. However, the path ahead is not without challenges. While emissions per unit are improving, overall production growth means total emissions could still rise. The challenge is now execution: scaling proven technologies, improving farm-level data coverage, and aligning incentives. The sector’s success will depend on how well these efforts are coordinated and scaled in the coming years. Rabobank enables this by steering capital toward top performers, supporting sector-wide tools, and helping customers close remaining gaps.
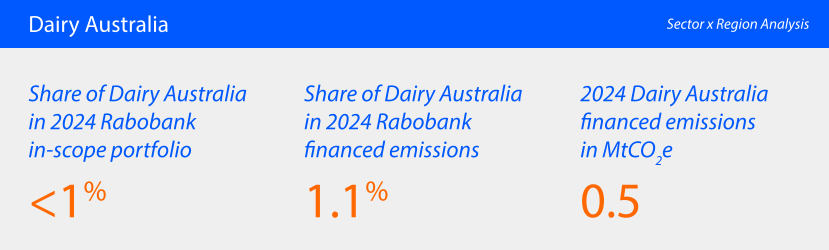
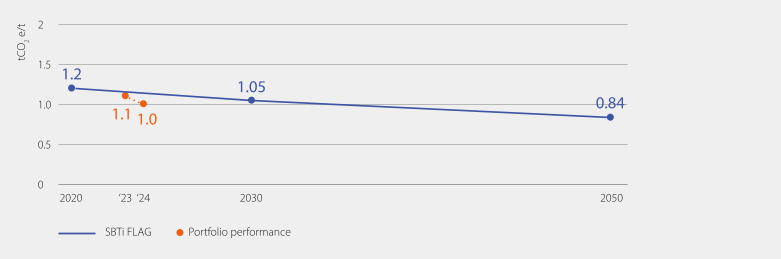
Sector Materiality
Rabobank’s Australian Rural dairy portfolio focuses on customers active in pasture-based milk production.
Climate Impact
Financed emissions remained stable at 0.5 Mt, despite portfolio growth. The reduction is driven by lower sector emissions linked to a smaller dairy cattle population and rising client asset levels. Physical intensity improved by 6%, reflecting stable emissions alongside higher production levels. Carbon calculator coverage increased but still represents a small share of the portfolio.
Material Risks
Climate: Heat stress and water scarcity are key challenges for pasture-based systems. These conditions can reduce milk yields and animal health, while extreme weather events add operational risk for farmers and financiers.
Nature: Nutrient run-off from intensive pasture management can impact water quality and long-term land productivity.
Transition: While no carbon tax is planned, Australia’s Net-Zero 2050 strategy signals a long-term shift toward greater accountability through improved emissions accounting and investment in low-emission technologies. Australia’s regulated carbon credit scheme offers optional pathways for integrated carbon projects alongside production. Nature-based solutions such as improved pasture management and riparian restoration can help mitigate these risks and support biodiversity outcomes.
Market Developments
Several developments are shaping sustainability efforts in the Australian dairy sector:
Industry Engagement: The Australian Dairy Sustainability Framework sets whole-of-industry targets for reducing emissions intensity by 30% by 2030, improving water efficiency, and protecting biodiversity. Dairy Australia facilitates research and farmer engagement to support these goals
Investment drivers: Processor-led sustainability commitments and reporting requirements are increasing transparency across the value chain. While these targets do not directly dictate farm practices, they signal market expectations and create opportunities for alignment.
Innovation: Research programs such as DairyBio and Dairy Moving Forward focus on genetic improvement, feed efficiency, and manure management to reduce emissions intensity. Methane-reducing feed additives and digesters remain early-stage and costly, limiting widespread adoption.
Data & Tools: Carbon calculators and benchmarking platforms are being introduced to help farmers measure emissions and identify improvement opportunities. Coverage is expanding, but independent verification remains a challenge.
Several external factors are influencing the pace of these developments:
Policy and Regulation: Regulatory pressure is limited; while carbon credit schemes exist, mandatory requirements are not yet in place.
Technology Readiness: Low-emission solutions like methane-reducing feed additives and digesters are still in early stages and face cost and scalability challenges. Widespread adoption will depend on commercial viability and technical support.
Market dynamics: Profitability challenges in some dairy regions may limit investment in sustainability improvements.
Rabobank Australia Key Actions for Dairy
Rabobank supports the transition of the Australian beef and dairy sectors by providing tools and insights to customer, steering the portfolio through data and risk integration, and collaborating with industry to enable system-wide change. Please refer to the content in the Beef Rural Australia analysis, as Rabobank's actions apply to both sectors.
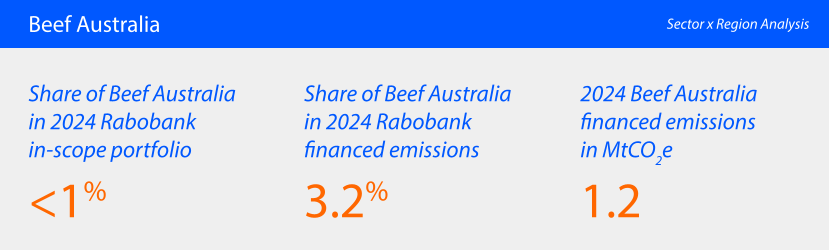
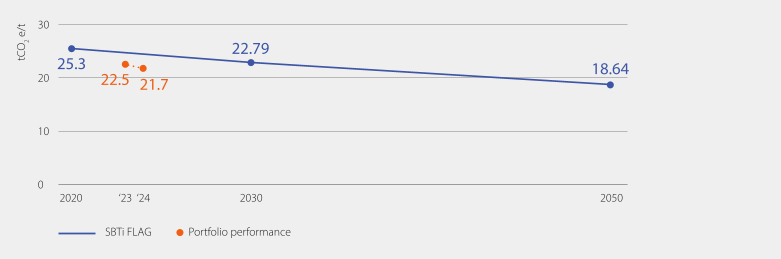
Sector Materiality
Rabobank's Australian Rural Beef portfolio focusses on primary producing beef operations with a strong presence in land-base cattle operations.
Climate Impact
Financed emissions decreased by 0.3 Mt due to more client-specific calculators showing lower emissions than sector averages. Higher client asset levels further reduced Rabobank’s attributed share. Physical intensity improved by 4% as production increased faster than emissions. Bottom-up data coverage expanded to 28%.
Material Risks
Climate: Increased drought frequency reduces feed availability impacting productivity and increases the cost of feeding stock reducing gross margins.
Nature: Risks include vegetation loss and soil degradation if grazing is poorly managed, which can affect biodiversity and long-term land value. However, beef operations also provide an opportunity for biodiversity and land stewardship if managed well.
Transition: While no carbon tax is planned, Australia’s Net-Zero 2050 strategy signals a long-term shift toward greater accountability through improved emissions accounting and investment in low-emission technologies. Australia’s regulated carbon credit scheme offers optional pathways for integrated carbon projects alongside production. Nature-based solutions such as improved pasture management and vegetation restoration can help mitigate these risks and support biodiversity outcomes.
Market Developments
Several developments are shaping sustainability efforts in the Australian beef sector:
Industry Engagement: The Australian Beef Sustainability Framework is improving transparency on climate, biodiversity, and animal welfare. Participation is growing, though adoption remains voluntary and uneven across regions. Meat & Livestock Australia continues to focus on emissions intensity reduction.
Investment drivers: Supply chain sustainability commitments and voluntary targets are creating opportunities for producers to align with emerging market expectations, alongside mandatory climate reporting requirements.
Innovation: Practices such as rotational grazing and tree planting improve feed efficiency and reduce emissions intensity. Genetic selection and feed additives are being explored as part of longer-term solutions.
Data & Tools: Carbon calculators and benchmarking platforms are being introduced to help farmers measure emissions and identify improvement opportunities. Coverage is expanding, but independent verification remains a challenge.
Several external factors are influencing the pace of these developments:
Policy and Regulation: Regulatory pressure is limited; while carbon credit schemes exist, mandatory requirements are not yet in place.
Technology Readiness: Low-emission solutions like methane-reducing feed additives and digesters are still in early stages and face cost and scalability challenges. Widespread adoption will depend on commercial viability and technical support.
Market Dynamics: Global scenarios suggest potential shifts in demand, but current export markets remain strong and continue to shape production decisions
Rabobank Australia Key Actions for Beef
Rabobank aims to support the transition of the Australian beef and dairy sectors by providing tools and insights to customers, steering the portfolio through data and risk integration, and collaborating with industry.
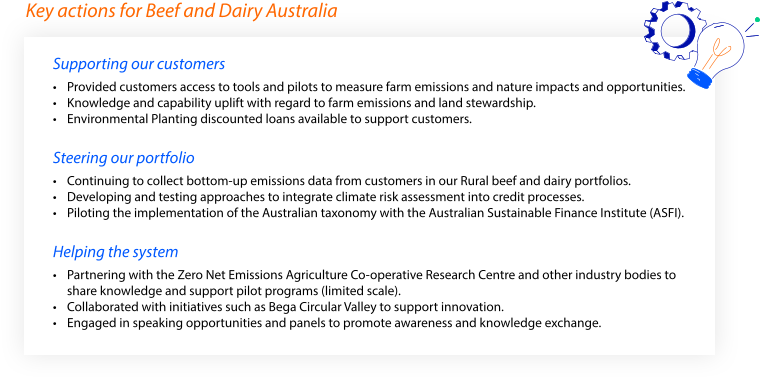
Sector Outlook/Reflection for Beef and Dairy
The beef and dairy sectors remain emissions-intensive and face significant physical and transition risks. While awareness and pilot programs are growing, scalable solutions for methane reduction and biodiversity protection are still emerging. Rabobank’s role is to enable practical, evidence-based change through data, finance, and partnerships.
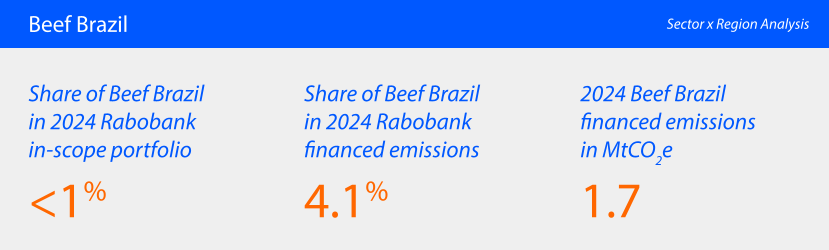
Sector Materiality
Brazil’s beef sector comprises four main production systems: extensive pasture based, intensive pasture based, fully intensive, and integrated crop livestock systems. Rabobank’s rural portfolio spans the three latter intensive systems, with a focus on supporting top tier producers through tailored financial services.
Climate Impact
Financed emissions increased by 0.1 Mt, from 1.6 Mt to 1.7 Mt. While absolute emissions are expected to increase alongside portfolio growth, the focus remains on reducing emissions intensity through improved land‑use practices, strengthened geographical monitoring, and tailored financial solutions supporting degraded pasture restoration and the adoption of intensive grazing systems.
Material Risks
Climate: High transition risk due to tightening deforestation regulations, increasing market pressure for deforestation-free supply chains, and potential carbon pricing mechanisms.
Nature: While beef production in Brazil is often associated with deforestation, biodiversity loss and soil degradation, these impacts are primarily driven by land appreciation dynamics and land‑grabbing practices. The customers in Rabobank Brazil's beef portfolio are not linked to such activities, consequently, the long‑term productivity and ecosystem‑stability risks commonly associated with land conversion do not directly affect us. Nonetheless, these dynamics create broader exposure for the entire agricultural value chain, particularly through the heightened vulnerability to extreme climate events driven by deforestation and large‑scale land‑use change.
Market Developments
Several market developments are helping to decarbonize the Brazilian Beef sector:
Regenerative Land Use: There is a growing shift toward restoring degraded pastures and adopting integrated crop-livestock-forestry systems, which improve soil health and carbon storage.
Forest Preservation Incentives: New market mechanisms, such as carbon credits for avoided deforestation, are encouraging farmers to preserve native vegetation beyond legal requirements.
Sustainable Intensification: New techniques like better grazing systems and improved cattle breeds help produce more beef with fewer emissions.
Monitoring and Data Tools: The use of satellite imaging, ESG dashboards, and geospatial tools is expanding, improving visibility into land use and environmental compliance.
Several external factors are influencing the pace of these developments:
Regulatory Pressure: Both domestic policies (e.g. Forest Code enforcement) and international regulations (e.g. EU Deforestation Regulation) are pushing the sector toward more sustainable practices.
Access to Finance Support: Many producers face challenges accessing the capital and knowledge needed to invest in sustainable transitions.
Market Demand and Traceability: Although global buyers and certain export markets are advancing deforestation‑free and fully traceable beef requirements, Brazil’s export profile remains concentrated in Asian markets, where such standards are not yet in place. As nearly 70% of Brazilian beef production is consumed domestically—within a developing‑economy context where sustainability attributes are not a primary driver of consumer demand—market incentives for large‑scale adoption of deforestation‑free production remain limited. As a result, while monitoring and certification systems continue to evolve, current market dynamics do not yet provide widespread support for a transition toward fully deforestation‑free beef across the sector.
Climate Variability: Extreme weather events such as droughts and floods are becoming more frequent, affecting pasture productivity.
Public Perception: The sector is under growing scrutiny from civil society and international media, which increases reputational risks and motivates change.
Data Limitations: While monitoring tools are improving, public data remains inconsistent and traceability is limited, particularly in indirect supply chains and among smaller producers.
Rabobank Key Actions
Rabobank contributes to the decarbonization of the Brazilian Beef sector by supporting farmers and stakeholders in their transition toward more sustainable land use, improved environmental performance, and long-term resilience—through actions at customer, portfolio, and system level.
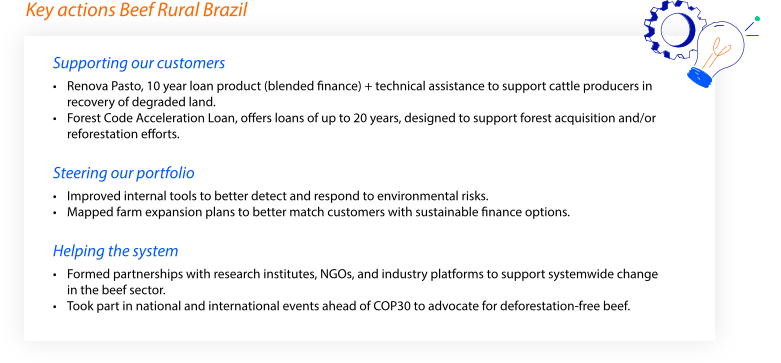
Sector Outlook/Reflection
The Brazilian beef sector is central to global climate and nature discussions. While the ambition for deforestation-free production is widely supported, implementation remains challenging. Producers operate in areas where legal, market, and land use dynamics are often misaligned. Rabobank plays a role in navigating these complexities, by supporting customers who want to transition, while recognizing that broader progress depends on systemic alignment beyond the farm level.
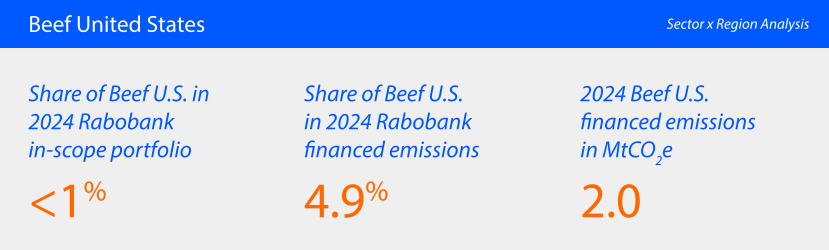
Sector Materiality
Rabobank’s U.S. beef portfolio spans the full value chain, engaging with both production and supply chain partners, which impacts our emissions profile and strengthens our ability to encourage efficient practices throughout the entire value chain.
Climate Impact
Financed emissions dropped by 2.9 Mt. Findings from our Farm Efficiency calculator (developed in cooperation with AgNext, part of Colorado State University) indicate that physical intensity emissions from Rabobank’s customers reached 19.0 tCO2e/t. The recent “Guaranteeing Fair Banking for All Americans” executive order and recently enacted state laws prevent external reporting of intensity targets.
Material Risks
Climate: Drought continues to be the most significant climate-related risk, posing ongoing challenges to beef production.
Nature: Water scarcity stands out as the primary nature risk, directly impacting crop growth and feed availability. As more granular data becomes available, risk assessments will increasingly reflect local conditions and be tailored to the specific farming practices of each customer.
Market Developments
Several market developments are helping to decarbonize the U.S. beef sector:
Innovation in Feed and Genetics: Feed additives like ionophores and Enogen corn help reduce methane emissions and improve feed conversion. In addition, breeding animals that grow faster and require less feed contributes to lower emissions per kilogram of beef.
Manure Management: Transitioning from dry-lot systems to composting or anaerobic digestion can reduce methane emissions.
Farm Efficiency: Tools are now available to help producers measure, understand, and benchmark their operational efficiency, supporting more targeted mitigation and reduction strategies.
Several external factors are influencing the pace of these developments:
Policy Environment: The absence of federal carbon pricing or mandatory emissions policies in the U.S. is contrasted by the emergence of stricter climate laws in certain states. Additionally, the recent “Guaranteeing Fair Banking for All Americans” executive order and recently enacted state laws prohibits influencing a customer’s lawful business activities.This environment results in a complex and sometimes conflicting regulatory landscape, adding uncertainty for producers and supply chain partners.
Data and Technology Gaps: Detailed emissions and nature-related data remain limited, particularly in the early stages of beef production (such as the cow/calf segment). Traceability continues to be a significant challenge, hindering efforts to accurately measure and manage impacts throughout the value chain.
Market Pressure: Retailers and processors are placing increasing demands on suppliers for environmental data and demonstrable emissions reductions. This indirect pressure compels producers to take action, while also driving meat processors to align with evolving retailer expectations.
Rabobank Key Actions
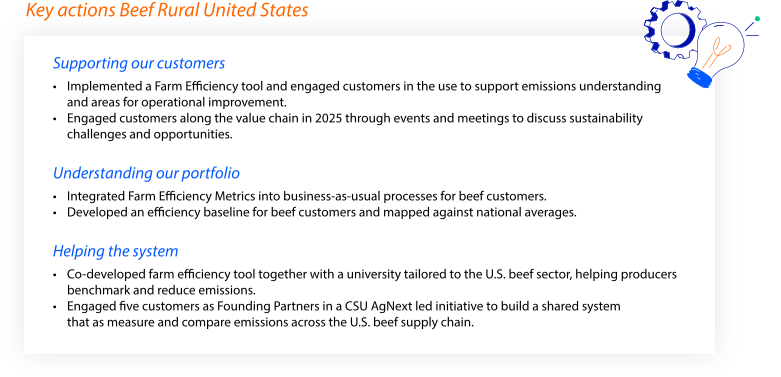
Sector Outlook/Reflection
The U.S. beef sector continues to make steady progress in sustainability by building on existing efficiencies and pursuing incremental improvements. Rabobank supports this journey by providing customers with practical tools, reliable data, and ongoing engagement to help them benchmark and enhance their operations. Since 2022, our approach has emphasized collaboration, transparency, and measurable outcomes. By working closely with producers and supply chain partners, Rabobank helps identify opportunities for operational gains and supports the adoption of best practices. While the sector is diverse and complex, progress is being achieved through continuous improvement and shared commitment to efficiency across the value chain.
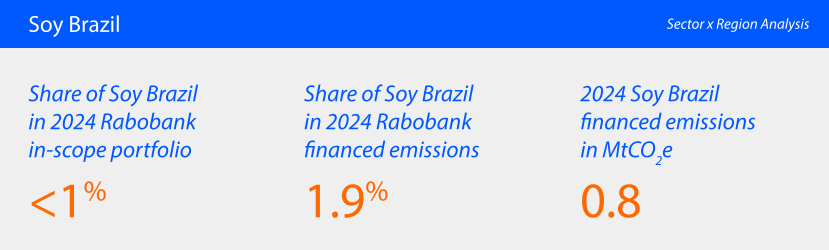
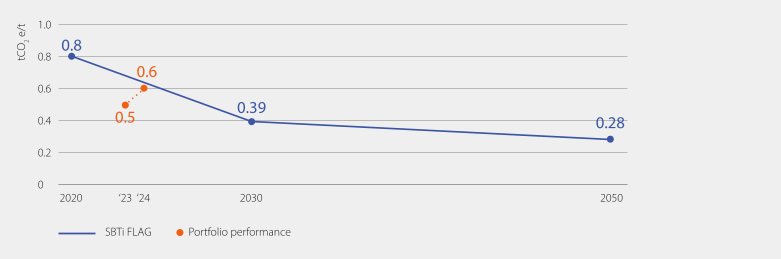
Sector Materiality
The Brazil soybean farming sector can be characterized as an intensive farming system mainly supported by rainfed scheme. Soybean farmers in Brazil largely use no-tillage and double-cropping systems (resulting in soils being covered by living plants or residues year-round). Rabobank focuses on providing financial services to the top segment of farmers.
Climate Impact
Financed emissions increased from 0.7 Mt to 0.8 Mt, driven entirely by portfolio growth. In 2023, emissions intensity could be calculated for the first time, although Scope 3 contributions were estimated at that stage. With the availability of enhanced data and additional client‑specific Scope 3 information, reported intensity increased by 13% to 0.60 tCO₂e/t in 2024. Over the longer term, average emissions intensity declined from 0.80 tCO₂e/t in 2020 to 0.53 tCO₂e/t in 2023, before rising again in 2024. While the Brazilian soy portfolio represents a relatively small share of total financed emissions compared with other sectors, soy cultivation nonetheless has climate impacts, primarily linked to land‑use change. The conversion of natural vegetation to agricultural land—including when conducted in compliance with legal requirements—results in the loss of carbon‑storing ecosystems and contributes to greenhouse gas emissions.
Material Risks
Climate: The main climate risk comes from land clearing for soy production, which releases large amounts of carbon and undermines efforts to reduce emissions.
Nature: Soy expansion into dense forested areas of the Amazon and Cerrado biomes poses significant risks to biodiversity, soil integrity and water availability, ultimately undermining long‑term agricultural productivity. When this expansion occurs through the conversion of native vegetation, it amplifies ecosystem degradation and contributes to climate instability across the landscape.
Market Developments
Several market developments are helping to decarbonize the Brazilian soy sector:
Sustainable Land Management: Many soy producers are restoring degraded land instead of clearing new areas. This reduces emissions from deforestation (+ increase soil carbon) and helps maintain soil health and productivity.
Trader Commitments: Major soy traders have committed to eliminating deforestation from their supply chains by 2025, and several aim for conversion-free soy by 2030.
Carbon Initiatives: Sector-wide efforts are emerging to restore degraded land and generate carbon credits. They aim to scale reforestation and forest preservation and support regenerative agriculture and degraded land recovery.
Monitoring and Data Tools: The use of satellite imaging, ESG dashboards, and geospatial tools is expanding, improving visibility into land use and environmental compliance.
Several external factors are influencing the pace of these developments:
Policy Environment: Legal land clearing under Brazil’s Forest Code slows progress toward deforestation-free soy, despite growing global pressure for stricter standards.
Data Limitations: While monitoring tools are improving, public data remains inconsistent and traceability is limited, particularly in indirect supply chains and among smaller producers.
Structural Barriers: Limited access to finance, restoration infrastructure, and coordinated policy support continue to hinder large-scale adoption of sustainable practices.
Rabobank Key Actions
Guided by its forest protection and land use change strategy, Rabobank Brazil has implemented a series of targeted actions to discourage deforestation and land conversion, strengthen portfolio oversight, and support customers in transitioning to more sustainable land use practices.
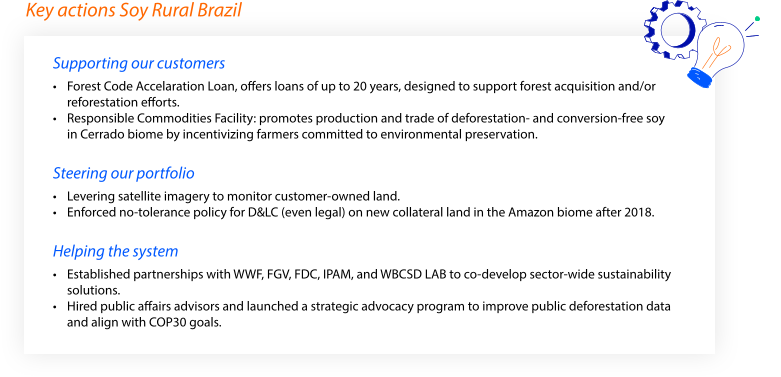
Sector Outlook/Reflections
Brazil’s soy sector, a cornerstone of global food supply and land use transformation, is navigating a complex transition, balancing international sustainability expectations with local realities. While the sector faces increasing scrutiny over deforestation and land use, it also holds significant potential for climate-smart agriculture. Rabobank plays a role in navigating these complexities, by supporting customers who want to transition, while recognizing that broader progress depends on systemic alignment beyond the farm level.
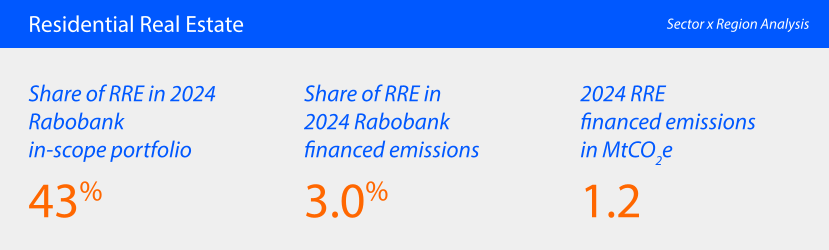
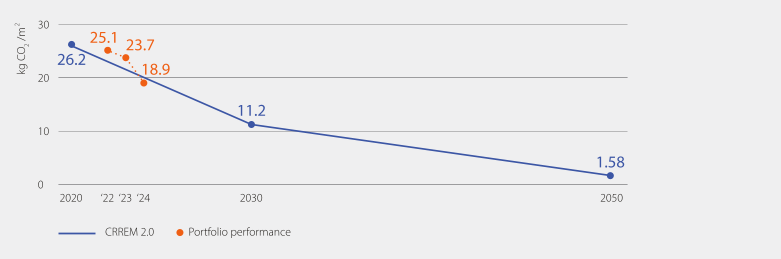
Sector Materiality
With over one million customers and a growing mortgage book, we feel the urge to help customers improve the energy efficiency of their homes and concurrently reduce the climate impact of our mortgages portfolio.
Climate Impact
Financed emissions decreased mainly due to a cleaner energy mix, more energy efficient homes, and targeted sustainability initiatives, particularly those improving energy labels. Although the outstanding volume grew slightly, the reduction in unit-level intensities more than offset this effect. Physical intensity dropped from 23.7 to 18.9 kg CO2/m2, reflecting efficiency improvements. Overall, financed emissions fell by 0.4 Mt to 1.2 Mt. However, the steeper CRREM 2.0 target pathways requires all involved stakeholders to work together and play their part; municipalities, energy and building companies, and home and building owners, will need to continue and step up their efforts.
Material Risks
Climate: Material risks are transition risk, flooding, and foundation damage. While current portfolio exposure to high flood and foundation risk is limited (the impact on individual customers affected by these risks can be impactful).
People: To mitigate climate risks for homeowners, we provide information and advice on making homes more sustainable through our website and energy performance advisors. Additionally, reliable and accessible information about potential climate risks should be available to current homeowners and prospective buyers.
Market Developments
Three market developments which impact the decarbonization of the Dutch mortgage sector:
Cleaner Energy Sources: The carbon footprint of homes is decreasing as the national electricity supply shifts to renewable energy sources like wind and solar.
Energy Efficiency: Reducing energy demand through better insulation and other efficiency measures is the first step in lowering emissions.
Electrification: Replacing fossil fuel systems with electric alternatives, such as heat pumps, further reduces the carbon footprint.
Several external factors are influencing the pace of these developments:
Government Regulations: Regulations, subsidies, and platforms like verbeterjehuis.nl support homeowners, but consistent governmental policy development en implementation are key.
Economic Factors: High interest rates, rising energy prices, and the overall cost of living (including inflation) all affect both the willingness and ability to invest in energy efficiency, despite long-term benefits like lower energy bills and increased property value.
Housing Shortage: A significant housing shortage, with over 400,000 homes needed, adds to these difficulties. The government’s ambition to build 100.000 homes yearly adds pressure to build quickly and affordably, while still meeting sustainability standards.
Grid Infrastructure Constraints: As electricity use increases for home heating and electric vehicles, the grid must be improved to avoid overload and delays.
Rabobank Key Actions
Our insight into what helps to decrease the carbon emissions of homes in our portfolio is increasing. This insight guides our efforts which we structure according to three levers.
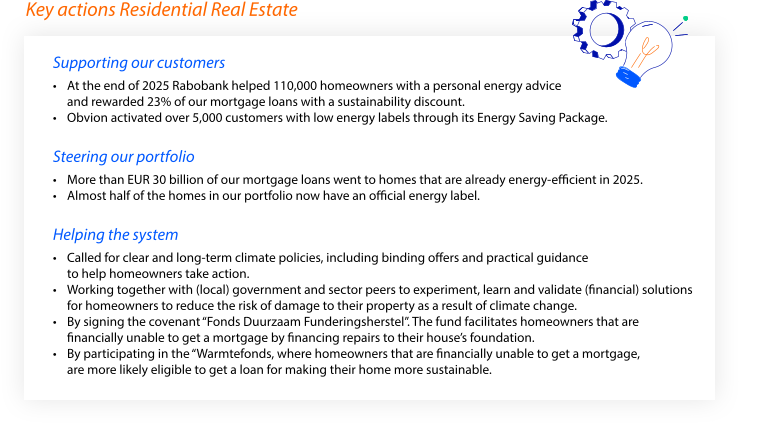
Sector Outlook/Reflection1
The residential real estate sector holds enormous potential for climate impact. Many homeowners want to improve their homes, but face financial-, practical-, or informational barriers. Rabobank helps bridge these gaps, by offering advice, financial incentives, and pushing for clearer policies. Still, the sector’s transition depends on more than individual action. It requires coordination across government, energy providers, and the construction sector. Rabobank’s role lies in supporting our customers to increase the energy-efficiency of their homes.
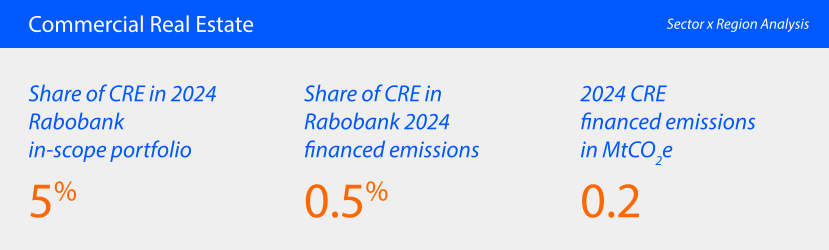
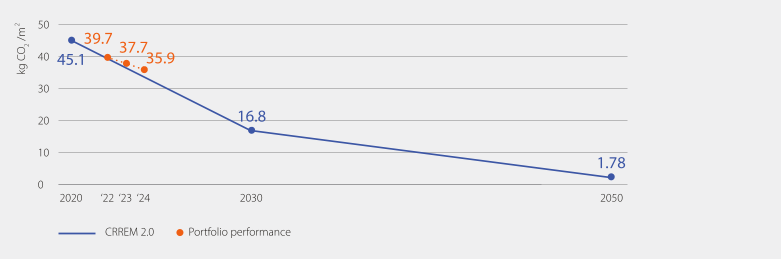
Sector Materiality
Our Commercial Real Estate portfolio2 is well-diversified across residential, office, retail, and industrial assets.
Climate Impact
Since the last update in our Road to Paris report published in 2022, the CRREM benchmark has become significantly steeper due to the latest scientific insights, raising the bar for decarbonisation. In 2024, physical intensity emissions dropped from 37.7 to 33.8 kg CO₂/m², mainly by improving energy labels and a cleaner national energy mix. Still, the international climate target is hard to reach under current conditions. More progress is expected after 2030, mostly through a different energy mix.
Material Risks
Climate: Key risks include drought/foundation risk and flooding. Approximately 3.8% of the portfolio is exposed to high climate risk, affecting 106 customers. Engagement and risk assessments are planned for 2026 to address these vulnerabilities.
Nature: N.a.
People: Affordable housing is a strategic priority. Over 70% of the residential rental portfolio is classified as affordable, with a focus on rural areas.
Market Developments
Several market developments are helping to decarbonize the Dutch CRE sector:
Energy Mix Transition: The decarbonization of the built environment depends heavily on the national energy mix. Progress in district heating, biogas, and electrification remains slow.
Energy Efficiency Standards: Rules around how energy-efficient buildings must be are getting stricter. This helps reduce emissions, but how well these rules are enforced and how ambitious they are can differ from one type of building to another.
Data and Transparency: The sector is starting to collect better and more detailed information about how much energy buildings use. This shift, from estimated labels to real energy data, is slowly starting to progress, the pace is expected to pick up in 2027.
Several external factors are influencing the pace of these developments:
Policy Gaps: The Dutch climate plan for buildings is not as ambitious as international standards, which slows down progress.
Infrastructure Bottlenecks: Delays in district heating and grid upgrades hinder electrification.
Macroeconomic conditions: Higher interest rates and stricter capital requirements affect financing availability and investment appetite.
Rabobank Key Actions
Rabobank supports the Commercial Real Estate sector in its transition toward a more sustainable built environment. Our actions are guided by growing insights into how we can reduce the carbon intensity of our portfolio and manage climate-related risks. These efforts are structured around three strategic levers: Customer, Portfolio, and System.
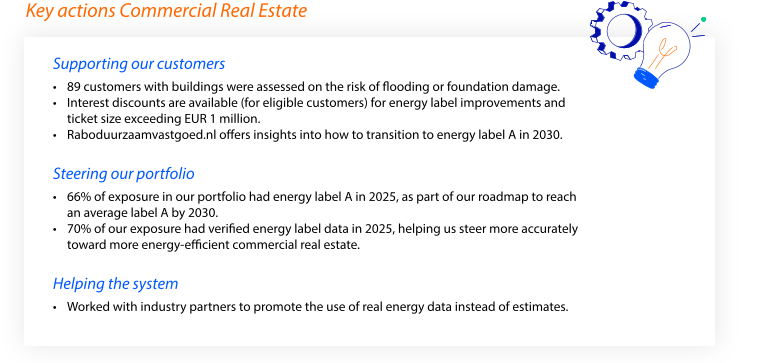
Sector Outlook/Reflection3
The Commercial Real Estate sector is both a challenge and an opportunity in the transition to a more sustainable built environment. While emissions from buildings are relatively low compared to other sectors, the sector’s influence lies in how buildings are designed, used, and adapted to climate risks. Rabobank plays a key role by helping customers future-ready their properties, through energy efficiency, climate resilience, and affordability. As the sector shifts from estimated performance to real energy use, the focus is increasingly on measurable impact. This transition requires not just financing, but also guidance, partnerships, and long-term commitment.
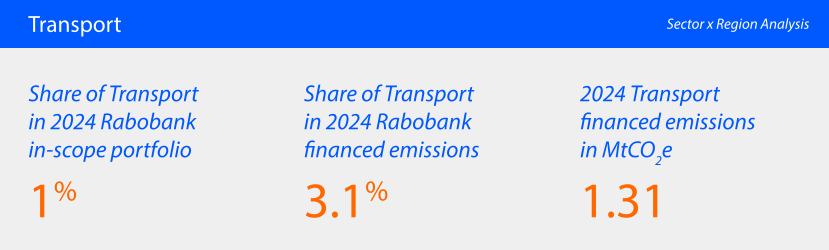
Climate Impact
Due to incompatibilities between client data reporting and the metrics used in the IEA’s decarbonization pathway we cannot measure the performance of this sector x region combination. We are working to find a more suitable pathway.
Sector Materiality
Sector: As of 2023, the Dutch road transport sector plays a vital role in the national economy, Transport by road contributing approximately 3.6% to GDP and employing over 241,000 FTEs, of which around 60% are drivers. Transport over water contributing approximately 1.4% to GDP and employing over 10,000 FTE’s. The sector includes national and international freight transport, distribution, courier services, and specialized logistics.
Rabobank Portfolio: As of mid-2025, Rabobank holds a 29,1% market share in the transport by road sector and a 44,1 for the transport over water , with a total exposure of approximately €3.788 million. Our portfolio is concentrated in medium and large enterprises, with a growing focus on financing zero-emission (ZE) vehicles and sustainable logistics solutions.
Material Risks
Transition Risk: Rated as medium. The sector faces increasing pressure to decarbonize due to EU and national regulations, rising fuel costs, and customer demands. However, the short asset cycle of road transport offers flexibility for adaptation. For long-distance transport, no technically feasible zero-emission solution has yet been found. This means that they will remain dependent on (bio)diesel.
Physical Risk: Considered low. While climate-related disruptions are relevant, the main challenges are infrastructure-related, such as grid-congestion and limited access to renewable energy and the affordability of renewable energy.
Social Risk: Rated as high. The sector is heavily reliant on an ageing and increasingly international workforce. Labor shortages, unattractive secondary employment benefits, high absenteeism, and scrutiny of working conditions pose reputational and operational risks.
Market Developments
Several market developments are helping to decarbonize the Dutch Transport sector:
Biofuels and Renewable Diesel: Hydrotreated Vegetable Oil (HVO) and other renewable fuels are increasingly used as transitional solutions to reduce emissions. However, concerns around supply constraints, cost, and long-term sustainability limit their viability as a permanent alternative.
Digitalization & Automation: AI, predictive maintenance, and autonomous driving and sailling are improving efficiency and reducing emissions.
Labor-Saving Technologies: Robotics and automation are being deployed to address labor shortages and improve productivity, especially in physically demanding or repetitive tasks.
Several external factors are influencing the pace of these developments:
Government Policy: ZE zones, CO₂ pricing, and REDIII are accelerating the transition. However, uncertainty around implementation and an uneven playing field between the Netherlands, Belgium and Germany can delay investment decisions.
Infrastructure Limitations: Grid congestion and limited access to charging and hydrogen refuelling infrastructure are major bottlenecks for scaling zero-emission solutions.
Economic Conditions: High upfront costs of ZE vehicles or vessels and limited EBITDA margins in the sector make financing challenging, especially for smaller firms
Labor Market Pressures: Aging workforce and stricter labor laws increase operational complexity.
Customer Expectations: Shippers increasingly demand sustainable transport, creating both pressure and opportunity.
Rabobank Key Actions
Rabobank supports the Dutch transport sector in its transition towards zero-emission logistics by leveraging its role as financier and advisor. Our actions are structured across three levers:
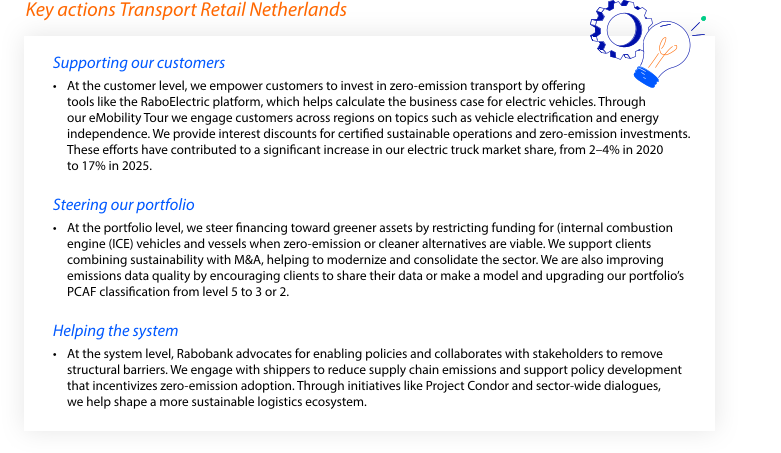
Sector Outlook/Reflection
Climate Impact
Between 2020 and 2023, Rabobank’s financed emissions in the transport portfolio decreased from 1.002 to 0.860 Mt CO₂e, a reduction of approximately 14%. However, without additional policy measures, the sector is projected to fall short of the national -55% reduction target by 2030, with current estimates ranging between 44–52%.Climate risk
Transition risks are considered medium. The sector faces high capital requirements, limited demand for zero-emission solutions, limited EBITDA growth, and residual value concerns for zero-emission assets. Technological development is progressing, but infrastructure limitations—particularly grid congestion and hydrogen availability—remain key bottlenecks. Rabobank mitigates these risks by focusing on newer, more efficient assets and by supporting customers with tailored financing and advisory services.Nature and People
Nature-related risks are less material in this sector, but social risks are significant. The sector continues to struggle with labor shortages, an aging workforce, unattractive secondary employment benefits and increasing scrutiny of working conditions—especially for foreign employees. Rabobank emphasizes the importance of digitalization and autonomous developments to enable future operations with fewer people. In the short term, discussions mainly focus on attracting personnel and inspiring young people, while simultaneously working on long-term resilience.
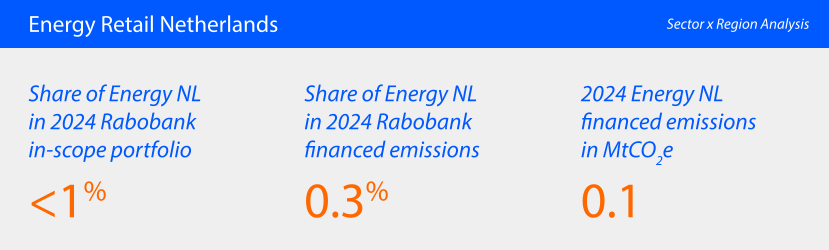
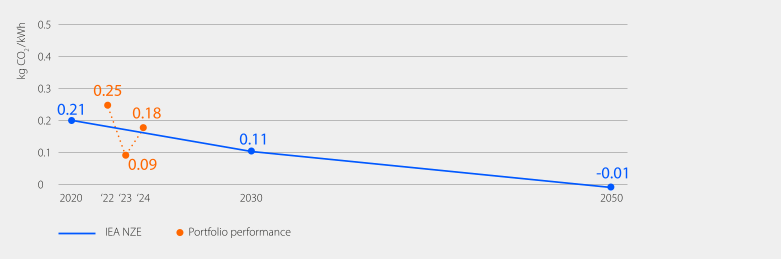
Sector Materiality
Sector: The Dutch energy sector is central to the national climate strategy, with a target of 70% renewable electricity by 2030. Currently, electricity accounts for only 16% of total energy consumption, but 50% of that electricity is already renewable. The sector includes solar, wind, geothermal, hydrogen, and biogas, with increasing emphasis on storage and distribution infrastructure.
Rabobank Portfolio: Rabobank’s Dutch Retail Banking (DRB) energy portfolio primarily finances renewable energy assets such as solar parks and wind farms. In 2024, the portfolio reached a volume of €841 million.
Climate Impact
Our target performance is deteriorating due to the growing exposure in biofuels. However, as biofuels are considered transition fuels, the current performance is considered acceptable and no additional mitigating actions will be undertaken.
Material Risks
Key climate risks: Rabobank faces low transition risk due to its limited exposure to fossil fuel-based energy, while the broader sector is exposed to high transition risk as a result of rising CO₂ prices under the EU Emissions Trading System (ETS).
Market Developments
Several market developments are helping to decarbonize the Dutch Energy sector:
Shift to Renewable Electricity: The share of renewable electricity in the Dutch energy mix has reached 50%, with a national target of 70% by 2030. This transition is central to reducing Scope 2 emissions across sectors.
Diversification of Energy Sources: Growth in solar, wind, geothermal, and biogas is supported by new financing propositions and infrastructure development.
Energy Hubs and Cooperatives: Initiatives such as energy hubs at business parks and local energy cooperatives are emerging to better match supply and demand.
Several external factors are influencing the pace of these developments:
Grid Congestion: Limited grid capacity is a major bottleneck for scaling up renewable electricity generation and distribution.
Policy and Regulation: National climate targets remain ambitious, but the pace of implementation is challenged by factors such as permitting delays, nitrogen-related restrictions, and elevated interest rates.
EU Emissions Trading System (ETS): Increasing CO₂ prices under the ETS create financial pressure on fossil-based energy producers, accelerating the shift to renewables.
Cross-sectoral Dependencies: Other sectors rely on clean electricity to meet their own decarbonization goals, increasing the urgency for energy sector transformation.
Rabobank Key Actions
Rabobank supports the Dutch energy sector in accelerating the transition to a sustainable energy system. Our actions are structured across three levels—customer, portfolio, and system—to ensure we contribute meaningfully to the generation, storage, and distribution of renewable energy.
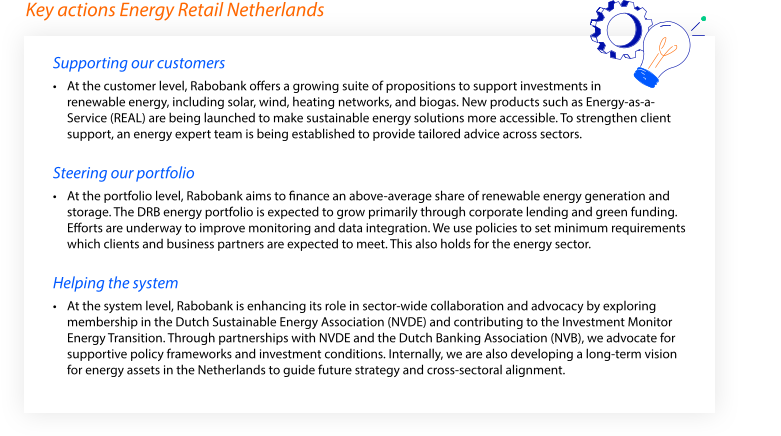
Sector Outlook/Reflection
Climate Impact
The DRB energy portfolio is well aligned with the Paris climate goals as it consists almost entirely of renewable energy assets. As a result, financed emissions are very low and remain well below the IPCC pathway. Looking ahead, the portfolio is expected to grow with minimal impact on emissions thanks to the low carbon intensity of renewable energy.Climate risk
Transition risk within Rabobank’s DRB energy portfolio is considered low given the limited exposure to fossil fuel-based electricity generation. However, the broader energy sector continues to face high transition risk due to rising CO₂ prices under the EU Emissions Trading System (ETS). Rabobank will continue to monitor these developments and advocate for policy frameworks that support a stable and accelerated transition.Nature and People
On the nature side, the expansion of renewable energy infrastructure—such as wind turbines and solar parks—can lead to spatial pressure on biodiversity and agricultural land. Careful spatial planning and integration with nature-inclusive design are therefore essential to minimize ecological disruption1.
Energy cooperatives and local ownership models can enhance public support and distribute benefits more fairly. However, issues such as affordability of energy, access to clean technologies, and the distribution of grid infrastructure may lead to regional or socioeconomic disparities. Ensuring a just transition—where vulnerable groups are not left behind—is increasingly seen as a key policy priority.
Asset x Region Analysis: DLL Transport
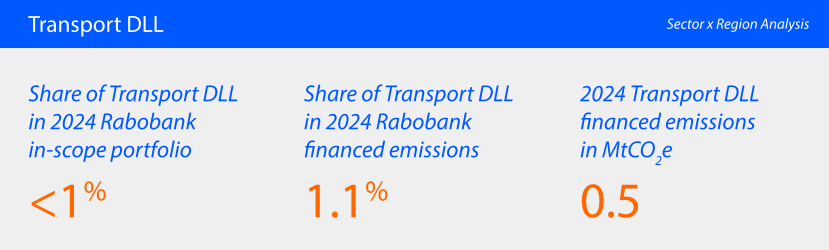
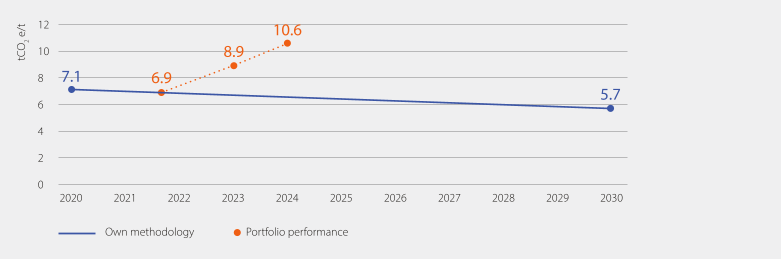
Sector Materiality
DLL’s Transport sector represent a significant to DLL’s climate ambitions, and a key lever for impact.
Climate Impact
While there is a science-based pathway for transport, it does not fully align with DLL’s business model of leasing. Since 2022, the financed emissions intensity has increased by 10%.
Market Developments
Two market developments which impact the decarbonization of the Transport sector:
Fuel efficiency gains: For long haul heavy trucks, low-emission options are a short-term option for decarbonisation.
Electrification: Due to geopolitical developments globally, the uptake of electric vehicles has slowed down.
Smaller engines: The market is showing a gradual shift towards smaller, more efficient transport.
Several external factors influence the pace of these developments:
Geopolitical developments: Despite global policy changes has broadly slowed the uptake of electric vehicles, smaller pockets of faster electrification do exist.
Efficiency gains: Engines are becoming more efficient with precision agriculture enabling features which support the reduction on-farm emissions.
Infrastructure development: Charging equipment, storage, and transmission of electricity for transportation is growing globally.
Technology developments: The increased adoption of electric technology, has been reducing the cost of such technology.
DLL Key Actions
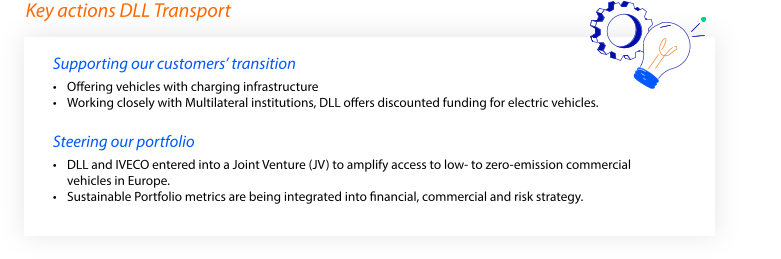
Sector Outlook/Reflection
Transportation has a high potential for decarbonisation. While geopolitical development has slowed the uptake of electric vehicles generally, there are some pockets of opportunity. DLL supports customers by offering vehicles and the infrastructure, sector expertise, and tailored financial products to support the transition into a low carbon economy.
Asset x Region Analysis: DLL Tractors
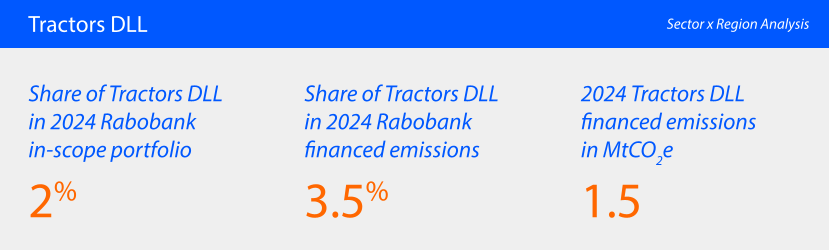
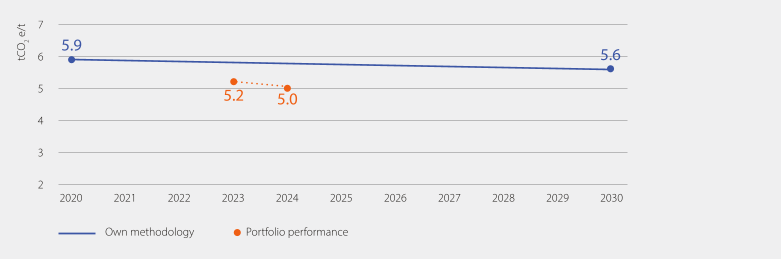
Sector Materiality
With over 200k tractors finances and a growing sector book, the Tractors represent a significant to DLL’s climate ambitions, and a key lever for impact.
Climate Impact
While there are developments for science-based targets for agriculture through SBTi FLAG, there is no science-based pathway for tractors specifically. Since 2022, the financed emissions-level has broadly remained constant at 0,1 Kg CO2-e/Euro outstanding.
Material Risks
Climate: Key material risks include transition risk, and flooding. While current portfolio exposure to high flood is limited (both ~1%). DLL is improving internal systems to better identify risks and supporting vendors and customer mitigate material climate risks.
Market Developments
Three market developments which impact the decarbonization of the Tractor sector:
Fuel efficiency gains: By financing more efficient tractors, DLL can reduce the overall footprint of tractors. DLL focuses on Stage IV/Final Tier V as the best-in-class engines.
Electrification: Electric tractors are not viable for large-scale adoption in the near-term due to technical challenges.
Smaller engines: The market is showing a gradual shift towards smaller, more efficient tractors.
Several external factors influence the pace of these developments:
Technical challenges: Development of zero direct emission powertrains for tractors is challenging due to the weight and intensity of usage during harvest.
Economic Factors: High interest rates, rising price of on-farm resources, and inflation affect both the willingness and ability to invest in newer technology.
Efficiency gains: Engines are becoming more efficient with precision agriculture enabling features which support the reduction on-farm emissions.
Infrastructure development: Charging equipment, storage, and transmission of electricity for tractors for farms is limited.
DLL Key Actions
Our insight into what helps decrease the carbon emissions of tractors in our portfolio is increasing. This insight guides our efforts which we structure according to two levers:
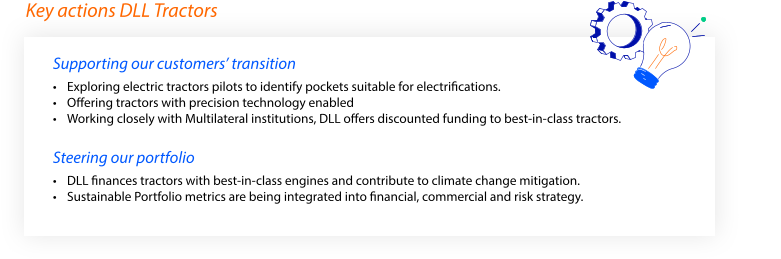
Sector Outlook/Reflection
Tractors serve an essential function in the food system. As the need for food increases, DLL is committed to support our customers and vendors in the food system transition. DLL recognizes that tractors are in the hard to abate sector and aims to identify and help partners overcome roadblocks. The sector’s transition is dependent on policies, market development, system coordination, and customer demand. DLL translates this ambition into action by offering innovative financial products, partnering with front-running vendors and customers, and financing best-in-class assets.
- An updated calculation methodology that aligns more with CRREM was received just prior to closing the annual report, but given the limited time available, it was not possible to include it.
- The graph applies to our full Commercial Real Estate portfolio. The elaborations below the graph apply to the Retail NL part of the portfolio as this is most material.
- An updated calculation methodology that aligns more with CRREM was received just prior to closing the annual report, but given the limited time available, it was not possible to include it.
Appendix 3: EU Taxonomy Tables
| 1. Assets for the calculation of GAR - Turnover KPI | |||||||||||||||||
|---|---|---|---|---|---|---|---|---|---|---|---|---|---|---|---|---|---|
| Disclosure reference date 31-12-2025 | |||||||||||||||||
| Total (gross) carrying amount | Of which Taxonomy-eligible | Of which Taxonomy-aligned | Breakdown per environmental objective | Of which use of Proceeds | Of which Transitional | Of which Enabling | |||||||||||
| Amounts in millions of euros | Climate Change Mitigation (CCM) | Climate Change Adaptation (CCA) | Water and Marine Resources (WTR) | Circular Economy (CE) | Pollution (PPC) | Biodiversity and Ecosystems (BIO) | Non-assessed exposured | Of which financing non-material activities of counterparties | Of which exposures financing counterparties reporting in accordance with Article 7(9) | Of which not assessed considered non-material by the credit institution (5) | |||||||
| 1 | GAR - Covered assets in both numerator and denominator | ||||||||||||||||
| 2 | Loans and advances, debt securities and equity instruments not HfT eligible for GAR calculation | 226,129 | 208,425 | 34,066 | 33,936 | 119 | 0 | 11 | 0 | 40 | 24 | ||||||
| 3 | Financial undertakings | 18,228 | 4,835 | 527 | 527 | 1 | 40 | 22 | |||||||||
| 4 | Loans and advances | 15,947 | 4,606 | 497 | 496 | 1 | 40 | 22 | |||||||||
| 5 | Debt securities, including UoP | 668 | 63 | 6 | 6 | 0 | |||||||||||
| 6 | Equity instruments | 1,614 | 166 | 24 | 24 | ||||||||||||
| 7 | Non-financial undertakings | 3,350 | 771 | 310 | 180 | 118 | 0 | 11 | 0 | 0 | 2 | ||||||
| 8 | Loans and advances | 3,303 | 770 | 310 | 180 | 118 | 0 | 11 | 0 | 0 | 2 | ||||||
| 9 | Debt securities, including UoP | 40 | 1 | 0 | 0 | 0 | 0 | ||||||||||
| 10 | Equity instruments | 7 | 0 | 0 | 0 | 0 | 0 | 0 | |||||||||
| 11 | Households | 202,818 | 202,818 | 33,229 | 33,229 | ||||||||||||
| 12 | of which loans collateralised by residential immovable property | 202,818 | 202,818 | 33,229 | 33,229 | ||||||||||||
| 13 | of which building renovation loans | ||||||||||||||||
| 14 | of which motor vehicle loans | ||||||||||||||||
| 15 | Local governments financing | 1,732 | 1 | ||||||||||||||
| 16 | Housing financing | ||||||||||||||||
| 17 | Other local government financing | 1,732 | 1 | ||||||||||||||
| 18 | Collateral obtained by taking possession: residential and commercial immovable properties | ||||||||||||||||
| 19 | Exposures included on a voluntary basis | ||||||||||||||||
| 20 | Total GAR assets | 226,129 | |||||||||||||||
| 21 | Assets not covered for GAR calculation | ||||||||||||||||
| 22 | Central governments and Supranational issuers | 23,974 | |||||||||||||||
| 23 | Central banks exposure | 62,203 | |||||||||||||||
| 24 | Trading book | 21,951 | |||||||||||||||
| 25 | Undertakings and entities not subject to CSRD | 290,949 | |||||||||||||||
| 26 | SMEs and undertakings (other than SMEs) not subject to CSRD disclosure obligations | 144,954 | |||||||||||||||
| 27 | Loans and advances | 138,950 | |||||||||||||||
| 28 | of which loans collateralised by commercial immovable property | 33,502 | |||||||||||||||
| 29 | of which building renovation loans | ||||||||||||||||
| 30 | Debt securities | 4,308 | |||||||||||||||
| 31 | Equity instruments | 1,696 | |||||||||||||||
| 32 | Non-EU country counterparties not subject to CSRD disclosure obligations | 145,995 | |||||||||||||||
| 33 | Loans and advances | 144,523 | |||||||||||||||
| 34 | Debt securities | 667 | |||||||||||||||
| 35 | Equity instruments | 804 | |||||||||||||||
| 36 | Derivatives | 691 | |||||||||||||||
| 37 | On demand interbank loans | 841 | |||||||||||||||
| 38 | Cash and cash-related assets | 568 | |||||||||||||||
| 39 | Other categories of assets (e.g. Goodwill, commodities etc.) | 13,222 | |||||||||||||||
| 40 | Total assets | 640,527 | |||||||||||||||
| Off-balance sheet exposures - Corporates subject to CSRD disclosure obligations | |||||||||||||||||
| 41 | Financial guarantees | 4 | 4 | 4 | |||||||||||||
| 42 | Assets under management | 40,125 | 40,125 | 40,125 | |||||||||||||
| 43 | Of which debt securities | 8,125 | 8,125 | 8,125 | |||||||||||||
| 44 | Of which equity instruments | 32,000 | 32,000 | 32,000 | |||||||||||||
| 1. Assets for the calculation of GAR - Turnover KPI | Disclosure reference date 31-12-2024 | |||||||||||||||||||||||||||||||
|---|---|---|---|---|---|---|---|---|---|---|---|---|---|---|---|---|---|---|---|---|---|---|---|---|---|---|---|---|---|---|---|---|
| Climate Change Mitigation (CCM) | Climate Change Adaptation (CCA) | Water and marine resources (WMR) | Circular economy (CE) | Pollution (P) | Biodiversity and Ecosystems (BE) | TOTAL (CCM + CCA + WMR + CE + P + BE) | ||||||||||||||||||||||||||
| Of which towards taxonomy relevant sectors (Taxonomy-eligible) | Of which towards taxonomy relevant sectors (Taxonomy-eligible) | Of which towards taxonomy relevant sectors (Taxonomy-eligible) | Of which towards taxonomy relevant sectors (Taxonomy-eligible) | Of which towards taxonomy relevant sectors (Taxonomy-eligible) | Of which towards taxonomy relevant sectors (Taxonomy-eligible) | Of which towards taxonomy relevant sectors (Taxonomy-eligible) | ||||||||||||||||||||||||||
| Total (gross) carrying amount | Of which environmentally sustainable (Taxonomy-aligned) | Of which environmentally sustainable (Taxonomy-aligned) | Of which environmentally sustainable (Taxonomy-aligned) | Of which environmentally sustainable (Taxonomy-aligned) | Of which environmentally sustainable (Taxonomy-aligned) | Of which environmentally sustainable (Taxonomy-aligned) | Of which environmentally sustainable (Taxonomy-aligned) | |||||||||||||||||||||||||
| Amounts in millions of euros | Of which specialised lending | Of which transitional | Of which enabling | Of which specialised lending | Of which enabling | Of which specialised lending | Of which enabling | Of which specialised lending | Of which enabling | Of which specialised lending | Of which enabling | Of which specialised lending | Of which enabling | Of which specialised lending | Of which transitional | Of which enabling | ||||||||||||||||
| 0 | GAR - Covered assets in both numerator and denominator | |||||||||||||||||||||||||||||||
| 1 | Loans and advances, debt securities and equity instruments not HfT eligible for GAR calculation | 275,781 | 195,610 | 23,949 | 19 | 4 | 94 | 220 | - | - | 0 | 0 | - | - | - | 32 | 9 | - | - | 1 | - | - | - | 0 | - | - | - | 195,862 | 23,958 | 19 | 4 | 94 |
| 2 | Financial corporations | 64,043 | 441 | 44 | 7 | 3 | 2 | 1 | - | - | 0 | - | - | - | - | - | - | - | - | 442 | 44 | 7 | 3 | 2 | ||||||||
| 3 | Credit institutions | 33,204 | 354 | 41 | 7 | 3 | 1 | 1 | - | - | 0 | - | - | - | - | - | - | - | - | 355 | 41 | 7 | 3 | 1 | ||||||||
| 4 | Loans and advances | 27,120 | 199 | 18 | 7 | 1 | 1 | 1 | - | - | 0 | - | - | - | - | - | - | - | - | 200 | 18 | 7 | 1 | 1 | ||||||||
| 5 | Debt securities, including UoP | 5,729 | 155 | 23 | 0 | 2 | 0 | 0 | - | - | - | - | - | - | - | - | - | - | - | 155 | 23 | 0 | 2 | 0 | ||||||||
| 6 | Equity instruments | 355 | - | - | - | - | - | - | - | - | - | - | - | - | - | - | - | - | ||||||||||||||
| 7 | Other financial corporations | 30,839 | 87 | 3 | - | 0 | 0 | 0 | - | - | - | - | - | - | - | - | - | - | - | 87 | 3 | - | 0 | 0 | ||||||||
| 8 | of which investment firms | - | - | - | - | - | ||||||||||||||||||||||||||
| 9 | Loans and advances | - | - | - | - | - | ||||||||||||||||||||||||||
| 10 | Debt securities, including UoP | - | - | - | - | - | ||||||||||||||||||||||||||
| 11 | Equity instruments | - | - | - | - | |||||||||||||||||||||||||||
| 12 | of which management companies | - | - | - | - | - | ||||||||||||||||||||||||||
| 13 | Loans and advances | - | - | - | - | - | ||||||||||||||||||||||||||
| 14 | Debt securities, including UoP | - | - | - | - | - | ||||||||||||||||||||||||||
| 15 | Equity instruments | - | - | - | - | |||||||||||||||||||||||||||
| 16 | of which insurance undertakings | 0 | 0 | 0 | - | 0 | 0 | - | - | - | - | 0 | 0 | - | 0 | 0 | ||||||||||||||||
| 17 | Loans and advances | 0 | 0 | 0 | - | 0 | 0 | - | - | - | - | - | - | - | - | 0 | 0 | - | 0 | 0 | ||||||||||||
| 18 | Debt securities, including UoP | - | - | - | - | - | ||||||||||||||||||||||||||
| 19 | Equity instruments | - | - | - | - | |||||||||||||||||||||||||||
| 20 | Non-financial corporations (NFCs subject to NFRD disclosure obligations) | 3,955 | 531 | 161 | 12 | 1 | 92 | 219 | - | 0 | 32 | 9 | - | - | 1 | 0 | 783 | 170 | 12 | 1 | 92 | |||||||||||
| 21 | Loans and advances | 3,955 | 531 | 161 | 12 | 1 | 92 | 219 | - | 0 | 32 | 9 | - | - | 1 | 0 | 783 | 170 | 12 | 1 | 92 | |||||||||||
| 22 | Debt securities, including UoP | - | - | - | - | - | ||||||||||||||||||||||||||
| 23 | Equity instruments | - | - | 0 | - | - | ||||||||||||||||||||||||||
| 24 | Households | 205,572 | 194,638 | 23,744 | - | - | 194,638 | 23,744 | - | - | - | |||||||||||||||||||||
| 25 | of which loans collateralised by residential immovable property | 194,638 | 194,638 | 23,744 | - | - | 194,638 | 23,744 | - | - | - | |||||||||||||||||||||
| 26 | of which building renovation loans | - | - | - | - | - | ||||||||||||||||||||||||||
| 27 | of which motor vehicle loans | - | - | - | - | - | ||||||||||||||||||||||||||
| 28 | Local governments financing | 2,211 | - | - | - | - | - | - | - | - | - | - | - | - | - | - | - | - | - | - | - | - | - | - | ||||||||
| 29 | Housing financing | - | - | - | - | - | ||||||||||||||||||||||||||
| 30 | Other local government financing | 2,211 | - | - | - | - | - | - | - | - | - | - | - | - | - | - | - | - | - | - | - | - | - | |||||||||
| 31 | Collateral obtained by taking possession: residential and commercial immovable properties | |||||||||||||||||||||||||||||||
| 32 | Other assets excluded from the numerator for GAR calculation (covered in the denominator) | 243,876 | ||||||||||||||||||||||||||||||
| 33 | Non-financial corporations | 228,550 | ||||||||||||||||||||||||||||||
| 34 | SMEs and NFCs (other than SMEs) not subject to NFRD disclosure obligations | 113,839 | ||||||||||||||||||||||||||||||
| 35 | Loans and advances | 113,307 | ||||||||||||||||||||||||||||||
| 36 | of which loans collateralised by commercial immovable property | 57,924 | ||||||||||||||||||||||||||||||
| 37 | of which building renovation loans | |||||||||||||||||||||||||||||||
| 38 | Debt securities | 271 | ||||||||||||||||||||||||||||||
| 39 | Equity instruments | 261 | ||||||||||||||||||||||||||||||
| 40 | Non-EU country counterparties not subject to NFRD disclosure obligations | 114,711 | ||||||||||||||||||||||||||||||
| 41 | Loans and advances | 114,355 | ||||||||||||||||||||||||||||||
| 42 | Debt securities | 174 | ||||||||||||||||||||||||||||||
| 43 | Equity instruments | 182 | ||||||||||||||||||||||||||||||
| 44 | Derivatives | 709 | ||||||||||||||||||||||||||||||
| 45 | On demand interbank loans | 995 | ||||||||||||||||||||||||||||||
| 46 | Cash and cash-related assets | 531 | ||||||||||||||||||||||||||||||
| 47 | Other assets (e.g. Goodwill, commodities etc.) | 13,091 | ||||||||||||||||||||||||||||||
| 48 | Total GAR assets | 519,657 | 195,610 | 23,949 | 19 | 4 | 94 | 220 | - | - | 0 | 0 | - | - | - | 32 | 9 | - | - | 1 | - | - | - | 0 | - | - | - | 195,862 | 23,958 | 19 | 4 | 94 |
| 49 | Other assets not covered for GAR calculation | 123,101 | ||||||||||||||||||||||||||||||
| 50 | Sovereigns | 14,298 | ||||||||||||||||||||||||||||||
| 51 | Central banks exposure | 84,343 | ||||||||||||||||||||||||||||||
| 52 | Trading book | 24,461 | ||||||||||||||||||||||||||||||
| 53 | Total assets | 642,758 | 195,610 | 23,949 | 19 | 4 | 94 | 220 | - | - | 0 | 0 | - | - | - | 32 | 9 | - | - | 1 | - | - | - | 0 | - | - | - | 195,862 | 23,958 | 19 | 4 | 94 |
| Off-balance sheet exposures - Corporates subject to NFRD disclosure obligations | ||||||||||||||||||||||||||||||||
| 54 | Financial guarantees | 508 | 2 | 0 | 0 | 0 | 0 | 0 | - | - | - | 0 | - | - | - | - | - | - | - | - | 2 | 0 | 0 | 0 | 0 | |||||||
| 55 | Assets under management | 48,595 | 846 | 403 | - | 28 | 5 | 42 | 9 | - | - | 10 | 2 | - | 0 | 94 | 3 | - | 2 | 94 | 1 | - | 5 | 3 | - | - | - | 1,635 | 422 | - | 28 | 12 |
| 56 | Of which debt securities | 17,136 | 421 | 190 | - | 16 | 1 | 30 | 9 | - | - | 7 | 2 | - | 0 | 16 | 1 | - | 0 | 19 | 1 | - | 1 | 2 | - | - | - | 545 | 203 | - | 16 | 3 |
| 57 | Of which equity instruments | 28,980 | 424 | 213 | - | 12 | 4 | 12 | 0 | - | - | 3 | 0 | - | 0 | 77 | 3 | - | 2 | 76 | 0 | - | 4 | 1 | - | - | - | 1,090 | 218 | - | 12 | 9 |
| 1. Assets for the calculation of GAR - Capex KPI | |||||||||||||||||
|---|---|---|---|---|---|---|---|---|---|---|---|---|---|---|---|---|---|
| Disclosure reference date 31-12-2025 | |||||||||||||||||
| Total (gross) carrying amount | Of which Taxonomy-eligible | Of which Taxonomy-aligned | Breakdown per environmental objective | Of which use of Proceeds | Of which Transitional | Of which Enabling | |||||||||||
| Amounts in millions of euros | Climate Change Mitigation (CCM) | Climate Change Adaptation (CCA) | Water and Marine Resources (WTR) | Circular Economy (CE) | Pollution (PPC) | Biodiversity and Ecosystems (BIO) | Non-assessed exposured | Of which financing non-material activities of counterparties | Of which exposures financing counterparties reporting in accordance with Article 7(9) | Of which not assessed considered non-material by the credit institution (5) | |||||||
| 1 | GAR - Covered assets in both numerator and denominator | ||||||||||||||||
| 2 | Loans and advances, debt securities and equity instruments not HfT eligible for GAR calculation | 226,129 | 208,316 | 34,090 | 33,959 | 119 | 0 | 11 | 0 | 47 | 38 | ||||||
| 3 | Financial undertakings | 18,228 | 4,726 | 551 | 550 | 1 | 47 | 36 | |||||||||
| 4 | Loans and advances | 15,947 | 4,663 | 544 | 544 | 1 | 47 | 36 | |||||||||
| 5 | Debt securities, including UoP | 668 | 63 | 6 | 6 | 0 | |||||||||||
| 6 | Equity instruments | 1,614 | |||||||||||||||
| 7 | Non-financial undertakings | 3,350 | 771 | 310 | 180 | 118 | 0 | 11 | 0 | 0 | 2 | ||||||
| 8 | Loans and advances | 3,303 | 770 | 310 | 180 | 118 | 0 | 11 | 0 | 0 | 2 | ||||||
| 9 | Debt securities, including UoP | 40 | 1 | 0 | 0 | 0 | 0 | ||||||||||
| 10 | Equity instruments | 7 | 0 | 0 | 0 | 0 | 0 | 0 | |||||||||
| 11 | Households | 202,818 | 202,818 | 33,229 | 33,229 | ||||||||||||
| 12 | of which loans collateralised by residential immovable property | 202,818 | 202,818 | 33,229 | 33,229 | ||||||||||||
| 13 | of which building renovation loans | - | |||||||||||||||
| 14 | of which motor vehicle loans | - | |||||||||||||||
| 15 | Local governments financing | 1,732 | 1 | ||||||||||||||
| 16 | Housing financing | - | |||||||||||||||
| 17 | Other local government financing | 1,732 | 1 | ||||||||||||||
| 18 | Collateral obtained by taking possession: residential and commercial immovable properties | - | |||||||||||||||
| 19 | Exposures included on a voluntary basis | - | |||||||||||||||
| 20 | Total GAR assets | 226,129 | |||||||||||||||
| 21 | Assets not covered for GAR calculation | - | |||||||||||||||
| 22 | Central governments and Supranational issuers | 23,974 | |||||||||||||||
| 23 | Central banks exposure | 62,203 | |||||||||||||||
| 24 | Trading book | 21,951 | |||||||||||||||
| 25 | Undertakings and entities not subject to CSRD | 290,949 | |||||||||||||||
| 26 | SMEs and undertakings (other than SMEs) not subject to CSRD disclosure obligations | 144,954 | |||||||||||||||
| 27 | Loans and advances | 138,950 | |||||||||||||||
| 28 | of which loans collateralised by commercial immovable property | 33,502 | |||||||||||||||
| 29 | of which building renovation loans | - | |||||||||||||||
| 30 | Debt securities | 4,308 | |||||||||||||||
| 31 | Equity instruments | 1,696 | |||||||||||||||
| 32 | Non-EU country counterparties not subject to CSRD disclosure obligations | 145,995 | |||||||||||||||
| 33 | Loans and advances | 144,523 | |||||||||||||||
| 34 | Debt securities | 667 | |||||||||||||||
| 35 | Equity instruments | 804 | |||||||||||||||
| 36 | Derivatives | 691 | |||||||||||||||
| 37 | On demand interbank loans | 841 | |||||||||||||||
| 38 | Cash and cash-related assets | 568 | |||||||||||||||
| 39 | Other categories of assets (e.g. Goodwill, commodities etc.) | 13,222 | |||||||||||||||
| 40 | Total assets | 640,527 | |||||||||||||||
| Off-balance sheet exposures - Corporates subject to CSRD disclosure obligations | |||||||||||||||||
| 41 | Financial guarantees | 4 | 4 | 4 | |||||||||||||
| 42 | Assets under management | 40,125 | 40,125 | 40,125 | |||||||||||||
| 43 | Of which debt securities | 8,125 | 8,125 | 8,125 | |||||||||||||
| 44 | Of which equity instruments | 32,000 | 32,000 | 32,000 | |||||||||||||
| 1. Assets for the calculation of GAR - CAPEX KPI | Disclosure reference date 31-12-2024 | |||||||||||||||||||||||||||||||
|---|---|---|---|---|---|---|---|---|---|---|---|---|---|---|---|---|---|---|---|---|---|---|---|---|---|---|---|---|---|---|---|---|
| Climate Change Mitigation (CCM) | Climate Change Adaptation (CCA) | Water and marine resources (WMR) | Circular economy (CE) | Pollution (P) | Biodiversity and Ecosystems (BE) | TOTAL (CCM + CCA + WMR + CE + P + BE) | ||||||||||||||||||||||||||
| Of which towards taxonomy relevant sectors (Taxonomy-eligible) | Of which towards taxonomy relevant sectors (Taxonomy-eligible) | Of which towards taxonomy relevant sectors (Taxonomy-eligible) | Of which towards taxonomy relevant sectors (Taxonomy-eligible) | Of which towards taxonomy relevant sectors (Taxonomy-eligible) | Of which towards taxonomy relevant sectors (Taxonomy-eligible) | Of which towards taxonomy relevant sectors (Taxonomy-eligible) | ||||||||||||||||||||||||||
| Total (gross) carrying amount | Of which environmentally sustainable (Taxonomy-aligned) | Of which environmentally sustainable (Taxonomy-aligned) | Of which environmentally sustainable (Taxonomy-aligned) | Of which environmentally sustainable (Taxonomy-aligned) | Of which environmentally sustainable (Taxonomy-aligned) | Of which environmentally sustainable (Taxonomy-aligned) | Of which environmentally sustainable (Taxonomy-aligned) | |||||||||||||||||||||||||
| Amounts in millions of euros | Of which specialised lending | Of which transitional | Of which enabling | Of which specialised lending | Of which enabling | Of which specialised lending | Of which enabling | Of which specialised lending | Of which enabling | Of which specialised lending | Of which enabling | Of which specialised lending | Of which enabling | Of which specialised lending | Of which transitional | Of which enabling | ||||||||||||||||
| 0 | GAR - Covered assets in both numerator and denominator | |||||||||||||||||||||||||||||||
| 1 | Loans and advances, debt securities and equity instruments not HfT eligible for GAR calculation | 275,781 | 196,043 | 24,231 | - | 18 | 148 | 285 | - | - | 0 | 1 | - | - | - | 86 | 11 | - | - | 20 | - | - | - | - | - | - | - | 196,435 | 24,242 | - | 18 | 148 |
| 2 | Financial corporations | 64,043 | 448 | 37 | - | 2 | 5 | 1 | - | - | 0 | - | - | - | - | 0 | - | - | - | - | - | - | - | 448 | 37 | - | 2 | 5 | ||||
| 3 | Credit institutions | 33,204 | 346 | 32 | - | 2 | 2 | 1 | - | - | 0 | - | - | - | - | - | - | - | - | - | - | - | - | 346 | 32 | - | 2 | 2 | ||||
| 4 | Loans and advances | 27,120 | 201 | 14 | - | 1 | 2 | 0 | - | - | 0 | - | - | - | - | - | - | - | - | - | - | - | - | 201 | 14 | - | 1 | 2 | ||||
| 5 | Debt securities, including UoP | 5,729 | 145 | 18 | - | 0 | 0 | 0 | - | - | - | - | - | - | - | - | - | - | - | - | - | - | - | 145 | 18 | - | 0 | 0 | ||||
| 6 | Equity instruments | 355 | - | - | - | - | - | - | - | - | - | - | - | - | - | - | - | - | - | - | - | - | ||||||||||
| 7 | Other financial corporations | 30,839 | 102 | 5 | - | 0 | 3 | 0 | - | - | - | - | - | - | - | 0 | - | - | - | - | - | - | - | 102 | 5 | - | 0 | 3 | ||||
| 8 | of which investment firms | - | - | - | - | - | ||||||||||||||||||||||||||
| 9 | Loans and advances | - | - | - | - | - | ||||||||||||||||||||||||||
| 10 | Debt securities, including UoP | - | - | - | - | - | ||||||||||||||||||||||||||
| 11 | Equity instruments | - | - | - | - | |||||||||||||||||||||||||||
| 12 | of which management companies | - | - | - | - | - | ||||||||||||||||||||||||||
| 13 | Loans and advances | - | - | - | - | - | ||||||||||||||||||||||||||
| 14 | Debt securities, including UoP | - | - | - | - | - | ||||||||||||||||||||||||||
| 15 | Equity instruments | - | - | - | - | |||||||||||||||||||||||||||
| 16 | of which insurance undertakings | 0 | 0 | 0 | - | - | - | 0 | 0 | - | - | - | ||||||||||||||||||||
| 17 | Loans and advances | 0 | 0 | 0 | - | - | - | 0 | 0 | - | - | - | ||||||||||||||||||||
| 18 | Debt securities, including UoP | - | - | - | - | - | ||||||||||||||||||||||||||
| 19 | Equity instruments | - | - | - | - | |||||||||||||||||||||||||||
| 20 | Non-financial corporations (NFCs subject to NFRD disclosure obligations) | 3,955 | 958 | 450 | - | 16 | 143 | 284 | 1 | 86 | 11 | - | - | 20 | - | - | - | 1,349 | 461 | - | 16 | 143 | ||||||||||
| 21 | Loans and advances | 3,955 | 958 | 450 | - | 16 | 143 | 284 | 1 | 86 | 11 | - | - | 20 | - | - | - | 1,349 | 461 | - | 16 | 143 | ||||||||||
| 22 | Debt securities, including UoP | - | - | - | - | - | ||||||||||||||||||||||||||
| 23 | Equity instruments | - | - | - | - | - | ||||||||||||||||||||||||||
| 24 | Households | 205,572 | 194,638 | 23,744 | - | - | - | 194,638 | 23,744 | - | - | - | ||||||||||||||||||||
| 25 | of which loans collateralised by residential immovable property | 194,638 | 194,638 | 23,744 | - | - | - | 194,638 | 23,744 | - | - | - | ||||||||||||||||||||
| 26 | of which building renovation loans | - | - | - | - | - | ||||||||||||||||||||||||||
| 27 | of which motor vehicle loans | - | - | - | - | - | ||||||||||||||||||||||||||
| 28 | Local governments financing | 2,211 | - | - | - | - | - | - | - | - | - | - | - | - | - | - | ||||||||||||||||
| 29 | Housing financing | - | - | - | - | - | ||||||||||||||||||||||||||
| 30 | Other local government financing | 2,211 | - | - | - | - | - | - | - | - | - | - | - | - | - | - | - | |||||||||||||||
| 31 | Collateral obtained by taking possession: residential and commercial immovable properties | |||||||||||||||||||||||||||||||
| 32 | Other assets excluded from the numerator for GAR calculation (covered in the denominator) | 243,876 | ||||||||||||||||||||||||||||||
| 33 | Non-financial corporations | 228,550 | ||||||||||||||||||||||||||||||
| 34 | SMEs and NFCs (other than SMEs) not subject to NFRD disclosure obligations | 113,839 | ||||||||||||||||||||||||||||||
| 35 | Loans and advances | 113,307 | ||||||||||||||||||||||||||||||
| 36 | of which loans collateralised by commercial immovable property | 57,924 | ||||||||||||||||||||||||||||||
| 37 | of which building renovation loans | |||||||||||||||||||||||||||||||
| 38 | Debt securities | 271 | ||||||||||||||||||||||||||||||
| 39 | Equity instruments | 261 | ||||||||||||||||||||||||||||||
| 40 | Non-EU country counterparties not subject to NFRD disclosure obligations | 114,711 | ||||||||||||||||||||||||||||||
| 41 | Loans and advances | 114,355 | ||||||||||||||||||||||||||||||
| 42 | Debt securities | 174 | ||||||||||||||||||||||||||||||
| 43 | Equity instruments | 182 | ||||||||||||||||||||||||||||||
| 44 | Derivatives | 709 | ||||||||||||||||||||||||||||||
| 45 | On demand interbank loans | 995 | ||||||||||||||||||||||||||||||
| 46 | Cash and cash-related assets | 531 | ||||||||||||||||||||||||||||||
| 47 | Other assets (e.g. Goodwill, commodities etc.) | 13,091 | ||||||||||||||||||||||||||||||
| 48 | Total GAR assets | 519,657 | 196,043 | 24,231 | - | 18 | 148 | 285 | - | - | 0 | 1 | - | - | - | 86 | 11 | - | - | 20 | - | - | - | - | - | - | - | 196,435 | 24,242 | - | 18 | 148 |
| 49 | Other assets not covered for GAR calculation | 123,101 | ||||||||||||||||||||||||||||||
| 50 | Sovereigns | 14,298 | ||||||||||||||||||||||||||||||
| 51 | Central banks exposure | 84,343 | ||||||||||||||||||||||||||||||
| 52 | Trading book | 24,461 | ||||||||||||||||||||||||||||||
| 53 | Total assets | 642,758 | 196,043 | 24,231 | - | 18 | 148 | 285 | - | - | 0 | 1 | - | - | - | 86 | 11 | - | - | 20 | - | - | - | - | - | - | - | 196,435 | 24,242 | - | 18 | 148 |
| Off-balance sheet exposures - Corporates subject to NFRD disclosure obligations | ||||||||||||||||||||||||||||||||
| 54 | Financial guarantees | 508 | 6 | 3 | - | 0 | 0 | 0 | - | - | - | - | - | - | - | 1 | - | - | - | 0 | - | - | - | - | - | - | 7 | 3 | - | 0 | 0 | |
| 55 | Assets under management | 48,595 | 1,156 | 214 | - | 42 | 81 | 80 | 19 | - | - | 16 | 3 | - | - | 62 | 1 | - | - | 78 | 0 | - | - | 0 | - | - | - | 1,392 | 237 | - | 42 | 82 |
| 56 | Of which debt securities | 17,136 | 565 | 123 | - | 19 | 52 | 32 | 14 | - | - | 12 | 3 | - | - | 12 | 0 | - | - | 15 | 0 | - | - | 0 | - | - | - | 636 | 140 | - | 19 | 52 |
| 57 | Of which equity instruments | 28,980 | 591 | 91 | - | 23 | 29 | 48 | 5 | - | - | 4 | 0 | - | - | 51 | 1 | - | - | 62 | 0 | - | - | 0 | - | - | - | 756 | 97 | - | 23 | 30 |
| 2. GAR sector information - Turnover KPI | Disclosure reference date 31-12-2025 | |||||||||
|---|---|---|---|---|---|---|---|---|---|---|
| Breakdown by sector - NACE 4 digits level (code and label) (million EUR) | Total [Gross] carrying amount | Of which Taxonomy eligible | Of which Taxonomy aligned | Climate Change Mitigation (CCM) | Climate Change Adaptation (CCA) | Water and Marine Resources (WTR) | Circular Economy (CE) | Pollution (PPC) | Biodiversity and Ecosystems (BIO) | |
| 1 | 77.11 - Renting and leasing of cars and light motor vehicles | 351 | 70 | 5 | 5 | - | - | - | - | - |
| 2 | 93.13 - Fitness facilities | 254 | - | - | - | - | - | - | - | - |
| 3 | 68.2 - Renting and operating of own or leased real estate | 232 | 232 | 147 | 30 | 117 | - | - | - | - |
| 4 | 35.11 - Production of electricity | 198 | 66 | 58 | 56 | 1 | 0 | - | - | - |
| 5 | 10.71 - Manufacture of bread; manufacture of fresh pastry goods and cakes | 191 | - | - | - | - | - | - | - | - |
| 6 | 46.61 - Wholesale of agricultural machinery, equipment and supplies | 172 | 30 | 6 | 6 | - | - | - | - | - |
| 7 | 46.38 - Wholesale of other food, including fish, crustaceans and molluscs | 160 | - | - | - | - | - | - | - | - |
| 8 | 26.11 - Manufacture of electronic components | 120 | 7 | 6 | 6 | - | - | - | - | - |
| 9 | 9.1 - Support activities for petroleum and natural gas extraction | 119 | - | - | - | - | - | - | - | - |
| 10 | 46.31 - Wholesale of fruit and vegetables | 114 | - | - | - | - | - | - | - | - |
| 11 | Nuclear activities (footnote 1) | 8 | 6 | 6 | ||||||
| 12 | Fossil Gas activities (footnote 2) | 10 | 0 | 0 | ||||||
| 13 | Of Which non-assessed exposures (footnote 3) | |||||||||
| footnote 1 - referred to in Sections 4.26, 4,27, and 4.28 of Annexes I and II to Delegated Regulation 2021/2139 | ||||||||||
| footnote 2 - referred to in Sections 4.29, 4,30, and 4.31 of Annexes I and II to Delegated Regulation 2021/2139 | ||||||||||
| footnote 3 - in accordance with Article 7(8) of the amending delegated act | ||||||||||
| 2. GAR sector information - Capex KPI | ||||||||||
|---|---|---|---|---|---|---|---|---|---|---|
| Disclosure reference date 31-12-2025 | ||||||||||
| Breakdown by sector - NACE 4 digits level (code and label) (million EUR) | Total [Gross] carrying amount | Of which Taxonomy eligible | Of which Taxonomy aligned | Climate Change Mitigation (CCM) | Climate Change Adaptation (CCA) | Water and Marine Resources (WTR) | Circular Economy (CE) | Pollution (PPC) | Biodiversity and Ecosystems (BIO) | |
| 1 | 77.11 - Renting and leasing of cars and light motor vehicles | 351 | 72 | 6 | 6 | - | - | - | - | - |
| 2 | 93.13 - Fitness facilities | 254 | - | - | - | - | - | - | - | - |
| 3 | 68.2 - Renting and operating of own or leased real estate | 232 | 232 | 71 | 29 | 42 | - | - | - | - |
| 4 | 35.11 - Production of electricity | 198 | 95 | 91 | 90 | 1 | 0 | - | - | - |
| 5 | 10.71 - Manufacture of bread; manufacture of fresh pastry goods and cakes | 191 | 52 | - | - | - | - | - | - | - |
| 6 | 46.38 - Wholesale of other food, including fish, crustaceans and molluscs | 172 | 102 | 46 | 46 | - | - | - | - | - |
| 7 | 26.11 - Manufacture of electronic components | 160 | 71 | - | - | - | - | - | - | - |
| 8 | 9.1 - Support activities for petroleum and natural gas extraction | 120 | 14 | 6 | 6 | - | - | - | - | - |
| 9 | 46.31 - Wholesale of fruit and vegetables | 119 | 25 | - | - | - | - | - | - | - |
| 10 | 46.61 - Wholesale of other machinery, equipment and supplies | 114 | 7 | - | - | - | - | - | - | - |
| 11 | Nuclear activities (footnote 1) | 7 | 6 | 6 | ||||||
| 12 | Fossil Gas activities (footnote 2) | 67 | 66 | 0 | ||||||
| 13 | Of Which non-assessed exposures (footnote 3) | |||||||||
| footnote 1 - referred to in Sections 4.26, 4,27, and 4.28 of Annexes I and II to Delegated Regulation 2021/2139 | ||||||||||
| footnote 2 - referred to in Sections 4.29, 4,30, and 4.31 of Annexes I and II to Delegated Regulation 2021/2139 | ||||||||||
| footnote 3 - in accordance with Article 7(8) of the amending delegated act | ||||||||||
| 3. GAR KPI stock - Turnover KPI | Disclosure reference date 31-12-2025 | |||||||||||||
|---|---|---|---|---|---|---|---|---|---|---|---|---|---|---|
| Taxonomy Eligible | Taxonomy Aligned | Proportion of Taxonomy Aligned in Taxonomy Eligible | Non-assessed Exposures | |||||||||||
| Breakdown per environmental objective | of which use of proceeds | Of which Transitional | Of which Enabling | |||||||||||
| % (compared to total covered assets in the denominator) | Climate Change Mitigation (CCM) | Climate Change Adaptation (CCA) | Water and Marine Resources (WTR) | Circular Economy (CE) | Pollution (PPC) | Biodiversity and Ecosystems (BIO) | ||||||||
| 1 | GAR - Covered assets in both numerator and denominator | |||||||||||||
| 2 | Loans and advances, debt securities and equity instruments not HfT eligible for GAR calculation | 92% | 15% | 15% | 0% | 0% | 0% | 0% | 0% | 0% | 16% | |||
| 3 | Financial undertakings | 2% | 0% | 0% | 0% | 0% | 0% | 11% | ||||||
| 4 | Loans and advances | 2% | 0% | 0% | 0% | 0% | 0% | 11% | ||||||
| 5 | Debt securities, including UoP | 0% | 0% | 0% | 0% | 10% | ||||||||
| 6 | Equity instruments | 0% | 0% | 0% | 0% | 0% | 15% | |||||||
| 7 | Non-financial undertakings | 0% | 0% | 0% | 0% | 0% | 0% | 0% | 0% | 0% | 40% | |||
| 8 | Loans and advances | 0% | 0% | 0% | 0% | 0% | 0% | 0% | 40% | |||||
| 9 | Debt securities, including UoP | 0% | 0% | 0% | 0% | 42% | ||||||||
| 10 | Equity instruments | 0% | 0% | 0% | 0% | 32% | ||||||||
| 11 | Households | 90% | 15% | 15% | 16% | |||||||||
| 12 | of which loans collateralised by residential immovable property | 90% | 15% | 15% | 16% | |||||||||
| 13 | of which building renovation loans | |||||||||||||
| 14 | of which motor vehicle loans | |||||||||||||
| 15 | Local governments financing | 0% | 0% | |||||||||||
| 16 | Housing financing | |||||||||||||
| 17 | Other local government financing | 0% | 0% | |||||||||||
| 18 | Collateral obtained by taking possession: residential and commercial immovable properties | |||||||||||||
| 19 | Exposures included on a voluntary basis | |||||||||||||
| 20 | Total GAR assets | 92% | 15% | 15% | 0% | 0% | 0% | 0% | 0% | 0% | 0% | 0% | 68% | |
| 3. GAR KPI stock - Turnover KPI | Disclosure reference date 31-12-2024 | |||||||||||||||||||||||||||||||
|---|---|---|---|---|---|---|---|---|---|---|---|---|---|---|---|---|---|---|---|---|---|---|---|---|---|---|---|---|---|---|---|---|
| Climate Change Mitigation (CCM) | Climate Change Adaptation (CCA) | Water and marine resources (WMR) | Circular economy (CE) | Pollution (P) | Biodiversity and Ecosystems (BE) | TOTAL (CCM + CCA + WMR + CE + P + BE) | ||||||||||||||||||||||||||
| Proportion of total covered assets funding taxonomy relevant sectors (Taxonomy-eligible) | Proportion of total covered assets funding taxonomy relevant sectors (Taxonomy-eligible) | Proportion of total covered assets funding taxonomy relevant sectors (Taxonomy-eligible) | Proportion of total covered assets funding taxonomy relevant sectors (Taxonomy-eligible) | Proportion of total covered assets funding taxonomy relevant sectors (Taxonomy-eligible) | Proportion of total covered assets funding taxonomy relevant sectors (Taxonomy-eligible) | Proportion of total covered assets funding taxonomy relevant sectors (Taxonomy-eligible) | ||||||||||||||||||||||||||
| Proportion of total covered assets funding taxonomy relevant sectors (Taxonomy-aligned) | Proportion of total covered assets funding taxonomy relevant sectors (Taxonomy-aligned) | Proportion of total covered assets funding taxonomy relevant sectors (Taxonomy-aligned) | Proportion of total covered assets funding taxonomy relevant sectors (Taxonomy-aligned) | Proportion of total covered assets funding taxonomy relevant sectors (Taxonomy-aligned) | Proportion of total covered assets funding taxonomy relevant sectors (Taxonomy-aligned) | Proportion of total covered assets funding taxonomy relevant sectors (Taxonomy-aligned) | proportion of total assets covered | |||||||||||||||||||||||||
| % (compared to total covered assets in the denominator) | Of which specialised lending | Of which transitional | Of which enabling | Of which specialised lending | Of which enabling | Of which specialised lending | Of which enabling | Of which specialised lending | Of which enabling | Of which specialised lending | Of which enabling | Of which specialised lending | Of which enabling | Of which specialised lending | Of which transitional | Of which enabling | ||||||||||||||||
| 0 | GAR - Covered assets in both numerator and denominator | |||||||||||||||||||||||||||||||
| 1 | Loans and advances, debt securities and equity instruments not HfT eligible for GAR calculation | 71% | 9% | 0% | 0% | 0% | 0% | 0% | 0% | 0% | 0% | 0% | 0% | 71% | 9% | 0% | 0% | 0% | 43% | |||||||||||||
| 2 | Financial corporations | 1% | 0% | 0% | 0% | 0% | 0% | 0% | 1% | 0% | 0% | 0% | 0% | 10% | ||||||||||||||||||
| 3 | Credit institutions | 1% | 0% | 0% | 0% | 0% | 0% | 0% | 1% | 0% | 0% | 0% | 0% | 4% | ||||||||||||||||||
| 4 | Loans and advances | 1% | 0% | 0% | 0% | 0% | 0% | 0% | 1% | 0% | 0% | 0% | 0% | 4% | ||||||||||||||||||
| 5 | Debt securities, including UoP | 3% | 0% | 0% | 0% | 0% | 0% | 3% | 0% | 0% | 0% | 0% | 0% | |||||||||||||||||||
| 6 | Equity instruments | 0% | ||||||||||||||||||||||||||||||
| 7 | Other financial corporations | 0% | 0% | 0% | 0% | 0% | 0% | 0% | 0% | 0% | 5% | |||||||||||||||||||||
| 8 | of which investment firms | |||||||||||||||||||||||||||||||
| 9 | Loans and advances | |||||||||||||||||||||||||||||||
| 10 | Debt securities, including UoP | |||||||||||||||||||||||||||||||
| 11 | Equity instruments | |||||||||||||||||||||||||||||||
| 12 | of which management companies | |||||||||||||||||||||||||||||||
| 13 | Loans and advances | |||||||||||||||||||||||||||||||
| 14 | Debt securities, including UoP | |||||||||||||||||||||||||||||||
| 15 | Equity instruments | |||||||||||||||||||||||||||||||
| 16 | of which insurance undertakings | 0% | 0% | 0% | 0% | 0% | 0% | 0% | 0% | 0% | ||||||||||||||||||||||
| 17 | Loans and advances | 0% | 0% | 0% | 0% | 0% | 0% | 0% | 0% | 0% | ||||||||||||||||||||||
| 18 | Debt securities, including UoP | |||||||||||||||||||||||||||||||
| 19 | Equity instruments | |||||||||||||||||||||||||||||||
| 20 | Non-financial corporations (NFCs subject to NFRD disclosure obligations) | 13% | 4% | 0% | 2% | 6% | 0% | 1% | 0% | 0% | 0% | 20% | 4% | 0% | 2% | 1% | ||||||||||||||||
| 21 | Loans and advances | 13% | 4% | 0% | 2% | 6% | 0% | 1% | 0% | 0% | 0% | 20% | 4% | 0% | 2% | 1% | ||||||||||||||||
| 22 | Debt securities, including UoP | |||||||||||||||||||||||||||||||
| 23 | Equity instruments | |||||||||||||||||||||||||||||||
| 24 | Households | 95% | 12% | 95% | 12% | 33% | ||||||||||||||||||||||||||
| 25 | of which loans collateralised by residential immovable property | 100% | 12% | 100% | 12% | 31% | ||||||||||||||||||||||||||
| 26 | of which building renovation loans | |||||||||||||||||||||||||||||||
| 27 | of which motor vehicle loans | |||||||||||||||||||||||||||||||
| 28 | Local governments financing | 0% | ||||||||||||||||||||||||||||||
| 29 | Housing financing | |||||||||||||||||||||||||||||||
| 30 | Other local government financing | 0% | ||||||||||||||||||||||||||||||
| 31 | Collateral obtained by taking possession: residential and commercial immovable properties | |||||||||||||||||||||||||||||||
| 32 | Total GAR assets | 38% | 5% | 0% | 0% | 0% | 0% | 0% | 0% | 0% | 0% | 0% | 0% | 38% | 5% | 0% | 0% | 0% | 81% | |||||||||||||
| 3. GAR KPI stock - Capex KPI | Disclosure reference date 31-12-2025 | |||||||||||||
|---|---|---|---|---|---|---|---|---|---|---|---|---|---|---|
| Taxonomy Eligible | Taxonomy Aligned | Proportion of Taxonomy Aligned in Taxonomy Eligible | Non-assessed Exposures | |||||||||||
| Breakdown per environmental objective | of which use of proceeds | Of which Transitional | Of which Enabling | |||||||||||
| % (compared to total covered assets in the denominator) | Climate Change Mitigation (CCM) | Climate Change Adaptation (CCA) | Water and Marine Resources (WTR) | Circular Economy (CE) | Pollution (PPC) | Biodiversity and Ecosystems (BIO) | ||||||||
| 1 | GAR - Covered assets in both numerator and denominator | |||||||||||||
| 2 | Loans and advances, debt securities and equity instruments not HfT eligible for GAR calculation | 92% | 15% | 15% | 0% | 0% | 0% | 0% | 0% | 0% | 16% | |||
| 3 | Financial undertakings | 2% | 0% | 0% | 0% | 0% | 0% | 12% | ||||||
| 4 | Loans and advances | 2% | 0% | 0% | 0% | 0% | 0% | 12% | ||||||
| 5 | Debt securities, including UoP | 0% | 0% | 0% | 0% | 10% | ||||||||
| 6 | Equity instruments | |||||||||||||
| 7 | Non-financial undertakings | 0% | 0% | 0% | 0% | 0% | 0% | 0% | 0% | 0% | 40% | |||
| 8 | Loans and advances | 0% | 0% | 0% | 0% | 0% | 0% | 0% | 0% | 0% | 40% | |||
| 9 | Debt securities, including UoP | 0% | 0% | 0% | 0% | 0% | 42% | |||||||
| 10 | Equity instruments | 0% | 0% | 0% | 0% | 0% | 0% | 32% | ||||||
| 11 | Households | 90% | 15% | 15% | 16% | |||||||||
| 12 | of which loans collateralised by residential immovable property | 90% | 15% | 15% | 16% | |||||||||
| 13 | of which building renovation loans | |||||||||||||
| 14 | of which motor vehicle loans | |||||||||||||
| 15 | Local governments financing | 0% | 0% | |||||||||||
| 16 | Housing financing | |||||||||||||
| 17 | Other local government financing | 0% | 0% | |||||||||||
| 18 | Collateral obtained by taking possession: residential and commercial immovable properties | |||||||||||||
| 19 | Exposures included on a voluntary basis | |||||||||||||
| 20 | Total GAR assets | 92% | 15% | 15% | 0% | 0% | 0% | 0% | 0% | 0% | 0% | 0% | 16% | |
| 3. GAR KPI stock - CAPEX KPI | Disclosure reference date 31-12-2024 | |||||||||||||||||||||||||||||||
|---|---|---|---|---|---|---|---|---|---|---|---|---|---|---|---|---|---|---|---|---|---|---|---|---|---|---|---|---|---|---|---|---|
| Climate Change Mitigation (CCM) | Climate Change Adaptation (CCA) | Water and marine resources (WMR) | Circular economy (CE) | Pollution (P) | Biodiversity and Ecosystems (BE) | TOTAL (CCM + CCA + WMR + CE + P + BE) | ||||||||||||||||||||||||||
| Proportion of total covered assets funding taxonomy relevant sectors (Taxonomy-eligible) | Proportion of total covered assets funding taxonomy relevant sectors (Taxonomy-eligible) | Proportion of total covered assets funding taxonomy relevant sectors (Taxonomy-eligible) | Proportion of total covered assets funding taxonomy relevant sectors (Taxonomy-eligible) | Proportion of total covered assets funding taxonomy relevant sectors (Taxonomy-eligible) | Proportion of total covered assets funding taxonomy relevant sectors (Taxonomy-eligible) | Proportion of total covered assets funding taxonomy relevant sectors (Taxonomy-eligible) | ||||||||||||||||||||||||||
| Proportion of total covered assets funding taxonomy relevant sectors (Taxonomy-aligned) | Proportion of total covered assets funding taxonomy relevant sectors (Taxonomy-aligned) | Proportion of total covered assets funding taxonomy relevant sectors (Taxonomy-aligned) | Proportion of total covered assets funding taxonomy relevant sectors (Taxonomy-aligned) | Proportion of total covered assets funding taxonomy relevant sectors (Taxonomy-aligned) | Proportion of total covered assets funding taxonomy relevant sectors (Taxonomy-aligned) | Proportion of total covered assets funding taxonomy relevant sectors (Taxonomy-aligned) | proportion of total assets covered | |||||||||||||||||||||||||
| % (compared to total covered assets in the denominator) | Of which specialised lending | Of which transitional | Of which enabling | Of which specialised lending | Of which enabling | Of which specialised lending | Of which enabling | Of which specialised lending | Of which enabling | Of which specialised lending | Of which enabling | Of which specialised lending | Of which enabling | Of which specialised lending | Of which transitional | Of which enabling | ||||||||||||||||
| 0 | GAR - Covered assets in both numerator and denominator | |||||||||||||||||||||||||||||||
| 1 | Loans and advances, debt securities and equity instruments not HfT eligible for GAR calculation | 71% | 9% | 0% | 0% | 0% | 0% | 0% | 0% | 0% | 0% | 71% | 9% | 0% | 0% | 43% | ||||||||||||||||
| 2 | Financial corporations | 1% | 0% | 0% | 0% | 0% | 0% | 0% | 1% | 0% | 0% | 0% | 10% | |||||||||||||||||||
| 3 | Credit institutions | 1% | 0% | 0% | 0% | 0% | 0% | 1% | 0% | 0% | 0% | 5% | ||||||||||||||||||||
| 4 | Loans and advances | 1% | 0% | 0% | 0% | 0% | 0% | 1% | 0% | 0% | 0% | 4% | ||||||||||||||||||||
| 5 | Debt securities, including UoP | 3% | 0% | 0% | 0% | 0% | 3% | 0% | 0% | 0% | 1% | |||||||||||||||||||||
| 6 | Equity instruments | 0% | ||||||||||||||||||||||||||||||
| 7 | Other financial corporations | 0% | 0% | 0% | 0% | 0% | 0% | 0% | 0% | 0% | 0% | 5% | ||||||||||||||||||||
| 8 | of which investment firms | |||||||||||||||||||||||||||||||
| 9 | Loans and advances | |||||||||||||||||||||||||||||||
| 10 | Debt securities, including UoP | |||||||||||||||||||||||||||||||
| 11 | Equity instruments | |||||||||||||||||||||||||||||||
| 12 | of which management companies | |||||||||||||||||||||||||||||||
| 13 | Loans and advances | |||||||||||||||||||||||||||||||
| 14 | Debt securities, including UoP | |||||||||||||||||||||||||||||||
| 15 | Equity instruments | |||||||||||||||||||||||||||||||
| 16 | of which insurance undertakings | 0% | 0% | 0% | 0% | 0% | ||||||||||||||||||||||||||
| 17 | Loans and advances | 0% | 0% | 0% | 0% | 0% | ||||||||||||||||||||||||||
| 18 | Debt securities, including UoP | |||||||||||||||||||||||||||||||
| 19 | Equity instruments | |||||||||||||||||||||||||||||||
| 20 | Non-financial corporations (NFCs subject to NFRD disclosure obligations) | 24% | 11% | 0% | 4% | 7% | 0% | 2% | 0% | 1% | 34% | 12% | 0% | 4% | 1% | |||||||||||||||||
| 21 | Loans and advances | 24% | 11% | 0% | 4% | 7% | 0% | 2% | 0% | 1% | 34% | 12% | 0% | 4% | 1% | |||||||||||||||||
| 22 | Debt securities, including UoP | |||||||||||||||||||||||||||||||
| 23 | Equity instruments | |||||||||||||||||||||||||||||||
| 24 | Households | 95% | 12% | 95% | 12% | 32% | ||||||||||||||||||||||||||
| 25 | of which loans collateralised by residential immovable property | 100% | 12% | 100% | 12% | 30% | ||||||||||||||||||||||||||
| 26 | of which building renovation loans | |||||||||||||||||||||||||||||||
| 27 | of which motor vehicle loans | |||||||||||||||||||||||||||||||
| 28 | Local governments financing | 0% | ||||||||||||||||||||||||||||||
| 29 | Housing financing | |||||||||||||||||||||||||||||||
| 30 | Other local government financing | 0% | ||||||||||||||||||||||||||||||
| 31 | Collateral obtained by taking possession: residential and commercial immovable properties | |||||||||||||||||||||||||||||||
| 32 | Total GAR assets | 38% | 5% | 0% | 0% | 0% | 0% | 0% | 0% | 0% | 0% | 38% | 5% | 0% | 0% | 81% | ||||||||||||||||
| 4. GAR KPI Flow - Turnover KPI | Disclosure reference date 31-12-2025 | |||||||||||||
|---|---|---|---|---|---|---|---|---|---|---|---|---|---|---|
| Taxonomy Eligible | Taxonomy Aligned | Proportion of Taxonomy Aligned in Taxonomy Eligible | Non-assessed Exposures | |||||||||||
| Breakdown per environmental objective | of which use of proceeds | Of which Transitional | Of which Enabling | |||||||||||
| % (compared to total covered assets in the denominator) | Climate Change Mitigation (CCM) | Climate Change Adaptation (CCA) | Water and Marine Resources (WTR) | Circular Economy (CE) | Pollution (PPC) | Biodiversity and Ecosystems (BIO) | ||||||||
| 1 | GAR - Covered assets in both numerator and denominator | |||||||||||||
| 2 | Loans and advances, debt securities and equity instruments not HfT eligible for GAR calculation | 67% | 14% | 14% | 0% | 0% | 0% | 20% | ||||||
| 3 | Financial undertakings | 29% | 3% | 3% | 0% | 0% | 0% | 11% | ||||||
| 4 | Loans and advances | 29% | 3% | 3% | 0% | 0% | 0% | 11% | ||||||
| 5 | Debt securities, including UoP | |||||||||||||
| 6 | Equity instruments | |||||||||||||
| 7 | Non-financial undertakings | 24% | 5% | 5% | 0% | 0% | 2% | 23% | ||||||
| 8 | Loans and advances | 24% | 5% | 5% | 0% | 0% | 2% | 23% | ||||||
| 9 | Debt securities, including UoP | |||||||||||||
| 10 | Equity instruments | |||||||||||||
| 11 | Households | 91% | 20% | 20% | 22% | |||||||||
| 12 | of which loans collateralised by residential immovable property | 100% | 22% | 22% | 22% | |||||||||
| 13 | of which building renovation loans | |||||||||||||
| 14 | of which motor vehicle loans | |||||||||||||
| 15 | Local governments financing | |||||||||||||
| 16 | Housing financing | |||||||||||||
| 17 | Other local government financing | |||||||||||||
| 18 | Collateral obtained by taking possession: residential and commercial immovable properties | |||||||||||||
| 19 | Exposures included on a voluntary basis | |||||||||||||
| 20 | Total GAR assets | 67% | 14% | 14% | 0% | 0% | 0% | 20% | ||||||
| 4. GAR KPI Flow - Capex KPI | Disclosure reference date 31-12-2025 | |||||||||||||
|---|---|---|---|---|---|---|---|---|---|---|---|---|---|---|
| Taxonomy Eligible | Taxonomy Aligned | Proportion of Taxonomy Aligned in Taxonomy Eligible | Non-assessed Exposures | |||||||||||
| Breakdown per environmental objective | of which use of proceeds | Of which Transitional | Of which Enabling | |||||||||||
| % (compared to total covered assets in the denominator) | Climate Change Mitigation (CCM) | Climate Change Adaptation (CCA) | Water and Marine Resources (WTR) | Circular Economy (CE) | Pollution (PPC) | Biodiversity and Ecosystems (BIO) | ||||||||
| 1 | GAR - Covered assets in both numerator and denominator | |||||||||||||
| 2 | Loans and advances, debt securities and equity instruments not HfT eligible for GAR calculation | 68% | 14% | 14% | 0% | 0% | 0% | 21% | ||||||
| 3 | Financial undertakings | 29% | 3% | 3% | 0% | 0% | 0% | 12% | ||||||
| 4 | Loans and advances | 29% | 3% | 3% | 0% | 0% | 0% | 12% | ||||||
| 5 | Debt securities, including UoP | 0% | ||||||||||||
| 6 | Equity instruments | 0% | ||||||||||||
| 7 | Non-financial undertakings | 55% | 31% | 31% | 0% | 0% | 3% | 55% | ||||||
| 8 | Loans and advances | 55% | 31% | 31% | 0% | 0% | 3% | 55% | ||||||
| 9 | Debt securities, including UoP | 0% | ||||||||||||
| 10 | Equity instruments | 0% | ||||||||||||
| 11 | Households | 91% | 20% | 20% | 22% | |||||||||
| 12 | of which loans collateralised by residential immovable property | 100% | 22% | 22% | 22% | |||||||||
| 13 | of which building renovation loans | 0% | ||||||||||||
| 14 | of which motor vehicle loans | 0% | ||||||||||||
| 15 | Local governments financing | |||||||||||||
| 16 | Housing financing | 0% | ||||||||||||
| 17 | Other local government financing | |||||||||||||
| 18 | Collateral obtained by taking possession: residential and commercial immovable properties | 0% | ||||||||||||
| 19 | Exposures included on a voluntary basis | 0% | ||||||||||||
| 20 | Total GAR assets | 68% | 14% | 14% | 0% | 0% | 0% | 0% | 0% | 0% | 0% | 0% | 14% | |
Appendix 4: TNFD Reference Table
In the 2025 Annual Report, we disclose in alignment with ESRS. As we are a Taskforce on Nature-related Financial Disclosures (TNFD) taskforce member, we aim to ensure that we also align our reporting efforts with TNFD's disclosure recommendations. In the below reference table have included TNFD's main disclosure categories and reference to where in the 2025 Annual Report (or in other publications such as the Nature Vision and Approach) we address these disclosure recommendations.
| Governance | A | Describe the Board’s oversight of nature-related risks and opportunities |
|
| |
| B | Describe management’s role in assessing and managing nature-related risks and opportunities |
| |||
| C | Describe the organization’s human rights policies and engagement activities, and oversight by the board and management, with respect to indigenous Peoples, Local Communities, and other stakeholders, in the organization’s assessment of, and response to, nature-related dependencies, impacts, risks, and opportunities. |
|
| ||
| Strategy | A | Describe the nature-related dependencies, impacts, risks and opportunities the organization has identified over the short, medium and long term. |
| With regards to opportunities, these are not fully quantified for each subtopic of Nature. | |
| B | Describe the effect nature-related dependencies, impacts, risks and opportunities have had on the organization’s business model, value chain, strategy and financial planning, as well as any transition plans or analysis in place. |
| We are increasingly including nature-related DIRO in our business processes. We will continue to further develop our insights into the effects on i.e. financial planning. | ||
| C | Describe the resilience of the organization’s strategy to nature-related risks and opportunities, taking into consideration different scenarios. |
| |||
| D | Disclose the locations of assets and/or activities in the organization’s direct operations and, where possible, upstream and downstream value chain(s) that meet the criteria for priority locations. |
| Assets and/or activities currently not disclosed. We will continue to further develop and detail our insights into priority sectors and regions. | ||
| Risk and Impact Management | A (I) | Describe the organization’s processes for identifying, assessing and prioritizing nature-related dependencies, impacts, risks and opportunities in its direct operations. | We know our own operations have limited impact and dependency on nature. Therefore our current main focus is on our financed activities. | ||
| A (II) | Describe the organization’s processes for identifying, assessing and prioritizing nature-related dependencies, impacts, risks and opportunities in its upstream and downstream value chain(s) | ||||
| B | Describe the organization’s processes for monitoring nature-related dependencies, impacts, risks and opportunities. | The double materiality process is yearly recurring. | |||
| C | Describe how processes for identifying, assessing, prioritising and monitoring nature-related risks are integrated into and inform the organization’s overall risk management processes. |
| Rabobank Nature Vision and Approach page 11 | ||
| Metrics and Targets | A | Disclose the metrics used by the organization to assess and manage material nature-related risks and opportunities in line with its strategy and risk management process. | Core metrics for financial institutions not disclosed. | ||
| B | Disclose the metrics used by the organization to assess and manage dependencies and impacts on nature. | Core metrics for financial institutions not disclosed. | |||
| C | Describe the targets and goals used by the organization to manage nature-related dependencies, impacts, risks and opportunities and its performance against these. | We have set and disclosed nature effort targets; we have not yet set outcome targets on the topics of land use, water, and pollution. |
Appendix 5: Datapoints that derive from other EU legislation
| Disclosure Requirement and related datapoint | SFDR reference | Pillar 3 reference | Benchmark Regulation reference | EU Climate Law reference | Section |
|---|---|---|---|---|---|
| ESRS 2 GOV-1 Board's gender diversity paragraph 21 (d) | Indicator number 13 of Table #1 of Annex 1 | Commission Delegated Regulation (EU) 2020/1816 (5), Annex II | The Role of the Managing Board and Supervisory Board | ||
| ESRS 2 GOV-1 Percentage of board members who are independent paragraph 21 (e) | Delegated Regulation (EU) 2020/1816, Annex II | The Role of the Managing Board and Supervisory Board | |||
| ESRS 2 GOV-4 Statement on due diligence paragraph 30 | Indicator number 10 Table #3 of Annex 1 | Statement on Due Diligence | |||
| ESRS 2 SBM-1 Involvement in activities related to fossil fuel activities paragraph 40 (d) i | Indicators number 4 Table #1 of Annex 1 | Article 449a Regulation (EU) No 575/2013; Commission Implementing Regulation (EU) 2022/2453 (6) Table 1: Qualitative information on Environmental risk and Table 2: Qualitative information on Social risk | Delegated Regulation (EU) 2020/1816, Annex II | Not material | |
| ESRS 2 SBM-1 Involvement in activities related to chemical production paragraph 40 (d) ii | Indicator number 9 Table #2 of Annex 1 | Delegated Regulation (EU) 2020/1816, Annex II | Not material | ||
| ESRS 2 SBM-1 Involvement in activities related to controversial weapons paragraph 40 (d) iii | Indicator number 14 Table #1 of Annex 1 | Delegated Regulation (EU) 2020/1818 (7), Article 12(1) Delegated Regulation (EU) 2020/1816, Annex II | Not material | ||
| ESRS 2 SBM-1 Involvement in activities related to cultivation and production of tobacco paragraph 40 (d) iv | Delegated Regulation (EU) 2020/1818, Article 12(1) Delegated Regulation (EU) 2020/1816, Annex II | Not material | |||
| ESRS E1-1 Transition plan to reach climate neutrality by 2050 paragraph 14 | Regulation (EU) 2021/1119, Article 2(1) | Transition plan for climate change mitigation | |||
| ESRS E1-1 Undertakings excluded from Paris-aligned Benchmarks paragraph 16 (g) | Article 449a Regulation (EU) No 575/2013; Commission Implementing Regulation (EU) 2022/2453 Template 1: Banking book-Climate Change transition risk: Credit quality of exposures by sector, emissions and residual maturity | Delegated Regulation (EU) 2020/1818, Article12.1 (d) to (g), and Article 12.2 | Transition plan for climate change mitigation | ||
| ESRS E1-4 GHG emission reduction targets paragraph 34 | Indicator number 4 Table #2 of Annex 1 | Article 449a Regulation (EU) No 575/2013; Commission Implementing Regulation (EU) 2022/2453 Template 3: Banking book – Climate change transition risk: alignment metrics | Delegated Regulation (EU) 2020/1818, Article 6 | Targets related to climate change mitigation | |
| ESRS E1-5 Energy consumption from fossil sources disaggregated by sources (only high climate impact sectors) paragraph 38 | Indicator number 5 Table #1 and Indicator n. 5 Table #2 of Annex 1 | Not material | |||
| ESRS E1-5 Energy consumption and mix paragraph 37 | Indicator number 5 Table #1 of Annex 1 | Not material | |||
| ESRS E1-5 Energy intensity associated with activities in high climate impact sectors paragraphs 40 to 43 | Indicator number 6 Table #1 of Annex 1 | Not material | |||
| ESRS E1-6 Gross Scope 1, 2, 3 and Total GHG emissions paragraph 44 | Indicators number 1 and 2 Table #1 of Annex 1 | Article 449a; Regulation (EU) No 575/2013; Commission Implementing Regulation (EU) 2022/2453 Template 1: Banking book – Climate change transition risk: Credit quality of exposures by sector, emissions and residual maturity | Delegated Regulation (EU) 2020/1818, Article 5(1), 6 and 8(1) | Scope 1 and 2: Not materialScope 3: Gross GHG emissions | |
| ESRS E1-6 Gross GHG emissions intensity paragraphs 53 to 55 | Indicators number 3 Table #1 of Annex 1 | Article 449a Regulation (EU) No 575/2013; Commission Implementing Regulation (EU) 2022/2453 Template 3: Banking book – Climate change transition risk: alignment metrics | Delegated Regulation (EU) 2020/1818, Article 8(1) | Scope 1 and 2: Not materialScope 3: Gross GHG emissions | |
| ESRS E1-7 GHG removals and carbon credits paragraph 56 | Regulation (EU) 2021/1119, Article 2(1) | Not material | |||
| ESRS E1-9 Exposure of the benchmark portfolio to climate-related physical risks paragraph 66 | Delegated Regulation (EU) 2020/1818, Annex II Delegated Regulation (EU) 2020/1816, Annex II | Anticipated financial effects from material physical and transition risks and potential climate-related opportunities | |||
| ESRS E1-9 Disaggregation of monetary amounts by acute and chronic physical risk paragraph 66 (a) ESRS E1-9 Location of significant assets at material physical risk paragraph 66 (c). | Article 449a Regulation (EU) No 575/2013; Commission Implementing Regulation (EU) 2022/2453 paragraphs 46 and 47; Template 5: Banking book - Climate change physical risk: Exposures subject to physical risk. | Anticipated financial effects from material physical and transition risks and potential climate-related opportunities | |||
| ESRS E1-9 Breakdown of the carrying value of its real estate assets by energy-efficiency classes paragraph 67 (c). | Article 449a Regulation (EU) No 575/2013; Commission Implementing Regulation (EU) 2022/2453 paragraph 34; Template 2:Banking book -Climate change transition risk: Loans collateralised by immovable property - Energy efficiency of the collateral | Anticipated financial effects from material physical and transition risks and potential climate-related opportunities | |||
| ESRS E1-9 Degree of exposure of the portfolio to climate- related opportunities paragraph 69 | Delegated Regulation (EU) 2020/1818, Annex II | Anticipated financial effects from material physical and transition risks and potential climate-related opportunities | |||
| ESRS E2-4 Amount of each pollutant listed in Annex II of the E-PRTR Regulation (European Pollutant Release and Transfer Register) emitted to air, water and soil, paragraph 28 | Indicator number 8 Table #1 of Annex 1 Indicator number 2 Table #2 of Annex 1 Indicator number 1 Table #2 of Annex 1 Indicator number 3 Table #2 of Annex 1 | Not material | |||
| ESRS E3-1 Water and marine resources paragraph 9 | Indicator number 7 Table #2 of Annex 1 | Not material | |||
| ESRS E3-1 Dedicated policy paragraph 13 | Indicator number 8 Table 2 of Annex 1 | Not material | |||
| ESRS E3-1 Sustainable oceans and seas paragraph 14 | Indicator number 12 Table #2 of Annex 1 | Not material | |||
| ESRS E3-4 Total water recycled and reused paragraph 28 (c) | Indicator number 6.2 Table #2 of Annex 1 | Not material | |||
| ESRS E3-4 Total water consumption in m3 per net revenue on own operations paragraph 29 | Indicator number 6.1 Table #2 of Annex 1 | Not material | |||
| ESRS 2- IRO 1 - E4 paragraph 16 (a) i | Indicator number 7 Table #1 of Annex 1 | Not material | |||
| ESRS 2- IRO 1 - E4 paragraph 16 (b) | Indicator number 10 Table #2 of Annex 1 | Not material | |||
| ESRS 2- IRO 1 - E4 paragraph 16 (c) | Indicator number 14 Table #2 of Annex 1 | Not material | |||
| ESRS E4-2 Sustainable land / agriculture practices or policies paragraph 24 (b) | Indicator number 11 Table #2 of Annex 1 | Policies related to land use | |||
| ESRS E4-2 Sustainable oceans / seas practices or policies paragraph 24 (c) | Indicator number 12 Table #2 of Annex 1 | Not material | |||
| ESRS E4-2 Policies to address deforestation paragraph 24 (d) | Indicator number 15 Table #2 of Annex 1 | Policies related to land use | |||
| ESRS E5-5 Non-recycled waste paragraph 37 (d) | Indicator number 13 Table #2 of Annex 1 | Not material | |||
| ESRS E5-5 Hazardous waste and radioactive waste paragraph 39 | Indicator number 9 Table #1 of Annex 1 | Not material | |||
| ESRS 2- SBM3 - S1 Risk of incidents of forced labour paragraph 14 (f) | Indicator number 13 Table #3 of Annex I | Not material | |||
| ESRS 2- SBM3 - S1 Risk of incidents of child labour paragraph 14 (g) | Indicator number 12 Table #3 of Annex I | Not material | |||
| ESRS S1-1 Human rights policy commitments paragraph 20 | Indicator number 9 Table #3 and Indicator number 11 Table #1 of Annex I | Not material | |||
| ESRS S1-1 Due diligence policies on issues addressed by the fundamental International Labor Organisation Conventions 1 to 8, paragraph 21 | Delegated Regulation (EU) 2020/1816, Annex II | Not material | |||
| ESRS S1-1 processes and measures for preventing trafficking in human beings paragraph 22 | Indicator number 11 Table #3 of Annex I | Not material | |||
| ESRS S1-1 workplace accident prevention policy or management system paragraph 23 | Indicator number 1 Table #3 of Annex I | Not material | |||
| ESRS S1-3 grievance/complaints handling mechanisms paragraph 32 (c) | Indicator number 5 Table #3 of Annex I | Not material | |||
| ESRS S1-14 Number of fatalities and number and rate of work- related accidents paragraph 88 (b) and (c) | Indicator number 2 Table #3 of Annex I | Delegated Regulation (EU) 2020/1816, Annex II | Not material | ||
| ESRS S1-14 Number of days lost to injuries, accidents, fatalities or illness paragraph 88 (e) | Indicator number 3 Table #3 of Annex I | Not material | |||
| ESRS S1-16 Unadjusted gender pay gap paragraph 97 (a) | Indicator number 12 Table #1 of Annex I | Delegated Regulation (EU) 2020/1816, Annex II | Compensation metrics | ||
| ESRS S1-16 Excessive CEO pay ratio paragraph 97 (b) | Indicator number 8 Table #3 of Annex I | Compensation metrics | |||
| ESRS S1-17 Incidents of discrimination paragraph 103 (a) | Indicator number 7 Table #3 of Annex I | Employee voice of Processes for engaging with our own workforce and workers' representatives about impacts | |||
| ESRS S1-17 Non-respect of UNGPs on Business and Human Rights and OECD paragraph 104 (a) | Indicator number 10 Table #1 and Indicator n. 14 Table #3 of Annex I | Delegated Regulation (EU) 2020/1816, Annex II Delegated Regulation (EU) 2020/1818 Art 12 (1) | Employee voice of Processes for engaging with our own workforce and workers' representatives about impacts | ||
| ESRS 2- SBM3 – S2 Significant risk of child labour or forced labour in the value chain paragraph 11 (b) | Indicators number 12 and n. 13 Table #3 of Annex I | Workers in the value chain and affected communities - Material impacts, risks and opportunities and their interaction with our strategy and business model | |||
| ESRS S2-1 Human rights policy commitments paragraph 17 | Indicator number 9 Table #3 and Indicator n. 11 Table #1 of Annex 1 | Policies related to value chain workers and affected communities | |||
| ESRS S2-1 Policies related to value chain workers paragraph 18 | Indicator number 11 and n. 4 Table #3 of Annex 1 | Policies related to value chain workers and affected communities | |||
| ESRS S2-1Non-respect of UNGPs on Business and Human Rights principles and OECD guidelines paragraph 19 | Indicator number 10 Table #1 of Annex 1 | Delegated Regulation (EU) 2020/1816, Annex II Delegated Regulation (EU) 2020/1818, Art 12 (1) | Policies related to value chain workers and affected communities | ||
| ESRS S2-1 Due diligence policies on issues addressed by the fundamental International Labor Organisation Conventions 1 to 8, paragraph 19 | Delegated Regulation (EU) 2020/1816, Annex II | Policies related to value chain workers and affected communities | |||
| ESRS S2-4 Human rights issues and incidents connected to its upstream and downstream value chain paragraph 36 | Indicator number 14 Table #3 of Annex 1 | Policies related to value chain workers and affected communities | |||
| ESRS S3-1 Human rights policy commitments paragraph 16 | Indicator number 9 Table #3 of Annex 1 and Indicator number 11 Table #1 of Annex 1 | Policies related to value chain workers and affected communities | |||
| ESRS S3-1 non-respect of UNGPs on Business and Human Rights, ILO principles or and OECD guidelines paragraph 17 | Indicator number 10 Table #1 Annex 1 | Delegated Regulation (EU) 2020/1816, Annex II Delegated Regulation (EU) 2020/1818, Art 12 (1) | Policies related to value chain workers and affected communities | ||
| ESRS S3-4 Human rights issues and incidents paragraph 36 | Indicator number 14 Table #3 of Annex 1 | Policies related to value chain workers and affected communities | |||
| ESRS S4-1 Policies related to consumers and end-users paragraph 16 | Indicator number 9 Table #3 and Indicator number 11 Table #1 of Annex 1 | Policies related to Consumers and End-users | |||
| ESRS S4-1 Non-respect of UNGPs on Business and Human Rights and OECD guidelines paragraph 17 | Indicator number 10 Table #1 of Annex 1 | Delegated Regulation (EU) 2020/1816, Annex II Delegated Regulation (EU) 2020/1818, Art 12 (1) | Policies related to Consumers and End-users | ||
| ESRS S4-4 Human rights issues and incidents paragraph 35 | Indicator number 14 Table #3 of Annex 1 | Consumers and end-users - Taking action on material impacts on consumers and end-users, and approaches to managing material risks related to consumers and end-users, and effectiveness of those actions | |||
| ESRS G1-1 United Nations Convention against Corruption paragraph 10 (b) | Indicator number 15 Table #3 of Annex 1 | Financial Economic Crime policies and corporate culture | |||
| ESRS G1-1 Protection of whistle- blowers paragraph 10 (d) | Indicator number 6 Table #3 of Annex 1 | Prevention and Detection of Financial Economic Crime Employee voice | |||
| ESRS G1-4 Fines for violation of anti- corruption and anti-bribery laws paragraph 24 (a) | Indicator number 17 Table #3 of Annex 1 | Delegated Regulation (EU) 2020/1816, Annex II) | Incidents of corruption or bribery | ||
| ESRS G1-4 Standards of anti- corruption and anti- bribery paragraph 24 (b) | Indicator number 16 Table #3 of Annex 1 | Incidents of corruption or bribery |
Appendix 6: Methodology Financed Emissions
Methodology Financed Emissions
In this appendix, we discuss the methodology used to estimate Rabobank’s Scope 3, Category 15 and 13 (for DLL) financed emissions as shown in the chapter: ‘Climate Change Mitigation and Adaptation’ of the Sustainability Statement. Additionally, we reflect on the results for the different parts of the portfolio and, where possible, the drivers behind the developments compared to last year’s estimates.
There are different ways to estimate and disclose financed emissions. In Rabobank we use the PCAF standard for accounting and disclosing financed emissions. Consequently, we use PCAF's Data Quality Scores (score 1-5) to qualify the level of precision of the estimates we disclose per PCAF asset class. Data quality scores are specific to each asset class. Data with PCAF scores 1/2 , company-level reported emissions data, represent the highest data quality and results in the most accurate emissions estimates. This is followed by physical activity-based emissions (PCAF score 3), and PCAF scores 4/5, given for an economic activity-based emissions approach. We strive to include the best data quality score based on data availability and feasibility.
To determine the financed emissions of our portfolio, we used a combination of internal and external information that is spread over multiple sources and categorized and reported in a variety of formats. We used reliable "bottom-up", i.e. client reported or so called primary GHG emissions data, for 13% of the portfolio at this stage, which means that for an estimated 87% of our portfolio we used so called "top-down" (secondary data) in line with PCAF recommendations. In the following paragraphs, we outline the proxies and data sources we used for our calculations.
Data and methodologies continuously change, improve and mature. Improved estimates or revised calculations may result in materially different outcomes. As we improve our calculations and methodologies, we will address changes in outcomes in future reports. We have calculated the financed emissions for 98% of eligible assets, for the assets where methodologies and data were available. We base our scoping on the consolidated balance sheet of Rabobank, including its subsidiaries. In this report, we use our balance sheet assets of 31 December 2024 to determine the Rabobank’s financing portion of the client’s emissions. Where methodology requires a usage of data from client financial statements, we use 2024 client related information when available. Additionally, PCAF requires to disclose the Scope 3 emissions of our customers as well. These estimated Scope 3 emissions are included in the section Gross GHG Emissions of the Sustainability Statements.
Loans to Private individuals
Methodology
Rabobank calculated the emissions of its Dutch residential real estate portfolio using the PCAF standard for mortgages. To attribute building emissions to the related mortgage loans, Rabobank used the outstanding amounts and (most recently recorded) current property value to determine the share of the value of the property financed by a Rabobank mortgage.
Energy consumption at the building level was estimated based on CBS-data (on gas and electricity usage based on building type and energy label), BAG data with building characteristics such as floor areas and construction years, the building type based on an internal model that uses BAG polygons, and data on energy labels obtained from external data provider Calcasa. Emission factors from CBS and RVO for electricity and natural gas respectively were applied to calculate the emissions of the estimated energy usage. This methodology was co-developed with other members within the PCAF NL working group Mortgages. Uncertainties remain concerning district heating emissions as well as challenges in linking the external datasets with Rabobank’s internal data. An updated calculation methodology that aligns more with CRREM was received just prior to closing the annual report, but given the limited time available, it was not possible to include it.
For mortgages, the score is dependent on the nature of the energy label for the underlying building. If the label is definitive, the data quality score is 3. If the label is provisional or estimated, it has been classified as PCAF data quality score 4 by the PCAF Mortgages Working group NL. Rabobank follows this classification.
Limitations
A data quality score of 3 or 4, as described above, means that emissions for a building are estimated based on its floor area, building type, and energy label as proxies. This method of estimation has the inherent limitation that it does not use actual metered building energy consumption to determine the emissions, increasing estimate uncertainty.
Dutch Business Customers
For Dutch Business Customers Rabobank estimated the financed emissions using the PCAF standard for business loans and unlisted equity. Rabobank performed an estimate on its customers’ scope 1, 2 and 3 emissions. For the scope 1 and 2 data, it used sector emissions data of 2023 (last year estimates were based on 2022 data). For the scope 3 emissions, no data update from EXIOBASE was available. Therefore, the same 2022 data was used with a correction for the inflation rate between 2022 and 2023.
Food & Agri
Methodology Scope 1&2
To calculate the Dutch F&A portfolio Financed Emissions Rabobank used national emissions statistics and mapped them to the sectors that it finances using a RaboResearch-developed approach. Rabobank determined an emission factor per Euro of assets based on publicly available data from the Statistics Netherlands (CBS) for agricultural sectors. Emissions source data comes from the National Institute for Public Health and the Environment (RIVM Emissieregistratie), Agrimatie (energy use), and CBS (herd size, and land-use data). Scope 2 emissions were calculated based on (gross) electricity consumption sector statistics provided by CBS, disaggregated to sub-sectors using data from Agrimatie. In line with the GHG protocol, Rabobank used the gross electricity consumption, excluding energy production in a sector and sold back to the grid, for instance from solar panels or Combined Heat and Power (CHP) generators. 11% of the Dutch Dairy customers and 0.4% of the Dutch Horticulture customers shared primary physical activity data which made it possible to calculate the financed emissions via the Carbon Calculator.
Limitations
The average data quality score for the Dutch F&A portfolio is 4.8. This is mainly caused by the large percentage of the portfolio with data quality score 5. For this part of the portfolio the financed emissions are determined through a top-down sector-based approach which inherently carries more estimation uncertainty.
Methodology Scope 3
Scope 3 emissions are quantified using the multi-regional input-output (MRIO) model EXIOBASE. This methodology combines industry-specific emissions data with economic data to estimate the supply chain emissions (scope 3) associated with one unit of economic output in a sector (i.e. supply chain emission related to one sector divided by sector revenue), which are referred to as scope 3 multipliers. The scope 3 multipliers are subsequently multiplied with the revenue of the client to get an estimate of the client’s scope 3 emission. This approach is used to estimate both upstream and downstream emissions. Where financial information from customers was missing, we made in-sector extrapolations based on Euros invested.
Limitations
Estimating client scope 3 emissions using Multi-Regional Input Output tables (MRIOs) like EXIOBASE involves significant uncertainty stemming from various sources. For instance, macro-economic data contains errors and uncertainty to start with. Additionally, the data in MRIO-tables has to be compiled from various different sources, which can vary in granularity or boundary definitions. Also, significant amount of data has to be estimated or interpolated. Moreover, the data must be reconciled in a mathematical process, introducing additional variation, most significantly for small sectors.
Trade, Industry & Services
Methodology scope 1 and 2
Rabobank uses economic activity as a proxy for estimating its customers’ emissions. Rabobank determined an emission factor per Euro of assets based on publicly available data from CBS for non-agricultural sectors. Scope 2 emissions were calculated using (gross) electricity consumption per sector excluding produced electricity sold back to the grid.
Limitations scope 1 and 2
The data quality score for the Dutch Trade, Industry & Services portfolio is 5. For this part of the portfolio the financed emissions are determined through a top-down sector-based approach which inherently carries more estimation uncertainty. Furthermore, the listed figure is likely an overstatement as it includes some double counting due to the fact that the Scope 1 emissions for the electricity, gas, steam and air conditioning supply sector overlap with the Scope 2 emissions for the other sectors in the Dutch economy.
Methodology scope 3
The Scope 3 methodology and limitations are explained in the Dutch business customers section of Food & Agri.
Commercial Real Estate
Methodology
Rabobank calculated the emissions of its portfolio of companies with activities in the Dutch Commercial Real Estate sector and Wholesale customers, using the PCAF standard for commercial real estate. The methodology for this is similar to that of the mortgage portfolio (note that the methodology how the energy consumption of the buildings was estimated is different). Rabobank used the outstanding amounts and (most recently recorded) current property value to determine the share of the value of the property financed by a Rabobank loan.
Energy consumption at the building level was estimated based upon data from external data provider CFP Green Buildings. In case of unmatched data, extrapolations were made based on average emissions (per m2 or per building) per building type.
As for the mortgage portfolio, loans in this portfolio have a PCAF score of either 3 or 4, as provisional labels have been classified as PCAF data quality score 4 by the PCAF Mortgages Working group NL.
Limitations
A data quality score of 3 or 4, as described above, means that emissions for a building are estimated based on its floor area and energy label as proxies. This method of estimation has the inherent limitation that it does not use actual building energy consumption to determine the emissions, increasing estimate uncertainty.
Wholesale & Rural
Wholesale Customers
Methodology
Rabobank estimated the financed emissions using the PCAF standard for business loans and unlisted equity. Where a client is listed, and data is available Rabobank made use of the PCAF standard for listed equity and corporate bonds. This year estimates cover customers' Scope 1 and 2 emissions and separately their scope 3 emissions. The calculation excludes customers in Markets departments (e.g. FIs). Where available, Rabobank used client’s enterprise value including cash (EVIC) for the attribution of financed emissions. Where a client is not listed, or when it is not possible to obtain EVIC due to data limitations, Rabobank makes use of the balance sheet total. Rabobank continuously strives to improve our data availability.
To determine a customers’ scope 1, 2 and 3 emissions, Rabobank makes use of several sources. Self-reported client emissions data comes from the data provider ISS-ESG, which collects self-reported emissions from large companies, and from self-reported emissions collected by Rabobank and information directly provided by Rabobank’s customers. For companies where self-reported data was not available, client emissions were calculated based on the ISS-ESG intensity dataset by applying company characteristics such as sector and total revenue or total assets. This is a different data source then used in previous reporting and leads to a decrease of 2.4 Mt CO2e. As per PCAF requirements, we have also included our customers’ Scope 3 emissions.
Limitations
For part of the portfolio it is still necessary to obtain modelled emissions, as bottom-up (client-reported) data is not available. Where emissions are modelled based on sector and economic-activity based indicators inherently more estimation uncertainty exists. Especially within the power generation sector, based on the NACE 2008 classification the split between renewable and non-renewable power generation is currently not sufficiently taking into account for modelled emissions. This is expected to improve with the implementation of NACE 2022 in 2026.
Facilitated Emissions
The estimated facilitated emissions for scope 1 & 2 are at 0.1Mt CO2e for equity and debt capital markets combined.
Estimated scope 3 emissions are 1.9 Mt CO2e.
PCAF score: 1/2 (86%) / 4 (14%) (scope 1 & 2)
PCAF score: 1/2 (61%) / 4/5 (39%) (scope 3)
Methodology
Rabobank estimated the facilitated emissions using the PCAF standard part B for facilitated emissions. The scope covered by Facilitated emissions are listed and private debt and equity issuances in the primary market. Of this scope, 54% of the total facilitated amount in 2024 is included, as some deals are out of scope due to lack of available PCAF methodology or insignificant facilitator roles. As by the PCAF guidance, only deals with the role of bookrunner are included or if Rabobank as facilitator is responsible for >5% of the total underwriting. Syndicated loans are currently out of scope due to data limitations. Rabobank used client’s enterprise value including cash (EVIC) for the attribution of financed emissions. Where a client is not listed, or when it is not possible to obtain EVIC due to data limitations, Rabobank makes use of the balance sheet total. Rabobank continuously strives to improve our data availability. Additionally, the 33% weighting factor is applied.
The estimates cover customers' Scope 1 and 2 emissions and their scope 3 emissions reported separately. To determine a customers’ emissions, Rabobank makes use of several sources. Self-reported client emissions data comes from the data provider ISS-ESG, which collects self-reported emissions from large companies. For companies where self-reported data was not available, modelled client emissions as calculated for Wholesale customers based on the ISS intensity dataset are used. As per PCAF requirements, we have also included our customers’ Scope 3 emissions.
Limitations
For a small part of the portfolio it is still necessary to obtain modelled emissions, as bottom-up (client-reported) data is not available. Where emissions are modelled based on sector and economic-activity based indicators inherently more estimation uncertainty exists.
Rural Customers
Methodology scope 1 and 2
Rabobank estimated the financed emissions using the PCAF standard for business loans and unlisted equity. All estimates cover our customers' Scope 1 and 2 emissions and separately their scope 3 emissions. Our calculation covers our customers in Australia, Brazil, New Zealand, the United States, Canada, Argentina, Chile and Peru.
The table below lists the sources used for sector emissions and revenue data for our customers’ top-down emissions calculations.
| Country | Data source emissions (IPCC agriculture) | Data source sector revenues | Summary of approach |
| Australia | AU National Inventory report | Production value (Agricultural Commodities Statistics - ABARES) | Country-specific mapping from process-based emissions into agricultural sectors |
| Brazil | SEEG | Production value (Ministry of Agriculture) | SEEG has emissions allocated to agricultural sectors, used tailor-made sector allocation for other agriculture-relevant emissions |
| New Zealand | NZ National Inventory report | Agricultural sector revenues (StatsNZ) | Country-specific mapping from process-based emissions into agricultural sectors |
| United States | Freedom of Information Act documents for the EPA’s greenhouse gas inventory | Cash receipts data (USDA) | Country-specific mapping from process-based emissions into agricultural sectors |
| Canada, Chile, Peru and Argentina and non-agricultural primary production customers in other countries | EXIOBASE | EXIOBASE | Sector-region specific emissions from EXIOBASE |
For customers registered as agricultural primary production operations in Australia, New Zealand, Brazil and United States, Rabobank used sector emissions and revenue data from 2023 (last year’s estimates used 2022 data). Attribution is based on client revenue and total assets data. Agriculture-related emissions were allocated to agricultural sub-sectors using country-specific logic (based on National Inventory Report (NIR) methodology descriptions and country-specific background data, or directly from SEEG in the case of Brazil). We obtained fossil fuel combustion emissions in agriculture from the National Inventory Reports or, for Brazil, from the International Energy Agency (IEA), and allocated to sectors using Global Trade Analysis Project (GTAP) fossil fuel combustion data. Our calculations for Scope 2 emissions are based on IEA data on electricity use in agriculture. These were allocated to sectors according to GTAP energy consumption tables.
For Canada, Chile, Peru and Argentina and non-agricultural primary production customers in Australia, New Zealand, Brazil and United States the sector-region specific scope 1 and 2 emissions from EXIOBASE are used.
Where financial information from customers was missing, we made in-sector extrapolations based on Euros invested.
This year, we have significantly increased the amount of bottom-up emission data from carbon calculators, where primary activity data was used from customers. Carbon calculator data (PCAF data quality 2) have been included for customers in Australia for Beef, Dairy and Commodities; in Brazil for Beef, Commodities and Fresh Produce; and in the United States for Beef, Dairy and Commodities. In total, emissions of 877 customers have been added based on carbon calculators. In Australia, the Greenhouse Accounting Framework (GAF) calculators are used, developed by Primary Industries Climate Challenge Centre (PICCC). In Brazil, the World Resources Institute (WRI) Brazil calculators were used.
All carbon calculator tools were assessed for completeness, consistency, and correctness in collaboration with Mérieux NutriSciences | Blonk, an external consulting company specializing in Food & Agri Life Cycle Assessments (LCAs). Where necessary, small adjustments were made to ensure consistency, such as in Global Warming Potential factors. The output was used in the overall results of our financed emissions calculations. Rabobank is striving to collect more bottom-up data from farming customers.
Limitations scope 1 and 2
We note that the PCAF score of 4 leaves a large range of estimation uncertainty, due to limited data quality. In addition, limitations to this analysis include the custom mapping from IPCC process-based emissions to sectoral/commodity-level emissions. In terms of comparability, another limitation we encountered is that different countries use different methodologies to calculate their emissions (e.g. countries can choose a Tier 1, 2, or 3 approach for each sub-sector) and use different sources for revenue data. We did not include emissions from land-use change related to agricultural production in our analysis, as those emissions are reported under the IPCC/UNFCCC's LULUCF (Land Use, Land Use Change & Forestry) category.
Methodology Scope 3
The Scope 3 methodology and limitations are explained in the Dutch business customers section of Food & Agri.
Leasing international
DLL uses an asset-specific calculation methodology as the carbon intensity of assets within our overall portfolio varies significantly, driven primarily by asset type and asset use, irrespective of the underlying lessee sector. These assets, therefore, require a case-by-case examination of carbon intensity. The PCAF asset class “Motor Vehicle loans” is used to calculate the financed emissions.
Determining the financed emissions requires a significant degree of judgement based on the estimation by management of expected emissions and expected utilization, for which third party validation of the methodology was obtained.
DLL Tractor Assets
Methodology
Assets within the DLL tractor portfolio are classified into one of six power-based categories based on a correlation between the horsepower range and usage of intensity. We consulted external data to determine expected engine hours, taking the average for different models falling in the horsepower categories and averaging over the last seven years (2016-2022). Fuel consumption data has been sourced from publicly available sources. The fuel consumption has been consequently calculated using average values of the six different engine loads for each category.
The attribution factor is calculated as the ratio between the outstanding amount and the total value at origination of the asset. Financed emissions is the product of attribution factor and vehicle emissions.
Limitations
Our calculations rely on external data sources, which have some limitations. The data on usage of assets in the various hours power bucket is externally sourced. We used the most current data available, but the inherent uncertainty of these statistics should be considered when interpreting the results.
DLL Transport Assets
Methodology
In the transportation sector, assets are allocated between various asset types (e.g., cars and trucks), and emissions are determined per type based on various external sources. The annual distance travelled was primarily retrieved directly from government statistics, specific to the country and vehicle type where available. Where data was not available, estimations were made based on appropriate proxies. Utilization of fossil or energy type and efficiency corresponded to the brand and model of each vehicle respectively, and it was aligned with diverse sources to obtain the average efficiency per vehicle type. We employed the most conservative number for the emission factor for fossil fuel vehicles. In the case of electric vehicles’ emission factor, we used country specific information where the availability of electricity generation is influential. Emissions attributable to DLL are incorporated in the attribution factor, which is the ratio between the outstanding amount and the total value at origination. We calculated the financed emissions as the multiplication of the attribution factor and vehicle emission in this manner.
Limitations
Our calculations rely on government statistics, which have some limitations. The data on distance traveled and energy efficiency may not fully represent temporal trends, as minor sources are up to six years old. Additionally, distance traveled data is only available for certain countries, and we used extrapolation based on the proximity of countries. In some countries, fuel/electricity efficiency data is at a regional level, lacking more granular details. We used the most current data available, but these gaps should be considered when interpreting the results.
DLL Other Assets
Methodology
Assets in the construction portfolio were classified based on an internal asset classification system, grouping equipment types (e.g., loaders, cranes, excavators) and external engine power data (kW) sourced from Lectura, which provides detailed specifications, and technical manuals supplied by the original equipment manufacturers pertinent to the asset’s specific brand and model under consideration. For missing engine power data, we used average values per asset type with similar specifications. To determine asset usage, we relied on both internal and external data. Due to limited fuel or electricity consumption data, we developed a formula to calculate efficiency for both electric and non-electric machinery based on their kW. This enabled granular efficiency calculations. We used a conservative emission factor for fossil fuel vehicles and country-specific data for electric vehicles, considering the local electricity generation mix.
Office and technology assets were categorized into various types, including printers, multifunctional devices, routers, mail folders, and others. The efficiency of these assets was gathered from ENERGY STAR®, an initiative led by the U.S. Environmental Protection Agency (EPA). We mapped our portfolio based on brand and model information to each specific asset type. In instances where model-specific data was unavailable, average efficiency values were applied either at the brand level or across all brands and models within a given asset type. For assets lacking any available information, we compiled efficiency data from diverse sources.
Given the wide variety of equipment in our portfolio, determining a single metric to reflect average asset usage within DLL proved to be challenging. As a result, we focused on individual asset types and utilized available external data to assess their usage more accurately. For emissions factor, we used country-specific emission factors for electric assets, considering the local electricity generation mix.
For assets in the industry sector, we use Industrial Truck Association (ITA) classification system to categorize the forklifts into six categories and emissions are determined per asset type based on internal and external sources. The usage hour data comes from the asset management department, aligning with approved tables and methods that correlate with DLL's assets and customers.
Fuel efficiency for forklifts is measured using the VDI 2198 circuit. For internal combustion forklifts, average fuel efficiency is calculated from key brands, while electric forklifts up to 6,000 lbs serve as benchmarks. As for emission factors, the most conservative estimates are used for fossil fuel vehicles. For electric vehicles, country-specific information on electricity generation is employed where available.
For the non-tractors F&A assets, the portfolio has been aligned with asset management. Agricultural machinery is now categorized according to engine horsepower, which indicates fuel efficiency. The portfolio is divided into six HP ranges, which are the same as the tractors. Non-agricultural machinery assets are categorized either under existing categories or the 'others' category. Market usage data from tractors is extrapolated to agricultural machinery, and average usage data is applied to non-agricultural machinery. As for emission factors, the most conservative estimates are used for fossil fuel vehicles. For electric vehicles, country-specific information on electricity generation is employed where available.
For healthcare assets, we have categorized the assets at a high level due to their non-materiality and selected the top three electric assets based on unit numbers for GHG emissions calculation, using relevant literature. For other healthcare assets and non-healthcare categories, we applied average market usage data.
For all assets, the emissions attributed to DLL are calculated using the attribution factor, which is the ratio of the outstanding amount to the total value at origination. Financed emissions are derived by multiplying the attribution factor by the asset’s emissions.
Limitations
For construction, we adopted a granular approach to estimate assets emissions. However, there are some limitations to consider. Information to calculate efficiency data was obtained from the U. S., the only available resource, which may not accurately represent conditions in ANZ and European regions. While we primarily relied on internal data for usage hours, certain assets require extrapolation information coming from U. S statistical sources, the only available resource. Which may not fully align with regional variations.
For office and technology assets, the absence of regional statistical data from most asset-owning is a significant factor contributing to a PCAF score of 4 (80%). However, approximately 20% of the portfolio utilized efficiency data at the make and model level, thereby making the score 3.
For industry assets variations in manufacturer data, differences in operational conditions, and the availability of precise electricity generation data for electric vehicles lead to uncertainty. These factors can impact the accuracy of fuel efficiency and emission calculations, highlighting the need for continuous updates and adjustments.
For non-tractors F&A assets, the asset categorization based on engine horsepower (HP) has limitations such as oversimplification, overlooking diverse applications, and potential mismanagement of the 'others' category. Extrapolating market usage data from tractors to all agricultural machinery may lead to inaccuracies, and average usage data for non-agricultural machinery might not reflect diverse patterns.
For healthcare assets, the limitations include the generalization of healthcare assets at a high level, which may overlook specific differences, and rely on average market usage data that could introduce inaccuracies and assume uniform usage patterns. Additionally, focusing only on the top three electric assets may not provide a comprehensive view, and the lack of detailed methodology and data sources reduces transparency and verifiability.
For healthcare assets the limitation includes the generalization of healthcare assets at a high level, which may overlook specific differences, and relying on average market usage data that could introduce inaccuracies and assume uniform usage patterns. Additionally, focusing only on the top three electric assets may not provide a comprehensive view, and the lack of detailed methodology and data sources reduces transparency and verifiability.
Other Assets
Other assets consist of sovereign bonds, Rabo Investments and other equity. The first two are explained below, for other equity the same methodology as for Wholesale is applied.
Sovereign Bonds
Methodology
For sovereign bonds the financed emissions are using the PCAF standard for sovereign debt. The attribution of sovereign emissions to Rabobank is done based on the nominal amount of the bond. PCAF Database now provides scope 1, 2 and 3 (as available) which are adjusted for GDP PPP of the reporting year. It also includes supranational methodology and emissions data for scope 1 emissions. PCAF requires to report production emissions both with and without Land Use and Land Use Change and Forestry (LULUCF).
For FY2024, exposure included in the scope are the exposures in sovereign bonds and supranationals, which are not green bonds and are included in the PCAF database. There is no methodology for green bonds and sub- sovereigns. Please note that double counting in these numbers is currently inevitable as some of the emissions in a country are also counted as emissions of our customers. Scope 3 emissions are only available for sovereigns, not for supranationals.
Limitations
Data for supranationals is available for only scope 1 emissions. Scope 1 emissions data for supranationals and scope 2 and 3 emissions data is from 2020. Additionally, the information is based on modelled emissions resulting in estimation uncertainty.
Rabo Investments
Methodology
Financed emissions of our Rabo Investment portfolio using the PCAF standard for business loans and unlisted equity. We used total assets value data or alternatively the equity stake (when current valuation/total assets > equity stake or depending on data availability) for the attribution of financed emissions. We are aware that PCAF advises the use of enterprise value including cash. However, due to data limitations it is currently not possible to apply our attribution using this metric. We aim to improve our data availability moving forward. Company emissions data comes from the external rating agency and data provider ISS-ESG, which collects self-reported emissions from large companies. For companies where self-reported data was not available, client emissions were calculated based on the ISS-ESG intensity dataset by applying company characteristics such as sector and total revenue or total assets. This is a different data source then used in previous reporting and leads to a decrease of 0.01 Mt CO2e. Additionally, self-reported company reported information, e.g. provided by funds, is included when available.
Limitations
For part of the portfolio it is still necessary to obtain modelled emissions, as bottom-up (client-reported) data is not available. Where emissions are modelled based on sector and economic-activity based indicators inherently more estimation uncertainty exists.
Avoided Emissions
Renewable energy portfolio
Methodology
On our renewable energy portfolio as part of project finance we estimate avoided emissions. Avoided Emissions have been estimated using the PCAF standard for project finance. Avoided emissions have only been calculated on projects with outstanding amounts which were in operation end of 2024. The attribution factor is calculated on the relative share of Rabobank financing in the overall financing of the projects. Avoided emissions have been calculated using the Renewable Energy GHG Accounting Approach from the International Finance Institutions Technical Working Group on Greenhouse Gas Accounting. Grid factor emissions were calculated using the IFI Harmonized Grid Emission factor dataset version 3.2 (published April, 2022).
Limitations
Debt and equity values on project levels are not available, as an alternative the share of financing in the project financing is used to calculate attribution factor.
Grid factor emissions on country level are based on dataset from 2022. In general, the grids are getting greener in most countries, so there is a possibility of overestimating the avoided emissions.
Appendix 7: Climate Target Setting Methodology
Sector: Energy
Parts of the value chain covered
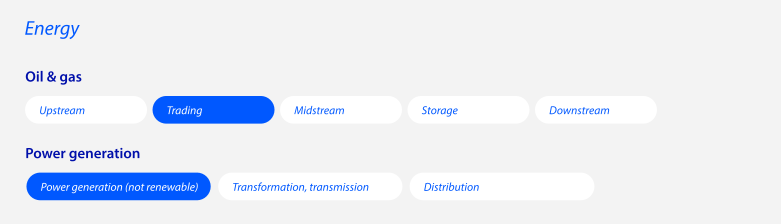
Pathway rationale:
Reference to Our Road to Paris, page 83
Target calculation methodology
For the power sector, and traded oil & gas, Rabobank uses one pathway based on IEA NZE and this is automatically the benchmark.
The 2030 value of this one Rabobank benchmark is the 2030 power sector goal value (both for Retail NL and for Wholesale).
For traded oil & gas, the decrease of the pathway is the target to decrease the USDbn on-balance exposure.
Target recalculation policy
The targets should be recalculated if the IEA NZE pathways are updated,
Performance monitoring
The emission intensity per client is calculated based on the assumed energy source used (linked to the SBI code) and the IEA emissions intensity data of that specific energy source. The average emission intensity for the portfolio for 2024 is calculated by taking the weighted average of the emission intensities of all the customers based on their exposure and the IEA emission intensities of reference year 2022 for NL. The CH4 and N2O emissions were first converted from CO2eq_AR6 to CO2eq_AR5. Energy Wholesale and Energy Project Finance are reported as having close to zero emissions, as their portfolios predominantly consist of renewable energy.
The traded oil & gas progress in measured in terms of exposure.
Sector: Residential and Commercial Real Estate
Parts of the value chain covered

Pathway rationale:
Reference to Our Road to Paris, page 83
Target calculation methodology
The CRREM provides a Paris aligned benchmark in terms of kgCO2/m2 for different building types. The Rabobank CRREM benchmark pathway is a weighted average of the CRREM pathways available for specific real estate types.
Residential Real Estate: For Residential Real Estate (RRE), Rabobank uses pathways for two real estate types: single family and multifamily homes. The pathways for these real estate types are combined into one Rabobank pathway, based on m2 financed for every type. The 2030 value of this pathway is the 2030 RRE goal value.
Commercial Real Estate: For Commercial Real Estate (CRE), Rabobank uses pathways for six real estate types: health, homes (averaged), industrial distribution warehouses (combined), lodges/leisure/recreation, offices & retail (combined). The pathways for these real estate types are combined into one Rabobank pathway, based on m2 financed for every type. The 2030 value of this one Rabobank pathway is the 2030 CRE goal value.
The benchmark for both CRE and RRE is calculated using this formula: benchmark =∑yemission_intensityy,bt*portfolio_m2bt/∑portfolio_m2
Benchmarky = the average emission intensity (kgCO2/m2) in year y for the Rabobank portfolio based on the CRREM emission intensities;
Emission_intensityy, bt = the benchmark emission intensity (kgCO2/m2) in year y for building type bt according to CRREM;
Portfolio_m2bt = the Rabobank portfolio total financed m2 for the building type bt;
Portfolio_m2 = the Rabobank portfolio’s total financed m2
Target recalculation policy
The targets should be recalculated if:
The CRREM pathways are updated
A new yearly portfolio mix of the square meters financed is available (and the 2030 goal value would change materially subsequently)
Performance monitoring
The total number of financed kg CO2 emissions is used for all the objects that have m2 data, and divided by the total number of financed m2.
Sector: Agriculture International
Parts of the value chain covered
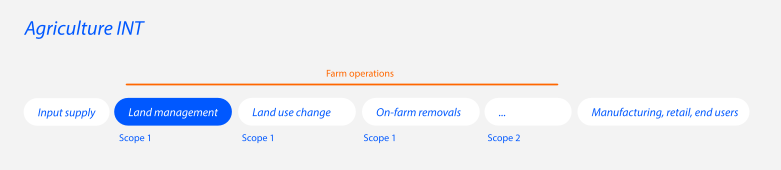
Pathway rationale:
Reference to Our Road to Paris, page 83
Target calculation methodology
SBTi FLAG pathways are convergence pathways, meaning all intensities converge to the same 2050 goal value. If the base year intensity is above the pathway, the 2030 goal value will also be above the pathway. If the base year intensity is below the pathway, the 2030 goal value will also be below the pathway.
If base year intensity is known: Fill in base year intensity in SBTi FLAG tool, the SBTi FLAG tool subsequently provides 2030 goal value. (If 2030 goal value provided by SBTi FLAG tool is equal to base year intensity, discussion with business should follow if stricter goal value is reasonable.)
If base year intensity is not known: Select 2030 value of SBTi FLAG pathway as 2030 goal value.
Target recalculation policy
The targets should be recalculated if:
The SBTi FLAG pathways are updated.
The base year intensity wasn’t known, but now sufficient bottom-up data of the Rabobank customers are available to calculate a base year intensity.
We start to include land use change emissions and removals in the Rabobank footprint. Currently only on-farm emissions are included in the footprint and target setting.
Performance monitoring
Please refer to the sector x region targets table for our disclosure regarding the physical intensities of the international sector x region combinations.
The output of the carbon calculator tools was used to plot Rabobank’s portfolio against the SBTi FLAG decarbonization pathway. In general, the calculated physical emissions intensity per sector x region = sum Financed Emissions over customers (client LtV*client FLAG emissions) / sum Financed physical activity over customers (client LtV*client production value (e.g. kg fresh weight)).
Sector: Agriculture Netherlands
Parts of the value chain covered
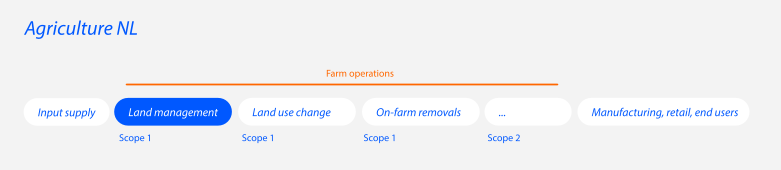
Pathway rationale:
Reference to Our Road to Paris, page 84
Target calculation methodology
The Dutch Climate Agreement provides absolute emissions reduction targets for Dairy NL and Pig Farming NL. The Convenant Energietransitie Glastuinbouw provide absolute emissions reduction targets for Greenhouse Horticulture NL.
The absolute financed emissions targets are the share of the sectoral absolute emissions reduction targets set, based on the assets financed.
Target recalculation policy
The targets should be recalculated if: final reduction targets per subsector are set and/or updated by the government/sector.
Performance monitoring
Please refer to sector x region targets table for the disclosure of the financed emissions of the Dutch F&A portfolio.
Sector: Transport
Parts of the value chain covered

Pathway rationale:
Reference to Our Road to Paris, page 84
Target calculation methodology
The IEA provides a Paris aligned pathway in terms of MtCO2/billion tkm for the freight transport modes inland shipping and trucks. The benchmark is a weighted average of the IEA pathways available for these transport modes.
Rabobank combines the IEA pathways for 2 freight transport modes -inland shipping and trucks- into one weighted Rabobank benchmark, based on the outstanding ratio for each. The 2030 value of this one Rabobank benchmark is the 2030 freight transport goal value.The benchmark for freight transport is calculated using the formula below:
benchmarky=(∑yemission_intensityy,tm∗portfolio_outstandingtm)/∑portfolio_outstanding
Benchmarky = the average emission intensity (MtCO2/billion tkm) in year y for the Rabobank portfolio based on the IEA emission intensities;
Emission_intensityy, tm = the benchmark emission intensity (MtCO2/billion tkm) in year y for freight transport mode tm according to IEA;
Portfolio_outstandingtm = the Rabobank portfolio total outstanding for the freight transport mode tm;
Portfolio_outstanding = the Rabobank freight transport portfolio’s outstanding
Target recalculation policy
The targets should be recalculated if:
The IEA pathways are updated.
A new yearly portfolio mix of the outstanding is available.
Performance monitoring
Calculating the physical intensity for the transport portfolio is under development.
Sector: DLL
Parts of the value chain covered
Not applicable
Pathway rationale:
No specific pathways are available for benchmarking leased assets, therefore DLL developed their own methodology, which was verified by an external party.
Target calculation methodology
The emissions of our DLL portfolio do not relate to the general activities of the businesses they serve, but rather for the asset that is leased. Only carbon dioxide is in scope. Specific targets have been set for the DLL tractors and transport asset portfolios. The targets are calculated based on IEA projections, market developments, and asset-uptake for the portfolio. This includes assumptions on zero or low-emission alternatives as well as use biofuel and other means of fuel efficiency.
Target recalculation policy
The targets should be recalculated if significant changes occur in the DLL portfolio composition or internal DLL strategy.
Performance monitoring
To determine the current intensity value, the portfolio financed emissions are divided by the number of assets in the portfolio.
Appendix 8: Alternative Performance Measures (APMs)
In this Annual Report, Rabobank uses financial measures in the analysis of its business and financial position, which Rabobank considers to constitute Alternative Performance Measures for the purposes of the ESMA Guidelines on Alternative Performance Measures. Such financial measures are not calculated in accordance with IFRS and are unaudited. Accordingly, they should not be considered as alternatives to "results from operating activities" or "profits" as indicators of Rabobank’s performance. However, Rabobank believes that such financial measures are commonly used by investors and as such useful for disclosure. The presentation of these financial measures may not be comparable to similarly titled measures reported by other companies due to differences in the ways the measures are calculated.
Set out below are further clarifications as to the meaning of such measures and their use, as well as the table which reconcile the APMs to the most directly comparable IFRS measures and provide comparative data for such measures for 2025.
| Alternative Performance Measures (APM) | Definition | Reason for use |
| Return on Assets | Is calculated by dividing (annualized) net profit by total average assets. | This ratio measures the return that Rabobank makes on its assets and is a common measure of profitability in the banking sector. |
| Return on Equity | Is calculated by dividing (annualized) net profit by average total equity. | This ratio measures the return that Rabobank makes on its equity and is a common measure of profitability in the banking sector. |
| 1-year rolling net interest margin | Is calculated by dividing the net interest income by average total assets. | Common measure of profitability in the banking sector. This ratio shows how much interest income Rabobank earns on its assets. |
| Cost income ratio | Is calculated by dividing operating expenses plus regulatory levies by income. | Common measure of operational efficiency in the banking sector. It measures the costs of Rabobank in relation to its income. |
| Underlying income | Specific income items outside the ordinary course of business are excluded. | To make a better comparison with previous periods. |
| Underlying expenses | Specific expense items outside the ordinary course of business are excluded. | To make a better comparison with previous periods. |
| Underlying gross result | Specific gross result items outside the ordinary course of business are excluded. | To make a better comparison with previous periods. |
| Underlying impairment losses on GW&A | Specific impairment losses on goodwill and associates outside the ordinary course of business are excluded. | To make a better comparison with previous periods. |
| Underlying operation profit before tax | Specific operating profit before tax items outside the ordinary course of business are excluded. | To make a better comparison with previous periods. |
| Impairment charges on financial assets (in bps of average private sector loan portfolio) | Is calculated by dividing (annualized) impairment charges on financial assets by average private sector loan portfolio. | Common measure of credit quality in the banking sector. This ratio quantifies Rabobank’s impairments arising from credit risk. |
| Non-performing loans ratio | Is calculated by dividing on-balance non-performing exposure by total on-balance exposure. | Common measure of credit quality in the banking sector. This ratio quantifies Rabobank’s non-performance loans arising from credit risk. |
| Loan-to-deposit ratio (point-in-time) | Is calculated by dividing loans by deposits, based on a specific definition of loans and deposits. | Common indicator for reliance on wholesale funding in the banking sector. This ratio shows how much loans Rabobank grants in relation to its deposit base. |
| Change private sector loan portfolio at constant foreign exchange (FX) rates2 | Difference between private sector loan portfolio current year minus private sector loan portfolio prior year at current foreign exchange rates. | To make a better comparison with previous periods. |
| Change lease portfolio at constant foreign exchange (FX) rates | Difference between lease portfolio current year minus lease portfolio prior year at current foreign exchange rates. | To make a better comparison with previous periods. |
- The definitions of the APMs are coincided with the basis of calculations adopted.
- See Annual Report 2025 chapter Performance Rock-Solid Bank (Group and W&R).
Reconcilation overview APMs
| Amounts in millions of euros | 2025 FY | 2024 FY | 2023 FY |
|---|---|---|---|
| Return on Assets | 0.78% | 0.83% | 0.70% |
| Net profit | 4,957 | 5,163 | 4,377 |
| Average total assets | 634,069 | 621,525 | 621,155 |
| Annualization factor | 1 | 1 | 1 |
| Return on Equity | 9.1% | 10.0% | 9.1% |
| Net profit | 4,957 | 5,163 | 4,377 |
| Average total equity | 54,648 | 51,543 | 47,999 |
| Annualization factor | 1 | 1 | 1 |
| 1-year rolling net interest margin | 1.87% | 1.90% | 1.80% |
| Net interest income | 12,001 | 12,061 | 11,712 |
| Average balance sheet total | 643,002 | 633,356 | 649,876 |
| Cost/income ratio | 54.5% | 54.4% | 55.9% |
| Income | 16,424 | 16,130 | 15,405 |
| Operating expenses | 8,710 | 8,511 | 8,057 |
| Regulatory levies | 234 | 266 | 554 |
| Underlying income | 16,235 | 16,090 | 15,298 |
| Income | 16,424 | 16,130 | 15,405 |
| Adjustments to income | (189) | (40) | (107) |
| Underlying expenses | 8,663 | 8,422 | 8,232 |
| Operating expenses | 8,710 | 8,511 | 8,057 |
| Adjustments to expenses | 47 | 89 | (175) |
| Underlying gross result | 7,572 | 7,668 | 7,066 |
| Underlying income | 16,235 | 16,090 | 15,298 |
| Underlying expenses | 8,663 | 8,422 | 8,232 |
| Underlying operating profit before tax | 6,574 | 6,864 | 5,680 |
| Operating profit before tax | 6,716 | 6,815 | 5,962 |
| Total adjustments | (142) | 49 | (282) |
| Impairment charges on financial assets (in bps of average private sector loan portfolio) | 17 | 11 | 17 |
| Impairment charges on financial assets | 764 | 468 | 727 |
| Average private sector loan portfolio | 451,209 | 440,822 | 432,683 |
| Annualization factor | 1 | 1 | 1 |
| Non-performing loans ratio | 1.4% | 1.7% | 1.6% |
| On-balance non-performing exposure | 8,050 | 9,879 | 8,997 |
| Total on-balance exposure | 581,189 | 578,777 | 570,544 |
| Loan-to-deposit ratio (point in time) | 1.07 | 1.10 | 1.12 |
| Loans | 460,250 | 447,867 | 434,145 |
| Deposits | 429,663 | 406,860 | 387,633 |
| Change lease portfolio at constant FX | 1,088 | ||
| Lease portfolio | 45,759 | 47,401 | |
| Change - current year vs prior year | (1,642) | - | |
| FX impact - prior year | - | (2,730) |
Appendix 9: Rabobank UN Principles for Responsible Banking Progress Statement
Principle 1: Alignment
As a cooperative bank, Rabobank is committed to ‘Growing a Better World Together’. With our industry knowledge, networks and financial solutions, we help our clients in becoming more resilient and transition to a sustainable future. Sustainability is embedded in the drivers of our strategy:
we aim to further strengthen our cooperative mentality, our strong cooperative presence and to deliver on our sustainability aspirations: Act on Climate, Value Nature and Enable People.
we aim to steer and optimize our bank-wide portfolio on risk, return and sustainability.
Our group‑wide strategic steering cycle ensures that sustainability is a core element in how we steer and optimize our business, as well as how sustainability risks are incorporated in the risk management framework. Rabobank incorporates sustainability ambitions into strategic decision-making by developing and executing plans for each prioritized sector x region combination. Our key levers to achieve these targets are supporting customer transitions, driving system change, and optimizing our portfolio.
Our main sustainability priorities are reducing our climate impact, bringing the impact on nature back to planetary boundaries and enabling people. We address human‑rights risks through the actions set out in our [2025 Enable People Vision], as we continue to build on this foundation and increase integration of climate, nature and people to enable just transitions.
Ourclimate change mitigation and adaptation strategy consists of clear definition of our climate goal – we remain committed to aligning our financing with 1.5ºC pathways by 2050 and to helping our customers successfully navigate their transition to a sustainable direction. We aim to achieve this by 1) reducing our own emissions and 2) reducing our financed emissions. We are committed to supporting the goals of the Paris Climate Agreement and contributing to transitions aligned with the UN Sustainable Development Goals. In all we do, we aim to act in line with our beliefs, commitments and regulations and do this in a science-based way.
Our Nature approach means for Rabobank to balance food and energy within planetary boundaries. By 2030, we aim to embed nature into core banking and governance and align our portfolio and policies with Global Biodiversity Framework 2030 targets. By addressing nature related impact, risks and opportunities we aim to increase the resilience of our customers as presented in our 2023 launched Value-Nature vision.
Principle 2: Impact & Target Setting
Following our annual strategic steering cycle and risk management framework, we refine our sustainability strategy to reflect developments in our operating environment and conduct a double materiality assessment (DMA). The DMA informs sector x region medium‑term plans, sustainability targets, and risk appetites, and outlined in our policies.
In the 2025 DMA the priorities for a global responsible banking sector —climate change, nature and biodiversity, human rights, and healthy, inclusive economies — were well considered. For the significant impact areas these are reflected in the outcome as material sustainability topic. We are aware of the opportunities interlinking climate adaptation actions with biodiversity actions and focus on just transition. Progress on these priorities and associated target setting is outlined in the Environmental Information and Social Information sections of the Annual Report.
Significant Impact Area 1: Climate Change
To reach our 2050 ambition, we have set GHG reduction targets for 19 priority sector x region combinations, covering the majority of our financed emissions (61%). Meanwhile in cooperation with UNEP-FI we are exploring ways of scaling up adaptation finance to help prevent, prepare for, and respond to climate caused events and make communities, economies and natural systems more resilient. Please refer to the Climate Change Mitigation and Adaptation section for more elaboration.
Significant Impact Area 2: Nature
Nature is integrated into our DMA and into 12 nature priority sector x region plans. Given the complexity and location‑specific nature of biodiversity impacts, we are in the process of identifying suitable metrics. Currently we steer on effort targets across the material nature themes of pollution, water and land use, while working towards the development of robust, outcome‑oriented targets as data and methodologies mature. Please refer to the Nature section for more elaboration.
Principle 3: Clients & Customers
Reducing our financed emissions
The vast majority of our emissions results from our customers' activities (our financed emissions). To address those, we leverage our generic four-step approach:
We build our understanding (through data collection and analysis) how much our customers are emitting and how much of it we are facilitating.
We identify science-based sectoral decarbonization pathways and set emission reduction targets for the most material sector x region combinations in our portfolio.
We develop sector x region level implementation plans to achieve the targets set.
We assess the effectiveness of our actions to also ensure accountability, transparency and consistent reporting.
Rabobank’s sector x region targets are designed to align our lending portfolios with the Paris Agreement, while supporting customers in their transition to more emission-efficient practices. This transition depends on many factors further explained in our Annual Report. Please refer to sector x region analyses in Appendix 2 for more detail.
Reducing our Negative impact on Nature
Our policy continues to revolve around how we can have an impact with our customers. Using an engagement approach, which involves discussing challenges and facilitating improvements with our customers, we continue to significantly contribute to our nature objectives aligned with GBF. This enables us and our customers to continuously do better.
Supporting our customers
To help customers progress in the transition of their operations, we provide support in multiple ways. For more details and examples see our Impact Report (pages 17 and 25):
Strengthening sustainability knowledge
We held knowledge sharing sessions, opening networks for more sustainable (agricultural) practices, innovation and sector development.Providing sustainability transition tools
We launched various tools and pilots e.g. to measure farm emissions and nature impacts and opportunities (e.g Farm Efficiency tool, satellite imagery and polygon information from the lands of our rural customers)Supporting incentivized financing
With a EUR 3 billion financial package, Rabobank helps Dutch farmers invest in renewable energy, circular production, biodiversity and emission reduction. In Brazil we developed multiple loan facilities for promoting deforestation- and conversion-free soy farming practices and to support forest acquisition, reforestation efforts and/or recovering degraded land.
Principle 4: Stakeholders
We are committed to conducting strategic, constructive, and proactive dialogues with all our stakeholders. We consider society at large as a stakeholder for all aspects of our products, services and operations. This includes external and internal stakeholders such as our members, clients, regulators, investors, different interest groups, employee representative councils and last but not least, employees. Through these interactions at global and local level and collaborations with environmental and social organizations we support system change toward sustainable food and energy systems and financially healthy communities.
In 2025 we participated in COP30 in Belém, Brazil, advocating for systemic change in deforestation reduction, land‑use conversion, regenerative agriculture, and long‑term policy coherence. Similarly we established system partnerships with WWF, IPAM, WBCSD, Biomas and AGRI3. With WWF we engage on improving agricultural practices, reducing impact on nature, make value chains sustainable. Furthermore we interact and co-create nature-related progress with stakeholders within numerous ‘commitments’ such as the Finance for Biodiversity Pledge and the Taskforce for Nature-related Financial Disclosures.
To advance our sector x region plans and achieving sector targets, Rabobank actively engages with industry partners to address cross‑sector sustainability challenges. For specific sectors (such as Soy, Palm Oil, Dairy etc.) we initiate dialogues with relevant stakeholders, partners and government bodies to explore how we can support the transition, to accelerate the sector’s shift toward lower emissions, avoidance of deforestation, improved animal welfare, fair labor practices, circular practices to name a few themes. We also seek to be informed by the voices of value‑chain workers and affected communities to understand how our activities and those of our business customers may impact their human rights. This includes engagement with workers’ organizations and representatives of human rights defenders to deepen our understanding of rightsholder risks in specific regions, countries, and high‑risk sectors where our clients operate.
Principle 5: Governance & Culture
Governance
Rabobank’s sustainability governance structure includes the Supervisory Board, Managing Board (MB), Sustainability Implementation Team (IMT), Sustainability Communication Review Committee (SCRC), the Risk Management Committee Group RMC Group), Sustainability Focus Group (SFG).. Each body operates under internal rules that define its mandate, responsibilities, and decision‑making authority. The MB sets and executes the bank’s corporate, risk, and sustainability strategies. It ensures compliance with sustainability laws and commitments, allocates the necessary resources, and takes corrective action when required. The IMT, chaired by the Chief Sustainability Officer (CSO), consists of senior leaders from key domains. Reporting to the MB, the IMT oversees the execution of sustainability decisions across the bank, approves implementation plans for key topics, and advises the MB on strategic sustainability matters. It coordinates and aligns sustainability activities, while policy approvals follow the standard governance process through Management Teams, the RMC Group, and the MB. The SCRC reviews external communication regarding Sustainability and the SFG reviews and allocates new sustainability regulations and commitments.
Remuneration
The Group Remuneration Policy is focused on delivering long-term performance. Our cooperative identity and Environmental, Social and Governance (ESG) targets are reflected in our performance management approach. Any variable remuneration awarded is based on a balanced mix of performance objectives, subject to at least 50% non-financial performance objectives.
Skills, culture and training
In 2025, Rabobank continued to deepen colleagues’ understanding of key sustainability topics, their societal implications, and the bank’s strategic response. As we strengthened our sustainability capability and culture, employees further developed the insights and expertise needed to support the execution of our sustainability roadmap. We expanded online learning options and provided targeted upskilling for teams requiring more advanced knowledge in priority areas.
Internal capabilities were further enhanced through nature‑related training and recurring senior management sessions, enabling more structured and informed steering on nature topics. Throughout the year, we also equipped our business colleagues with tools and knowledge to support customer engagement on human rights. In parallel, our active internal sustainability community continued to grow, fostering peer learning and broadening engagement across the organization.
Principle 6: Transparency & Accountability
This Report should be read alongside our Annual Report 2025 (please also refer to the Basis for Preparation section), the Impact Report 2025 (which provides our stakeholders with an impression of how Rabobank endeavors to make a positive impact on the societies we serve), our Road to Paris 2022 and its 2024 addendum (which discloses our targets, plans and progress toward aligning our lending portfolio with the Paris Climate Agreement targets and mitigating key climate risks), Nature vision and Enable People publication.
As this self-assessment Report is in line with Rabobank's double materiality analysis and the disclosures thereon in the annual report which has an assurance opinion, no separate assurance on this report has been sought in 2025.
Financial Statements


Consolidated Statement of Financial Position
Consolidated Statement of Financial Position
| December 31 | December 31 | ||
|---|---|---|---|
| Amounts in millions of euros | Note | 2025 | 2024 |
Assets | |||
| Cash and cash equivalents | 6 | ||
| Loans and advances to credit institutions | 7 | ||
| Financial assets held for trading | 8 | ||
| Financial assets mandatorily at fair value | 9 | ||
| Derivatives | 10 | ||
| Loans and advances to customers | 11 | ||
| Financial assets at fair value through other comprehensive income | 12 | ||
| Investments in associates and joint ventures | 13 | ||
| Goodwill and other intangible assets | 14 | ||
| Property and equipment | 15 | ||
| Investment properties | 16 | ||
| Current tax assets | |||
| Deferred tax assets | 26 | ||
| Other assets | 17 | ||
| Non-current assets held for sale | 18 | ||
| Total assets |
| December 31 | December 31 | ||
|---|---|---|---|
| Amounts in millions of euros | Note | 2025 | 2024 |
Liabilities | |||
| Deposits from credit institutions | 19 | ||
| Deposits from customers | 20 | ||
| Debt securities in issue | 21 | ||
| Financial liabilities held for trading | 22 | ||
| Financial liabilities designated at fair value | 23 | ||
| Derivatives | 10 | ||
| Other liabilities | 24 | ||
| Provisions | 25 | ||
| Current tax liabilities | |||
| Deferred tax liabilities | 26 | ||
| Subordinated liabilities | 28 | ||
| Total liabilities | |||
Equity | |||
| Reserves and retained earnings | 30 | ||
| Equity instruments issued by Rabobank | |||
| - Rabobank Certificates | 31 | ||
| - Capital Securities | 32 | ||
| Non-controlling interests | 33 | ||
| Total equity | |||
| Total equity and liabilities |
- Comparative figures have been amended to align for the current year presentation of the hedge accounting adjustment amounting to EUR 589 million.
Consolidated Statement of Income
Consolidated Statement of Income
| For the year ended December 31 | |||
|---|---|---|---|
| Amounts in millions of euros | Note | 2025 | 2024 |
| Interest income from financial assets using the effective interest method | 35 | ||
| Other interest income | 35 | ||
| Interest expense | 35 | ||
| Net interest income | 35 | ||
| Fee and commission income | 36 | ||
| Fee and commission expense | 36 | ||
| Net fee and commission income | 36 | ||
| Income from other operating activities | 37 | ||
| Expenses from other operating activities | 37 | ||
| Net income from other operating activities | 37 | ||
| Income from investments in associates and joint ventures | 38 | ||
| Gains/ (losses) arising from the derecognition of financial assets measured at amortized cost | |||
| Gains/ (losses) on financial assets and liabilities at fair value through profit or loss | 39 | ||
| Gains/ (losses) on financial assets at fair value through other comprehensive income | ( | ( | |
| Other income | 40 | ||
| Income | |||
| Staff costs | 41 | ||
| Other administrative expenses | 42 | ||
| Depreciation and amortization | 43 | ||
| Operating expenses | |||
| Impairment charges on investments in associates and joint ventures | |||
| Impairment charges on financial assets | 44 | ||
| Regulatory levies | 45 | ||
| Operating profit before tax | |||
| Income tax | 46 | ||
| Net profit for the year | |||
| Of which attributed to Rabobank | |||
| Of which attributed to Rabobank Certificates | |||
| Of which attributed to Capital Securities | |||
| Of which attributed to non-controlling interests | 33 | ||
| Net profit for the year | |||
Consolidated Statement of Comprehensive Income
Consolidated Statement of Comprehensive Income
| Amounts in millions of euros | Note | 2025 | 2024 |
|---|---|---|---|
| Net profit for the year | |||
| Other comprehensive income transferred to profit or loss if specific conditions are met, net of tax: | |||
| Exchange differences on translation of foreign operations | 30 | ( | |
| Increase/ (decrease) in the fair value of debt instruments at fair value through other comprehensive income | 30 | ( | |
| Costs of hedging | 30 | ( | |
| Cash flow hedges | 30 | ( | ( |
| Share of other comprehensive income of associates and joint ventures | 30 | ||
| Other comprehensive income not to be transferred to profit or loss, net of tax: | |||
| Remeasurements of post-employee benefit obligations | 30 | ||
| Increase/ (decrease) in the fair value of equity instruments at fair value through other comprehensive income | 30 | ( | |
| Share of other comprehensive income of associates and joint ventures | 30 | ( | |
| Decrease/ (increase) in the fair value due to own credit risk on financial liabilities designated at fair value | 30 | ( | ( |
| Other comprehensive income | ( | ||
| Total comprehensive income | |||
| Of which attributed to Rabobank | |||
| Of which attributed to Rabobank Certificates | |||
| Of which attributed to Capital Securities | |||
| Of which attributed to non-controlling interests | |||
| Total comprehensive income |
Consolidated Statement of Changes in Equity
Consolidated Statement of Changes in Equity
| Note | Reserves and retained earnings | Equity instruments issued by Rabobank | Non-controlling interests | Total | |
|---|---|---|---|---|---|
| Amounts in millions of euros | |||||
| Balance on January 1, 2025 | |||||
| Net profit for the year | |||||
| Other comprehensive income | 30 | ( | ( | ( | |
| Total comprehensive income | |||||
| Payments on Rabobank Certificates | ( | ( | |||
| Payments on Capital Securities | ( | ( | |||
| Redemption of Capital Securities | ( | ( | ( | ||
| Other | ( | ( | |||
| Balance on December 31, 2025 | |||||
| Balance on January 1, 2024 | |||||
| Net profit for the year | |||||
| Other comprehensive income | 30 | ( | |||
| Total comprehensive income | |||||
| Payments on Rabobank Certificates | ( | ( | |||
| Payments on Capital Securities | ( | ( | |||
| Redemption of Rabobank Certificates | ( | ( | ( | ||
| Other | ( | ( | ( | ( | |
| Balance on December 31, 2024 |
Consolidated Statement of Cash Flows
| For the year ended December 31 | |||
|---|---|---|---|
| Amounts in millions of euros | Note | 2025 | 2024 |
| Cash flows from operating activities | |||
| Operating profit before tax | |||
| Adjusted for: | |||
| Depreciation and amortization | 43 | ||
| Depreciation of operating lease assets and investment properties | 15, 16 | ||
| Impairment charges on investments in associates and joint ventures | 13 | ||
| Impairment charges on financial assets | 44 | ||
| (Reversal) Impairment losses on property and equipment | 15 | ( | |
| (Reversal) Impairment losses on other intangible assets | 14 | ||
| Gains/ (losses) on disposal of property and equipment | |||
| Income from investments in associates and joint ventures | 38 | ( | ( |
| Income from disposal of subsidiaries | |||
| Gains/ (losses) on financial assets and liabilities at fair value through profit or loss | 39 | ( | ( |
| Gains/ (losses) on derecognition of debt instruments at fair value through other comprehensive income | 40 | ||
| Gains/ (losses) arising from the derecognition of financial assets measured at amortized cost | ( | ( | |
| Provisions | 25 | ||
| Capitalized costs self-developed software and other assets | ( | ( | |
| Non-cash items recognized in operating profit before tax | |||
| Loans and advances to credit institutions | 7, 44 | ( | ( |
| Financial assets held for trading | 8, 39 | ( | |
| Financial assets mandatorily at fair value | 9 | ( | |
| Derivatives | 10 | ( | |
| Loans and advances to customers | 11, 44 | ( | ( |
| Acquisition of financial assets at fair value through other comprehensive income | 12 | ( | ( |
| Proceeds from the sale and repayment of financial assets at fair value through other comprehensive income | 12 | ||
| Acquisition of operational lease assets | 15 | ( | ( |
| Proceeds from the disposal of operational lease assets | 15 | ||
| Dividends received from associates and financial assets | 13 | ||
| Deposits from credit institutions | 19 | ( | ( |
| Deposits from customers | 20 | ||
| Financial liabilities held for trading | 22 | ( | |
| Financial liabilities designated at fair value | 23 | ( | ( |
| Derivatives | 10 | ( | |
| Other liabilities | 24 | ( | |
| Income tax paid | ( | ( | |
| Other assets | 17 | ( | |
| Other changes | ( | ||
| Net cash flow from/ (used in) operating activities | ( | ||
| Cash flows from investing activities | |||
| Acquisition of investments in associates | 13 | ( | ( |
| Proceeds from disposal of investments in associates | 13 | ||
| Acquisition of subsidiary | ( | ( | |
| Proceeds from disposal of subsidiaries net of cash and cash equivalents | |||
| Acquisition of property, equipment and investment properties | 15, 16 | ( | ( |
| Proceeds from the disposal of property, equipment and investment properties | 15, 16 | ||
| Net cash flow from/ (used in) investing activities | ( | ( | |
| Cash flows from financing activities | |||
| Proceeds from debt securities in issue | 21, 34 | ||
| Redemption of debt securities in issue | 21, 34 | ( | ( |
| Proceeds from the issue of subordinated liabilities | 34 | ||
| Redemption of subordinated liabilities | 34 | ( | ( |
| Purchase of Rabobank Certificates | 31 | ( | ( |
| Sale of Rabobank Certificates | 31 | ||
| Payments on Rabobank Certificates and Capital Securities | ( | ( | |
| Redemption of Rabobank Certificates | ( | ||
| Redemption of Capital Securities | ( | ||
| Net cash flow from/ (used in) financing activities | ( | ( | |
| Net change in cash and cash equivalents | ( | ( | |
| Cash and cash equivalents at the beginning of the year | 6 | ||
| Exchange rate differences on cash and cash equivalents | ( | ||
| Cash and cash equivalents at the end of the year | 6 | ||
| The cash flows from interest are included in the net cash flow from operating activities1 | |||
| Interest received | |||
| Interest paid | ( | ( | |
- The 2024 received and paid interest figures were adjusted by including the correct accrued interest balances. Interest received decreased with EUR 478 million and interest paid with EUR 1,417 million.
Notes to the Consolidated Financial Statements
1 Corporate Information
2 Material Accounting Policies
2.1 Basis of Preparation
Rabobank's Consolidated Financial Statements have been prepared in accordance with IFRS Accounting Standards as adopted in the European Union (E.U.) and the applicable articles of Part 9 of Book 2 of the Dutch Civil Code. The consolidated financial statements have been prepared on the basis of the accounting policies set out in this section.
Amended Standards Issued by the International Accounting Standards Board (IASB) and Adopted in the E.U Which Apply in the Current Financial Year
Minor amendments have been made to IAS 21 The Effects of Changes in Foreign Exchange Rates which became effective for annual periods beginning on or after January 1, 2025. These amendments clarify the estimation of the spot exchange rate when a currency is not exchangeable. The implementation of these amendments did not affect profit or equity.
Amended Standards Issued by the IASB but not yet adopted in the E.U. Which Do Not Apply in the Current Financial Year
Amendments to IFRS 7 and IFRS 9 regarding the Classification and Measurement of Financial Instruments
The IASB amended requirements related to assessing contractual cash flow characteristics of financial assets, including those with environmental, social and governance (ESG)-linked contingent features, and settling financial liabilities using an electronic payment system. The IASB also amended disclosure requirements relating to investments in equity instruments designated at fair value through other comprehensive income and added disclosure requirements for financial instruments with contingent features that do not relate directly to basic lending risks and costs. These amendments will be effective for annual periods beginning on or after January 1, 2026.
Rabobank has provided financial assets with ESG-linked contingent features, predominantly via its mortgages and sustainability-linked loans where interest discounts are provided when certain ESG KPI’s are achieved by the client. As the cashflows of these financial assets with and without the contingent features are not significantly different, Rabobank does not expect that the implementation of these amendments changes the measurement category of these financial assets and therefore does not expect that these amendments affect profit or equity.
IFRS 18 Presentation and Disclosure in Financial Statements
This Standard sets out general and specific requirements for the presentation of information in the Statement(s) of Income, the Statement of Financial Position and the Statement of Changes in Equity. This Standard also sets out requirements for the disclosure of information in the notes. This Standard supersedes IAS 1 and will be effective for annual periods beginning on or after January 1, 2027. The implementation of this Standard will not affect profit or equity and will not change recognition or measurement of items in the financial statements, but it will impact the structure of the income statement and is expected to lead to more information about management-defined performance measures (MPMs) will be included such as a reconciliation of each MPM to the most comparable IFRS-specified subtotal.
IFRS 19 Subsidiaries without Public Accountability: Disclosures
This Standard is intended for subsidiaries without public accountability and specifies the disclosure requirements that such an entity is permitted to apply instead of the disclosure requirements in other IFRS Accounting Standards. This Standard will be effective for annual periods beginning on or after January 1, 2027. This standard is not applicable for Rabobank's consolidated financial statements.
Other amendments
Minor amendments have been made to IFRS 9 and IFRS 7 with regard to Contracts Referencing Nature-dependent Electricity and minor amendments to IFRS 1, IFRS 7, IFRS 9, IFRS 10 and IAS 7 have been made via the Annual Improvements Volume 11. These amendments will be effective for annual periods beginning on or after January 1, 2026. Although these new requirements are currently being analyzed and their impact is not yet known, Rabobank does not expect the implementation of these amendments to affect profit or equity.
Going Concern
The Managing Board considers it appropriate to adopt the going concern basis of accounting in preparing these financial statements. This is based on Rabobank’s medium-term planning (MTP) and budget process which supports the going concern assumption.
Judgments and Estimates
In preparing the consolidated financial statements management applied judgment with respect to estimates and assumptions that affects the amounts reported for assets and liabilities, the reporting of contingent assets and liabilities on the date of the consolidated financial statements, and the amounts reported for income and expenses during the reporting period. The accounting principles listed below require critical estimates that are based on assessments and assumptions. Although management estimates are based on the most careful assessment of current facts and circumstances on the basis of available financial data and information, the actual results may deviate from these estimates.
Impairment Allowances on Financial Assets
Rabobank applies three-stage expected credit loss impairment models for measuring and recognizing expected credit losses which involve management judgment. Rabobank uses estimates and management judgment to determine the expected credit losses for the model-based impairment allowances. In certain circumstances Rabobank applies Management Adjustments (MAs) in addition to the model outcomes; these are described in this section. The MAs often require a significant degree of management judgment.
Further information regarding the model-based impairment allowances is included in Section 4.3.6 "Judgments and estimates on Model Based Impairment Allowances on Financial Assets”. For credit-impaired financial assets that are assessed on an individual basis, a discounted cash flow calculation is performed. In many cases, judgment is required for the estimation of the expected future cash flows and the weighting of used scenarios (three).
MA Geopolitical Risk
The Geopolitical Risk MA of EUR 128 million (December 31, 2024: EUR 76 million) ) aims to cover the risk stemming from geopolitical tensions such as uncertainties around US tariffs, the war in Ukraine, conflicts in the Middle East and increasing tensions between US and China.
MA Mortgages
For mortgages (most notably for Interest Only mortgages (IOM)) the risk of future unaffordability is not fully reflected in the IFRS 9 model outcomes. The MAs for these future affordability risks have been re-assessed. As part of the MA mortgages, an IOM Backstop MA of EUR 5 million (December 31, 2024: EUR 7 million) has been recognized for clients for which no sufficient up to date information is available to assess future affordability. The total MA Mortgages increased to EUR 86 million (December 31, 2024: EUR 39 million) mainly due to including the expected LGD impact from concentration risk when IOM loans will mature. Ongoing supervisory scrutiny on IOM may affect future capital requirements and impairment levels.
MA Climate Risk: Livestock
The Livestock MA amounted to EUR 29 million (December 31, 2024: EUR 23 million), which is applied to the full Dutch livestock portfolio. Farmers in the livestock sector are scored on the profitability and sustainability of their business model, which determines the associated additional expected credit losses.
MA Climate Risk: Forward Looking Climate end Environmental (C&E) Risks
Risks are expected to mainly materialize in the future as regulation becomes more stringent, which introduces transition risks, and as a result of anticipated future chronic climate changes, increasing the probability and intensity of events such as droughts and floods (‘physical risks’). The Climate Risk MA covers this chronic increase in forward looking C&E risks and amounts to EUR 59 million (December 31, 2024: EUR 87 million). The MA covers the mortgage portfolio and the entire business loans portfolio including DLL. Furthermore, it is noted that a big part of the MA C&E Risks (EUR 26 million) is included directly in the new IFRS 9 model for the Corporate Portfolio, this largely explains the decrease.
MA new methodology for determining individually assessed stage3 exposures
For the individual provisions we have narrowed the scenario weightings to reduce biases due to individual judgment and enhance consistency. Per December 31, 2025 an MA of EUR 43 million (December 31, 2024: nil) is needed for the expected impact of the amended methodology for calculating stage 3 individual provisions for segment W&R.
MA for stage 3 corporate acquisition finance exposures
This new MA for stage 3 corporate acquisition finance (CAF) exposures with high leverage in segment DRB amounts to EUR 38 million (December 31, 2024: nil). These CAF loans are typically granted to clients backed by a Private Equity (PE) sponsor, resulting in an asset-light business model that relies more on cashflow–based lending rather than collateral as a risk mitigant. Management considers the IFRS 9 model outcome for this sub portfolio to be not fully sufficient, warranting an additional MA.
Other MAs
The total of the remainder of the MAs is EUR 67 million (December 31, 2024: EUR 105 million).
Fair Value of Financial Assets and Liabilities
Information regarding the determination of the fair value of financial assets and liabilities is included in Section 4.8 "Fair Value of Financial Assets and Liabilities" and Section 11 "Derivatives".
Impairment of Goodwill, Other Intangible Assets and Investments in Associates and Joint Ventures
The other intangible assets and the investments in associates and joint ventures are tested for impairment when specific triggers are identified; goodwill is tested at least once a year. When the recoverable value is lower than the carrying amount, an impairment loss is recognized. Determining the recoverable amount in an impairment assessment of these assets requires estimates based on quoted market prices, prices of comparable businesses, present value, or other valuation techniques, or a combination thereof, which necessitate management to make subjective judgments and assumptions. Because these estimates and assumptions could result in significant differences to the amounts reported if the underlying circumstances were to change, these estimates are considered to be critical. The important assumptions for determining recoverable value of goodwill are set out in Section 15 "Goodwill and Other Intangible Assets"; the assumptions for investments in associates and joint ventures are set out in Section 14 "Investments in Associates and Joint Ventures".
Taxation
Estimates are used when determining the income tax charge and the related current and deferred tax assets and liabilities. The tax treatment of transactions is not always clear or certain and, in a number of countries, prior year tax returns often remain open and subject to approval by the tax authorities for lengthy periods. The tax assets and liabilities reported here are based on the best available information, and where applicable, on external advice. Differences between the final outcome and the original estimates are accounted for in the current and deferred tax assets and liabilities in the period in which reasonable certainty is obtained.
Provisions
Judgment is involved in the application of IAS 37 when determining whether a present obligation exists and in estimating the probability, timing, and amount of any outflows. More information on judgments regarding provisions is included in Section 25 "Provisions" and for legal and arbitration proceedings in Section 4.9 “Legal and Arbitration Proceedings”.
2.2 Consolidated Financial Statements
2.2.1 Subsidiaries
The participating interests over which Rabobank has control are its subsidiaries (including structured entities) and these are consolidated. Control is exercised over a participating interest if the investor is entitled to receive variable returns from its involvement in the participating interest and has the ability to influence these returns through its power over the participating interest. The assets, liabilities and profit and loss of these companies are fully consolidated.
Subsidiaries are consolidated as from the date on which Rabobank acquires effective control and subsidiaries are deconsolidated as of the date on which this control is ceded. Transactions, balances and unrealized gains and losses on transactions between and among Rabobank and its subsidiaries are eliminated.
A list of principal subsidiaries is included in Section 50 "Principal subsidiaries".
2.2.2 Investments in Associates and Joint Ventures
Investments in associates and joint ventures are initially recognized at cost (including goodwill) and subsequently accounted for using the equity method of accounting. Rabobank's share of post-acquisition profits and losses is recognized in the statement of income and its share of post-acquisition movements in reserves is recognized directly in other comprehensive income. The cumulative post-acquisition movements are included in the carrying amount of the investment.
Associates are entities over which Rabobank can exercise significant influence and in which it generally holds between 20% and 50% of the voting rights but does not have control. A joint venture is an agreement between one or more parties under which the parties jointly have control and are jointly entitled to the net assets under the agreement. Unrealized profits on transactions between Rabobank and its associates and joint ventures are eliminated in proportion to Rabobank’s interest in the respective associates and joint ventures. Unrealized losses are also eliminated unless the transaction indicates that an impairment loss should be recognized on the asset(s) underlying the transaction.
2.3 Derivatives and Hedging
Derivatives generally comprise foreign exchange contracts, currency and interest rate futures, forward rate agreements, currency and interest rate swaps and currency and interest rate options (written or acquired). Derivatives are recognized at fair value (excluding transaction costs) determined on the basis of listed market prices (with mid-prices being used for EUR, USD and GBP derivatives that have a bid-ask range), prices offered by traders, discounted cash flow models and option valuation models based on current market prices and contract prices for the underlying instruments and reflecting the time value of money, yield curves and the volatility of the underlying assets and liabilities. Derivatives are included under assets if their fair value is positive and under liabilities if their fair value is negative.
Derivatives Not Used for Hedging
Realized and unrealized gains and losses on derivatives held for trading are recognized in "Gains/ (Losses) on Financial Assets and Liabilities at Fair Value through Profit or Loss".
Derivatives Used for Hedging
Derivatives are used for asset and liability management of interest rate risks, credit risks and foreign currency risks. Rabobank applies IFRS 9 for non-portfolio hedge accounting. IFRS 9 does not offer a solution for fair value hedge accounting for a portfolio hedge of interest rate risk. Rabobank opted to use the EU policy choice of IFRS 9 to continue to apply the IAS 39 for such portfolio hedge accounting (EU carve out).
At the time of inception of a hedge accounting relationship, derivatives are designated as one of the following: (1) a hedge of the fair value of an asset, a group of assets or a liability in the statement of financial position (fair value hedge); (2) a hedge of future cash flows allocable to an asset or liability in the statement of financial position, an expected transaction or a firm commitment (cash flow hedge); or (3) a hedge of a net investment in a foreign operation (net investment hedge). Hedge accounting is applied for derivatives designated in this manner provided that certain criteria are met, including the following:
Formal documentation of the hedging instrument, the hedged item, the objective of the hedge, the hedging strategy, and the hedge relationship;
Documentation of the assessment and analysis of the sources of hedge ineffectiveness and how the hedges ratio is determined (IFRS 9);
Effectiveness of 80% to 125% (IAS 39), in covering changes in the hedged item’s fair value to the hedged risks during the entire reporting period;
Continuous effectiveness from the moment of the hedge's inception; and
An economic relationship between the hedged item and hedging instrument (IFRS 9).
1. Derivatives Used for Fair Value Hedge Accounting
Changes in the fair value of derivatives that are designated as fair value hedges and are effective in terms of the hedged risks are recognized in the statement of income in "Gains/ (Losses) on Financial Assets and Liabilities at Fair Value through Profit or Loss’" together with the corresponding changes in the fair values of the assets or liabilities hedged.
As and when the hedge no longer meets the criteria for hedge accounting (applying the fair value hedge model), the cumulative adjustment to the fair value of a hedged interest-bearing financial instrument is amortized through profit and loss over the relevant interest repricing period.
2. Derivatives Used for Cash Flow Hedge Accounting
Changes in the fair value of derivatives that are designated (and qualify) as cash flow hedges and that are effective in relation to the hedged risks are recognized in other comprehensive income. Ineffective elements of the changes in the fair value of derivatives are recognized in the statement of income. Deferred amounts included in other comprehensive income are taken to the statement of income in "Gains/ (Losses) on Financial Assets and Liabilities at Fair Value through Profit or Loss" in the periods during which the hedged expected cash flows affect the statement of income.
3. Derivatives Used for Net Investment Hedge Accounting
The hedging instruments used to hedge net investments in foreign operations are measured at fair value, with changes in the fair value being recognized in other comprehensive income for the portion that is determined to be an effective hedge. Changes in the hedged equity instrument resulting from exchange-rate fluctuations are also recognized in other comprehensive income. Gains and losses accumulated in other comprehensive income are reclassified to profit or losses when the equity instrument is disposed of.
4. Costs of Hedging
The cross-currency basis spreads of cross-currency interest rate swaps and (resettable) cross-currency basis swaps in hedge accounting relationships designated with issued debt securities and loans (intra group monetary items between entities with a different functional currency) at amortised cost in foreign currency is excluded from designation. The cross-currency basis spread volatility is taken through other comprehensive income as costs of hedging and is reclassified to profit or loss in the same periods as when the hedged expected future cash flows affect profit or loss until maturity of the issued bond or loan.
Although derivatives are used as economic hedges under Rabobank’s managed risk positions, certain derivative contracts do not qualify for hedge accounting under the specific IFRS rules. Interest on derivatives held for economic hedging purposes are shown under interest expense, both the receive and pay leg of the derivative.
2.4 Financial Assets and Liabilities Held for Trading
Financial assets held for trading are financial assets acquired with the objective of generating profit from short-term fluctuations in prices or trading margins or they are financial assets that form part of portfolios characterized by patterns of short-term profit participation. Financial assets held for trading are recognized at fair value based on listed bid prices and all realized and unrealized results therefrom are recognized in"Gains/ (Losses) on Financial Assets and Liabilities at Fair Value through Profit or Loss’. Interest earned on financial assets is recognized as interest income. Dividends received from financial assets held for trading are recognized in "Gains/ (Losses) on Financial Assets and Liabilities at Fair Value through Profit or Loss’.
Financial liabilities held for trading are mainly negative fair values of derivatives and delivery obligations that arise on the short selling of securities. Securities are sold short to realize gains from short-term price fluctuations. The securities needed to settle short sales are acquired through securities lending and repurchasing agreements. Securities sold short are recognized at fair value on the reporting date.
2.5 Financial Assets and Financial Liabilities Designated at Fair Value
On initial recognition, financial assets and financial liabilities may be classified as "Financial Assets and Liabilities designated at Fair Value" if this accounting eliminates or significantly reduces any inconsistent treatment that would otherwise have arisen upon measurement of the assets or liabilities or recognition of profits or losses on the basis of different accounting policies.
Interest earned and due on such assets and liabilities is recognized as interest income and expense, respectively. Other realized and unrealized gains and losses on the revaluation of these financial instruments to fair value are recognized in "Gains/ (Losses) on Financial Assets and Liabilities at Fair Value through Profit or Loss" except for fair value changes due to own credit risk of financial liabilities designated at fair value. These fair value changes after tax are presented in other comprehensive income (OCI) under line item "Fair Value Changes Due to Own Credit Risk on Financial Liabilities Designated at Fair Value". Presenting these effects of changes in credit risk in OCI does not create or enlarge an accounting mismatch in profit or loss.
2.6 Day One Gains/ Losses
When using fair value accounting at the inception of a financial instrument, any positive or negative difference between the transaction price and the fair value (referred to as "day one gain/ loss") is accounted for immediately under "Gains/ (Losses) on Financial Assets and Liabilities at Fair Value through Profit or Loss" where the valuation method is based on observable inputs from active markets. In all other cases, the entire day one gain/loss is deferred and accounted for as "Other liabilities" or "Other assets". After initial recognition the deferred day one gain/ loss is recognized as a gain/ loss to the extent it results from a change in a factor (including time effects).
2.7 Financial Assets at Fair Value Through Other Comprehensive Income
Debt instruments that are held for collection of contractual cash flows and for selling the financial assets, where the assets’ cash flows solely represent payments of principal and interest on the principal amount outstanding, are measured at fair value through other comprehensive income and presented as "Financial Assets at Fair Value through Other Comprehensive Income".
Financial assets at fair value through other comprehensive income are initially recognized at fair value, including transaction costs. The fair values of unlisted equity instruments are estimated on the basis of appropriate price/earnings ratios and adjusted to reflect the specific circumstances of the respective issuer.
Movements in the carrying amount are taken through OCI, except for the recognition of impairment losses, interest income and foreign exchange gains and losses which are recognized in profit or loss. When the financial asset is derecognized, the cumulative gain or loss previously recognized in OCI is reclassified from equity to profit or loss. Interest from these financial assets is included in net interest income using the effective interest rate method.
Impairment losses are included in "Impairment Charges on Financial Assets" in the statement of income.
Where Rabobank has elected to present fair value gains and losses on equity investments in OCI, there is no subsequent reclassification of fair value gains and losses to profit or loss following the derecognition of the investment. Dividends from such investments continue to be recognized in profit or loss as other income when Rabobank’s right to receive payments is established.
2.8 Repurchase Agreements and Reverse Repurchase Agreements
Financial assets that are sold subject to related sale and repurchase agreements are included in the consolidated statement of financial position under "Financial Assets Held for Trading" or "Financial Assets at Fair Value through Other Comprehensive Income", as applicable. The liability to the counterparty is included under "Deposits from Credit Institutions" or "Deposits from Customers", as applicable.
Financial assets acquired under reverse sale and reverse repurchase agreements are not recognized in the consolidated statement of financial position. The consideration paid to purchase financial assets is recognized as "Loans and Advances to Credit Institutions" or "Loans and Advances to Customers", as applicable. The difference between the sales and repurchasing prices is recognized as interest income or expense over the term of the agreement using the effective interest method.
2.9 Securitizations and (De)Recognition of Financial Assets and Liabilities
Recognition of Financial Assets and Liabilities
Purchases and sales of financial assets and liabilities at fair value through profit or loss and financial assets at fair value through other comprehensive income which are required to be delivered within a regulatory-prescribed period or in accordance with market conventions are recognized on the transaction date. Financial instruments carried at amortized cost are recognized on the settlement date.
Securitizations and Derecognition of Financial Assets and Liabilities
Rabobank securitizes and sells various financial assets. These assets are sometimes sold to a special purpose entity (SPE) which then issues securities to investors. Rabobank has the option of retaining an interest in these assets in the form of subordinated interest-only strips, subordinated securities, spread accounts, servicing rights, guarantees, put and call options or other constructions.
A financial asset (or a portion thereof) is derecognized where:
The rights to the cash flows from the asset expire;
The rights to the cash flows from the asset and substantially all the risks and rewards of ownership of the asset are transferred;
A contractual obligation is assumed to transfer the cash flows from the asset and substantially all the risks and rewards have been transferred; or
Substantially all the risks and rewards are neither transferred nor retained but where control over the asset is not retained.
Continuing involvement is recognized if Rabobank neither retains nor transfers substantially all the risks and rewards and control is retained. The asset is recognized to the extent of Rabobank's continuing involvement in it. A financial liability or a part thereof is derecognized if it ceases to exist, i.e. after the contractual obligation has been fulfilled or cancelled or after it has expired.
Where a transaction does not meet these conditions for derecognition, it is recognized as a financial asset for which security has been provided. To the extent that the transfer of a financial asset does not qualify for derecognition, Rabobank’s contractual rights are not separately recognized as derivatives if recognition of these instruments and the transferred asset, or the liability arising from the transfer, were to result in the double recognition of the same rights and obligations.
Profits and losses on securitizations and sale transactions depend partly on the carrying amounts of the assets transferred. The carrying amounts of these assets are allocated to the interests sold and retained using the relative fair values of these interests on the date of sale. Any gains and losses are recognized through profit and loss at the time of transfer. The fair value of the interests sold and retained is determined based on listed market prices or as the present value of the future expected cash flows based on pricing models that involve several assumptions regarding credit losses, discount rates, yield curves, payment frequency or other factors.
2.10 Cash and Cash Equivalents
Cash equivalents are highly liquid short-term assets held at central banks to meet current cash obligations rather than for investments or other purposes. These assets have terms of less than 90 days from inception. Cash equivalents are readily convertible to known amounts of cash and are subject to an insignificant risk of changes in value.
2.11 Offsetting Financial Assets and Liabilities
Where there is legal right to offset recognized amounts and it is intended to settle the expected future cash flows on a net basis or to realize the asset and settle the liability simultaneously, financial assets and liabilities are offset and the net amount is recognized in the statement of financial position. This relates predominantly to derivatives and reverse repurchase agreements. The offsetting of taxes is addressed in Section 2.26 "Tax".
2.12 Foreign Currency
Foreign Entities
Transactions and balances included in the financial statements of individual entities within Rabobank are reported in the currency that best reflects the economic reality of the individual entity’s underlying operating environment (the functional currency).
The consolidated financial statements are presented in euros, which is the parent company’s functional currency. The statements of income and cash flows of foreign operations are translated into Rabobank’s presentation currency at the exchange rates prevailing on the transaction dates, which approximate the average exchange rates for the reporting period. The statements of financial position are translated at the rates prevailing at the end of the reporting period. Exchange differences arising on net investments in foreign operations and on loans and other currency instruments designated as hedges of these investments are recognized in other comprehensive income. Upon the sale of a foreign operation, these translation differences are transferred to the statement of income as part of the profit or loss on the sale.
Foreign Currency Transactions
Transactions in foreign currencies are translated into the functional currency at the exchange rates prevailing on the transaction dates. Differences arising on the settlement of transactions or on the translation of monetary assets and liabilities denominated in foreign currencies are recognized in the statement of income as foreign exchange gains and losses and differences that qualify as net investment hedges are recognized in other comprehensive income. Translation differences on non-monetary items measured at fair value through profit or loss are recognized as part of the fair value gains or losses. Translation differences on non-monetary assets at fair value through other comprehensive income are included in the revaluation reserves for equity instruments at fair value through other comprehensive income.
2.13 Interest
Interest income and expense are recognized in the statement of income using the effective interest method. This method is used for calculating the amortized cost of a financial asset or a financial liability and for allocating the interest income or interest expense to the relevant period. The calculation includes all fees paid or received between parties to the contract that are an integral part of the effective interest rate, transaction costs, and all other premiums or discounts. Interest income is calculated by applying the effective interest rate to the gross carrying amount of a financial asset except for credit-impaired financial assets. For those financial assets, Rabobank applies the effective interest rate to the amortized cost of the financial asset in subsequent reporting periods. Interest income on financial assets using the effective interest method includes interest income on "Cash and Cash Equivalents", "Loans and Advances to Credit Institutions", "Loans and Advances to Customers", "Financial Assets at Fair Value through Other Comprehensive Income" and "Derivatives used for Fair Value Hedge Accounting". Interest on derivatives held for economic hedging purposes are shown under interest expense, both the receive and pay leg of the derivative. Interest on financial liabilities with a negative interest rate are presented as interest income. Interest on financial assets with a negative interest are presented as interest expense.
2.14 Fees and Commissions
Rabobank earns fee and commission income from a diverse range of services it provides to its customers. Commissions earned for the provision of services such as payment services, insurance intermediation, and advisory fees are generally recognized as the service is provided. Commissions received for negotiating a transaction or for involvement in negotiations on behalf of third parties (for example the acquisition of a portfolio of loans, shares or other securities or the sale or purchase of companies) are recognized upon completion of the underlying transaction. Fee and commission expenses mainly relate to payment services and are recognized over the period in which the services were received.
2.15 Loans and Advances to Customers and Loans and Advances to Credit Institutions
Financial assets that are held for collection of contractual cash flows where those cash flows represent solely payments of principal and interest on the principal amount outstanding are measured at amortized cost and presented as "Loans and Advances to Credit Institutions" or "Loans and Advances to Customers". At initial recognition, Rabobank measures these financial assets at its fair value plus transaction costs that are directly attributable to the acquisition of the financial asset.
Interest income from these financial assets is included in net interest income using the effective interest rate method. Any gain or loss arising on derecognition is recognized directly in profit or loss and presented in "Gains/ (Losses) Arising from the Derecognition of Financial Assets Measured at Amortized Cost".
Impairment losses are included in "Impairment Charges on Financial Assets" in the statement of income.
2.16 Impairment Allowances on Financial Assets and Credit Related Contingent Liabilities
Impairment allowances apply to financial assets at amortized cost and financial assets at fair value through OCI, as well as to lease receivables, contract assets, trade receivables, certain loan commitments and financial guarantees. At initial recognition, an allowance is formed for the amount of the expected credit losses from possible defaults in the coming 12 months (stage 1). If credit risk increased significantly since origination (but remains non-credit impaired), an allowance is required for the amount that equals the expected credit losses stemming from possible defaults during the expected lifetime of the financial asset (stage 2). If the financial instrument becomes credit-impaired the allowance will remain at the Lifetime ECL (stage 3). For these instruments the interest income is recognized by applying the effective interest rate on the net carrying amount (including the impairment allowance). Financial instruments become credit-impaired when one or more events have occurred that had a detrimental impact on estimated future cash flows. Rabobank does not use the low credit risk exemption.
Two fundamental drivers of the IFRS 9 impairments requirements are a) the methodology for the measurement of 12-Month and Lifetime Expected Credit Losses and b) the criteria used to determine whether a 12-month ECL, Lifetime ECL non-credit-impaired, or Lifetime ECL credit-impaired should be applied (also referred to as stage determination criteria).
a) Methodology to Determine Expected Credit Losses
In order to determine ECLs Rabobank utilizes point-in-time Probability of Default (PD) x Loss Given Default (LGD) x Exposure at Default (EAD) models for the majority of the portfolio in scope. Three macro-economic scenarios are incorporated into these models and probability weighted in order to determine the expected credit losses. When unexpected external developments or data quality issues are not sufficiently covered by the outcome of the ECL models, a management adjustment will be made (refer to paragraph 2.1 under Judgement and Estimates).
b) Stage Determination Criteria
In order to allocate financial instruments in scope between stage 1, stage 2 and stage 3 Rabobank has a framework of qualitative and quantitative factors. The criteria for allocating a financial instrument to stage 3 are aligned with the criteria for assigning a defaulted status, for example 90 days past due status, or if a debtor is likely to become unable to pay its credit obligations without liquidation of collateral by the bank. In order to allocate financial instruments between stages 1 and 2, Rabobank assesses whether the credit risk on financial instruments has increased significantly since initial recognition (SICR).
For portfolios without individual PDs or with PDs that are not updated on a frequent basis such that an assessment of the change in PD is not possible, a collective assessment on groups of financial instruments with shared credit risk characteristics is made.
Significant Increases in Credit Risk (SICR)
At each reporting date, Rabobank assesses whether the credit risk on financial instruments has increased significantly since initial recognition. The main parameter taken into account in the SICR assessment for financial instruments is the lifetime probability of default and its development from origination to reporting date. A relative change that is above a certain threshold in combination with an absolute threshold are considered to be indicators for a significant increase in credit risk. For loan commitments, Rabobank considers changes in the lifetime probability of default occurring on the loan to which a loan commitment relates. For financial guarantee contracts, Rabobank considers the changes in the risk that the specified debtor will default on the contract. The assessment of changes in credit risk analysis is a multifactor and holistic analysis. Whether a specific factor is relevant (and its weight compared to other factors) depends on the type of product, characteristics of the financial instruments and the borrower as well as the geographical region. Refer to paragraph 4.5 ‘Criteria for identifying a significant increase in credit risk’ for more information on relative and absolute PD thresholds.
Rabobank also relies on a number of qualitative indicators to identify and assess SICR. These include:
Internal credit rating: Financial difficulties (situation where the client is facing or about to face difficulties in meeting its financial commitments)
Forbearance status for non-defaulted exposures
30 days past due
Vulnerable sector
Default Definition
Rabobank’s definition of default is entirely based on external EU regulation (CRR and EBA). This means that a default is assigned when i) an exposure is more than 90 days materially past due, or when ii) Rabobank considers that the obligor is unlikely to pay its credit obligations in full, without recourse by the institution to actions such as realizing security.
Collective Versus Individual Assessment
Some factors or indicators may not be identifiable on an individual instrument level. In that case, the factors or indicators are assessed for appropriate portfolios, groups of portfolios or a portion of a portfolio to determine whether the requirements for recognition of lifetime ECL have been met. The aggregation of financial instruments to assess whether there are changes in credit risk on a collective basis may change over time when new information becomes available on groups of, or individual, financial instruments.
Depending on the nature of the financial instruments and the credit risk information available for particular groups of financial instruments, Rabobank may not be able to identify SICR for an individual instrument before that instrument becomes past due. This may be the case for financial assets (such as retail loans) for which there is little or no updated credit risk information routinely obtained and monitored on an individual instrument level until a customer breaches the contractual terms. If changes in the credit risk for an individual instrument are not captured before it becomes past due, a loss allowance based solely on credit information at an individual instrument level would not faithfully represent the changes in credit risk since initial recognition.
In some circumstances, Rabobank has no reasonable and supportable information available without undue cost or effort to measure lifetime ECL on an individual instrument basis. Lifetime ECL is then recognized by collectively considering comprehensive credit risk information, which not only incorporates past due information but also all relevant credit information (including forward-looking macro-economic information) to approximate the result of recognizing lifetime ECL when there has been a SICR since initial recognition.
For the purpose of determining SICR and recognizing a loss allowance on a collective basis, Rabobank may group financial instruments based on shared credit risk characteristics with the objective of facilitating an analysis designed to enable SICR to be identified in a timely fashion. However, when Rabobank is unable to group those financial instruments for which the credit risk is considered to have increased significantly since initial recognition based on shared credit risk characteristics, it recognizes lifetime ECL on a portion of the financial instruments for which credit risk is deemed to have increased significantly.
Shared credit risk characteristics may include but are not limited to: instrument types, credit risk ratings, collateral types, initial recognition dates, remaining terms to maturity, industries, geographic location, collateral value relative to the financial instrument if it has an impact on the PD (e.g. non-recourse loans in some jurisdictions or LTV ratios).
2.17 Modifications
The contractual terms of a financial asset may be modified for a commercial reason or due to a forbearance measure. A commercial modification is a change to the previous terms and conditions of a contract (financial asset) that alters the timing or amount of the contractual cash flows of the financial asset. Rabobank typically considers a modification as non-substantial if it does not impact multiple aspects of the contract at the same time, for example a change in the fixed interest period, repayment type or obligors. At Rabobank, forbearance measures are normally non-substantial modifications.
Substantial modifications lead to a derecognition of the financial asset and non-substantial modifications lead to modification accounting. In the event of modification accounting, Rabobank recalculates the gross carrying amount based on the revised cash flows of the financial asset and recognizes a modification gain or loss in profit or loss. The new gross carrying amount is recalculated by discounting the modified cash flows at the original effective interest rate.
2.18 Goodwill and Other Intangible Assets
Goodwill
Goodwill is the amount by which the acquisition price paid for a subsidiary exceeds the fair value on the date on which the share of net assets and contingent liabilities of the entity was acquired. With each acquisition, the other non-controlling interests are recognized at fair value or at its share of the identifiable assets and liabilities of the acquired entity. Tests are performed annually, or more frequently if indications so dictate, to determine whether there has been an impairment.
Other Intangible Assets, including software development costs
Costs directly incurred in connection with identifiable and unique software products over which Rabobank has control and which will likely provide economic benefits exceeding the costs for longer than one year are recognized as other intangible assets. Direct costs include the personnel costs of the software development team, financing costs and an appropriate portion of the relevant overhead.
Expenditures that improve the performance of software as compared with their original specifications are added to the original cost of the software. Software development costs are recognized as other intangible assets and are amortized on a straight-line basis over a period not exceeding five years. Costs related to the maintenance of software are recognized as an expense at the time they are incurred.
Impairment Losses on Goodwill
Goodwill is allocated to cash-generating units for the purpose of impairment testing, which is undertaken at the lowest level of assets that generate largely independent cash inflows. During the fourth quarter of each financial year, or more frequently if there are indications of impairment, goodwill is tested for impairment and any excess of carrying amount over recoverable amount is provided. The recoverable amount is the higher of the value in use and the fair value less selling costs.
The value in use of a cash flow generating unit is determined as the present value of the expected future pre-tax cash flows of the cash flow generating unit in question. The key assumptions used in the cash flow model depend on the input data and they reflect various judgmental financial and economic variables, such as risk-free interest rates and premiums reflecting the risk inherent in the entity concerned. Impairments of goodwill are included in "Impairment losses on goodwill" in the statement of income, if applicable.
Impairment Losses on Other Intangible Assets
At each reporting date, an assessment is made as to whether there are indications of impairment of other intangible assets. If there are such indications, impairment testing is carried out to determine whether the carrying amount of the other intangible assets is fully recoverable. The recoverable amount shall be estimated for the individual asset. If it is not possible to estimate the recoverable amount of the individual asset, the recoverable amount of the cash generating unit to which the asset belongs is determined. An impairment loss is recognized if the carrying amount exceeds the recoverable amount. Impairment losses and impairment reversals are included in "Other Administrative Expenses" in the statement of income.
Regardless of any indication of impairment, intangible assets not yet available for use are tested for impairment annually by comparing their carrying amount with their recoverable amount.
2.19 Property and Equipment
Property and Equipment for Own Use
Property for own use consists mainly of office buildings and is recognized at cost less accumulated depreciation and impairment, as is equipment for own use. Assets are depreciated to their residual values over the following estimated useful lives on a straight-line basis:
| Property | |
| - Land | Not depreciated |
| - Buildings | 25 - 40 years |
| Equipment | |
| - Computer equipment | 1 - 5 years |
| - Other equipment and vehicles | 3 - 8 years |
An annual assessment is made as to whether there are indications of impairment of property and equipment. If the carrying amount of an asset exceeds its estimated recoverable amount, the carrying amount is written down to the recoverable amount. Impairment losses and impairment reversals are included in "Other Administrative Expenses" in the statement of income. Gains and losses on the disposal of property and equipment are determined on the basis of their carrying amounts and are included in "Other Administrative Expenses".
Repair and maintenance work is charged to the statement of income at the time the costs are incurred. Expenditures to extend the economic life or increase the economic value of land and buildings as compared with their original economic value are capitalized and subsequently depreciated.
2.20 Investment Properties
Investment properties, primarily office buildings and housing units, are held for their long-term rental income and are not used by Rabobank or its subsidiaries. Investment properties are recognized as long-term investments and included in the statement of financial position at cost net of accumulated depreciation and impairment. Investment properties are depreciated on a straight-line basis to their residual values over an estimated useful life of 40 years.
2.21 Other Assets
Structured Inventory Products
Rabobank offers several products that relate to financing commodities. Some of these products are recognized as loans with commodities as collateral, others as loans with embedded derivatives and others as commodities. The classification is mainly dependent on the transfer of risk and rewards of the commodity from the client to Rabobank.
Building Sites
Building sites are carried at cost, including allocated interest and additional expenses for purchasing the sites and making them ready for construction or, if lower, the net realizable value. Interest is not recognized in the statement of financial position for land which has not been zoned for a particular purpose if there is no certainty that the land will be built on. Possible decreases in value as a result of future change of designated use of the relevant land are not included in the cost of land, but are included in the determination of the net realizable value.
The net realizable value of all building sites is reviewed at least once a year or earlier, in case of any indications of impairment. The net realizable value for building sites is the direct realizable value or, if higher, the indirect realizable value. The direct realizable value is the estimated value upon sale less the estimated costs for achieving the sale. The indirect realizable value is the estimated sale price within the context of normal operations less the estimated costs of completion and the estimated costs necessarily incurred to realize the sale. The calculation of the indirect realizable value is based on an analysis of scenarios that includes as many site-specific aspects and company-specific parameters and conditions as possible. A write-down is recognized if the carrying value exceeds the net realizable value.
Properties on building sites are classified as investment property if the current use of Rabobank is leasing them out under one or more operating leases.
Work in Progress
Work in progress concerns unsold residential projects under construction or in preparation, as well as unsold commercial property projects. Work in progress is carried at the costs incurred plus allocated interest or, if lower, the net realizable value. Revenues from projects for the construction of real estate are recognized when the related performance obligations are satisfied. Expected losses on projects are immediately deducted from the work in progress. If Rabobank transfers (parts of) a project to a customer before the customer pays instalments, Rabobank recognizes a contract asset. If a customer pays instalments, or if Rabobank has an unconditional right to instalments, Rabobank recognizes a contract liability, before transferring (parts of) a project to a customer.
The carrying amount of unsold work in progress is reviewed annually for indications of a decline in value. If there is such an indication, the indirect realizable value of the work in progress is estimated; in most cases this is done by means of an internal or external appraisal. The indirect realizable value is the estimated sale price within the context of normal operations less the estimated costs of completion and the estimated costs necessarily incurred to realize the sale. A downward value adjustment is recognized if the carrying value exceeds the expected indirect net realizable value, to the extent that this difference must be borne by Rabobank.
Finished Properties
Unsold residential and commercial properties developed in-house are carried at cost or, if lower, the net realizable value. The net realizable value of finished properties is reviewed at least once a year or if there are any indications for a decline in value. For finished properties, the net realizable value is generally equal to the direct realizable value, which is mostly determined by means of an internal or external appraisal. A downward value adjustment is recognized if the carrying value exceeds the expected direct net realizable value, to the extent that the difference is for Rabobank's account.
2.22 Leasing
Rabobank as Lessee
As a lessee, Rabobank recognizes a right-of-use asset representing its right to use the underlying leased asset and a corresponding liability representing its obligation to make lease payments at the date on which the leased asset is available for use. Each lease payment is allocated between the lease liability and interest expense. The interest expenses are charged to profit or loss over the lease period so as to produce a constant periodic rate of interest on the remaining balance of the liability for each period. The right-of-use assets are depreciated over the lease term on a straight-line basis. The lease liability is measured at the present value of the lease payments. The lease payments comprise the following payments for the right to use the underlying asset during the lease term that are not paid at the commencement date:
Fixed payments less any lease incentives received;
Variable lease payments that depend on an index or a rate, initially measured using the index or rate as at the commencement date;
Amounts expected to be payable by the lessee under residual value guarantees;
The exercise price of a purchase option if the lessee is reasonably certain to exercise that option; and
Payments of penalties for terminating the lease, if the lease term reflects the lessee exercising an option to terminate the lease.
The present value of the lease payments is determined by using the interest rate implicit in the lease. If that rate cannot be determined, the lessee’s incremental borrowing rate is used, which is the rate that the lessee would have to pay to borrow the funds necessary to obtain an asset of similar value in a similar economic environment with similar terms and conditions. Rabobank defines the incremental borrowing rate as the internal funding rate (Funds Transfer Pricing (FTP) rate) plus an asset-specific premium.
By using the FTP rate as a basis the discount rate is defined for each time bucket and consists of the following elements:
Base rate: the risk-free rate;
Credit spread: based on credit risk of the group company;
Country specific risk: based on location of the group company; and
Currency risk: based on the functional currency of the group company;
The right-of-use asset is measured at an amount equal to the lease liability, adjusted by the lease payments made at or before the commencement date less any lease incentives received and any initial direct costs and restoration costs. Payments associated with short-term leases and leases of low-value assets are recognized on a straight-line basis as an expense in profit or loss. Short-term leases are leases with a lease term of 12 months or less. Rabobank recognizes the right-of-use assets as part of the line-item Property and Equipment and the lease liability as part of line-item Other Liabilities in the consolidated statement of financial position.
Rabobank as Lessor
Finance Leases
A finance lease is recognized as a receivable under "Loans and Advances to Credit Institutions" or "Loans and Advances to Customers", as applicable, at an amount equal to the net investment in the lease. The net investment in the lease is the present value of the nominal minimum lease payments and the unguaranteed residual value. The difference between the gross investment and the net investment in the lease is recognized as unearned finance income. Lease income is recognized as interest income over the term of the lease using the net investment method, which results in a constant rate of return on the investment.
Operating Leases
Assets leased under operating leases are included in the statement of financial position under "Property and Equipment". The assets are depreciated over their expected useful lives in line with those of comparable items of property and equipment. Rental income (fewer write-offs and discounts granted to lessees) is recognized under "Net Income from Other Operating Activities" on a straight-line basis over the term of the lease.
2.23 Provisions and Contingent Liabilities
Provisions
Provisions are recognized for obligations (both legal and constructive) arising as a result of a past event where it is probable that an outflow of resources will be required to settle the obligation and the amount of the obligation can be reliably estimated. If Rabobank expects a provision to be reimbursed, for example under an insurance policy, the reimbursement is recognized as a separate asset but only if the reimbursement is virtually certain. The provisions are carried at the discounted value of the expected future cash flows. The additions to and releases of provisions are recognized in the statement of income under "Other Administrative Expenses".
Restructuring
Restructuring provisions comprise payments under redundancy schemes and other costs directly attributable to restructuring programs. These costs are recognized during the period in which the legal or actual payment obligation arises, a detailed plan has been prepared for redundancy pay and there are realistic expectations among the affected parties that the restructuring will be implemented.
Legal Issues
The provision for legal issues is based on the best estimates available at the end of the reporting period, taking legal advice into account. The timing of the cash outflow of these provisions is uncertain because the outcome of the disputes and the time involved are unpredictable.
Other Provisions
Other provisions include provisions for onerous contracts, potential settlements, and credit related contingent liabilities. See Section 2.16 for the accounting policy of impairment allowances on credit related contingent liabilities.
Contingent liabilities
A contingent liability is a possible obligation that arises from past events and whose existence will be confirmed only by the occurrence or non-occurrence of one or more uncertain future events not wholly within the control of Rabobank; or a present obligation that arises from past events but is not recognized because it is either not probable that an outflow of economic benefits will be required to settle the obligation or the amount of the obligation cannot be measured reliably. Contingent liabilities are not recognized in the statement of financial position, but are rather disclosed in the notes unless the possibility of the outflow of economic benefits is remote.
2.24 Employee Benefits
Rabobank has various pension plans in place based on the local conditions and practices of the countries in which it operates. In general, the plans are financed by payments to insurance companies or to trustee administered funds determined by periodic actuarial calculations. A defined benefit pension plan is one that incorporates an obligation to pay an agreed amount of pension benefit, which is usually based on several factors such as age, number of years’ service and remuneration. A defined contribution plan is one in which fixed contributions are paid to a separate entity (a pension fund) with no further legal or constructive obligation on the part of the employer should the fund have insufficient assets to settle its obligations to employee-members of the plan.
Pension Obligations
The obligation under defined benefit pension plans is the present value of the defined benefit pension obligation at the end of the reporting period reduced by the fair value of the fund investments. The defined benefit obligation is calculated annually by independent actuaries based on the projected unit credit method. The present value of the defined benefit obligation is determined as the estimated future outflow of cash funds based on the interest rates of high-quality corporate bonds with terms that approximate those of the corresponding obligation. The majority of pension plans are career-average plans. The costs of these plans (being the net pension charge for the period after deducting employee contributions and interest) are included under ‘Staff costs’. Net interest expense/income is determined by applying the discount rate at the beginning of the reporting period to the asset or liability of the defined benefit pension plan.
Actuarial gains and losses arising from events and/or changes in actuarial assumptions are recognized in the statement of comprehensive income.
Defined Contribution Plans
Under defined contribution plans, contributions are paid into publicly or privately managed pension insurance plans on a compulsory, contractual or voluntary basis. These regular contributions are recognized as expense in the year in which they are due and they are included under "Staff costs".
Other Post-Employment Obligations
Some of Rabobank’s business units provide other post-employment benefits. To become eligible for such benefits, the usual requirement is that the employee remains in service until retirement and has been with the company for a minimum number of years. The expected costs of these benefits are accrued during the years of service, based on a system similar to that for defined benefit pension plans. The obligations are calculated annually by independent actuaries.
Variable Remuneration
Variable remuneration payable unconditionally and in cash is recognized in the year in which the employee renders the service. Conditional cash remuneration is included, on a straight line basis, in staff costs in the statement of income over the period of the year in which the employee’s services are received and the remaining three years of the vesting period (i.e. over four years). The liability is recognized in "Other liabilities". The accounting treatment of payments based on equity instruments is disclosed in Section 2.25.
2.25 Variable Remuneration Based on Equity Instruments
For certain identified staff, remuneration for services rendered is settled in the form of cash payments based on equity instruments that are similar to, and have the same characteristics as, Rabobank Certificates. The costs of the services received are based on the fair value of the equity instruments on the award date and are restated annually to fair value. The costs related to the award of equity instruments during the period of the employee’s contract are included in staff costs in the statement of income over the period of the year of award and the remaining three years of the vesting period of the equity instruments (i.e. over four years). The liability is recognized in "Other liabilities".
2.26 Tax
Current tax receivables and payables are offset where there is a legally enforceable right to offset and where simultaneous treatment or settlement is intended. Deferred tax assets and liabilities are offset where there is a legally enforceable right to offset and where they relate to the same tax authority and arise within the same taxable entity.
Deferred income tax is provided, using the liability method, on temporary differences between the tax bases of assets and liabilities and their carrying amounts for financial reporting purposes. These temporary differences arise primarily on depreciation of tangible fixed assets, revaluation of certain financial assets and liabilities (including derivatives), employee benefits, loan impairment allowances and other impairments, tax losses and fair value adjustments to net assets acquired in business combinations. Deferred tax assets and liabilities are also recognized on the revaluation of financial assets at fair value through other comprehensive income and cash flow hedges that are taken directly to other comprehensive income. When realized, they are recognized in the statement of income at the same time as the respective deferred gain or loss is recognized. Deferred tax assets are recognized to the extent that it is probable that future taxable profits will be available against which the losses can be utilized and are measured at the tax rates that have been enacted or substantively enacted as at the reporting date. In case of a history of recent losses, deferred tax assets arising from unused tax losses are recognized only to the extent that sufficient taxable temporary differences exist or there is convincing other evidence that sufficient taxable profit will be available against which the unused tax losses can be utilized. Rabobank considers all deferred taxes to be non-current.
Taxes on profit are calculated in accordance with the tax legislation of the relevant jurisdictions in which Rabobank operates and are recognized as an expense in the period in which the profit is realized. The tax effects of loss carry forwards are recognized as an asset if it is probable that future taxable profits will be available against which the losses can be utilized.
2.27 Deposits from Credit Institutions, Deposits from Customers and Debt Securities in Issue
These liabilities are initially recognized at fair value, which is the issue price minus transaction costs that are directly attributable to the issue, and thereafter at amortized cost. Own issued debt securities that are repurchased are derecognized, and the difference between the carrying amount and the consideration paid is recognized in the statement of income.
2.28 Rabobank Certificates
The proceeds of the issue of Rabobank Certificates are available to Rabobank in perpetuity and are subordinate to all liabilities and to the Capital Securities. As there is no obligation to (re)pay the principal or to pay dividend, the Rabobank Certificates are classified as equity. As the payment of distributions is wholly discretionary, the proceeds received and dividends paid on them are recognized directly in equity.
2.29 Capital Securities
As there is no obligation to (re)pay the principal or to pay dividend, the Capital Securities are classified as equity and dividends paid on these instruments are recognized directly in equity.
2.30 Financial Guarantees
Financial guarantee contracts require the issuer to compensate the holder for losses incurred when the debtor fails to meet its obligations under the terms of the related debt instrument. The guarantees are initially recognized at fair value and subsequently measured at the higher amount of the impairment allowance and the amount initially recognized less cumulative amortization.
2.31 Segmented Information
An operating segment is a component of Rabobank that engages in business activities from which it may earn revenues and incur expenses. The operating segments' operating results are regularly reviewed by Rabobank's Managing Board to make decisions about resources to be allocated to the segment and assess its performance, and discrete financial information is available about them.
2.32 Cash Flow Statement
Cash and cash equivalents include cash resources, money market deposits and deposits at central banks. The cash flow statement is prepared using the indirect method and provides details of the source of the cash and cash equivalents that became available during the year as well as their application during the year. The net pre-tax cash flow from operating activities is adjusted for non-cash items in the statement of income and for non-cash changes in items in the statement of financial position.
The Consolidated Statement of Cash Flows presents the cash flows from operating, investing and financing activities separately. Cash flows from operating activities include net changes in loans and advances, interbank deposits, deposits from customers and acquisitions, disposals and repayment of financial investments. Investment activities include acquisitions and disposals of subsidiaries, investments in associates and property and equipment. Financing activities include issues and repayments of Rabobank Certificates, Capital Securities, subordinated liabilities and debt securities in issue.
The difference between the net change presented in the statement of cash flows and the change in cash and cash equivalents included in the statement of financial position is due to foreign exchange differences.
3 Solvency and Capital Management
Rabobank aims to maintain a proper level of solvency. For this purpose a number of capital ratios are utilized. The principal ratios are the Common Equity Tier 1 ratio (CET1), the Tier 1 ratio, the total capital ratio and the equity capital ratio. Rabobank uses its own internal objectives that extend beyond the minimum requirements of the supervisors. It takes market expectations and developments in legislation and regulations into account. Rabobank manages its solvency position based on policy documents. The solvency position and the objectives are periodically reviewed by the Risk Management Committee and the Asset Liability Committee of the Managing Board and the Supervisory Board.
Rabobank complies with the minimum solvency requirements as stipulated under the "Capital Requirements Regulation (CRR)" and "Capital Requirements Directive (CRD V)". The solvency position is determined on the basis of ratios. These ratios compare the qualifying capital (total capital ratio), the Tier 1 capital (Tier 1 ratio) and the core capital (Common Equity Tier 1 ratio) with the total of the risk-adjusted assets. The minimum percentages are determined on the basis of CRD/CRR and reflect the application of Article 104a in CRD V, which allows Rabobank to partly fulfil the total pillar 2 requirement (1.9%) with Additional Tier 1 and Tier 2 capital.
Minimum Capital Buffer
| CET 1 | AT 1 | Tier 1 | Tier 2 | Overall capital requirement | |
|---|---|---|---|---|---|
| Pillar 1 requirement | 4.50% | 1.50% | 6.00% | 2.00% | 8.00% |
| Pillar 2 requirement | 1.07% | 0.36% | 1.43% | 0.47% | 1.90% |
| Capital conservation buffer | 2.50% | - | 2.50% | - | 2.50% |
| Systemic buffer | 1.52% | - | 1.52% | - | 1.52% |
| Countercyclical buffer | 1.26% | - | 1.26% | - | 1.26% |
| Total required | 10.85% | 1.86% | 12.71% | 2.47% | 15.18% |
Risk-weighted assets are determined based on separate and distinct methods for each of the credit, operational and market risks. For credit risk purposes, the risk-weighted assets are determined in several ways dependent on the nature of the asset. For the majority of assets the risk weighting is determined by reference to internal ratings and a number of characteristics specific to the asset concerned. For off-balance sheet items the balance sheet equivalent is calculated firstly on the basis of internal conversion factors and the resulting equivalent amounts are then also assigned risk-weightings. For operational risk purposes, the Standardized Measurement Approach model is used to determine the amount of risk-weighted assets. For market risk purposes, the Internal Model Approach is applied on the majority of the exposures in scope, with very small exposures following standardized methods. On December 31, 2025, Common Equity Tier 1 (CET1) ratio amounted to 20.3% (2024: 16.9%). The main driver of our CET1 ratio development was an increase in CET1 capital due to the addition of net profit to retained earnings. Risk-weighted assets decreased by EUR 22.2 billion (from EUR 261.5 billion to EUR 239.2 billion) mainly due to the introduction of CRR3 and a downward FX impact, business development partly compensated the decrease.
The CET1 capital requirement at year-end was 10.9% (2024: 11.0%), subject to application in full of article 104a of CRD V regarding meeting the Pillar 2 Requirement partly by AT1 and Tier 2.
Capital Ratios
| Amounts in millions of euros | 2025 | 2024 |
|---|---|---|
| Reserves and Retained earnings | 44,323 | 40,942 |
| Expected distributions | (1) | (2) |
| Rabobank Certificates | 6,909 | 6,909 |
| Regulatory adjustments | (2,598) | (3,685) |
| Common Equity Tier 1 capital | 48,633 | 44,164 |
| Capital Securities | 3,980 | 4,972 |
| Regulatory adjustments | (75) | (73) |
| Additional Tier 1 capital | 3,905 | 4,900 |
| Tier 1 capital | 52,538 | 49,063 |
| Part of subordinated debt treated as qualifying capital | 4,056 | 5,671 |
| Regulatory adjustments | (90) | (89) |
| Tier 2 capital | 3,966 | 5,582 |
| Qualifying capital | 56,504 | 54,646 |
| Risk-weighted assets | 239,223 | 261,452 |
| Common Equity Tier 1 ratio | 20.3% | 16.9% |
| Tier 1 ratio | 22.0% | 18.8% |
| Total capital ratio | 23.6% | 20.9% |
Elements in the regulatory adjustments are an NPL prudential backstop, goodwill, other intangible assets, deferred tax assets which depend on future taxable profits, the IRB shortfall for credit risk adjustments and adjustments relating to cumulative results due to changes in the bank’s own credit risk on financial liabilities designated at fair value.
4 Risk Exposure on Financial Instruments
4.1 Risk Organization
The Managing Board has ultimate responsibility to determine and implement the strategy, including risk strategy, risk appetite and culture of Rabobank and its subsidiaries. The Managing Board establishes governance structures and processes to manage the risks involved in realizing the Rabobank’s strategy. This includes the ongoing strengthening of staff skills and enhancements to risk management systems, policies, processes, quantitative models and reports needed to ensure the bank’s risk management capabilities are sufficiently robust and effective to fully support its strategic objectives and all of its risk-taking activities. The Supervisory Board is responsible for the supervision of the Managing Board regarding the risk profile, risk policies and risk management activities. The Supervisory Board Risk Committee consists of members of the Supervisory Board. The Risk Committee prepares the Supervisory Board’s decision making regarding the supervision of the integrity and quality of Rabobank’s risk appetite and risk management framework.
Risk Appetite
Our Risk Strategy produces a set of Risk Appetite Statements that are directly linked to the medium-term planning 2026-2028 (MTP) and our strategic pillars: Excellent Customer Focus, Meaningful Cooperative, Rock-Solid Bank, and Empowered Employees. These pillars establish the high-level boundaries within which our risk appetite operates. We define our risk appetite by risk type, specifying the level of risk we are willing to accept to achieve our business objectives. This overall maximum level of risk exposure is used in business activities to evaluate the desired risk profile against the risk-return sustainability profile of a given activity.
4.2 Strategy for the Use of Financial Instruments
Rabobank’s activities are inherently related to the use of financial instruments, including derivatives. As part of the services it offers, Rabobank accepts deposits from customers at varying terms and at both fixed and variable interest rates. Rabobank earns interest income by investing these deposits in high-quality assets and by providing loans to commercial and retail borrowers. Rabobank aims to increase the margin on these activities by actively managing the interest rate positions of the banking book balance within risk boundaries while maintaining sufficient cash resources to meet obligations as they fall due. Rabobank is exposed to credit risk on the on-balance sheet loans and on the off-balance sheet guarantees it provides, such as letters of credit, letters of performance, and other guarantee documents.
4.3 Credit Risk
Credit risk is defined as the risk of the bank facing an economic loss because the bank’s counterparties cannot fulfil their contractual obligations.
Credit risk management within the bank is governed by the bank-wide central credit risk policy and further detailed in underlying specific credit risk standards and procedures. The primary responsibility for managing and monitoring credit risk lies with the business as the first line of responsibility. The business is required to identify, assess and manage, monitor and report potential weaknesses in the credit risk portfolios. Monitoring takes place on an ongoing basis to limit credit risk exposures to a level in line with the business line’s risk appetite.
In addition, risk in the credit portfolio is measured and monitored at bank-wide level and on entity level on a monthly basis and by quarterly and ad-hoc portfolio reporting and analysis, with specific attention to risk developments and concentrations.
4.3.1 Credit Risk Management
Credit Acceptance
Rabobank’s credit acceptance policy is typified by a prudent assessment of customers and their ability to repay the loan that was granted (continuity perspective). As a result, the loan portfolio has an acceptable risk profile even in less than favorable economic circumstances. Rabobank aims to have long-term relationships with customers that are beneficial for both the client and the bank. An important starting point in acceptance policy for business loans is the "know your customer" principle. In the context of business customers, this means that the bank only grants loans to customers whose management Rabobank considers to be ethical and competent. In addition, Rabobank closely monitors developments in the business sectors in which its customers operate and in which it can properly assess the financial performance of its customers. Furthermore, in respect of sustainability and sustainable financing, guidelines have been established for use in the credit process.
Although credit is usually granted on the cash flow generating potential of the client or project, collateral will improve the position of the bank in case a client defaults. In respect of business clients, collateral can be independent of the client’s business and/or obtained from the client’s business. Rabobank has outlined its policies for collateral valuation and collateral management in the Global Standard on Credit Risk Mitigation. The valuation method depends on the type of collateral. For asset collateral, the valuation sources can be the customer’s balance sheet (e.g. equipment, machinery and stock), nominal value (e.g. cash and receivables), market value (e.g. securities and commodities), independent valuations (commercial immovable property) and market indices (residential immovable property). All (eligible) collateral is valued at market value or less than market value and the collateral value is monitored regularly. The collateral must be sufficiently liquid and its value over time should be sufficiently stable to provide appropriate credit protection. Each type of collateral is addressed separately within the Rabobank policy framework.
The main types of collateral are residential and commercial immovable property, inventory (such as equipment, machinery, stock etc.), commodities, receivables and guarantees. With a substantial domestic mortgage portfolio, residential immovable property is considered a concentration risk within the credit risk mitigation that is taken. The quality of the collateral is assessed in the initial credit request, and is monitored within the credit revision process (see table below for the Rabobank policy concerning revaluation and monitoring of collateral). The frequency of revaluation depends on the client's credit quality (performing or non-performing) and on the type of collateral and is in line with the requirements set out in the CRR. The main types of guarantors for business clients are governments, local authorities, (central) banks and corporate entities. A minimum rating is required for institutions, insurance undertakings and export credit agencies.
| Immovable property exposure/ immovable property collateral | Revaluation at least | Monitoring at least |
| Non-performing exposures | every year | every 6 months; exposure < EUR 1 million: every year |
| Performing exposures | ||
| a) exposure > EUR 3 million/ all types of collateral | every three years | every year |
| b) all commercial immovable property with exposure <= EUR 3 million | as defined by business unit | every year |
| c) residential immovable property with exposure <= EUR 3 million | as defined by business unit | every three years |
Credit Committees and Credit Approval
Within the boundaries set by the Risk Management Committee, the Managing Board has mandated decision-making authority to transactional committees or to credit decision approval officers (in a four eyes basis) that operate on an entity, regional or central level. Credit committees and approval officers review all significant risks in credit proposals to arrive at a systematic judgment and a balanced decision. Rabobank has various levels of credit decision authority. Applications exceeding the authority of the approval officers are complemented with a decision and submitted to a more senior credit committee for final decision-making.
The Credit Risk Approval Framework (CRAF) is part of the Credit Policy and describes the basis upon which credit risk decision making can be taken by Committee or approval officers. System supported decisions can also be taken as long as the credit is assessed as acceptable by an expert system or meets predefined criteria (the credit complies with decision tools). Fully IT supported assessments and approvals are allowed under strict conditions.
The Terms of Reference (ToR) of the credit committees provide their mandate, responsibilities & scope, hierarchical relationships, membership, authority levels and modalities. Credit committees take decisions on the basis of consensus, unless local regulation requires majority voting. Consensus is reached when there is a general agreement or when none of the members have fundamental objections to the decision. When no consensus can be reached, an application is considered declined. In case of majority voting, the representative(s) from the Risk domain has a veto right. If a veto is used, the Managing Board decides.
Each Business Unit (Wholesale & Rural, DRB, DLL) has a decision making authority for CRC Good and Early Warning clients. FR&R has a decision making authority for CRC Financial Difficulties and Default clients. In both cases the authority is vested in either approval officers or credit committees. The following central credit committees are in place:
The Central Credit Committee Rabobank Group (CCCRG) – takes credit decisions on corporate credit applications exceeding the authority of the relevant business unit.
The Credit Committee Financial Restructuring & Recovery (CC-FR&R) - takes credit decisions on proposals for classified (CRC Financial Difficulties or Default) clients exceeding the authority of Business Unit FR&R departments.
Country & Financial Institutions Committee (CFIC) – takes credit decisions on proposals exceeding the authority of Country & Financial Institutions Risk which is responsible for the risk management of exposure on financial institutions and sovereigns/countries.
Loan Loss Provision Committee (LLPC) – is responsible for determining (and where appropriate making recommendations to the Managing Board on) the level of expected credit loss provisions. Responsibility covers both model-based (stage 1, stage 2 and stage 3a) and individually assessed exposures (stage 3b) as well as management adjustments proposed by the Management Adjustment Committee (MAC). The MAC is responsible for MA process such as consistent application of methodology and quality of substantiation.
Credit committees play a key role in ensuring consistency among Rabobank standards of credit analysis, compliance with credit policy and consistent use of the rating models. Policies are also in place which restrict or prohibit certain counterparty types or industries. As a rule, all internal ratings are reviewed at least once a year (corporate clients). The frequency of counterparty reviews is risk based, meaning that counterparties with a higher risk profile are reviewed on a more frequent basis. Credit approval authorities may request more frequent reviews as well. Credit committees and approvers may also request more frequent reviews.
4.3.2 Loan portfolio composition
Rabobank has a significant market share in residential mortgages lending in the Netherlands. These loans have a low risk profile and the net addition in 2025 to loan impairment allowances is 1 basis points. In 2025, the proportion of the private sector lending allocable to the food and agricultural sectors was 26% and the proportion of private sector lending allocable to trade, industry and services was 28%. Loans to trade, industry and services and loans to the food and agricultural sectors are spread over a wide range of industries in many different countries. None of these individual sector shares represents more than 10% of the total private sector lending.
| Amounts in millions of euros | 2025 | 2024 | ||
|---|---|---|---|---|
| Total loans and advances to customers | 472,319 | 454,485 | ||
| Of which: | ||||
| Loans to government clients | 1,471 | 1,740 | ||
| Reverse repurchase transactions, securities borrowing agreements and settlement accounts | 21,773 | 15,509 | ||
| Hedge accounting adjustment | (10,759) | (10,079) | ||
| Loans to private sector clients | 459,834 | 447,315 | ||
| This can be broken down geographically as follows: | ||||
| The Netherlands | 304,444 | 66% | 293,438 | 65% |
| Rest of Europe | 51,146 | 11% | 46,386 | 10% |
| North America | 50,204 | 11% | 51,962 | 12% |
| Latin America | 17,171 | 4% | 17,318 | 4% |
| Asia | 6,378 | 1% | 6,723 | 2% |
| Oceania | 30,274 | 7% | 31,258 | 7% |
| Africa | 217 | 0% | 230 | 0% |
| Total loans to private sector clients | 459,834 | 100% | 447,315 | 100% |
| Breakdown of loans by business sector | ||||
| Private individuals | 212,372 | 46% | 204,520 | 46% |
| Trade, industry and services (TIS) | 129,865 | 28% | 122,951 | 27% |
| Food & agri | 117,597 | 26% | 119,844 | 27% |
| Total loans to private sector clients | 459,834 | 100% | 447,315 | 100% |
The geographical breakdown is based on the country of residence of the counterparty of the loans. The loans to private individuals are almost all incorporated in the business segment Domestic Retail Banking and geographically in the Netherlands. The loans to TIS and Food & Agri are categorized by sector and business segment as follows:
Trade, Industry and Services Loan Portfolio Analyzed by Business sector
| Amounts in millions of euros | Domestic Retail Banking | W&R | Leasing | Property Development | Other Segments | Total |
|---|---|---|---|---|---|---|
On December 31, 2025 | ||||||
| Manufacturing (non-F&A) | 4,497 | 6,441 | 2,584 | - | - | 13,522 |
| Energy | 775 | 14,062 | 160 | - | - | 14,997 |
| Construction | 4,050 | 463 | 2,285 | 178 | - | 6,976 |
| Wholesale and retail trade (non-F&A and energy) | 6,482 | 3,029 | 5,605 | - | - | 15,116 |
| Transportation and storage | 4,717 | 3,141 | 1,625 | - | - | 9,483 |
| Accommodation and food service activities | 3,107 | 2,662 | 244 | - | - | 6,013 |
| Information and communication | 1,018 | 2,121 | 940 | - | 1 | 4,080 |
| Financial and insurance activities | 3,147 | 11,321 | 867 | - | - | 15,335 |
| Real estate activities | 14,841 | 6,358 | 356 | - | - | 21,555 |
| Professional, scientific and technical activities | 1,618 | 966 | 1,302 | - | - | 3,886 |
| Administrative and support service activities | 2,088 | 1,935 | 3,336 | - | - | 7,359 |
| Education | 160 | 1 | 619 | - | - | 780 |
| Human health and social work activities | 3,131 | 46 | 2,993 | - | - | 6,170 |
| Arts, entertainment and recreation | 739 | 281 | 521 | - | - | 1,541 |
| Other non-F&A | 604 | 1,084 | 1,364 | - | - | 3,052 |
| Total | 50,974 | 53,911 | 24,801 | 178 | 1 | 129,865 |
| Amounts in millions of euros | Domestic Retail Banking | W&R | Leasing | Property Development | Other Segments | Total |
|---|---|---|---|---|---|---|
On December 31, 2024 | ||||||
| Manufacturing (Non-F&A) | 4,475 | 6,138 | 2,929 | - | - | 13,542 |
| Energy | 702 | 12,156 | 194 | - | - | 13,052 |
| Construction | 3,654 | 542 | 2,246 | 157 | - | 6,599 |
| Wholesale and retail trade (non-F&A and energy) | 6,396 | 2,934 | 6,059 | - | - | 15,389 |
| Transportation and storage | 4,219 | 2,303 | 1,668 | - | - | 8,190 |
| Accommodation and food service activities | 2,851 | 2,472 | 238 | - | - | 5,561 |
| Information and communication | 871 | 1,264 | 1,013 | - | 1 | 3,149 |
| Financial and insurance activities | 3,094 | 10,593 | 795 | - | - | 14,482 |
| Real estate activities | 15,282 | 5,850 | 361 | 1 | - | 21,494 |
| Professional, scientific and technical activities | 1,658 | 639 | 1,321 | - | - | 3,618 |
| Administrative and support service activities | 1,785 | 1,429 | 3,301 | - | - | 6,515 |
| Education | 135 | 2 | 610 | - | - | 747 |
| Human health and social work activities | 2,895 | 46 | 3,119 | - | - | 6,060 |
| Arts, entertainment and recreation | 658 | 213 | 501 | - | - | 1,372 |
| Other Non F&A | 411 | 1,364 | 1,406 | - | - | 3,181 |
| Total | 49,086 | 47,945 | 25,761 | 158 | 1 | 122,951 |
Food & Agri Loan Portfolio Analyzed by Business Sector
| Amounts in millions of euros | Domestic Retail Banking | W&R | Leasing | Property Development | Other Segments | Total |
|---|---|---|---|---|---|---|
On December 31, 2025 | ||||||
| Commodities | 2,627 | 21,585 | 4,893 | - | - | 29,105 |
| Animal Protein | 3,416 | 17,511 | 3,001 | - | - | 23,928 |
| Beverages | 133 | 5,355 | 144 | - | - | 5,632 |
| Consumer Foods | 2,184 | 10,071 | 431 | - | - | 12,686 |
| Dairy | 7,658 | 11,348 | 1,547 | - | - | 20,553 |
| Farm Inputs | 1,069 | 5,734 | 3,895 | - | - | 10,698 |
| Fresh Produce | 5,419 | 5,753 | 2,675 | - | - | 13,847 |
| Other F&A | 28 | 648 | 472 | - | - | 1,148 |
| Total | 22,534 | 78,005 | 17,058 | - | - | 117,597 |
| Amounts in millions of euros | Domestic Retail Banking | W&R | Leasing | Property Development | Other Segments | Total |
|---|---|---|---|---|---|---|
On December 31, 2024 | ||||||
| Commodities | 2,548 | 21,110 | 5,673 | - | - | 29,331 |
| Animal Protein | 3,134 | 17,640 | 2,720 | - | - | 23,494 |
| Beverages | 124 | 5,582 | 140 | - | - | 5,846 |
| Consumer Foods | 1,938 | 10,091 | 447 | - | - | 12,476 |
| Dairy | 7,599 | 11,978 | 1,487 | - | - | 21,064 |
| Farm Inputs | 1,208 | 6,353 | 4,199 | - | - | 11,760 |
| Fresh Produce | 5,208 | 7,157 | 2,469 | - | - | 14,834 |
| Other F&A | 26 | 562 | 451 | - | - | 1,039 |
| Total | 21,785 | 80,473 | 17,586 | - | - | 119,844 |
Derivatives
Rabobank sets strict limits for open positions, in amounts as well as in terms. If ISDA (International Swaps and Derivatives Association) standards apply or a master agreement including equivalent terms has been concluded with the counterparty, and if the jurisdiction of the counterparty permits offsetting, the net open position is monitored and reported. This credit risk is managed as part of the general lending limits for clients. Where needed, Rabobank obtains collateral or other credit enhancements to mitigate credit risks inherent in these transactions. The credit risk exposure represents the current fair value of all open derivative contracts showing a positive market value, taking into account master netting agreements enforceable under law.
Credit Related Contingent Liabilities
The financial guarantees and standby letters of credit that Rabobank provides to third parties in the event of a client being unable to fulfill their obligations to these third parties, are exposed to credit risk. Rabobank provides documentary and commercial letters of credit and written undertakings on behalf of clients that authorize third parties to draw bills against Rabobank up to a fixed amount and subject to specific conditions. As these transactions are secured by the delivery of the underlying goods to which they relate, the risk exposure of such an instrument is lower than that of a direct loan. From the moment that the documents have been accepted under the terms of the letters of credit, Rabobank recognizes an asset and a liability until payment.
Loan commitments are firm commitments to provide credit under pre-specified terms and conditions. Rabobank is exposed to credit risk when it promises to grant loans. The amount of any losses is likely to be lower than the total of the unused commitments because the commitments are subject to the clients meeting certain loan conditions. Rabobank monitors the term to the expiry of loan commitments because long-term commitments generally involve higher risk than short-term commitments.
4.3.3 Credit Risk Exposure and Credit Quality
In its financing approval process, Rabobank uses the Rabobank Risk Rating, which reflects the risk of failure or the probability of default (PD) of the loan relation over a period of one year. The loan-quality categories are determined on the basis of the internal Rabobank Risk Rating. The Rabobank Risk Rating consists of 21 performance ratings (R0-R20) and four default ratings (D1-D4). The performance ratings assess the probability of default within a period of one year and the rating is determined, in principle, on a cyclically neutral basis. D1-D4 ratings refer to default classifications. D1 represents more than 90 days past due on a material contractual payment; D2 indicates that it is unlikely that the obligor will pay its debt in full, without recourse by the bank to actions such as realizing security; D3 indicates that a distressed sale or a distressed restructuring has occurred that is likely to result in a credit-related economic loss; and D4 indicates bankruptcy status. The default ratings make up the total credit-impaired exposure. The table below shows the credit quality of the financial assets subject to impairment disclosed in ranges of rating grades that is consistent with the number that is reported to key management personnel for credit risk management purposes. The gross carrying amount of the financial assets below also represent the maximum exposure to credit risk on these assets.
Credit Risk Profile per Internal Rating Grade of Loans and Advances to Credit Institutions
| Amounts in millions of euros | ||||
|---|---|---|---|---|
On December 31, 2025 | Gross carrying amount | |||
| Non credit-impaired | Credit-impaired | Total | ||
| Subject to 12-month ECL | Subject to lifetime ECL | Subject to lifetime ECL | ||
| R0-R1 (AAA) | 109 | - | - | 109 |
| R2-R4 (AA) | 9,420 | - | - | 9,420 |
| R5-R7 (A) | 19,966 | - | - | 19,966 |
| R8-R10 (BBB) | 745 | - | - | 745 |
| R11-R13 (BB) | 1,660 | - | - | 1,660 |
| R14-R16 (B+) | 289 | 1 | - | 290 |
| R17-R19 (B-) | 461 | - | - | 461 |
| R20 (CCC+) | - | - | - | - |
| Default ratings (D) | - | - | 1 | 1 |
| Non-rated | 400 | - | - | 400 |
| Total | 33,050 | 1 | 1 | 33,052 |
On December 31, 2024 | ||||
| R0-R1 (AAA) | 49 | - | - | 49 |
| R2-R4 (AA) | 6,242 | 19 | - | 6,261 |
| R5-R7 (A) | 17,109 | 4 | - | 17,113 |
| R8-R10 (BBB) | 1,048 | 1 | - | 1,049 |
| R11-R13 (BB) | 1,248 | 2 | - | 1,250 |
| R14-R16 (B+) | 494 | 2 | - | 496 |
| R17-R19 (B-) | 291 | 1 | - | 292 |
| R20 (CCC+) | - | - | - | - |
| Default ratings (D) | - | - | 1 | 1 |
| Non-rated | 525 | - | - | 525 |
| Total | 27,006 | 29 | 1 | 27,036 |
Credit Risk Profile per Internal Rating Grade of Loans and Advances to Customers
| Amounts in millions of euros | ||||
|---|---|---|---|---|
On December 31, 2025 | Gross carrying amount | |||
| Non credit-impaired | Credit-impaired | Total | ||
| Subject to 12-month ECL | Subject to lifetime ECL | Subject to lifetime ECL | ||
| R0-R1 (AAA) | 714 | 2 | - | 716 |
| R2-R4 (AA) | 15,186 | 846 | - | 16,032 |
| R5-R7 (A) | 95,954 | 11,043 | - | 106,997 |
| R8-R10 (BBB) | 138,836 | 13,232 | - | 152,068 |
| R11-R13 (BB) | 108,529 | 14,689 | - | 123,218 |
| R14-R16 (B+) | 40,215 | 15,492 | - | 55,707 |
| R17-R19 (B-) | 6,534 | 6,877 | - | 13,411 |
| R20 (CCC+) | 448 | 2,620 | - | 3,068 |
| Default ratings (D) | - | - | 8,050 | 8,050 |
| Non-rated | 6,254 | 68 | - | 6,322 |
| Total | 412,670 | 64,869 | 8,050 | 485,589 |
On December 31, 2024 | ||||
| R0-R1 (AAA) | 310 | 1 | - | 311 |
| R2-R4 (AA) | 8,777 | 905 | - | 9,682 |
| R5-R7 (A) | 82,899 | 11,737 | - | 94,636 |
| R8-R10 (BBB) | 133,399 | 16,446 | - | 149,845 |
| R11-R13 (BB) | 103,049 | 16,468 | - | 119,517 |
| R14-R16 (B+) | 46,797 | 15,109 | - | 61,906 |
| R17-R19 (B-) | 8,257 | 6,321 | - | 14,578 |
| R20 (CCC+) | 550 | 2,101 | - | 2,651 |
| Default ratings (D) | - | - | 9,875 | 9,875 |
| Non-rated | 3,495 | 504 | - | 3,999 |
| Total | 387,533 | 69,592 | 9,875 | 467,000 |
Credit Risk Profile per External Rating Grade of Financial Assets at Fair Value through Other Comprehensive Income
| Amounts in millions of euros | ||||
|---|---|---|---|---|
On December 31, 2025 | Gross carrying amount | |||
| Non credit-impaired | Credit-impaired | Total | ||
| Subject to 12-month ECL | Subject to lifetime ECL | Subject to lifetime ECL | ||
| AAA-A | 28,778 | - | - | 28,778 |
| BBB-B | 651 | - | - | 651 |
| CCC-C | - | - | - | - |
| D | - | - | - | - |
| Non-rated | - | - | - | - |
| Total | 29,429 | - | - | 29,429 |
On December 31, 2024 | ||||
| AAA-A | 18,111 | - | - | 18,111 |
| BBB-B | 600 | - | - | 600 |
| CCC-C | - | - | - | - |
| D | - | - | - | - |
| Non-rated | - | - | - | - |
| Total | 18,711 | - | - | 18,711 |
Credit Risk Profile per Internal Rating Grade of Loan Commitments and Financial Guarantees
| Amounts in millions of euros | ||||
|---|---|---|---|---|
On December 31, 2025 | Exposure to credit risk | |||
| Non credit-impaired | Credit-impaired | |||
| Subject to 12-month ECL | Subject to lifetime ECL | Subject to lifetime ECL | Total | |
| R0-R1 (AAA) | 1,247 | 1 | - | 1,248 |
| R2-R4 (AA) | 5,955 | 206 | - | 6,161 |
| R5-R7 (A) | 19,429 | 723 | - | 20,152 |
| R8-R10 (BBB) | 22,187 | 1,075 | - | 23,262 |
| R11-R13 (BB) | 17,204 | 2,731 | - | 19,935 |
| R14-R16 (B+) | 3,313 | 1,353 | - | 4,666 |
| R17-R19 (B-) | 170 | 320 | - | 490 |
| R20 (CCC+) | 22 | 95 | - | 117 |
| Default ratings (D) | - | - | 517 | 517 |
| Non-rated | 20,310 | 17 | - | 20,327 |
| Total | 89,837 | 6,521 | 517 | 96,875 |
On December 31, 2024 | ||||
| R0-R1 (AAA) | 1,326 | - | - | 1,326 |
| R2-R4 (AA) | 3,674 | 180 | - | 3,854 |
| R5-R7 (A) | 20,862 | 321 | - | 21,183 |
| R8-R10 (BBB) | 20,704 | 1,301 | - | 22,005 |
| R11-R13 (BB) | 15,336 | 1,811 | - | 17,147 |
| R14-R16 (B+) | 3,760 | 1,126 | - | 4,886 |
| R17-R19 (B-) | 314 | 261 | - | 575 |
| R20 (CCC+) | 8 | 33 | - | 41 |
| Default ratings (D) | - | - | 929 | 929 |
| Non-rated | 22,101 | 984 | - | 23,085 |
| Total | 88,085 | 6,017 | 929 | 95,031 |
4.3.4 Impairment Allowances on Financial Assets and Credit Related Contingent Liabilities
The following tables present a reconciliation from the opening balance to the closing balance of the impairment allowances of financial assets and credit related contingent liabilities.
Impairment Allowances on Loans and Advances to Credit Institutions
| Amounts in millions of euros | ||||
|---|---|---|---|---|
| Subject to 12-month ECL | Subject to lifetime ECL non-credit impaired | Subject to lifetime ECL credit impaired | Total | |
| Balance on January 1, 2025 | 1 | - | - | 1 |
| Increases due to origination and acquisition | 1 | - | - | 1 |
| Decreases due to derecognition | - | - | - | - |
| Changes due to change in credit risk | (1) | - | - | (1) |
| Write-off of defaulted loans during the year | - | - | - | - |
| Other changes | (1) | - | - | (1) |
| Balance on December 31, 2025 | - | - | - | - |
| Balance on January 1, 2024 | 1 | - | - | 1 |
| Increases due to origination and acquisition | - | - | - | - |
| Decreases due to derecognition | - | - | - | - |
| Changes due to change in credit risk | - | - | - | - |
| Write-off of defaulted loans during the year | - | - | - | - |
| Other changes | - | - | - | - |
| Balance on December 31, 2024 | 1 | - | - | 1 |
Impairment Allowances on Loans and Advances to Customers
| Amounts in millions of euros | ||||
|---|---|---|---|---|
| Subject to 12-month ECL | Subject to lifetime ECL non-credit impaired | Subject to lifetime ECL credit impaired | Total | |
| Balance on January 1, 2025 | 388 | 456 | 1,592 | 2,436 |
| Increases due to origination and acquisition | 122 | 30 | 73 | 225 |
| Decreases due to derecognition | (51) | (55) | (246) | (352) |
| Changes due to change in credit risk | (115) | 143 | 989 | 1,017 |
| Write-off of defaulted loans during the year | (6) | (4) | (727) | (737) |
| Other changes | (6) | (17) | (54) | (77) |
| Balance on December 31, 2025 | 332 | 553 | 1,627 | 2,512 |
| Balance on January 1, 2024 | 393 | 706 | 1,810 | 2,909 |
| Increases due to origination and acquisition | 183 | 21 | 152 | 356 |
| Decreases due to derecognition | (70) | (87) | (216) | (373) |
| Changes due to change in credit risk | (104) | (179) | 860 | 577 |
| Write-off of defaulted loans during the year | (10) | (4) | (1,020) | (1,034) |
| Other changes | (4) | (1) | 6 | 1 |
| Balance on December 31, 2024 | 388 | 456 | 1,592 | 2,436 |
Impairment Allowances on Financial Assets at Fair Value through Other Comprehensive Income
| Amounts in millions of euros | ||||
|---|---|---|---|---|
| Subject to 12-month ECL | Subject to lifetime ECL non-credit impaired | Subject to lifetime ECL credit impaired | Total | |
| Balance on January 1, 2025 | 5 | - | - | 5 |
| Increases due to origination and acquisition | 2 | - | - | 2 |
| Decreases due to derecognition | (1) | - | - | (1) |
| Changes due to change in credit risk | 4 | - | - | 4 |
| Write-off of defaulted loans during the year | - | - | - | - |
| Other changes | (1) | - | - | (1) |
| Balance on December 31, 2025 | 9 | - | - | 9 |
| Balance on January 1, 2024 | 1 | - | - | 1 |
| Increases due to origination and acquisition | 4 | - | - | 4 |
| Decreases due to derecognition | - | - | - | - |
| Changes due to change in credit risk | - | - | - | - |
| Write-off of defaulted loans during the year | - | - | - | - |
| Other changes | - | - | - | - |
| Balance on December 31, 2024 | 5 | - | - | 5 |
Impairment Allowances on Loan Commitments and Financial Guarantees
| Amounts in millions of euros | ||||
|---|---|---|---|---|
| Subject to 12-month ECL | Subject to lifetime ECL non-credit impaired | Subject to lifetime ECL credit impaired | Total | |
| Balance on January 1, 2025 | 53 | 34 | 74 | 161 |
| Increases due to origination and acquisition | 2 | - | 3 | 5 |
| Decreases due to derecognition | (84) | (62) | (103) | (249) |
| Changes due to change in credit risk | 59 | 55 | 78 | 192 |
| Write-off of defaulted loans during the year | - | - | - | - |
| Other changes | (3) | (1) | (3) | (7) |
| Balance on December 31, 2025 | 27 | 26 | 49 | 102 |
| Balance on January 1, 2024 | 26 | 27 | 125 | 178 |
| Increases due to origination and acquisition | 11 | - | 8 | 19 |
| Decreases due to derecognition | (51) | (24) | (114) | (189) |
| Changes due to change in credit risk | 66 | 31 | 55 | 152 |
| Write-off of defaulted loans during the year | - | - | - | - |
| Other changes | 1 | - | - | 1 |
| Balance on December 31, 2024 | 53 | 34 | 74 | 161 |
The following table provides an overview of the significant changes in the gross carrying amount of loans and advances to customers during the period that contributed to changes in the total impairment allowance.
Changes in the Gross Carrying Amount of Loans and Advances to Customers
| Amounts in millions of euros | Gross carrying amount | |||
|---|---|---|---|---|
| Non-credit-impaired | Credit-impaired | |||
| Subject to 12-month ECL | Subject to lifetime ECL | Subject to lifetime ECL | Total | |
| Balance on January 1, 2025 | 387,533 | 69,592 | 9,875 | 467,000 |
| Transfers of financial assets | (5,723) | 4,498 | 1,225 | - |
| New financial assets originated or acquired | 170,002 | 12,345 | 2,141 | 184,488 |
| Financial assets that have been derecognized | (130,436) | (20,763) | (4,267) | (155,466) |
| Write-offs | (13) | (4) | (758) | (775) |
| Other changes | (8,693) | (799) | (166) | (9,658) |
| Balance on December 31, 2025 | 412,670 | 64,869 | 8,050 | 485,589 |
| Balance on January 1, 2024 | 396,879 | 47,674 | 8,997 | 453,550 |
| Transfers of financial assets | (35,244) | 31,939 | 3,305 | - |
| New financial assets originated or acquired | 150,366 | 6,763 | 1,985 | 159,114 |
| Financial assets that have been derecognized | (124,609) | (16,920) | (3,333) | (144,862) |
| Write-offs | (14) | (5) | (1,029) | (1,048) |
| Other changes | 155 | 141 | (50) | 246 |
| Balance on December 31, 2024 | 387,533 | 69,592 | 9,875 | 467,000 |
4.3.5 Criteria for identifying a significant increase in credit risk (SICR)
The parameter taken into account in the quantitative SICR assessment is the lifetime probability of default and its development from origination to reporting date. A relative change which is above a certain threshold in combination with an absolute threshold are considered to be indicators for a significant increase in credit risk. The comparison between the lifetime PD at origination and the lifetime PD at reporting date is made by translating both the rating at the start of the financial instrument and the rating at reporting date into (point-in-time) PD curves. The threshold is 2.0 (2024: 2.0) and represents the multiplier by which the lifetime PD needs to be increased to migrate from stage 1 to stage 2. In addition, an absolute delta PD of 0.5% (2024: 0.5%) should be reached as a minimum to migrate from stage 1 to stage 2. The thresholds are the same for all frameworks.
4.3.6 Judgments and Estimates on Model Based Impairment Allowances on Financial Assets
Rabobank applies the three-stage expected credit loss impairment models for measuring and recognizing expected credit losses which involve a significant degree of management judgment. The impairment methodology results in the recognition of allowances measured at an amount equal to 12 month expected credit losses (stage 1); allowances measured at an amount equal to lifetime expected credit losses for financial assets for which credit risk has increased significantly since initial recognition but that are not credit-impaired (stage 2); and financial assets that are credit-impaired (stage 3). Rabobank uses estimates and management judgment in determining the expected credit loss for model-based impairment allowances. The IFRS 9 models have been developed as overlay models, meaning they are built on top of the AIRB frameworks and rely on the AIRB best estimates as inputs. Judgement and estimates are applicable within the model approach. The most important elements are disclosed below.
As part of the model governance process, new or updated IFRS 9 models are reviewed by an internal validation unit and approved for use by the Model & AI Risk Committee. Monitoring procedures are subsequently in place to ensure that the model-output is reliable and adjustments to the models are made when necessary. Expert judgment resulting in management adjustments on top of IFRS9 model outcome are described in Section 2.1.
SICR Sensitivity
Transferring assets from stage 1 to stage 2 requires judgment. To assess the sensitivity of the ECL to the PD thresholds, an analysis was run, which assumed all assets were below the PD thresholds and apportioned a 12 month ECL. On the same asset base, an analysis was run which assumed all assets were above the PD thresholds and apportioned a lifetime ECL. Both analyses were run without taking into account the impact of management adjustments and resulted in ECLs of EUR 632 million (2024: 671 million) and EUR 1,682 million (2024: EUR 1,700 million) respectively. The total stage 1 and stage 2 impairment allowances as at December 31, 2025 are EUR 947 million (December 31, 2024: EUR 937 million).
Forward-looking Information and Macro-economic Scenarios
Estimating expected credit losses for each stage and assessing significant increases in credit risk uses information about past events and current conditions as well as reasonable and supportable forecasts of future events and economic conditions (forward looking information). Rabobank uses three, probability-weighted, macro-economic scenarios (consisting of a baseline scenario, a baseline minus scenario and a baseline plus scenario) in its ECL models to determine the expected credit losses. The baseline macro-economic scenario is considered the most likely at a 60% (December 31, 2024: 60%) likelihood, compared to 20% likelihood for the minus (December 31, 2024: 20%) and 20% for the plus scenarios (December 31, 2024: 20%).
Determination of Plus and Minus Scenarios
Rabobank uses a statistical simulation method from the National Institute Global Econometric Model (NiGEM) to generate its plus and minus scenarios. The procedure for the determination involves two steps:
1. Application of the stochastic function of NiGEM to run 1,000 scenarios starting in the third quarter where the plus and minus scenarios may differ from the baseline. NiGEM uses historical residuals (randomly chosen) from the model equations that results in shocks during the forecast period (Monte Carlo simulation). The result is a distribution of possible macroeconomic outcomes.
2. Pick from the distribution of possible macroeconomic outcomes, the two scenarios which represent the 20% plus scenarios and the 20% minus scenarios.
Most important Macro-economic Variables
Important variables are gross domestic product growth, unemployment rates, and private sector investment. These forward-looking macro-economic forecasts require judgment and are largely based on internal Rabobank research. An analysis of the sensitivity of key forward-looking macro-economic inputs used in the ECL modelling process for stage 1, stage 2, and the model-based stage 3 provisioning and the probability-weights applied to each of the three scenarios is presented below without taking into account the impact of management adjustments. The countries included in the analysis are the most significant in terms of gross contribution to reportable ECL. Accordingly, Rabobank considers these portfolios to present the most significant risk of resulting in an adjustment to the carrying amount of financial assets.
Key macro-economic inputs and related ECL pre MAs
| Weighted ECL in millions of euro per | Weighted ECL in millions of euro per | |||||||
|---|---|---|---|---|---|---|---|---|
| Netherlands | 2026 | 2027 | 2028 | ECL unweighted | Probability | December 31, 2025 | December 31, 2024 | |
| Plus | GDP per capita | 1.65% | 1.40% | 0.34% | ||||
| Unemployment | 3.58% | 2.96% | 2.84% | 907 | 20% | |||
| Private Sector Investment | -0.01% | 1.02% | -0.12% | |||||
| Baseline | GDP per capita | 0.73% | 0.81% | 0.90% | ||||
| Unemployment | 4.08% | 4.26% | 4.43% | 995 | 60% | 997 | 730 | |
| Private Sector Investment | -0.29% | 0.59% | -0.04% | |||||
| Minus | GDP per capita | -0.22% | 0.19% | 1.50% | ||||
| Unemployment | 4.55% | 5.47% | 5.93% | 1,094 | 20% | |||
| Private Sector Investment | -0.56% | 0.13% | 0.05% | |||||
| Weighted ECL in millions of euro per | Weighted ECL in millions of euro per | |||||||
| United States | 2026 | 2027 | 2028 | ECL unweighted | Probability | December 31, 2025 | December 31, 2024 | |
| Plus | GDP per capita | 2.14% | 2.20% | 1.24% | ||||
| Unemployment | 4.10% | 3.09% | 2.62% | 116 | 20% | |||
| Private Sector Investment | -0.64% | 0.56% | 0.08% | |||||
| Baseline | GDP per capita | 1.25% | 1.22% | 1.49% | ||||
| Unemployment | 4.63% | 4.45% | 4.30% | 133 | 60% | 133 | 137 | |
| Private Sector Investment | -0.88% | 0.14% | 0.00% | |||||
| Minus | GDP per capita | 0.34% | 0.17% | 1.72% | ||||
| Unemployment | 5.12% | 5.74% | 5.89% | 152 | 20% | |||
| Private Sector Investment | -1.12% | -0.31% | -0.08% | |||||
| Weighted ECL in millions of euro per | Weighted ECL in millions of euro per | |||||||
| Brazil | 2026 | 2027 | 2028 | ECL unweighted | Probability | December 31, 2025 | December 31, 2024 | |
| Plus | GDP per capita | 1.87% | 3.35% | 2.02% | ||||
| Unemployment | 4.10% | 3.09% | 2.62% | 90 | 20% | |||
| Private Sector Investment | 0.10% | -1.56% | -0.22% | |||||
| Baseline | GDP per capita | 1.19% | 2.86% | 2.24% | ||||
| Unemployment | 4.63% | 4.45% | 4.30% | 100 | 60% | 100 | 70 | |
| Private Sector Investment | -0.09% | -1.79% | -0.35% | |||||
| Minus | GDP per capita | 0.49% | 2.33% | 2.45% | ||||
| Unemployment | 5.12% | 5.74% | 5.89% | 111 | 20% | |||
| Private Sector Investment | -0.29% | -2.01% | -0.46% | |||||
| Weighted ECL in millions of euro per | Weighted ECL in millions of euro per | |||||||
| Australia | 2026 | 2027 | 2028 | ECL unweighted | Probability | December 31, 2025 | December 31, 2024 | |
| Plus | GDP per capita | 1.95% | 1.99% | 1.31% | ||||
| Unemployment | 3.76% | 2.91% | 2.54% | 41 | 20% | |||
| Private Sector Investment | 0.07% | 0.83% | 0.22% | |||||
| Baseline | GDP per capita | 1.40% | 1.39% | 1.38% | ||||
| Unemployment | 4.38% | 4.50% | 4.50% | 44 | 60% | 44 | 33 | |
| Private Sector Investment | -0.18% | 0.25% | -0.05% | |||||
| Minus | GDP per capita | 0.84% | 0.78% | 1.46% | ||||
| Unemployment | 4.96% | 6.01% | 6.36% | 47 | 20% | |||
| Private Sector Investment | -0.42% | -0.33% | -0.30% |
A probability weighting of 15% (2024: 15%) for both the minus and plus scenario and a probability weighting of 70% (2024: 70%) for the baseline scenario, would decrease the total weighted ECL for stage 1, stage 2, and model-based stage 3 exposures by EUR 1 million (2024: EUR 1 million). If the probability weighting for both the minus and plus scenario was 25% (2024: 25%) and 50% (2024: 50%) for the baseline scenario, it would increase the total weighted ECL for stage 1, stage 2, and model-based stage 3 exposures by EUR 1 million (2024: EUR 1 million).
Gross carrying amount of loans to customers in stage 1 and stage 2
| Amounts in millions of euros | 2025 | 2024 |
|---|---|---|
| Netherlands | 302,619 | 290,946 |
| United States | 48,731 | 49,204 |
| Brazil | 11,187 | 11,414 |
| Australia | 21,382 | 21,636 |
Measurement of Expected Credit Losses
The probability of default (PD), loss given default (LGD) and the exposure at default (EAD) are used to estimate expected credit losses as inputs for the ECL models. When unexpected external developments or data quality issues are not sufficiently covered by these ECL models, an adjustment will be made based on judgments and estimates. The inputs also require estimates as follows:
PD – The probability of default is an estimate of the likelihood of default over a given time horizon.
LGD – The loss given default is an estimate of the loss arising when a default occurs at a given time. It is based on the difference between the contractual cash flows due and those that Rabobank would expect to receive, including cash flows expected from collateral and other credit enhancements.
EAD – The exposure at default is an estimate of the exposure at a future default date, taking into account expected changes in the exposure after reporting date due to prepayment.
The table below shows the impact on the ECL in the baseline scenario resulting from changes in probability of default (PD), collateral value and full prepayment rate.
Impact on ECL
| 2025 | 2024 | |
| PD rating 1 notch deterioration (PD) | 279 | 294 |
| PD rating 1 notch improved (PD) | (269) | (231) |
| Collateral value down by 10 % (LGD) | 56 | 102 |
| Collateral value up by 10% (LGD) | (38) | (85) |
| Full prepayment rate down by 50% (EAD) | 66 | 82 |
| Full prepayment rate up by 50% (EAD) | (49) | (66) |
4.3.7 Credit Risk Mitigation
Rabobank’s credit risk exposure is partly mitigated by obtaining collateral and other credit enhancements where necessary. The amount and nature of the collateral required depends partly on the assessment of the credit risk of the loan to the counterparty. Rabobank has guidelines in place for the purpose of accepting and valuing different types of collateral. The major types of collateral are:
Mortgage collateral on residential immovable property;
Mortgage collateral on commercial immovable property, pledges on movable property, inventories and receivables (mainly for corporate loans); and
Cash and securities, mainly for derivatives, securities lending activities and reverse repurchase transactions.
Rabobank also uses credit derivatives to manage credit risks and enters into master netting arrangements with counterparties for a significant volume of transactions. In general, master netting arrangements do not lead to the offsetting of assets and liabilities included in the statement of financial position because transactions are usually settled gross except for transactions that meet the offsetting criteria as mentioned in Section 2.11. Credit risk is limited by master netting arrangements, but only to the extent that if an event or cancellation occurs, all amounts involving the counterparty are frozen and settled net. The total credit risk exposure from derivatives to which offsetting arrangements apply is sensitive to the closure of new transactions, the expiration of existing transactions and fluctuations in market interest and exchange rates.
Offsetting of Financial Instruments
| Offset in the statement of financial position | Not offset in the statement of financial position | Net exposure | |||||||
|---|---|---|---|---|---|---|---|---|---|
| Amounts in millions of euros | Amount before offsetting | IAS 32 Offsetting | Net carrying amount | Master netting agreements | Securities and cash collateral | Immovable property collateral | Other collateral | Financial guarantees | |
On December 31, 2025 | |||||||||
| Loans and advances to credit institutions | 33,052 | - | 33,052 | - | (27,817) | - | - | - | 5,235 |
| Derivatives | 131,243 | (111,620) | 19,623 | (8,030) | (7,236) | - | - | - | 4,357 |
| Loans and advances to customers | 473,184 | (865) | 472,319 | - | (21,858) | (304,247) | (109,650) | (4,754) | 31,810 |
| Other assets | 6,402 | - | 6,402 | - | - | - | - | - | 6,402 |
| Total | 643,881 | (112,485) | 531,396 | (8,030) | (56,911) | (304,247) | (109,650) | (4,754) | 47,804 |
| Deposits from credit institutions | 10,414 | (197) | 10,217 | - | (34) | - | - | - | 10,183 |
| Deposits from customers | 440,253 | (6,350) | 433,903 | - | (73) | - | - | - | 433,830 |
| Derivatives | 118,800 | (105,938) | 12,862 | (8,030) | (2,452) | - | - | - | 2,380 |
| Other liabilities | 5,585 | - | 5,585 | - | - | - | - | - | 5,585 |
| Total | 575,052 | (112,485) | 462,567 | (8,030) | (2,559) | - | - | - | 451,978 |
On December 31, 2024 | |||||||||
| Loans and advances to credit institutions | 27,045 | (10) | 27,035 | - | (19,595) | - | - | - | 7,440 |
| Derivatives | 141,415 | (117,986) | 23,429 | (10,358) | (7,791) | - | - | - | 5,280 |
| Loans and advances to customers | 456,097 | (1,612) | 454,485 | - | (15,699) | (297,050) | (102,308) | (5,233) | 34,195 |
| Other assets | 6,695 | - | 6,695 | - | - | - | - | - | 6,695 |
| Total | 631,252 | (119,608) | 511,644 | (10,358) | (43,085) | (297,050) | (102,308) | (5,233) | 53,610 |
| Deposits from credit institutions | 16,152 | (3,705) | 12,447 | - | (400) | - | - | - | 12,047 |
| Deposits from customers | 413,592 | (2,156) | 411,436 | - | (146) | - | - | - | 411,290 |
| Derivatives | 131,122 | (113,747) | 17,375 | (10,358) | (4,040) | - | - | - | 2,977 |
| Other liabilities | 5,702 | - | 5,702 | - | - | - | - | - | 5,702 |
| Total | 566,568 | (119,608) | 446,960 | (10,358) | (4,586) | - | - | - | 432,016 |
The next table shows the credit-impaired financial assets in relation to the collateral that is held as security to mitigate credit risk. In some cases, Rabobank did not recognize a loan impairment allowance for individually assessed exposures because of a surplus of collateral.
Collateral Held as Security and Other Credit Enhancements for Credit-impaired Financial Assets
| Amounts in millions of euros | Gross carrying amount credit impaired financial assets | Impairment allowances | Carrying amount after deduction impairment allowance | Collateral held as security and other credit enhancements |
|---|---|---|---|---|
On December 31, 2025 | ||||
| Loans and advances to credit institutions | 1 | - | 1 | 1 |
| Loans and advances to customers | 8,050 | 1,627 | 6,423 | 5,399 |
| Financial assets at fair value through other comprehensive income | - | - | - | - |
| Total | 8,051 | 1,627 | 6,424 | 5,400 |
On December 31, 2024 | ||||
| Loans and advances to credit institutions | 1 | - | 1 | 1 |
| Loans and advances to customers | 9,875 | 1,592 | 8,283 | 7,257 |
| Financial assets at fair value through other comprehensive income | - | - | - | - |
| Total | 9,876 | 1,592 | 8,284 | 7,258 |
The next table sets out the maximum exposure to credit risk to which Rabobank is exposed for financial instruments not subject to the IFRS 9 impairment requirements, without taking into account any collateral or other measures for restricting credit risk. It also shows the financial effect of any collateral provided or other types of credit risk reduction. In some cases the amounts stated deviate from the carrying amounts as presented in the statement of financial position because outstanding equity instruments are included in the carrying amounts but not included in the maximum exposure to credit risk as presented below.
Maximum Exposure to Credit Risk of Financial Assets Not Subject to Impairment
| Amounts in millions of euros | ||
|---|---|---|
| Maximum exposure to credit risk | Collateral held as security and other credit enhancements | |
On December 31, 2025 | ||
| Financial assets held for trading | 2,643 | - |
| Financial assets mandatorily at fair value | 859 | 247 |
| Derivatives | 19,623 | 5,932 |
| Total | 23,125 | 6,179 |
On December 31, 2024 | ||
| Financial assets held for trading | 1,619 | - |
| Financial assets mandatorily at fair value | 955 | 267 |
| Derivatives | 23,430 | 6,763 |
| Total | 26,004 | 7,030 |
Write-off Policy
Rabobank writes off loans when it has exhausted all practical recovery efforts and has concluded there is no reasonable expectation of recovery. Indicators that there is no reasonable expectation of recovery include (i) ceasing enforcement activity and (ii) where the recovery method is foreclosing on collateral and the value of the collateral is such that there is no reasonable expectation of recovering in full. Rabobank may write-off loans that are still subject to enforcement activity. The outstanding contractual amounts of partly or wholly written off assets during 2025 was EUR 376 million (2024: EUR 1,431 million).
Rabobank acquired financial and non-financial assets during the year by taking possession of collateral with an estimated value of EUR 38 million as at December 31, 2025 (2024: EUR 34 million). It is Rabobank policy to sell these assets in the reasonably foreseeable future. Yields are allocated to repayment of the outstanding amount.
4.3.8 Modified Assets
The following table includes information about financial assets with lifetime ECL whose cash flows were modified during the period:
Financial Assets Modified While Loss Allowance Measured at Lifetime ECL
| Amounts in millions of euros | 2025 | 2024 |
|---|---|---|
| Amortized cost before modification | 1,054 | 1,554 |
| Net modification gain/ loss | (5) | 2 |
| Financial assets modified since initial recognition | 1,049 | 1,556 |
The risk of default of modified assets is assessed at the reporting date and compared with the risk under the original terms at initial recognition. Rabobank monitors the subsequent performance of these forborne modified assets and may determine that the credit risk has significantly improved, so that the assets are moved from stage 3 or stage 2 (Lifetime ECL) to stage 1 (12-month ECL). The gross carrying amount of such assets held as at December 31, 2025 was EUR 294 million (2024: EUR 231 million).
4.3.9 Connectivity between the Financial Statements and the Sustainability Statements
Based on its 2025 Double Materiality Assessment (DMA), Rabobank identified several sustainability topics that are material from a financial risk perspective. The connectivity between the financial statements and the sustainability statements is reflected explicitly in the area of credit risk and non-financial risk.
First of all, the consequences of climate and nature change (physical risks) and the risks related to a shift towards a impact neutral economy (transition risks). ESG risks are translated into IFRS impairment allowances through multiple channels. The impairment allowances are captured in the IFRS 9 ECL models through macroeconomic developments, embedded in individual client assessments, included in the sector vulnerability assessments, and Management Adjustments are made for sectors or regions affected by climate and nature. For ECL Management Adjustments related to risks of clients towards “Climate Change Adaptation”, “Climate Change Mitigation”, and “Land use”, reference is made to the Management Adjustment Climate Risk: Forward Looking Climate end Environmental (C&E) Risks in section 2.1 "Judgments and estimates".
Risks related to “Pollution” are reflected for Rabobank in the nitrogen reduction measures that lead to uncertainties in the Dutch agricultural sector for which an ECL Management Adjustment is recognized. Reference is made to the Management Adjustment Climate risk: Livestock in section 2.1 "Judgments and estimates".
The sustainability topics “Information and Safety related impacts” and “Financial economic crime” are disclosed in section 4.7 on “Non-financial risks” respectively section 4.9 on “Legal and Arbitration Proceedings”.
Financial economic crime is strongly linked to the role Rabobank plays conform Wwft in Anti-Money Laundering and Counter Terrorism Financing. Preventing fraud and use by criminals of our infrastructure is disclosed in section 4.7.2 "Compliance".
4.4 Market Risk in the Banking Book
Rabobank manages its balance sheet in order to protect the asset & liability positions against interest rate risk in the banking book (IRRBB), credit spread risk in the banking book (CSRBB) and FX & commodity (price) risk in the banking book (FXCPRBB).
4.4.1 Interest Rate Risk in the Banking Book
Interest rate risk in the banking book refers to the risk that the financial results and/or the economic value of the banking book could be adversely affected by changes in market interest rates.
Interest rate risk at Rabobank arises because of repricing and maturity mismatches between loans and funding, and optionality in client products. Customer behaviour is an important determining factor with respect to interest rate risk in the banking book. The modelling of customer behaviour is therefore one of the core elements of the interest rate risk framework. Behavioural models and assumptions are among others in place for mortgage prepayments, savings accounts and current accounts.
Rabobank accepts a certain amount of interest rate risk in the banking book; this is a fundamental part of banking. But at the same time the bank also aims to avoid unexpected material fluctuations in the financial result and the economic value due to interest rate fluctuations. The Managing Board, overseen by the Supervisory Board, therefore annually approves the interest rate risk appetite and the corresponding interest rate risk limits.
At group level, Rabobank’s interest rate risk is governed by the Asset and Liability Committee Group chaired by the Chief Financial Officer. Treasury is responsible for implementing the decisions of this committee, while Risk Management is responsible for monitoring the interest rate risk position independently from a second line of responsibility.
Economic value of equity as a measure for managing interest rate risk differs from the accounting value of equity. For interest rate risk management, the economic value of equity is defined as the present value of assets minus the present value of liabilities together with the present value of the off-balance-sheet items. Through the use of hedge accounting and as a large proportion of the balance sheet is carried at amortized cost (in IFRS terms), a loss in economic value does not automatically equate with accounting losses.
As part of its interest rate risk policy, Rabobank uses among others the following indicators for managing and controlling interest rate risk:
Earnings at risk: the EaR is the largest deviation in negative terms of the expected net interest income in the next 12 months as a result of different interest rates scenarios;
Modified duration of equity (MDoE);
Basis point value (BPV);
Delta profile (BPV per tenor);
Economic Value at Risk;
Supervisory Outlier Test (SOT) on EVE;
Supervisory Outlier Test (SOT) on NII;
IRRBB & CSRBB Economic Capital
The next sections provide further details on "Earnings at risk" and "Modified duration” developments.
Earnings at Risk
The Earnings at risk indicator is calculated once a month based on a standard interest-rate-sensitivity analysis. This indicator shows the changes in the projected net interest income over the next 12 months triggered by a set of scenarios: one in which all market interest rates gradually increase by two percentage points, by a scenario in which all market interest rates gradually decrease by a maximum of two percentage points (interest rates in this scenario are floored at levels deemed as realistic), by two scenarios in which interest rates increase and decrease instantaneously by 1 percentage point and by two scenarios in which the yield curve steepens or flattens.
In 2025, Rabobank’s net interest income was most sensitive to the interest rate down scenario. Earnings at Risk amounted to minus EUR 708 million on December 31, 2025, which was an increase of Earnings at Risk compared to December 31, 2024 minus EUR 557 million.
Earnings at Risk
| December 31, 2025 | December 31, 2024 | |
| Earnings at Risk | (708) | (557) |
| Split by main currencies | ||
| Earnings at Risk – EUR | (696) | (556) |
| Earnings at Risk – USD | (20) | (9) |
Modified Duration
Modified duration (MD) of equity indicates the reduction of economic value of equity in percentage points if market interest rates increase by one percentage point. For 2025, the Managing Board has set an upper MD limit of 6.0%. During 2025 Modified Duration has decreased from 3.5% as per December 31, 2024, to 2.9% as per December 31, 2025.
4.4.2 Credit Spread Risk in the Banking Book (CSRBB)
The risk that is driven by changes in the market perception about the price of credit risk, liquidity premium and potentially other components of credit-risky instruments introducing fluctuations in the price which are not explained by IRRBB or by expected credit/(jump-to-) default risk.
Rabobank uses Credit Spread Value of a Basis Point (“CS01”) for managing and controlling credit spread risk in the banking book. Additionally, there are Earnings at Risk (EaR), CSRBB Economic Value of Equity (CSRBB EVEatR) and Earnings at Risk+ (EaR+) risk measures to further cover both value and earnings aspects of CSRBB.
Credit Spread Value of a Basis Point (CS01)
CS01 measures the change in the market value of assets because of a one basis point upward shock in the credit spreads. Over the course of the year, the size of the liquidity portfolio increased leading to an increase in the CS01 indicator.
CS01
| Amounts in millions of euros | December 31, 2025 | December 31, 2024 |
|---|---|---|
| CS01 | (14.7) | (10.3) |
4.4.3 FX & Commodity (Price) Risk in the Banking Book (FXCPRBB)
FX and Commodity (Price) Risk is the risk that (adverse) changes in foreign exchange rates and commodity prices lead to (negative) consequences in a bank’s Banking Book and consequently on its financial figures and ratios.
FXCPRBB, together with Interest Rate Risk in the Banking Book (IRRBB) and Credit Spread Risk in the Banking Book (CSRBB), is a sub-risk under Market Risk in the Banking Book as defined in Rabobank’s Global Policy on Risk Management and Risk Taxonomy. The Global Standard on FXCPRBB describes what is required to manage, monitor, and report the identified and assessed foreign exchange and commodity price risks.
FX Translation Risk (Banking Book)
FX Translation Risk is the risk that FX fluctuations will adversely affect the translation of assets and liabilities of operations –denominated in foreign currency– into the functional currency of the parent company. Functional currency for Rabobank is Euro. Translation Risk impacts Rabobank’s equity position, risk-weighted assets and capital ratios.
FX Translation Risk Management includes managing the sensitivity of the Rabobank's CET1 ratio due to FX movements. A strategy for a given currency may entail full ratio hedging, absolute capital hedging, or an approach in between (partial ratio hedging). Rabobank aims for a limited FX Translation Risk impact of exchange rate movements on its CET1 ratio.
Currency Risk (Banking Book)
Currency Risk is the risk that (unexpected) exchange rate movements lead to (negative) consequences in open currency positions present in the Banking Book. Currency mismatches in banking book assets and liabilities imply sensitivity to FX changes and trigger this risk. Rabobank does not have any appetite to run FX mismatches in its banking books.
Commodity (Price) Risk (Banking Book)
Commodity (Price) Risk is the risk that Banking Book is exposed to (adverse) movements in commodity prices. and Rabobank aims not to be exposed to it in its banking book.
4.5 Market Risk in the Trading Book
Market risk in the trading environment arises from the risk of losses on the trading book positions, affected by movements in interest rates, credit spreads, currencies, commodities, and equities . Risk positions acquired from clients can either be redistributed to other clients or managed through risk transformation (hedging). The trading desks also act as a market-maker for secondary markets (by providing liquidity and pricing) in interest rate derivatives, commodities, FX and debt, including Rabobank bonds and Rabobank Certificates.
Market risk in the trading environment is monitored at least daily within the market risk framework. This framework measures, monitors and manages market risk in the trading books and extends to all derivatives and debt positions in the trading books as well as loan syndication books. An important part of the framework are appropriate limit and trading control structures. The Managing Board determines Rabobank’s risk appetite on an annual basis. A cascading limit structure with an increasing granularity has been implemented from Rabobank’s consolidated level down to the Markets business unit and underlying portfolios.
The risk appetite for market risk is small due to Rabobank’s strategy of client risk redistribution and risk hedging. Regular risk reporting to risk management committees (monthly), senior management (weekly), as well as daily reporting on portfolio level ensure timely communication of key risk developments. Risk developments that require urgent attention are communicated accordingly outside the regular reporting cycle. In case of any limit breaches, remedial actions will be stipulated to bring the exposure back within the appetite.
At consolidated level, the risk appetite is defined for a number of risk measures. Event risk trading book and stress test loan underwriting are considered the most important ones. Additional indicators in the risk appetite statement relate to VaR, interest rate delta, regulatory capital for market risk in the trading book and regulatory capital for credit valuation adjustment, as well as notional bridge loan syndication limits and stress testing limits for (highly) leveraged underwriting transactions.
Rabobank considers Event Risk a key risk indicator for market risk in the trading book. Event risk in the trading book is based on loss estimates generated from extreme, but plausible moves in risk factors by using sensitivity, hypothetical and historical stress scenarios. Risk factors captured by these scenarios include tenor basis swap spreads, interest rates, credit spreads, FX rates, commodity futures, and volatility. For interest rates, this also includes rotation scenarios. Depending on the scenario, individual or multiple risk factors will be stressed.
The event risk, measured by taking the worst loss among all predefined scenarios, was EUR 25 million on December 31, 2025, well within the set limit. It fluctuated between EUR 21 million and EUR 39 million with an average of EUR 29 million.
Outside the trading environment a stress test limit is applied to the underwriting business. The stress test is based on internal credit risk scores that mirror debt ratings and the market's categorization of the debt. The stress test was EUR 227 million on December 31, 2025, and EUR 121 million on December 31, 2024, well within the set limit.
The VaR indicates the maximum loss for a given confidence level and horizon under ‘normal’ market conditions, based on one year of historical market movements. For internal risk management purposes, Rabobank has opted for a confidence level of 97.5% and a time horizon of one day. The table below presents the composition of the VaR and its range of movements. In 2025, the VaR fluctuated between EUR 1.9 million and EUR 5.1 million, with the average being EUR 3.0 million. The VaR amounted to EUR 2.1 million on December 31, 2025.
VAR (1 day, 97.5%) (amounts in millions of euros)
| Interest | Credit | Currencies | Shares | Commodities | Diversification | Total | |
| December 31, 2025 | 1.9 | 0.4 | 0.2 | 0.0 | 0.5 | (0.9) | 2.1 |
| 2025 – average | 2.3 | 1.2 | 0.3 | 0.0 | 0.5 | 3.0 | |
| 2025 – highest | 3.8 | 3.6 | 1.7 | 0.0 | 1.2 | 5.1 | |
| 2025– lowest | 1.6 | 0.3 | 0.1 | 0.0 | 0.2 | 1.9 | |
| December 31, 2024 | 2.5 | 1.3 | 0.2 | 0.0 | 0.4 | (1.3) | 2.7 |
| 2024 – average | 2.7 | 2.1 | 0.3 | 0.0 | 0.5 | 3.8 | |
| 2024– highest | 6.0 | 5.6 | 0.8 | 0.0 | 1.0 | 9.0 | |
| 2024 –lowest | 1.5 | 1.0 | 0.2 | 0.0 | 0.2 | 2.2 |
The interest rate delta measures the change in the value of positions for a parallel increase in the yield curve of 1 basis point (i.e. 0.01 percentage point). The interest rate delta table below shows the sensitivity of positions to changes in the yield curves for the major currencies. On December 31, 2025, the interest rate delta for trading books was negative EUR 0.18 million. The interest rate delta remained well within the set limit during the reporting period.
Interest Rate Delta
| Amounts in millions of euros | December 31, 2025 | December 31, 2024 |
| USD | (0.11) | (0.01) |
| EUR | (0.04) | 0.09 |
| GBP | (0.01) | (0.02) |
| Other | (0.01) | 0.04 |
| Total | (0.18) | 0.10 |
4.6 Liquidity Risk
Liquidity risk is the risk that Rabobank will not be able to meet all of its payment and repayment obligations on time, as well as the risk that Rabobank will not be able to fund increases in assets at a reasonable price, if at all. This could happen if, for instance, customers or professional counterparties suddenly withdraw more funds than expected and which could not be absorbed by the bank’s cash resources, by selling or pledging assets in the market or by borrowing funds from third parties. Rabobank considers an adequate liquidity position and retaining the confidence of both professional market parties and retail customers to be crucial in ensuring unimpeded access to the public money and capital markets.
Rabobank has in place a well-suited liquidity management framework equipped with adequate liquidity positions (stable funded balance sheet, sufficient and high-quality liquidity buffers, diversified funding profile, and limited structural currency mismatch with liquidity measures managed to target and well within risk limits).
Liquidity risk management consists of several components. A key component is to maintain a substantial high-quality buffer of liquid assets. Besides credit balances held at central banks, these assets can be pledged to central banks, in repo transactions, or can be sold directly in the market to generate liquidity immediately. The size of the liquidity buffer is attuned to the risk Rabobank is exposed to in its balance sheet. In addition, Rabobank has securitized a portion of the mortgage and SME loan portfolio internally, which means it can be pledged to the central bank, thereby serving as an additional liquidity buffer. Since this concerns retained securitizations, it is not reflected in the consolidated balance sheet.
Other components for managing liquidity risk are a good credit rating, high capital levels and prudent funding policies. Rabobank takes various measures to avoid becoming overly dependent on a single source of funding. These include balanced diversification of financing sources regarding maturity, currencies, investors, geography and markets, a high degree of unsecured funding and therefore limited asset encumbrance, and an active and consistent investor-relations policy.
Also setting strict limits for the maximum outgoing cash flows within the wholesale banking business is a crucial element of liquidity risk management. Among other things, Rabobank measures and reports on a daily basis what incoming and outgoing cash flows can be expected during the next 12 months. Limits have been set for these outgoing cash flows, including for each currency and each location. Detailed plans (the contingency funding plans) have been drawn up for contingency funding to ensure the bank is prepared for potential crisis situations. Periodic operational tests are performed for these plans.
Furthermore, an internal stress test framework is in place to ensure that in times of severe liquidity stress, Rabobank has adequate counterbalancing capacity to meet the associated, heightened outflow of funding for a prolonged period. The framework covers market wide stress scenarios, Rabobank stress scenarios and combined stress scenarios. Under these various scenarios, the liquidity buffer is compared with anticipated stressed net contractual and contingent outflows.
The table below shows the undiscounted liabilities grouped according to the remaining liquidity period from the reporting date to the expected contract repayment date. The total amounts do not correspond exactly with the amounts in the consolidated statement of financial position because this table is based on undiscounted contractual cash flows relating to both principal and future interest payments. Derivatives are not included in this table and have not been analyzed on the basis of the contractual due date, because they are not essential for the management of liquidity risk or for reporting to senior management. The maturity profile of derivatives used for cash flow hedging is disclosed in Section 10.3 "Derivatives Designated as Hedging Instrument".
Contractual Repayment Date
| Amounts in millions of euros | On demand | Less than 3 months | 3 months to 1 year | 1 - 5 years | Longer than 5 years | No maturity applicable | Total |
|---|---|---|---|---|---|---|---|
On December 31, 2025 | |||||||
Liabilities | |||||||
| Deposits from credit institutions | 1,992 | 1,542 | 1,381 | 2,987 | 971 | 1,792 | 10,665 |
| Deposits from customers | 377,876 | 8,170 | 14,314 | 12,686 | 20,100 | 4,073 | 437,219 |
| Debt securities in issue | 5,338 | 10,564 | 31,367 | 43,604 | 30,576 | - | 121,449 |
| Other liabilities (excluding employee benefits and lease liabilities) | 1,734 | 779 | 1,619 | 339 | 26 | 171 | 4,668 |
| Lease liabilities | 7 | 12 | 28 | 179 | 93 | - | 319 |
| Financial liabilities held for trading | - | 464 | - | - | - | - | 464 |
| Financial liabilities designated at fair value | 221 | 159 | 52 | 801 | 1,012 | - | 2,245 |
| Subordinated liabilities | 26 | 29 | 1,522 | 3,567 | 3,496 | - | 8,640 |
| Total financial liabilities | 387,194 | 21,719 | 50,283 | 64,163 | 56,274 | 6,036 | 585,669 |
| Financial guarantees | 4,650 | - | - | - | - | - | 4,650 |
| Loan commitments | 64,047 | - | - | - | - | - | 64,047 |
| Amounts in millions of euros | On demand | Less than 3 months | 3 months to 1 year | 1 - 5 years | Longer than 5 years | No maturity applicable | Total |
On December 31, 2024 | |||||||
Liabilities | |||||||
| Deposits from credit institutions | 3,867 | 790 | 1,800 | 3,246 | 815 | 2,367 | 12,885 |
| Deposits from customers | 351,520 | 10,856 | 15,153 | 11,986 | 21,597 | 4,426 | 415,538 |
| Debt securities in issue | 5,610 | 9,894 | 29,563 | 52,231 | 31,410 | - | 128,708 |
| Other liabilities (excluding employee benefits and lease liabilities) | 1,884 | 431 | 1,672 | 547 | 59 | 312 | 4,905 |
| Lease liabilities | 13 | 16 | 40 | 197 | 117 | - | 383 |
| Financial liabilities held for trading | - | 277 | - | - | - | - | 277 |
| Financial liabilities designated at fair value | 491 | 205 | 194 | 826 | 1,010 | - | 2,726 |
| Subordinated liabilities | 29 | 64 | 1,737 | 5,296 | 4,091 | - | 11,217 |
| Total financial liabilities | 363,414 | 22,533 | 50,159 | 74,329 | 59,099 | 7,105 | 576,639 |
| Financial guarantees | 6,054 | - | - | - | - | - | 6,054 |
| Loan commitments | 61,258 | - | - | - | - | - | 61,258 |
The table below shows assets and liabilities grouped according to the period remaining from the reporting date to the contractual repayment date. These amounts correspond to the amounts included in the Consolidated Statement of Financial Position.
Current and Non-current Financial Instruments
| Amounts in millions of euros | On demand | Less than 3 months | 3 months to 1 year | 1 - 5 years | Longer than 5 years | No maturity applicable | Total |
|---|---|---|---|---|---|---|---|
On December 31, 2025 | |||||||
Financial assets | |||||||
| Cash and cash equivalents | 62,203 | - | - | - | - | 568 | 62,771 |
| Loans and advances to credit institutions | 9,933 | 11,903 | 8,969 | 67 | 10 | 2,170 | 33,052 |
| Financial assets held for trading | 211 | 1,244 | 76 | 364 | 748 | 376 | 3,019 |
| Financial assets mandatorily at fair value | 352 | 81 | 19 | 69 | 497 | 2,000 | 3,018 |
| Derivatives | 958 | 1,896 | 2,297 | 3,727 | 10,745 | - | 19,623 |
| Loans and advances to customers | 56,429 | 17,753 | 32,382 | 130,357 | 233,933 | 1,465 | 472,319 |
| Financial assets at fair value through other comprehensive income | 204 | 584 | 1,010 | 10,735 | 16,887 | 134 | 29,554 |
| Other assets (excluding employee benefits) | 186 | 701 | 612 | 2,988 | 252 | 1,654 | 6,393 |
| Total financial assets | 130,476 | 34,162 | 45,365 | 148,307 | 263,072 | 8,367 | 629,749 |
Financial liabilities | |||||||
| Deposits from credit institutions | 1,989 | 1,525 | 1,332 | 2,741 | 838 | 1,792 | 10,217 |
| Deposits from customers | 377,910 | 8,154 | 14,495 | 11,840 | 17,431 | 4,073 | 433,903 |
| Debt securities in issue | 5,323 | 10,476 | 30,332 | 38,436 | 26,378 | - | 110,945 |
| Derivatives | 601 | 1,383 | 1,148 | 2,865 | 6,865 | - | 12,862 |
| Financial liabilities held for trading | - | 464 | - | - | - | - | 464 |
| Other liabilities (excluding employee benefits and lease liabilities) | 1,623 | 1,043 | 1,630 | 561 | 76 | 119 | 5,052 |
| Lease liabilities | 7 | 11 | 25 | 154 | 94 | - | 291 |
| Financial liabilities designated at fair value | 220 | 155 | 39 | 695 | 949 | - | 2,058 |
| Subordinated liabilities | 23 | 23 | 1,327 | 2,835 | 1,802 | - | 6,010 |
| Total financial liabilities | 387,696 | 23,234 | 50,328 | 60,127 | 54,433 | 5,984 | 581,802 |
| Net balance | (257,220) | 10,928 | (4,963) | 88,180 | 208,639 | 2,383 | 47,947 |
| Amounts in millions of euros | On demand | Less than 3 months | 3 months to 1 year | 1 - 5 years | Longer than 5 years | No maturity applicable | Total |
|---|---|---|---|---|---|---|---|
On December 31, 2024 | |||||||
Financial assets | |||||||
| Cash and cash equivalents | 84,093 | 51 | - | 10 | - | 720 | 84,874 |
| Loans and advances to credit institutions | 14,337 | 5,927 | 3,302 | 95 | 8 | 3,366 | 27,035 |
| Financial assets held for trading | 206 | 257 | 52 | 379 | 726 | 120 | 1,740 |
| Financial assets mandatorily at fair value | 334 | 129 | 142 | 40 | 453 | 2,071 | 3,169 |
| Derivatives | 1,714 | 1,754 | 1,824 | 5,298 | 12,840 | - | 23,430 |
| Loans and advances to customers | 47,004 | 17,048 | 38,631 | 132,073 | 217,967 | 1,762 | 454,485 |
| Financial assets at fair value through other comprehensive income | 155 | 636 | 705 | 4,581 | 12,629 | 117 | 18,823 |
| Other assets (excluding employee benefits) | (139) | 907 | 654 | 3,042 | 180 | 2,042 | 6,686 |
| Total financial assets | 147,704 | 26,709 | 45,310 | 145,518 | 244,803 | 10,198 | 620,242 |
Financial liabilities | |||||||
| Deposits from credit institutions | 3,861 | 777 | 1,737 | 3,011 | 693 | 2,368 | 12,447 |
| Deposits from customers | 351,537 | 10,835 | 15,244 | 11,196 | 18,198 | 4,426 | 411,436 |
| Debt securities in issue | 5,586 | 9,732 | 28,441 | 46,755 | 26,248 | - | 116,762 |
| Derivatives | 2,053 | 1,863 | 2,381 | 3,993 | 7,085 | - | 17,375 |
| Financial liabilities held for trading | - | 277 | - | - | - | - | 277 |
| Other liabilities (excluding employee benefits and lease liabilities) | 1,775 | 696 | 1,705 | 714 | 121 | 133 | 5,144 |
| Lease liabilities | 9 | 14 | 34 | 173 | 105 | - | 335 |
| Financial liabilities designated at fair value | 489 | 202 | 182 | 723 | 970 | - | 2,566 |
| Subordinated liabilities | 26 | 52 | 1,491 | 4,292 | 2,048 | - | 7,909 |
| Total financial liabilities | 365,336 | 24,448 | 51,215 | 70,857 | 55,468 | 6,927 | 574,251 |
| Net balance | (217,632) | 2,261 | (5,905) | 74,661 | 189,335 | 3,271 | 45,991 |
The overview presented above was composed based on contractual information and does not represent the actual behavior of these financial instruments, which is accounted for in the day-to-day management of liquidity risk. Customer savings are an example. Under contract, these are payable on demand. Experience has shown that they are a very stable source of long-term financing for Rabobank. The liquidity regulations of the supervisory authority also factor this in.
With a Liquidity Coverage Ratio (LCR) of 182% as at December 31, 2025 (December 31, 2024: 175%), Rabobank complies with the minimum 100% requirement as set by the Dutch Central Bank (DNB).
The liquidity requirements to meet payments under financial guarantees are considerably lower than the notional amount of the liabilities because Rabobank does not generally expect that third parties to such arrangements will draw funds. The total outstanding amount in contractual obligations to provide credit does not necessarily represent Rabobank's future cash resource needs because many of these obligations will lapse or terminate without financing being required.
4.7 Non-Financial Risks
4.7.1 Operational Risk
Inadequate or failing processes, people, systems, and /or external events are an inevitable part of Rabobank's business activities. Rabobank manages these operational risks within the boundaries set by our risk appetite as appropriate to the complexity and size of our organization and pro-actively monitors the risks and takes action where needed. Managing operational risks is an integral part of the way we do business supported by risk and control activities
Risk Profile Performance
Additional progress was made in managing operational risks during 2025. The overall profile remains elevated but stable for newly reported incidents. Remediation programs are in place to continue to lower the operational risk profile. The majority of Rabobank's operational risk losses in 2025 were related to Execution, Delivery and Process Management.
4.7.2 Compliance
External fraud
External fraud occurs when a client or third party intentionally engages in deceptive or dishonest conduct to obtain an unjust or illegal financial benefit. In 2025, the Group recorded a reduction in external fraud losses compared to 2024. This improvement reflects continued strengthening of the Group's fraud risk management framework. Credit related fraud and fraud involving payment products continue to represent important areas of fraud exposure for the Group. Looking ahead, new regulatory requirements for payment services will take effect 2026. It is expected that this will have a moderate impact on the Group's fraud management approach. Related fraud and fraud involving payment products remain key areas of attention. Looking ahead, 2026 is expected to be an important year as new regulatory requirements for payment services are introduced, bringing both challenges and opportunities to further reinforce the Group’s fraud controls.
Internal Fraud and Integrity Violations
Internal fraud arises when an employee commits an intentional act, involving deception or dishonesty, to obtain or cause an unjust or illegal advantage or disadvantage. Preventative and detective controls to mitigate the risk of these events occurring are embedded throughout the Bank, and include employee screening, authorized access restrictions, and whistleblowing and reporting mechanisms. The governance is captured in Rabobank’s Global Policy on Financial Crime Compliance and Rabobank’s Global Standard on Internal Fraud which are periodically reviewed. The whistleblowing channel is available for staff to ensure that signals of internal fraud and integrity violations are referred to the relevant department for follow up, which is formalized in Rabobank’s Global Policy on Whistleblowing. Internal fraud or integrity investigations are governed by Rabobank’s Global Procedure on Internal Integrity Investigations. Rabobank is not aware of any current internal fraud incidents that could potentially result in the financial statements being materially misstated.
4.7.3 Model and AI Risk
Models are powering processes, products, and services to deliver customer-centric solutions and enable data-driven decisions. In an ever-changing environment, models are strategic assets that help Rabobank to stay relevant. Managing model risk is critical for decision-making, financial stability, and regulatory compliance. Rabobank’s Model Risk Management framework spans across the full model lifecycle, including independent model validation. This ensures that models are reliable and responsibly used.
In 2025, Rabobank laid the foundation for robust AI risk management by updating policies, in alignment with EU AI Act requirements. Integral and integrated AI risk management will ensure responsible AI innovation and sustained regulatory compliance across the organization.
4.8 Fair Value of Financial Assets and Liabilities
For fair value measurement Rabobank assumes that the transaction to sell an asset or transfer a liability is conducted in the principal market for the asset or liability, or in the most advantageous market if no principal market exists.
Market prices are not available for a large number of the financial assets and liabilities that Rabobank holds or issues. For financial instruments for which no market prices are available, the fair values shown in the following table have been estimated using the present value or the results of other estimation and valuation methods, based on the market conditions on the reporting date. The values produced using these methods are highly sensitive to the underlying assumptions used for the amounts and for the timing of future cash flows, discount rates and possible market illiquidity. The following methods and assumptions have been used.
Cash and Cash Equivalents
The fair value of cash and cash equivalents is assumed to be almost equal to their carrying amount. This assumption is used for highly liquid investments and for the short-term component of all other financial assets and liabilities.
Loans and Advances to Credit Institutions
Loans and advances to credit institutions also include interbank placings and items to be collected. The fair values of floating rate placings, which are repriced regularly and do not vary significantly in terms of credit risk, and overnight deposits are their carrying amounts. The estimated fair value of fixed-interest deposits is based on the present value of the cash flows, calculated based on appropriate money market interest rates for debts with comparable credit risks and terms to maturity.
Financial Assets and Derivatives Held for Trading
Financial assets held for trading are carried at fair value based on available quoted prices in an active market. If quoted prices in an active market are not available, the fair value is estimated based on discounted cash flow models and option valuation models.
Derivatives are recognized at fair value determined on the basis of listed market prices (mid-prices are used for EUR, USD and GBP derivatives that have a bid-ask range), prices offered by traders, discounted cash flow models and option valuation models based on current market prices and contract prices for the underlying instruments which reflect the time value of money, yield curves and the volatility of the underlying assets and liabilities.
Credit valuation adjustments (CVA) are included in the valuation of OTC derivatives to reflect expected credit losses related to the non-performance risk of a given counterparty. A CVA is determined per counterparty and depends on expected future exposure taking into account collateral, netting agreements and other relevant contractual factors, default probability and recovery rates. The CVA calculation is based on available market data including credit default swap (CDS) spreads. If CDS spreads are not available relevant proxies are used. A debit valuation adjustment (DVA) is made to include own credit in the valuation of OTC derivatives. The calculation of DVA is consistent with the CVA framework and is calculated using the Rabobank CDS spread. Another set of factors taken into account is the funding valuation adjustments (FVA). FVA concerns the valuation difference between transactions hedged by securities and transactions not hedged by securities. Collateralized derivative transactions are valued by means of a discounting curve, based on the Overnight Indexed Swap. Non-collateralized derivative transactions are valued by means of a discounting curve, based on Euribor plus a spread which reflects the market conditions.
Financial Assets Mandatorily at Fair Value
These financial assets are carried at fair value based on quoted prices in an active market if available. If not, they are estimated from comparable assets on the market, or using valuation methods, that include the appropriate discounted cash flow models and option valuation models.
Loans and Advances to Customers
The fair value of loans and advances to customers is estimated by discounting expected future cash flows using current market rates for similar loans, considering the creditworthiness of the counterparty. For the fair valuation of residential mortgage loans, the contractual cash flows are adjusted for the prepayment rate of the portfolio. For variable-interest loans that are repriced regularly and do not vary significantly in terms of credit risk, the fair value approximates the carrying amount.
Financial Assets at Fair Value through Other Comprehensive Income
These financial assets are measured at fair value based on listed market prices. If quoted prices in an active market are not available, the fair value is estimated based on discounted cash flow models and option valuation models.
Deposits from Credit Institutions
Deposits from credit institutions include interbank placings, items to be collected and deposits. The fair values of floating rate placings, which are repriced regularly and do not vary significantly in terms of credit risk, and overnight deposits are their carrying amounts. The estimated fair value of fixed-interest deposits is based on the present value of the cash flows, calculated based on valid money market interest rates for debts with comparable credit risks and terms to maturity.
Deposits from Customers
Deposits from customers includes current accounts and deposits. The fair value of savings and current account balances that have no specific termination date are assumed to be the amount payable on demand on the reporting date, that is, their carrying amount on that date. The fair value of deposits is estimated from the present value of the cash flows based on current bid rates for interest for similar arrangements and terms to maturity that also match the items to be measured. The carrying amount of variable-interest deposits is a good approximation of their fair value on the reporting date.
Financial Liabilities Held for Trading
The fair value of financial liabilities held for trading is based on available quoted prices in an active market. If quoted prices in an active market are not available, the fair value is estimated on the basis of valuation models.
Financial Liabilities Designated at Fair Value
The fair value option is used to eliminate the accounting mismatch and valuation asymmetry between these instruments and the economic hedging derivatives that would occur if these instruments were accounted for at amortized cost. The financial liabilities designated at fair value include structured notes and structured deposits which are managed and reported on a fair value basis with the hedging derivatives. The fair value of these liabilities is determined by discounting contractual cash flows using credit adjusted yield curves based on available market data in the secondary market. All other market risk parameters are valued consistently with derivatives used to hedge the market risk in these liabilities. Changes in the fair value that are attributable to changes in own credit risk are reported in "Other comprehensive income". The change in fair value that is attributable to changes in own credit risk is calculated by deducting on a note by note basis the current fair value of the structured notes portfolio at the reporting date from the fair value recalculated based on the prevailing credit curve at the time of origination, with all other pricing components unchanged. This calculation reflects the amount that can be attributed to the change in Rabobank's own credit risk since the origination of these liabilities.
Debt Securities in Issue and Subordinated Liabilities
The fair value of these instruments is calculated using quoted prices in an active market. For debt securities for which no quoted prices on an active market are available, a discounted cash flow model is used based on credit adjusted yield curves appropriate for the term to maturity.
The following table shows the fair value of financial instruments, recognized at amortized cost based on the valuation methods and assumptions detailed below. This table is included because not all financial instruments are recognized at fair value in the balance sheet. Fair value represents the price that would have been either received for the sale of an asset or paid in order to transfer a liability in a standard transaction conducted between market participants on the valuation date.
| 2025 | 2024 | |||
|---|---|---|---|---|
| Amounts in millions of euros | Carrying amount | Fair value | Carrying amount | Fair value |
Assets | ||||
| Cash and cash equivalents | 62,771 | 62,770 | 84,874 | 84,875 |
| Loans and advances to credit institutions | 33,052 | 33,052 | 27,035 | 27,014 |
| Loans and advances to customers | 472,319 | 472,511 | 454,485 | 455,448 |
Liabilities | ||||
| Deposits from credit institutions | 10,217 | 10,203 | 12,447 | 12,381 |
| Deposits from customers | 433,903 | 433,591 | 411,436 | 411,921 |
| Debt securities in issue | 110,945 | 109,187 | 116,762 | 114,790 |
| Subordinated liabilities | 6,010 | 6,458 | 7,909 | 8,415 |
The above figures represent management's best estimates on a range of methods and assumptions. If a quoted price in an active market is available, this is the best estimate of fair value.
If no quoted prices in an active market are available for fixed-term securities, equity instruments, derivatives, and commodity instruments, Rabobank bases the expected fair value on the present value of the future cash flows, discounted at market rates which correspond to the credit ratings and terms to maturity of the investments. A model-based price can also be used to determine fair value.
Rabobank follows a policy of having all models used for valuing financial instruments in the statement of financial position validated by expert staff who are independent of the staff who determine the fair values of the financial instruments.
In determining market values or fair values, various factors have been considered. These factors include the time value of money, volatility, underlying options, and credit quality of the counterparty. The valuation process has been designed in such a way that market prices that are available on a periodic basis are systematically used. Modifications to assumptions might affect the fair value of financial assets and liabilities held for trading and non-trading purposes.
The table on the next page illustrates the fair value hierarchy used in determining the fair value of financial assets and liabilities. The breakdown is:
Level 1: Quoted prices in active markets for identical assets or liabilities; an "active market" is a market in which transactions relating to the asset or liability occur in sufficient frequency and at a sufficient volume to provide price information on a permanent basis.
Level 2: Inputs other than quoted prices included in level 1 that are observable for the asset or liability, either directly (i.e. as prices) or indirectly (i.e. derived from prices).
Level 3: Inputs for the asset or liability not based on observable market data.
For recurrent valuations of financial instruments at fair value, Rabobank determines when transfers between the various categories of the fair-value hierarchy occurred by reassessing the level at the end of each reporting period.
| Amounts in millions of euros | Level 1 | Level 2 | Level 3 | Total | |
|---|---|---|---|---|---|
On December 31 2025 | |||||
Assets carried at amortized cost in the statement of financial position | |||||
| Cash and cash equivalents | 62,770 | - | - | 62,770 | |
| Loans and advances to credit institutions | - | 30,209 | 2,843 | 33,052 | |
| Loans and advances to customers | - | 69,953 | 402,558 | 472,511 | |
Assets carried at fair value in the statement of financial position | |||||
| Financial assets held for trading | 1,402 | 73 | 1,544 | 3,019 | |
| Financial assets mandatorily at fair value | 445 | 635 | 1,938 | 3,018 | |
| Derivatives | 23 | 19,496 | 104 | 19,623 | |
| Financial assets at fair value through other comprehensive income | 29,215 | 222 | 117 | 29,554 | |
| Non-current assets held for sale | - | - | 112 | 112 | |
Liabilities carried at amortized cost in the statement of financial position | |||||
| Deposits from credit institutions | - | 10,181 | 22 | 10,203 | |
| Deposits from customers | - | 67,500 | 366,091 | 433,591 | |
| Debt securities in issue | 70,486 | 38,631 | 70 | 109,187 | |
| Subordinated liabilities | 6,237 | 221 | - | 6,458 | |
Liabilities carried at fair value in the statement of financial position | |||||
| Derivatives | 26 | 12,723 | 113 | 12,862 | |
| Financial liabilities held for trading | 464 | - | - | 464 | |
| Financial liabilities designated at fair value | 113 | 1,945 | - | 2,058 | |
| Amounts in millions of euros | Level 1 | Level 2 | Level 3 | Total | |
On December 31 2024 | |||||
Assets carried at amortized cost in the statement of financial position | |||||
| Cash and cash equivalents | 84,875 | - | - | 84,875 | |
| Loans and advances to credit institutions | - | 24,253 | 2,761 | 27,014 | |
| Loans and advances to customers | - | 67,086 | 388,362 | 455,448 | |
Assets carried at fair value in the statement of financial position | |||||
| Financial assets held for trading | 1,140 | 107 | 493 | 1,740 | |
| Financial assets mandatorily at fair value | 311 | 619 | 2,239 | 3,169 | |
| Derivatives | 34 | 23,343 | 53 | 23,430 | |
| Financial assets at fair value through other comprehensive income | 18,427 | 279 | 117 | 18,823 | |
| Non-current assets held for sale | - | - | 142 | 142 | |
Liabilities carried at amortized cost in the statement of financial position | |||||
| Deposits from credit institutions | - | 12,350 | 31 | 12,381 | |
| Deposits from customers | - | 69,847 | 342,074 | 411,921 | |
| Debt securities in issue | 65,531 | 49,259 | - | 114,790 | |
| Subordinated liabilities | 8,160 | 255 | - | 8,415 | |
Liabilities carried at fair value in the statement of financial position | |||||
| Derivatives | 15 | 17,297 | 63 | 17,375 | |
| Financial liabilities held for trading | 277 | - | - | 277 | |
| Financial liabilities designated at fair value | 270 | 2,296 | - | 2,566 |
The potential effect before taxation, if more favorable reasonable assumptions are used for the valuation of the financial instruments in level 3 on the statement of income, is EUR 244 million (2024: EUR 190 million) and EUR 0 million (2024: EUR 0 million) on other comprehensive income. The potential effect before taxation, if more unfavorable reasonable assumptions are used for the valuation of financial instruments in level 3 on the statement of income, is EUR -243 million (2024: EUR -189 million) and EUR 0 million (2024: EUR 0 million) on other comprehensive income.
Financial assets at fair value categorized in Level 3 mainly include private equity interests (in 2024: also including the equity stake in Mechanics Bank) for a total amount of EUR 1,711 million as at December 31, 2025 (2024: EUR 2,065 million). A significant unobservable input for the valuation of the private equity interests is the multiplier which is applied to the EBITDA. The average weighted multiplier is 10.7 (2024: 10.9), with a bandwidth of -1 (unfavorable) and +1 (favorable) of the multiplier.
The table shows movements in the financial instruments which are stated at fair value in the statement of financial position and which are categorized in Level 3. The fair value adjustments in Level 3 which are included in equity are accounted for in the revaluation reserves for financial assets at fair value through comprehensive income.
In 2025 there were no significant transfers between level 1 and level 2.
| Amounts in millions of euros | Balance on January 1, 2025 | Fair value changes incorporated in profit or loss | Fair value changes incorporated in OCI | Purchases | Sales | Settlements | Transfers to or from level 3 | Transfers to assets held for sale | Balance on December 31, 2025 |
|---|---|---|---|---|---|---|---|---|---|
Assets | |||||||||
| Financial assets held for trading | 493 | 7 | - | 1,495 | (409) | (42) | - | - | 1,544 |
| Financial assets mandatorily at fair value | 2,239 | 49 | - | 268 | (289) | (17) | (312) | - | 1,938 |
| Derivatives | 53 | 56 | - | - | - | - | (5) | - | 104 |
| Financial assets at fair value through other comprehensive income | 117 | - | 11 | 8 | - | - | (19) | - | 117 |
Liabilities | |||||||||
| Derivatives | 63 | 49 | - | - | - | 1 | - | - | 113 |
| Financial liabilities designated at fair value | - | - | - | - | - | - | - | - | - |
| Amounts in millions of euros | Balance on January 1, 2024 | Fair value changes incorporated in profit or loss | Fair value changes incorporated in OCI | Purchases | Sales | Settlements | Transfers to or from level 3 | Transfers to assets held for sale | Balance on December 31, 2024 |
|---|---|---|---|---|---|---|---|---|---|
Assets | |||||||||
| Financial assets held for trading | 741 | 30 | - | 681 | (890) | (69) | - | - | 493 |
| Financial assets mandatorily at fair value | 2,150 | 102 | - | 319 | (132) | (200) | - | - | 2,239 |
| Derivatives | 57 | 2 | - | - | - | (5) | (1) | - | 53 |
| Financial assets at fair value through other comprehensive income | 137 | - | (31) | 15 | (4) | - | - | - | 117 |
Liabilities | |||||||||
| Derivatives | 79 | (8) | - | - | - | (8) | - | - | 63 |
| Financial liabilities designated at fair value | - | - | - | - | - | - | - | - | - |
The amount of total gains or losses recognized in the statement of income relating to the assets and liabilities in Level 3 is shown in the following table.
| Amounts in millions of euros | Instruments held at the end of the reporting period | Instruments no longer held at the end of the reporting period | Total |
|---|---|---|---|
On December 31, 2025 | |||
Assets | |||
| Financial assets held for trading | 7 | - | 7 |
| Financial assets mandatorily at fair value | 2 | 47 | 49 |
| Derivatives | 55 | 1 | 56 |
| Financial assets at fair value through other comprehensive income | - | - | - |
Liabilities | |||
| Derivatives | 49 | - | 49 |
| Financial liabilities designated at fair value | - | - | - |
On December 31, 2024 | |||
Assets | |||
| Financial assets held for trading | (1) | 31 | 30 |
| Financial assets mandatorily at fair value | 129 | (27) | 102 |
| Derivatives | 2 | - | 2 |
| Financial assets at fair value through other comprehensive income | - | - | - |
Liabilities | |||
| Derivatives | (8) | - | (8) |
| Financial liabilities designated at fair value | - | - | - |
4.9 Legal and Arbitration Proceedings
Rabobank is active in a legal and regulatory environment that exposes it to a substantial risk of litigation. Rabobank is involved in legal cases, arbitrations, and regulatory proceedings in the Netherlands and in other countries. The most relevant legal and regulatory claims which could give rise to liability on the part of Rabobank are described below. Provisions for legal claims are recognized for obligations arising as a result of a past event where it is probable that an outflow of resources will be required to settle the obligation and a reliable estimate can be made of the amount of the obligation. When determining whether the probability that claims lead to an outflow of resources is more likely than not (i.e. with a likelihood of over 50%), Rabobank takes several factors into account. These factors include (but are not limited to) the type of claim and the underlying facts; the procedural history of each case; rulings from legal and arbitration bodies; Rabobank’s experience and that of third parties in similar cases (if known); previous (third-party) settlements in similar cases (where known); available (potential) recourse; and the advice and opinions of legal advisors and other experts. Similar types of cases are grouped together and some cases may also consist of a number of claims. When information about estimated loss for individual cases is assessed by Rabobank as being expected to seriously prejudice its position in a dispute with other parties, this information is not disclosed separately. The estimated potential losses and provisions are based on the information available at the time and are largely subject to judgments and a number of different assumptions, variables and known and unknown uncertainties. These uncertainties may include the inaccuracy or incompleteness of information available to Rabobank (especially in the early stages of a case). In addition, assumptions made by Rabobank about the future rulings of legal- or other instances or the likely actions or attitudes of supervisory bodies or the parties opposing Rabobank may turn out to be incorrect. Furthermore, estimates of potential losses relating to legal disputes are often impossible to process using statistical or other quantitative analysis instruments that are generally used to make judgments and estimates. The group of cases for which Rabobank determines that the risk of future outflows of funds is more likely than not to occur varies over time, as do the number of cases for which the bank can estimate the potential loss. In practice, the end results could turn out considerably higher or lower than the estimates of potential losses in those cases where an estimate was made. Rabobank can also sustain losses from legal risks where the occurrence of a loss may not be probable, but is not improbable either, and for which no provisions have been recognized. For those cases where (a) the probability of an outflow of funds is not probable but also not remote or (b) the probability of an outflow of funds is more likely than not but the potential loss cannot be estimated reliably, a contingent liability is disclosed. Rabobank may settle legal cases or regulatory proceedings or investigations before any fine is imposed or liability is determined. Reasons for settling could include (i) the wish to avoid costs and/or management effort (ii) avoiding other adverse business consequences and/or (iii) pre-empt the regulatory or reputational consequences of continuing with disputes relating to liability, even if Rabobank believes it has good arguments in its defense. Furthermore, Rabobank may, for the same reasons, compensate third parties for their losses, even in situations where Rabobank does not believe that it is legally required to do so.
Anti-Money Laundering, Counter Terrorism Financing
In December 2022, the Dutch Public Prosecutor (DPP) announced that it considered Rabobank as a suspect in connection to (alleged) violations of the Wwft and started criminal investigations. In its press release of 9 April 2025, the DPP indicated that it has decided to summon Rabobank and that the criminal investigation is in the final phase. In December 2025, an initial draft indictment was received. This draft indictment lacks any specific details, so it is not clear what exact allegations DPP is making against the Bank. Currently the timeframe and potential outcome remain unclear. Consequently, the nature and materiality of the potential impact cannot be reliably estimated beyond stating that it has the potential to be significant.
European Union Competition Law Proceedings
As announced by the European Commission by means of a press release on November 22, 2023, the Commission fined Rabobank EUR 26.6 million in connection with certain historic communications between a small number of individuals at Deutsche Bank and Rabobank, which the Commission has concluded breached EU competition law. These proceedings relate to conduct between 2006 and 2016 on the secondary market for Euro-denominated SSA (Supra-Sovereign, Foreign Sovereign, Sub-Sovereign/Agency) and Government Guaranteed bonds in the European Economic Area (EEA). Rabobank cooperated with the Commission’s investigation and is disappointed by the outcome. The Bank lodged an appeal against the EC’s decision before the EU General Court, which is ongoing. The amount of the fine has been paid in full. Relatedly, a putative class action suit was brought against Rabobank and the other bank by civil plaintiffs before the United States District Court for the Southern District of New York on December 9, 2022. On September 11, 2024, the Court dismissed the case with prejudice.
Benchmark Litigation
Rabobank, along with a large number of other panel banks and inter-dealer brokers, has been named as a defendant in a number of putative class action suits and individual civil court cases brought before the courts in the United States. These proceedings relate to U.S. Dollar (USD) Libor, Japanese Yen (JPY) Libor, Tibor (note: Rabobank was never a member of the Tibor panel) and Euribor. Rabobank also received writs of summons ordering Rabobank to appear before the Dutch and Argentine Court in civil proceedings (both class action suits) relating to interest rate benchmarks. Since the civil proceedings set out above are intrinsically subject to uncertainties, it is difficult to predict their outcome. Rabobank takes the stance that it has substantive and convincing legal and factual defenses against these claims. Rabobank intends to continue to defend itself against these claims. Rabobank considers this group of benchmark litigation to be a contingent liability because the probability of an outflow of funds is neither probable nor remote. Rabobank cannot give a reliable estimate of the expected total outflow of this contingent liability. No provision has been made.
Other Cases
Rabobank is subject to other legal proceedings for which provisions have been recognized. These cases are individually less significant in size and are therefore not separately disclosed. The total provision for the cases of which the amount of the provision is not specified above amounts to EUR 36 million (December 31, 2024: EUR 63 million). The maximum amount of non-remote measurable contingent liabilities relating to claims not specified above is EUR 45 million (December 31, 2024: EUR 37 million).
5 Segment Reporting
5.1 Business Segments
The business segments Rabobank uses in its reporting are defined from a management viewpoint. This means that the segments are reviewed as part of Rabobank's strategic management and are used to make business decisions with different risks and returns.
Rabobank distinguishes five major business segments: Domestic Retail Banking; Wholesale & Rural (W&R); Leasing; Property Development; and Other Segments.
Domestic Retail Banking mainly encompasses the activities of Retail NL, Obvion, Vista Hypotheken and Freo.
Wholesale and Rural (W&R) contains wholesale activities in the Netherlands and focuses on the food & agri sectors and the energy transition sectors internationally. This segment develops corporate banking activities and also controls globally operating divisions such as Markets, Mergers & Acquisition, Corporate Finance Origination, Core Lending, Project Finance, Trade & Commodity Finance, Value Chain Finance, and Rabo Investments. The segment also contains International Rural operations under the Rabobank label.
In the Leasing segment, DLL is responsible for leasing activities and offers a wide range of leasing products. DLL supports manufacturers, vendors and distributors globally in their sales with products relevant to asset financing.
Property Development mainly encompasses the activities of BPD. The core activity is the development of residential property.
Other Segments within Rabobank include various sub-segments of which no single segment can be listed separately. This business segment mainly comprises the financial results of investments in associates (in particular Achmea B.V.), Treasury, and the Rabobank Group Organization.
There are no customers who represent more than a 10% share in Rabobank's total revenues. Transactions between the various business segments are conducted under regular commercial terms. Other than operating activities, there is no other material comprehensive income between the business segments. The financial reporting principles used for the segments are identical to those described in the "Material Accounting Policies" section. As management primarily relies on net interest income to assess the performance of the segments and to make decisions about resources to be allocated to the segment, the segment’s interest income is presented net of its interest expense.
| Amounts in millions of euros | Domestic Retail Banking | W&R | Leasing | Property Development | Other Segments | Consolidation Effects | Total |
|---|---|---|---|---|---|---|---|
For the year ended December 31, 2025 | |||||||
| Net interest income | 7,554 | 2,994 | 1,380 | (55) | 129 | (1) | 12,001 |
| Net fee and commission income | 1,870 | 461 | 95 | 2 | 2 | - | 2,430 |
| Other results | 68 | 664 | 399 | 238 | 624 | - | 1,993 |
| Income | 9,492 | 4,119 | 1,874 | 185 | 755 | (1) | 16,424 |
| Staff costs | 3,494 | 1,710 | 767 | 124 | 207 | 1 | 6,303 |
| Other administrative expenses | 1,121 | 386 | 299 | 36 | 364 | (85) | 2,121 |
| Depreciation and amortization | 72 | 88 | 29 | 9 | 3 | 85 | 286 |
| Operating expenses | 4,687 | 2,184 | 1,095 | 169 | 574 | 1 | 8,710 |
| Impairment charges on investments in associates and joint ventures | - | - | - | - | - | - | - |
| Impairment charges on financial assets | 110 | 254 | 397 | 2 | 1 | - | 764 |
| Regulatory levies | 131 | 82 | 18 | 1 | 2 | - | 234 |
| Operating profit before tax | 4,564 | 1,599 | 364 | 13 | 178 | (2) | 6,716 |
| Income tax | 1,203 | 520 | 58 | 64 | (85) | (1) | 1,759 |
| Net profit | 3,361 | 1,0791 | 306 | (51)2 | 263 | (1) | 4,957 |
| Cost/income ratio including regulatory levies (in %)3 | 50.8 | 55.0 | 59.4 | 91.9 | n/a | n/a | 54.5 |
| Impairment charges on financial assets (in basis points of average private sector loan portfolio)4 | 4 | 20 | 87 | n/a | n/a | n/a | 17 |
| External assets | 286,895 | 159,779 | 47,639 | 4,575 | 139,998 | - | 638,886 |
| Goodwill | 322 | - | 12 | 21 | - | - | 355 |
| Private sector loan portfolio | 284,399 | 132,050 | 43,068 | 178 | 139 | - | 459,834 |
- Net profit was impacted by a prior year impairment of a deferred tax asset of EUR 58 million which was recognized in the first half of 2025.
- Net profit declined in the first half of 2025 due to a prior year impairment of a deferred tax asset of EUR 67 million, related to the carry forward of unused tax losses from previous years at BPD Germany.
- Operating expenses plus regulatory levies divided by Income
- Impairment charges on financial assets divided by 12-month average private sector loan portfolio
| Amounts in millions of euros | Domestic Retail Banking | W&R | Leasing | Property Development | Other Segments | Consolidation Effects | Total |
|---|---|---|---|---|---|---|---|
Impairment allowances on financial assets | |||||||
| Balance on January 1, 2025 | 1,057 | 1,038 | 507 | 1 | - | - | 2,603 |
| Increases due to origination and acquisition | 76 | 78 | 79 | - | - | - | 233 |
| Decreases due to derecognition | (281) | (312) | (9) | - | - | - | (602) |
| Changes due to change in credit risk | 363 | 490 | 359 | - | - | - | 1,212 |
| Write-off of defaulted loans during the year | (182) | (207) | (348) | - | - | - | (737) |
| Other adjustments | (4) | (65) | (17) | - | - | - | (86) |
| Balance on December 31, 2025 | 1,029 | 1,022 | 571 | 1 | - | - | 2,623 |
| Impairment allowance 12-month ECL | 108 | 171 | 89 | - | - | - | 368 |
| Impairment allowance lifetime ECL non-credit impaired | 307 | 167 | 105 | - | - | - | 579 |
| Impairment allowance lifetime ECL credit-impaired | 614 | 684 | 377 | 1 | - | - | 1,676 |
| Balance on December 31, 2025 | 1,029 | 1,022 | 571 | 1 | - | - | 2,623 |
| Amounts in millions of euros | Domestic Retail Banking | W&R | Leasing | Property Development | Other Segments | Consolidation Effects | Total |
|---|---|---|---|---|---|---|---|
For the year ended on December 31, 2024 | |||||||
| Net interest income | 7,833 | 2,928 | 1,425 | (58) | (67) | - | 12,061 |
| Net fee and commission income | 1,755 | 453 | 106 | - | (8) | (4) | 2,302 |
| Other results | 79 | 617 | 358 | 130 | 585 | (2) | 1,767 |
| Income | 9,667 | 3,998 | 1,889 | 72 | 510 | (6) | 16,130 |
| Staff costs | 3,468 | 1,678 | 743 | 104 | 175 | (3) | 6,165 |
| Other administrative expenses | 1,187 | 494 | 285 | 35 | 109 | (91) | 2,019 |
| Depreciation and amortization | 96 | 89 | 25 | 10 | 14 | 93 | 327 |
| Operating expenses | 4,751 | 2,261 | 1,053 | 149 | 298 | (1) | 8,511 |
| Impairment charges on investments in associates and joint ventures | - | - | - | (2) | 72 | - | 70 |
| Impairment charges on financial assets | (166) | 329 | 303 | - | 2 | - | 468 |
| Regulatory levies | 166 | 82 | 16 | 1 | 1 | - | 266 |
| Operating profit before tax | 4,916 | 1,326 | 517 | (76) | 137 | (5) | 6,815 |
| Income tax | 1,288 | 332 | 108 | (35) | (41) | - | 1,652 |
| Net profit | 3,628 | 994 | 409 | (41) | 178 | (5) | 5,163 |
| Cost/income ratio including regulatory levies (in %)1 | 50.9 | 58.6 | 56.6 | 208.3 | n/a | n/a | 54.4 |
| Impairment charges on financial assets (in basis points of average private sector loan portfolio)2 | (6) | 26 | 67 | n/a | n/a | n/a | 11 |
| External assets | 276,557 | 159,867 | 49,483 | 4,397 | 138,949 | - | 629,253 |
| Goodwill | 322 | - | - | 16 | - | - | 338 |
| Private sector loan portfolio | 273,835 | 128,553 | 44,768 | 159 | - | - | 447,315 |
- Operating expenses plus regulatory levies divided by Income
- Impairment charges on financial assets (in basis points of average private sector loan portfolio)
| Amounts in millions of euros | Domestic Retail Banking | W&R | Leasing | Property Development | Other Segments | Consolidation Effects | Total |
|---|---|---|---|---|---|---|---|
Impairment allowances on financial assets | |||||||
| Balance on January 1, 2024 | 1,433 | 1,218 | 438 | 1 | - | - | 3,090 |
| Increases due to origination and acquisition | 101 | 195 | 83 | - | - | - | 379 |
| Decreases due to derecognition | (336) | (215) | (11) | - | - | - | (562) |
| Changes due to change in credit risk | 80 | 383 | 266 | - | - | - | 729 |
| Write-off of defaulted loans during the year | (221) | (549) | (264) | - | - | - | (1,034) |
| Other adjustments | - | 6 | (5) | - | - | - | 1 |
| Balance on December 31, 2024 | 1,057 | 1,038 | 507 | 1 | - | - | 2,603 |
| Impairment allowance 12-month ECL | 99 | 267 | 81 | - | - | - | 447 |
| Impairment allowance lifetime ECL non-credit impaired | 222 | 136 | 132 | - | - | - | 490 |
| Impairment allowance lifetime ECL credit-impaired | 736 | 635 | 294 | 1 | - | - | 1,666 |
| Balance on December 31, 2024 | 1,057 | 1,038 | 507 | 1 | - | - | 2,603 |
5.2 Geographic Information (Country-by-Country Reporting)
Rabobank operates in seven main geographical areas. Its country of domicile is the Netherlands. The information below is reported by distinguishable components of Rabobank that provide products and/or services within a particular economic environment within specific geographical locations/ areas. The breakdown is based on the location of the individual subsidiary/ branch from which the transactions are initiated. Revenue is defined as total income as presented in the statement of income plus interest expense, fee and commission expense and expenses from other operating activities.
| On December 31, 2025 | |||||||
|---|---|---|---|---|---|---|---|
| Amounts in millions of euros | |||||||
| Geographic location | Country | Name of division | Type of operations | Revenues | Average number of internal employees in FTE | Operating profit before tax | Income tax |
The Netherlands | The Netherlands | Rabobank, DLL, Obvion, Rabo Vastgoedgroep, BPD | Domestic Retail Banking, Wholesale and Rural, Leasing, Property Development | 30,166 | 31,951 | 5,187 | 1,230 |
Other Eurozone countries | France | DLL, Rabobank | Leasing, Wholesale and Rural | 227 | 191 | 76 | 19 |
| Belgium | DLL, Rabobank | Leasing, Wholesale and Rural | 37 | 75 | 6 | 1 | |
| Germany | DLL, Rabobank, Rabo Vastgoedgroep, BPD | Leasing, Wholesale and Rural, Property Development | 596 | 727 | (56) | 78 | |
| Italy | DLL, Rabobank | Leasing, Wholesale and Rural | 154 | 227 | 40 | 13 | |
| Luxembourg | Rabobank | Wholesale and Rural | - | - | - | - | |
| Ireland | DLL, Rabobank | Leasing, Wholesale and Rural | 809 | 214 | 95 | 16 | |
| Finland | DLL | Leasing | 12 | 17 | 3 | 1 | |
| Austria | DLL | Leasing | 7 | 1 | 2 | 1 | |
| Portugal | DLL | Leasing | 13 | 19 | 1 | - | |
| Spain | DLL, Rabobank | Leasing, Wholesale and Rural | 93 | 157 | 18 | 5 | |
Rest of Europe (non-Eurozone) | United Kingdom | DLL, Rabobank | Leasing, Wholesale and Rural | 1,126 | 875 | 150 | 41 |
| Norway | DLL | Leasing | 88 | 60 | 11 | 3 | |
| Sweden | DLL | Leasing | 95 | 163 | 2 | 1 | |
| Denmark | DLL | Leasing | 37 | 41 | 5 | 1 | |
| Switzerland | DLL | Leasing | 10 | 5 | 1 | - | |
| Poland | DLL | Leasing | 39 | 103 | 3 | - | |
| Turkey | Rabobank | Wholesale and Rural | 20 | 29 | 12 | 4 | |
North America | United States | DLL, Rabobank | Leasing, Wholesale and Rural | 6,941 | 3,003 | 572 | 210 |
| Canada | DLL, Rabobank | Leasing, Wholesale and Rural | 496 | 365 | 77 | 20 | |
Latin America | Mexico | DLL | Leasing | 41 | 69 | 10 | 5 |
| Brazil | DLL, Rabobank | Leasing, Wholesale and Rural | 1,155 | 927 | 13 | (23) | |
| Chile | DLL, Rabobank | Leasing, Wholesale and Rural | 77 | 129 | 18 | 4 | |
| Argentina | DLL | Leasing | 4 | 14 | (1) | - | |
| Peru | Rabobank | Wholesale and Rural | 1 | 7 | - | - | |
Asia | India | DLL, Rabobank | Leasing, Wholesale and Rural | 11 | 175 | 5 | - |
| Singapore | DLL, Rabobank | Leasing, Wholesale and Rural | 262 | 96 | 31 | 5 | |
| China | Rabobank | Wholesale and Rural | 16 | 30 | 3 | 1 | |
| Hong Kong | DLL, Rabobank | Leasing, Wholesale and Rural | 427 | 168 | 41 | 8 | |
| South Korea | DLL | Leasing | 17 | 30 | 3 | 1 | |
Australia | Australia | DLL, Rabobank | Leasing, Wholesale and Rural | 2,223 | 1,573 | 235 | 71 |
| New Zealand | DLL, Rabobank, | Leasing, Wholesale and Rural | 838 | 549 | 153 | 43 | |
Other | Kenya, Uganda | Rabobank | Wholesale and Rural | 3 | 22 | - | - |
| Consolidation effects | Consolidation effects | (15,123) | - | - | - | ||
| 30,918 | 42,012 | 6,716 | 1,759 | ||||
| On December 31, 2024 | |||||||
|---|---|---|---|---|---|---|---|
| Amounts in millions of euros | |||||||
| Geographic location | Country | Name of division | Type of operations | Revenues | Average number of internal employees in FTE | Operating profit before tax | Income tax |
The Netherlands | The Netherlands | Rabobank, DLL, Obvion, Rabo Vastgoedgroep, BPD | Domestic Retail Banking, Wholesale and Rural, Leasing, Property Development | 32,208 | 31,131 | 5,315 | 1,246 |
Other Eurozone countries | France | DLL, Rabobank | Leasing, Wholesale and Rural | 193 | 187 | 65 | 17 |
| Belgium | DLL, Rabobank | Leasing, Wholesale and Rural | 37 | 71 | 5 | 1 | |
| Germany | DLL, Rabobank, Rabo Vastgoedgroep, BPD | Leasing, Wholesale and Rural, Property Development | 684 | 729 | (55) | (15) | |
| Italy | DLL, Rabobank | Leasing, Wholesale and Rural | 145 | 220 | 44 | 15 | |
| Luxembourg | Rabobank | Wholesale and Rural | - | - | - | - | |
| Ireland | DLL, Rabobank | Leasing, Wholesale and Rural | 878 | 211 | 107 | 32 | |
| Finland | DLL | Leasing | 11 | 16 | 3 | 1 | |
| Austria | DLL | Leasing | 7 | 1 | 2 | 1 | |
| Portugal | DLL | Leasing | 13 | 20 | 1 | - | |
| Spain | DLL, Rabobank | Leasing, Wholesale and Rural | 85 | 157 | 15 | 4 | |
Rest of Europe (non-Eurozone) | United Kingdom | DLL, Rabobank | Leasing, Wholesale and Rural | 1,472 | 871 | 112 | 30 |
| Norway | DLL | Leasing | 73 | 56 | 7 | 2 | |
| Sweden | DLL | Leasing | 107 | 156 | 2 | (3) | |
| Denmark | DLL | Leasing | 41 | 39 | 6 | 2 | |
| Switzerland | DLL | Leasing | 10 | 6 | 1 | 1 | |
| Poland | DLL | Leasing | 42 | 100 | 1 | - | |
| Hungary | DLL | Leasing | 4 | 16 | - | 1 | |
| Turkey | DLL, Rabobank | Leasing, Wholesale and Rural | 22 | 31 | 15 | 4 | |
North America | United States | DLL, Rabobank | Leasing, Wholesale and Rural | 8,105 | 3,096 | 522 | 147 |
| Canada | DLL, Rabobank | Leasing, Wholesale and Rural | 557 | 335 | 70 | 18 | |
Latin America | Mexico | DLL | Leasing | 42 | 72 | 7 | 2 |
| Brazil | DLL, Rabobank | Leasing, Wholesale and Rural | 1,111 | 935 | 65 | (1) | |
| Chile | DLL, Rabobank | Leasing, Wholesale and Rural | 95 | 132 | 24 | 5 | |
| Argentina | DLL | Leasing | 9 | 13 | 3 | 1 | |
| Peru | Rabobank | Wholesale and Rural | 1 | 7 | 2 | 1 | |
Asia | India | DLL, Rabobank | Leasing, Wholesale and Rural | 16 | 119 | 13 | 2 |
| Singapore | DLL, Rabobank | Leasing, Wholesale and Rural | 340 | 103 | 28 | 4 | |
| China | Rabobank | Wholesale and Rural | 32 | 39 | 5 | 12 | |
| Hong Kong | DLL, Rabobank | Leasing, Wholesale and Rural | 682 | 178 | 36 | 7 | |
| South Korea | DLL | Leasing | 17 | 28 | 2 | - | |
| United Arab Emirates | DLL | Leasing | - | - | - | - | |
Australia | Australia | DLL, Rabobank | Leasing, Wholesale and Rural | 2,370 | 1,546 | 247 | 75 |
| New Zealand | DLL, Rabobank, | Leasing, Wholesale and Rural | 1,171 | 546 | 145 | 40 | |
Other | Kenya, Uganda | Rabobank | Wholesale and Rural | 3 | 23 | - | - |
| Consolidation effects | Consolidation effects | (17,512) | - | - | - | ||
| 33,071 | 41,190 | 6,815 | 1,652 |
Rabobank did not receive government subsidies in 2025 and 2024.
5.3 Geographic Information of Non-current Assets
| Amounts in millions of euros | 2025 | 2024 | |||
|---|---|---|---|---|---|
| Domestic | Non-domestic | Domestic | Non-domestic | ||
| Goodwill and other intangible assets | 542 | 108 | 581 | 108 | |
| Property and equipment and investment properties | 2,425 | 2,698 | 2,224 | 2,804 | |
| Other assets | 4,386 | 2,016 | 4,580 | 2,115 | |
| Non-current assets held for sale | 56 | 56 | 32 | 110 | |
| Total | 7,409 | 4,878 | 7,417 | 5,137 | |
6 Cash and Cash Equivalents
| Amounts in millions of euros | 2025 | 2024 |
|---|---|---|
| Cash | 568 | 531 |
| Deposits at central banks | 62,203 | 84,343 |
| Total cash and cash equivalents | 62,771 | 84,874 |
The average minimum reserve to be held for the Netherlands for the month of December 2025 was EUR 3,801 million (December 2024: EUR 3,528 million).
7 Loans and Advances to Credit Institutions
| Amounts in millions of euros | 2025 | 2024 |
|---|---|---|
| Current accounts and receivables | 5,754 | 7,017 |
| Reverse repurchase transactions and securities borrowing agreements | 27,031 | 19,594 |
| Loans | 153 | 309 |
| Other | 114 | 116 |
| Gross carrying amount loans and advances to credit institutions | 33,052 | 27,036 |
| Loan impairment allowance on loans and advances to credit institutions | - | (1) |
| Total loans and advances to credit institutions | 33,052 | 27,035 |
8 Financial Assets Held for Trading
| Amounts in millions of euros | 2025 | 2024 |
|---|---|---|
| Government bonds | 778 | 800 |
| Other debt securities | 343 | 339 |
| Loans | 1,522 | 481 |
| Equity instruments | 376 | 120 |
| Total financial assets held for trading | 3,019 | 1,740 |
9 Financial Assets Mandatorily at Fair Value
| Amounts in millions of euros | 2025 | 2024 |
|---|---|---|
| Debt securities | 184 | 314 |
| Loans | 675 | 641 |
| Equity instruments | 2,159 | 2,214 |
| Total financial assets mandatorily at fair value | 3,018 | 3,169 |
10 Derivatives
Rabobank uses derivatives to mitigate at least a portion of the risks arising from the bank’s various operations. For example, interest rate swaps are used to hedge interest rate risks arising from the difference in maturities between assets and liabilities. Another example is cross-currency swaps, which are used to hedge the currency risk to which the bank is exposed after issuing debt instruments in foreign currencies. In addition to hedging purposes, Rabobank also contracts derivatives with corporate customers to serve them in their risk management to hedge currency or interest rate exposures.
Forward currency and interest rate contracts are contractual obligations to receive or pay a net amount based on prevailing exchange or interest rates, or to purchase or sell foreign currency or a financial instrument on a future date at a fixed specified price in an organized financial market. The credit risk is low, since collateral for forward contracts is provided in the form of cash, cash equivalents or marketable securities, and changes in the value of forward contracts are settled daily, mainly via a central counterparty clearing house. Rabobank's credit risk exposure is represented by the potential cost of replacing the swaps if the counterparties default. The risk is monitored continuously against current fair value, a portion of the notional amount of the contracts and the liquidity in the markets. As part of the credit risk management process, Rabobank employs the same methods for evaluating counterparties as it does for evaluating its own lending activities.
10.1 Derivatives Held for Trading
The derivatives held or issued for trading are those used to hedge economic risks but which do not qualify as hedge accounting instruments and derivatives that corporate customers have contracted with Rabobank to hedge interest rate and currency risks. The exposures from derivatives with corporate customers are normally hedged by entering into offsetting positions with one or more professional counterparties, within set trading limits.
10.2 Derivatives Designated as Hedging Instrument
Rabobank has various derivatives that serve to hedge economic risks, including interest rate and currency risks, which qualify as a hedging instrument in a fair value hedge, a cash flow hedge or a net investment hedge.
Fair value hedges
IAS 39 portfolio fair value hedges
Rabobank uses interest rate swaps to hedge potential changes in the fair value due to interest rate changes. Hedged items are fixed-income financial assets and liabilities in both local and foreign currencies, such as mortgages, issued debt securities, current accounts and deposits with agreed maturity. Rabobank tests the hedge effectiveness based on statistical regression analysis models, both prospectively and retrospectively for IAS 39 portfolio fair value hedges.
IFRS 9 non-portfolio fair value hedges
Rabobank uses interest rate swaps and cross-currency interest rate swaps to hedge potential changes in the fair value due to interest rate or foreign currency rate changes. Hedged items are fixed-income financial assets and liabilities in both local and foreign currencies, such as debt securities at fair value through other comprehensive income and issued debt securities in foreign currencies. Rabobank analyses the sources of ineffectiveness for IFRS 9 non-portfolio fair value hedges. The identified source of ineffectiveness for issued debt securities in foreign currencies is the float leg (excluding margin) of the cross-currency interest rate swap. For debt securities at fair value through other comprehensive income the source of ineffectiveness is the single currency basis risk. The hedged ratio is the notional of the issued debt security in foreign currency compared with the notional of the cross-currency interest rate swap or the notional of the debt security at fair value through other comprehensive income compared with the notional of the interest rate swap.
For Rabobank's main currencies the average fixed rate for interest rate swaps used in fair value hedge accounting is 1.94% (2024: 1.88%) for EUR and 3.25% (2024: 2.85%) for USD.
The following table shows the notional amount of derivatives designated in fair value hedging, split into the maturity of the instruments.
Maturity Profile of Hedging Instruments in Fair Value Hedges
| Amounts in millions of euros | Remaining maturity | |||
|---|---|---|---|---|
| Total notional amount | Less than 1 year | 1 - 5 years | Longer than 5 years | |
On December 31, 2025 | ||||
| Hedging instruments in fair value hedges | 263,288 | 113,765 | 35,842 | 113,681 |
On December 31, 2024 | ||||
| Hedging instruments in fair value hedges | 172,332 | 42,089 | 41,436 | 88,807 |
The following table shows the carrying amounts of derivatives designated in fair value hedge relationships and the change in fair value used for calculating hedge ineffectiveness. The carrying amounts in this table represent the fair value of the derivatives before netting of collateral. Amounts in Section 10.3 represent carrying amounts after netting of collateral.
Designated Hedging Instruments in Fair Value Hedges of Interest Rate Risk
| Amounts in millions of euros | Carrying amount derivative financial assets | Carrying amount derivative financial liabilities | Change in fair value used for calculating hedge ineffectiveness |
|---|---|---|---|
On December 31, 2025 | |||
| Hedge of loans and advances to customers | 4,778 | 1,087 | 1,489 |
| Hedge of financial assets at fair value through other comprehensive income | 410 | 240 | 227 |
| Hedge of deposits from customers | 31 | 108 | 10 |
| Hedge of deposits from credit institutions | 410 | 567 | (403) |
| Hedge of issued debt securities | 410 | 1,321 | (11) |
| Hedge of subordinated liabilities | 2 | 574 | 20 |
On December 31, 2024 | |||
| Hedge of loans and advances to customers | 7,302 | 939 | (754) |
| Hedge of financial assets at fair value through other comprehensive income | 443 | 359 | (45) |
| Hedge of deposits from customers | 1 | 27 | 60 |
| Hedge of deposits from credit institutions | - | - | - |
| Hedge of issued debt securities | 945 | 869 | 328 |
| Hedge of subordinated liabilities1 | 30 | 320 | 60 |
- Presentation adjusted to separately disclose the hedge accounting related to subordinated liabilities
Hedge ineffectiveness of fair value hedging amounts to minus EUR (35) million (2024: minus EUR 24 million) and is included in the statement of income on line item "Gains/ (Losses) on Financial Assets and Liabilities at Fair Value through Profit or Loss". These carrying amounts do not reconcile to the amounts presented in section 10.4 as no netting rules are applied.
Designated Hedged Items in Fair Value Hedges of Interest Rate Risk
| Amounts in millions of euros | Carrying amount | Accumulated amount of fair value hedge adjustment on the hedged item included in the carrying amount of the hedged item | Change in fair value used for calculating hedge ineffectiveness | Accumulated amount of fair value hedge adjustments remaining for any hedged items that have ceased to be adjusted for hedging gains and losses |
|---|---|---|---|---|
On December 31, 2025 | ||||
| Loans and advances to customers | 67,987 | (10,759) | (1,411) | (9,616) |
| Financial assets at fair value through other comprehensive income | 27,343 | - | (224) | - |
| Deposits from customers | 9,274 | (105) | (12) | (93) |
| Deposits from credit institutions | 29,236 | (400) | 388 | (109) |
| Issued debt securities | 34,605 | (724) | (17) | (86) |
| Subordinated liabilities | 4,701 | (453) | (21) | (321) |
On December 31, 2024 | ||||
| Loans and advances to customers | 53,626 | (10,079) | 746 | (7,209) |
| Financial assets at fair value through other comprehensive income | 16,696 | - | 52 | - |
| Deposits from customers | 1,604 | (81) | (61) | (81) |
| Deposits from credit institutions | - | - | - | - |
| Issued debt securities | 46,623 | (701) | (351) | (211) |
| Subordinated liabilities1 | 7,260 | (588) | (60) | (351) |
- Presentation adjusted to separately disclose the hedge accounting related to subordinated liabilities
Cash Flow Hedges
Rabobank’s cash flow hedges mainly consist of the following two types of cash flow hedges:
Cash flow hedges where the fixed spread of issued securities in foreign currency is hedged with a cross-currency swap for changes in foreign currency rates.
Cash flow hedges for assets or liabilities in foreign currency with cross-currency basis swaps. For these hedges all accounting mismatch relates to the revaluation of the cross-currency basis swaps in response to fluctuations of cross-currency basis spreads. Such revaluations are recorded through OCI in the Revaluation reserve – Costs of hedging. As such, no cash flow hedge adjustments are recorded.
Rabobank analyses the sources of ineffectiveness for IFRS 9 cash flow hedges. The IFRS 9 cash flow hedges are 100% effective.
Maturity Profile and Average Price/ Rate of Hedging Instruments in Cash Flow Hedges
| Amounts in millions of euros | Remaining maturity | |||
|---|---|---|---|---|
| Total notional amount | Less than 1 year | 1 - 5 years | Longer than 5 years | |
On December 31, 2025 | ||||
Cross-currency swaps (USD:EUR) | ||||
| Notional amounts of hedging instrument | 15,729 | 3,594 | 11,929 | 206 |
| Average exchange rate (USD:EUR) | 1.17 | 1.16 | 1.14 | |
Cross-currency swaps (GBP:EUR) | ||||
| Notional amounts of hedging instrument | 192 | - | 138 | 54 |
| Average exchange rate (GBP:EUR) | n/a | 0.84 | 0.85 | |
Cross-currency swaps (other currencies) | ||||
| Notional amounts of hedging instrument | 3,850 | 1,973 | 1,861 | 16 |
On December 31, 2024 | ||||
Cross-currency swaps (USD:EUR) | ||||
| Notional amounts of hedging instrument | 14,629 | 5,137 | 9,122 | 370 |
| Average exchange rate (USD:EUR) | 1.06 | 1.07 | 1.15 | |
Cross-currency swaps (GBP:EUR) | ||||
| Notional amounts of hedging instrument | 593 | 207 | 322 | 64 |
| Average exchange rate (GBP:EUR) | 0.83 | 0.84 | 0.85 | |
Cross-currency swaps (other currencies) | ||||
| Notional amounts of hedging instrument | 6,513 | 2,507 | 3,986 | 20 |
The following table shows the carrying amounts of derivatives designated in cash flow hedging and the change in fair value used for calculating hedge ineffectiveness.
Cash Flow Hedges of Interest Rate and Foreign Currency Risk, Designated Hedging Instruments
| Amounts in millions of euros | Carrying amount derivative financial assets | Carrying amount derivative financial liabilities | Change in fair value used for calculating hedge ineffectiveness |
|---|---|---|---|
On December 31, 2025 | |||
| Cross-currency interest rate swaps (USD:EUR) | 96 | 102 | 57 |
| Cross-currency interest rate swaps (GBP:EUR) | 4 | 11 | 20 |
| Cross-currency interest rate swaps (other currencies) | 254 | 10 | 1 |
| Total | 354 | 123 | 78 |
On December 31, 2024 | |||
| Cross-currency interest rate swaps (USD:EUR) | 21 | 460 | (51) |
| Cross-currency interest rate swaps (GBP:EUR) | 9 | 17 | (21) |
| Cross-currency interest rate swaps (other currencies) | 131 | 6 | 1 |
| Total | 161 | 483 | (71) |
For the changes in the value of the hedging instrument recognized in other comprehensive income and the amount reclassified from the cash flow hedge reserve to profit or loss, reference is made to Section 30 "Reserves and Retained Earnings". Hedge ineffectiveness amounts to nil and is included in the statement of income on line item "Gains/ (losses) on financial assets and liabilities at fair value through profit or loss".
Cash Flow Hedges of Interest Rate and Foreign Currency Risk, Designated Hedged Items
| Amounts in millions of euros | Change in fair value used for calculating hedge ineffectiveness | Cash flow hedge reserve for continuing hedges | Remaining cash flow hedge reserve from hedging relationships for which hedge accounting is no longer applied |
|---|---|---|---|
On December 31, 2025 | |||
| Issued debt securities | (22) | (17) | (19) |
| Subordinated liabilities | (56) | (54) | - |
On December 31, 2024 | |||
| Issued debt securities | 30 | (13) | (21) |
| Subordinated liabilities1 | 41 | (31) | - |
- Presentation adjusted to separately disclose the hedge accounting related to subordinated liabilities
Net Investment Hedges
Rabobank uses forward currency contracts to hedge a portion of the currency translation risk of net investments in foreign operations.
Maturity Profile and Average Rate of Hedging Instruments in Net Investment Hedges
| Total notional amount | Remaining maturity on December 31, 2025 | |||
|---|---|---|---|---|
| Amounts in millions of euros | Less than 1 year | 1 - 5 years | Longer than 5 years | |
Forward currency contracts | ||||
| Notional amounts of hedging instrument | 4,012 | 4,012 | - | - |
| Total notional amount | Remaining maturity on December 31, 2024 | |||
Forward currency contracts | ||||
| Notional amounts of hedging instrument | 6,425 | 6,425 | - | - |
For the main currencies the average exchange rates used in net investment hedge accounting for 2025 are EUR/AUD 1.75 (2024: 1.64), EUR/NZD 1.94 (2024: 1.79) and EUR/BRL 6.31 (2024: 5.83).
| Amounts in millions of euros | Carrying amount financial assets | Carrying amount financial liabilities | Change in fair value used for calculating hedge ineffectiveness |
|---|---|---|---|
On December 31, 2025 | |||
| Forward currency contracts | 17 | 52 | 213 |
On December 31, 2024 | |||
| Forward currency contracts | 58 | 35 | 201 |
For the changes in the value of the hedging instrument recognized in other comprehensive income and the amount reclassified from the net investment hedge reserve to profit or loss, see Section 30 "Reserves and Retained Earnings". Hedge ineffectiveness amounts to zero and is included in the statement of income in line item "Gains/ (Losses) on Financial Assets and Liabilities at Fair Value through Profit or Loss".
Net Investment Hedges of Currency Translation Risk, Designated Hedged Items
| Amounts in millions of euros | Change in fair value used for calculating hedge ineffectiveness | Foreign currency translation reserve for continuing hedges | Remaining foreign currency translation reserve from hedging relationships for which hedge accounting is no longer applied |
|---|---|---|---|
On December 31, 2025 | |||
| Net investment | (213) | 654 | 134 |
On December 31, 2024 | |||
| Net investment | (201) | 528 | 136 |
10.3 Notional Amount and Fair Value of Derivatives
The following table shows the notional amounts and the fair values of derivatives as presented in the statement of financial position.
Notional Amount and Fair Values of Derivatives
| On December 31, 2025 | On December 31, 2024 | |||||
|---|---|---|---|---|---|---|
| Amounts in millions of euros | Notional amounts | Fair values | Notional amounts | Fair values | ||
| Assets | Liabilities | Assets | Liabilities | |||
| Derivatives held for trading | 7,266,765 | 18,915 | 11,800 | 6,448,777 | 22,663 | 16,422 |
| Derivatives designated as hedging instrument | 285,688 | 708 | 1,062 | 197,892 | 767 | 953 |
| Total derivatives | 7,552,453 | 19,623 | 12,862 | 6,646,669 | 23,430 | 17,375 |
Derivatives held for trading | ||||||
Currency derivatives | ||||||
| Currency swaps | 408,873 | 5,893 | 4,654 | 421,267 | 7,575 | 8,427 |
| Currency options - purchased and sold | 6,697 | 68 | 71 | 6,656 | 99 | 61 |
| Listed tradeable contracts | 344 | 8 | 4 | 364 | 2 | 2 |
| Currency futures | 597 | 12 | 10 | 732 | 4 | 28 |
| Total currency derivatives | 416,511 | 5,981 | 4,739 | 429,019 | 7,680 | 8,518 |
Interest rate derivatives | ||||||
| OTC interest rate swaps | 6,612,431 | 11,770 | 6,039 | 5,788,604 | 13,348 | 6,723 |
| OTC interest rate options | 103,334 | 494 | 469 | 111,548 | 748 | 763 |
| Listed interest rate swaps | 116,706 | 1 | 1 | 101,651 | 2 | 1 |
| Total interest rate derivatives | 6,832,471 | 12,265 | 6,509 | 6,001,803 | 14,098 | 7,487 |
| Credit derivatives | 4,110 | 192 | 38 | 3,419 | 56 | 26 |
| Equity instruments/index derivatives | - | 1 | - | - | 1 | - |
| Other derivatives | 13,675 | 477 | 515 | 14,536 | 828 | 391 |
| Total derivatives held for trading | 7,266,767 | 18,916 | 11,801 | 6,448,777 | 22,663 | 16,422 |
Derivatives designated as hedging instrument | ||||||
Derivatives designated as hedging instrument in fair value hedges | ||||||
| Interest rate swaps and cross-currency interest rate swaps | 263,289 | 337 | 913 | 172,332 | 548 | 456 |
Derivatives designated as hedging instrument in cash flow hedges | ||||||
| Currency swaps and cross-currency interest rate swaps | 19,770 | 354 | 123 | 21,734 | 161 | 483 |
Derivatives designated as hedging instrument as net investment hedges | ||||||
| Currency futures contracts | 2,629 | 17 | 26 | 3,826 | 58 | 14 |
| Total derivatives designated as hedging instrument | 285,688 | 708 | 1,062 | 197,892 | 767 | 953 |
11 Loans and Advances to Customers
| Amounts in millions of euros | 2025 | 2024 |
|---|---|---|
Loans to private sector clients: | ||
| Overdrafts | 10,023 | 10,188 |
| Mortgages | 201,991 | 194,734 |
| Finance leases | 22,300 | 22,271 |
| Corporate loans | 210,521 | 209,587 |
| Other | 17,642 | 12,965 |
Loans to government clients: | ||
| Finance leases | 197 | 183 |
| Other | 1,144 | 1,164 |
Reverse repurchase transactions, securities borrowing agreements and settlement accounts | 21,772 | 15,908 |
| Gross carrying amount loans and advances to customers | 485,590 | 467,000 |
| Hedge accounting adjustment | (10,759) | (10,079) |
| Impairment allowances on loans and advances to customers | (2,512) | (2,436) |
| Total loans and advances to customers | 472,319 | 454,485 |
Finance Leases
Loans and advances to customers includes receivables from finance leases, which can be broken down as follows:
| Amounts in millions of euros | 2025 | 2024 |
|---|---|---|
Receivables from gross investment in finance leases | ||
| Not exceeding 1 year | 8,041 | 8,307 |
| 1 to 2 years | 6,056 | 5,728 |
| 2 to 3 years | 4,485 | 4,183 |
| 3 to 4 years | 2,927 | 2,908 |
| 4 to 5 years | 1,687 | 1,459 |
| More than 5 years | 1,187 | 1,825 |
| Gross investment in finance leases | 24,383 | 24,410 |
| Unearned deferred finance income from finance leases | 2,135 | 2,226 |
| Net investment in finance leases | 22,248 | 22,184 |
| Loan impairment allowance finance leases | 249 | 270 |
| Gross carrying amount finance leases | 22,497 | 22,454 |
| Finance income on net investment | 1,205 | 1,312 |
The finance leases mainly relate to the lease of equipment, cars and factoring products. The unguaranteed residual values accruing to the lessor amounted to EUR 2,769 million (2024: EUR 2,697 million).
12 Financial Assets at Fair Value through Other Comprehensive Income
| Amounts in millions of euros | 2025 | 2024 |
|---|---|---|
| Government bonds | 20,765 | 11,999 |
| Other debt securities | 8,655 | 6,707 |
| Equity instruments | 134 | 117 |
| Total financial assets at fair value through other comprehensive income | 29,554 | 18,823 |
Rabobank designated equity investments in foreign financial service providers at fair value through other comprehensive income upon initial recognition because these instruments are held for strategic purposes rather than for the purpose of selling them in the near term.
| Amounts in millions of euros | 2025 | 2024 |
|---|---|---|
| Equity investments in foreign financial service providers | 98 | 81 |
| Other equity investments | 36 | 36 |
| Total equity instruments | 134 | 117 |
During 2025, Rabobank recognized dividends of EUR 14 million of which EUR 0 million relates to equity investments that were derecognized in 2025. Transfers of the cumulative gains or losses within equity during the period are disclosed in Section 30 in the movement schedule of the "Revaluation Reserve – Equity Instruments at Fair Value Through Other Comprehensive Income".
13 Investments in Associates and Joint Ventures
| Amounts in millions of euros | 2025 | 2024 |
|---|---|---|
| Opening balance | 2,062 | 1,793 |
| Foreign exchange differences | (12) | 13 |
| Purchases | 24 | 35 |
| Sales | (75) | (68) |
| Share of profit of associates and joint ventures | 381 | 474 |
| Dividends paid out (and capital repayments) | (88) | (77) |
| Revaluation | 23 | (8) |
| Impairment on investments in associates | - | (74) |
| Reversal impairment on investments in joint ventures | - | 4 |
| Other | (7) | (30) |
| Total investments in associates and joint ventures | 2,308 | 2,062 |
13.1 Investments in Associates
The main associate in terms of the size of the capital interest held by Rabobank is Achmea.
| On December 31, 2025 | Shareholding | Voting rights |
| The Netherlands | ||
| Achmea B.V. | 29% | 29% |
Achmea is Rabobank's strategic partner for insurance products and Interpolis, a brand of the Achmea Group, works closely with Rabobank. Achmea’s head office is located in Zeist, the Netherlands. No listed market price is available for the equity investment in Achmea. The equity investment in Achmea is valued according to the equity method which leads to a carrying amount of EUR 1,697 million.
A yearly external valuation of the investment in Achmea is performed. The outcome of this valuation did not lead to a trigger for impairment or reversal of impairment as the carrying amount closely aligns with this fair value. The valuation is performed by an external expert and a combination of valuation methods is used:
a cash flow valuation method assuming that the equity value of a company is equal to the discounted value of future dividends or future cashflows minus the net debt position of the company. The discount rate used for operations in the Netherlands ranges between 7.5% and 10.3%; and
a comparable company analysis which is a multiple analysis based on financials and market date of peer companies. The most important inputs are:
the price-to-book multiple derived from a regression analysis of the price-to-book ratios of peers and their expected return on equity. The most important price-to-book multiple ranges between 0.8x and 1.5x and;
the price-to-earnings multiple which is based on the current financial year’s profitability and estimates of the 1-year and 2-year forward looking profitability of peers. The most important price-to-earnings multiple ranges between 8.1x and 10.3x.
The valuation of Achmea is based on 50%-50% weighting to the outcomes of the two valuation methods.
Rabobank received EUR 72 million cash dividend from Achmea in 2025 (2024: EUR 59 million) and is part of the operating segment ‘Other segments’.
Achmea
| Amounts in millions of euros | 2025 | 2024 |
|---|---|---|
| Cash and balances at central banks | 1,757 | 2,131 |
| Investments | 77,501 | 74,683 |
| Other assets | 6,079 | 5,402 |
| Total assets | 85,337 | 82,216 |
| Insurance related provisions | 42,581 | 43,866 |
| Loans and funds borrowed | 25,391 | 25,549 |
| Other liabilities | 5,478 | 3,386 |
| Total liabilities | 73,450 | 72,801 |
| Revenues | 29,417 | 28,177 |
| Net profit | 1,197 | 1,303 |
| Other comprehensive income | 35 | 20 |
| Total comprehensive income | 1,232 | 1,323 |
Reconciliation Carrying Amount of Interest in Achmea
| 2025 | 2024 | |
|---|---|---|
| Total equity Achmea | 11,050 | 9,410 |
| Minus: hybrid capital | 1,100 | 500 |
| Minus: preference shares and accrued dividend | 13 | 5 |
| Shareholder’s equity | 9,937 | 8,905 |
| Share of Rabobank | 29.20% | 30.16% |
| 2,902 | 2,686 | |
| Accumulated impairment | (1,205) | (1,243) |
| Carrying amount | 1,697 | 1,443 |
Result from Other Associates
| Amounts in millions of euros | 2025 | 2024 |
|---|---|---|
| Result from continuing operations | 46 | 84 |
| Net profit | 46 | 84 |
| Other comprehensive income | 2 | (26) |
| Total comprehensive income | 48 | 58 |
13.2 Investments in Joint Ventures
Almost all joint ventures are investments of BPD. Their total carrying amount is EUR 105 million (2024: EUR 103 million). Joint ventures are recognized in accordance with the equity method.
BPD often enters into partnerships for developing integrated residential areas. In the majority of cases, each participating member of the partnership has a decisive vote, and decisions can only be passed by consensus. The majority of these partnerships therefore qualify as "joint arrangements."
Each partnership has its own legal structure depending on the needs and requirements of the parties concerned. The legal form (business structure) typically used is the Dutch "CV-BV" structure (a limited partnership-private limited liability company) or the "VOF" structure (general partnership) or a comparable structure. In the case of a CV-BV, the risk of a partner is generally limited to the issued capital and partners are only entitled to the net assets of the entity. In the case of general partnerships ("VOF"), each party bears, in principle, unlimited liability and has, in principle, a proportional right to the assets and obligations for the liabilities of the entity. On the basis of the legal form, a CV-BV structure qualifies as a "joint venture", whereas a VOF structure qualifies as a "joint operation". Particular the contractual terms and other relevant facts and circumstances may result in a different classification.
As a separate legal structure is established for each project, projects have different participating partners and individual projects are not of a substantial size, BPD did not have material joint arrangements in 2025 and 2024.
Result from Joint Ventures
| Amounts in millions of euros | 2025 | 2024 |
|---|---|---|
| Profit or loss from continuing operations | 16 | 15 |
| Post-tax profit or loss from discontinued operations | - | - |
| Net profit | 16 | 15 |
| Other comprehensive income | - | - |
| Total comprehensive income | 16 | 15 |
Contingent Liabilities to Joint Ventures
BPD entered into commitments with regard to real estate projects and into commitments with third parties (including subcontractors and architects) for an amount of EUR 38 million (2024: EUR 50 million). The commitments regarding building sites amount to EUR 63 million (2024: EUR 68 million).
14 Goodwill and Other Intangible Assets
| Amounts in millions of euros | Goodwill | Software developed inhouse | Other intangible assets | Total |
|---|---|---|---|---|
Year ended December 31, 2025 | ||||
| Opening balance | 338 | 221 | 130 | 689 |
| Foreign exchange differences | - | (6) | - | (6) |
| Additions | 12 | 49 | 15 | 76 |
| Disposals | - | - | (5) | (5) |
| Other | 7 | 4 | (2) | 9 |
| Amortization | - | (62) | (49) | (111) |
| Impairments | (2) | - | - | (2) |
| Closing balance | 355 | 206 | 89 | 650 |
| Cost | 357 | 1,433 | 434 | 2,224 |
| Accumulated amortization and impairments | (2) | (1,227) | (345) | (1,574) |
| Net carrying amount | 355 | 206 | 89 | 650 |
Year ended December 31, 2024 | ||||
| Opening balance | 322 | 250 | 165 | 737 |
| Foreign exchange differences | - | 2 | (1) | 1 |
| Additions | 16 | 38 | 22 | 76 |
| Disposals | - | (6) | (5) | (11) |
| Other | - | 9 | (1) | 8 |
| Amortization | - | (68) | (50) | (118) |
| Impairments | - | (4) | - | (4) |
| Closing balance | 338 | 221 | 130 | 689 |
| Cost | 338 | 1,399 | 456 | 2,193 |
| Accumulated amortization and impairments | - | (1,178) | (326) | (1,504) |
| Net carrying amount | 338 | 221 | 130 | 689 |
The goodwill as at December 31, 2025 is allocated to one of the cash-generating units in the Domestic Retail Banking segment: the collective of local Rabobanks. The recoverable amount is based on the value in use. The value in use is determined using cash flows expected in the near future based on financial forecasts. As the recoverable amount substantially exceeded the carrying amount, Rabobank concluded that the goodwill allocated to this cash-generating unit was not impaired. Rabobank considers a 10% increase in the discount rate or a 10% reduction in the future cash flows to be the maximum of possible changes in key assumptions. Such changes do not cause the carrying amount to exceed the recoverable amount and would not result in an impairment.
Impairments of software developed in-house and other intangible assets are not individually material. The total impairments of software developed in-house was EUR nil million (2024: EUR 4 million).
15 Property and Equipment
15.1 Tangible fixed assets
| Amounts in millions of euros | 2025 | 2024 |
|---|---|---|
| Land and buildings | 597 | 692 |
| Equipment | 202 | 183 |
| Operating lease assets | 2,881 | 2,954 |
| Tangible fixed assets | 3,680 | 3,829 |
| Right-of-use assets | 252 | 282 |
| Total property and equipment | 3,932 | 4,111 |
| Amounts in millions of euros | Land and buildings | Equipment | Operating lease assets | Tangible fixed assets |
|---|---|---|---|---|
Year ended December 31, 2025 | ||||
| Opening balance | 692 | 183 | 2,954 | 3,829 |
| Foreign exchange differences | (3) | (6) | (211) | (220) |
| Purchases | 55 | 48 | 1,282 | 1,385 |
| Disposals | (11) | 7 | (266) | (270) |
| Transfers to assets held for sale | (84) | 15 | (132) | (201) |
| Depreciation | (42) | (53) | - | (95) |
| Depreciation of operating lease assets | - | - | (748) | (748) |
| Other | (10) | 8 | 2 | - |
| Closing balance as per December 31 | 597 | 202 | 2,881 | 3,680 |
| Cost | 1,493 | 672 | 4,739 | 6,904 |
| Accumulated depreciation and impairments | (896) | (470) | (1,858) | (3,224) |
| Net carrying amount as per December 31 | 597 | 202 | 2,881 | 3,680 |
Year ended December 31, 2024 | ||||
| Cost | 1,851 | 689 | 4,655 | 7,195 |
| Accumulated depreciation and impairments | (1,093) | (512) | (1,901) | (3,506) |
| Net carrying amount as per January 1 | 758 | 177 | 2,754 | 3,689 |
| Opening balance | 758 | 177 | 2,754 | 3,689 |
| Foreign exchange differences | 1 | 1 | 81 | 83 |
| Purchases | 57 | 67 | 1,449 | 1,573 |
| Disposals | (2) | (7) | (376) | (385) |
| Transfers to assets held for sale | (48) | - | (139) | (187) |
| Transfers to investment property | (14) | - | - | (14) |
| Impairments | (8) | (2) | - | (10) |
| Reversal impairments | 13 | - | - | 13 |
| Depreciation | (64) | (58) | - | (122) |
| Depreciation of operating lease assets | - | - | (753) | (753) |
| Other | (1) | 5 | (62) | (58) |
| Closing balance as per December 31 | 692 | 183 | 2,954 | 3,829 |
| Cost | 1,747 | 690 | 4,932 | 7,369 |
| Accumulated depreciation and impairments | (1,055) | (507) | (1,978) | (3,540) |
| Net carrying amount as per December 31 | 692 | 183 | 2,954 | 3,829 |
15.2 Lease contracts as a lessee
Rabobank has several lease contracts as a lessee, predominantly related to property used as office and to cars for employees. The consolidated statement of financial position shows the following amounts relating to leases:
| Amounts in millions of euros | 2025 | 2024 | |||
|---|---|---|---|---|---|
| Property-lease | 201 | 234 | |||
| Car-lease | 49 | 47 | |||
| Other leases | 2 | 1 | |||
| Total right-of-use assets | 252 | 282 | |||
| Total lease liabilities | 291 | 335 |
Additions to right-of-use assets during 2025 were EUR 24 million (2024: EUR 29 million). The consolidated statement of income shows the following amounts relating to leases:
| Amounts in millions of euros | 2025 | 2024 | |||
|---|---|---|---|---|---|
| Property-lease | 56 | 63 | |||
| Car-lease | 22 | 22 | |||
| Other leases | 2 | 2 | |||
| Depreciation charge of right-of-use assets | 80 | 87 | |||
| Interest expense | 13 | 14 | |||
| Expense relating to short-term leases | - | - | |||
| Expense relating to leases of low-value assets | - | - | |||
| Expense relating to variable lease payments not included in lease liabilities | 6 | 5 |
The total cash outflow for leases in 2025 was EUR 52 million (2024: EUR 57 million).
15.3 Operating lease contracts as a lessor
Rabobank has concluded various operating lease contracts as lessor. The undiscounted lease payments to be received from operating leases can be broken down as follows:
| Amounts in millions of euros | 2025 | 2024 |
|---|---|---|
| Not exceeding 1 year | 794 | 805 |
| 1 to 2 years | 593 | 603 |
| 2 to 3 years | 399 | 392 |
| 3 to 4 years | 243 | 217 |
| 4 to 5 years | 136 | 106 |
| More than 5 years | 97 | 80 |
| Total payments receivable from operating leases | 2,262 | 2,203 |
16 Investment Properties
| Amounts in millions of euros | 2025 | 2024 |
|---|---|---|
| Cost | 1,066 | 771 |
| Accumulated depreciation and impairments | (149) | (68) |
| Net carrying amount as per January 1 | 917 | 703 |
| Opening balance | 917 | 703 |
| Purchases | 76 | 27 |
| Sales | (1) | - |
| Transfers from real estate projects | 234 | 225 |
| Transfers from land and buildings | - | 14 |
| Depreciation | (24) | (25) |
| Impairments | (3) | (37) |
| Reversal impairment | 26 | 1 |
| Other | (34) | 9 |
| Closing balance as per December 31 | 1,191 | 917 |
| Cost | 1,355 | 1,066 |
| Accumulated depreciation and impairments | (164) | (149) |
| Net carrying amount as per December 31 | 1,191 | 917 |
The fair value of the investment properties amounts to EUR 1,494 million (2024: EUR 1,091 million). External valuations of investment properties were performed by duly certified external parties in accordance with RICS valuation standards or other equivalent standards. The determination of the fair value of investment properties is based on the methodologies that are most appropriate for the type of property. This includes the discounted cash flow valuation method and the capitalization method based on net initial yields for comparable transactions.
| Valuations | 2025 | 2024 |
|---|---|---|
| External valuations | 92% | 94% |
| Internal valuations | 8% | 6% |
Most investment property is unique. There is often no active market for similar properties in the same location and condition. Appraisals of the different types of investment properties are based on many parameters, which are derived from current contracts and market information as much as possible. A certain degree of judgment and estimation cannot be avoided. Therefore, all investment property has been designated as level 3 in line with the fair value classification under IFRS 13. When determining the fair value of investment property, the parameters used include the following, depending on the type of property: current and expected future market rent per m2, current and expected future vacancy rates, location of the property, the marketability of the property, the average discount rate, the development budget, and any credit risks.
17 Other Assets
Other Assets
| Amounts in millions of euros | Note | 2025 | 2024 |
|---|---|---|---|
| Receivables and prepayments | 1,534 | 1,692 | |
| Commodities and warehouse receipts | 1,429 | 1,755 | |
| Real estate projects | 2,441 | 2,478 | |
| Accrued income | 471 | 340 | |
| Employee benefits | 27 | 9 | 9 |
| Other assets | 518 | 421 | |
| Total other assets | 6,402 | 6,695 |
Real Estate Projects
| Amounts in millions of euros | 2025 | 2024 |
|---|---|---|
| Building sites | 1,846 | 1,839 |
| Work in progress | 454 | 530 |
| Finished properties | 141 | 109 |
| Total real estate projects | 2,441 | 2,478 |
In 2025 the net realizable value of all current building sites not subject to a zoning plan was calculated and compared with the carrying amount. This resulted in a reversal of EUR 95 million to the provision (2024: addition of EUR 18 million).
Movements in Provisions for Real Estate Projects
| Amounts in millions of euros | Balance on January 1, 2025 | Additions/ release | Withdrawals/ other changes | Balance on December 31, 2025 |
|---|---|---|---|---|
| Building sites | 496 | (80) | (30) | 386 |
| Work in progress | 54 | 17 | (61) | 9 |
| Finished properties | 10 | 2 | (5) | 7 |
| Total | 560 | (61) | (96) | 402 |
| Amounts in millions of euros | Balance on January 1, 2024 | Additions/ release | Withdrawals/ other changes | Balance on December 31, 2024 |
| Building sites | 456 | 39 | 1 | 496 |
| Work in progress | 32 | 4 | 18 | 54 |
| Finished properties | 2 | 8 | - | 10 |
| Total | 490 | 51 | 19 | 560 |
Work in Progress
| Amounts in millions of euros | 2025 | 2024 |
| Residential property in preparation and under construction | 1,085 | 978 |
| Commercial property in development and under construction | 4 | 3 |
| Instalments invoiced in advance – residential property | (635) | (451) |
| Total work in progress | 454 | 530 |
18 Non-Current Assets Held for Sale
The non-current assets held for sale amount to EUR 112 million (2024: EUR 142 million) and include various types of real estate in the segment Domestic Retail Banking for an amount of EUR 56 million (2024: EUR 31 million), and a loan portfolio and foreign subsidiary in segment Wholesale & Rural for an amount of EUR 56 million (2024: EUR 110 million). The carrying values are expected to be realized through sale rather than through continuing use.
19 Deposits from Credit Institutions
| Amounts in millions of euros | 2025 | 2024 |
|---|---|---|
| Demand deposits | 632 | 617 |
| Fixed-term deposits | 9,511 | 11,424 |
| Repurchase agreements | 34 | 399 |
| Other deposits from credit institutions | 40 | 7 |
| Total deposits from credit institutions | 10,217 | 12,447 |
20 Deposits from Customers
| Amounts in millions of euros | 2025 | 2024 |
|---|---|---|
| Current accounts and overnight deposits | 314,352 | 299,776 |
| Deposits with agreed maturity | 66,601 | 72,469 |
| Deposits redeemable at notice | 52,884 | 39,042 |
| Repurchase agreements | 66 | 149 |
| Total deposits from customers | 433,903 | 411,436 |
Non-monetary instruments from central banks amounting to EUR 11 billion (2024: EUR 10 billion) are included in "Deposits with agreed maturity".
21 Debt Securities in Issue
| Amounts in millions of euros | 2025 | 2024 |
|---|---|---|
| Certificates of deposit | 18,668 | 17,880 |
| Commercial paper | 10,757 | 10,367 |
| Issued bonds | 31,969 | 32,599 |
| Covered bonds | 22,806 | 22,782 |
| Other debt securities | 26,745 | 33,134 |
| Total debt securities in issue | 110,945 | 116,762 |
22 Financial Liabilities Held for Trading
Financial liabilities held for trading are mainly negative fair values of derivatives and delivery obligations that arise on the short selling of securities. Securities are sold short to realize gains from short-term price fluctuations. The securities needed to settle short sales are acquired through securities lending and repurchasing agreements. The fair value of the shares and bonds sold short are EUR 464 million (2024: EUR 277 million).
23 Financial Liabilities Designated at Fair Value
| Amounts in millions of euros | 2025 | 2024 |
|---|---|---|
| Debt securities issued | 1,274 | 1,732 |
| Deposits | 784 | 834 |
| Total financial liabilities designated at fair value | 2,058 | 2,566 |
The cumulative change in fair value of the financial liabilities designated at fair value attributable to changes in Rabobank's own credit risk amounts to EUR 86 million (2024: EUR 84 million). The change in fair value that is attributable to changes in own credit risk is calculated by deducting on a note by note basis the current fair value of these liabilities at the reporting date from the fair value recalculated based on the prevailing credit curve at the time of origination, with all other pricing components unchanged. This calculation reflects the amount that can be attributed to the change in Rabobank's own credit risk since the origination of these liabilities.
Transfers of the cumulative gains or losses within equity during the period and the amounts presented in other comprehensive income that are realized at derecognition are disclosed in Section 30 in the movement schedule of the "Revaluation Reserve – Fair Value Changes Due to Own Credit Risk on Financial Liabilities Designated at Fair Value".
The carrying value of the issued debt securities and deposits designated at fair value is EUR 276 million (2024: EUR 426 million) lower than the amount Rabobank is contractually obliged to repay to the holders.
24 Other Liabilities
| Amounts in millions of euros | Note | 2025 | 2024 |
|---|---|---|---|
| Payables | 5,011 | 5,099 | |
| Lease liabilities | 291 | 335 | |
| Employee benefits | 27 | 242 | 223 |
| Other | 41 | 45 | |
| Total other liabilities | 5,585 | 5,702 |
25 Provisions
| Amounts in millions of euros | Note | 2025 | 2024 |
|---|---|---|---|
| Restructuring provision | 92 | 105 | |
| Provision for legal issues | 36 | 77 | |
| Impairment allowances on loan commitments and financial guarantees | 4.3.4 | 102 | 161 |
| Other provisions | 212 | 251 | |
| Total provisions | 442 | 594 |
| Amounts in millions of euros | Restructuring provision | Provision for legal issues | Other provisions | Total |
|---|---|---|---|---|
| Opening balance on January 1, 2025 | 105 | 77 | 251 | 433 |
| Additions | 75 | 29 | 69 | 173 |
| Withdrawals | (60) | (46) | (83) | (189) |
| Releases | (28) | (24) | (25) | (77) |
| Closing balance on December 31, 2025 | 92 | 36 | 212 | 340 |
| Opening balance on January 1, 2024 | 34 | 105 | 295 | 434 |
| Additions | 102 | 32 | 16 | 150 |
| Withdrawals | (19) | (39) | (52) | (110) |
| Releases | (12) | (21) | (8) | (41) |
| Closing balance on December 31, 2024 | 105 | 77 | 251 | 433 |
For additional information regarding the additions to the provision for legal issues, see Section 4.9, "Legal and arbitration proceedings".
Irrevocable payment commitment (IPC) regarding the Single Resolution Fund
For the contribution to the Single Resolution Fund, Rabobank opted in previous years to use the opportunity to fulfil part of the liability via an irrevocable payment commitment. Rabobank considers this irrevocable payment commitment as a provision, measured at zero, because any expected cash outflow is not anticipated to occur until the very distant future. The nominal amount of the obligation is EUR 270 million (2024: EUR 270 million). Rabobank has provided cash collateral for the IPC which is classified as a financial asset measured at amortized cost.
Maturities of Provisions
| Amounts in millions of euros | 2025 | 2024 |
|---|---|---|
| Not exceeding one year | 320 | 399 |
| Longer than 1 year but less than 5 years | 104 | 174 |
| Longer than 5 years | 18 | 21 |
| Total | 442 | 594 |
26 Deferred Taxes
Deferred tax assets and liabilities are measured for all temporary differences using the liability-method. Deferred tax assets recognized with respect to carry-forward losses and temporary deductible differences can only be utilized if taxable profits are realized in the future.
Certain deferred tax assets arising from the carry forward of unused tax losses from earlier years and temporary differences in segment Property Development and segment Wholesale & Rural are impaired in 2025 because of insufficient convincing evidence for sufficient available future taxable profits from the respective taxable entities. In segment Other a release of a provision for an uncertain tax asset position related to a previous tax year compensates these tax expenses. As a result of these developments, unused tax losses for which no deferred tax assets have been recognized, increased to EUR 473 million (2024: EUR 121 million) of which EUR 382 million (2024: EUR 121 million) relates to tax losses with an infinite expiry date. The tax effect of the unused tax losses amounts to EUR 142 million (2024: EUR 35 million).
The amount of income tax recognized as deferred tax and relating to components of other comprehensive income is disclosed in the following table.
| Deferred tax assets | Deferred tax liabilities | Deferred tax charges | Tax on other compre- hensive income | |
|---|---|---|---|---|
| Amounts in millions of euros | ||||
On December 31, 2025 | ||||
| Pensions and other post-employment benefits | 21 | 2 | - | 1 |
| Impairment allowances on financial assets | 208 | (46) | 72 | - |
| Provisions | 11 | (12) | 16 | - |
| Hedge accounting | 218 | 39 | 59 | - |
| Carry forward losses | 135 | (5) | 17 | - |
| Tax credits | 1 | (1) | - | - |
| Goodwill and other intangible assets | 11 | - | - | - |
| Revaluation reserves for financial assets at fair value through other comprehensive income | (18) | 2 | - | 76 |
| Revaluation reserves – Cash flow hedges | 29 | (1) | - | 22 |
| Revaluation reserves – Costs of hedging | (46) | - | - | (37) |
| Revaluation reserve – Fair value changes due to own credit risk on financial liabilities designated at fair value | 24 | 2 | - | (1) |
| Property and equipment, including operating leases | 125 | 265 | 4 | - |
| Other temporary differences | 50 | 31 | 21 | - |
| Total | 769 | 276 | 189 | 61 |
| Deferred tax assets | Deferred tax liabilities | Deferred tax charges | Tax on other comprehensive income | |
| Amounts in millions of euros | ||||
On December 31, 2024 | ||||
| Pensions and other post-employment benefits | 22 | 1 | (3) | - |
| Impairment allowances on financial assets | 280 | (61) | (136) | - |
| Provisions | 41 | (2) | (20) | - |
| Hedge accounting | 273 | 35 | 28 | - |
| Carry forward losses | 164 | (6) | (21) | - |
| Tax credits | 1 | (1) | 5 | - |
| Goodwill and other intangible assets | 8 | - | - | - |
| Revaluation reserves for financial assets at fair value through other comprehensive income | 47 | (3) | - | (9) |
| Revaluation reserves – Cash flow hedges | 20 | (2) | - | (20) |
| Revaluation reserves – Costs of hedging | (84) | - | - | 44 |
| Revaluation reserve – Fair value changes due to own credit risk on financial liabilities designated at fair value | 24 | 2 | - | (3) |
| Property and equipment, including operating leases | 93 | 243 | 104 | - |
| Other temporary differences | 44 | 6 | 25 | - |
| Total | 933 | 212 | (18) | 12 |
The current tax asset relating to currency translation of foreign currency branches and group entities and related hedging that is recognized in other comprehensive income as at December 31, 2025 is EUR 173 million current tax asset (2024: current tax liability EUR 85 million).
27 Employee Benefits
| Amounts in millions of euros | 2025 | 2024 |
|---|---|---|
| Employee benefits – assets | (9) | (9) |
| Employee benefits – liabilities | 242 | 223 |
| Total employee benefits | 233 | 214 |
| Pension plans | 16 | 17 |
| Other employee benefits | 217 | 197 |
| Total employee benefits | 233 | 214 |
27.1 Pension Plans
Rabobank has placed its Dutch pension scheme with Rabobank Pension Fund. The scheme qualifies as a defined contribution plan under IAS 19 with a pensionable age of 68 and a flat rate savings contribution of 27% of the pension base, including an employee contribution of 5.5%. Risk premiums and administration costs are paid separately by the employer. The investments costs are deducted from the accrued pension capital. Rabobank complies with all its pension obligations by paying the annual pension premium and therefore has no financial liabilities with regard to underlying membership years and accrued pension rights in the past.
As per January 1, 2025, the pension plan of former Friesland Bank does not classify anymore as a defined benefit plan. As of December 31, 2025, only a few small plans qualify as defined benefit pension plans. These are career-average defined benefit pension plans, administered by a fund or otherwise that are related to the remuneration of employees upon retirement and which mostly pay annual pensions. Annual contributions are paid to the funds at a rate necessary to adequately finance the accrued liabilities of the plans calculated in accordance with local legal requirements. The assets related to the plans are held independently of Rabobank assets in separate funds managed by trustees. The obligations are valued each year by independent actuaries based on the method prescribed by IFRS. The most recent actuarial valuations were performed at the end of 2025.
| Amounts in millions of euros | 2025 | 2024 |
|---|---|---|
| Defined benefit obligation | 107 | 342 |
| Fair value of plan assets | 91 | 325 |
| Net defined benefit obligation | 16 | 17 |
Movements in plan assets and liabilities:
| Amounts in millions of euros | 2025 | 2024 | ||
|---|---|---|---|---|
Defined benefit obligation | ||||
| Opening balance | 342 | 340 | ||
| Exchange rate differences | (6) | 7 | ||
| Interest expense | 5 | 13 | ||
| Benefits paid | (3) | (18) | ||
| Settlements | (229) | - | ||
| Other | (4) | 1 | ||
| Experience adjustments | 2 | (4) | ||
| Actuarial gains and losses arising from changes in demographic assumptions | 2 | - | ||
| Actuarial gains and losses arising from changes in financial assumptions | (2) | 3 | ||
| Defined benefit obligation on December 31 | 107 | 342 | ||
Fair value of plan assets | ||||
| Opening balance | 325 | 313 | ||
| Exchange rate differences | (7) | 5 | ||
| Interest income | 5 | 12 | ||
| Contributions paid by employer | - | 12 | ||
| Benefits paid | (3) | (17) | ||
| Settlements | (229) | - | ||
| Other | - | 1 | ||
| Experience adjustments | - | (6) | ||
| Remeasurements arising from changes in financial assumptions plan assets | - | 5 | ||
| Fair value of plan assets on December 31 | 91 | 325 |
The costs recognized in profit and loss are shown in the table below.
| Amounts in millions of euros | 2025 | 2024 | ||
|---|---|---|---|---|
| Interest expense on liabilities | 5 | 13 | ||
| Interest income on plan assets | (5) | (12) | ||
| Losses/(gains) on curtailments, settlements and costs | 1 | - | ||
| Total cost of defined benefit pension plans | 1 | 1 |
As the amounts became very small the tables with the weighted averages of the main actuarial assumptions, the sensitivity analysis, the estimated contribution and the average duration are no longer disclosed.
27.2 Other Employee Benefits
Other employee benefits mainly consist of liabilities for future long-service awards and a liability for the sustainability contribution for employees.
28 Subordinated Liabilities
| Amounts in millions of euros | 2025 | 2024 |
|---|---|---|
| Issued by Rabobank | 6,010 | 7,909 |
| Total subordinated liabilities | 6,010 | 7,909 |
The following table shows details of the issues of subordinated liabilities:
Subordinated Liabilities issued by Rabobank
| Amounts in millions | ||||
|---|---|---|---|---|
| Notional | Currency | Coupon | Year of issuance | Year of maturity |
| 90 | AUD | 5.454% | 2022 | 2037 |
| 60 | AUD | 5.00% | 2022 | 2037 |
| 750 | EUR | 3.875% | 2022 | 2032, early optional redemption date 2027 |
| 1,500 | USD | 3.75% | 2016 | 2026 |
| 1,250 | USD | 5.25% | 2015 | 2045 |
| 1,000 | GBP | 4.625% | 2014 | 2029 |
| 1,250 | USD | 5.75% | 2013 | 2043 |
| 500 | GBP | 5.25% | 2012 | 2027 |
| 7,000 | JPY | 1.23% | 2022 | 2034, early optional redemption date 2029 |
| 300 | AUD | 7.07% | 2022 | 2032, early optional redemption date 2027 |
| 200 | AUD | 7.35% | 2022 | 2032, early optional redemption date 2027 |
| 20,000 | JPY | 1.55% | 2023 | 2033, early optional redemption date 2028 |
29 Contingent Liabilities
Credit Related Contingent Liabilities
Rabobank enters into irrevocable loan commitments and contingent liabilities consisting of financial guarantees and standby letters of credit on behalf of its customers. Under these contracts Rabobank is required to perform under an obligation agreement or to make payments to the beneficiary on third party's failure to meet its obligations. The following table shows the amount of the maximum potential utilization of credit related contingent liabilities.
| Amounts in millions of euros | 2025 | 2024 |
|---|---|---|
| Financial guarantees | 4,650 | 6,054 |
| Loan commitments | 64,047 | 61,2581 |
| Other commitments | 28,956 | 25,234 |
| Credit related contingent liabilities | 97,653 | 92,546 |
- Certain off balance items of DLL are no longer considered to be loan commitments. The comparable figures 2024 have been lowered for an amount of EUR 946 million.
Contingent Liabilities Related to Litigation
Rabobank is involved in a number of legal and arbitration proceedings in the Netherlands and other countries in connection with claims brought by and against Rabobank arising from its operations. For additional information, refer to Section 4.9 "Legal and Arbitration Proceedings".
Other Contingent Liabilities
The contractual commitments relating to the acquisition, construction and development of work in progress and investment properties amount to EUR 1,208 million (2024: EUR 1,172 million).
30 Reserves and Retained Earnings
| Amounts in millions of euros | 2025 | 2024 |
|---|---|---|
| Foreign currency translation reserves | (1,586) | (609) |
| Revaluation reserve – Financial assets at fair value through other comprehensive income | (30) | (265) |
| Revaluation reserve – Cash flow hedges | (89) | (64) |
| Revaluation reserve – Costs of hedging | 133 | 242 |
| Remeasurement reserve – Pensions | (31) | (69) |
| Revaluation reserve – Fair value changes due to own credit risk on financial liabilities designated at fair value | (64) | (62) |
| Retained earnings | 45,990 | 41,769 |
| Total reserves and retained earnings at year-end | 44,323 | 40,942 |
Changes in the reserves were as follows:
| Amounts in millions of euros | 2025 | 2024 |
|---|---|---|
Foreign currency translation reserves | ||
| Opening balance | (609) | (938) |
| Translation of foreign operations | (1,194) | 116 |
| Changes in hedging instrument | 213 | 201 |
| Changes at associates and joint ventures | 2 | 12 |
| Transferred to profit or loss | 2 | - |
| Closing balance | (1,586) | (609) |
Revaluation reserves – Debt instruments at fair value through other comprehensive income | ||
| Opening balance | (101) | (81) |
| Foreign exchange differences | (2) | (1) |
| Changes at associates and joint ventures | 1 | 2 |
| Fair value changes | 176 | (92) |
| Transferred to profit or loss | 36 | 71 |
| Closing balance | 110 | (101) |
Revaluation reserves – Equity instruments at fair value through other comprehensive income | ||
| Opening balance | (164) | (107) |
| Transfers to retained earnings | 11 | - |
| Changes at associates and joint ventures | 3 | (25) |
| Fair value changes | 10 | (32) |
| Closing balance | (140) | (164) |
Revaluation reserve – Cash flow hedges | ||
| Opening balance | (64) | (59) |
| Foreign exchange differences | (88) | 53 |
| Fair value changes | 54 | (60) |
| Transferred to profit or loss | 9 | 2 |
| Closing balance | (89) | (64) |
Revaluation reserve – Costs of hedging | ||
| Opening balance | 242 | 116 |
| Foreign exchange differences | (3) | (1) |
| Fair value changes | (66) | 129 |
| Transferred to profit or loss | (40) | (2) |
| Closing balance | 133 | 242 |
Remeasurement reserve – Pensions | ||
| Opening balance | (69) | (75) |
| Foreign exchange differences | 1 | (1) |
| Changes at associates and joint ventures | 17 | 3 |
| Remeasurements defined benefit plans | 3 | 4 |
| Settlement | 17 | - |
| Closing balance | (31) | (69) |
Revaluation reserve – Fair value changes due to own credit risk on financial liabilities designated at fair value | ||
| Opening balance | (62) | (52) |
| Fair value changes | (4) | (12) |
| Realization at derecognition | 2 | 2 |
| Closing balance | (64) | (62) |
Retained earnings | ||
| Opening balance | 41,769 | 37,438 |
| Net profit | 4,906 | 5,098 |
| Payments on equity instruments | (644) | (667) |
| Redemption of Rabobank Certificates | - | (85) |
| Redemption of Capital Securities | (6) | - |
| Settlement pension plan | (17) | - |
| Disposal of equity instruments at fair value through other comprehensive income | (11) | - |
| Other | (7) | (15) |
| Closing balance | 45,990 | 41,769 |
| Total reserves and retained earnings | 44,323 | 40,942 |
31 Rabobank Certificates
As of June 25, 2025, Rabobank Certificates are no longer issued by the foundation Stichting Administratie Kantoor Rabobank Certificaten, but directly by Rabobank. Rabobank Certificates are listed on Euronext Amsterdam. The total number of certificates including those that are owned by Rabobank is 313,005,461 (December 31, 2024: 313,005,461) with a nominal value of EUR 25 each, in total EUR 7,825 million (December 31, 2024: EUR 7,825 million). On 31 December 2025, Rabobank Certificates recognized in equity amount to EUR 6,909 million (December 31, 2024: EUR 6,909 million) and represent a total number of 276,352,572 (December 31, 2024: 276,352,572) certificates issued externally by Rabobank and belong to Rabobank's Common Equity Tier 1 capital.
The cash distribution paid per certificate in 2025 was EUR 1.625. The amounts listed in the table below are recognized in equity and are based on the nominal value of EUR 25 per Rabobank Certificate. Cash flows arising from changes during the year in the Rabobank Certificates are included in the consolidated statement of cash flows.
| Amounts in millions of euros | 2025 | 2024 |
|---|---|---|
| Changes during the year: | ||
| Opening balance | 6,909 | 7,825 |
| Redemption of Rabobank Certificates | - | (916) |
| Change in Rabobank Certificates during the year | - | - |
| Closing balance | 6,909 | 6,909 |
32 Capital Securities
32.1 Capital Securities
All Capital Securities are perpetual securities issued by Rabobank and have no expiry date. The discretionary distribution on Capital Securities per issue is as follows:
Issue of EUR 750 million
The coupon is 3.10% per year and was made payable semi-annually in arrears as of the issue date (April 21, 2021) for the first time on June 29, 2021. These Capital Securities are perpetual and first redeemable on June 29, 2028. As of December 29, 2028, and subject to Capital Securities not being redeemed early, the distribution is set for a five-year period, but without a step-up, based on the five-year euro swap rate + 3.234%. The coupon is fully discretionary.
Issue of EUR 1,250 million
The coupon is 3.25% per year and is made payable every six months in arrears as of the issue date (September 9, 2019), for the first time on December 29, 2019. These Capital Securities are perpetual and first redeemable on December 29, 2026. As of December 29, 2026, and subject to Capital Securities not being redeemed early, the distribution is set for a five-year period, but without a step-up, based on the 5-year euro swap rate + 3.702%. The coupon is fully discretionary.
Issue of EUR 1,000 million
The coupon is 4.375% per year and is made payable every six months in arrears as of the issue date (July 14, 2020), for the first time on December 29, 2020. These Capital Securities are perpetual and first redeemable on June 29, 2027. As of December 29, 2027, and subject to Capital Securities not being redeemed early, the distribution is set for a five-year period, but without a step-up, based on the 5-year euro swap rate + 4.679%. The coupon is fully discretionary.
Issue of EUR 1,000 million
The coupon is 4.875% per year and was made payable every six months in arrears as of the issue date (April 6, 2022) for the first time on June 29, 2022. The Capital Securities are perpetual and first redeemable on June 29, 2029. As of December 29, 2029, and subject to Capital Securities not being redeemed early, the distribution is set for a five-year period, but without a step-up, based on the five-year euro swap rate + 3.717%. The coupon is fully discretionary.
32.2 Capital Securities That Were Redeemed During the Reporting Year
Rabobank redeemed its capital securities, issued on September 11, 2018 and amounting to EUR 1,000 million, on the first call date of December 29, 2025 in accordance with its Terms and Conditions.
33 Non-Controlling Interests
This item relates to shares held by non-controlling parties in Rabobank's subsidiaries.
| Amounts in millions of euros | 2025 | 2024 |
|---|---|---|
| Opening balance | 621 | 599 |
| Net profit | 51 | 65 |
| Exchange rate differences | (33) | (1) |
| Entities included in consolidation/deconsolidated | 41 | 5 |
| Dividends | (40) | (43) |
| Other | (1) | (4) |
| Closing balance | 639 | 621 |
The Rabobank subsidiaries with the largest non-controlling interests are AGCO Finance SAS and AGCO Finance LLC. Both entities are accounted for in the segment Leasing.
AGCO Finance SAS is located in Beauvais, France, and Rabobank has a capital and voting right interest of 51%. The non-controlling interests with regard to this entity amount to EUR 194 million (2024: EUR 160 million). The following financial data apply:
AGCO Finance SAS
| Amounts in millions of euros | 2025 | 2024 |
|---|---|---|
| Revenues | 82 | 70 |
| Net profit | 49 | 37 |
| Other comprehensive income | - | - |
| Total comprehensive income | 49 | 37 |
| Profit attributable to non-controlling interests | 24 | 18 |
| Dividends paid to non-controlling interests | - | - |
| Financial assets | 2,862 | 2,612 |
| Other assets | 29 | 57 |
| Financial liabilities | 2,374 | 2,243 |
| Other liabilities | 122 | 99 |
AGCO Finance LLC is located in Johnston, United States, and Rabobank has a capital and voting right interest of 51%. The non-controlling interests with regard to this entity amount to EUR 115 million (2024: EUR 117 million). The following financial data apply:
AGCO Finance LLC
| Amounts in millions of euros | 2025 | 2024 |
|---|---|---|
| Revenues | 83 | 86 |
| Net profit | 42 | 53 |
| Other comprehensive income | - | - |
| Total comprehensive income | 42 | 53 |
| Profit attributable to non-controlling interests | 21 | 26 |
| Dividends paid to non-controlling interests | 9 | 7 |
| Financial assets | 3,036 | 3,727 |
| Other assets | 56 | 25 |
| Financial liabilities | 2,683 | 3,326 |
| Other liabilities | 175 | 188 |
34 Changes in Liabilities Arising from Financing Activities
| Amounts in millions of euros | Debt securities in issue | Subordinated liabilities | Total |
|---|---|---|---|
Year ended December 31, 2025 | |||
| Opening balance | 116,762 | 7,909 | 124,671 |
| Changes from financing cash flows | (536) | (1,450) | (1,986) |
| Effect of changes in foreign exchange rates | (5,424) | (559) | (5,983) |
| Other non-cash changes | 143 | 110 | 253 |
| Closing balance | 110,945 | 6,010 | 116,955 |
Year ended December 31, 2024 | |||
| Opening balance | 122,519 | 8,817 | 131,336 |
| Changes from financing cash flows | (9,742) | (703) | (10,445) |
| Effect of changes in foreign exchange rates | 2,538 | 377 | 2,915 |
| Other non-cash changes | 1,447 | (582) | 865 |
| Closing balance | 116,762 | 7,909 | 124,671 |
35 Net Interest Income
| Amounts in millions of euros | 2025 | 2024 |
|---|---|---|
Interest income | ||
| Cash and cash equivalents | 2,322 | 3,983 |
| Loans and advances to credit institutions | 843 | 1,120 |
| Loans and advances to customers | 20,665 | 21,494 |
| Derivatives used for fair value hedge-accounting income /(expense) | (335) | (421) |
| Financial assets at fair value through other comprehensive income | 825 | 538 |
| Interest income from financial assets using the effective interest method | 24,320 | 26,714 |
| Financial assets held for trading | 114 | 137 |
| Financial assets mandatorily at fair value | 25 | 18 |
| Other | 106 | 127 |
| Other interest income | 245 | 282 |
| Total interest income | 24,565 | 26,996 |
Interest expense | ||
| Deposits from credit institutions | 574 | 900 |
| Deposits from customers | 7,725 | 8,840 |
| Debt securities in issue | 4,033 | 4,837 |
| Financial liabilities held for trading | 37 | 37 |
| Derivatives held as economic hedges (income)/expense | (255) | (345) |
| Financial liabilities designated at fair value | 81 | 79 |
| Subordinated liabilities | 366 | 405 |
| Other | 3 | 182 |
| Total interest expense | 12,564 | 14,935 |
| Net interest income | 12,001 | 12,061 |
Capitalized interest attributable to qualifying assets amounted to EUR 19 million (2024: EUR 14 million). The average interest rate applied in determining interest charges to be capitalized ranged between 3% and 5% (2024: between 2% and 7%). The interest income on credit-impaired financial assets accrued is EUR 455 million (2024: EUR 572 million).
36 Net Fee and Commission Income
| Amounts in millions of euros | 2025 | 2024 |
|---|---|---|
Fee and commission income | ||
| Payment services | 1,123 | 1,062 |
| Lending | 520 | 441 |
| Purchase and sale of other financial assets and handling fees | 458 | 382 |
| Insurance commissions | 464 | 455 |
| Lease-related fee | 39 | 40 |
| Other commission income | 228 | 284 |
| Total fee and commission income | 2,832 | 2,664 |
Fee and commission expense | ||
| Payment services | 278 | 254 |
| Purchase and sale of other financial assets and handling fees | 67 | 60 |
| Custodial fees and securities services | 11 | 13 |
| Other commission expense | 46 | 35 |
| Total fee and commission expense | 402 | 362 |
| Net fee and commission income | 2,430 | 2,302 |
37 Net Income from Other Operating Activities
| Amounts in millions of euros | 2025 | 2024 |
|---|---|---|
| Income from real estate activities | 944 | 962 |
| Expenses from real estate activities | 762 | 818 |
| Net income real estate activities | 182 | 144 |
| Income from operational lease activities | 1,042 | 1,061 |
| Expenses from operational lease activities | 748 | 754 |
| Net income from operational lease activities | 294 | 307 |
| Income from investment property | 58 | 45 |
| Expenses from investment property | 18 | 72 |
| Net income from investment property | 40 | (27) |
| Net income from other operating activities | 516 | 424 |
Income from operational lease activities relating to variable lease payments that do not depend on an index or a rate is EUR 120 million (2024: EUR 104 million). All expenses from investment properties relate to properties that are leased.
38 Income from Investments in Associates and Joint Ventures
| Amounts in millions of euros | 2025 | 2024 |
|---|---|---|
| Rabobanks share of profit of investments in associates and joint ventures | 381 | 474 |
| Result on disposal of investments in associates and joint ventures | (11) | (10) |
| Income from investments in associates and joint ventures | 370 | 464 |
39 Gains/ (Losses) on Financial Assets and Liabilities at Fair Value through Profit or Loss
| Amounts in millions of euros | 2025 | 2024 |
|---|---|---|
| Gains/ (losses) on financial assets and liabilities held for trading and from derivatives held for trading | 754 | 687 |
| Gains/ (losses) on financial assets mandatorily at fair value through profit or loss | 156 | 100 |
| Gains/ (losses) on financial liabilities designated at fair value and derivatives used to hedge the interest rate risk of those financial liabilities | (15) | (9) |
| Total gains/ (losses) on financial assets and liabilities at fair value through profit or loss | 895 | 778 |
Gains/ (losses) on financial liabilities designated at fair value and derivatives used to hedge the interest rate risk of those financial liabilities mainly relate to fair value changes of the structured notes portfolio attributable to changes in i) market interest rates and ii) day-one gains that are directly recognized in profit or loss for an amount of EUR 0 million (2024: EUR 3 million). The results related to fair value changes of the structured notes due to changes in market interest rates are largely offset by the fair value changes of the derivatives used to hedge this interest rate risk.
| Amounts in millions of euros | 2025 | 2024 |
|---|---|---|
| Gains/ (losses) on interest rate instruments | 1,182 | 206 |
| Gains/ (losses) on equity instruments | 201 | 18 |
| Gains/ (losses) on foreign currency instruments | (861) | 317 |
| Translation gains/ (losses) on foreign currency | 171 | (33) |
| Other | 202 | 270 |
| Gains/ (losses) on financial assets and liabilities at fair value through profit or loss | 895 | 778 |
40 Other Income
| Amounts in millions of euros | 2025 | 2024 |
|---|---|---|
| Gains/ (losses) arising from the derecognition of financial liabilities at amortized cost | 80 | 10 |
| Result on sale of group companies | (1) | - |
| Other | 165 | 171 |
| Other income | 244 | 181 |
41 Staff Costs
| Amounts in millions of euros | 2025 | 2024 |
|---|---|---|
| Wages and salaries | 3,929 | 3,714 |
| Social security contributions and insurance costs | 446 | 412 |
| Pension costs - defined contribution plans | 559 | 516 |
| Pension costs - defined benefit pension plans | 1 | 1 |
| Training and traveling expenses | 161 | 163 |
| Addition/ (release) of other post-employment provisions | 63 | 44 |
| Other staff costs | 1,144 | 1,315 |
| Staff costs | 6,303 | 6,165 |
Expressed in FTEs, the number of internal and external employees in Rabobank was 48,202 (2024: 49,272).
Rabobank has a Group Remuneration Policy which is updated on a regular basis and includes the provisions under the Dutch Act on Remuneration Policies for Financial Companies. Insofar as employees in the Netherlands are still eligible for variable remuneration, it never amounts to more than an average of 20% of fixed income. Outside the Netherlands, any variable remuneration never amounts to more than 100% of fixed income. Insofar as Identified Staff (employees who can have a material influence on the risk profile of Rabobank Group) are eligible for variable remuneration, it is awarded for periods in which the risks associated with the underlying business activities are adequately taken into account. Payment of a significant part of variable remuneration is deferred; 40% of the variable pay is paid on a deferred basis. If the total variable pay exceeds EUR 500,000, 60% of the total variable pay is deferred. The direct part of variable remuneration is unconditional, whereas the deferred part is conditional. One-fourth of the deferred part becomes unconditional each year (also known as vesting). For senior management, 40% of the variable pay is direct and therefore unconditional, whereas the deferred part is 60%. One-fifth of the deferred part becomes unconditional each year (vested). Among other things, Rabobank assesses whether there has been a significant reduction in financial performance or a significant change in risk management at Rabobank or one of its business unit that puts the circumstances assessed when the relevant variable remuneration was awarded in a different perspective. In principle, the right to any conditionally awarded remuneration lapses when the staff member’s employment ends. 50% of both the direct and the deferred part of the variable remuneration is awarded in cash. The cash component of the direct part vests immediately. The cash component of the deferred part is paid out only after vesting (within a period of four or five years). 50% of the direct and the deferred part of the variable remuneration is awarded in the form of an instrument (instrument component) i.e. the Deferred Remuneration Note (DRN). The instrument component of the direct part vests immediately. The instrument component of the deferred part is paid out only after vesting (within a period of four or five years).
The value of a DRN is linked directly to the price of a Rabobank Certificate (RC) as listed on Euronext Amsterdam. The instrument component is converted into DRNs at the time of awarding on completion of the performance year. The number of DRNs is determined on the basis of the closing rates for Rabobank Certificates, as traded on Euronext Amsterdam on the first trading day of each month of the performance year. This represents both the instrument component of the direct and the deferred part of the variable remuneration. The final value of the DRNs relating to the deferred part is established on vesting (within a period of four or five years). The payment of the instrument component is subject to a one year retention period. After the end of the retention period, the employee receives, for each DRN (or a portion thereof) an amount in cash that corresponds with the value of the DRN at that moment.
Payment of the variable remuneration is measured in accordance with IAS 19 Employee benefits. The direct part of the variable remuneration is recognized in the performance year, whereas the deferred part is recognized in the years before vesting. The same system also applies, in broad terms, to the non-Identified Staff, although no deferral policy applies to the first EUR 130,000. Both the direct and the deferred part are paid fully in cash, which means that no DRNs are awarded.
On December 31, 2025, the costs of equity instrument-based payments were EUR 18 million (2024: EUR 17 million) and a liability of EUR 41 million was recognized (2024: EUR 37 million) of which EUR 16 million (2024: EUR 16 million) was vested. The costs of variable remuneration paid in cash were EUR 282 million (2024: EUR 287 million). The number of outstanding DRNs is presented in the following table.
| in thousands | 2025 | 2024 |
|---|---|---|
| Opening balance | 1,859 | 1,595 |
| Awarded during the year | 628 | 707 |
| Paid during the year | (550) | (432) |
| Changes from previous year | - | (11) |
| Closing balance | 1,938 | 1,859 |
The value of a DRN is linked directly to the price of a Rabobank Certificate. The estimated payments to be made for the variable remuneration are shown in the following table.
| On December 31, 2025 | Year of payment | |||||||||
| Amounts in millions of euros | 2026 | 2027 | 2028 | 2029 | 2030 | 2031 | 2032 | Total | ||
| Variable remuneration, excluding DRNs | 280.4 | 9.1 | 7.9 | 6.3 | 2.2 | 0.1 | - | 306.0 | ||
| DRNs | 17.0 | 17.1 | 7.5 | 6.2 | 4.3 | 2.2 | 0.1 | 54.4 | ||
| Total | 297.4 | 26.3 | 15.4 | 12.5 | 6.5 | 2.3 | 0.1 | 360.4 | ||
| On December 31, 2024 | Year of payment | |||||||||
| Amounts in millions of euros | 2025 | 2026 | 2027 | 2028 | 2029 | 2030 | 2031 | Total | ||
| Variable remuneration, excluding DRNs | 284.0 | 8.9 | 8.9 | 7.6 | 2.4 | 0.2 | - | 312.0 | ||
| DRNs | 14.9 | 16.5 | 6.5 | 5.5 | 4.3 | 2.4 | 0.1 | 50.2 | ||
| Total | 298.9 | 25.4 | 15.4 | 13.1 | 6.7 | 2.6 | 0.1 | 362.2 | ||
42 Other Administrative Expenses
| Amounts in millions of euros | 2025 | 2024 |
|---|---|---|
| Additions and releases of provisions | 96 | 109 |
| IT expenses and software costs | 695 | 644 |
| Consulting and other professional services fees | 461 | 529 |
| Publicity expenses | 144 | 148 |
| Result on derecognition and impairments on (in)tangible assets | 1 | 13 |
| Other expenses | 724 | 576 |
| Other administrative expenses | 2,121 | 2,019 |
43 Depreciation and Amortization
| Amounts in millions of euros | 2025 | 2024 |
|---|---|---|
| Depreciation of tangible fixed assets | 95 | 122 |
| Depreciation of right-of-use assets | 80 | 87 |
| Amortization of intangible assets | 111 | 118 |
| Depreciation and amortization | 286 | 327 |
44 Impairment Charges on Financial Assets
| Amounts in millions of euros | 2025 | 2024 |
|---|---|---|
| Loans and advances to customers and credit institutions | 921 | 582 |
| Financial assets at fair value through other comprehensive income | 4 | 4 |
| Recoveries following write-off | (109) | (102) |
| Loan commitments and financial guarantees | (52) | (16) |
| Impairment charges on financial assets | 764 | 468 |
45 Regulatory Levies
The regulatory levies consist of bank tax, bank levies and contributions to the Single Resolution Fund and the Deposit Guarantee Scheme.
| Amounts in millions of euros | 2025 | 2024 |
|---|---|---|
| Bank tax Netherlands | 185 | 184 |
| Contribution Single Resolution Fund | 1 | 1 |
| Contribution Deposit Guarantee Fund | 48 | 81 |
| Regulatory levies | 234 | 266 |
46 Income Tax
| Amounts in millions of euros | 2025 | 2024 |
|---|---|---|
Income tax | ||
| Reporting period | 1,713 | 1,792 |
| Adjustments of previous years current tax | (146) | (121) |
| Adjustments of previous years deferred tax | 157 | - |
| Recognition of previously unrecognized tax losses | (2) | (2) |
| Deferred tax | 37 | (16) |
| Total income tax | 1,759 | 1,652 |
The effective tax rate is 26.2% (2024: 24.2%) and differs from the Dutch statutory corporate tax rate. This difference is explained as follows:
| Amounts in millions of euros | 2025 | 2024 | ||
|---|---|---|---|---|
| Operating profit before taxation | 6,716 | 6,815 | ||
| Applicable tax rate | 25.8% | 1,733 | 25.8% | 1,758 |
| Increase/(decrease) in taxes resulting from: | ||||
| Tax-exempt income | (1.8%) | (121) | (2.0%) | (133) |
| Impact of foreign tax rates | (0.1%) | (6) | 0.0% | 1 |
| Non-deductible expenses | 2.5% | 165 | 2.7% | 181 |
| Recognition of previously unrecognized tax losses | (0.0%) | (2) | (0.0%) | (2) |
| Other permanent differences | (1.0%) | (67) | (1.0%) | (70) |
| Adjustments of previous years | (1.7%) | (114) | (1.8%) | (121) |
| Adjustment due to changes in tax rates | 0.1% | 4 | (0.0%) | (1) |
| Write down deferred tax | 1.9%1 | 125 | (0.0%) | (1) |
| Other non-recurring tax items | 0.6% | 42 | 0.6% | 40 |
| Total income tax | 26.2% | 1,759 | 24.2% | 1,652 |
- The deferred tax assets arising from the carryforward of unused tax losses in segment W&R and segment Property Development are no longer recognized as a result of a history of recent losses and the lack of other convincing evidence that sufficient future taxable profits are available. This led to an income tax expense from prior years of EUR 58 million in segment W&R and EUR 67 million in segment Property Development.
The non-deductible expenses mainly relate to the bank tax and to interest expenses falling under the Dutch Thin Cap regulation for banks. The other permanent differences mainly consist of the tax effect on the interest payments on Capital Securities. The adjustments of previous years are explained by completion and filing of tax returns.
Under the Pillar Two legislation, Rabobank is obliged to pay a top-up tax for the difference between their GloBE (Global Anti-Base Erosion rules) effective tax rate per jurisdiction and the 15% minimum rate. Rabobank has assessed that based on the financial statements no or only a non-material amount of top up tax would be payable. Rabobank applied the exception to recognising and disclosing information about deferred tax assets and liabilities related to Pillar Two income taxes.
47 Transactions with Related Parties
Two parties are considered related if one party exercises control or has significant influence over the other party regarding financial or operating decisions. In the normal course of business, Rabobank conducts a wide variety of transactions with related entities. These involve different types of loans, deposits and transactions in foreign currencies. Transactions between related parties also includes transactions with associates, pension funds, joint ventures, the Managing Board and the Supervisory Board. These transactions are conducted under commercial terms and conditions and against market prices. Intragroup transactions are not disclosed in the consolidated financial statements.
In the normal course of Rabobank’s business operations, banking transactions are carried out with related parties. These involve loans, deposits and transactions in foreign currencies. These transactions are conducted under commercial terms and conditions and against market prices. The volumes of related party transactions, year-end outstanding balances and the corresponding income and expenses during the year are presented in the following table. Transactions and balances outstanding with members of the Managing Board and members of the Supervisory Board are disclosed in Section 49. Transactions with pension funds are disclosed in Section 27.
| Amounts in millions of euros | Investments in associates | Other related parties | ||||||
|---|---|---|---|---|---|---|---|---|
| 2025 | 2024 | 2025 | 2024 | |||||
| Loans | ||||||||
| Outstanding at beginning of year | 25 | 15 | 16 | 102 | ||||
| Provided during the year | 19 | 12 | 16 | 1 | ||||
| Redeemed during the year | (29) | (2) | - | (87) | ||||
| Other | - | - | - | - | ||||
| Gross loans as of December 31 | 15 | 25 | 32 | 16 | ||||
| Less: loan impairment allowance | - | - | - | - | ||||
| Total loans as of December 31 | 15 | 25 | 32 | 16 | ||||
| Deposits from credit institutions and deposits from customers | ||||||||
| Outstanding at beginning of the year | 5,522 | 5,882 | 72 | 38 | ||||
| Received during the year | 1,007 | 995 | 150 | 190 | ||||
| Repaid during the year | (1,109) | (1,355) | (164) | (156) | ||||
| Other | - | - | - | - | ||||
| Total deposits as of December 31 | 5,420 | 5,522 | 58 | 72 | ||||
| Credit related contingent liabilities | 198 | 193 | - | - | ||||
| Income | ||||||||
| Net interest income | 14 | 11 | - | - | ||||
| Net fee and commission income | 299 | 285 | - | - | ||||
| Total income from transactions with related parties | 313 | 296 | - | - | ||||
| Expenses | ||||||||
| Interest expense | 167 | 193 | - | - | ||||
| Net fee and commission expense | 37 | 30 | - | - | ||||
| Total expenses from transactions with related parties | 204 | 223 | - | - | ||||
48 Cost of External Independent Auditor
Expenses for services provided by Rabobank’s independent auditor, PricewaterhouseCoopers Accountants N.V. ("PwC") and its member firms and/ or affiliates to Rabobank and its subsidiaries in 2025 are specified as follows:
| Amounts in millions of euros | 2025 | 2024 | ||||
| PwC Netherlands | Other PwC network firms | Total | PwC Netherlands | Other PwC network firms | Total | |
| Audit services | 15.5 | 11.5 | 27.0 | 11.1 | 11.1 | 22.2 |
| Other audit services | - | - | - | 2.9 | - | 2.9 |
| Tax advisory services | - | 0.2 | 0.2 | - | 0.5 | 0.5 |
| Other non-audit services | - | - | - | - | - | - |
| Total | 15.5 | 11.7 | 27.2 | 14.0 | 11.6 | 25.6 |
The audit fees listed above relate to Rabobank and its consolidated group entities audited by PwC and other member firms in the global PwC network, including their tax services and advisory groups. These audit fees relate to the audit of the financial statements, regardless of whether the work was performed during the financial year.
Rabobank's independent auditor, PricewaterhouseCoopers Accountants N.V., has rendered, for the period to which the statutory audit relates, in addition to the audit of the statutory financial statements the following services to the company and its controlled entities (Section 10, subsection 2.g of the EU Regulation 537/2015):
Other Audit Services Required By Law or Regulatory Requirements including
Audit of the regulatory returns to be submitted to DNB/ECB
Assurance engagement cost price models for the AFM
ISAE 3402 assurance engagements on the deposit guarantee scheme for DNB
Agreed upon procedures for the Single Resolution Fund.
Other Audit Services including:
Assurance engagement on the sustainability reporting
Agreed upon procedures on cost allocations
Assurance engagement on the effectiveness of internal control over financial reporting
Comfort letters issued in connection with funding program updates and drawdowns thereunder
Special purpose financial statement audits of controlled and related entities.
49 Remuneration of the Supervisory Board and the Managing Board
The members of the Supervisory Board and the Managing Board are listed in Section 54 of these Consolidated Financial Statements. Rabobank regards the members of the Managing Board and the Supervisory Board as key management personnel. The members of the Managing Board are among the identified staff as disclosed in Section 41. The remuneration of members of the Managing Board is set out below.
| Amounts in thousands of euros | Short-term employee benefits | Post-employment benefits | Total | ||
|---|---|---|---|---|---|
| Salary | Other | Pension scheme | Individual pension contribution | ||
| Stefaan Decraene, CEO | 1,255 | 78 | 29 | 297 | 1,659 |
| Bas Brouwers, CFO | 1,057 | - | 32 | 245 | 1,334 |
| Els Kamphof, Wholesale & Rural | 869 | 48 | 34 | 195 | 1,147 |
| Carlo van Kemenade, Retail NL | 978 | - | 29 | 224 | 1,230 |
| Vincent Maagdenberg, CRO | 869 | 43 | 29 | 195 | 1,136 |
| Philippe Vollot, COO | 1,416 | 122 | 34 | 340 | 1,912 |
| Janine Vos, CHRO | 869 | 2 | 32 | 195 | 1,098 |
| Lara Yocarini, Vendor Finance | 869 | 30 | 29 | 195 | 1,123 |
| Alexander Zwart, CITO | 869 | 2 | 31 | 195 | 1,097 |
| Total 2025 | 9,051 | 325 | 279 | 2,081 | 11,736 |
| Members Managing Board | 8,078 | 294 | 443 | 1,662 | 10,477 |
| Former Members Managing Board | 400 | 995 | 26 | 80 | 1,500 |
| Total 2024 | 8,478 | 1,289 | 469 | 1,742 | 11,977 |
At year-end 2025, 25,523 DRNs were outstanding among members of the Managing Board (2024: 37,772 pieces). The pension scheme for the members of the Managing Board is classified as a defined contribution scheme. The maximum income on the basis of which the members of the Managing Board can accrue a pension amounts to a maximum for 2025 of EUR 137.800. Any income exceeding this amount is not pensionable for which the members of the Managing Board receive an individual pension contribution. The members of the Managing Board are entitled to a car lease arrangement.
The remuneration of members of the Supervisory Board is set out below. The remuneration also depends on the roles in the various committees. The composition of these committees is detailed in the Annual Report. The remuneration structure is the following:
| Amounts in euros | Remuneration |
|---|---|
| Chair | 239,096 |
| Member | 97,812 |
| Additional fees | |
| Supervisory Board deputy chair | 32,604 |
| Chair Audit Committee | 21,736 |
| Chair Risk Committee | 21,736 |
| Chair Cooperative Affairs Committee | 21,736 |
| Chair HR & Remuneration Committee | 10,868 |
| Chair Appointments Committee | 10,868 |
| Chair and member Financial Economic Crime Committee1 | 10,868 |
- Temporary committee
The table below shows the remuneration for individual members of the Supervisory Board.
| Amounts in thousands of euros | Remuneration |
|---|---|
| Marjan Trompetter | 250 |
| Johan van Hall | 163 |
| Sandra Berendsen | 98 |
| Driek Desmet | 100 |
| Miriam van Dongen | 119 |
| Matthew Elderfield | 167 |
| Brian Hirman (member per September 17, 2025) | 28 |
| Gail Klintworth | 126 |
| Mark Pensaert | 115 |
| Bart Zegers (member per September 17, 2025) | 28 |
| Petri Hofsté (member until March 3, 2025) | 17 |
| Total 2025 | 1,211 |
| Total 2024 | 1,177 |
At Rabobank, the Chairman of the Supervisory Board holds a number of roles which are related to the cooperative such as Chairman of the General Members' Council.
| Amounts in millions of euros | Managing Board | Supervisory Board | ||
|---|---|---|---|---|
| Loans, advances and guarantees | 2025 | 2024 | 2025 | 2024 |
| Outstanding on January 1 | 3.3 | 3.7 | 2.1 | 2.2 |
| Provided during the year | 0.2 | - | - | - |
| Redeemed during the year | (0.3) | - | (0.2) | (0.4) |
| Reduction on account of leaving office | - | (1.4) | - | (1.3) |
| Increase on account of taking office | - | 1.1 | 0.7 | 1.5 |
| Outstanding on December 31 | 3.2 | 3.3 | 2.5 | 2.1 |
No members of the Managing Board in office have invested in Rabobank Certificates in person. The loans, advances and guarantees of the members of the Managing Board in office and the average interest rates were as follows:
| Amounts in millions of euros | Outstanding loans | Average interest rate (in %) |
|---|---|---|
| On December 31, 2025 | ||
| Bas Brouwers | 0.7 | 1.5 |
| Els Kamphof | 0.3 | 1.3 |
| Carlo van Kemenade | 0.9 | 2.0 |
| Janine Vos | 1.1 | 1.6 |
| Lara Yocarini | 0.1 | 1.1 |
| Alexander Zwart | 0.1 | 5.3 |
| Amounts in millions of euros | Outstanding loans | Average interest rate (in %) |
|---|---|---|
| On December 31, 2024 | ||
| Bas Brouwers | 0.7 | 1.5 |
| Els Kamphof | 0.4 | 1.3 |
| Carlo van Kemenade | 0.9 | 1.9 |
| Janine Vos | 1.1 | 1.6 |
| Lara Yocarini | 0.1 | 1.1 |
| Alexander Zwart | 0.1 | 5.3 |
The loans, advances and guarantees of the members of the Supervisory Board in office and the average interest rates were as follows:
| Amounts in millions of euros | Outstanding loans | Average interest rate (in %) |
|---|---|---|
| On December 31, 2025 | ||
| Sandra Berendsen | 1.3 | 3.8 |
| Marjan Trompetter | 0.6 | 3.0 |
| Bart Zegers | 0.6 | 2.0 |
| Amounts in millions of euros | Outstanding loans | Average interest rate (in %) |
|---|---|---|
| On December 31, 2024 | ||
| Sandra Berendsen | 1.5 | 3.8 |
| Marjan Trompetter | 0.6 | 3.0 |
At year-end 2025, the members of the Supervisory Board not listed in the table had not received any loans, advances or guarantees. These transactions with members of the Managing Board and Supervisory Board were completed in person on the basis of employee terms and conditions and/or market rates for the Supervisory Board. The rates depend in part on the currency, on the agreed fixed-interest period and on the time at which the transaction was completed or on the time at which a new fixed-interest term becomes effective.
50 Principal Subsidiaries
| On December 31, 2025 | Share | Voting rights |
| Principal subsidiaries | ||
| The Netherlands | ||
| DLL International B.V. | 100% | 100% |
| BPD Europe B.V. | 100% | 100% |
| Obvion N.V. | 100% | 100% |
| North America | ||
| Utrecht America Holdings Inc. | 100% | 100% |
| South America | ||
| Banco Rabobank International Brasil S.A. | 100% | 100% |
| Australia and New Zealand | ||
| Rabobank Australia Limited | 100% | 100% |
| Rabobank New Zealand Limited | 100% | 100% |
All subsidiaries listed in the table have been consolidated. In 2025, none of the subsidiaries experienced any significant restrictions in the payment of dividends or the redemption of loans and repayment of advances. The possibility for subsidiaries to pay dividend to Rabobank depends on various factors, including local regulatory requirements, statutory reserves and financial performance.
Several structured entities in W&R segment are not consolidated, even if Rabobank retains more than half of the voting rights. These structured entities are not consolidated because the relevant activities and the variable returns are determined by a third party to the contract.
Rabobank controls several entities in the "Leasing" segment as part of its vendor leasing operations, even though it retains less than half of the voting rights. This is because control is not determined based on voting rights, but rather on management participation.
51 Transfer of Financial Assets and Financial Assets Provided as Collateral
51.1 Reverse Repurchase Transactions and Securities Borrowing Agreements
Reverse repurchase transactions and securities borrowing agreements concluded by Rabobank are included under "Loans and Advances to Credit Institutions" or "Loans and Advances to Customers" and amount to:
| Amounts in millions of euros | 2025 | 2024 |
|---|---|---|
| Loans and advances to credit institutions | 27,031 | 19,594 |
| Loans and advances to customers | 21,771 | 15,907 |
| Total reverse repurchase transactions and securities borrowing agreements | 48,802 | 35,501 |
In accordance with the terms of the reverse repurchase transactions and securities borrowing agreements, Rabobank receives collateral under conditions that enable it to re-pledge or resell the collateral to third parties. On December 31, 2025, the total fair value of the securities received under the terms of the agreements was EUR 49,675 million (2024: EUR 35,294 million). In accordance with the agreement terms, a portion of the securities was re-pledged or sold as collateral. These transactions were effected subject to the normal conditions for standard reverse repurchase transactions and securities borrowing agreements. The securities have not been recognized in the statement of financial position because almost all the associated risks and benefits accrue to the counterparty. A receivable has been recognized at a value equivalent to the amount paid as collateral.
51.2 Repurchase Transactions and Securities Lending Agreements
Repurchase transactions and securities lending agreements concluded by Rabobank are included under "Deposits from Credit Institutions" and "Deposits from Customers". They amount to:
| Amounts in millions of euros | 2025 | 2024 |
|---|---|---|
| Deposits from credit institutions | 34 | 399 |
| Deposits from customers | 66 | 149 |
| Total repurchase and securities lending | 100 | 548 |
Rabobank provided interest-bearing securities with a carrying amount (equal to fair value) as at December 31, 2025 of EUR 107 million (2024: EUR 546 million) as collateral for repurchase agreements. The counterparty retains the right to sell or re-pledge the securities. Rabobank performed these transactions subject to the normal conditions for standard repurchase transactions and securities lending agreements. The bank may provide or receive securities or cash as collateral if the value of the securities changes. The securities have not been de-recognized because almost all the associated risks and benefits accrue to Rabobank, including credit and market risks. A liability is recognized at a value equivalent to the amount received as collateral.
51.3 Securitizations
As part Rabobank's financing activities and liquidity management, and in order to reduce credit risk, cash flows from certain financial assets are transferred to third parties (true sale transactions). Most of the financial assets subject to these transactions have been mortgages and other loan portfolios that have been transferred to a special purpose vehicle that has subsequently been consolidated. After securitization, the assets continue to be recognized in Rabobank's statement of financial position, mainly under "Loans and Advances to Customers". The securitized assets have been measured in accordance with the accounting policies referred to in Section 2.15.
The carrying amount of the transferred financial assets related to own-asset securitization is EUR 61,486 million (2024: EUR 67,485 million) with the corresponding liability amounting to EUR 61,009 million (2024: EUR 66,657 million). Approximately 90% (2024: 87%) of the transferred assets have been securitized internally for liquidity purposes. The carrying amount of the assets where Rabobank acts as a sponsor (Nieuw-Amsterdam) is EUR 3,102 million (2024: EUR 3,118 million) with the corresponding liability amounting to EUR 3,103 million (2024: EUR 3,118 million). Rabobank retains 5% to 6% of the outstanding commercial paper issued by Nieuw Amsterdam for regulatory purposes.
51.4 Carrying Amount of Financial Assets Pledged as Collateral for (Contingent) Liabilities
The assets referred to below have been pledged as collateral for (contingent) liabilities (with exception of repo transactions, securities lending and own-asset securitizations) with the objective of providing security for the counterparty. Should Rabobank enter into default, the counterparties may use the security to settle the debt.
| Amounts in millions of euros | 2025 | 2024 |
|---|---|---|
| Cash and cash equivalents | 55 | 190 |
| Loans and advances to credit institutions | 2,092 | 3,305 |
| Loans and advances to customers | 33,694 | 34,097 |
| Financial assets held for trading | 23 | 193 |
| Financial assets at fair value through other comprehensive income | 472 | 437 |
| Total assets pledged as collateral | 36,336 | 38,222 |
52 Structured Entities
52.1 Consolidated Structured Entities
A structured entity is an entity that is structured so that voting rights or comparable rights do not constitute the dominant factor in determining who exercises control over the entity. Rabobank uses structured entities in order to securitize mortgages and other loan portfolios as part of its financing activities, liquidity management and in order to reduce credit risk. The loans are actually transferred to the structured entities. Own-asset securitization is performed by Rabobank, Obvion and DLL. In addition to providing cash facilities, Rabobank also acts as a swap counterparty for all own-asset securitizations.
Rabobank acts as a sponsor in Nieuw Amsterdam Receivables Corporation. Nieuw Amsterdam issues asset-backed commercial paper (ABCP) in various currencies and provides Rabobank customers access to liquidity through the commercial paper market. Rabobank provides advice and manages the program, markets ABCP, provides cash facilities and credit risk enhancements and other facilities for the underlying transactions and as well as for the program itself.
Rabobank consolidates the own-asset securitization vehicles and Nieuw Amsterdam because it is exposed to or entitled to fluctuating income in respect of its involvement in these entities. In addition, Rabobank also has the option to influence the amount of the investor’s income by virtue of having control over the entities.
52.2 Non-Consolidated Structured Entities
Non-consolidated structured entities refer to all structured entities over which Rabobank has no control. These interests are comprised mainly of debt securities to securitization vehicles and private equity interests. The amount of these debt securities is almost always limited when compared to the vehicle’s total assets. Rabobank usually refinances these securitization vehicles by issued debt securities or credit facilities.
The following table lists the nature and risks of Rabobank’s interests in non-consolidated structured entities. The size of non-consolidated structured entities generally reflects the carrying amount of the assets and the contingent liabilities. The maximum exposure equals the carrying amount disclosed in the table below.
Income from sponsored, non-consolidated structured entities in which Rabobank holds no interest is zero (2024: zero).
| Amounts in millions of euros | On December 31, 2025 | On December 31, 2024 | ||||
|---|---|---|---|---|---|---|
Assets recognized by Rabobank | Securitizations | Other | Total | Securitizations | Other | Total |
| Financial assets held for trading | - | 8 | 8 | - | 11 | 11 |
| Financial assets mandatorily at fair value | - | 1,432 | 1,432 | - | 1,425 | 1,425 |
| Derivatives | - | - | - | - | - | - |
| Loans and advances to customers | 507 | 168 | 675 | 527 | 151 | 678 |
| Financial assets at fair value through other comprehensive income | - | - | - | - | - | - |
| Investments in associates | 1 | 149 | 150 | - | 175 | 175 |
| Total financial assets recognized by Rabobank | 508 | 1,757 | 2,265 | 527 | 1,762 | 2,289 |
Liabilities recognized by Rabobank | ||||||
| Derivatives | 53 | - | 53 | 12 | - | 12 |
| Deposits from customers | 220 | - | 220 | 268 | - | 268 |
| Total liabilities recognized by Rabobank | 273 | - | 273 | 280 | - | 280 |
53 Events after the Reporting Period
There were no subsequent events to be disclosed.
54 Authorization of the Financial Statements
The financial statements were signed by the Supervisory Board and Managing Board on March 5, 2026. The financial statements will be presented for adoption to the General Meeting, to be held on April 8, 2026. With regard to the adoption of Rabobank's financial statements, the Articles of Association state: "The resolution to adopt the financial statements will be passed by an absolute majority of the votes validly cast by the General Members’ Council".
Managing Board
Stefaan Decraene, Chair
Bas Brouwers, CFO
Vincent Maagdenberg, CRO
Els Kamphof, Member
Carlo van Kemenade, Member
Philippe Vollot, Member
Janine Vos, Member
Lara Yocarini, Member
Alexander Zwart, Member
Supervisory Board
Marjan Trompetter, Chair
Johan van Hall, Vice Chair
Sandra Berendsen
Driek Desmet
Miriam van Dongen
Matthew Elderfield
Brian Hirman
Gail Klintworth
Mark Pensaert
Bart Zegers

Statement of Financial Position
Statement of Financial Position (before profit appropriation)
| Amounts in millions of euros | Note | December 31, 2025 | December 31, 2024 | ||
|---|---|---|---|---|---|
Assets | |||||
| Cash and balances at central banks | 1 | 60,697 | 83,528 | ||
| Short-term government papers | 2 | 174 | 227 | ||
| Professional securities transactions | 26,094 | 19,266 | |||
| Other loans and advances to credit institutions | 13,934 | 16,109 | |||
| Loans and advances to credit institutions | 3 | 40,028 | 35,375 | ||
| Public sector lending | 1,139 | 1,047 | |||
| Private sector lending | 416,081 | 398,972 | |||
| Professional securities transactions | 22,210 | 16,367 | |||
| Loans and advances to customers | 4 | 439,430 | 416,386 | ||
| Interest-bearing securities | 5 | 28,676 | 18,075 | ||
| Shares | 6 | 315 | 70 | ||
| Interests in group companies | 7 | 17,987 | 17,641 | ||
| Other equity investments | 8 | 1,743 | 1,490 | ||
| Intangible assets | 9 | 274 | 330 | ||
| Tangible fixed assets | 10 | 870 | 955 | ||
| Other assets | 11 | 3,387 | 3,673 | ||
| Derivatives | 12 | 20,323 | 24,183 | ||
| Total assets | 613,904 | 601,933 | |||
| Amounts in millions of euros | Note | December 31, 2025 | December 31, 2024 | ||
|---|---|---|---|---|---|
Liabilities | |||||
| Professional securities transactions | 34 | 399 | |||
| Other liabilities to credit institutions | 12,152 | 13,599 | |||
| Due to credit institutions | 14 | 12,186 | 13,998 | ||
| Savings | 190,219 | 173,662 | |||
| Professional securities transactions | 66 | 52 | |||
| Other due to customers | 227,873 | 221,868 | |||
| Due to customers | 15 | 418,158 | 395,582 | ||
| Debt securities in issue | 16 | 102,423 | 106,698 | ||
| Other liabilities | 17 | 2,988 | 3,725 | ||
| Derivatives | 12 | 16,397 | 20,565 | ||
| Provisions | 18 | 530 | 633 | ||
| Subordinated liabilities | 19 | 6,010 | 7,909 | ||
| 558,692 | 549,110 | ||||
| Rabobank Certificates | 6,909 | 6,909 | |||
| Capital Securities | 3,980 | 4,972 | |||
| Revaluation reserves | 19 | (73) | |||
| Legal reserves | (83) | 463 | |||
| Other reserves | 39,481 | 35,454 | |||
| Profit for the year | 4,906 | 5,098 | |||
| Equity | 20 | 55,212 | 52,823 | ||
| Total equity and liabilities | 613,904 | 601,933 | |||
Statement of Income
Statement of Income
| For the year ended 31 December | |||
|---|---|---|---|
| Amounts in millions of euros | Note | 2025 | 2024 |
| Interest income | 21 | 20,557 | 22,898 |
| Interest expense | 21 | 11,536 | 13,921 |
| Net interest income | 21 | 9,021 | 8,977 |
| Fee and commission income | 22 | 2,581 | 2,417 |
| Fee and commission expense | 22 | 347 | 318 |
| Net fee and commission income | 22 | 2,234 | 2,099 |
| Income from equity interests | 23 | 1,520 | 1,099 |
| Gains/ (losses) from trading portfolio with external parties | 738 | 633 | |
| Gains/ (losses) from trading portfolio with group companies | (324) | 401 | |
| Gains/ (losses) from investment portfolio | (24) | (27) | |
| Net income from financial transactions | 390 | 1,007 | |
| Other results | 161 | 91 | |
| Income | 13,326 | 13,273 | |
| Staff costs | 24 | 4,911 | 4,761 |
| Other administrative expenses | 1,553 | 1,467 | |
| Depreciation | 224 | 264 | |
| Operating expenses | 6,688 | 6,492 | |
| Impairment on investments in associates | - | 72 | |
| Impairment charges on financial assets | 318 | (46) | |
| Regulatory levies | 25 | 199 | 232 |
| Operating profit before taxation | 6,121 | 6,523 | |
| Income tax | 26 | 1,215 | 1,425 |
| Net profit | 4,906 | 5,098 | |
Notes to the Company Financial Statements
1 Basis of Preparation
The company financial statements of Coöperatieve Rabobank U.A., a credit institution as referred to in Section 1:1 of the Financial Supervision Act, have been prepared in accordance with accounting policies generally accepted in the Netherlands and comply with the financial reporting requirements included in Part 9 of Book 2 of the Dutch Civil Code. In accordance with subsection 8 of section 362 of Book 2 of the Dutch Civil Code, the accounting policies in the company financial statements are the same as those used in preparing Rabobank's consolidated financial statements. For the accounting policies, reference is made to Section 2 "Material Accounting Policies" of the consolidated financial statements, with one exception regarding the measurement of interests in group companies as these are measured at net asset value. The hedge accounting entries of the consolidated financial statements have also been applied in the company financial statements by using combination 3 (Option 3 RJ). If an underlying hedged item belongs to a group company, then the hedge accounting adjustment is included in balance sheet item ‘Interests in group companies’ because this item is a combination of assets and liabilities of that group company. For disclosures about hedge accounting, reference is made to the consolidated financial statements.
The Coöperatieve Rabobank U.A. and the legal entities and companies that form part of the group, is an international financial services provider operating on the basis of cooperative principles. Rabobank has its registered office in Amsterdam and is registered under Chamber of commerce number 30046259.
2 Risk Exposure on Financial Instruments
Rabobank manages risks at various levels within the organization. At the highest level, the Managing Board (under the supervision of the Supervisory Board) determines the risk strategy it will pursue, the risk appetite, the policy framework as well as the limits. The Supervisory Board regularly assesses the risks attached to Rabobank's activities and portfolio. The Chief Risk Officer, as a Member of the Managing Board, is responsible for the risk management policy within Rabobank.
Rabobank considers risks at company level the same as risks at consolidated level. Please refer to Section 4 "Risk Exposure on Financial Instruments" of the consolidated financial statements. Additional remarks on solvency on solo level are presented below.
Solvency
Coöperatieve Rabobank U.A. (solo) must comply with a number of minimum solvency positions as stipulated under law. The solvency position is determined on the basis of ratios. These ratios compare the qualifying capital (total capital ratio), the Tier 1 capital (Tier 1 ratio) and the core capital (Common Equity Tier 1 ratio) with the total of the risk-adjusted assets. The minimum percentages are determined on the basis of CRD V/CRR.
Minimum Capital Buffer
| CET 1 | AT 1 | Tier 1 | Tier 2 | Overall capital requirements | ||
| Pillar 1 requirement | 4.50% | 1.50% | 6.00% | 2.00% | 8.00% | |
| Capital conservation buffer | 2.50% | - | 2.50% | - | 2.50% | |
| Countercyclical buffer | 1.44% | - | 1.44% | - | 1.44% | |
| Systemic buffer | 0.02% | - | 0.02% | - | 0.02% | |
| Total required | 8.46% | 1.50% | 9.96% | 2.00% | 11.96% |
The CET1-ratio of Coöperatieve Rabobank U.A. (solo) is 20.7% (2024: 16.6%).
Legal and Arbitration Proceedings
Rabobank considers risks regarding legal and arbitration proceedings the same at company level as at consolidated level. For a description of these proceedings, see Section 4.9 "Legal and Arbitration Proceedings" in the consolidated financial statements. For legal and arbitration proceedings related to Coöperatieve Rabobank U.A. the following amounts apply.
| Amounts in millions of euros | 2025 | 2024 |
|---|---|---|
| Legal provisions | 25 | 64 |
| Contingent liabilities | 29 | 28 |
Notes to the Statement of Financial Position
1 Cash and Balances at Central Banks
This item consists of balances available on demand with central banks in countries in which Rabobank operates and with De Nederlandsche Bank (the Dutch Central Bank) as required under its minimum reserve policy.
2 Short-term Government Papers
This item relates to government securities with an original term to maturity of up to two years. The cost and market value of short-term government papers are virtually the same.
| Amounts in millions of euros | 2025 | 2024 | |||
|---|---|---|---|---|---|
| Recognized in the investment portfolio | 174 | 227 | |||
| Total short-term government papers | 174 | 227 |
3 Loans and Advances to Credit Institutions
This item represents loans and advances to other credit institutions, other than in the form of interest-bearing securities.
| Amounts in millions of euros | 2025 | 2024 |
|---|---|---|
| Loans and advances to other credit institutions | 31,495 | 25,972 |
| Loans and advances to group companies | 8,533 | 9,403 |
| Total loans and advances to credit institutions | 40,028 | 35,375 |
| Of which subordinated | 1,039 | 324 |
The terms of loans and advances to credit institutions can be broken down as follows: | ||
| On demand | 8,867 | 14,253 |
| ≤ 3 months | 12,038 | 6,873 |
| > 3 months ≤ 1 year | 10,833 | 5,590 |
| > 1 year ≤ 5 years | 6,110 | 5,315 |
| > 5 years | 56 | 49 |
| No maturity | 2,124 | 3,295 |
| Total loans and advances to credit institutions | 40,028 | 35,375 |
The fair value of accepted collateral in the form of securities is EUR 26,881 million (2024: EUR 19,268 million).
4 Loans and Advances to Customers
This item consists of loans and advances arising in the course of business operations, other than receivables from credit institutions and interest-bearing securities.
The fair value of accepted collateral in the form of securities is EUR 21,858 million (2024: EUR 15,699 million).
| Amounts in millions of euros | 2025 | 2024 |
|---|---|---|
Breakdown of loans and advances to customers: | ||
| Public sector lending | 1,139 | 1,047 |
| Private sector lending | 416,081 | 398,972 |
| Professional securities transactions | 22,210 | 16,367 |
| Total loans and advances to customers | 439,430 | 416,386 |
Totals include: | ||
| Of which to group companies | 98,413 | 94,399 |
| Of which mortgages | 160,582 | 156,316 |
| Loans recognized in the trading portfolio | 1,522 | 481 |
| Loans recognized in the investment portfolio | - | - |
| Loans recognized in the investment portfolio at fair value through profit or loss | 639 | 630 |
| Loans at amortized cost | 437,269 | 415,275 |
| Total loans and advances to customers | 439,430 | 416,386 |
The terms of loans and advances can be broken down as follows: | ||
| On demand | 55,476 | 52,446 |
| ≤ 3 months | 17,455 | 15,630 |
| > 3 months ≤ 1 year | 28,314 | 26,621 |
| > 1 year ≤ 5 years | 114,746 | 108,561 |
| > 5 years | 220,093 | 211,083 |
| No maturity | 1,185 | 934 |
| Loans at amortized cost | 437,269 | 415,275 |
Loans (excluding government loans and reverse repos) can be classified as follows by their concentration in specific business sectors: | ||
| Food & agri | 20% | 21% |
| Trade, industry and services | 29% | 28% |
| Private individuals | 51% | 51% |
| Total | 100% | 100% |
5 Interest-Bearing Securities
This item represents interest-bearing securities other than short-term government papers.
| Amounts in millions of euros | 2025 | 2024 |
|---|---|---|
Interest-bearing securities of: | ||
| Governments | 19,476 | 10,895 |
| Other issuers | 9,200 | 7,180 |
| Total interest-bearing securities | 28,676 | 18,075 |
Breakdown of interest-bearing securities: | ||
| Trading portfolio | 1,122 | 1,159 |
| Investment portfolio | 27,553 | 16,913 |
| Investment portfolio at fair value through profit or loss | 1 | 3 |
| Total interest-bearing securities | 28,676 | 18,075 |
The portfolio also includes: | ||
| Securities issued by group companies | 184 | 202 |
| Listed portion of the portfolio | 28,233 | 17,716 |
| Non-listed securities and securities issued by group companies | 443 | 359 |
| Total interest-bearing securities | 28,676 | 18,075 |
6 Shares
This item consists of shares and other non-interest-bearing securities.
| Amounts in millions of euros | 2025 | 2024 |
|---|---|---|
This breaks down as follows: | ||
| Investment portfolio | 29 | 27 |
| Trading portfolio | 286 | 43 |
| Total shares | 315 | 70 |
| Listed portion of the portfolio | 272 | 41 |
| Non-listed portion of the portfolio | 43 | 29 |
| Total shares | 315 | 70 |
7 Interests in Group Companies
This item includes the interests held directly in group companies.
| Amounts in millions of euros | 2025 | 2024 |
|---|---|---|
| Equity investments in: | ||
| Credit institutions | 4,746 | 4,668 |
| Other entities | 13,241 | 12,973 |
| Total interest in group companies | 17,987 | 17,641 |
Changes in equity investments: | ||
| Carrying amount on January 1 | 17,641 | 16,925 |
| Additions, capital contributions during the financial year | 283 | 632 |
| Sales, disposals and liquidations during the financial year | - | (384) |
| Profit | 1,207 | 737 |
| Dividend/capital reimbursements | (293) | (194) |
| Revaluation | (850) | (76) |
| Other | (1) | 1 |
| Carrying amount on December 31 | 17,987 | 17,641 |
8 Other Equity Investments
This item includes participating interests in associates, particularly in Achmea B.V.
| Amounts in millions of euros | 2025 | 2024 |
|---|---|---|
Equity investments in: | ||
| Credit institutions | - | - |
| Other entities | 1,743 | 1,490 |
| Total other equity investments | 1,743 | 1,490 |
Changes in equity investments: | ||
| Carrying amount on January 1 | 1,490 | 1,245 |
| Acquisitions during the financial year | 1 | 5 |
| Disposals during the financial year | (10) | (10) |
| Profit/ (loss) | 323 | 369 |
| Revaluation | 14 | 14 |
| Impairment | - | (72) |
| Dividend | (75) | (61) |
| Carrying amount on December 31 | 1,743 | 1,490 |
9 Intangible Assets
The intangible assets mainly consist of software.
| Amounts in millions of euros | 2025 | 2024 |
|---|---|---|
| Carrying amount on January 1 | 330 | 393 |
| Acquisitions during the financial year | 50 | 45 |
| Disposals during the financial year | (4) | (7) |
| Depreciation | (100) | (108) |
| Impairment losses | - | (4) |
| Exchange differences and other | (2) | 11 |
| Carrying amount on December 31 | 274 | 330 |
| Accumulated depreciation and impairment losses | 1,504 | 1,437 |
10 Tangible Fixed Assets
| Amounts in millions of euros | 2025 | 2024 |
|---|---|---|
| Land and buildings in own use | 571 | 660 |
| Equipment | 134 | 108 |
| Right-of-use assets | 165 | 187 |
| Total tangible fixed assets | 870 | 955 |
| Amounts in millions of euros | Land and buildings in own use | Equipment |
|---|---|---|
| Carrying amount on January 1, 2025 | 660 | 108 |
| Acquisitions during the financial year | 55 | 34 |
| Disposals during the financial year | - | (4) |
| Depreciation | (40) | (37) |
| Transfers between Land and buildings in own use and Equipment | (31) | 31 |
| Transfers to other assets | (69) | - |
| Exchange differences and other | (4) | 2 |
| Carrying amount on December 31, 2025 | 571 | 134 |
| Accumulated depreciation and impairment losses | 826 | 378 |
| Amounts in millions of euros | ||
| Carrying amount on January 1, 2024 | 724 | 107 |
| Acquisitions during the financial year | 39 | 45 |
| Disposals during the financial year | (2) | (5) |
| Depreciation | (61) | (39) |
| Impairment losses | (8) | (1) |
| Reversal impairment losses | 13 | - |
| Transfers to other assets | (49) | - |
| Exchange differences and other | 4 | 1 |
| Carrying amount on December 31, 2024 | 660 | 108 |
| Accumulated depreciation and impairment losses | 984 | 405 |
11 Other Assets
This item relates to current and deferred tax assets and assets that cannot be classified under any other heading.
| Amounts in millions of euros | 2025 | 2024 | |||
|---|---|---|---|---|---|
This item can be broken down as follows: | |||||
| Current tax assets | 83 | 68 | |||
| Deferred tax assets | 581 | 607 | |||
| Employee benefits | 9 | 8 | |||
| Commodities and warehouse receipts | 1,429 | 1,755 | |||
| Other | 1,285 | 1,235 | |||
| Total other assets | 3,387 | 3,673 |
Fiscal Unity for Corporate Income Tax Purposes
For corporate income tax purposes Rabobank forms a fiscal unity with a number of domestic subsidiaries. Under this fiscal unity, each participating legal entity is jointly and severally liable for the fiscal unity’s corporate income tax liabilities.
12 Derivatives
| Amounts in millions of euros | 2025 | 2024 |
|---|---|---|
Assets | ||
| This item can be broken down as follows: | ||
| Derivative contracts with third parties | 19,446 | 22,899 |
| Derivative contracts with group companies | 877 | 1,284 |
| Total derivatives | 20,323 | 24,183 |
Liabilities | ||
| This item can be broken down as follows: | ||
| Derivative contracts with third parties | 12,673 | 17,084 |
| Derivative contracts with group companies | 3,724 | 3,481 |
| Total derivatives | 16,397 | 20,565 |
The table below shows the notional amounts and the positive and negative fair values of Rabobank’s derivative contracts.
| Amounts in millions of euros | Notional amounts | Fair values | |
|---|---|---|---|
| Balance on December 31, 2025 | Assets | Liabilities | |
Derivatives | |||
| OTC | 7,018,214 | 13,041 | 10,057 |
| Listed | 114,600 | 1 | 1 |
| Interest rate contracts | 7,132,814 | 13,042 | 10,058 |
| OTC | 447,221 | 6,612 | 5,789 |
| Listed | - | - | - |
| Currency contracts | 447,221 | 6,612 | 5,789 |
| Credit derivatives | 4,110 | 192 | 38 |
| OTC | 13,803 | 477 | 512 |
| Listed | - | - | - |
| Other contracts | 13,803 | 477 | 512 |
| Total derivatives | 7,597,948 | 20,323 | 16,397 |
| Amounts in millions of euros | Notional amounts | Fair values | |
|---|---|---|---|
| Balance on December 31, 2024 | Assets | Liabilities | |
Derivatives | |||
| OTC | 6,128,489 | 15,148 | 10,761 |
| Listed | 100,002 | 2 | 1 |
| Interest rate contracts | 6,228,491 | 15,150 | 10,762 |
| OTC | 463,358 | 8,181 | 9,372 |
| Listed | - | - | - |
| Currency contracts | 463,358 | 8,181 | 9,372 |
| Credit derivatives | 3,419 | 56 | 26 |
| OTC | 14,752 | 796 | 405 |
| Listed | - | - | - |
| Other contracts | 14,752 | 796 | 405 |
| Total derivatives | 6,710,020 | 24,183 | 20,565 |
13 Trading and Investment Portfolios
Breakdown of Trading and Investment Portfolios
| Amounts in millions of euros | 2025 | 2024 |
|---|---|---|
Trading portfolio | ||
| Short-term government papers | - | - |
| Loans and advances to customers | 1,522 | 481 |
| Interest-bearing securities | 1,122 | 1,159 |
| Shares | 286 | 43 |
| Total trading portfolio | 2,930 | 1,683 |
Investment portfolio | ||
| Short-term government papers | 174 | 227 |
| Loans and advances to customers | - | - |
| Interest-bearing securities | 27,553 | 16,913 |
| Shares | 29 | 27 |
| Total investment portfolio | 27,756 | 17,167 |
| Included in the investment portfolios of group companies | 183 | 182 |
Changes in the investment portfolio | ||
| Balance on January 1 | 17,167 | 12,067 |
| Foreign exchange differences | (331) | 153 |
| Acquisitions during the financial year | 18,510 | 11,494 |
| Disposals during the financial year | (7,366) | (6,746) |
| Fair value changes | 10 | (128) |
| Other | (234) | 327 |
| Balance on December 31 | 27,756 | 17,167 |
The terms of the investment portfolio can be broken down as follows: | ||
| On demand | 204 | 159 |
| ≤ 3 months | 221 | 215 |
| > 3 months ≤ 1 year | 696 | 309 |
| > 1 year ≤ 5 years | 9,848 | 3,792 |
| > 5 years | 16,758 | 12,665 |
| No maturity | 29 | 27 |
| Total investment portfolio | 27,756 | 17,167 |
Investment portfolio at fair value through profit or loss | ||
| Interest-bearing securities | 1 | 3 |
| Loans and advances to customers | 639 | 630 |
| Total investment portfolio at fair value through profit or loss | 640 | 633 |
14 Due to Credit Institutions
This item represents amounts owed to credit institutions, other than debt securities and subordinated debt, of which:
| Amounts in millions of euros | 2025 | 2024 |
|---|---|---|
| Due to credit institutions | 7,469 | 9,239 |
| Due to group companies | 4,590 | 4,636 |
| Monetary instruments of central banks | - | - |
| Due to other equity investments | 127 | 123 |
| Total due to credit institutions | 12,186 | 13,998 |
| On demand | 5,701 | 7,856 |
| ≤ 3 months | 1,830 | 565 |
| > 3 months ≤ 1 year | 999 | 1,236 |
| > 1 year ≤ 5 years | 1,405 | 1,484 |
| > 5 years | 459 | 491 |
| No maturity | 1,792 | 2,366 |
| Total due to credit institutions | 12,186 | 13,998 |
15 Due to Customers
This item consists of amounts due to customers other than debt securities. Due to customers also includes the investments of central banks amounting to EUR 11 billion (2024: EUR 10 billion).
| Amounts in millions of euros | 2025 | 2024 |
|---|---|---|
| Due to other customers | 409,813 | 386,763 |
| Due to group companies | 3,063 | 3,431 |
| Due to other equity investments | 5,282 | 5,388 |
| Total due to customers | 418,158 | 395,582 |
Due to other customers comprises all deposits and savings accounts of natural persons, businesses, non-profit making associations and foundations, as well as non-transferable savings bonds.
| Amounts in millions of euros | 2025 | 2024 |
|---|---|---|
| On demand | 370,185 | 344,368 |
| ≤ 3 months | 5,718 | 8,751 |
| > 3 months ≤ 1 year | 10,602 | 10,288 |
| > 1 year ≤ 5 years | 10,163 | 9,674 |
| > 5 years | 17,434 | 18,121 |
| No maturity | 4,056 | 4,380 |
| Total due to customers | 418,158 | 395,582 |
16 Debt Securities in Issue
This item relates to non-subordinated bonds and other interest-bearing securities, such as certificates of deposit.
| Amounts in millions of euros | 2025 | 2024 |
|---|---|---|
| Tradeable debt securities | 57,248 | 62,347 |
| Other debt securities | 45,175 | 44,351 |
| Total debt securities in issue | 102,423 | 106,698 |
| On demand | 3,404 | 4,691 |
| ≤ 3 months | 8,592 | 6,298 |
| > 3 months ≤ 1 year | 29,141 | 26,547 |
| > 1 year ≤ 5 years | 34,850 | 42,879 |
| > 5 years | 26,436 | 26,283 |
| Total debt securities in issue | 102,423 | 106,698 |
17 Other Liabilities
This item includes liabilities that cannot be classified under any other heading such as current taxes, short positions on securities, liabilities for staff costs, and creditors.
| Amounts in millions of euros | 2025 | 2024 |
|---|---|---|
This item can be broken down as follows: | ||
| Current tax liabilities | 60 | 301 |
| Other liabilities | 2,928 | 3,424 |
| Total other liabilities | 2,988 | 3,725 |
18 Provisions
| Amounts in millions of euros | 2025 | 2024 |
|---|---|---|
| Provision for pension plans and other post-retirement provisions | 189 | 172 |
| Provision for deferred tax liabilities | 4 | 5 |
| Impairment allowances on loan commitments and financial guarantees | 94 | 150 |
| Other provisions | 243 | 306 |
| Total provisions | 530 | 633 |
Provision for Employee Benefits
The provision for employee benefits consists of a provision for pension plans of EUR 3 million (2024: EUR 4 million) and of other post-retirement provisions of EUR 186 million (2024: EUR 168 million).
Other Provisions
| Amounts in millions of euros | Restructuring provision | Provision for legal issues | Other | Total |
|---|---|---|---|---|
| Opening balance on January 1, 2025 | 63 | 64 | 179 | 306 |
| Additions | 65 | 24 | 63 | 152 |
| Withdrawals | (39) | (42) | (76) | (157) |
| Releases | (21) | (21) | (16) | (58) |
| Closing balance on December 31, 2025 | 68 | 25 | 150 | 243 |
| Opening balance on January 1, 2024 | 23 | 94 | 234 | 351 |
| Additions | 69 | 25 | 8 | 102 |
| Withdrawals | (19) | (36) | (60) | (115) |
| Releases | (10) | (19) | (3) | (32) |
| Closing balance on December 31, 2024 | 63 | 64 | 179 | 306 |
19 Subordinated Liabilities
This represents the loans relating to the issue of subordinated loans.
| Amounts in millions of euros | 2025 | 2024 |
|---|---|---|
| Subordinated loans | 6,010 | 7,909 |
| Balance on December 31 | 6,010 | 7,909 |
In the following table details of the issues of subordinated liabilities are shown:
Subordinated Liabilities
| Amounts in millions | ||||
|---|---|---|---|---|
| Notional | Currency | Coupon | Year of issuance | Year of maturity |
| 90 | AUD | 5.454% | 2022 | 2037 |
| 60 | AUD | 5.00% | 2022 | 2037 |
| 750 | EUR | 3.875% | 2022 | 2032, early optional redemption date 2027 |
| 1,500 | USD | 3.75% | 2016 | 2026 |
| 1,250 | USD | 5.25% | 2015 | 2045 |
| 1,000 | GBP | 4.625% | 2014 | 2029 |
| 1,250 | USD | 5.75% | 2013 | 2043 |
| 500 | GBP | 5.25% | 2012 | 2027 |
| 7,000 | JPY | 1.23% | 2022 | 2034, early optional redemption date 2029 |
| 300 | AUD | 7.07% | 2022 | 2032, early optional redemption date 2027 |
| 200 | AUD | 7.35% | 2022 | 2032, early optional redemption date 2027 |
| 20,000 | JPY | 1.55% | 2023 | 2033, early optional redemption date 2028 |
20 Equity
| Amounts in millions of euros | 2025 | 2024 |
|---|---|---|
This item can be broken down as follows: | ||
| Rabobank Certificates | 6,909 | 6,909 |
| Capital Securities | 3,980 | 4,972 |
| Revaluation reserves | 19 | (73) |
| Legal reserves | (83) | 463 |
| Other reserves | 39,481 | 35,454 |
| Profit for the year | 4,906 | 5,098 |
| Total equity | 55,212 | 52,823 |
Rabobank Certificates
As of June 25, 2025, Rabobank Certificates are no longer issued by the foundation Stichting Administratie Kantoor Rabobank Certificaten, but directly by Rabobank. Rabobank Certificates are listed on Euronext Amsterdam. The total number of certificates including those that are owned by Rabobank is 313,005,461 (December 31, 2024: 313,005,461) with a nominal value of EUR 25 each, in total EUR 7,825 million (December 31, 2024: EUR 7,825 million). On 31 December 2025, Rabobank Certificates recognized in equity amount to EUR 6,909 million (December 31, 2024: EUR 6,909 million) and represent a total number of 276,352,572 (December 31, 2024: 276,352,572) certificates issued externally by Rabobank and belong to Rabobank's Common Equity Tier 1 capital.
The cash distribution paid per certificate in 2025 was EUR 1.625. The amounts listed in the table below are based on the nominal value of EUR 25 per Rabobank Certificate. Cash flows arising from changes during the year in the Rabobank Certificates are included in the consolidated statement of cash flows.
Rabobank Certificates
| Amounts in millions of euros | 2025 | 2024 |
|---|---|---|
Changes during the year: | ||
| Opening balance | 6,909 | 7,825 |
| Redemption of Rabobank Certificates | - | (916) |
| Closing balance | 6,909 | 6,909 |
Capital Securities
For issues and redemptions, please refer to Section 32 "Capital Securities" of the consolidated financial statements.
Capital Securities
| Amounts in millions of euros | 2025 | 2024 |
|---|---|---|
Movements were as follows: | ||
| Balance on January 1 | 4,972 | 4,975 |
| Redemption of Capital Securities | (994) | - |
| Other | 2 | (3) |
| Balance on December 31 | 3,980 | 4,972 |
Revaluation Reserves
| Amounts in millions of euros | 2025 | 2024 |
|---|---|---|
The revaluation reserves can be specified as follows: | ||
| Cash flow hedges | (89) | (64) |
| Interest-bearing securities | 108 | (102) |
| Shares and non-interest-bearing securities | (133) | (149) |
| Costs of hedging | 133 | 242 |
| Total revaluation reserves | 19 | (73) |
Movements were as follows: | ||
| Balance on January 1 | (73) | (107) |
| Exchange rate differences | (103) | 57 |
| Revaluations | 176 | (78) |
| Other | 4 | (16) |
| Transferred to profit or loss | 4 | 71 |
| Transfers to retained earnings | 11 | - |
| Balance on December 31 | 19 | (73) |
Legal Reserves
| Amounts in millions of euros | 2025 | 2024 |
|---|---|---|
The legal reserves can be specified as follows: | ||
| Retained profits of investments in associates | 1,305 | 862 |
| Software developed in-house | 199 | 210 |
| Translation differences | (1,587) | (609) |
| Total legal reserves | (83) | 463 |
Movements were as follows: | ||
| Balance on January 1 | 463 | (209) |
| From other reserves to legal reserves | 432 | 343 |
| Exchange rate differences | (978) | 329 |
| Balance on December 31 | (83) | 463 |
Other Reserves
| Amounts in millions of euros | 2025 | 2024 |
|---|---|---|
The other reserves can be specified as follows: | ||
| Recalibration of pensions | (31) | (69) |
| Fair value changes due to own credit risk on financial liabilities designated at fair value | (64) | (62) |
| Retained earnings | 39,576 | 35,585 |
| Total other reserves | 39,481 | 35,454 |
Movements in the recalibration of pensions: | ||
| Balance on January 1 | (69) | (75) |
| Recalibration of pensions | 21 | 6 |
| Settlement | 17 | - |
| Balance on December 31 | (31) | (69) |
Movements in the fair value changes due to own credit risk on financial liabilities designated at fair value: | ||
| Balance on January 1 | (62) | (52) |
| Fair value changes | (4) | (12) |
| Realization at derecognition | 2 | 2 |
| Balance on December 31 | (64) | (62) |
Movements in retained earnings: | ||
| Balance on January 1 | 35,585 | 32,398 |
| Profit for previous financial year | 5,098 | 4,287 |
| Distribution to third parties | (644) | (667) |
| Transferred to legal reserves | (432) | (343) |
| Transferred to revaluation reserves | (19) | (9) |
| Redemption of Rabobank Certificates | - | (85) |
| Redemption of Capital Securities | (6) | - |
| Settlement pension plan | (17) | - |
| Other changes | 11 | 4 |
| Balance on December 31 | 39,576 | 35,585 |
The reserves cannot be distributed among members.
Rabobank's consolidated financial statements include the financial information of Coöperatieve Rabobank U.A. and its group companies. Rabobank's consolidated net profit was EUR 4,957 million (2024: EUR 5,163 million); Rabobank's net profit in the company financial statements was EUR 4,906 million (2024: EUR 5,098 million). The difference of EUR 51 million (2024: EUR 65 million) represents profit attributed to non-controlling interests.
The table below shows the reconciliation between the equity of Coöperatieve Rabobank U.A. and consolidated equity:
| Amounts in millions of euros | 2025 | 2024 |
|---|---|---|
| Equity of Rabobank according to Part 9 of Book 2 of the Dutch Civil Code | 55,212 | 52,823 |
| Non-controlling interests | 639 | 621 |
| Equity according to IFRS as presented in the consolidated financial statements | 55,851 | 53,444 |
Notes to the Statement of Income
21 Net Interest Income
| Amounts in millions of euros | 2025 | 2024 |
|---|---|---|
Interest income | ||
| Cash and cash equivalents | 2,250 | 3,914 |
| Loans and advances to credit institutions | 1,130 | 1,708 |
| Loans and advances to customers | 16,756 | 17,635 |
| Financial assets held for trading | 114 | 137 |
| Financial assets mandatorily at fair value | 22 | 11 |
| Financial assets at fair value through other comprehensive income | 708 | 425 |
| Derivatives | (452) | (976) |
| Other | 30 | 44 |
| Total interest income | 20,558 | 22,898 |
Interest expense | ||
| Deposits from credit institutions | 624 | 1,058 |
| Deposits from customers | 6,915 | 7,940 |
| Debt securities in issue | 3,507 | 4,216 |
| Financial liabilities held for trading | 37 | 37 |
| Financial liabilities designated at fair value | 81 | 79 |
| Subordinated liabilities | 360 | 399 |
| Other | 12 | 192 |
| Total interest expense | 11,536 | 13,921 |
| Net interest income | 9,022 | 8,977 |
22 Net Fee and Commission Income
| Amounts in millions of euros | 2025 | 2024 |
|---|---|---|
Fee and commission income | ||
| Payment services | 1,126 | 1,064 |
| Lending | 522 | 448 |
| Purchase and sale of other financial assets and handling fees | 455 | 375 |
| Insurance commissions | 363 | 333 |
| Other commission income from group companies | 1 | 2 |
| Other commission income | 114 | 195 |
| Total fee and commission income | 2,581 | 2,417 |
Fee and commission expense | ||
| Payment services | 278 | 253 |
| Handling fees | 23 | 26 |
| Custodial fees and securities services | 11 | 13 |
| Other commission expense to group companies | 4 | 3 |
| Other commission expense | 31 | 23 |
| Total fee and commission expense | 347 | 318 |
| Net fee and commission income | 2,234 | 2,099 |
23 Income from Equity Interests
| Amounts in millions of euros | 2025 | 2024 | ||
|---|---|---|---|---|
| Dividend income from shares | - | 3 | ||
| Results from interests in group companies | 1,207 | 737 | ||
| Results from other equity investments | 323 | 369 | ||
| Results from disposed interests | (10) | (10) | ||
| Total income from equity interests | 1,520 | 1,099 |
24 Staff Costs
| Amounts in millions of euros | 2025 | 2024 | |||
|---|---|---|---|---|---|
| Wages and salaries | 3,012 | 2,828 | |||
| Social security contributions and insurance costs | 336 | 313 | |||
| Pension costs | 483 | 442 | |||
| Training and travelling expenses | 122 | 122 | |||
| Other staff costs | 958 | 1,056 | |||
| Total staff costs | 4,911 | 4,761 |
The average number of internal and external employees was 39,500 (2024: 40,247), of which outside the Netherlands 2,974 (2024: 3,031). Expressed in FTEs, the average number of internal and external employees was 38,838 (2024: 39,460).
25 Regulatory Levies
| Amounts in millions of euros | 2025 | 2024 |
|---|---|---|
| Bank tax Netherlands | 152 | 154 |
| Contribution Deposit Guarantee Fund | 47 | 78 |
| Regulatory levies | 199 | 232 |
26 Income Tax
| Amounts in millions of euros | 2025 | 2024 |
|---|---|---|
Income tax | ||
| Reporting period | 1,333 | 1,457 |
| Adjustments of previous years | (116) | (114) |
| Deferred tax | (2) | 82 |
| Total income tax | 1,215 | 1,425 |
| Effective tax rate | 19.8% | 21.8% |
| Applicable tax rate | 25.8% | 25.8% |
The effective tax rate differs from the applicable tax rate in 2025 mainly because of the net inclusion of income from group entities and the deduction of interest payments on Capital Securities.
The effective tax rate was 19.8% (2024: 21.8%) and differs from the theoretical rate that would arise using the Dutch corporate tax rate. This difference is explained as follows:
| Amounts in millions of euros | 2025 | 2024 | ||
|---|---|---|---|---|
| Operating profit before taxation | 6,121 | 6,523 | ||
| Applicable tax rate | 25.8% | 1,579 | 25.8% | 1,683 |
Increase/(decrease) in taxes resulting from: | ||||
| Increase/(decrease) from interests in group companies | (5.1%) | (311) | (2.9%) | (190) |
| Other tax-exempt income | (0.8%) | (50) | (1.4%) | (90) |
| Impact of foreign tax rates | (0.2%) | (10) | (0.1%) | (8) |
| Non-deductible expenses | 2.5% | 154 | 2.5% | 166 |
| Tax losses not recognized in previous years | (0.0%) | (1) | 0.0% | (1) |
| Other permanent differences | (0.8%) | (50) | (0.8%) | (51) |
| Adjustments of previous years | (1.9%) | (116) | (1.7%) | (114) |
| Adjustment due to changes in tax rates | - | - | - | - |
| Write-down deferred tax items | - | - | 0.0% | (2) |
| Other non-recurring tax items | 0.3% | 20 | 0.5% | 33 |
| Total income tax | 19.8% | 1,215 | 21.8% | 1,425 |
The non-deductible expenses mainly relate to the bank tax and to interest expenses falling under the Dutch Thin Cap regulation for banks.
Other Notes to the Financial Statements
27 Professional Securities Transactions and Assets Not Freely Available
Reverse repurchase transactions and securities borrowing agreements concluded by Rabobank are included under "Loans and advances to credit institutions" or "Loans and advances to customers".
| Amounts in millions of euros | 2025 | 2024 |
|---|---|---|
| Loans and advances to credit institutions | 26,094 | 19,266 |
| Loans and advances to customers | 22,210 | 16,367 |
| Total | 48,304 | 35,633 |
Repurchase transactions and securities lending agreements concluded by Rabobank are included under "Due to credit institutions" and "Due to customers" .
| Amounts in millions of euros | 2025 | 2024 |
|---|---|---|
| Due to credit institutions | 34 | 399 |
| Due to customers | 66 | 52 |
| Total | 100 | 451 |
The assets referred to in the table below (with exception of professional securities transactions) were provided to counterparties as security for (contingent) liabilities. Should Rabobank enter into default, the counterparties may use the security to settle the debt.
| Amounts In millions of euros | 2025 | 2024 | |
|---|---|---|---|
Assets not freely available: | Related to type of liabilities: | ||
| Loans and advances to credit institutions | Derivatives | 2,092 | 3,305 |
| Loans and advances to customers | Due to customers, Debt securities in issue | 27,038 | 26,418 |
| Interest-bearing securities | Due to customers | 495 | 630 |
| Total | 29,625 | 30,353 |
28 Contingent Liabilities
Rabobank enters into irrevocable loan commitments and other contingent liabilities consisting of financial guarantees and standby letters of credit on behalf of its customers. Under these contracts Rabobank is required to perform under an obligation agreement or to make payments to the beneficiary on third party's failure to meet its obligations. The following table shows the amount of the maximum potential utilization of contingent liabilities.
| Amounts in millions of euros | 2025 | 2024 |
|---|---|---|
Contingent liabilities consist of: | ||
| Financial guarantees | 6,168 | 8,052 |
| Loan commitments | 56,471 | 55,738 |
| Other commitments | 30,051 | 26,760 |
| Total contingent liabilities | 92,690 | 90,550 |
Of which: | ||
| Contingent liabilities to group companies | 10,161 | 10,772 |
Liability Undertakings
Pursuant to Section 403 of Book 2 of the Dutch Civil Code, Rabobank has assumed liability for the debts arising from the legal transactions of the following group companies:
|
|
|
|
|
|
|
|
Rabobank issued a liquidity guarantee for Rabo Groen Bank B.V.
Fiscal Unity for Corporate Income Tax Purposes
For corporate income tax purposes Rabobank forms a fiscal unity with a number of domestic subsidiaries. Under the fiscal unity, each participating legal entity is jointly and severally liable for the fiscal unity’s corporate income tax liabilities.
29 Principal Group Companies
In 2025, none of the group companies experienced any significant restrictions in the payment of dividends or the redemption of loans and repayment of advances. The option of group companies to pay dividend to Rabobank depends on various factors, including local regulatory requirements, statutory reserves and financial performance.
| On December 31, 2025 | Share | Voting rights |
| Principal group companies | ||
| The Netherlands | ||
| DLL International B.V. | 100% | 100% |
| BPD Europe B.V. | 100% | 100% |
| Obvion N.V. | 100% | 100% |
| North America | ||
| Utrecht America Holdings Inc. | 100% | 100% |
| Australia and New Zealand | ||
| Rabobank Australia Limited | 100% | 100% |
| Rabobank New Zealand Limited | 100% | 100% |
30 Remuneration of the Supervisory Board and the Managing Board
The members of the Managing Board and the Supervisory Board are listed in Section 33. The information on remuneration of the members of the Managing Board and the Supervisory Board is included in Section 49 "Remuneration of the Supervisory Board and the Managing Board" in the consolidated financial statements.
31 Proposals Regarding the Appropriation of Available Profit for Rabobank
Of the profit of EUR 4,906 million, EUR 644 million is payable to the holders of Rabobank Certificates and Capital Securities in accordance with Managing Board resolutions. Rabobank proposes to add the remainder of the profit to the general reserves held by Rabobank.
32 Events After the Reporting Period
There were no subsequent events to be disclosed.
33 Authorization of the Financial Statements
The financial statements were signed by the Supervisory Board and Managing Board on March 5, 2026. The financial statements will be presented for adoption to the General Meeting, to be held on April 8, 2026. With regard to the adoption of the financial statements of Rabobank, the Articles of Association state: "The resolution to adopt the financial statements will be passed by an absolute majority of the votes validly cast by the General Members’ Council."
Managing Board
Stefaan Decraene, Chair
Bas Brouwers, CFO
Vincent Maagdenberg, CRO
Els Kamphof, Member
Carlo van Kemenade, Member
Philippe Vollot, Member
Janine Vos, Member
Lara Yocarini, Member
Alexander Zwart, Member
Supervisory Board
Marjan Trompetter, Chair
Johan van Hall, Vice Chair
Sandra Berendsen
Driek Desmet
Miriam van Dongen
Matthew Elderfield
Brian Hirman
Gail Klintworth
Mark Pensaert
Bart Zegers
Other Information

Statutory Provisions
Profit can be used under a Managing Board resolution to pay distributions on participation rights and distributions on additional tier 1 instruments.
The remainder of the profit is added to the general reserves held by Rabobank. The Managing Board can also decide to make interim distributions to holders of participation rights (and via AK Foundation to holders of Rabobank Certificates) and the holders of additional tier 1 instruments from the profit and/or the result. While Rabobank still exists, the reserves cannot be distributed to the members, neither in full, nor in part. The Managing Board has the right to make a distribution from the reserves on participation rights (and via AK Foundation on Rabobank Certificates) and/or additional tier 1 instruments. If the decision is taken at any time to dissolve Rabobank in order to have its business continued by another legal entity or institution, the reserves will be transferred to said other legal entity or institution.
Independent Auditor's Report
Assurance Report of the Independent Auditor