This Annual Report 2025 provides information on ASN Bank's financial and non-financial performance in compliance with statutory requirements. It sets out how we dealt with opportunities and risks in 2025 and how we created value for our customers, society, our employees and our shareholder.
This Annual Report 2025 consists of:
Report of the Executive Board, including:
Our Annual Report 2025 is our statutory and regulatory reporting disclosure.
The financial information in the Financial statements has been prepared in accordance with the International Financial Reporting Standards (IFRS) Accounting Standards as adopted by the European Union.
Moreover, the financial information meets the requirements as set out in Title 9, Book 2 of the Dutch Civil Code.
Capital metrics and risk positions for 2025 and comparative figures for 2024 are reported under the Basel III framework (CRD/CRR). The Pillar 3 Report 2025, containing the mandatory reporting on capital requirements and risk management ensuing from the European Capital Requirements Regulation (CRR) can be found on our website.
The Corporate Sustainability Reporting Directive (CSRD), which entered into force on 5 January 2023, requires ASN Bank to disclose information on the way it operates and manages ESG challenges in its Annual Report 2025. The CSRD mandates the European Sustainability Reporting Standards (ESRS). In anticipation of the transposition of the CSRD into Dutch law, we have decided to voluntarily use this framework and to adhere to the ESRS. In response to the European Commission's recently proposed Omnibus amendments, we assessed the implications of the proposed changes to ensure continued compliance with evolving European regulatory standards. ASN Bank thus prepares its Sustainability statements in accordance with the CSRD. We are also committed to the United Nations Principles for Responsible Banking (UN PRB). More information on this can be found in the Section Principles for Responsible Banking.
This Annual Report 2025 is available in English only. Our financial reporting currency is the euro (€).
We supplement our IFRS Accounting Standards figures with internally used non-IFRS measures that constitute alternative performance measures under European Securities and Markets Authority (ESMA) guidance and non-GAAP financial measures. For more details, see the Section Reconciliation of alternative performance measures.
This report is available both in PDF and in the European Single Electronic Format (ESEF). To download this report please visit our website. Please note that the ESEF version prevails in the event of any discrepancies between these two versions.

Introduction
Foreword from the CEO

“In 2025 we successfully focussed on delivering our transformation targets while navigating through economic uncertainty, geopolitical turbulence and a changing interest rate environment. Given these challenging circumstances we are pleased with our financial and commercial results. We achieved steady growth in mortgages with healthy margins which we intend to maintain in the coming years.
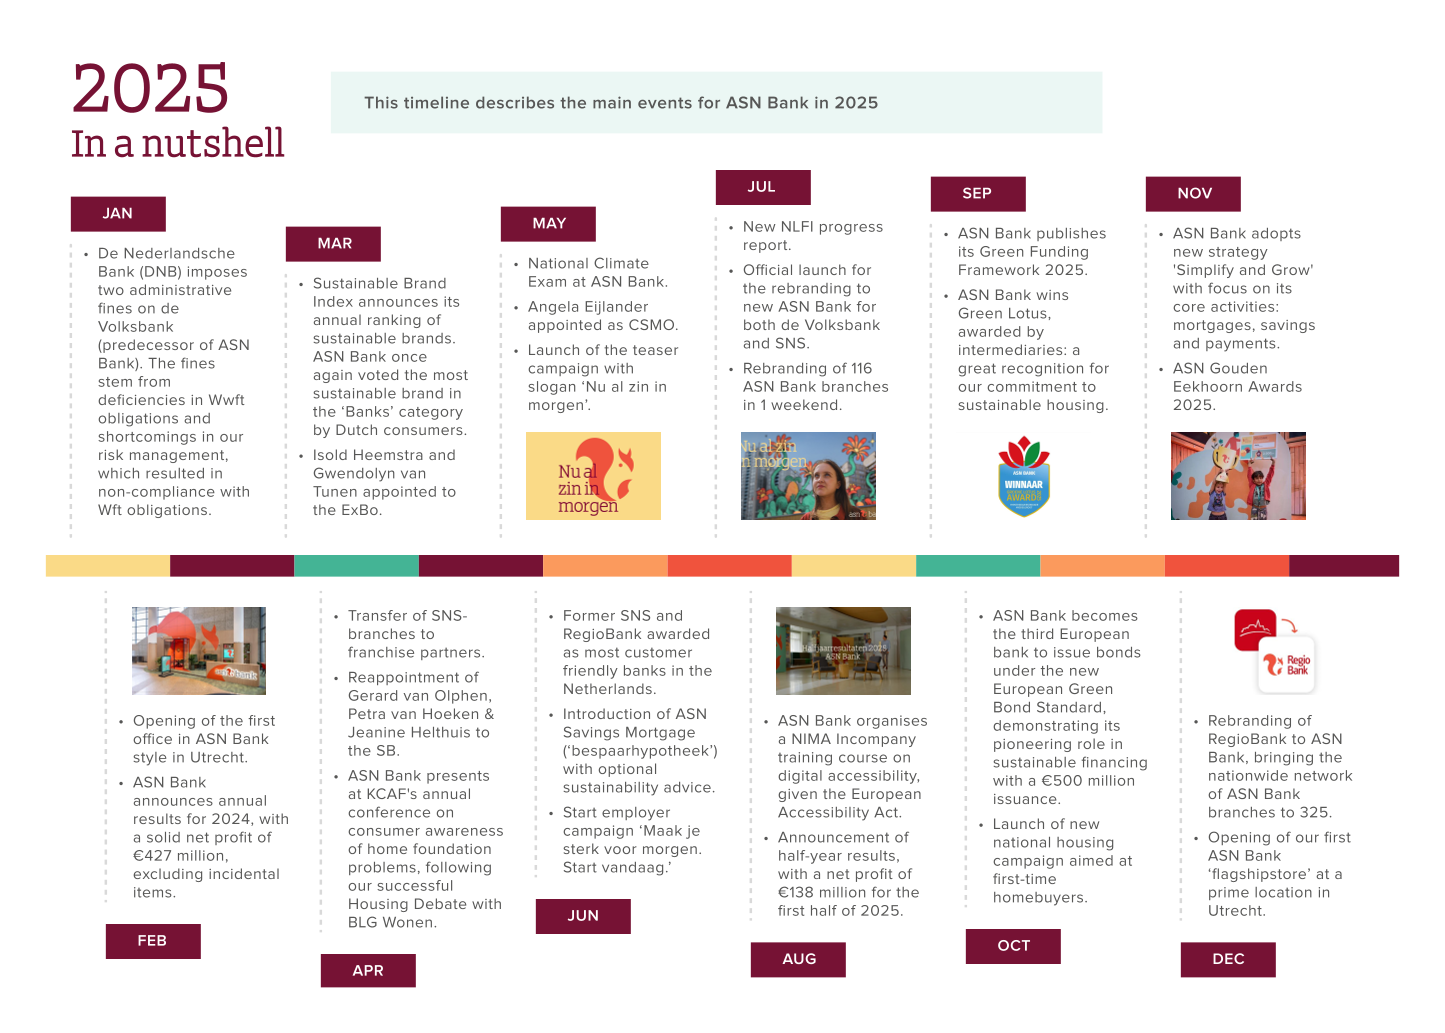
In July we launched our new organisation and completed the rebranding of SNS branches. With the rebranding of RegioBank in December, ASN Bank now offers customers face-to-face service through our unique franchise model with a nationwide network of 325 branches – which is what continues to set us apart from other banks.
Building on the progress of our transformation, in November we announced our new strategy aimed at achieving growth in mortgages, savings and payments. This calls for further simplifying our operations by aligning our product portfolio, IT infrastructure and support services under an integrated distribution channel and our one strong brand.
Another priority is increasing our impact on society. As an accessible bank, we remain committed to provide solutions for challenges in the Dutch society such as sustainability, housing accessibility and financial wellbeing.
In parallel to these developments, we have made good progress in strengthening our remediation efforts in anti-money laundering and risk management, meeting all interim requirements agreed upon with the supervisory authorities after we were fined in January 2025 for shortcomings in previous years. Our new streamlined organisational structure with clear mandates and responsibilities allows us to better address these deficiencies and gives us agility in a changing regulatory environment.
However, all these changes meant we had to say goodbye to many of our colleagues. A first round of job cuts, affecting over 700 FTEs, was completed this year. An additional ambition with a second round of job cuts, affecting 850-950 FTEs in 2026, was announced in November. These are painful but necessary decisions in building ASN Bank as a future-oriented and financially solid bank for our customers.
I am grateful to our customers, franchise partners, intermediaries, shareholder and other stakeholders for their continued trust and support in ASN Bank. My thanks in particular to all my colleagues for their hard work and sacrifice during this transformational and challenging journey. Based on what we have achieved this year, I have every confidence we will succeed in building an operationally, commercially and financially strong bank where customer relations come first.”

Strategy and performance
Strategy and performance
In this section, we describe our strategy 'Simplify and Grow' and our transformation programme, including the rebranding to ASN Bank. We also discuss our future prospects and our strategic progress in 2025.
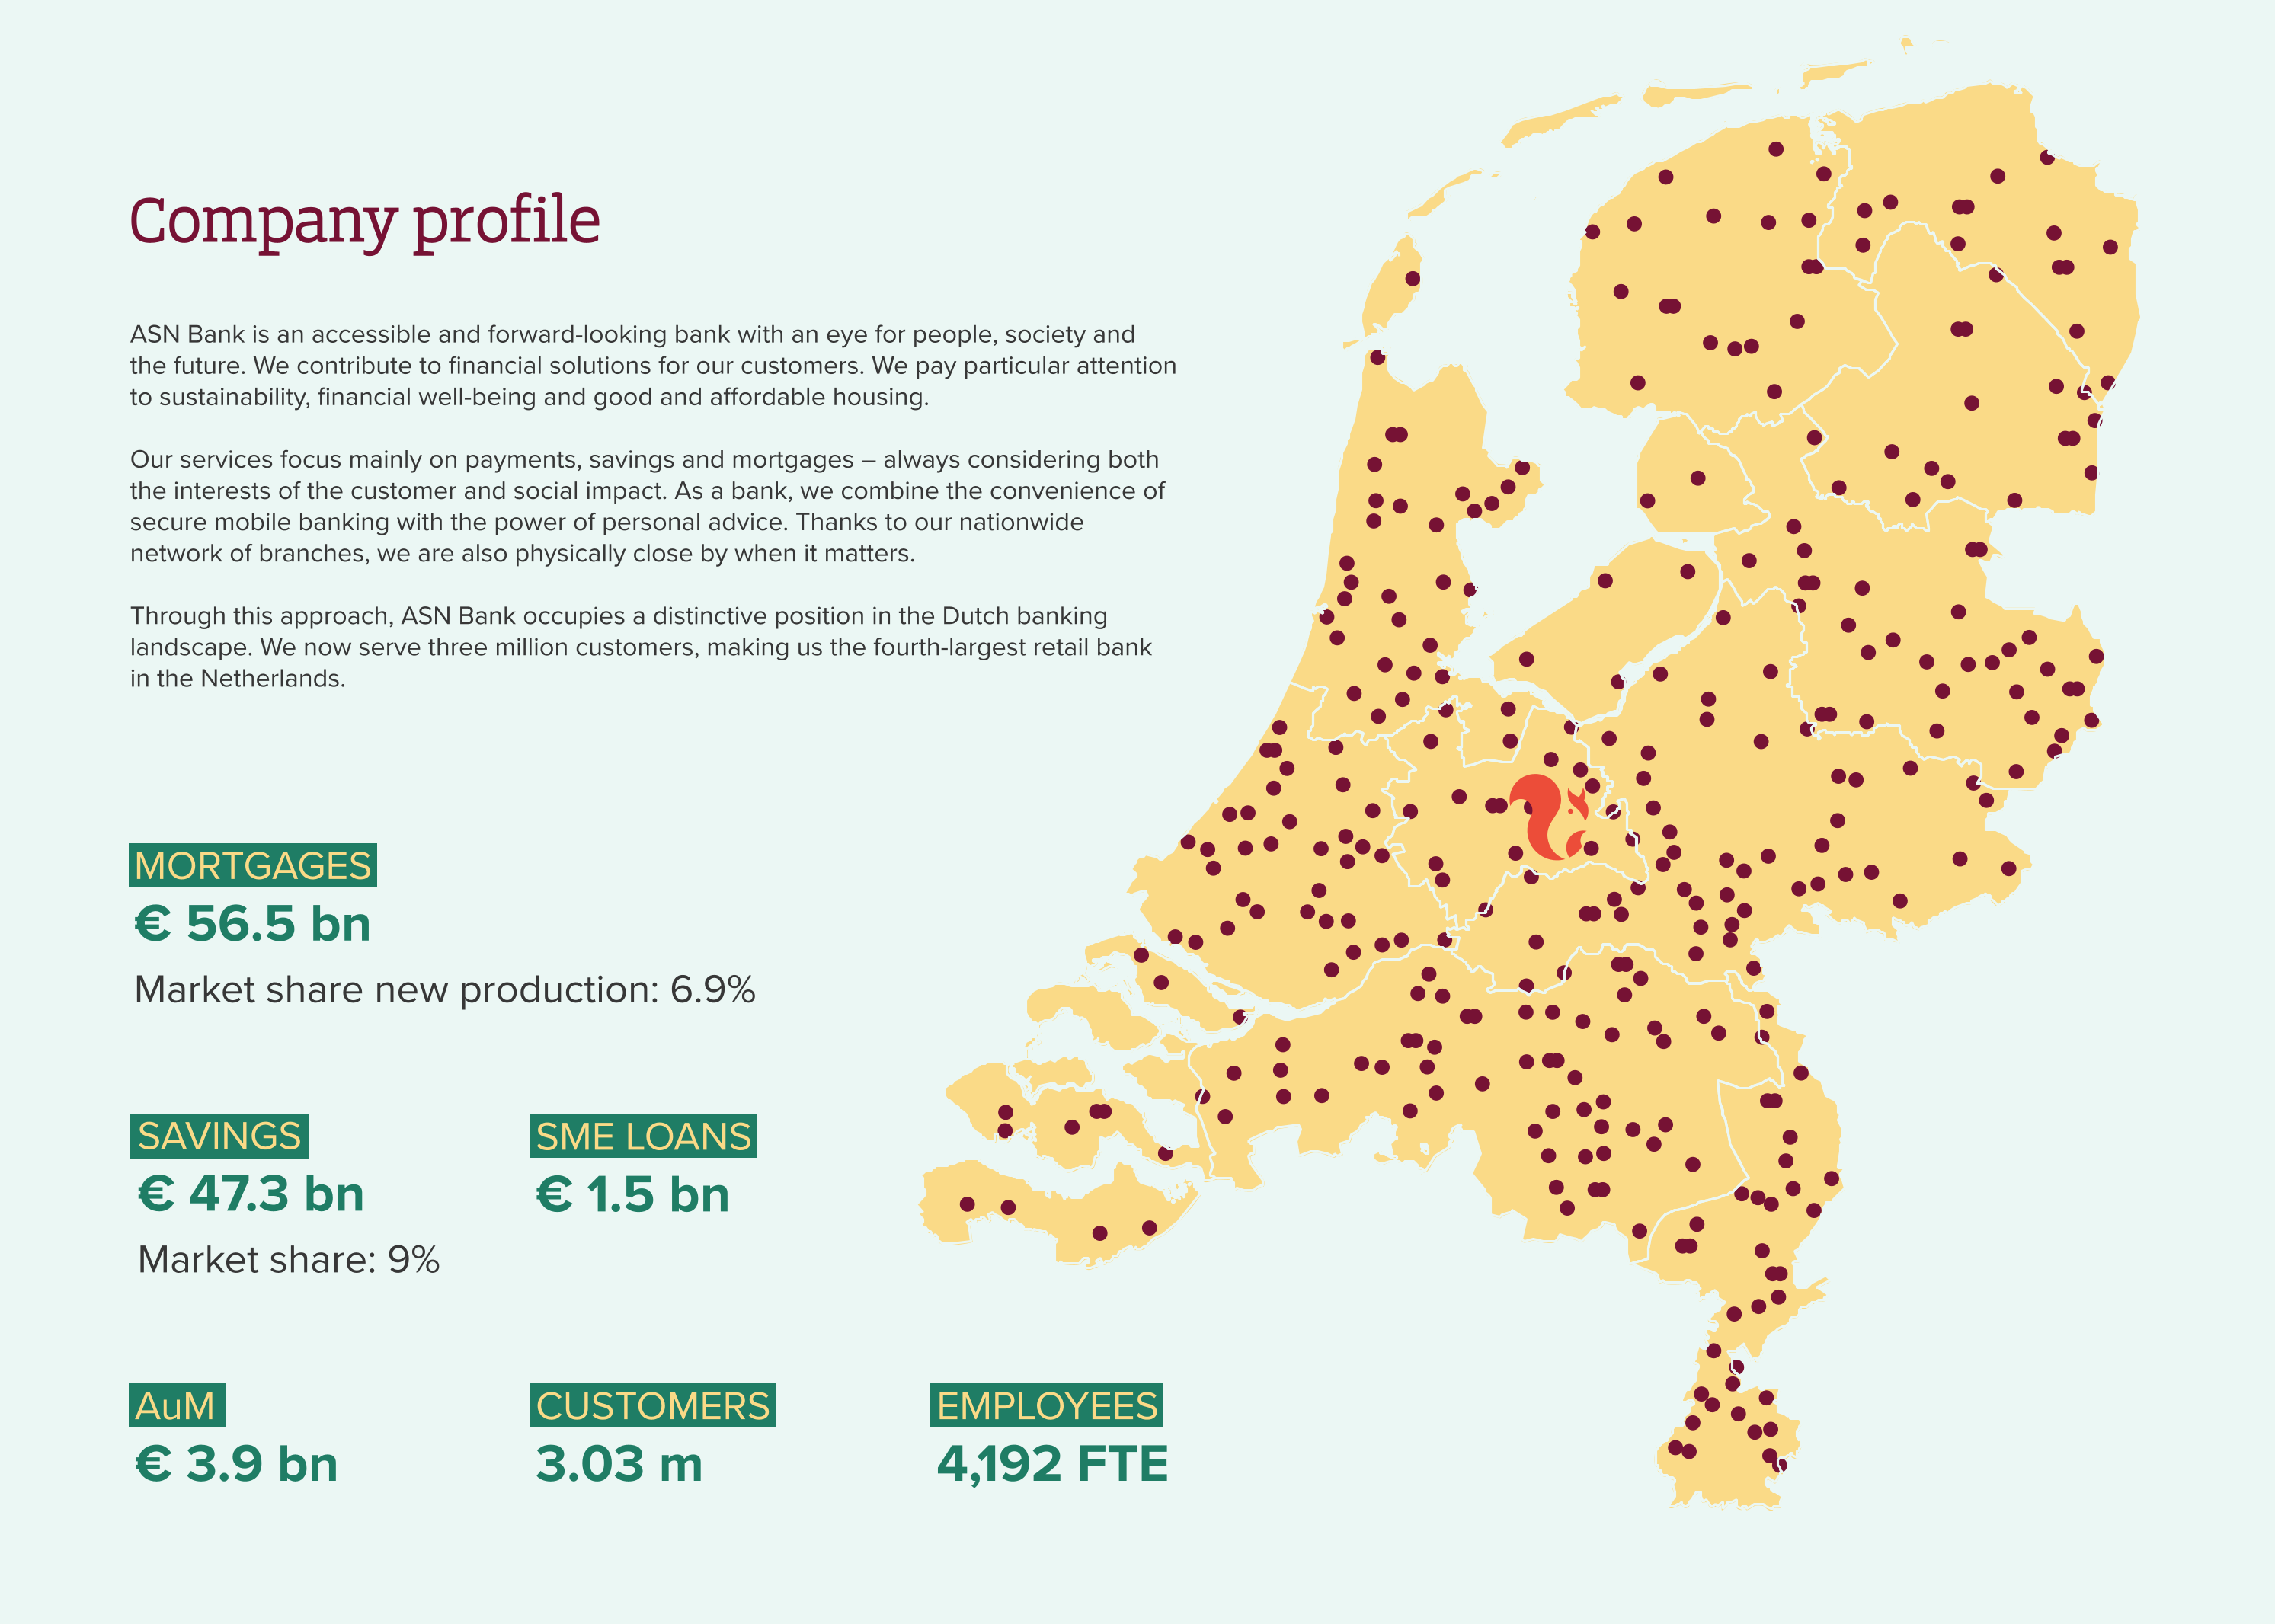
Our history dates back to 1817, the year in which a number of regional savings banks merged with the aim of taking good care of the money that the Dutch people entrusted to them. Our services focus mainly on payments, savings and mortgages – always with an eye for both the interests of the customer and social impact. As a bank, we combine the convenience of secure mobile banking with the power of personal advice. Thanks to our nationwide network of 325 branches, we are also physically close by when it matters.
ASN Bank is an accessible and forward-looking bank with an eye for people, society and the future. We sustainably contribute to financial solutions for our customers while addressing Dutch societal issues. We pay particular attention to sustainability, financial wellbeing and affordable accessible housing. Through this approach, ASN Bank occupies a distinctive position in the Dutch banking landscape. We now serve three million customers, making us the fourth-largest retail bank in the Netherlands. More information can be found in the Section Our strategic objectives.
Our strategy
During 2025, we concluded the execution of our strategy 2021-2025: 'Better for each other – from promise to impact'. This strategy had two main pillars aimed at strengthening our distinctive capabilities: to be the bank with the strongest customer relationship and to have a substantial and measurable positive impact on society. While significant progress was made against the core ambitions of the 2021-2025 strategy, economic circumstances and customer needs continued to evolve. This prompted the development of a new strategy with a strong focus on simplification and growth.
On 13 November 2025, we announced our new strategy 'Simplify and Grow', building on our successful first year of transformation. We aim to achieve growth through our core activities: mortgages, savings, and payments, and enhance the effectiveness and efficiency of business operations, internal processes, and systems.
Building on the strong ASN Bank brand and our distinctive social profile, the new strategy sets out three priorities:
We aim to grow in mortgages, savings, and payments through simple products that meet customer needs, positioning ourselves as a sympathetic challenger. Franchise partners and intermediary channels remain crucial for mortgage distribution, while we work to make savings more attractive.
Improving the customer experience is central to achieving this growth. Customers expect fast, accurate service; digital where possible, personal where it matters. ASN Bank aims to broaden its customer base also in the Randstad, where we are opening flagship stores in Utrecht, Rotterdam, and Amsterdam.
ASN Bank remains committed to contributing to a sustainable and fair future for everyone. Our priority is increasing our impact on society. As an accessible bank we remain committed to provide solutions for challenges in the Dutch society such as sustainability, housing accessibility and financial wellbeing.
Simpler, faster, smarter remains our guiding principle. Simplification is essential for becoming a healthy, cost-efficient bank with an eye for people and society. Having completed the first transformation phase focused on the "front end" in 2025, we now shift attention to "back end" improvements in 2026 and 2027.
We will move to a clear, improved and appropriate product range. More standardisation means less complexity and therefore lower costs. Our technology requires modernisation; we will replace outdated systems and standardise where possible, while investing in reliable data, future-proof IT platforms, and pragmatic AI applications. Customers will experience these improvements through enhanced, faster services including a unified app, simplified processes, and shorter turnaround times.
We will also continue strengthening our anti-financial crime processes and risk management. While we have made significant progress in remediation and addressing past backlogs, compliance costs remain elevated due to temporary external staffing requirements.
The strategy is primarily focused on simplification and growth, with ambitious commercial and financial targets. The proposed streamlining is expected to result in total annual structural cost savings as of 2027 of approximately € 150 million, of which € 70 million are to be realised as of 2026 and an additional € 80 million as of 2027. These savings are expected to be partly offset by higher temporary costs related to the implementation of the transformation programme, wage inflation and additional remediation costs to combat financial crime and deficiencies in risk management.
Under the new strategy, the financial ambitions are:
Cost-income ratio of 50%-55%
Return on Equity of 8%-10%
Common Equity Tier 1 capital ratio of at least 17%, and
Leverage ratio of at least 4.5%
In addition to financial ambitions, ASN Bank also has non-financial targets1:
At least 1.5 million primary customers
Leading Net Promotor Score
Reducing CO2 emissions to net zero by 2050, and
Employee engagement score of at least 8
For a more detailed explanation of these KPIs, see the Section Our strategic objectives.
- For the measurement methodology of this KPI, refer to the Section Definitions of strategic KPIs in this report.
Transformation programme (In scope of CSRD)
In the second half of 2024, we launched a transformation programme designed to simplify our organisation by consolidating to a single retail brand, optimising our distribution model, and streamlining operations. This transformation programme aims to enhance efficiency and adaptability in response to regulatory requirements, technological developments, economic shifts, and evolving customer needs. The programme is progressing according to plan.
Our transformation achieved significant progress across three key pillars:
Single retail brand: ASN Bank: We launched the new ASN Bank by merging our four retail brands and changing the entity name from ‘de Volksbank N.V.’ to ‘ASN Bank N.V.' We successfully migrated 2.3 million ASN Bank and SNS customers on 1 July 2025, bringing our total customer base including former RegioBank and BLG Wonen customers to 3.03 million. RegioBank customers and franchisees successfully transitioned on 1 December 2025, with BLG Wonen partnerships in the intermediary channel scheduled for 2026.
Optimised distribution model: We implemented our strategy combining mobile-first banking with a nationwide branch network. We have transferred our own SNS branches to the franchise partners. We rebranded former SNS shops to the new ASN Bank style on 1 July, and former RegioBank branches successfully transitioned to ASN Bank on 1 December, resulting in a total of 325 branches across the Netherlands now displaying the ASN logo on their facades. We launched a flagship store in Utrecht on 8 December, Rotterdam and Amsterdam locations are planned for 2026.
Simplified organisational model: Since 1 July 2025, we operate under a streamlined structure designed to increase clarity, responsiveness, and cost-efficiency while maintaining focus on operational excellence and customer service. In line with our announcements, over 700 FTEs left the organisation. An additional ambition with a second round of job cuts, affecting 850-950 FTEs in 2026, was announced in November 2025. Through our Social Plan, we support these colleagues by developing their employability and assisting them in finding new positions.
The simultaneous execution of our transformation and remediation programmes affects our FTE and cost development. With the transformation, we aim to reduce the structural cost base, while at the same time temporary FTEs and costs are required to cover remediation work, focusing on anti-financial crime and risk management-related topics. To provide insights in both developments, the table below shows a breakdown of FTEs and operating expenses into a structural and a temporary component.
FTEs1 | 31-12-2024 | 30-6-2025 | 31-12-2025 | 1-1-2026 |
|---|---|---|---|---|
Total number of FTEs | 4,357 | 4,257 | 4,192 | 3,865 |
Structural FTEs | 4,262 | 4,048 | 3,811 | 3,484 |
Temporary FTEs until end 2027 | 95 | 209 | 381 | 381 |
- Excluding vacant positions, including internal and external FTEs
At the end of 2024, we announced a reduction in the number of FTEs by 700-750 based on the reference point for the number of jobs of 4,500 as at 30 June 2024. At year-end 2025, the reported number of FTEs of 4,192 still included 327 FTEs who left the bank on 1 January 2026. As per this date, the total number of FTEs amounted to 3,865, of which 3,484 structural FTEs, confirming that our year-end 2024 announced ambition has been fully realised.
Total FTEs also included 381 temporary FTEs covering remediation work, focusing on anti-financial crime-related topics. These temporary FTEs, comprising of internal and external FTEs, are expected to support ASN Bank until year-end 2027 and are largely provisioned for in our AFC remediation programme.
On 13 November 2025, we announced an additional planned reduction of 850-950 FTEs, partly by cutting external staff and not filling vacancies. This reduction is driven by the further streamlining of the organisation and is expected to occur in phases throughout 2026.
Financial impact (in € millions) | FY2024 | 1H2025 | 2H2025 | FY2025 |
|---|---|---|---|---|
Total operating expenses | 1,140 | 425 | 449 | 874 |
Incidental items and regulatory levies | -386 | -6 | -59 | -65 |
Total operating expenses excluding incidental items & levies | 754 | 419 | 390 | 809 |
Structural cost base | 730 | 386 | 355 | 741 |
Temporary costs until end 2027 | 24 | 33 | 35 | 68 |
Total operating expenses in 2025, excluding incidental items and levies of € 809 million, consisted of € 741 million structural costs and € 68 million temporary costs. Temporary costs relate mainly to remediation work for anti-financial crime and risk management and our transformation programme.
Structural costs in 2025 were positively influenced by realised transformation-related cost savings of around € 35 million. This equates to € 70 million on an annualised basis, which will be fully reflected in 2026 financial figures. Realised cost savings in 2025 were offset by the impact from wage inflation and higher IT costs.
The achieved structural cost reduction in 2025 is visible in the structural cost base in the second half of 2025, which decreased by € 31 million compared to the first half of 2025 to € 355 million.
The anticipated additional FTE reduction by 850-950 FTEs will result in additional annual cost savings as of 2027. This will only be partly visible in 2026 figures due to a phased execution of the reduction. The future structural cost base will be impacted by ongoing wage inflation, which will partly offset structural cost savings.
Overall, the proposed streamlining is expected to result in total annual structural cost savings as of 2027 of approximately € 150 million, of which € 70 million are to be realised as of 2026 and an additional € 80 million as of 2027.
Our strategic objectives
Our strategic objectives are presented and discussed in more detail below.
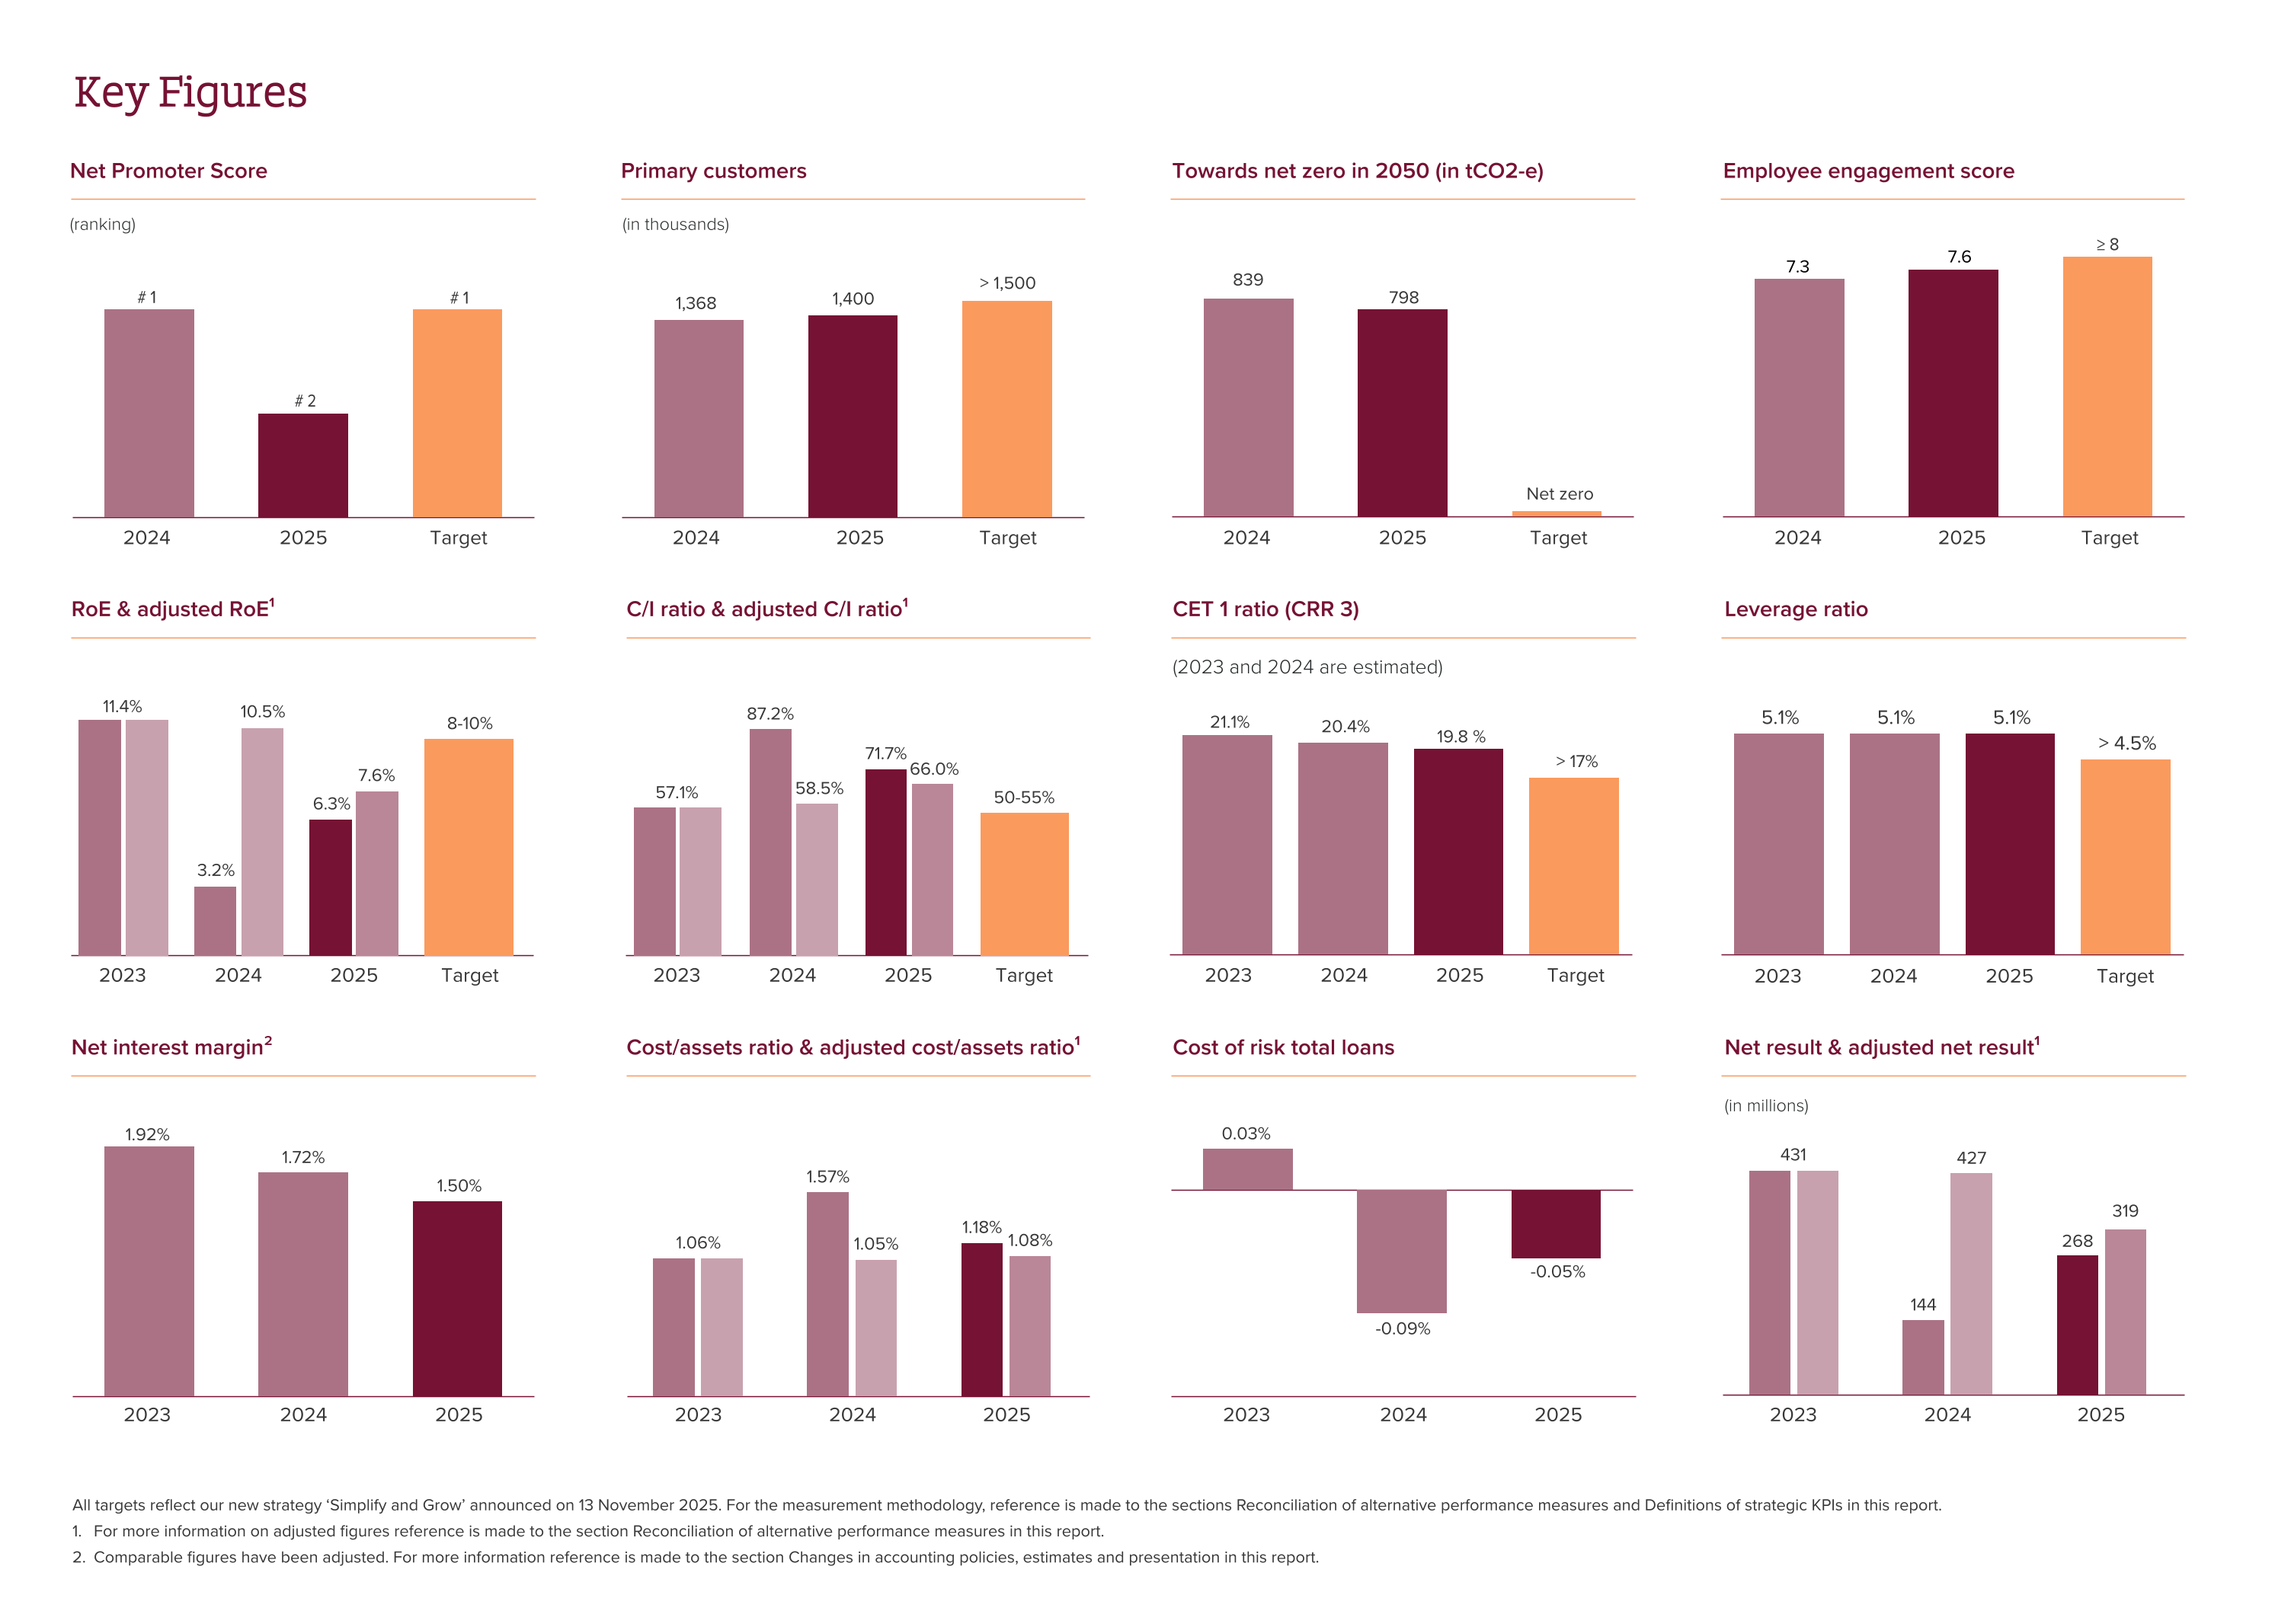
In 2025, the customer-weighted average NPS1 decreased to -7 (year-end 2024: +4). Key drivers for the decline were a greater than expected impact from the transformation and rebranding, the reduction of branches and mandatory customer re-identification procedures. In our new strategy, we are targeting the highest NPS position among the major systemic Dutch banks. At year-end 2025, we ended in joint second position, driven by the transformation impact.
In 2025, the number of active multi-customers1 rose by 46 thousand to 1.28 million (year-end 2024: 1.23 million), mainly as a result of new current account and savings account customers.
In our new strategy, we replaced our customer KPI ‘Active multi-customers’ with KPI1 ‘Primary customers’, targeting at least 1.5 million. At year-end 2025, the number of primary customers was 1.40 million (year-end 2024: 1.37 million).
The total number of customers was virtually stable at 3.03 million (year-end 2024: 3.10 million). With the transition from four brands to one retail brand, ASN Bank, we adjusted our customer base by applying the single customer calculation, which resulted in a one-time reduction of approximately 150,000 customers. This does not represent a loss of actual customers, but rather the de-duplication of multi-brand customers.
As of 31 December 2025, we formally concluded our KPI climate-neutral balance sheet1, with 100% well above the 75% target. The climate-neutral balance sheet included 959 kilotonnes (kt) of CO2e emissions (year-end 2024: 991 kt) and 963 kt of avoided emissions (year-end 2024: 1,000 kt).
The climate-neutral balance sheet KPI is succeeded by the net zero1 by 2050 KPI. Net zero is a widely used concept, with a more uniform way of measuring emissions and setting targets. Because of this, the emissions deviate from the climate-neutral balance sheet. The net zero KPI includes all relevant operational and financing activities of ASN Bank. This is the first year we can report progress on this KPI. The net zero KPI included 798 ktCO2e emissions at year-end 2025, compared to 839 ktCO2e emissions at year-end 2024.
We replaced our People KPI ‘Genuine attention’ with ‘Employee engagement’1. This KPI is measured on an annual basis via our Employee Listening Survey. In previous years, employee engagement was already measured with a set of four questions, resulting in a score of 1-10. Going forward, employee engagement will be measured using a new set of questions, resulting in a 1-10 score, with a target of at least 8. For comparison purposes, employee engagement in 2025 was measured using both the previous and new question sets, both resulting in a score of 7.6, compared to 7.3 in 2024 using the previous set.
In 2025, our cost/income ratio (C/I ratio) moved to 71.7%, compared to 87.2% in 2024. Adjusted for incidental items, the C/I ratio stood at 66.0% (2024: 58.5%), higher than our 2025 target of 57-59% as operating expenses in 2025 included substantial temporary costs, mainly related to our transformation programme and the remediation of anti-financial crime (AFC) and risk management related topics. We have set our new C/I ratio target on 50-55%.
In 2025, we achieved a 6.3% Return on Equity (RoE), compared to 3.2% in 2024. The RoE adjusted for incidental items2. amounted to 7.6% compared to 10.5% in 2024. This decrease was mainly driven by a decrease in total income, reflecting the changed external interest rate environment. Going forward, we expect to achieve our RoE target of 8-10%, supported by our transformation programme.
At year-end 2025, ASN Bank's CET1 capital ratio (CRR 3) decreased slightly to 19.8% (year-end 2024: 20.4% CRR 3). The leverage ratio was stable at 5.1% (year-end 2024: 5.1%). Both ratios remained well above our planning targets of at least 17.0% and 4.5%, and well above regulatory minimum requirements. For more information on the capital and leverage ratios, refer to the Section Capital management.
ASN Bank has set a target range of 40%-60% of net profit for regular dividend distribution. For the financial year 2025 we propose a dividend amount of € 124 million, which corresponds to a pay-out ratio of 50% of the net profit attributable to the shareholder. For the 2024 financial year, ASN Bank decided in its General Meeting of Shareholders (GSM) in April 2025 to retain the net profit.
- For the measurement methodology of this KPI, refer to the Section Definitions of strategic KPIs in this report.
- For the definition and the explanation of incidental items and adjusted net result, see the Section Reconciliation of alternative performance measures in this report.

Financial performance
Financial performance
Macroeconomic developments
The global economy proved resilient over the course of the year, achieving a GDP growth of 3.2% at the end of 2025, broadly stable compared to 2024. Developments were impacted by improved financial conditions, rising AI-related investments and trades, as well as expansive fiscal policies. Underlying risks are determined by prolonged geopolitical uncertainties, ongoing conflicts, protectionism and potential global value chain disruptions, which could adversely affect global economic growth. Labour markets are showing early signs of weakening despite historically low unemployment rates. While inflation remains sticky in some regions, it is projected to continue to decline towards central bank targets.
Despite global turbulences, the underlying fundamentals of the Dutch economy remained robust, as reflected by GDP growth of 1.9% in 2025, compared to 1.0% in 2024. The domestic unemployment rate remained stable at a low level of 4.0% in December 2025. The Dutch housing market continued to perform strongly. According to the Dutch Mortgage Data Network (HDN), mortgage applications increased by 16.5%, partly due to the sale of rental properties by investors as a result of the Affordable Rent Act (Wet betaalbare huur) and higher taxes on real estate investments. The year-on-year increase in house prices amounted to 5.8% at the end of 2025. The increase in house prices was mainly caused by supply shortages and higher wages. The annual average inflation rate in the Netherlands amounted to 3.0%, compared to 3.2% in 2024. The relatively high inflation in the Netherlands is attributable to rising costs for services and processed food.
In the first half of 2025, the European Central Bank (ECB) further reduced its three key interest rates by a total of 100 basis points (bps) to 2.15% for the main refinancing operations, 2.40% for the marginal lending facility, and 2.00% for the deposit facility rate. In the second half of 2025 the ECB kept its key rates stable as inflation remained close to the 2% medium-term target. In our baseline scenario, the key ECB rates remain unchanged in 2026.
.
Summary of our financial performance
In terms of asset growth, the bank’s residential mortgage portfolio increased by € 4.5 billion to € 56.5 billion at the end of 2025. In a growing market, our market share in new residential mortgage production improved to 6.9% compared to 6.3% in 2024, supported by the transformation measures. Our SME loan portfolio grew by € 148 million to € 1,541 million in 2025. On the liability side, our retail deposits increased by € 1.6 billion to € 57.3 billion at the end of 2025. In a higher savings market our market share stood at 9.0%, which is slightly below 2024 (9.4%).
The bank reported a net profit of € 268 million in 2025, which is an increase of 86% compared to the € 144 million net profit in 2024. This increase is entirely due to the lower negative impact from incidental items, reflecting substantial provisions taken in 2024. Total income of € 1,219 million decreased by 7%, reflecting the changed external interest rate environment. Total operating expenses of € 874 million were 23% below the previous year, entirely as a result of lower negative incidental items, mainly consisting of restructuring provision charges for the transformation programme and a provision related to our anti-financial crime (AFC) remediation programme in 2024.
As a result of the transformation measures taken, structural staff cost savings of € 35 million were realised in the second half of 2025. In line with the announcement made at the end of 2024, a structural reduction in staff of over 700 FTE was achieved in 2025. In addition, a release of impairment charges on financial assets totalling € 32 million was recorded in 2025. This amount was 37% lower than the previous year, as we recorded a release of € 51 million in 2024.
The bank's capital position remained strong and well above our targets and regulatory minimum requirements. The CET1 capital ratio decreased slightly to 19.8% (year-end 2024: 20.4% CRR 3), as the increase in CET1 capital due to the addition of retained earnings was offset by higher total risk-weighted assets (RWA), reflecting additional asset growth. This is primarily related to the deliberate growth of our residential mortgage loan portfolio and our investments to optimise our risk-return profile. The leverage ratio was stable at 5.1% (year-end 2024: 5.1%).
in € millions | FY25 | FY24 | Change |
|---|---|---|---|
Net interest income1 | 1,122 | 1,240 | -10% |
Net fee and commission income | 83 | 77 | 8% |
Other income1 | 14 | -9 | 256% |
Total income | 1,219 | 1,308 | -7% |
Operating expenses excluding regulatory levies | 878 | 1,129 | -22% |
Regulatory levies | -4 | 11 | -136% |
Total operating expenses | 874 | 1,140 | -23% |
Impairment charges (releases) on financial assets | -32 | -51 | 37% |
Total expenses | 842 | 1,089 | -23% |
Result before taxation | 377 | 219 | 72% |
Taxation | 109 | 75 | 45% |
Net result | 268 | 144 | 86% |
Incidental items2 | 51 | 283 | |
Adjusted net result2 | 319 | 427 | -25% |
Ratios | |||
Cost/income ratio3 | 71.7% | 87.2% | |
Adjusted cost/income ratio3 | 66.0% | 58.5% | |
Return on Equity (RoE)3 | 6.3% | 3.2% | |
Adjusted Return on Equity (RoE)3 | 7.6% | 10.5% | |
Net interest margin1,3 | 1.50% | 1.72% | |
Cost/assets ratio as a % of average assets3 | 1.18% | 1.57% | |
Adjusted cost/assets ratio as a % of average assets3 | 1.08% | 1.05% |
- Comparable figures have been adjusted. For more information reference is made to the section Changes in accounting policies, estimates and presentation in this report.
- For the definition and the explanation of incidental items and adjusted net result, see section Reconciliation of alternative performance measures in this report.
- For the measurement methodology of this KPI, see section Reconciliation of alternative performance measures in this report.
Net result
In 2025, ASN Bank recorded a net result of € 268 million, which is € 124 million higher compared to 2024. This increase is entirely driven by a € 232 million lower negative impact from incidental items.
The 2025 net result included negative incidental items of € 51 million after tax (€ 69 million before tax), consisting entirely of a restructuring charge. This charge comprised three main components:
An employee redundancy provision in 2025 connected to an additional reduction in internal FTEs. In 2026, the transformation programme is expected to lead to a further simplification of the organisational structure and an additional reduction in total FTEs of 850 to 950, partly by cutting external staff and not filling vacancies.
An additional charge related to the 2024 employee redundancy provision, driven by a higher number of substantially changed job functions than initially assumed combined with more internal employees deciding to leave the bank.
The restructuring provision related to optimising our distribution network was updated, resulting in a small net charge.
The net result in 2024 included incidental items of € 283 million (€ 375 million before tax), consisting of restructuring charges related to the transformation programme and provisions related to the AFC remediation programme, the settlement of legal proceedings and two administrative fines.
Adjusted for incidental items, ASN Bank recorded a net result of € 319 million in 2025, which is € 108 million (-24%) lower than the € 427 million adjusted net profit in 2024.
Total income declined by € 89 million to € 1,219 million (-7%). This decrease was mainly driven by lower net interest income on cash management activities, due to lower volumes year-on-year and the decline in the ECB deposit facility rate. Total operating expenses, adjusted for incidental items, increased by € 40 million to € 805 million (+5%), due to higher temporary costs to address deficiencies in risk management, and additional costs for our transformation programme. In addition, 2024 included a non-recurring VAT refund of € 16 million. These cost increases were partly compensated by lower regulatory levies in 2025 and a decrease in staff costs, driven by structural cost savings from the transformation programme.
Furthermore, the bank recorded an impairment release of € 32 million, compared to a larger release of € 51 million in 2024. The releases in both periods mainly related to residential mortgages, as house prices continued to improve year-on-year. The release in 2025 was further supported by the implementation of an enhanced IFRS 9 Expected Credit Loss (ECL) model for residential mortgages. The impairment release in 2024 was positively impacted by improved residential house prices and a more favourable macroeconomic outlook at that time.
Total income
in € millions | FY25 | FY24 | Change |
|---|---|---|---|
Net interest income1 | 1,122 | 1,240 | -10% |
Net fee and commission income | 83 | 77 | 8% |
Other income | 14 | -9 | 256% |
- of which investment income (losses) | 3 | -14 | 121% |
- of which other results on financial instruments1 | 11 | 5 | 120% |
Total income | 1,219 | 1,308 | -7% |
Ratios | |||
Net interest margin1,2 | 1.50% | 1.72% |
- Comparable figures have been adjusted. For more information reference is made to the section Changes in accounting policies, estimates and presentation in this report.
- For the measurement methodology of this KPI, see section Reconciliation of alternative performance measures in this report.
Net interest income decreased by € 118 million to € 1,122 million (-10%), and the net interest margin declined to 1.50% (2024: 1.72%). Both decreases were mainly driven by lower net interest income on cash management activities, due to the decline in the ECB deposit facility rate and less cash volume year-on-year.
Commercial interest income1 on residential mortgages increased, despite a competitive domestic market, driven by portfolio growth in combination with a broadly stable portfolio margin in bps. The residential mortgage portfolio, excluding IFRS value adjustments2, rose to € 56.5 billion (year-end 2024: € 52.0 billion). Commercial interest income on savings remained virtually stable in 2025.
Gross fee and commission income rose by € 6 million to € 197 million (+3%), while total fee and commission expenses remained stable at € 114 million. Net fee and commission income rose by € 6 million to € 83 million (+8%).
This increase was mainly due to higher payment fees as a result of the customer base growth and repricings. Management fees were slightly below 2024. At year-end 2025, assets under management stood at € 3.9 billion, lower than compared to year-end 2024 (€ 4.1 billion).
Investment income in 2025 was € 3 million compared to a negative amount of € 14 million in 2024, which consisted of realised results on fixed-income investments, in the light of our regular asset and liability management.
Other results on financial instruments amounted to € 11 million compared to € 5 million in 2024. In both periods, these mainly consisted of hedge ineffectiveness results.
- Commercial interest income consists of the margin in Euros.
- Consist of fair value adjustments from hedge accounting and amortisations.
Total expenses
Operating expenses
in € millions | FY25 | FY24 | Change |
|---|---|---|---|
Staff costs | 564 | 721 | -22% |
Depreciation of (in)tangible assets | 20 | 27 | -26% |
Other operating expenses | 290 | 392 | -26% |
Total operating expenses | 874 | 1,140 | -23% |
Incidental items1 | -69 | -375 | -- |
Adjusted operating expenses1 | 805 | 765 | 5% |
Regulatory levies | -4 | 11 | -- |
Operating expenses excluding incidental items & regulatory levies1 | 809 | 754 | 7% |
- of which AFC costs | 115 | 1212 | -5% |
Adjusted staff costs | 499 | 514 | -3% |
Adjusted depreciation of (in)tangible assets | 19 | 22 | -14% |
Adjusted other operating costs | 287 | 229 | 25% |
Ratios | |||
Cost/assets ratio as a % of average assets3 | 1.18% | 1.57% | |
Adjusted cost/assets ratio as a % of average assets3 | 1.08% | 1.05% | |
FTEs | |||
Number of internal FTEs | 3,388 | 3,602 | -6% |
Number of external FTEs | 804 | 755 | 6% |
Total number of FTEs | 4,192 | 4,357 | -4% |
- For the definition and the explanation of incidental items and adjusted net result, see section Reconciliation of alternative performance measures in this report.
- Excluding the AFC remediation-related provisioning charge.
- For the measurement methodology of this KPI, see section Reconciliation of alternative performance measures in this report.
Total operating expenses decreased by € 266 million to € 874 million (-23%) as a result of a € 306 million lower negative impact from incidental items. In 2025, operating expenses were negatively impacted by incidental items totalling € 69 million, consisting of an addition to the restructuring provision related to the transformation programme. Operating expenses in 2024 included € 375 million incidental items, consisting of restructuring charges related to the transformation programme and provisions related to the AFC remediation programme, the settlement of legal proceedings and two administrative fines.
Total operating expenses, excluding incidental items, increased by € 40 million to € 805 million (+4%), despite a € 15 million decrease in regulatory levies. Regulatory levies reflected a reversal of € 4 million in 2025 compared to a charge of € 11 million in 2024. Levies in the reporting period consisted of a € 9 million refund of a prior year’s contribution to the Single Resolution Fund (SRF). This was partly offset by a € 5 million contribution to the Deposit Guarantee Scheme. Levies in 2024 were entirely linked to the ex-ante DGS contribution.
Total operating expenses, excluding incidental items and regulatory levies, went up by € 55 million to € 809 million (+7%) due to € 73 million higher other operating expenses, partly compensated by € 15 million lower staff costs and € 3 million lower depreciations.
Staff costs decreased by € 15 million as reductions in structural FTEs resulting from the transformation outweighed the impact of wage inflation and an increase in temporary FTEs covering remediation work on anti-financial crime and risk management-related topics. The total reported number of FTEs dropped by 165 to 4,192 compared to year-end 2024, with structural FTEs declining while temporary FTEs increased. Total reported FTEs at year-end 2025 included 343 FTEs which were provisioned for and left the bank on 1 January 2026 effectively. As per this date, total number of FTEs amounted to 3,849.
Other operating expenses, excluding regulatory levies, increased by € 73 million. Of this amount € 16 million was linked to a non-recurring gain in 2024 for an adjustment in recoverable VAT in previous years. In addition, consultancy costs increased, mainly related to our transformation programme and addressing deficiencies in risk management, while IT and marketing costs also increased.
The adjusted cost/assets ratio increased to 108 bps, compared to 105 bps in 2024. This increase was wholly attributable to higher operating expenses, while average assets were higher as a result of loan growth.
AFC costs (In scope of CSRD)
In 2025, total AFC costs, amounted to € 115 million (2024: € 121 million, which was excluding an incidental provision for AFC data remediation).
Impairment charges (releases) on financial assets
in € millions | FY25 | FY24 | Change |
|---|---|---|---|
Investments | -1 | -- | |
Loans and advances to banks | -1 | -1 | |
Loans and advances to customers | -30 | -50 | |
- of which residential mortgages | -38 | -48 | |
- of which consumer loans | 1 | -- | |
- of which SME loans | -3 | -7 | |
- of which other corporate and government loans | 10 | 5 | |
Other | -- | -- | |
Total impairment charges (releases) on financial assets | -32 | -51 | -37% |
Cost of risk ratios | |||
Total loans1 | -0.05% | -0.09% | |
Residential mortgages1 | -0.07% | -0.09% | |
SME loans1 | -0.20% | -0.50% | |
Other corporate and government loans1 | 0.46% | 0.24% |
- For the measurement methodology of this KPI, see section Reconciliation of alternative performance measures in this report.
Total impairments on financial assets were a release of € 32 million, compared to a release of € 51 million in 2024. For a more detailed description of loan loss provisioning, refer to the Section Credit risk.
For residential mortgages, the bank recorded an impairment release of € 38 million, compared to a release of € 48 million in 2024. The release in 2025 was mainly attributable to lower modelled provisions due to the implementation of an enhanced IFRS 9 Expected Credit Loss (ECL) model and a € 7 million decrease in the management overlay. The new model shows lower expected credit losses (ECL) compared to the previous model, primarily because of lower loss given default (LGD) rates driven by positive house price developments, methodological improvements in modelling and the incorporation of more recent and enhanced data.
The release in 2024 was mainly related to a decrease in the modelled provision, driven by an improved macroeconomic outlook and higher house prices at the time, which also led to a shift of mortgages to lower Loan-to-Value (LtV) buckets.
Incurred credit losses (write-offs) on residential mortgages were negligible (zero bps) in both reported periods, reflecting the strong underlying credit quality of our portfolio.
Impairment charges on consumer loans amounted to a small charge of € 1 million (2024: nil), reflecting the small size of the portfolio and a virtually unchanged credit quality.
Impairment charges on SME loans consisted of a release of € 3 million compared to a release of € 7 million in 2024. The reversal in 2025 was driven by a decrease in the number of defaults within stage 3 and arrears within stage 2. The release in 2024 was partly driven by the full release of the management overlay for SME customers who might be affected by high inflation. The credit quality of the SME loan portfolio remained sound and incurred credit losses were very limited.
Impairment charges on other corporate and government loans consisted of a charge of € 10 million compared to a charge of € 5 million in 2024, in both periods consisting of impairments on certain individual corporate loans as a result of increased credit risk.
Slightly decreased credit spreads resulted in a release of € 1 million on loans to banks in both reporting periods. Impairments on investments were also a release of € 1 million in 2025 (2024: nil).
Taxation
ASN Bank recognised € 109 million in corporate income tax, corresponding to an effective tax rate of 28.9% (2024: 34.2%), above the statutory rate of 25.8%. This was the result of the interest deduction limitation on borrowed capital (thin capitalisation rule), partly offset by the tax impact from interest expenses related to Additional Tier 1 capital securities that are recognised directly in shareholders' equity.
In 2024 the higher effective tax rate was also the result of two administrative fines that were not tax deductible.
Balance sheet
in € millions | 31-12-2025 | 31-12-2024 | |
|---|---|---|---|
Cash and balances at central banks | 1,178 | 2,834 | |
Derivatives | 1,789 | 2,141 | |
Investments | 6,809 | 7,199 | |
Loans and advances to banks | 7,323 | 6,710 | |
Loans and advances to customers | 59,172 | 54,494 | |
Other | 393 | 302 | |
Total assets | 76,664 | 73,680 | |
Derivatives | 509 | 1,105 | |
Amounts due to banks | 1,117 | 1,401 | |
Amounts due to customers | 57,811 | 56,153 | |
Debt certificates | 11,873 | 9,322 | |
Subordinated debts | 494 | 997 | |
Provisions | 263 | 405 | |
Other | 266 | 249 | |
Total liabilities | 72,333 | 69,632 | |
Total equity | 4,331 | 4,048 | |
Total equity and liabilities | 76,664 | 73,680 |
In 2025, the balance sheet total increased by € 3.0 billion to € 76.7 billion (+4%), largely as a result of an increase in loans to customers by € 4.7 billion, partly compensated by a decrease in cash by € 1.7 billion. On the liability side, this was mainly reflected in € 1.7 billion growth in amounts due to customers and an increase in debt certificates by € 2.6 billion.
Investments decreased by € 0.4 billion as part of cash management activities. Amortised cost investments decreased by € 0.7 billion due to redemptions of T-bills. Fair value through OCI investments increased by € 0.3 billion as a result of purchased bonds. Loans and advances to banks increased by € 0.6 billion to € 7.3 billion, as part of cash management activities.
Total equity increased by € 283 million to € 4.3 billion, due to the addition of the 2025 net profit (€ 268 million) and an increase in the fair value reserve (€ 36 million), partly offset by the payment of AT1 coupons (€ 21 million).
in € millions | 31-12-2025 | 31-12-2024 | ||||
|---|---|---|---|---|---|---|
Gross carrying amount | Provision for credit losses | Book value | Gross carrying amount | Provision for credit losses | Book value | |
Residential mortgages | 56,482 | -53 | 56,429 | 52,003 | -80 | 51,923 |
Consumer loans | 76 | -6 | 70 | 67 | -7 | 60 |
SME loans | 1,541 | -12 | 1,529 | 1,393 | -15 | 1,378 |
Other corporate and government loans | 2,695 | -14 | 2,681 | 2,261 | -40 | 2,221 |
IFRS fair value adjustments1 | -1,537 | -- | -1,537 | -1,088 | -- | -1,088 |
Total | 59,257 | -85 | 59,172 | 54,636 | -142 | 54,494 |
- Consisting of fair value adjustments from hedge accounting and amortisations.
Loans and advances to customers increased by € 4.7 billion to € 59.2 billion in 2025. This includes the IFRS fair value adjustments from hedge accounting and amortisations of € 1.5 billion negative, which is part of residential mortgages. The negative fair value adjustments increased by € 449 million due to increased (long term) interest rates. Excluding the fair value adjustments, total gross loan growth amounted to € 5.1 billion, mainly driven by an increase in residential mortgage loans.
Our gross retail mortgage portfolio excluding the IFRS value adjustments increased by € 4.5 billion to € 56.5 billion (year-end 2024: € 52.0 billion). In an expanded mortgage market ASN Bank’s new mortgage production increased to € 10.3 billion (2024: € 7.1 billion). The market share of new mortgages stood at 6.9%, up compared to 2024 (6.3%). 80% of new mortgage production in 2025 consisted of mortgages with a 10-year fixed rate, in line with 2024 (77%). Repayments amounted to € 5.8 billion (2024: € 4.7 billion) and interest rate renewals were € 2.7 billion, up € 1.3 billion compared to 2024.
In addition, the total gross outstanding amount of SME loans went up by € 148 million to € 1,541 million. Gross other corporate and government loans increased by € 0.4 billion to € 2.7 billion as a result of cash management.
in € millions | 2025 | 2024 |
|---|---|---|
Households | ||
Deposits due on demand | 41,868 | 39,892 |
Deposits with agreed maturity | 5,463 | 5,747 |
Total household deposits | 47,331 | 45,638 |
Current accounts | 5,844 | 5,856 |
Savings deposits mortgages | 619 | 598 |
Investment portfolio mortgages | 16 | 15 |
53,810 | 52,107 | |
Other corporates and governments | ||
Current accounts | 777 | 764 |
Deposits due on demand | 1,610 | 1616 |
Deposits with agreed maturity | 485 | 482 |
of which deposits held for trading | 52 | 68 |
Savings deposits mortgages | 1,129 | 1,184 |
4,001 | 4,046 | |
Amounts due to customers | 57,811 | 56,153 |
In 2025, total amounts due to customers rose by € 1.7 billion to € 57.8 billion. Amounts due to households increased by € 1.7 billion, driven by an increase in deposits due on demand in a higher savings market. The savings market1 grew to € 529 billion as at end December 2025, from € 487 billion at year-end 2024, supported by rising consumer income. Our market share in savings of 9.0% was below the market share of 9.4% as at year-end 2024.
Amounts due to other corporates and governments remained broadly stable.
- According to data from DNB.
Outlook
Global economic activity is expected to maintain its momentum in 2026, but will continue to face major risks such as geopolitical tensions (trade wars, conflicts), financial weaknesses (rising debt, climate/defence funding gaps), increasing protectionism and persistent inflation. The global GDP growth projection for 2026 amounts to 3.3%, broadly in line with 2025. For the European economy, the economic outlook for 2026 points to steady, moderate growth of around 1.3%, driven by falling inflation, lower interest rates, robust consumer demand and stable labour markets. The Dutch economy is expected to grow by around 1.4% in 2026. Inflation will remain high due to rising costs in the service sector. The unemployment rate is expected to rise slightly but remain low. The escalation of the conflict in the Middle East at the end of February could have significant consequences for economic growth, inflation, and interest rates.
Looking ahead, we expect net interest income in 2026 to increase modestly compared to 2025, driven by commercial growth, partly offset by the full impact of the ECB's previous interest rate cuts. We do not expect a further interest rate cut in 2026, but net interest income will continue to be sensitive to any changes in the ECB's interest rate policy.
Total operating expenses - excluding incidental items and regulatory levies - are expected to decrease in 2026 due to the full impact from cost savings related to the staff reduction in 2025 and anticipated additional staff reduction in 2026. These structural cost savings are partly offset by wage inflation, higher IT costs and ongoing additional costs for the remediation of anti-financial crime (AFC) and risk management related topics.
Regulatory levies are expected to increase in 2026 as levies in 2025 included a refund of a prior year’s contribution to the Single Resolution Fund (SRF).
The effect of macroeconomic developments on our customers and their financial resilience is uncertain and may, therefore, impact our loan loss provisioning levels. Based on the current economic outlook and sound credit quality of our loan portfolio, we expect the level of impairment charges on loans and advances to be moderate in 2026.
For the full year 2026 we expect net profit, adjusted for incidental items, to be in line with 2025.
Reconciliation of alternative performance measures
Our financial results have been prepared and are reported in accordance with IFRS Accounting Standards as adopted within the European Union, as outlined in the Section Accounting principles for the consolidated financial statements. We also present alternative performance measures, i.e. non-IFRS financial measures. These include the adjusted performance that we use to align internal and external reporting, identify and quantify items that management believes to be significant, and provide insight into how management assesses the bank's period-on-period performance.
To derive adjusted performance, we adjust for incidental items that meet the following criteria: (i) they are not directly related to our regular banking activities, (ii) they are incidental in nature, and (iii) they have a impact exceeding € 15 million after tax on net result. By removing these items, we provide greater transparency into our underlying business performance. Significant adjustments to previously reported incidental items are also treated as incidental to maintain consistency in our reporting.
The 2025 net result included negative incidental items of € 51 million after tax (€ 69 million before tax), consisting entirely of a restructuring charge. This charge comprised three main components:
An employee redundancy provision in 2025 connected to an additional reduction in internal FTEs. In 2026, the transformation programme is expected to lead to a further simplification of the organisational structure.
An additional charge related to the 2024 employee redundancy provision, driven by a higher number of substantially changed job functions than initially assumed combined with more internal employees deciding to leave the bank.
The restructuring provision related to optimising our distribution network was updated, resulting in a small net charge.
The net result in 2024 included incidental items of € 283 million (€ 375 million before tax), consisting of restructuring charges related to the transformation programme and provisions related to the AFC remediation programme, the settlement of legal proceedings and two administrative fines. For more information about the incidental items in 2024, reference is made to our Annual Report 2024.
Definitions of additional ratios presented in this Annual Report are presented in the tables Non-IFRS financial measures below.
in € millions | 2025 | 2024 | ||||
|---|---|---|---|---|---|---|
Reported | Adjust- | Adjusted | Reported | Adjust- | Adjusted | |
Net interest income1 | 1,122 | 1,122 | 1,240 | 1,240 | ||
Net fee and commission income | 83 | 83 | 77 | 77 | ||
Investment income (losses) | 3 | 3 | -14 | -14 | ||
Other results on financial instruments1 | 11 | 11 | 5 | 5 | ||
Total income | 1,219 | 1,219 | 1,308 | -- | 1,308 | |
Staff costs | 564 | -65 | 499 | 721 | -207 | 514 |
Depreciation and amortisation of tangible and intangible assets | 20 | -1 | 19 | 27 | -5 | 22 |
Other operating expenses | 290 | -3 | 287 | 392 | -163 | 229 |
- of which: regulatory levies | -4 | -4 | 11 | 11 | ||
Total operating expenses | 874 | -69 | 805 | 1,140 | -375 | 765 |
- of which: operating expenses excluding regulatory levies | 878 | -69 | 809 | 1,129 | 754 | |
Impairment charges (releases) on financial assets | -32 | -32 | -51 | -51 | ||
- of which investments | -1 | -1 | -- | -- | ||
- of which loans and advances to banks | -1 | -1 | -1 | -1 | ||
- of which loans and advances to customers | -30 | -30 | -50 | -50 | ||
- of which residential mortgages | -38 | -38 | -48 | -48 | ||
- of which consumer loans | 1 | 1 | -- | -- | ||
- of which SME loans | -3 | -3 | -7 | -7 | ||
- of which other corporate and government loans | 10 | 10 | 5 | 5 | ||
- of which other | -- | -- | -- | -- | ||
Total expenses | 842 | -69 | 773 | 1,089 | -375 | 714 |
Result before taxation | 377 | 69 | 446 | 219 | 375 | 594 |
Taxation | 109 | 18 | 127 | 75 | 92 | 167 |
Net result for the period | 268 | 51 | 319 | 144 | 283 | 427 |
- In 2025, the presentation of Interest income and Other results on financial instruments has been changed, as a result the Net interest margin also changed. Comparable figures have been adjusted accordingly. For more information reference is made to the section Changes in accounting policies, estimates and presentation in this report.
KPIs and definitions | in € millions | 2025 | 2024 | ||||
|---|---|---|---|---|---|---|---|
Reported | Adjustments | Adjusted | Reported | Adjustments | Adjusted | ||
Cost/income ratio | |||||||
Total operating expenses (including regulatory levies) as a percentage of total income | Total operating expenses | 874 | -69 | 805 | 1,140 | -375 | 765 |
Total income | 1,219 | 1,219 | 1,308 | 1,308 | |||
Cost/income ratio | 71.7% | 66.0% | 87.2% | 58.5% | |||
Return on Equity (RoE) | |||||||
Annualised net result for the period, excluding interest expenses related to AT1 capital securities, as percentage of average month-end total equity, excluding AT1 capital securities, for the reporting period | Net result | 268 | 51 | 319 | 144 | 283 | 427 |
Interest expenses related to AT1 capital securities | -21 | -21 | -21 | -21 | |||
Average month-end total equity | 3,907 | 3,907 | 3,881 | 3,881 | |||
Return on Equity (RoE) | 6.3% | 7.6% | 3.2% | 10.5% | |||
Net interest margin (bps) | |||||||
Annualised net interest income as percentage of average month-end total assets for the reporting period | Net interest income1 | 1,122 | 1,122 | 1,240 | 1,240 | ||
Average month-end total assets | 74,722 | 74,722 | 71,898 | 71,898 | |||
Net interest margin (bps)1 | 1.50% | 1.50% | 1.72% | 1.72% | |||
Cost/assets ratio | |||||||
Annualised total operating expenses excluding regulatory levies as a percentage of average month-end total assets for the reporting period | Operating expenses excluding regulatory levies | 878 | -69 | 809 | 1,129 | -375 | 754 |
Average month-end total assets | 74,722 | 74,722 | 71,898 | 71,898 | |||
Cost/assets ratio | 1.18% | 1.08% | 1.57% | 1.05% | |||
- Comparable figures have been adjusted. For more information reference is made to the section Changes in accounting policies, estimates and presentation in this report.
Definition | in € millions | 2025 | 2024 | |||
|---|---|---|---|---|---|---|
Cost of risk | ||||||
Impairment charges (releases) on financial assets as a percentage of average month-end loan portfolio exposure for the reporting period. | Total loans and advances to customers | |||||
Impairment charges (releases) on financial assets - total loans | -30 | -50 | ||||
Average month-end portfolio exposure - total loans | 57,764 | 53,955 | ||||
Cost of risk total loans and advances to customers | -0.05% | -0.09% | ||||
Residential mortgages | ||||||
Impairment charges (releases) on financial assets - residential mortgages | -38 | -48 | ||||
Average month-end portfolio exposure - residential mortgages | 54,054 | 50,527 | ||||
Cost of risk residential mortgages | -0.07% | -0.09% | ||||
SME loans | ||||||
Impairment charges (releases) on financial assets - SME loans | -3 | -7 | ||||
Average month-end portfolio exposure - SME loans | 1,474 | 1,316 | ||||
Cost of risk SME loans | -0.20% | -0.50% | ||||
Other corporate and government loans | ||||||
Impairment charges of financial assets - Other corporate and government loans | 10 | 5 | ||||
Average month-end portfolio exposure - Other corporate and government loans | 2,168 | 2,052 | ||||
Cost of risk Other corporate and government loans | 0.46% | 0.24% | ||||
Definition | in € millions | 2025 | 2024 | |||
|---|---|---|---|---|---|---|
Loan-to-Deposit ratio | ||||||
Loans and advances to retail customers as a percentage of amounts due to retail customers | Total loans and advances to customers | 59,162 | 54,494 | |||
Excluding: IFRS value adjustments | -1,537 | -1,088 | ||||
Excluding: Loans and advances to other corporates and governments | 1,289 | 680 | ||||
Loans and advances to retail customers | 59,410 | 54,902 | ||||
Total amounts due to customers | 57,811 | 56,153 | ||||
Excluding: Amounts due to non-retail customers | 483 | 466 | ||||
Amounts due to retail customers | 57,328 | 55,687 | ||||
Loan-to-Deposit ratio | 104% | 99% | ||||

Risk, funding and capital
Risk, funding and capital
ASN Bank manages risks across the various domains. This chapter covers our approach to managing these different types of risks.
Reader's guide
To combine disclosures where possible and to reduce duplication, we have integrated the IAS 1 and IFRS 7 information on capital management and financial instruments related risks in this Risk management chapter. The information is part of the audited financial statement only if this is explicitly stated in the relevant text or by means of the label ‘Audited’.
In addition, our Pillar 3 Report for 2025 is available on the website www.corporate.asnbank.nl. This report contains additional information about risks, risk management and capital adequacy of the bank. Although we are required to provide this information under the CRR, this information is not part of the audit performed by the external auditor.
Risk management
ASN Bank is an accessible and forward-looking bank with an eye for people, society and the future. We contribute to financial solutions for our customers. We pay particular attention to sustainability, financial well-being and good and affordable housing.
Risk management framework
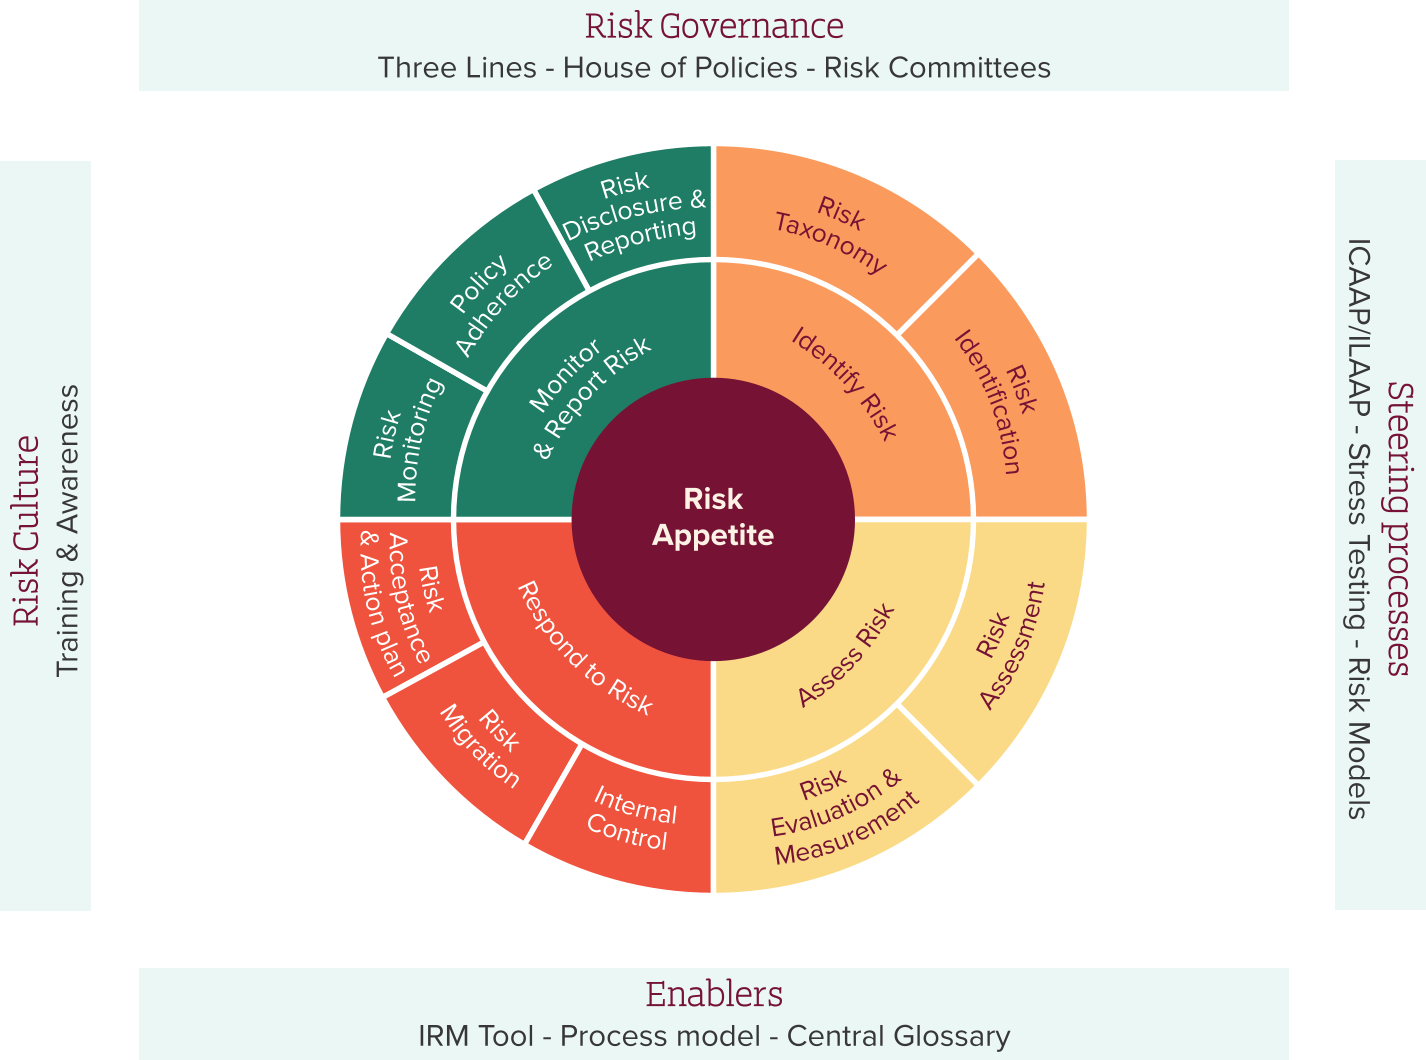
ASN Bank applies the COSO1 Enterprise Risk Management (ERM) Framework. The Risk Management Framework (RMF) enables ASN Bank to properly apply all COSO ERM elements, and serves as a generic tool for both the first line and second line. The RMF ensures consistent terminology and provides a compatible methodology for the identification, assessment, measurement, monitoring, management and reporting of key risks.
In 2025, ASN Bank undertook several important steps to further strengthening its RMF, updating the bank's policy management approach (House of Policies), enhancing the risk management cycle (RMC) and refining its issue management processes.
The risk management cycle is designed to support evaluation of the effectiveness of the design and operation of the internal risk management and control system.
The RMC, as the central part of the RMF, provides a methodology for a sound internal risk management and control system, describing the necessary instruments, and using consistent terminology. It is designed to support the evaluation of the design and effectiveness of the internal risk management and control system.
The ExBo has assessed the effectiveness of the internal risk management and internal control system in relation to operational, compliance and reporting risks during the past financial year. The basis for this assessment is the overall risk mitigation for strategic risks, financial risks and non-financial risks. With respect to internal control over for financial reporting, the bank relies on the outcome of the evaluation of high rated issues, operational incidents, and identified deviations from the proper functioning of the internal control system. These evaluations have resulted in defined areas of attention for 2025 including mitigating measures.
The bank used different approaches for risk mitigation during 2025:
For the mitigation of strategic risks, a Strategic Risk Assessment was performed to identify strategic and emerging risks and to define actions to mitigate these risks at both strategic and operational organisation levels. The top risks were assessed and aligned with the risk taxonomy and aligned with the risk appetite to the potential impact of any such top risks.
For the mitigation of financial risks, the bank used additional processes and instruments to mitigate, such as the Financial Risk Assessment and regular monitoring and comparison with RAS limits. Consistent with their mandates, responsible risk committees (Credit Committee, ALCO and ExBo) can decide on measures to steer the risk position towards risk appetite when necessary.
For the mitigation of non-financial risks, significant effort was put into the improvement of several key processes and instruments, such as the issue management process, the financial and IT key control frameworks, the risk assessment approach and the control testing standard. We will continue with the improvements in 2026.
- The Committee of Sponsoring Organizations of the Treadway Commission, www.coso.org
Risk governance
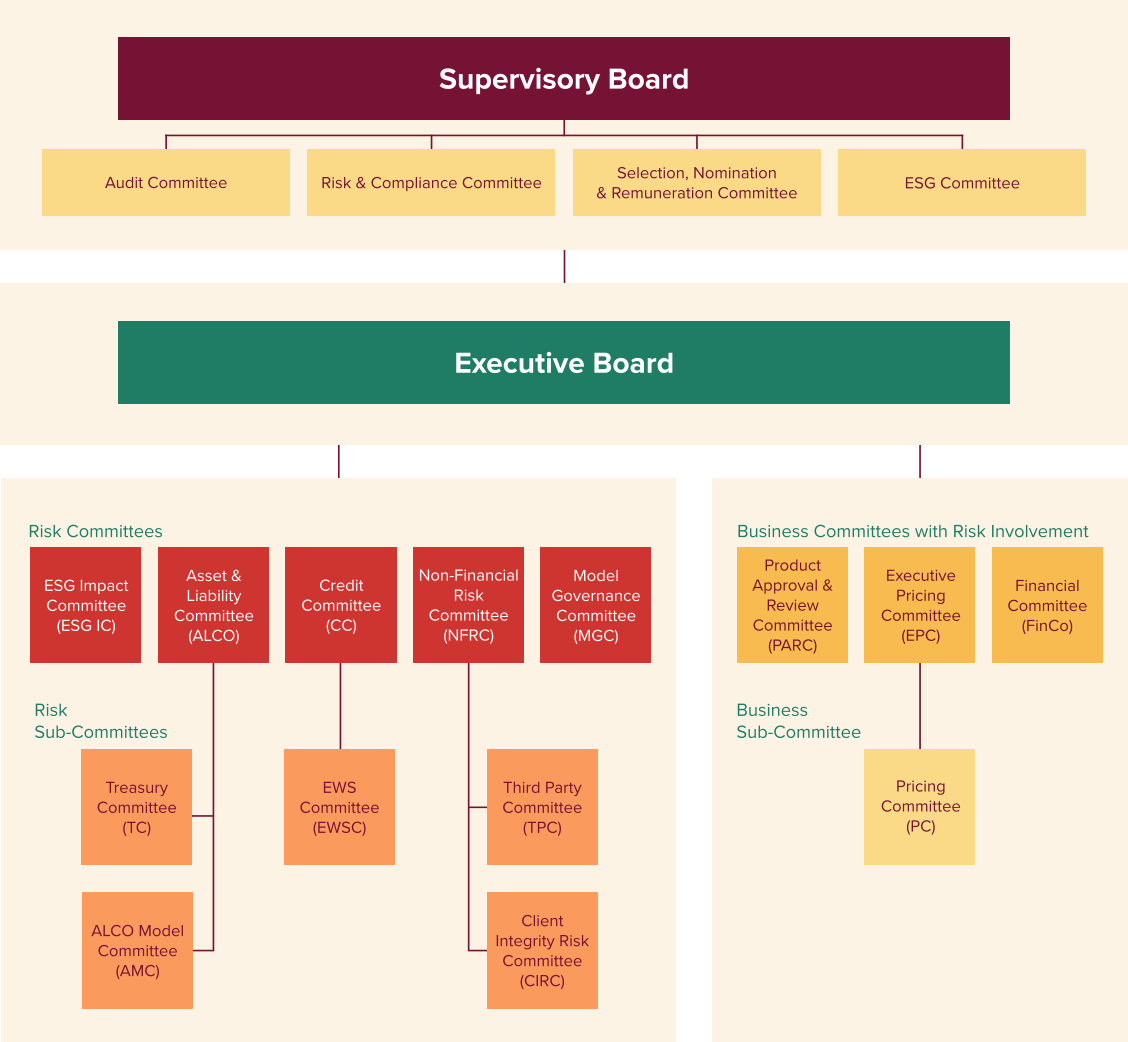
The bank’s risk governance is based on the three lines model. In this model, the first line, i.e. the business, is responsible for setting up and executing its own processes and for the identification and assessment of the risks involved. The business units measure the risks against the defined risk appetite and report on relevant risks. The second line, consisting of the risk management and the compliance function, supports the first line, sets the frameworks, gives advice and monitors if the business units take their responsibility. More specifically, the compliance function monitors how ASN Bank complies with laws and regulations and internal policies on integrity. The third line, the audit function, independently assesses the effectiveness of the first and second line.
The ExBo is ultimately responsible for risk management within the organisation. Various risk committees support the ExBo in fulfilling this task.
The Supervisory Board is charged with the supervision of the ExBo and in that role is advised by the Audit Committee, the Risk & Compliance Committee, the Selection, Nomination & Remuneration Committee and the ESG Committee, for more information on risk committees, see Section Leadership and governance in the Annual Report 2025.
The bank’s risk management function is an integral, but independent, part of the organisation. On the one hand, the risk management function informs, challenges, takes positions and gives solicited and unsolicited advice, and on the other hand it is essential that they listen to and liaise with stakeholders. They take into consideration all stakeholders and try to find solutions that do justice to the various stakeholder interests and contribute to the realisation of the strategy.
The compliance function oversees ethical employee conduct within the organisation. The Ethics Committee enables such oversight.
The compliance function develops and executes an integrity awareness plan for all employees on an annual basis. This plan includes ongoing training and communication initiatives such as workshops, e-learning courses, intranet publications and dilemma-management.
The bank has five risk committees and three business committees. Each risk committee is chaired by an ExBo member and is responsible for the monitoring and steering of exposures in one or more risk type of the risk taxonomy. Business committees address questions that involve aspects of various risk types and are chaired by an ExBo member. The third line has a standing invitation for all risk and business committee meetings but has no voting rights. Both types of committees are made up of officers who represent the business and manage the risks, and officers from the risk management function and/or compliance function, who monitor risks and the risk-related response.
Decision-making related to, or with impact on, risk management follows the lines of risk governance and is assessed against risk guidelines. If risk limits are exceeded, or if the risk appetite is not otherwise observed, risk committees will discuss the issue and take subsequent remedial actions. A risk committee may escalate and present a point of discussion to the ExBo. The risk management function regularly facilitates a complete self-assessment for all risk committees and business committees, defining areas for improvement where necessary.
Risk Taxonomy
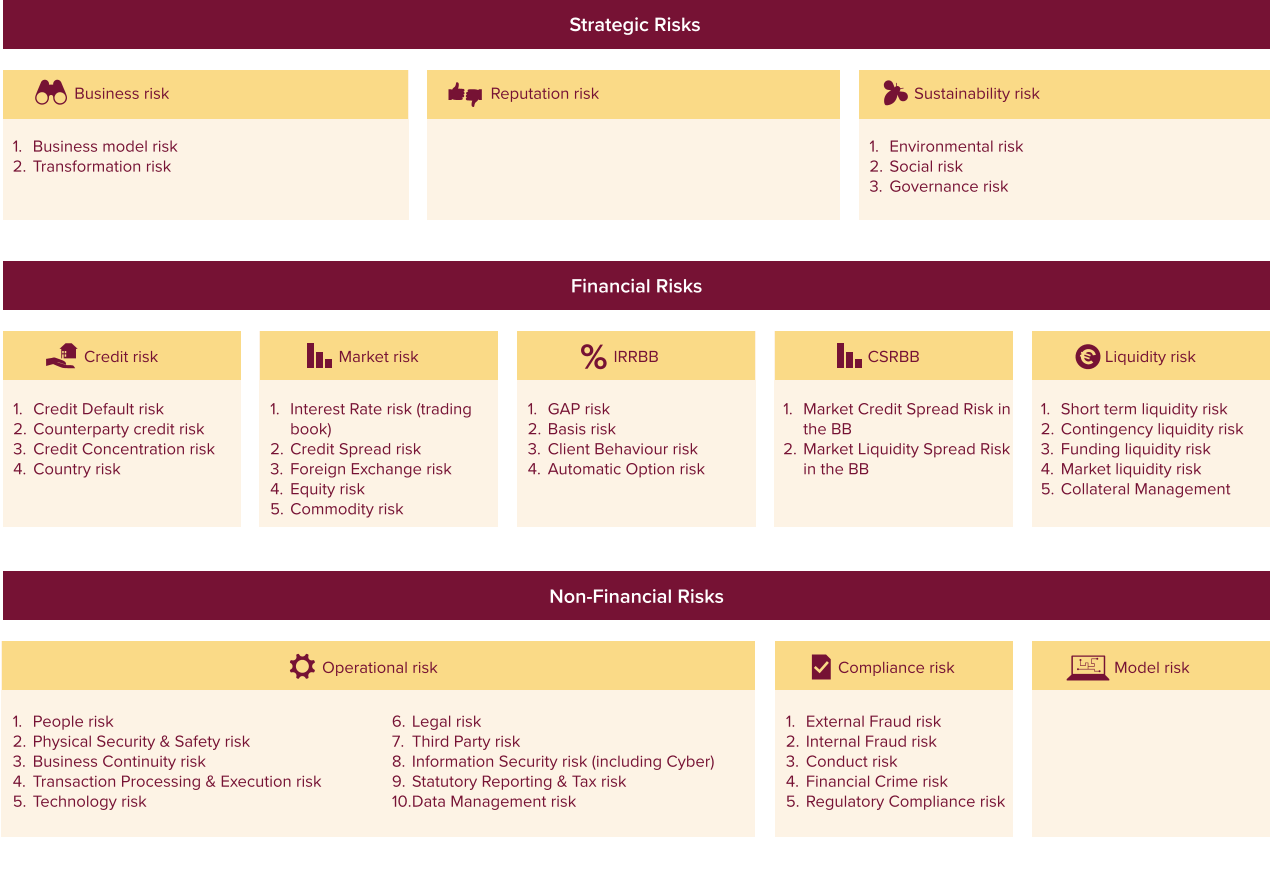
ASN Bank has a process in place to identify risks that are material. The risks are included in a comprehensive internal risk inventory. All risks that may have a material impact on our strategic objectives and viability are included in the bank’s risk taxonomy, clustered into three categories:
Strategic risks,
Financial risks and
Non-financial risks.
ASN Bank carries out regulated and supervised activities that may be impacted by developments. These developments and related risks may prevent us from achieving our strategic objectives. For more details on our strategic objectives, see the Section Our strategy in the Annual Report 2025.
ASN Bank annually carries out a Strategic Risk Assessment (SRA), which identifies and assesses the most important risks in relation to its strategy. Refer to the Section Strategic risks for an overview.
We assess the material risks and will adjust the risk taxonomy when necessary. If so, we will take measures to align our strategy and risk appetite to the potential impact of any such top risks.
Risk Appetite Framework
The Risk Appetite Framework (RAF) is an integral part of ASN Bank's Risk Management Framework and the structured approach the bank uses to define, communicate and manage the amount of risk it is willing to take in pursuit of its strategic objectives. It defines Risk Appetite governance and presents the approach and methodology by which the risk appetite is identified, measured, determined, allocated, supervised, communicated and reported. The Risk Appetite Framework outlines the bank’s appetite for all key risks.
The Supervisory Board, supported by its relevant committees, is responsible for setting and overseeing the bank’s risk appetite, ensuring an effective internal control environment is operated by the ExBo.
Key elements of the ASN Bank's Risk Appetite Framework are:
Risk Appetite Statement: expresses the amount and type of risk which the organisation is generally willing to accept in order to meet its strategic and financial objectives. It reflects the bank’s mission, vision and values.
Risk Limit Framework: is imposed to express the banks risk appetite and to facilitate prudent allocation of such risk appetite to individual risk takers or group of risk takers. The Risk Limit Framework consists of measurable metrics (key risk indicators) to monitor the Risk Profile and to communicate the boundaries to senior management.
Risk Appetite setting and calibration: Risk Appetite is set at an aggregated bank-wide level across the different risk categories. The Risk Appetite Framework provides the principles for cascading this risk appetite down into the organisation. The strategic risk assessment and materiality assessment acts as the starting point for the yearly review, setting and calibration of the Risk Appetite.
Risk Appetite monitoring and reporting: To validate that the bank remains within the set risk appetite of the defined risk categories it reports the risk profile of ASN Bank monthly via the KRIs and accompanying limits to the applicable Risk Committees. On a monthly basis the Level 1 Risk Appetite Statement KRIs are submitted to the Executive Board via the Integrated Risk Report reflecting the exposure of the bank to the set risk appetite. Risk Appetite escalation and breach management aligns with escalation for economic capital and recovery & resolution planning.
Areas of attention
During 2025, ASN Bank implemented multiple improvements in the RMF, as a deliverable of the Risk & Compliance Transformation programme. A new House of Policies was designed, the RAS process updated, and a new risk reporting cycle was in place.
The bank has updated its methodology enhancing requirements for risk appetite setting and calibration and clarifying roles and responsibilities in relation with risk appetite. Additionally, the bank improved the governance cycle including risk appetite review and approval in (Risk) committees and the ExBo.
Also, the bank aligned its risk committee structure to the new ASN Bank organisation as described in the paragraph Risk Committee Structure.
At the end of every year, the bank executes an internal review of all identified deviations to a proper functioning of the internal control system. These deviations are translated into areas of attention, which are ultimately reviewed by the ExBo for their overall impact and required actions.
Below is an overview of the areas of attention, resulting from our internal risk assessments, including mitigating measures.
The bank is continuously improving the risk culture by establishing and translating a healthy and mature risk culture into effective behaviour throughout the entire organisation in an integrated and comprehensible manner.
During 2025, many improvements in the renewed Risk Management Framework were implemented as part of the Risk & Compliance Transformation programme. A new House of Policies was designed, the Risk Appetite Statement process updated, Regulatory Change process (including installation of a Regulatory Change Board) and a new risk report and cycle is set in place. The risk management organisation has also been strengthened by focusing on additional knowledge and experience, where necessary from outside the organisation. Further mitigating measures focused on strengthening risk awareness and behavioural alignment, including bank wide masterclasses on the business model, regulatory environment and key risks, complemented by interactive, values-based discussions to support risk informed decision making.
For 2026, we will further strengthen the culture, further interventions have been planned as part of our company wide corporate culture. In addition, we will continue to operationalise and improve the risk and compliance management processes within the first and second line following the roll-out of the defined road maps. We will also focus on the improvement of Control testing, Risk reporting, implementation of the Model Risk Management Framework, setting up the Independent Validation Unit, and regulatory monitoring.
The evolution towards a risk mature organisation will require ongoing management attention and perseverance.
The control framework for Data risks is being improved. While the necessary data capabilities are defined, further strengthening awareness, knowledge, and skills related to data throughout the organisation requires continued attention.
To address the identified need to further strengthen data awareness, knowledge and skills across the organisation, the Data Management Risk policy was updated and is translated to underlying standards and controls. Implementation of this policy is supported by a newly developed data Target Operating Model which clarifies data related roles, responsibilities and accountabilities across business units and data domains. This operating model serves as a foundation for embedding data governance requirements into daily activities and supports targeted training and capability development.
For 2026, the bank is fully focused on realising being in control for BCBS 239 for financial and non-financial reporting, in line with the roadmap planning.
The bank is continuing to strengthen its alignment with regulatory requirements and supervisory expectations, with particular focus on credit risk models. Initiatives are underway to further enhance model quality, data and methodological foundations, and governance across the relevant domains.
These improvements are expected to reinforce the accuracy and robustness of parameters used for RWA and provisioning, support a more risk sensitive capital framework, and enhance the quality and depth of insight into the bank’s underlying risk profile.
The execution of the Path to Green (P2G) for model risk focuses on implementing structural enhancements in the Data & IT processes and addressing findings The execution is monitored in the Model Governance Committee (MGC). The Model Risk Management House of Policies is approved in accordance with internal governance. The implementation will further strengthen the model risk management framework and enhance the governance and effectiveness of the model life cycle.
Ensuring alignment with applicable laws and regulations remains a key priority for the bank. Ongoing initiatives focus on the implementation and embedding of regulatory requirements across areas such as AML, data protection (GDPR), climate risk, data management, and risk and provisioning models, including IFRS 9.
Regulatory risks are mitigated through an operational Regulatory Change Management process, including active engagement initiatives such as roadshows. Legal is closely involved in all supervisory files, ensuring timely interpretation and application of regulatory requirements.
In addition, first line compliance and activity reporting is aligned and subject to review by the second line, with further refinement of this process ongoing.
In the area of Wwft and Sanctions Act compliance, the bank is continuing to strengthen the effectiveness of customer due diligence and ongoing monitoring processes. At the reporting date, these processes are operational, but their execution requires further enhancement to fully meet our obligations and supervisory expectations.
AFC risks are mitigated through strengthened governance and oversight. During 2025, the Chief Financial Crime Officer (CFCO) role was established and embedded in the Executive Board, reinforcing senior management accountability for AFC matters. In addition, the AFC budget has been structurally integrated into the standard investment and operational planning (IP/OP) process.
Planned AFC remediation actions for 2025 have been realised. The remediation plan has been evaluated and translated into an operational roadmap for 2026. Compliance is further embedding its second line role through the Quality Management Framework, enhancing ongoing oversight and challenge.
The bank is developing further insight into its privacy-related risks. Data cleansing and data retention remain an ongoing area of attention into 2026, alongside continued focus on the security of personal data exchanges.
Privacy risks are mitigated through a structured roadmap that is actively being implemented. Further embedding and alignment with the ISO privacy framework is planned for 2026, supporting continued strengthening of privacy controls.
In the current reality we are aware of the continuous threat of a possible cyber-attack. Also, we face the risk that our IT systems are unable to keep up with market and supervisory developments, which could lead to unrealised strategic priorities.
These risks are mitigated through continuous strengthening and transformation of the IT landscape, focusing on resilience, security and flexibility. Modernisation of the IT environment remains a strategic priority for 2026, further enhancing the bank’s ability to deliver high quality services and respond to regulatory and market developments.
Supervisory actions
At the end of January 2025, De Nederlandsche Bank (DNB) imposed a fine of € 5 million for shortcomings in the bank’s organisation and operations to comply with the Anti-Money Laundering and Anti-Terrorist Financing Act (Wet ter voorkoming van witwassen en financieren van terrorisme - Wwft). At the same time, DNB also imposed a fine of € 15 million for shortcomings in risk management as a result of not complying with the sound business operations-related requirements under the Financial Supervision Act (Wet op het financieel toezicht - Wft).
The bank is currently in the process of strengthening its risk management and ensuring sound business operations, to comply with Wwft and Wft requirements. This means that:
A risk transformation programme was initiated to improve our risk management processes. As from July, required remediations have been incorporated in the improvement planning of the restructured risk management organisation. The risk management organisation has also been strengthened by focusing on additional knowledge and experience, where necessary from outside the organisation. We are fully committed, and have set to work, to sustainably and adequately address the identified deficiencies in risk management to comply with laws and regulations. The bank is prioritising improved monitoring, reporting and tightened escalation mechanisms.
With effect from 1 February 2025, a renewed AFC organisation has been implemented. The bank introduced a simplified organisational structure across all three lines with clear mandates and responsibilities to manage and mitigate the AFC risks that the bank is potentially exposed to. We are committed to a healthy risk culture and managing our customer portfolio within the boundaries of our risk appetite.
During 2025 ASN Bank has made substantial progress in reducing AFC risks by:
Advanced in-depth insights in AFC risks as part of our SIRA 2024 and the necessary requirements to further mitigate these risks.
Reduction in operational backlogs for transaction monitoring and customer due diligence.
Further improvements in sanctions screening processes and systems.
Start of large-scale customer data remediation and customer risk reassessment.
Development of AFC standards and risk frameworks in line with market practices.
For more detailed information on the Anti-financial crime (AFC) remediation, see Section Anti-financial crime in the Sustainability statements in the Annual Report 2025.
Overall, we have made good progress in strengthening our remediation efforts in anti-money laundering and risk management. We maintain a continuous dialogue with our supervisory authorities on the progress of all ongoing improvements.
Risk culture and awareness
A strong risk culture identifies, manages and controls relevant risks in line with the bank's vision, risk appetite and customer needs, all within the applicable legal frameworks. It shapes management and employees’ day-to-day decisions and fosters an atmosphere of open communication and constructive challenge which is a prerequisite for effective risk management and risk awareness. We aim for the envisaged risk culture to be endorsed by the entire organisation. This starts by using the bank’s RMF policy that describes our overall risk management governance.
In 2025, a new vision on risk culture was developed and rolled out, intended to strengthen the risk culture within ASN Bank. Multiple initiatives were rolled out to raise risk awareness and provide guidance towards desired behaviour like 'whole system in the room' workshops to strengthen cooperation between first and second line and dilemma management. Additionally, all employees are expected to include a goal regarding risk awareness in their performance cycle.
In January 2025, we measured the perceived integrity and risk culture within ASN Bank with an employee survey. This survey included the main elements from ASN Bank risk culture model and EBA requirements. The results showed that employees experience an improvement in certain areas of the risk culture, mainly in leading by example (2025: 74.8%; 2023: 73.6%) and feasibility (2025: 78.3%; 2023: 77.6%). Commitment (94%), discussability (80%) and accountability (77%) remained at the same level whereas transparency (2025: 65.2%; 2023: 66.9%) and enforcement (2025: 80.3%; 2023: 83%) showed a small decline.
Risk awareness is the ability to spot risks that could impact the organisation. We raise risk awareness among our employees by helping them identify, assess and respond better and more consciously to (potential) risks. We do this by providing training courses, workshops and e-learning programmes as well as by sharing risk awareness-related success stories and lessons learned with our employees. This risk awareness framework is carefully maintained and continuously improved, and new rules and regulations are embedded into the different policies that are accessible to employees in the policy framework. We encourage a critical consideration of the risk-return ratio by focusing on the interests of our customers, society, our employees and the shareholder.
Internal code of conduct
We expect our employees to show good corporate behaviour. They are guided in this by our Code of Conduct: ‘Common Sense, Clear Conscience’, which focuses on moral dilemmas and how to deal with them. A well-spread network of confidential counsellors offers staff the opportunity to raise concerns about malpractices.
Remuneration policy
ASN Bank pursues a remuneration policy based on the strategy of building strong customer relationships and increasing its social impact. We do not grant any variable remuneration to discourage employees from taking undesirable risks that may give priority to short-term individual interests over long-term collective objectives. For more detailed information on our remuneration policy, see Section Remuneration report in the Annual Report 2025.
Stress testing
In addition to monitoring our risk indicator-based risk appetite, we use stress tests to gain insight into the sensitivity to changes in the underlying causes and the interrelationship of risks. Several times a year, we calculate a severe yet plausible macroeconomic scenario to determine its effects on aspects such as our profitability, capital and liquidity position. In 2025, we also performed a climate stress test to gain insight in the impact of climate change resulting from both physical and transitional climate-risk drivers. We carry out different types of stress tests to reveal potential vulnerabilities.
For the use of stress tests in relation to credit risk, market risk, liquidity risk and capital adequacy, see the related sections in the Annual Report 2025. For more information on the continued development of climate stress testing, see Section Sustainability risk - Areas of focus and activities.
Strategic risks
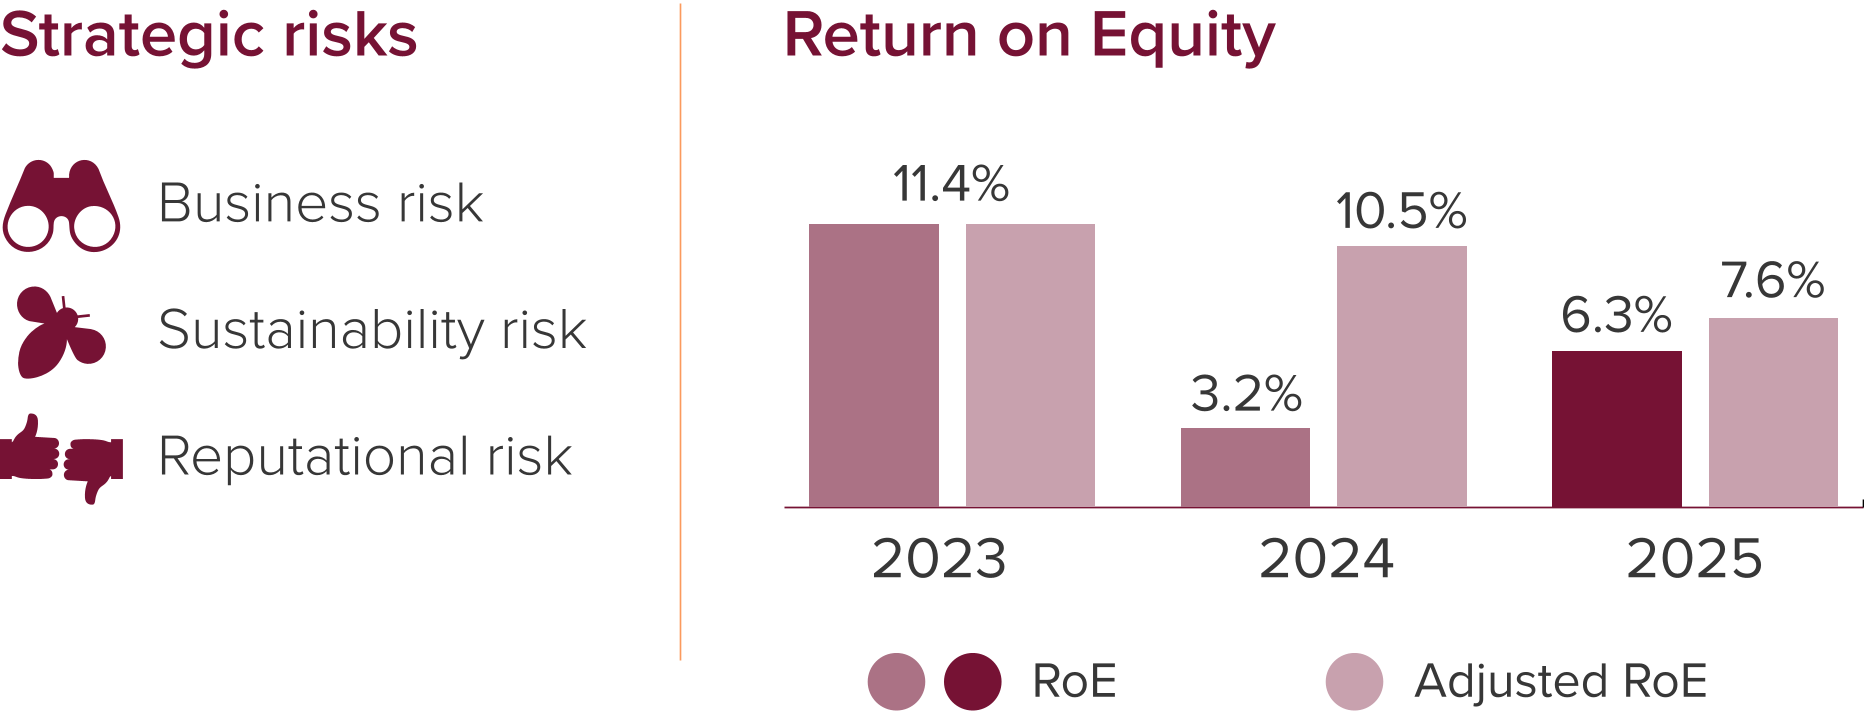
ASN Bank distinguishes three strategic risks, i.e. business risk, sustainability risk and reputational risk.
We have established three strategic risk types because the risks differ in nature. They can all have a material impact on the viability of our strategy. They potentially pose a risk to the bank’s ability to add long-term value if we fail to adequately identify, and respond to, internal and external changes and events. An exception to this is reputational risk, which always materialises through events caused by other risk types. In order to manage this dynamic interaction in an appropriate manner, reputational risk is classified and managed as a separate risk type.
In general, we established indicators for all types of risk, ensuring that the development of risks is continuously monitored and that adjustments are made when necessary.
Business risk
Business risk is defined as the risk that the ASN Bank's profitability deviates from limits that may negatively impact the viability of the bank’s business model and sustainability of the bank’s strategy. Business risk-sub types are:
Business model risk and
Transformation risk
Business model risk is defined as the risk that the profitability of ASN Bank deviates from limits that may have a negative impact on the viability of the bank’s business model and sustainability of the bank’s strategy.
Net interest income in 2025 decreased, driven by lower net interest income on cash management activities, due to less volume year-on-year and the decline in the ECB deposit facility rate.
In 2025, both the mortgage and savings market grew. Despite a competitive domestic market, the commercial interest income on residential mortgages increased, driven by portfolio growth in combination with a stable portfolio margin in basis points (bps). Commercial interest income on savings remained virtually stable.
In these markets, we managed to reduce ASN Bank’s excess liquidity as loan growth outpaced the increase in retail deposits. As a result, our loan-to-deposit ratio improved, which makes us less sensitive to future changes in short-term interest rates. In the coming year, we will continue our efforts to optimise our balance sheet.
Total operating expenses, adjusted for incidental items, in 2025 consisting of restructuring charges for our transformation programme and, in 2024 also for a provision related to our anti-financial crime (AFC) remediation programme, increased due to higher consultancy costs. These costs mainly related to our transformation programme and addressing deficiencies in risk management, and to higher IT costs. In addition, expenses in 2024 included a non-recurring gain related to an adjustment in recoverable VAT in previous years. These elements were partly offset by lower regulatory levies and lower staff costs.
Staff costs decreased, despite pressure from (wage) inflation and an increase in temporary FTEs covering remediation work, focusing on anti-financial crime and risk management-related topics. The decrease in staff costs was driven by structural cost savings from our transformation programme. Transformation-related cost savings of around € 35 million were realised, this equates to the € 70 million cost savings on an annualised basis, as announced at the end of 2024.
The next phase of the transformation will lead to an expected FTE reduction of 850–950 throughout 2026. This additional FTE reduction is anticipated to result in an additional annual structural cost saving of approximately € 80 million as of 2027.
ASN Bank has drawn up a Financial Plan & Budget for the 2026-2030 period. This plan sets mission-driven objectives for growth and improvement and includes efficient capital management. At the same time, it carves out a path with actions to achieve our financial objectives.
For more information on ongoing and future actions refer to Section Strategy and performance in the Annual Report 2025.
Transformation risk is defined as the incapability to (rapidly) transform the business in response to changes in the market such as the entry of new competitors, the development of new industry-changing technologies, regulatory requirements or shifts in overall market conditions that may negatively impact the viability and sustainability of the bank’s business model.
We achieved significant progress on our transformation, including the successful brand merge, which led to cost savings of € 70 million on an annualised basis through migrating 2.3 million customers, streamlining the branch network, and reducing the number of FTE.
Two primary transformation risks are: 1) the ability to sustain the pace of execution and 2) the possible transformation delays. The first risk is driven by the magnitude and scope of simultaneous changes across multiple domains and organisational complexity. The second risk is due to increased interdependencies between changes across systems, processes, and organisational structures in 2026.
To mitigate these risks, ASN Bank established a Transformation Office, which has proven effective in delivering risk mitigation through strengthened governance structures.
The transformation is a centrally orchestrated process and continuously manages activities, sequences the various transformation initiatives, and flags bottlenecks to ensure optimal delivery. Risk management is embedded as a core practice, to assure strong daily customer service and prevents transformation to interfere with the ongoing remediation efforts.
Reputational risk
Reputational risk is the risk that ASN Bank becomes subject to negative public opinion due to internal or external events that may negatively impact the bank’s ability to attract and retain (the support of) customers, employees, society, counterparties, shareholders and supervisory authorities. This may be caused by internal and/or external events and/or developments, which may subsequently result in the loss of stakeholder support and motivation and a direct or indirect financial loss.
Reputational risks may be related to our own conduct in events that are subject to the public's attention, but also to policy decisions, our day-to-day actions and issues regarding products, or the actions of individual employees. External developments may also affect reputational risk as they may change stakeholder expectations of ASN Bank.
The Corporate Communications department actively manages issues at sector and bank level by monitoring and mitigating current and upcoming internal and external events that may result in reputational damage for the bank and its brands. In addition, ASN Bank's Crisis Communication Plan (CCP) includes (press) policies, communication strategies and key messages for various crisis communication scenarios. The CCP is tested and updated annually. ASN Bank measures reputation scores on a quarterly basis. They are conducted by RepTrak, the leading global reputation research company. Since the transition to one brand on 1 July, reputation was measured for ASN Bank, RegioBank and BLG Wonen in the third quarter of 2025, and from the fourth quarter of 2025 onwards is measured exclusively for ASN Bank.
2025 marked many changes. From the rebranding to one brand 'ASN Bank', the closing of SNS branches in March, to the reduction of over 700 FTEs, and the announcement in November of the new strategy and an additional reduction of 850-950 FTEs throughout 2026.
In 2025, the customer-weighted average NPS decreased to -7 (year-end 2024: +4). Key drivers for the decline were a greater than expected impact from the transformation and rebranding, the reduction of branches and mandatory customer re-identification procedures. In our new strategy, we are targeting the highest NPS position among the major systemic Dutch banks. At year-end 2025, we ended in joint second position, driven by the transformation impact.
The above-mentioned developments did not lead to significant fluctuations in the bank's 2025 reputation scores. The RepTrak research shows that ASN Bank still outperforms on relevant reputational drivers such as conduct, products and services and citizenship. As a result ASN Bank holds the top position in the Dutch banking industry, as well as on ESG-related themes.
Sustainability risk (In scope of CSRD)
Sustainability risk is the risk of financial and/or reputational damage as a result of Environmental, Social and Governance (ESG) developments. Developments related to sustainability risk are elaborated on in Section Sustainability risk.
Non-financial risks
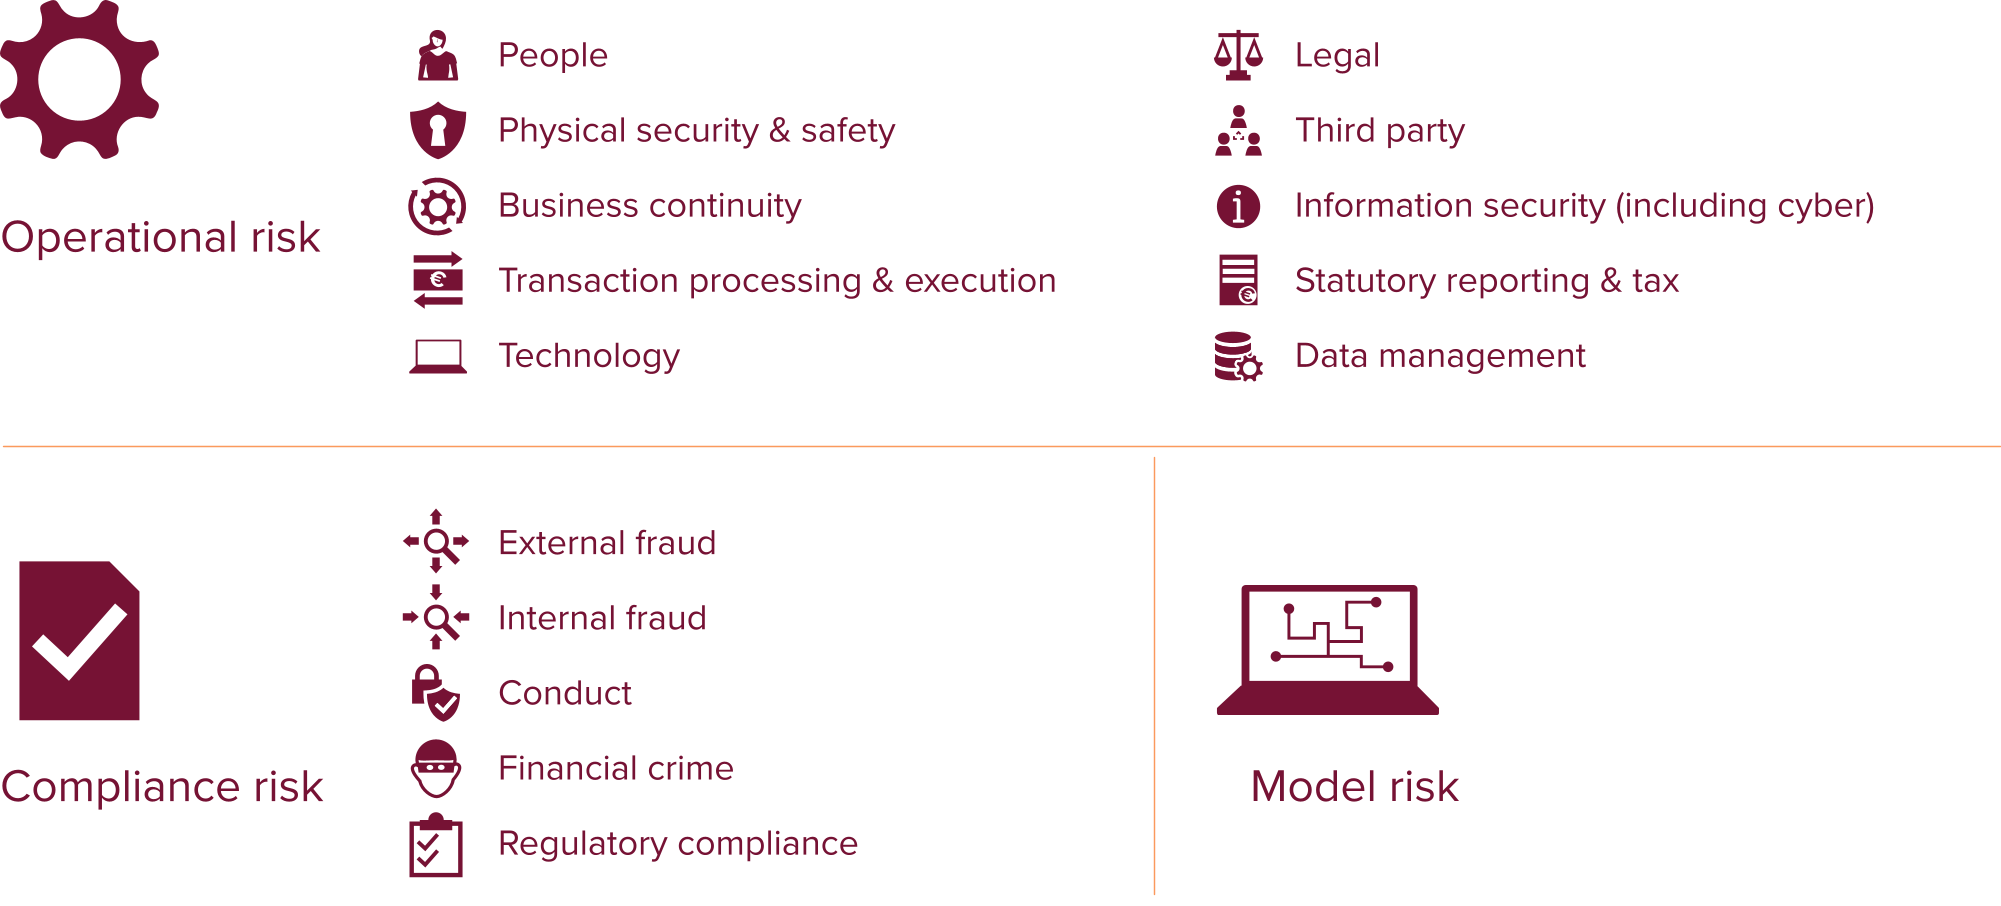
Operational risk is the risk of loss resulting from inadequate or failed internal processes, people and systems, external events, and conduct-related factors that could impact an organisation's operations, compliance, reputation, or strategic objectives.
Compliance risk is the risk that the bank (or one of its subsidiaries) does not or insufficiently comply with the (ratio of) applicable legislation and additional rules, self-regulation rules, codes of conduct including related internal policies, with the possible consequence of criminal or regulatory enforcement, sanctions, material financial loss or reputational damage.
Model risk is the risk that the use of models has a negative impact on society, the customers, employees of the bank, or the financial position of the bank. Model risk arises from errors in the development, implementation, use, or interpretation of models, leading to inaccurate, incompliant, or misinterpreted model output.
Management and control
Operational risk management aims to minimise operational losses at reasonable cost while meeting regulatory requirements, with risk appetite and supporting risk indicators captured in the Risk Appetite Statement (RAS).
Operational risk governance is anchored in the three lines model: the business owns and manages risks and controls; the independent risk management and compliance functions set the frameworks, advise, monitor and challenge; and the internal audit function independently assesses the effectiveness of the first and second line.
The Executive Board (ExBo) is ultimately responsible for managing and controlling non-financial risks. The Supervisory Board (SB) supervises, advises, challenges and supports the ExBo in its management of non-financial risks, specifically via the Risk & Compliance Committee (R&CC). ASN Bank has a risk taxonomy and related controls in place to identify, closely monitor and report on the risks. The non-financial risk committee (NFRC) reviews and assesses non-financial risks monthly, based on ASN Bank's risk appetite. Further oversight committees are described in the Section Risk governance.
For Pillar 1 capital purposes, operational risk requirements are calculated using the standardised approach. The outcome provides input to the internal capital adequacy assessment process (ICAAP). For ongoing measurement and management, ASN Bank uses a risk control framework to monitor control effectiveness, evaluates and monitors issues and incidents, and applies (key) risk indicators (KRIs) to measure exposures against appetite.
In the first half of 2025, the CRO domain completed a 2nd line improvement programme, which resulted in enhanced risk management framework and processes (e.g. policies, risk appetite process, integrated risk reporting).
Operational risk
For operational risk, the most important sub-risks and developments of 2025 are highlighted below, specifically: people risk, technology, information security and data management risks, as well as third party risks. ASN Bank acts on the other risk types in line with the Risk Management Framework (RMF) of the bank.
People risk
People risk is the risk of breaching employment legislation, mismanaging employee relations, and failing to ensure a safe work environment.
To deliver on our strategy, ASN Bank strives to have the right workforce with appropriate skills at the right time. may impact employee morale and create uncertainty, potentially leading to higher turnover, reduced productivity, and recruitment challenges. Our ongoing transformation is expected to impact the working environment and employee morale, potentially leading to higher turnover, higher absenteeism, lower productivity, loss of key people, and insufficient inflow of capable staff. This is also reflected in our absenteeism figures, which were 5.6% in 2025, up from 5.4% in 2024. Given that the transformation may put additional pressure on absenteeism due to job insecurity and difficulties coping with change, this will require close attention in the period ahead.
For more information, see the Section Own workforce in the Sustainability statements in the Annual Report 2025.
Technology risk
Technology risk is the risk associated with the failure or outage of systems, including hardware, software and networks.
With rapid digitalisation, AI, automation and cloud developments, ASN Bank is modernising applications and infrastructure based on our strategic IT roadmap. The migration towards one ASN Bank brand accelerated this strategy, focusing on technology best practices and specific risk mitigation projects. ASN Bank must adapt to the continuously changing digital world while providing availability and continuity of applications and services, including those from external vendors. In 2025, we focused on continuous execution and improvements of incident and change management processes to maximise systems availability.
Due to ASN Bank's focus on IT outsourcing, there is substantial dependency on third-party risk management, which requires further maturation. To reduce technology risks, we phased out end-of-life applications and are modernising our infrastructure. Technology risk is monitored through a newly introduced KRI, increasing awareness and senior management involvement in risk mitigation.
Information security risk
Information Security Risk is the risk of information security incidents, including the loss, theft or misuse of data / information (this covers all types of data).
Cybercriminals are becoming more sophisticated through Ransomware-as-a-Service, and generative AI developments. Their focus has expanded from direct financial services attacks to critical infrastructure, indirectly impacting customer services.
Senior management conducted a deep-dive on information security risk in 2025 and concluded that cybersecurity needs to be a fundamental part of ASN Bank's strategy, addressing geopolitical threats, ransomware attacks, supply chain risks, DDoS attacks, and regulatory pressure. Success requires a security-first culture.
Current developments require strengthened cyber resilience which is actively enforced by the Digital Operational Resilience Act (DORA), which is incorporated into ASN Bank's policies and controls. ASN Bank invests in employee awareness as our human firewall through ongoing programmes including phishing campaigns with micro trainings, risk awareness days, and dedicated cybersecurity month activities. These initiatives strengthen our corporate security culture and mindset.
Data management risk
Data management risk is the risk of failing to appropriately manage and maintain all types of data, including customer data, employee data, and the organisation’s proprietary data.
2025 marked the start of building upon 2024's foundational work while managing the bank-wide transformation impact. We strengthened data organisation by appointing a Chief Data Officer.
On the business side, we embedded data management capabilities in the new organisation. Data domains were revised to fit ASN Bank's new organisational structure. Data stewards for each domain were appointed as full-time positions, reflecting the importance of this function.
Our BCBS239 programme focuses on ensuring control over the data we process, including data lineage challenges, making sure that all data risks are managed in conformity with risk data aggregation and risk reporting (RDARR) principles. Across all data management capabilities and more, the BCBS239 programme is executed according to a detailed action plan.
Third-party risk
Third-party risk is the risk of failing to manage third party relationships and risks appropriately, for example, not taking reasonable steps to identify and mitigate additional operational risks resulting from the outsourcing of services or functions.
In 2025, ASN Bank continued strengthening its management of third-party and outsourcing risks, aligning with industry standards and European regulations. The bank ensures compliance with EBA guidelines on outsourcing arrangements and has incorporated Digital Operational Resilience Act (DORA) requirements into its policies and processes. Contract management is centralised to improve oversight of critical outsourcing arrangements, with risk analyses and due diligence conducted for all outsourcing contracts.
Compliance risk
We define compliance risk as the risk that ASN Bank fails to comply with laws, or the spirit of any such laws, additional regulations, self-regulation and any relevant codes of conduct.
The compliance function continuously monitors compliance with laws, regulations and internal policies. The taxonomy of compliance risk distinguishes five sub-risks:
External fraud risk
Internal fraud risk
Conduct risk
Financial crime risk
Regulatory compliance risk
We ensure better identification and management of compliance risks by means of tools, such as regulatory technology, compliance management dashboards and new privacy tooling.
The bank conducted an ESG materiality assessment in 2025; the results for compliance risk are included in the Section Sustainability risk.
Below, we describe the most important compliance risk-related developments in 2025.
External fraud risk
External fraud is fraud attempted or perpetrated against the organisation by an external party (i.e. a party without a direct relationship to the financial institution) without the involvement of an employee or affiliate of the organisation.
Fraud has a significant impact on society. It erodes trust in financial systems and causes personal and financial hardship for victims. Managing fraud risks is recognised by ASN Bank as an important area of attention. There are no indicators that the financial impact for fraud is high, and the control framework is currently being improved.
Fraud committed by external third parties was present in 2025. The primary method of external fraud in payment transactions observed by ASN Bank involved scams where individuals impersonate others, often with the intention of gaining trust and deceiving victims. Three main types were observed
Bank helpdesk fraud: external fraudsters impersonate bank employees to obtain customer data or execute transactions. In 2025, damages were increasingly recovered from money mules.
Investment fraud: external parties offer false investment opportunities to deceive victims.
Dating fraud: external fraudsters use dating platforms to mislead victims into transferring money.
As fraudsters continually adapt their methods, ASN Bank continues to invest in security measures to reduce the risk of customers becoming victims of external fraud. Key measures include customer awareness campaigns, advanced monitoring and detection systems to recognise fraud patterns, and collaboration with other financial institutions and public entities to exchange information on trends and developments.
ASN Bank actively advocates for legislative improvements, including lobbying politicians for enhanced information exchange capabilities and working with the Ministry of Justice and Security to reduce online crime. Additionally, we collaborate with the Dutch Banking Association to monitor AI-related fraud trends and respond swiftly to protect customers.
In addition to external fraud, ASN Bank again observed mortgage fraud in applications during 2025. This constitutes first party fraud, typically involving applicants providing false information such as manipulated pay slips, falsified bank statements, or incorrect asset declarations to obtain mortgages.
The most common cases involved fraud with income statements and concealment of unregistered debts, such as student loans. ASN Bank continued dialogue with industry associations to improve regulations, including lobbying for enhanced income verification through government sources and exploring expanded information sharing from police investigations.
In 2026, we will continue collaborating with public and private organisations to address upcoming legislation, monitor developments, and enhance our resilience against fraud through improved infrastructure and awareness programs.
Internal fraud risk
Internal fraud is fraud attempted or perpetrated by an internal party (or parties) against the organisation, i.e. an employee or affiliate of the organisation, including instances where an employee is acting in collusion with external parties.
ASN Bank remains committed to protecting its organisation from internal threats and continually invests in strengthening its preventive, detective, and responsive measures. A key development in 2025 was the enhancement of employee screening quality by revising policies and conducting quality audits with suppliers, which further reinforces our ability to identify potential risks early in the process. Through these ongoing efforts, ASN Bank contributes to maintaining a safe and reliable business operation.
Conduct risk
Ethical business conduct is fundamental to ASN Bank’s strategy and essential for maintaining customer trust and a sound risk culture. Conduct risk management is embedded in our risk policies and processes, including the investigation and follow‑up of concerns related to complaints, misconduct or conflicts of interest.
In 2025, we strengthened our approach to the management of conduct risk. We launched the updated Code of Conduct and carried out awareness activities to support ethical behaviour and responsible decision-making. We also encouraged reporting by clarifying how concerns can be raised and by collecting feedback from reporters to improve our SpeakUp processes.
Since establishing the SpeakUp whistleblowing desk in 2024, we have seen an increase in external reports, which has supported our efforts to reinforce integrity safeguards.
To further grow a strong and transparent risk culture, we introduced several organisation-wide initiatives, including enhanced leadership profiles, whole‑system‑in‑the‑room sessions, dilemma workshops, and keynote sessions on ethical decision-making and risk culture. These initiatives support employees in recognising, discussing, and addressing ethical issues, contributing to more structured and consistent behaviour across the organisation.
Conduct risk activities are supported by robust governance structures, including the Ethics Committee, which provides advice on ethical issues and addresses significant normative questions. The Committee consists of members from the Executive Board, senior management, the Works Council, and first‑ and second‑line functions.
In 2026, we will continue these initiatives to further strengthen conduct risk management and deepen our values‑driven risk culture.
Financial crime risk - Anti-financial crime (KYC)
See the Section Anti-financial crime in the Sustainability statements in the Annual Report 2025 for disclosures on AFC.
Privacy
ASN Bank is continuously monitoring, following up and improving its maturity level of being compliant with the privacy regulations protecting the privacy of customers, employees and other relevant stakeholders. During 2025, ASN Bank increased overall maturity in the privacy risk area but is not sufficient mature yet. Progress is made on level of maturity of the Record of Processing Activities (RoPA), Data Protection Impact Assessments (DPIA), Transfer Impact Assessments (TIA) and Legitimate Interest Assessment (LIA). These privacy risk deliverables provide important insights into sensitive processing activities and privacy risks within the bank, which are addressed and followed accordingly. Privacy risk maturity was also strengthened by several awareness and training initiatives such as 'Week of Privacy', mandatory privacy e-learning courses and multiple presentations on privacy related topics (e.g. privacy vs Artificial Intelligence (AI), How to protect your personal data, etc.). Improvement is needed on the implementation of retention term and data quality.
From an outside-in perspective, ASN Bank continuously monitors technological (AI) and societal developments regarding the processing of personal data. We continue to monitor privacy developments because of court decisions, guidelines, sanctions, and fines announced by supervisory authorities. In particular, we took notice of developments relating to the transfer of personal data to countries outside of the European Economic Area (EEA) and the stricter interpretations of the legal grounds for processing activities with respect to consent and legitimate interests. Internally, the Data Protection Officer and the Privacy Office are focusing on systems with integrated AI capabilities and how personal data is being processed.
Regulatory compliance risk
Regulatory compliance risk is defined as the failure to comply with any legal or regulatory obligations that are not captured through other non-financial risks. Amongst others, this risk arises from failure to prepare and respond to regulatory change adequately. This definition ensures comprehensive coverage of our regulatory landscape while maintaining clear boundaries within our risk management framework. Managing regulatory compliance risk is also about protecting our customers, maintaining their trust, and protecting the broader financial system we operate. Our comprehensive approach enables us to anticipate, assess, and implement regulatory requirements in a timely and demonstrable manner and maintaining ongoing demonstrable compliance.
A range of activities contributed to managing the regulatory compliance risk in 2025. The regulatory change management process for implementing new laws and regulations within ASN Bank was evaluated and improved. A key result is the establishment of a Regulatory Change Board, mandated by the Executive Board to maintain central oversight of timely and demonstrable compliance with new or changing laws and regulations affecting ASN Bank. In addition, the way of working and ownership for implementation of cross-departmental laws and regulations was improved, which is expected to have a positive effect on legal and compliance risk. Work continues in 2026 to operationalise the new process and additionally, tooling is being developed.
ASN Bank's regulatory radar process was evaluated in 2025. Several improvements have been adapted, such as input for the implementation of cross-departmental laws and regulations and ownership, which are expected to have a positive effect on legal and compliance risk.
Model risk
Model risk is the risk that the use of models has a negative impact on society, customers, employees of the bank, or the financial position of the bank. Model risk arises from errors in the development, implementation, use, or interpretation of models, leading to inaccurate, non-compliant, or misinterpreted model output.
Model risk governance and maintenance are an ongoing process involving many discussions and iterations with the ECB, DNB and the JST. We have paid considerable attention to improving compliance with regulatory capital and provisions-related regulations, especially with respect to the residential mortgage portfolio.
The active model versions (including those for regulatory capital and the IFRS 9 provisioning for our residential mortgages) are part of our internal ongoing validation cycle in accordance with regulatory requirements and internal policies. In December 2025, model risk remains outside our risk appetite, as further improvement is required on key aspects such as data, IT infrastructure and (credit) processes, as well as in the implementation of the newly approved model risk management framework. To sufficiently mitigate this model risk in our regulatory capital model we continue to hold additional capital (a self-imposed capital add-on, SIA) with clear focus on strengthening our management and use of models.
In 2025, we have finalised the new iteration of our regulatory capital models and provisioning models for our residential mortgage portfolio. The regulatory capital models are currently undergoing a supervisory approval process. The IFRS 9 ECL model was upgraded and internally approved, for more information, see the Section Provisioning methodology.
Credit risk
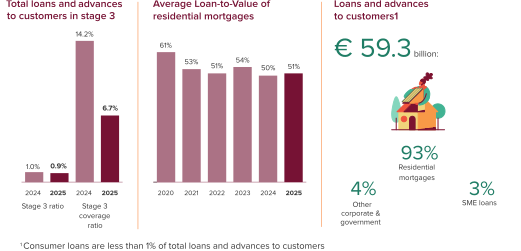
At ASN Bank, we define credit risk as ‘the risk that the bank suffers a financial loss or a material decrease in solvency due to the fact that a borrower or counterparty does not meet the financial or other contractual obligations to the bank, or due to a significant deterioration of the creditworthiness of a specific borrower or counterparty’.
The material credit risks identified in our risk taxonomy are:
Credit default risk: the risk that the obligor to a unilateral credit exposure could default before the final settlement of all financial obligations.
Credit concentration risk: the risk that is related to the degree of diversification in the credit portfolio. Relevant concentration risks that the bank considers are single name, industry, product and geographic concentration. The latter subcategory replaces a more general country concentration classification as the banks strategic focus on the Netherlands leads to an automatic and consciously taken concentration risk.
Counterparty credit risk: the risk that the counterparty to a transaction could default before the final settlement of the transaction's cash flows. CCR creates a bilateral risk of loss: the market value of the transaction can be positive or negative to either counterparty to the transaction.
Country risk: the risk that economic, political or other developments in a country have an adverse effect on the ability of counterparties located in that country to fulfil their obligations towards the bank.
Regarding credit risk, ASN Bank has a low-to-medium risk appetite. ASN Bank has a strong focus on the Dutch market and primarily provides collateralised loans (residential mortgages).
ASN Bank conducted an ESG materiality assessment in 2025; the results for credit risk are included in the Section Sustainability risk.
Credit risk exposures (Audited)
ASN Bank is concentrated in residential mortgage loans in the Netherlands. The Dutch residential mortgage market is considered a low-risk segment. Other loan portfolios on the balance sheet, much smaller in size, are:
Other retail loans: consumer loans including credit facilities and personal loans
SME loans, largely consisting of mortgage-backed loans
Other corporate and government loans, consisting of:
Sustainable finance loans
Private placement loans
We make a distinction between secured and unsecured loans. Secured loans are collateralised by a mortgage on residential or business property. Sometimes loans are reinforced by a guarantee, like the National Mortgage Guarantee (NHG) or a government guarantee. Unsecured loans are overdraft facilities and personal loans for retail customers.
Exposures on financial institutions, governments or large corporates are used for managing the Banking Book. ASN Bank has policies in place that address the magnitude of such exposures and the reliability of counterparties (e.g. external ratings), to avoid excessive losses if a counterparty can no longer meet its obligations.
Management and control (Audited)
ASN Bank has a comprehensive credit risk monitoring framework, allowing it to monitor, analyse and manage the credit risk in relation to the risk appetite.
We have developed a framework to actively monitor concentration risks within the portfolios. As part of credit risk management, we internally assess and monitor the credit standing of our customers i.e. borrowers or counterparties. In this process we estimate the probability of our customers being unable to meet their contractual payment obligations arising from the loan agreement, as such inability could result in a potential financial loss for the bank. Monitoring takes place throughout the distinct phases of the Credit Life Cycle.
We use specific criteria to allocate customers and loans to a particular portfolio. At portfolio level, we steer the risk by defining the desired credit quality of new and existing loans. We monitor the actual development of the credit quality and, if necessary, take corrective measures if a deviation from the risk appetite is about to occur.
To ensure effective monitoring and the timely implementation of mitigating actions, ASN Bank draws up credit risk reports. The responsibility for credit risk reporting lies with the first and second lines, respectively the business unit and risk management. The first line monitors portfolio developments to keep the risk within the risk appetite. The second line develops credit risk reports, which provide comprehensive insight into the level of credit risk and give a timely and forward looking warning when the quality of the portfolio deteriorates.
The credit risk reports are periodically submitted to the Credit Committee, the ExBo and the Risk and Compliance Committee of the Supervisory Board.
Preventive management and arrears management (Audited)
ASN Bank prioritises customer trust for long-term relationships. When we have concerns regarding retail customer's ability to meet its obligations in accordance with the agreed terms, we contact them to assess solutions: we can offer financial coaching or potentially offer a solution that is within the commercial mandate. If this is not feasible, Collections & Recovery (C&R) steps in. This department manages customers with financial difficulties regarding mortgages, private loans, current accounts or SME loans. C&R can arrange a visit to discuss the customer's financial difficulties. Based on a customer assessment, a modification of the loan can be agreed upon (a forbearance measure) or C&R supports the customer to sell the collateral and foreclose the loan. ASN Bank avoids debt collection agencies and only engages the services of a bailiff if no long-term solution can be agreed upon.
For Other corporate and government loans, ASN Bank responds promptly when customers either notify us of expected financial difficulties or display signs of financial distress. Together with the customer and supported by external expertise, we explore the options to make the business financially resilient again. If necessary a forbearance measure, but if restructuring proves impossible, we support the customer in selling the collateral and unwinding the loan.
Risk profile
Over the past years the credit risk of ASN Bank’s portfolios decreased due to the strong economic situation of the Netherlands. The unemployment rate is low, salaries increased, house prices increased, and the customer interest rates are favourable. As a result the number of customers in arrears or in default remains low. Portfolio developments are in line with ASN Bank’s strategy to increase market share and fit well within the risk appetite of the bank.
Also throughout 2025, interest-only mortgages had our continued attention. We explored additional de-risking measures for interest-only mortgages in the Netherlands. ASN Bank implemented processes to gather information on customers' intention to repay their interest-only mortgage and the affordability of the mortgage at maturity, aligning with ECB guidance. These measures may result in further scrutiny of the future loan volume development, impairment charges and capital.
For Other corporate and government loans, ASN Bank faced a deteriorated financial situation of multiple Sustainable Finance loans. Besides the windmill parks and solar energy parks, ASN Bank also invested in several innovative projects for which the business cases appeared to be less sound than initially projected at origination. ASN Bank placed selected loans on the watchlist and holds higher individually determined provisions for these loans. In 2025, a non-performing loan with a significant exposure was unwound. ASN Bank will continue to closely and actively manage this portfolio from a risk perspective. ASN Bank held appropriate credit provisions for the problem loans during 2025.
The risk profiles for SME loans, Other retail loans and Private placement loans did not significantly change throughout 2025. The portfolio volumes grew only slightly in 2025, the loan sizes are small, and these portfolios are both in absolute and relative terms less material on ASN Bank’s balance sheet.
Provisioning methodology (Audited)
Based on IFRS 9 Expected Credit Loss (ECL) models, we estimate the risk of our customers running into financial difficulties on a monthly basis. Details of how loan loss provisions are determined are set out in this section.
Under IFRS 9, ASN Bank creates a provision for expected credit losses for each customer with a loan or credit facility. This provision also includes expected losses on loan commitments and financial guarantee contracts, known as ‘off-balance sheet commitments’.
At ASN Bank, we distinguish the following specific loan portfolios for which we determine loan loss provisions:
Residential mortgages;
Consumer loans;
SME loans;
Sustainable finance loans and private placement loans (included in Other commercial and government loans);
Financial Markets portfolio (included in Other commercial and government loans, Investments and Loans and advances to banks).
ASN Bank uses a specific IFRS 9 model for every portfolio to establish customers’ creditworthiness and the Expected Credit Loss (ECL). The ECL models are Point-In-Time (PIT) and forward-looking, which means that, at every reporting date, they calculate the ECL for every loan in the portfolio based on internal predictions of the present economic situation in three scenarios (base, up and down), with every scenario being assigned a probability of occurrence. The ECL outcomes of these three scenarios are probability-weighted to arrive at a final ECL estimate. Depending on the credit stage classification, either a weighted 12-month ECL (for Stage 1 assets) or a weighted lifetime ECL (for Stage 2 and Stage 3 assets) is calculated.
In 2025, we implemented an update of our IFRS 9 Expected Credit Loss (ECL) model for residential mortgages. The new model shows lower expected credit losses (ECL) compared to the previous model, primarily because of lower loss given default (LGD) rates driven by positive house price developments, methodological improvements in modelling and the incorporation of more recent and enhanced data. All in all, this had a decreasing impact of € 18 million on the provision for credit losses as at 31 December 2025.
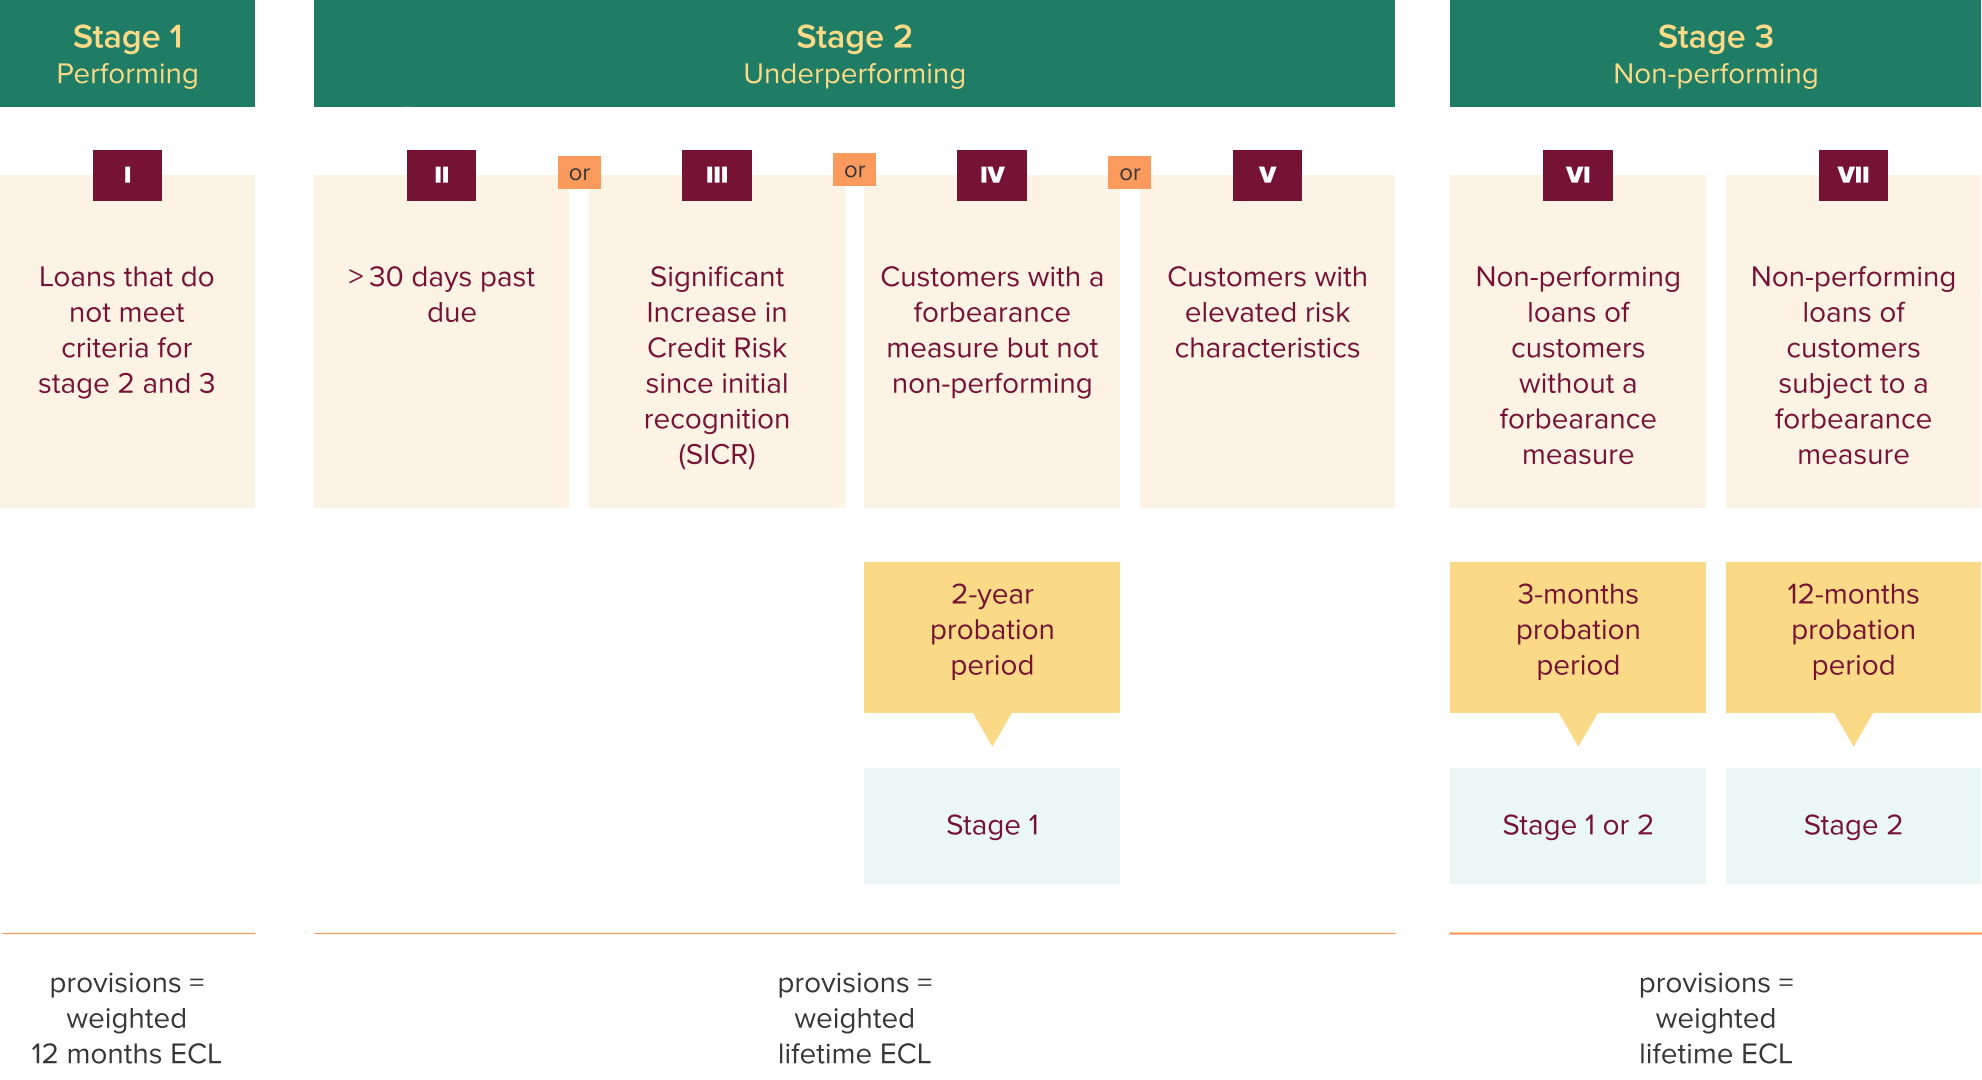
IFRS 9 includes three stages reflecting how the credit risk of an exposure may develop over time compared with the date of origination. The stages are decisive for the calculation method and the amount of the provision to be made. The IFRS 9 stage allocation process within ASN Bank is presented in the diagram above.
Stage 1 includes customers with loans that have shown no significant increase in credit risk since the origination date. For these customers, we create a provision for ECL in the next 12 months.
We create a provision for stage 2 customers based on losses expected until maturity (lifetime ECL). A customer is included in stage 2 if at least one of the following conditions applies:
A customer is in arrears if the interest payment and/or redemption amount are past due one day after the agreed payment date (monthly payment arrangement) and exceed a threshold value. When a customer is past due for more than 30 days, the loan is transferred to stage 2.
For each individual portfolio, the ECL models determine when a customer's credit rating is subject to significant deterioration (Significant Increase in Credit Risk, SICR). For the residential mortgage portfolio this deterioration is assessed by comparing the current lifetime Probability of Default (PD) with the lifetime PD assigned to the loan part on the origination date. If the difference between the two exceeds a pre-defined threshold, the lifetime PD is considered to have significantly deteriorated, the customer is allocated to stage 2. If the lifetime PD subsequently improves, the customer may be transferred back to stage 1, keeping the threshold in mind.
For the other loan portfolios, a significant deterioration in credit risk is assessed as follows:
In the SICR model for SME loans, customers are classified into PD buckets according to their individual credit rating calculated on the loan origination date. Depending on the PD bucket, the current credit rating may show a capped deterioration compared with the loan origination date.
Consumer loans are assigned a rating. If this rating exceeds a pre-determined limit, the credit facility is allocated to stage 2.
For the Sustainable Finance portfolio and the private placement loans, we assess whether the current PD shows that pre-determined relative and absolute limits are exceeded compared with the PD on the loan origination date. If this is the case, the loan is allocated to stage 2.
For the exposures in the Financial Markets portfolio, the current external credit rating and PD are used to assess whether there is a significant deterioration relative to the external credit rating and the PD upon initial recognition of the bond or loan. If pre-determined relative and absolute limits are exceeded, the bond or loan is allocated to stage 2.
Customers who have been subjected to a forbearance measure and who do not meet the prudential non-performing criteria are allocated to stage 2. This category consists of:
1) customers who are subject to a forbearance measure but who have not yet been classified as non-performing, and
2) customers who were previously part of the prudential non-performing forborne category (category VII) and were reclassified to the prudential performing forborne category after a probation period of at least one year.
Following a minimum probation period of two years, a customer is allocated to stage 1.
This category includes three types of customers with specific risk characteristics:
Specific interest-only customers
Customers with loans Purchased or Originated Credit Impaired (POCI)
Customers that are on the watchlist as part of the Early Warning System (EWS) of ASN Bank.
ASN Bank pays specific attention to retail customers with full or partial interest-only mortgage loans.
Mortgage loans with:
High expected Loan-to-Value (LtV),
High Loan-to-Income (LtI) and
Nearing maturity, retirement of the borrower or the end of tax deductibility of interest payments (i.e. time-to-event) carry a higher potential risk as an affordability and/or repayment problem may arise when these events occur.
These three variables are used to distribute interest-only mortgage loans over multiple risk segments. Depending on the risk segment a collective SICR trigger is applied. In addition, future affordability information is available from an increasing number of customers as part of our customer contact strategy. The information from this affordability test is taken into account in the provisioning methodology and used to determine whether individual customer should be classified as underperforming (stage 2).
POCI customers have at least one asset that has been purchased or originated credit impaired. As ASN Bank considers that these customers have a higher risk profile and the accounting treatment for POCI assets is dependent on lifetime ECL, the customers will remain in stage 2.
The EWS framework consists of a two-tier approach. An early warning list is maintained to register and monitor all customers that triggered one or more early warning indicators that require closer investigation regarding credit quality deterioration. The second tier is the watchlist, which is aimed at customers that are deemed to have a deteriorating credit quality. Once a customer is on the watchlist a stage 2 transfer will apply.
If a customer is credit impaired, the loans provided are considered non-performing and allocated to stage 3. The provision is created based on losses expected until maturity (lifetime ECL). A loan is credit impaired in the following situations:
ASN Bank applies a specific definition of default to every portfolio for which loan loss provisions have to be determined. A default is considered to occur if at least one of the following conditions is met:
the obligor is past due for more than 90 days on any material credit obligation, and/or
the obligor is considered unlikely-to-pay (UtP).
Examples of these UtP triggers are the following:
suspension of payment
bankruptcy
fraud
sale of the collateral by the Arrears Management department
sale of the collateral with a residual debt
Customers only recover from the default status once the arrears have been repaid in full or the UtP triggers have lapsed, and a three-month probation period has expired.
In addition, loans to customers - who are subject to a forbearance measure and who meet the prudential non-performing criteria - are allocated to stage 3. This is the case for forborne loans that were transferred to stage 2 after a one-year probation period in stage 3 and receive a new forbearance measure and/or later fall into arrears of 30 days. Customers in this category are in default due to a UTP trigger.
We calculate the various risks in the aforementioned portfolios at customer level on a monthly basis by means of our credit risk models. Monitoring the development of the customer and the portfolio is essential if we are to make proper estimates of the loss expected. We have provisions in place for expected losses and we maintain capital for unexpected credit losses.
We use various techniques for the individual portfolios to arrive at the ECL models.
We use the survival model technique for the residential mortgages, SME loans, sustainable finance loans and private placement loans. The survival model technique is a method for calculating the month-on-month Probability of Default (PD), Probability of Cure and Probability of Foreclosure. These models determine the creditworthiness of the customer over two periods: 1) a 12-month period; i.e. we calculate the probability of the customer defaulting on payments in the next 12 months (also known as the ‘12-month PD’), and 2) the remaining term of the loan; i.e. we calculate the probability of the customer defaulting on payments at any time during the remaining term of the loan (also known as the ‘lifetime PD’).
The total expected credit loss (ECL) is determined by customers' Probability of Default (PD), Loss Given Default (LGD) and Exposure at Default (EAD), taking into account a discount rate.
We apply an expert-based model to determine stage allocation and provisioning for consumer loans, consisting of personal loans and accounts, revolving credit and overdraft facilities (credit limits on current accounts). The model calculates an individual PD at loan or account level and ranks consumer contracts from low to high risk based on risk parameters. These risk parameters include the registered arrears, use of the limit available and the date of origination. Contracts are then allocated to stages based on their credit ranking (rating). We use historical observations (default rates) to set an average PD for each stage, and the LGD is a result of the expert judgement based on historical data. We determine the ECL by multiplying the stage-dependent PD and product-specific LGD by the amount of the credit facility.
For the ECL of the Financial Markets portfolio, we use a model in which the PD is derived from spreads on Credit Default Swap (CDS) curves. Specific CDS curves have been selected for various portfolio components. The ECL is the sum of the cumulative PDs multiplied by the cumulative discounted cashflows multiplied by the LGD factor. The ECL stage migration for underperforming financial instruments is based on numerical as well as qualitative triggers, such as significant increases in PD as well as three-notch credit rating downgrades. These credit ratings originate from well-known rating agencies such as S&P and Moody’s.
We use three scenarios in our provisions calculations, in which we also make forward-looking information available. The three scenarios describe the expected macroeconomic forecast (baseline scenario) as well as a downside and upside development. An independent team of macroeconomic experts defines forward-looking trends based on input from a third-party provider for each scenario. In making these estimates, these experts also look at trends and forecasts of external parties, such as Eurostat, Statistics Netherlands (CBS) and the Netherlands Bureau for Economic Policy Analysis (CPB). All three scenarios describe a realistic development of the macroeconomy.
Weights are assigned to the scenarios based on the methodology of the third-party provider. The development of macroeconomic parameters is predicted thirty years ahead.
A 12-month ECL and a lifetime ECL are calculated for each of the three scenarios and for each customer, on a monthly basis. The scenario weights are used to calculate a weighted average 12-month ECL and a lifetime ECL.
For residential mortgages, we use the following macroeconomic parameters: the relative change in house prices i.e. the house price index, and the unemployment rate. For SME loans, we use the unemployment rate and the number of bankruptcies. In the model for consumer loans, we only use the unemployment rate as a macroeconomic parameter. All macroeconomic parameters of the ECL models for residential mortgages, consumer loans and SME loans are related to the developments in the Netherlands. In the ECL model for Financial Markets, the Sustainable Finance portfolio and for private placements, the macroeconomic impact is incorporated in the CDS curves used.
Scenarios and their weights are reviewed quarterly and adjusted as needed. Following challenge by first and second line experts, including second line ESG and credit risk specialists, the Asset and Liability Committee (ALCO) approves both scenarios and weights. The scenarios that are used to determine the provisions are also used to draw up our Financial Plan & Budget.
The parameters used in the three scenarios are presented in the Section Sensitivity analyses in the Annual Report 2025.
Loans and debt securities are written off (either partially or in full) when there is no reasonable expectation of recovery and/or collectability of amounts due. When writing off a loan, we make a distinction between the waiver of amounts due and the write-off of a residual debt. The following is a description of these terms:
Waiver of amounts due: a loan is written off, in full or in part if the waiver of amounts payable leads to the customer's recovery. The consequence of this is that the customer can meet his or her payment obligations again. Waivers of amounts payable are debited to the credit provision;
Write-off of residual debt: there may be a residual debt as a result of a recovery process. This residual debt is fully provisioned for. Any collateral is realised during a period of 6 months after the execution process. After this period, any remaining debt is written off.
We apply a management overlay when credit-related dynamics, such as in the macroeconomic environment, are not sufficiently captured in our credit risk models. We review the elements of the management overlay at least every quarter as part of the credit risk governance process.
As at year-end 2025, a management overlay in the amount of € 34 million was in place for residential mortgages. For more information, please refer to the Section Additional credit risk information - Management overlay in the Annual Report 2025.
To determine capital requirements for credit risk of residential mortgages, ASN Bank uses the Advanced Internal Ratings-based (AIRB) approach. The AIRB approach measures credit risk by using internal models for the calculation of PD and LGD.
For the other exposures, risk-weighted assets are determined according to the Standardised Approach (SA).
As from 31 December 2021, we have implemented a uniform definition of default (DoD) for all credit exposures, which is aligned to Capital Requirements Regulation (CRR) Article 178. A default is considered to occur if at least one of the following conditions is met:
the obligor is past due for more than 90 days on any material credit obligation and/or;
the obligor is considered unlikely-to-pay (UtP).
Additional credit risk information
The following table presents the credit risk exposure based on the Exposure at Default (EAD) from the regulatory report (see also the Section Capital management - Risk-weighted assets). The provisions have been deducted from the receivables, but any collateral or other credit risk mitigating instruments have been disregarded.
The maximum exposure to credit risk increased over the course of 2025 from € 77.7 billion to € 81.7 billion. Representing 77% of the total, the loans and advances to customers category is the largest on the balance sheet. Therefore, in order to provide a meaningful view of the credit risk of our loan portfolio, the remainder of this section mainly relates to the loans and advances to customers. For more information on the other financial assets, please refer to the Notes to the consolidated financial statements.
in € millions | 2025 | 2024 | ||||
|---|---|---|---|---|---|---|
Gross | Provision | Book | Gross | Provision | Book | |
Cash and balances at central banks | 1,178 | -- | 1,178 | 2,834 | -- | 2,834 |
Derivatives | 1,789 | -- | 1,789 | 2,141 | -- | 2,141 |
Investments | 6,815 | -6 | 6,809 | 7,206 | -7 | 7,199 |
Loans and advances to banks | 7,325 | -2 | 7,323 | 6,713 | -3 | 6,710 |
Loans and advances to customers | 59,257 | -85 | 59,172 | 54,636 | -142 | 54,494 |
Other assets | 342 | -- | 342 | 247 | -- | 247 |
Total financial assets | 76,706 | -93 | 76,613 | 73,777 | -152 | 73,625 |
IFRS fair value adjustments1 | 1,537 | 1,537 | 1,088 | 1,088 | ||
Total items not subject to credit risk exposure | 1,537 | 1,537 | 1,088 | 1,088 | ||
On-balance sheet exposure to credit risk (IFRS) | 78,243 | -93 | 78,150 | 74,865 | -152 | 74,713 |
Loan commitments given | 3,585 | -4 | 3,581 | 3,041 | -8 | 3,033 |
Financial guarantees given | 2 | -- | 2 | 3 | -- | 3 |
Off-balance sheet exposure to credit risk (IFRS) | 3,587 | -4 | 3,583 | 3,044 | -8 | 3,036 |
Maximum exposure to credit risk | 81,830 | -97 | 81,733 | 77,909 | -160 | 77,749 |
Other assets2 | 51 | -- | 51 | 66 | -- | 66 |
Valuation adjustments3 | -1,230 | -1,755 | ||||
Recalculation off-balance credit facilities and guarantees to EAD4 | -1,921 | -571 | ||||
Adjustment for AIRB provisions | 53 | 80 | ||||
Other differences | -- | -10 | ||||
Total Exposures at Default | 78,686 | 75,559 | ||||
Credit risk RWA/Total Exposure at Default | 23.2% | 19.7% | ||||
- Consist of fair value adjustments from hedge accounting and amortisations.
- Assets that are not subject to ECL according to IFRS.
- Consists mainly of the balance of netting derivative positions and an add-on for potential future exposure and credit risk mitigating items (particularly collateral).
- Off-balance sheet commitments are converted into EAD using a conversion factor.
in € millions | 2025 | 2024 | ||||
|---|---|---|---|---|---|---|
Gross carrying amount | Provision for credit losses | Book value | Gross carrying amount | Provision for credit losses | Book value | |
Residential mortgages | 54,9451 | -53 | 54,892 | 50,9151 | -80 | 50,835 |
Consumer loans | 76 | -6 | 70 | 67 | -7 | 60 |
SME loans | 1,541 | -12 | 1,529 | 1,393 | -15 | 1,378 |
Other corporate and government loans | 2,695 | -14 | 2,681 | 2,261 | -40 | 2,221 |
Total loans and advances to customers | 59,257 | -85 | 59,172 | 54,636 | -142 | 54,494 |
Off-balance sheet items | 3,587 | -4 | 3,583 | 3,044 | -8 | 3,036 |
Total on and off-balance sheet items to customers | 62,844 | -89 | 62,755 | 57,680 | -150 | 57,530 |
- Including IFRS value adjustments of € 1,537 million negative (2024: € 1,088 million negative), consisting of fair value adjustments from hedge accounting and amortisations.
Book value in € millions | 2025 | 2024 |
|---|---|---|
The Netherlands | 57,185 | 53,051 |
EMU excl. the Netherlands | 1,654 | 1,005 |
Other | 333 | 438 |
Total | 59,172 | 54,494 |
Loans and advances to customers increased by € 4.7 billion to € 59.2 billion in 2025. This includes the IFRS fair value adjustments from hedge accounting and amortisations of € 1.5 billion negative, which is part of residential mortgages. The fair value adjustments decreased by € 449 million due to increased (long term) interest rates. Excluding the fair value adjustments, total gross loan growth amounted to € 5.1 billion, driven by an increase in residential mortgage loans.
Our gross retail mortgage portfolio excluding the IFRS value adjustments increased by € 4.5 billion to € 56.5 billion (year-end 2024: € 52.0 billion).
In addition, the total gross outstanding amount of SME loans went up by € 148 million to € 1,541 million. Gross other corporate and government loans increased by € 0.4 billion to € 2.7 billion as a result of the bank's cash management.
Slightly narrower credit spreads resulted in a € 1 million release of the provision for loans to banks; the provision for investments also decreased by € 1 million in 2025.
Overall, the credit quality of the total loans and advances to customers remained stable. Loans and advances in arrears as a percentage of total loans increased to 0.8% compared to year-end 2024 (0.6%). The 2025 arrears balances incorporate a refinement to the operational application of the measurement of arrears explaining the year-on-year movement. This refinement was applied as of year-end 2025 and does not have a material impact on prior year ECL or staging. The stage 2 ratio remained stable at 12.3%, while the stage 3 ratio decreased to 0.9% as a result of portfolio growth combined with a stable stage 3 exposure level. In 2025, incurred losses were substantial, largely attributable to a € 33 million write-off in the Sustainable Finance portfolio; incurred losses across other portfolios were negligible.
The provision for credit losses decreased to € 89 million (year-end 2024: € 150 million), mainly driven by lower provisions for the residential mortgages portfolio due to the implementation of an enhanced IFRS 9 Expected Credit Loss (ECL) model and a decrease in the management overlay. The new model shows lower expected credit losses (ECL) compared to the previous model, primarily because of lower loss given default (LGD) rates driven by positive house price developments, methodological improvements in modelling and the incorporation of more recent and enhanced data. Also recoveries in the SME portfolio and the write-off in the Sustainable Finance portfolio contributed to lower provisions for credit losses.
The stage 3 coverage ratio decreased from 14.2% to 6.7%, primarily due to the aforementioned write-off in the Sustainable Finance portfolio (which was almost fully provided for) and reduced stage 3 provisions for residential mortgages resulting from the enhanced model and derecognition of stage 3 loans.
For more details on the provision for credit losses, see the Sections Management overlay and Developments per portfolio below.
At year-end 2025, a management overlay in the amount of € 34 million was in place for residential mortgages. A more detailed description can be found on the next page in the Residential mortgages Section.
| 2025 | 2024 | ||||
|---|---|---|---|---|---|---|
Modelled provision | Management overlay2 | Total provision | Modelled provision | Management overlay2 | Total provision | |
Residential mortgages | 20 | 34 | 54 | 44 | 41 | 85 |
Consumer loans | 8 | -- | 8 | 9 | -- | 9 |
SME loans | 13 | -- | 13 | 16 | -- | 16 |
Other corporate and government loans | 14 | -- | 14 | 40 | -- | 40 |
Total | 55 | 34 | 89 | 109 | 41 | 150 |
- Including the provision for credit losses for off-balance sheet items.
- The management overlay concerns post-model adjustments.
The gross carrying amount on our mortgage portfolio - excluding the IFRS value adjustments1 - increased by € 4.5 billion to € 56.5 billion (year-end 2024: € 52.0 billion). In an expanded mortgage market ASN Bank’s new mortgage production increased to € 10.3 billion (2024: € 7.1 billion). The market share of new mortgages stood at 6.9%, up compared to 2024 (6.3%). 80% of new mortgage production in 2025 consisted of mortgages with a 10-year fixed rate, in line with 2024 (77%). Repayments amounted to € 5.8 billion (2024: € 4.7 billion) and interest rate renewals were € 2.7 billion, up € 1.3 billion compared to 2024.
The weighted average indexed LtV of the residential mortgage portfolio was virtually unchanged compared to year-end 2024 at 51%, as the impact of new originations with higher LtVs were offset by higher house prices.
In 2025, we refined the risk segmentation, including the staging framework for interest-only mortgages. A significant part of the interest-only mortgages previously in scope of the management overlay, has been included in the modelled part of the stage 2 provision. However, for a part of the interest-only exposure in stage 2 (€ 379 million), we calculate the credit loss provision (€ 11 million) using non-performing expected credit loss rates through the management overlay.
In 2025, the credit loss provision declined to € 54 million (2024: € 85 million). This decrease consisted of a € 24 million reduction in the modelled provision to € 20 million, primarily driven by the updated model predicting lower losses than its predecessor and improved house prices, and a € 7 million decrease in the management overlay to € 34 million.
The management overlay for residential mortgages decreased by € 7 million to € 34 million (year-end 2024: € 41 million). This net change reflects three key developments. First, we implemented an enhanced model with improved methodology and performance, resulting in a € 12 million release. Second, we refined the management overlay for the interest-only mortgage portfolio: the composition of this overlay was adjusted, while the total amount remained stable at € 22 million. Furthermore, we retained the management overlay for ESG risks, which identifies physical environmental risks associated with collateral, specifically flood and drought risks in the Netherlands. Finally, we introduced a management overlay of € 5 million for geopolitical risks not captured in the model.
Stage 1 exposure increased from € 44.8 billion to € 48.6 billion due to new originations. Derecognitions increased slightly while transfers from and to stage 1 were in balance. The provision for stage 1 exposures decreased to € 7 million (year-end 2024: € 25 million), primarily due to the staging refinement transferring a part of the interest-only management overlay provision from stage 1 to stage 2. Changes in credit risk and the updated model also contributed to this release. This was partly offset by additions due to new originations.
Stage 2 exposure for residential mortgages increased by € 0.6 billion to € 7.4 billion, primarily driven by a refined SICR methodology as part of the IFRS 9 ECL model redevelopment. The stage 2 provision increased by € 7 million to € 31 million, mainly due to the interest-only management overlay transfer, partly offset by a release of € 4 million for the updated model.
The stage 3 exposure decreased slightly by € 7 million to € 466 million at year-end 2025. The largest release from the model update was recorded in stage 3 (€ 11 million) as the model predicts lower losses and due to positive house price developments. Derecognitions and a lower stage 3 management overlay also contributed to the decrease in stage 3 provisions from € 31 million to € 15 million at year-end 2025. The stage 3 coverage ratio decreased to 3.2% (year-end 2024: 6.6%).
The consumer loan portfolio grew slightly, as our customers were looking for more responsible lending flexibility and we could expand our offering to all customers under one ASN Bank brand.
In 2025, the credit quality of the consumer loan portfolio slightly improved. Stage 3 exposure further decreased as did the exposure for loans and accounts in arrears. The provisions for on- and off-balance sheet items decreased due to the decline in stage 3 exposures.
ASN Bank continues to grow in the micro-sized and small-sized business loans market segment in the Netherlands. As a result, in 2025 our SME loan portfolio grew by € 148 million, from € 1,393 million to € 1,541 million.
The credit loss provision for SME loans declined from € 16 million at year-end 2024 to € 13 million in 2025. Portfolio growth resulted in a slight increase in stage 1 provisions. Stage 3 provisions decreased slightly, as did the stage 3 exposure, resulting in a stable stage 3 coverage ratio. Loans in arrears decreased from € 43 million to € 31 million, with both short-term and long-term arrears improving. In addition, the more positive outlook in the macroeconomic scenario resulted in a reduction of the stage 2 Significant Increase in Credit Risk (SICR) population. Together, this resulted in a release of € 3 million in the stage 2 provisions.
Other corporate and government loans mainly consist of the Sustainable Finance portfolio (€ 1.2 billion), with loans to the sustainable industry, such as solar and wind energy companies, and our Financial Markets portfolio (€ 1.3 billion) through which we provide loans to other financial institutions and central and local governments.
Since early 2025, we have suspended new sustainable finance loan origination, while reviewing our strategy and focus in this area. This will result in a steady decrease in volume due to regular and occasional early full loan repayments. We are currently investigating whether and in what form the portfolio can possibly grow again in the future.
In 2025, the total credit loss provision for other corporate and government loans dropped to € 14 million (year-end 2024: € 40 million), mainly due to a stage 3 Sustainable Finance loan write-off of € 33 million. Despite this write-off, the stage 3 exposure increased to € 53 million, due to corporate loans transferred to stage 3. The coverage ratio dropped from 82.2% to 22.6% at year-end 2025 as the new and remaining stage 3 loans require lower provisioning levels, while the written-off loan was almost fully provided for.
- Consist of fair value adjustments from hedge accounting and amortisations.
in € millions | Residential mortgages | Consumer loans | SME loans | Other corporate and government loans | Total loans | Off-balance sheet items1 | ||||||
|---|---|---|---|---|---|---|---|---|---|---|---|---|
2025 | 2024 | 2025 | 2024 | 2025 | 2024 | 2025 | 2024 | 2025 | 2024 | 2025 | 2024 | |
Opening balance | 80 | 118 | 7 | 8 | 15 | 22 | 40 | 34 | 142 | 182 | 8 | 11 |
Transfer to stage 1 | -4 | -8 | -- | -1 | -4 | -4 | -- | -- | -8 | -13 | -1 | -1 |
Transfer to stage 2 | -1 | -1 | -- | -- | 2 | 4 | -- | -- | 1 | 3 | -- | 1 |
Transfer to stage 3 | 8 | 9 | 1 | 1 | 2 | -- | 9 | 3 | 20 | 13 | -- | -- |
Change in credit risk | -8 | -17 | -- | -- | -2 | -3 | -- | 2 | -10 | -18 | -1 | -3 |
Originated or purchased | 8 | 3 | -- | -- | 2 | 3 | -- | 1 | 10 | 7 | 1 | 2 |
Matured or sold | -8 | -14 | 1 | 1 | -2 | -3 | -2 | -- | -11 | -16 | -- | -1 |
Change in models | -17 | -- | -- | -- | -- | -- | -- | -- | -17 | -- | -1 | -- |
Change in management overlay | -5 | -10 | -- | -- | -- | -3 | -- | -- | -5 | -13 | -2 | -1 |
Impairment charges (releases) | -27 | -38 | 2 | 1 | -2 | -6 | 7 | 6 | -20 | -37 | -4 | -3 |
Write-offs | -- | -- | -3 | -2 | -1 | -1 | -33 | -- | -37 | -3 | -- | -- |
Closing balance | 53 | 80 | 6 | 7 | 12 | 15 | 14 | 40 | 85 | 142 | 4 | 8 |
- of which: management overlay | 33 | 38 | -- | -- | -- | -- | -- | -- | 33 | 38 | 1 | 3 |
Impairment charges (releases) | -27 | -38 | 2 | 1 | -2 | -6 | 7 | 6 | -20 | -37 | -4 | -3 |
Recoveries and other charges through P&L | -8 | -9 | -1 | -- | -- | -- | 3 | -- | -6 | -9 | -- | -- |
Total impairment charges (releases)2 | -35 | -47 | 1 | 1 | -2 | -6 | 10 | 6 | -26 | -46 | -4 | -3 |
- Consist mainly of off-balance sheet facilities and guarantees. The provision for credit losses of off-balance sheet items is reported in Provisions.
- The total impairment charges (releases) for the period exclude charges (releases) for loans and advances to banks, investments and others, amounting a € 2 million release (2024: € 1 million release).
| 2025 | 2024 | ||||||||
|---|---|---|---|---|---|---|---|---|---|---|
Gross carrying amount | Provision for credit losses | Book value | Stage | Coverage ratio | Gross carrying amount | Provision for credit losses | Book value | Stage | Coverage ratio | |
Residential mortgages | ||||||||||
Stage 1 | 48,658 | -7 | 48,651 | 86.1% | 0.0% | 44,8071 | -25 | 44,782 | 86.2% | 0.1% |
Stage 2 | 7,3582 | -31 | 7,327 | 13.0% | 0.4% | 6,723 | -24 | 6,699 | 12.9% | 0.4% |
Stage 3 | 466 | -15 | 451 | 0.8% | 3.2% | 473 | -31 | 442 | 0.9% | 6.6% |
Total | 56,482 | -53 | 56,429 | 100% | 0.1% | 52,003 | -80 | 51,923 | 100% | 0.2% |
IFRS value adjustments3 | -1,537 | -1,537 | -1,088 | -1,088 | ||||||
Total residential mortgages | 54,945 | -53 | 54,892 | 50,915 | -80 | 50,835 | ||||
Consumer loans | ||||||||||
Stage 1 | 54 | -- | 54 | 71.1% | 0.0% | 44 | -- | 44 | 65.7% | 0.0% |
Stage 2 | 16 | -- | 16 | 21.1% | 0.0% | 15 | -- | 15 | 22.4% | 0.0% |
Stage 3 | 6 | -6 | -- | 7.9% | 100.0% | 8 | -7 | 1 | 11.9% | 87.5% |
Total consumer loans | 76 | -6 | 70 | 100% | 7.9% | 67 | -7 | 60 | 100% | 10.4% |
SME loans | ||||||||||
Stage 1 | 1,437 | -3 | 1,434 | 93.3% | 0.2% | 1,257 | -3 | 1,254 | 90.2% | 0.2% |
Stage 2 | 74 | -5 | 69 | 4.8% | 6.8% | 104 | -8 | 96 | 7.5% | 7.7% |
Stage 3 | 30 | -4 | 26 | 1.9% | 13.3% | 32 | -4 | 28 | 2.3% | 12.5% |
Total SME loans4 | 1,541 | -12 | 1,529 | 100% | 0.8% | 1,393 | -15 | 1,378 | 100% | 1.1% |
Other corporate and government loans | ||||||||||
Stage 1 | 2,627 | -2 | 2,625 | 97.5% | 0.1% | 2,168 | -3 | 2,165 | 95.9% | 0.1% |
Stage 2 | 15 | -- | 15 | 0.6% | 0.0% | 48 | -- | 48 | 2.1% | 0.0% |
Stage 3 | 53 | -12 | 41 | 2.0% | 22.6% | 45 | -37 | 8 | 2.0% | 82.2% |
Total other corporate and government loans | 2,695 | -14 | 2,681 | 100% | 0.5% | 2,261 | -40 | 2,221 | 100% | 1.8% |
Loans and advances to customers | ||||||||||
Stage 1 | 52,776 | -12 | 52,764 | 86.8% | 0.0% | 48,276 | -31 | 48,245 | 86.6% | 0.1% |
Stage 2 | 7,463 | -36 | 7,427 | 12.3% | 0.5% | 6,890 | -32 | 6,858 | 12.4% | 0.5% |
Stage 3 | 555 | -37 | 518 | 0.9% | 6.7% | 558 | -79 | 479 | 1.0% | 14.2% |
Total excluding IFRS value adjustments | 60,794 | -85 | 60,709 | 100% | 0.1% | 55,724 | -142 | 55,582 | 100% | 0.3% |
IFRS value adjustments3 | -1,537 | -1,537 | -1,088 | -1,088 | ||||||
Total loans and advances to customers | 59,257 | -85 | 59,172 | 0.1% | 54,636 | -142 | 54,494 | 0.3% | ||
Off-balance sheet items | ||||||||||
Stage 1 | 3,253 | -1 | 3,252 | 0.0% | 2,916 | -2 | 2,914 | 0.1% | ||
Stage 2 | 325 | -1 | 324 | 0.3% | 117 | -3 | 114 | 2.6% | ||
Stage 3 | 9 | -2 | 7 | 22.2% | 11 | -3 | 8 | 27.3% | ||
Total off-balance sheet items5 | 3,587 | -4 | 3,583 | 0.1% | 3,044 | -8 | 3,036 | 0.3% | ||
Total on and off-balance sheet items to customers | 62,844 | -89 | 62,755 | 0.1% | 57,680 | -150 | 57,530 | 0.3% | ||
- At year-end 2024, for a part of the interest-only exposure allocated to its current stage, being stage 1 (€ 0.7 billion) the credit loss provision (€ 19 million) was calculated based on lifetime expected credit losses as part of the management overlay.
- At year-end 2025, for a part of the interest-only exposure allocated to its current stage, being stage 1 (€ 379 million) the credit loss provision (€ 11 million) was calculated based on lifetime expected credit losses as part of the management overlay.
- Consist of fair value adjustments from hedge accounting and amortisations.
- Gross SME loans include mortgage-backed loans for a gross amount of € 1,511 million (31-12-2024: € 1,361 million).
- Consist mainly of off-balance sheet facilities and guarantees for residential mortgages: € 2,632 million gross carrying amount an € 1 million provision for credit losses (2024: € 1,968 million respectively € 5 million).
in € millions | Residential mortgages1 | Consumer loans | SME | Other corporate and government loans | Total | |||||
|---|---|---|---|---|---|---|---|---|---|---|
2025 | 2024 | 2025 | 2024 | 2025 | 2024 | 2025 | 2024 | 2025 | 2024 | |
Opening balance | 50,915 | 47,885 | 67 | 59 | 1,393 | 1,235 | 2,261 | 1,850 | 54,636 | 51,029 |
Reclassifications | -- | -- | -- | -- | -- | -- | 198 | -- | 198 | -- |
Originated or purchased2 | 10,326 | 7,094 | 29 | 20 | 325 | 286 | 2,272 | 3,129 | 12,952 | 10,529 |
Change in current accounts | -- | -- | -3 | -1 | -3 | -47 | -4 | -8 | -10 | -56 |
Matured or sold2 | -5,844 | -4,663 | -14 | -9 | -173 | -81 | -1,996 | -2,706 | -8,027 | -7,459 |
Write-offs | -- | -- | -3 | -2 | -1 | -1 | -33 | -- | -37 | -3 |
Change in fair value as a result of hedge accounting | -452 | 213 | -- | -- | -- | -- | -- | -- | -452 | 213 |
Amortisations | 3 | 15 | -- | -- | -- | -- | -- | -- | 3 | 15 |
Exchange rate differences | -- | -- | -- | -- | -- | -- | -1 | -6 | -1 | -6 |
Other movements3 | -3 | 371 | -- | -- | -- | 1 | -24 | 2 | -5 | 374 |
Closing balance | 54,945 | 50,915 | 76 | 67 | 1,541 | 1,393 | 2,695 | 2,261 | 59,257 | 54,636 |
- Including fair value adjustments from hedge accounting and amortisations.
- Other corporate and government loans include short-term deposits with governments and pension funds in particular, with the advances and repayments being administered on a daily basis.
- In 2024, Other movements of residential mortgages include the repurchase of mortgages for an amount of € 349 million, which were sold in the past by legal predecessors of ASN Bank.
- Other movements include a modification loss of € 3 million due to the restructuring of a corporate loan.
in € millions | Residential mortgages | Consumer loans | SME loans | Other corporate and government loans | Total loans | |||||
|---|---|---|---|---|---|---|---|---|---|---|
2025 | 2024 | 2025 | 2024 | 2025 | 2024 | 2025 | 2024 | 2025 | 2024 | |
Transfers between Stage 1 and Stage 2: | ||||||||||
To Stage 2 from Stage 1 | 3,552 | 5,364 | 6 | 5 | 27 | 40 | 4 | 20 | 3,589 | 5,429 |
To Stage 1 from Stage 2 | 3,792 | 1,106 | 1 | 16 | 54 | 67 | 24 | 35 | 3,871 | 1,224 |
Transfers between Stage 2 and Stage 3: | ||||||||||
To Stage 3 from Stage 2 | 107 | 90 | 1 | 1 | 8 | 6 | 23 | 6 | 139 | 103 |
To Stage 2 from Stage 3 | 116 | 132 | -- | -- | 5 | 5 | -- | -- | 121 | 137 |
Transfers between Stage 1 and Stage 3: | ||||||||||
To Stage 3 from Stage 1 | 105 | 128 | -- | -- | 10 | 4 | 27 | 1 | 142 | 133 |
To Stage 1 from Stage 3 | 18 | 12 | -- | -- | 4 | 3 | -- | -- | 22 | 15 |
in € millions | 2025 | 2024 | Off-balance sheet items1 | |||||||
|---|---|---|---|---|---|---|---|---|---|---|
Stage 1 | Stage 2 | Stage 3 | Total | Stage 1 | Stage 2 | Stage 3 | Total | 2025 | 2024 | |
Opening balance | 31 | 32 | 79 | 142 | 44 | 50 | 88 | 182 | 8 | 11 |
Transfer to stage 1 | -- | -8 | -- | -8 | -- | -13 | -- | -13 | -1 | -1 |
Transfer to stage 2 | -- | 8 | -7 | 1 | -1 | 14 | -10 | 3 | -- | 1 |
Transfer to stage 3 | -- | -1 | 21 | 20 | -- | -4 | 17 | 13 | -- | -- |
Change in credit risk | -7 | -4 | 1 | -10 | -4 | -7 | -7 | -18 | -1 | -3 |
Originated or purchased | 8 | 2 | -- | 10 | 5 | 2 | -- | 7 | 1 | 2 |
Matured or sold | -1 | -3 | -7 | -11 | -1 | -6 | -9 | -16 | -- | -1 |
Change in models | -2 | -4 | -11 | -17 | -- | -- | -- | -- | -1 | -- |
Change in management overlay | -17 | 14 | -2 | -5 | -12 | -4 | 3 | -13 | -2 | -1 |
Impairment charges (releases) | -19 | 4 | -5 | -20 | -13 | -18 | -6 | -37 | -4 | -3 |
Write-offs | -- | -- | -37 | -37 | -- | -- | -3 | -3 | -- | -- |
Closing balance | 12 | 36 | 37 | 85 | 31 | 32 | 79 | 142 | 4 | 8 |
- Consist mainly of off-balance sheet facilities and guarantees. The provision for credit losses of off-balance sheet items is reported in Provisions.
As part of its Risk Management Framework ASN Bank evaluates its capital and liquidity position under severe stress conditions. The level of credit risk has a significant impact on stress test results. In addition, we regularly measure the sensitivity of the loan portfolios, and the level of the loan loss provisions against fluctuations of macroeconomic parameters.
For further details on stress testing, see Section Capital management - Management and control in the Annual Report 2025.
We use three forward-looking scenarios in our provisions calculations: baseline (40% weight), downside (30%) and upside (30%). An independent team of macroeconomic experts defines these scenarios using third-party input, predicting key variables like unemployment, bankruptcies and housing indicators thirty years ahead. Weights are based on the methodology of the third-party provider.
Baseline scenario: The U.S. imposes moderate tariffs on the EU without reciprocal measures. This impacts the export-oriented Dutch economy but avoids full recession. Unemployment remains around 4%.
Downside scenario: Trade war escalates with reciprocal EU tariffs. The Netherlands faces trade-related challenges as export partners enter recession, leading to declining consumer sentiment, increased bankruptcies and rising unemployment.
Upside scenario: U.S. tariffs drop in 2026, boosting global trade. The Dutch economy benefits from higher international trade volumes and stronger European growth, with firms increasing investments and unemployment declining marginally.
Additionally, we note that our IFRS 9 ECL includes a geopolitical overlay to capture the potential impact of geopolitical tensions on inflation and GDP.
The tables below show the scenarios used for calculating the expected credit loss (ECL) at 31 December 2025 and 31 December 2024 for residential mortgages and SME loans. The sensitivity analysis shows ASN Bank's macroeconomic projections for the next four years.
For residential mortgages, the differences compared to the actual provisioning level are explained by the gap in the HPI between the upside and downside scenario and by the scenario weights used. The reduced sensitivity of unweighted ECL across the upside, base, and downside scenarios at year-end 2025 compared to the prior year is attributable to the application of different macroeconomic scenarios rather than a change in the model's inherent sensitivity. The sensitivity to macroeconomic projections on the loan loss provisions for SME loans is less significant. We consider that the residential mortgages and SME loans present the most significant risk to potential adjustments in the carrying amount of financial assets.
Macroeconomic parameter | 2025 | 2026 | 2027 | 2028 | 2029 | Weight | Unweighted ECL | Reported ECL | |
|---|---|---|---|---|---|---|---|---|---|
Residential mortgages | |||||||||
Up | Relative change in house price index | 7.8% | 7.0% | 3.9% | 3.8% | 4.4% | 30% | € 48 million | € 54 million21 |
Unemployment rate | 3.9% | 3.5% | 3.5% | 3.8% | 3.9% | ||||
Base | Relative change in house price index | 7.1% | 3.7% | 4.8% | 4.8% | 4.8% | 40% | € 51 million | |
Unemployment rate | 3.9% | 4.1% | 4.1% | 4.0% | 3.9% | ||||
Down | Relative change in house price index | 6.2% | -6.6% | 2.5% | 9.9% | 7.7% | 30% | € 63 million | |
Unemployment rate | 4.0% | 5.4% | 5.7% | 4.6% | 4.0% | ||||
SME loans | |||||||||
Up | Unemployment rate | 3.9% | 3.5% | 3.5% | 3.8% | 3.9% | 30% | € 12 million | € 13 million21 |
Number of bankruptcies (monthly) | 368 | 329 | 353 | 378 | 395 | ||||
Base | Unemployment rate | 3.9% | 4.1% | 4.1% | 4.0% | 3.9% | 40% | € 12 million | |
Number of bankruptcies (monthly) | 377 | 401 | 402 | 398 | 396 | ||||
Down | Unemployment rate | 4.0% | 5.4% | 5.7% | 4.6% | 4.0% | 30% | € 14 million | |
Number of bankruptcies (monthly) | 392 | 601 | 497 | 399 | 374 | ||||
- Including the provision for credit losses for off-balance sheet items.
Macroeconomic parameter | 2024 | 2025 | 2026 | 2027 | 2028 | Weight | Unweighted ECL | Reported ECL | |
|---|---|---|---|---|---|---|---|---|---|
Residential mortgages | |||||||||
Up | Relative change in house price index | 16.7% | 7.3% | 3.6% | 3.5% | 3.5% | 20% | € 61 million | € 85 million2 |
Unemployment rate | 3.9% | 3.7% | 3.6% | 3.7% | 3.7% | ||||
Base | Relative change in house price index | 13.2% | 3.3% | 1.4% | 3.5% | 3.5% | 50% | € 72 million | |
Unemployment rate | 3.8% | 4.2% | 4.4% | 4.5% | 4.5% | ||||
Down | Relative change in house price index | 6.1% | -4.5% | -4.4% | 3.5% | 3.5% | 30% | € 121 million | |
Unemployment rate | 3.9% | 4.6% | 5.7% | 6.0% | 6.1% | ||||
SME loans | |||||||||
Up | Unemployment rate | 3.9% | 3.7% | 3.6% | 3.7% | 3.7% | 20% | € 15 million | € 16 million2 |
Number of bankruptcies (monthly) | 392 | 392 | 378 | 375 | 371 | ||||
Base | Unemployment rate | 3.8% | 4.2% | 4.4% | 4.5% | 4.5% | 50% | € 16 million | |
Number of bankruptcies (monthly) | 404 | 454 | 490 | 502 | 498 | ||||
Down | Unemployment rate | 3.9% | 4.6% | 5.7% | 6.0% | 6.1% | 30% | € 17 million | |
Number of bankruptcies (monthly) | 406 | 494 | 650 | 690 | 684 | ||||
- The macroeconomic parameters look ahead with a 12-months interval from the reporting period.
- Including the provision for credit losses for off-balance sheet items.
Forbearance is the process of granting measures to customers experiencing or about to experience financial difficulties in meeting their financial commitments. The purpose of forbearance is to maintain the debtor relationship and give customers room to meet their obligations to the bank. A summary of our policies and practices for forbearance is set out in Management and control and Provisioning methodology.
in € millions | 2025 | 2024 | ||||||||||
|---|---|---|---|---|---|---|---|---|---|---|---|---|
Gross carrying amount forborne assets | Provision for credit losses forborne assets | Gross carrying amount forborne assets | Provision for credit losses forborne assets | |||||||||
Performing | Non-performing | Total | Performing | Non-performing | Total | Performing | Non-performing | Total | Performing | Non-performing | Total | |
Residential mortgages | 686 | 182 | 868 | -5 | -12 | -17 | 739 | 208 | 947 | -7 | -17 | -24 |
Consumer loans | 2 | 1 | 3 | -- | -- | -- | 3 | 1 | 4 | -- | -- | -- |
SME loans | 12 | 11 | 23 | -1 | -4 | -5 | 21 | 21 | 42 | -1 | -6 | -7 |
Other corporate and government loans | 2 | 39 | 41 | -- | -7 | -7 | 3 | 45 | 48 | -- | -37 | -37 |
Total | 702 | 233 | 935 | -6 | -23 | -29 | 766 | 275 | 1,041 | -8 | -60 | -68 |
Off-balance sheet items | 4 | 2 | 6 | -- | -1 | -1 | 5 | 2 | 7 | -- | -1 | -1 |
Total | 706 | 235 | 941 | -6 | -24 | -30 | 771 | 277 | 1,048 | -8 | -61 | -69 |
The table below depicts the amount of loans and advances to customers in arrears, based on any arrears amount days-past-due. Loans and advances in arrears as percentage of total loans was 0.8%, higher compared to 2024 (0.6%). For residential mortgages, the percentage increased to 0.7% and the exposures in arrears itself increased from € 279 million to € 413 million at year-end 2025. The 2025 arrears balances incorporate a refinement to the operational application of the measurement of arrears explaining the year-on-year movement. This refinement was applied as of year-end 2025 and does not have a material impact on prior year ECL or staging.
SME loan exposures in arrears decreased from € 43 million to € 31 million, with short-term as well as long-term arrears improving.
A summary of our policies and practices for arrears is set out in Preventive management and arrears management.
2025 | 2024 | |||||||||||
|---|---|---|---|---|---|---|---|---|---|---|---|---|
| Gross carrying amount | No arrears | ≤ 30 days in arrears | > 30 days ≤ 90 days in arrears | > 90 days in arrears | % in arrears | Gross carrying amount | No arrears | ≤ 30 days in arrears | > 30 days ≤ 90 days in arrears | > 90 days in arrears | % in arrears |
Residential mortgages | ||||||||||||
Stage 1 | 48,658 | 48,580 | 3 | 31 | 44 | 0.2% | 44,807 | 44,787 | 11 | 2 | 7 | 0.0% |
Stage 2 | 7,358 | 7,117 | 79 | 80 | 82 | 3.3% | 6,723 | 6,588 | 31 | 52 | 52 | 2.0% |
Stage 3 | 466 | 372 | 11 | 19 | 64 | 20.2% | 473 | 349 | 12 | 19 | 93 | 26.2% |
Total residential mortgages excluding IFRS value adjustments | 56,482 | 56,069 | 93 | 130 | 190 | 0.7% | 52,003 | 51,724 | 54 | 73 | 152 | 0.5% |
IFRS value adjustments1 | -1,537 | -1,088 | ||||||||||
Total residential mortgages | 54,945 | 56,069 | 93 | 130 | 190 | 50,915 | 51,724 | 54 | 73 | 152 | ||
Consumer loans | ||||||||||||
Stage 1 | 54 | 54 | -- | -- | -- | 0.0% | 44 | 44 | -- | -- | -- | 0.0% |
Stage 2 | 16 | 11 | 2 | 1 | 2 | 31.3% | 15 | 10 | 2 | 1 | 2 | 33.3% |
Stage 3 | 6 | 1 | -- | -- | 5 | 83.3% | 8 | 1 | -- | -- | 7 | 87.5% |
Total consumer loans | 76 | 66 | 2 | 1 | 7 | 13.2% | 67 | 55 | 2 | 1 | 9 | 17.9% |
SME loans | ||||||||||||
Stage 1 | 1,437 | 1,436 | 1 | -- | -- | 0.1% | 1,257 | 1,256 | 1 | -- | -- | 0.1% |
Stage 2 | 74 | 58 | 6 | 7 | 3 | 21.6% | 104 | 76 | 12 | 8 | 8 | 26.9% |
Stage 3 | 30 | 16 | 1 | 4 | 9 | 46.7% | 32 | 18 | 3 | 1 | 10 | 43.8% |
Total SME loans | 1,541 | 1,510 | 8 | 11 | 12 | 2.0% | 1,393 | 1,350 | 16 | 9 | 18 | 3.1% |
Other corporate and government loans | ||||||||||||
Stage 1 | 2,627 | 2,622 | 5 | -- | -- | 0.2% | 2,168 | 2,168 | -- | -- | -- | 0.0% |
Stage 2 | 15 | 13 | 2 | -- | -- | 13.3% | 48 | 48 | -- | -- | -- | 0.0% |
Stage 3 | 53 | 53 | -- | -- | -- | 0.0% | 45 | 45 | -- | -- | -- | 0.0% |
Total other corporate and government loans | 2,695 | 2,688 | 7 | -- | -- | 0.3% | 2,261 | 2,261 | -- | -- | -- | 0.0% |
Loans and advances to customers | ||||||||||||
Stage 1 | 52,776 | 52,692 | 9 | 31 | 44 | 0.2% | 48,276 | 48,255 | 12 | 2 | 7 | 0.0% |
Stage 2 | 7,463 | 7,199 | 89 | 88 | 87 | 3.5% | 6,890 | 6,722 | 45 | 61 | 62 | 2.4% |
Stage 3 | 555 | 442 | 12 | 23 | 78 | 20.4% | 558 | 413 | 15 | 20 | 110 | 26.0% |
Total excluding IFRS value adjustments | 60,794 | 60,333 | 110 | 142 | 209 | 0.8% | 55,724 | 55,390 | 72 | 83 | 179 | 0.6% |
IFRS value adjustments1 | -1,537 | -1,088 | ||||||||||
Total loans and advances to customers | 59,257 | 60,333 | 110 | 142 | 209 | 54,636 | 55,390 | 72 | 83 | 179 | ||
- Consist of fair value adjustments from hedge accounting and amortisations.
Credit risk mitigation
The bank offsets financial assets and liabilities and reports the net amount on the balance sheet if there is a legally enforceable right to offset the recognised amounts, and if there is an intention to settle the items on a net basis, or to settle the asset and the liability simultaneously. There is an enforceable right to offset amounts, provided it is not dependent on a future event and is legally enforceable under normal circumstances as well as in the case of bankruptcy. If these conditions are not met, amounts will not be offset.
The table below shows how exposures were offset, netted, collateralised and guaranteed as at year-end 2025 and 2024. The table discloses the potential effect of netting arrangements and collateral agreements on ASN Bank's financial position. We included the potential effect of rights of set-off related to ASN Bank's recognised financial assets and recognised financial liabilities.
The amounts eligible for offsetting pursuant to the International Swaps and Derivatives Association (ISDA) contracts are related to derivatives and amount to € 441 million (2024: € 945 million).
We ensure that the inflow of loans meets adequate standards in respect of customer, income and collateral. We limit potential losses resulting from credit risk by setting conditions on collateral, such as the value of the collateral and possibly the issue of a National Mortgage Guarantee ( NHG ).
An NHG mortgage provides both the customer and the bank with additional security. On 1 January 2025, the NHG limit was set at € 450,000 and at € 477,000 in case of investments in energy-saving measures. With effect from 1 January 2026, these maximum amounts were raised to € 470,000 and € 498,200 respectively. Of the residential mortgages, € 16.1 billion (2024: € 14.1 billion), i.e. 29%, of the gross carrying amount of the exposure fell under the NHG guarantee scheme.
The weighted average indexed LtV of the residential mortgage portfolio was virtually unchanged at 51%, from 50% at year-end 2024 as new originations with a higher LtV were offset by higher house prices. In the event of foreclosure, we instruct an appraiser of our choosing to (re)value the collateral. For more information on LtV and NHG for residential mortgages, see the Section Credit quality of the residential mortgages in the Annual Report 2025.
The major part of our SME loan portfolio consists of mortgages on commercial real estate. All collateralised assets are located in the Netherlands, a mature market for commercial real estate. The revaluation frequency for property depends on the amount of its exposure. If 1) the exposure exceeds € 3 million or 2) the exposure exceeds € 1 million and the LtV is above 80%, the property must be revalued every three years.
A revaluation is also initiated as part of the (arrears) management process. This is a standard procedure once the process for a loan that has been declared to be in default has been started. A revaluation is also made if, upon a check, the information received indicates that the value of the real estate has dropped sharply in comparison with general market prices. For every new mortgage or material change in a loan, a valuation report is required for all properties to which the loan pertains. For new developments, this is a valuation based on the specifications and underlying documents such as a building contract.
The major part of the sustainable loans we provide are loans with government-guaranteed electricity prices and/or power purchase agreements. Other corporate and government loans also have government-issued guarantees, such as loans provided to healthcare institutions and housing associations. We do not use credit derivatives as collateral.
Collateral for investments primarily concerns bonds with a financial guarantee from a government or local authority.
The guarantees for loans and advances to banks are guarantees issued by regional or central governments. The collateral is mainly linked to derivative transactions.
31 December 2025 | 31 December 2024 | |||||||||||||||||||||
|---|---|---|---|---|---|---|---|---|---|---|---|---|---|---|---|---|---|---|---|---|---|---|
in € millions | Not offset in the balance sheet | Not offset in the balance sheet | ||||||||||||||||||||
Gross carrying | Offsetting | Maximum | Master netting | Cash | Debt | Savings | Immovable | Financial | Net | Provision for | Gross carrying | Offsetting | Maximum | Master netting | Cash | Debt | Savings | Immovable | Financial | Net | Provision for | |
Cash and balances at central banks | 1,178 | 1,178 | 1,178 | 2,834 | 2,834 | 2,834 | ||||||||||||||||
Derivatives | 1,789 | 1,789 | 4411 | 1,3362 | 12 | 2,141 | 2,141 | 9451 | 1,1792 | 17 | ||||||||||||
Investments | 6,815 | 6,815 | 272 | 6,543 | -6 | 7,206 | 7,206 | 300 | 6,906 | -7 | ||||||||||||
Loans and advances to banks | 7,325 | 7,325 | 2,598 | 4,727 | -2 | 6,713 | 6,713 | 2,664 | 4,049 | -3 | ||||||||||||
Loans and advances to customers | 59,257 | 59,257 | 1,741 | 56,099 | 199 | 1,218 | -85 | 54,636 | 54,636 | 1,776 | 51,480 | 231 | 1,149 | -142 | ||||||||
- Residential mortgages | 56,482 | 56,482 | 1,741 | 54,691 | 53 | 45 | -53 | 52,003 | 52,003 | 1,776 | 50,133 | 23 | 92 | -80 | ||||||||
- Consumer loans | 76 | 76 | 76 | -6 | 67 | 67 | 67 | -7 | ||||||||||||||
- SME loans | 1,541 | 1,541 | 1,408 | 133 | -12 | 1,393 | 1,393 | 1,347 | 46 | -15 | ||||||||||||
- Other corporate and government loans | 2,695 | 2,695 | 194 | 2,501 | -14 | 2,261 | 2,261 | 229 | 2,032 | -40 | ||||||||||||
- IFRS fair value adjustments4 | -1,537 | -1,537 | -1,537 | -1,088 | -1,088 | -1,088 | ||||||||||||||||
Other assets | 342 | 342 | 342 | 247 | 247 | 247 | ||||||||||||||||
Total financial assets | 76,706 | -- | 76,706 | 441 | 1,336 | -- | 1,741 | 56,099 | 3,069 | 14,020 | -93 | 73,777 | -- | 73,777 | 945 | 1,179 | -- | 1,776 | 51,480 | 3,195 | 15,202 | -152 |
Derivatives | 509 | 509 | 4411 | 615 | 7 | 1,105 | 1,105 | 9451 | 1525 | 8 | ||||||||||||
Amounts due to banks | 1,117 | 1,117 | 1,117 | 1,401 | 1,401 | 1,401 | ||||||||||||||||
Other liabilities | 70,442 | 70,442 | 70,442 | 66,712 | 66,712 | 66,712 | ||||||||||||||||
Total financial liabilities | 72,068 | -- | 72,068 | 441 | 61 | -- | -- | -- | -- | 71,566 | -- | 69,218 | -- | 69,218 | 945 | 152 | -- | -- | -- | -- | 68,121 | -- |
Loan commitments given | 3,585 | 3,585 | 1,040 | 2,545 | -4 | 3,041 | 3,041 | 903 | 2,138 | -8 | ||||||||||||
Financial guarantees | 2 | 2 | 2 | -- | -- | 3 | 3 | 3 | -- | -- | ||||||||||||
Total off-balance sheet | 3,587 | -- | 3,587 | -- | 2 | -- | -- | 1,040 | -- | 2,545 | -4 | 3,044 | -- | 3,044 | -- | 3 | -- | -- | 903 | -- | 2,138 | -8 |
- Eligible for offsetting pursuant to the International Swap and Derivatives Association (ISDA).
- This is the amount that can be offset against net current credit exposure. The total cash collateral posted amounted to € 1,351 million (2024: € 1,205 million).
- Guarantees for residential mortgages provided with a National Mortgage Guarantee (NHG) and an LtV > 100%.
- Consist of fair value adjustments from hedge accounting and amortisations.
- This is the amount that can be offset against net current credit exposure. The total cash collateral posted amounted to € 69 million (2024: € 156 million).
in € millions | Gross carrying amount before balance sheet netting | Offsetting balance sheet values | Maximum exposure to credit risk | Immovable property1 | Net exposure | Provision for credit losses | ||||||
|---|---|---|---|---|---|---|---|---|---|---|---|---|
2025 | 2024 | 2025 | 2024 | 2025 | 2024 | 2025 | 2024 | 2025 | 2024 | 2025 | 2024 | |
Residential mortgages | 466 | 473 | 466 | 473 | 451 | 441 | 15 | 32 | -15 | -31 | ||
Consumer loans | 6 | 8 | 6 | 8 | -- | -- | 6 | 8 | -6 | -7 | ||
SME loans | 30 | 32 | 30 | 32 | 22 | 26 | 8 | 6 | -4 | -4 | ||
Other corporate and government loans | 53 | 45 | 53 | 45 | -- | -- | 53 | 45 | -12 | -37 | ||
Loans and advances to customers | 555 | 558 | -- | -- | 555 | 558 | 473 | 467 | 82 | 91 | -37 | -79 |
Off-balance sheet exposures | 9 | 11 | -- | -- | 9 | 11 | 7 | 8 | 2 | 3 | -2 | -3 |
- Not offset in the statement of financial position.
ASN Bank enters into derivative contracts mainly with financial institutions and qualifying central counterparties (QCCPs) primarily to hedge the interest rate and currency risks arising from its banking activities. These products expose the bank to the risk that the counterparty of a transaction defaults before the final settlement of the transaction’s cash flows.
To manage this risk, the bank conducts periodic credit reviews to reassess counterparty creditworthiness and to validate that internal limits remain appropriate and aligned with the bank’s risk appetite. Counterparties are continuously monitored for early-warning indicators, limit usage and other credit-related triggers. The management of counterparty credit risk is governed by the bank’s risk management framework and overseen by the respective Committee.
Credit risk on derivative positions is calculated in accordance with the Standardized Approach for Counterparty Credit Risk (SA-CCR) taking into account netting sets and collateral arrangements. The exposure is measured through the Exposure at Default (EAD), which includes both the replacement cost and the potential future exposure. Additionally, Credit Valuation Adjustments (CVA) are applied to reflect counterparty credit risk in the valuation of derivative positions.
Interest rate derivative transactions are cleared mostly through a QCCP, reducing the counterparty credit risk on a specific counterparty. Derivative transactions that are not eligible for central clearing are executed bilaterally under International Swaps and Derivatives (ISDA) agreements with Credit Support Annexes (CSAs), or under Global Master Repurchase Agreements (GMRAs) in the case of repurchase transactions. Nearly all derivative transactions are subject to cash collateral agreements, with daily collateral exchanges to reflect the market value movements. Collateral value is monitored on a daily basis. Settlement risk for the bilateral foreign exchange derivative transactions is mitigated by executing them via Continuous Linked Settlement. ASN Bank does not use credit derivatives as a form of security or as an instrument to hedge credit risk.
Additional disclosures on residential mortgages
The estimated probability of default (PD) in the new enhanced IFRS 9 Expected Credit Loss (ECL) model resulted in a changed distribution over PD-scales and on average an increase in PD. These movements are explained by methodological enhancements in modelling and the incorporation of more recent data. The increase in PD is offset by a significant decrease in Loss Given Default (LGD) rates, resulting in an overall reduction in ECL.
| 2025 | 2024 | |||||||||||||||
|---|---|---|---|---|---|---|---|---|---|---|---|---|---|---|---|---|---|
Gross carrying amount | Provision for credit losses | Gross carrying amount | Provision for credit losses | ||||||||||||||
Stage 1 | Stage 2 | Stage 3 | Total | Stage 1 | Stage 2 | Stage 3 | Total | Stage 1 | Stage 2 | Stage 3 | Total | Stage 1 | Stage 2 | Stage 3 | Total | ||
Internal rating grade | PD scaling | ||||||||||||||||
1 | 0.00 to <0.15 | 736 | 3 | -- | 739 | -- | -- | -- | -- | 23,092 | 22 | -- | 23,114 | -3 | -- | -- | -3 |
2 | 0.15 to <0.25 | 1,859 | 3 | -- | 1,862 | -- | -- | -- | -- | 13,629 | 90 | -- | 13,719 | -5 | -- | -- | -5 |
3 | 0.25 to <0.35 | 3,531 | 5 | -- | 3,536 | -- | -- | -- | -- | 5,510 | 180 | -- | 5,690 | -5 | -- | -- | -5 |
4 | 0.35 to <0.50 | 9,587 | 29 | -- | 9,616 | -1 | -- | -- | -1 | 1,828 | 408 | -- | 2,236 | -4 | -- | -- | -4 |
5 | 0.50 to <0.75 | 20,828 | 52 | -- | 20,880 | -3 | -- | -- | -3 | 72 | 757 | -- | 829 | -- | -- | -- | -- |
6 | 0.75 to <1.25 | 11,454 | 105 | -- | 11,559 | -3 | -- | -- | -3 | 85 | 1,419 | -- | 1,504 | -- | -1 | -- | -1 |
7 | 1.25 to <1.50 | 398 | 76 | -- | 474 | -- | -- | -- | -- | 56 | 592 | -- | 648 | -- | -1 | -- | -1 |
8 | 1.50 to <1.75 | 158 | 147 | -- | 305 | -- | -- | -- | -- | 51 | 426 | -- | 477 | -- | -1 | -- | -1 |
9 | 1.75 to <3.50 | 104 | 1,034 | -- | 1,138 | -- | -4 | -- | -4 | 359 | 1,503 | -- | 1,862 | -3 | -3 | -- | -6 |
10 | 3.50 to <10.00 | 2 | 2,727 | -- | 2,729 | -- | -11 | -- | -11 | 119 | 413 | -- | 532 | -4 | -2 | -- | -6 |
11 | 10.00 to <15.00 | 1 | 1,221 | -- | 1,222 | -- | -4 | -- | -4 | 3 | 176 | -- | 179 | -- | -1 | -- | -1 |
12 | 15.00 to <25.00 | -- | 1,455 | -- | 1,455 | -- | -6 | -- | -6 | 3 | 290 | -- | 293 | -1 | -3 | -- | -4 |
13 | 25.00 to <100.00 | -- | 501 | -- | 501 | -- | -6 | -- | -6 | -- | 447 | -- | 447 | -- | -12 | -- | -12 |
Default | 100.00 | -- | -- | 466 | 466 | -- | -- | -15 | -15 | -- | -- | 473 | 473 | -- | -- | -31 | -31 |
Total | 48,658 | 7,358 | 466 | 56,482 | -7 | -31 | -15 | -53 | 44,807 | 6,723 | 473 | 52,003 | -25 | -24 | -31 | -80 | |
IFRS value adjustments1 | -1,537 | -1,088 | |||||||||||||||
Total residential mortgages | 48,658 | 7,358 | 466 | 54,945 | -7 | -31 | -15 | -53 | 44,807 | 6,723 | 473 | 50,915 | -25 | -24 | -31 | -80 | |
- Consist of fair value adjustments from hedge accounting and amortisations.
Time in default (as a % of total gross amount) | 2025 | 2024 |
|---|---|---|
< 1 year | 49% | 51% |
1-3 years | 34% | 34% |
3-5 years | 13% | 10% |
5-10 years | 2% | 3% |
> 10 years | 2% | 2% |
Total | 100% | 100% |
The Loan-to-Value (LtV) is the amount of the (remaining) loan expressed as a percentage of the indexed market value of the collateral. The weighted average indexed LtV of the residential mortgage portfolio was virtually unchanged at 51%, from 50% at year-end 2024, new originations with higher LtVs were offset by higher house prices. To determine the LtV, we index collateral values every month on the basis of house price developments by using indices, by municipality and type of collateral.
An LtV in excess of 100% does not necessarily indicate a customer in financial difficulties. New inflow of residential mortgages with an LtV in excess of 100% mainly relates to sustainable home improvements in accordance with the temporary Dutch scheme for mortgage loans (Tijdelijke Regeling Hypothecair Krediet). The LtV on these loans is capped at 106%.
in € millions | 2025 | 2024 | ||||||||||||||||
|---|---|---|---|---|---|---|---|---|---|---|---|---|---|---|---|---|---|---|
Gross carrying amount | Provision for credit losses | Gross carrying amount | Provision for credit losses | |||||||||||||||
Stage 1 | Stage 2 | Stage 3 | Total | Stage 1 | Stage 2 | Stage 3 | Total | Stage 1 | Stage 2 | Stage 3 | Total | Stage 1 | Stage 2 | Stage 3 | Total | |||
NHG2 | ||||||||||||||||||
≤ 75% | 10,964 | 692 | 59 | 11,715 | 21% | -1 | -2 | -2 | -5 | 10,206 | 980 | 62 | 11,248 | 22% | -2 | -2 | -3 | -7 |
>75 ≤ 100% | 4,093 | 120 | 7 | 4,220 | 7% | - | - | -- | -- | 2,717 | 62 | 6 | 2,785 | 5% | -2 | -1 | -- | -3 |
>100 ≤ 110% | 194 | 2 | -- | 196 | 0% | -- | -- | -- | -- | 53 | -- | -- | 53 | 0% | -- | -- | -- | -- |
>110 ≤ 125% | -- | 3 | -- | 3 | 0% | -- | -- | -- | -- | 1 | -- | -- | 1 | 0% | -- | -- | -- | -- |
> 125% | 1 | 2 | - | 3 | 0% | -- | -- | -- | -- | 1 | 1 | - | 2 | 0% | -- | -- | -- | -- |
Total NHG | 15,252 | 819 | 66 | 16,137 | 29% | -1 | -2 | -2 | -5 | 12,978 | 1,043 | 68 | 14,089 | 27% | -4 | -3 | -3 | -10 |
Non-NHG | ||||||||||||||||||
≤ 75% | 29,182 | 5,869 | 365 | 35,416 | 63% | -4 | -23 | -9 | -36 | 28,488 | 5,411 | 352 | 34,251 | 66% | -12 | -14 | -18 | -44 |
>75 ≤ 100% | 3,923 | 587 | 30 | 4,540 | 8% | -2 | -6 | -2 | -10 | 3,232 | 256 | 41 | 3,529 | 7% | -9 | -6 | -7 | -22 |
>100 ≤ 110% | 268 | 62 | 1 | 331 | 1% | -- | -- | -- | -- | 82 | 7 | 5 | 94 | 0% | -- | -- | -1 | -1 |
>110 ≤ 125% | 19 | 16 | -- | 35 | 0% | -- | -- | -- | -- | 16 | 2 | 3 | 21 | 0% | -- | -- | -1 | -1 |
> 125% | 14 | 5 | 4 | 23 | 0% | -- | -- | -2 | -2 | 11 | 4 | 4 | 19 | 0% | -- | -1 | -1 | -2 |
Total Non-NHG | 33,406 | 6,539 | 400 | 40,345 | 71% | -6 | -29 | -13 | -48 | 31,829 | 5,680 | 405 | 37,914 | 73% | -21 | -21 | -28 | -70 |
Total | 48,658 | 7,358 | 466 | 56,482 | 100% | -7 | -31 | -15 | -53 | 44,807 | 6,723 | 473 | 52,003 | 100% | -25 | -24 | -31 | -80 |
IFRS value adjustments3 | -1,537 | -1,088 | ||||||||||||||||
Total residential mortgages | 54,945 | -53 | 50,915 | -80 | ||||||||||||||
Weighted average indexed LtV | 51% | 50% | ||||||||||||||||
- The LtV is based on the indexed market value of collateral.
- NHG is determined on loan part level; the size of guarantees related to NHG-guaranteed mortgages expires on an annuity basis.
- Consist of fair value adjustments from hedge accounting and amortisations.
in € millions | 2025 | 2024 | ||
|---|---|---|---|---|
Floating rate | 743 | 1% | 847 | 1% |
≥ 1 and < 5-year fixed rate | 1,721 | 3% | 993 | 2% |
≥ 5 and < 10-year fixed rate | 2,584 | 5% | 1,912 | 4% |
≥ 10 and < 15-year fixed rate | 32,734 | 58% | 29,298 | 56% |
≥ 15-year fixed rate | 18,240 | 32% | 18,547 | 36% |
Other | 460 | 1% | 406 | 1% |
Total | 56,482 | 100% | 52,003 | 100% |
- Gross carrying amount and excluding fair value adjustments from hedge accounting and amortisations.
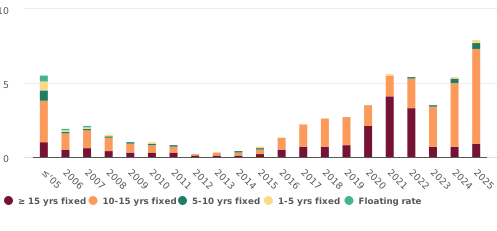
in € millions | 2025 | 2024 | ||
|---|---|---|---|---|
Interest-only (100%) | 8,757 | 16% | 9,077 | 17% |
Interest-only (partially)2 | 12,694 | 22% | 12,943 | 25% |
Annuity | 28,629 | 51% | 23,307 | 45% |
Linear | 1,390 | 2% | 1,289 | 2% |
(Bank) savings3 | 2,865 | 5% | 3,085 | 6% |
Life insurance/investments | 1,702 | 3% | 1,896 | 4% |
Other | 445 | 1% | 406 | 1% |
Total | 56,482 | 100% | 52,003 | 100% |
- Gross carrying amount and excluding fair value adjustments from hedge accounting and amortisations.
- Besides an interest-only loan part, customers also have a loan part with a repayment, such as annuity or linear repayments.
- The guaranteed savings deposits accrued in a policy with the insurer are accounted for under (bank) savings.
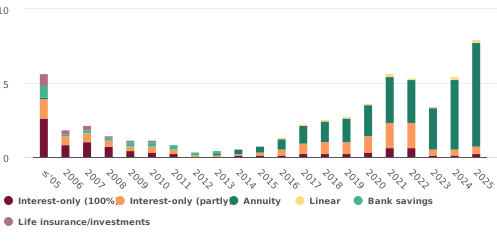
- Amounts in this chart do include mortgage renewals, but do not include bridge loans and 'Extra Ruimte' mortgages.
- Amounts in this chart do include mortgage renewals, but do not include bridge loans and 'Extra Ruimte' mortgages.
Additional disclosures on SME loans
2025 | 2024 | |||||||||||||||||
|---|---|---|---|---|---|---|---|---|---|---|---|---|---|---|---|---|---|---|
in € millions | Gross carrying amount | Provision for credit losses | Gross carrying amount | Provision for credit losses | ||||||||||||||
Stage 1 | Stage 2 | Stage 3 | Total | Stage 1 | Stage 2 | Stage 3 | Total | Stage 1 | Stage 2 | Stage 3 | Total | Stage 1 | Stage 2 | Stage 3 | Total | |||
≤ 75% | 504 | 20 | 11 | 535 | 35% | -1 | -1 | -- | -2 | 426 | 22 | 13 | 461 | 33% | -1 | -1 | -1 | -3 |
>75 ≤ 100% | 645 | 27 | 13 | 685 | 44% | -1 | -1 | -2 | -4 | 578 | 46 | 11 | 635 | 46% | -1 | -3 | -1 | -5 |
>100 ≤ 110% | 184 | 11 | 4 | 199 | 13% | -1 | -1 | -1 | -3 | 171 | 17 | 2 | 190 | 14% | -1 | -1 | -- | -2 |
>110 ≤ 125% | 77 | 6 | 1 | 84 | 5% | -- | -1 | -- | -1 | 54 | 7 | 1 | 62 | 4% | -- | -1 | -- | -1 |
> 125% | 27 | 10 | 1 | 38 | 3% | -- | -1 | -1 | -2 | 28 | 12 | 5 | 45 | 3% | -- | -2 | -2 | -4 |
Total SME loans | 1,437 | 74 | 30 | 1,541 | 100% | -3 | -5 | -4 | -12 | 1,257 | 104 | 32 | 1,393 | 100% | -3 | -8 | -4 | -15 |
- LtV based on foreclosure value of collateral.
| 2025 | 2024 | |||||||||||||||
|---|---|---|---|---|---|---|---|---|---|---|---|---|---|---|---|---|---|
Gross carrying amount | Provision for credit losses | Gross carrying amount | Provision for credit losses | ||||||||||||||
Stage 1 | Stage 2 | Stage 3 | Total | Stage 1 | Stage 2 | Stage 3 | Total | Stage 1 | Stage 2 | Stage 3 | Total | Stage 1 | Stage 2 | Stage 3 | Total | ||
Internal rating grade | PD scaling | ||||||||||||||||
1 | 0.00 to <0.15 | -- | -- | -- | -- | -- | -- | -- | -- | -- | -- | -- | -- | -- | -- | -- | -- |
2 | 0.15 to <0.25 | 1 | -- | -- | 1 | -- | -- | -- | -- | 1 | -- | -- | 1 | -- | -- | -- | -- |
3 | 0.25 to <0.35 | 10 | -- | -- | 10 | -- | -- | -- | -- | 13 | -- | -- | 13 | -- | -- | -- | -- |
4 | 0.35 to <0.50 | 28 | -- | -- | 28 | -- | -- | -- | -- | 39 | -- | -- | 39 | -- | -- | -- | -- |
5 | 0.50 to <0.75 | 184 | -- | -- | 184 | -- | -- | -- | -- | 178 | -- | -- | 178 | -- | -- | -- | -- |
6 | 0.75 to <1.25 | 401 | -- | -- | 401 | -1 | -- | -- | -1 | 292 | -- | -- | 292 | -1 | -- | -- | -1 |
7 | 1.25 to <1.50 | 103 | -- | -- | 103 | -- | -- | -- | -- | 77 | -- | -- | 77 | -- | -- | -- | -- |
8 | 1.50 to <1.75 | 79 | -- | -- | 79 | -- | -- | -- | -- | 73 | -- | -- | 73 | -- | -- | -- | -- |
9 | 1.75 to <3.50 | 428 | -- | -- | 428 | -1 | -- | -- | -1 | 407 | 1 | -- | 408 | -1 | -- | -- | -1 |
10 | 3.50 to <10.00 | 202 | 7 | -- | 209 | -1 | -- | -- | -1 | 174 | 5 | -- | 179 | -1 | -- | -- | -1 |
11 | 10.00 to <15.00 | 1 | 16 | -- | 17 | -- | -- | -- | -- | 3 | 13 | -- | 16 | -- | -- | -- | -- |
12 | 15.00 to <25.00 | -- | 15 | -- | 15 | -- | -1 | -- | -1 | -- | 17 | -- | 17 | -- | -1 | -- | -1 |
13 | 25.00 to <100.00 | -- | 36 | -- | 36 | -- | -4 | -- | -4 | -- | 67 | -- | 67 | -- | -7 | -- | -7 |
Default | 100.00 | -- | -- | 30 | 30 | -- | -- | -4 | -4 | -- | 1 | 32 | 33 | -- | -- | -4 | -4 |
Total SME loans | 1,437 | 74 | 30 | 1,541 | -3 | -5 | -4 | -12 | 1,257 | 104 | 32 | 1,393 | -3 | -8 | -4 | -15 | |
Time in default (as a % of total gross amount) | 2025 | 2024 |
|---|---|---|
< 1 year | 59% | 33% |
1-3 years | 26% | 28% |
3-5 years | 7% | 18% |
5-10 years | 8% | 18% |
> 10 years | 0% | 3% |
Total | 100% | 100% |
in € millions | 2025 | 2024 | ||
|---|---|---|---|---|
Gross carrying amount | Provision for credit losses | Gross carrying amount | Provision for credit losses | |
Agriculture, forestry and fishing | 14 | -- | 16 | -- |
Manufacturing | 68 | -1 | 67 | -1 |
Water supply | 1 | -- | 1 | -- |
Construction | 146 | -2 | 127 | -2 |
Wholesale and retail trade | 245 | -2 | 249 | -3 |
Transport and storage | 19 | -- | 13 | -- |
Accommodation and food service activities | 69 | -1 | 67 | -1 |
Information and communication | 11 | -- | 11 | -- |
Financial and insurance activities | 377 | -2 | 345 | -3 |
Real estate activities | 248 | -2 | 208 | -3 |
Professional, scientific and technical activities | 212 | -1 | 172 | -2 |
Administrative and support service activities | 30 | -1 | 29 | -- |
Education | 13 | -- | 10 | -- |
Human health services and social work activities | 31 | -- | 31 | -- |
Arts, entertainment and recreation | 21 | -- | 18 | -- |
Other | 36 | -- | 29 | -- |
Total SME loans | 1,541 | -12 | 1,393 | -15 |
- Based on the activity classification of the European Union (Nomenclature statistique des activités économiques dans la Communauté Européenne, NACE).
Additional disclosures on other corporate and government loans
in € millions | 2025 | 2024 |
|---|---|---|
Government | 1,162 | 780 |
- of which money market loans | 1,092 | 680 |
- of which other private placement loans | 70 | 100 |
Other financial corporations | 513 | 315 |
- of which sustainable funds | 310 | 315 |
- of which money market loans | 198 | -- |
- of which other loans | 5 | -- |
Non-financial corporations | 1,020 | 1,166 |
- of which sustainable finance loans | 841 | 955 |
- of which other private placement loans | 179 | 211 |
Gross other corporate and government loans | 2,695 | 2,261 |
Provision for credit losses | -14 | -40 |
Total other corporate and government loans | 2,681 | 2,221 |
in € millions | 2025 | 2024 | ||
|---|---|---|---|---|
Gross carrying amount | Provision for credit losses | Gross carrying amount | Provision for credit losses | |
Manufacturing | 30 | -- | 32 | -- |
Electricity, gas, steam and air conditioning supply | 647 | -5 | 754 | -35 |
Construction | 17 | -- | 9 | -- |
Financial and insurance activities | 70 | -1 | 75 | -1 |
Real estate activities | 124 | -- | 146 | -- |
Professional, scientific and technical activities | 38 | -5 | 39 | -1 |
Administrative and support service activities | 5 | -3 | 7 | -3 |
Human health services and social work activities | 65 | -- | 78 | -- |
Arts, entertainment and recreation | 24 | -- | 26 | -- |
Total non-financial corporations | 1,020 | -14 | 1,166 | -40 |
- Based on the activity classification of the European Union (Nomenclature statistique des activités économiques dans la Communauté Européenne, NACE).
in € millions | 2025 | 2024 |
|---|---|---|
The Netherlands | 71 | 100 |
EMU excl. the Netherlands | 769 | 254 |
Switzerland | 322 | 426 |
Total | 1,162 | 780 |
Market risk
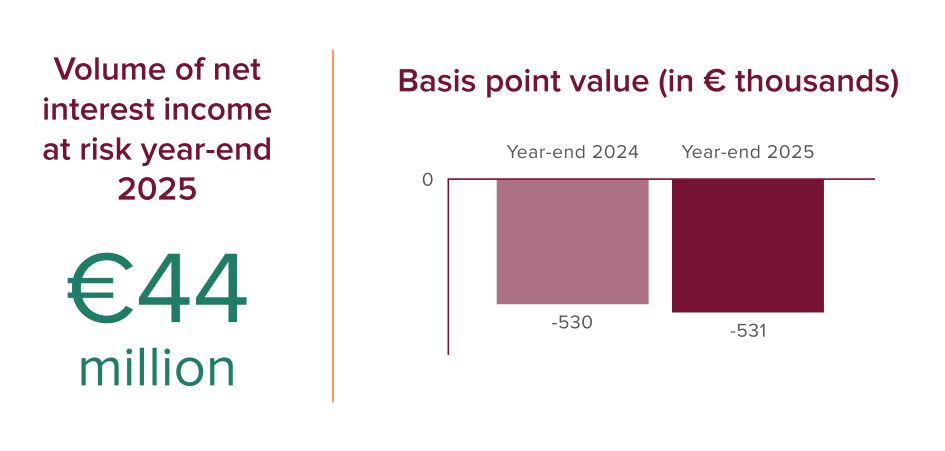
Market risk in the banking book
Market risk in the banking book mainly comprises market interest rate risk and credit spread risk. Market interest rate risk is the risk that the bank’s future interest income deteriorates when market rates change. This risk is inherent of a bank that provides mortgage and savings products. Liquid market instruments with direct or indirect reference to market prices may be affected by credit spread risk. Other risks that may be qualified as market risk are limited for ASN Bank. ASN Bank has a low risk appetite for currency risk. With equity holdings in other companies totalling € 15 million (2024: € 16 million), the equity (price) risk is small. Moreover, the banking book does not contain any exposure to commodities.
Interest rate risk in the banking book
Interest rate risk management aims to protect and generate stable net interest income. In the assessment and management of interest rate risks, we take into account:
Behavioural aspects of demand deposits and mortgages;
Effects of the current and anticipated interest rate environment;
Effects of interest rate developments that deviate from our expectations.
When managing the banking book’s interest rate risk we focus on the net interest income (NII) and market value changes perspectives to manage the short to medium-term interest rate risk. For managing long-term interest rate risk, we focus on the economic value (EV) perspective.
Short-term interest rate risk: NII (Audited)
To determine the short-term risk to NII, we apply the NII-at-Risk measure, which expresses the change in interest income due to gradual deviations from the expected interest rate development over a horizon of one year. This assessment is based on a dynamic balance sheet, which is aligned with the regular planning process. Deviating interest rate scenarios are calibrated using statistical analysis. To capture basis risk, the NII-at-Risk calculations take into account diverging rate movements of different benchmark rates as part of the scenario-set. Complimentary to the internal perspective, the NII sensitivity is measured and steered in relation to the Supervisory Outlier Test on net interest income (SOT NII), which is based on the assumption of a constant balance sheet.
Long-term interest rate risk: economic value (Audited)
When we apply the economic value (EV) methodology, we determine the economic value of equity (EVE) by considering all future incoming and outgoing cashflows based on current market rates. The key control measures of EVE sensitivity for day-to-day steering purposes are basis point values at total level and per tenor. The basis point value at total level is used to express the sensitivity of the EVE in euros in the event of a parallel interest rate increase of one basis point. The basis point values per tenor expresses this sensitivity at specific points on the yield curve, enabling us to identify sensitivity to non-parallel shifts in the market yield curve.
Complementary to the basis point value measurements, we protect the EVE against stress in market interest rates by managing its sensitivity to parallel and non-parallel curve movements of a greater magnitude, with a specific focus on potential adverse effects from (behavioural) non-linearity. We assess the sensitivity of EVE to interest rate scenarios calibrated using statistical analysis in our internal EV-at-Risk calculations. This is supplemented by the regulatory prescribed Supervisory Outlier Test on Economic Value of Equity (SOT EVE).
Fair value impact on P&L and equity (Audited)
Fair value changes of positions marked-to-market may result in P&L and/or (indirect) capital effects from marking-to-market. To manage the interest rate risk component, we monitor and manage the sensitivity of fair value movements to different interest rate scenarios for these items within our risk management framework.
Sensitivity analysis IRRBB
2025 | 2024 | |
|---|---|---|
Basis point value (in € 1,000) | -531 | -530 |
NII-at-Risk (in € millions) | 44 | 54 |
SOT EVE (in € millions, 200 bps instantaneous upward interest rate shock) | -344 | -141 |
SOT NII (in € millions, 200 bps instantaneous downward interest rate shock) | -122 | -118 |
These metrics are actively monitored and managed. The metrics are within risk appetite.
At year-end 2025, the basis point value was € -531 thousand (2024: € -530 thousand), remaining almost unchanged compared to last year.
At year-end 2025, the NII-at-Risk amounted to € 44 million before tax (2024: € 54 million). The sensitivity has decreased compared to last year as a result of a lower cash and cash equivalents position, and changes in assumptions underlying the dynamic balance sheet projections.
At year-end 2025, the SOT EVE amounted to € -344 million (2024: € -141 million), in the scenario where interest rates instantaneously increase by 200 basis points. The increase is primarily attributable to refinements in behavioural assumptions to better reflect customers' interest rate considerations in prepayment behaviour, with ASN Bank assuming that customers now exhibit heightened sensitivity to sudden substantial interest rate increases compared to previous periods.
At year-end 2025, the SOT NII amounted to € -122 million (2024: € -118 million) , in the scenario where interest rates instantaneously decrease by 200 basis points. The sensitivity has slightly increased compared to last year as a result of minimally higher net short-term exposures on the balance sheet.
Sensitivity interest rats
in € millions | 2025 | 2024 | ||
|---|---|---|---|---|
Interest rate +1% | Interest rate -1% | Interest rate +1% | Interest rate -1% | |
Market value equity1 | -192 | 37 | -146 | 57 |
Net interest income2 | 63 | -69 | 68 | -70 |
IFRS equity3 | -27 | 30 | -31 | 34 |
- The market value of equity reflects the net sensitivity in all asset and liability values in the banking book.
- Net interest income reflects the sensitivity of the net interest income for the first 12 months.
- IFRS equity reflects the sensitivity of the fair value through OCI investment portfolio and non-linear derivatives for which hedge accounting is not applied to a parallel 100 basis point interest rate increase or decrease.
We derive the market value of equity from the market value of the assets and liabilities, where possible based on available market prices. If this is not possible, we determine the expected market value on the basis of the net present value of the cash flows. On top of the interest rates, we also take into account any product-specific characteristics, for both the cash flows and the discount rate. The change in the market value of equity is reflected by the difference in value that arises when 100 basis points higher and lower interest rates are applied.
A parallel interest rate increase of 100 basis points would have a negative impact of € 192 million (2024: negative € 146 million) on the market value of equity. Compared to year-end 2024, assets display a higher sensitivity to this scenario, while the liabilities display a lower sensitivity to this scenario. This is partially offset by a higher sensitivity of the hedges.
An instantaneous parallel interest rate increase of 100 basis points would yield a positive impact on one-year forward-looking net interest income of € 63 million at year-end 2025 (2024: € 68 million), while a parallel interest rate decrease of 100 basis points would have a negative impact of € 69 million (2024: negative € 70 million) on net interest income. The sensitivity of net interest income is primarily driven by the liquidity position and derivatives, the majority comprising of short-term repricing items. as a result of a lower cash and cash equivalents position and changes in assumptions underlying the dynamic balance sheet projections.
An instantaneous parallel interest rate increase of 100 basis points would have a direct negative impact on IFRS equity of € 27 million (2024: negative € 31 million), whereas a parallel interest rate decrease of 100 bps would have a positive impact on IFRS equity of € 30 million (2024: € 34 million). The interest rate sensitivity of IFRS equity is reflected in the fair value reserve and other interest income. This is a consequence of changes in the fair value of the HTCS portfolios, including related interest rate derivatives, combined with the fair value changes of derivatives not included in hedge accounting. The reduced sensitivity for a 100 basis points rate shift compared to last year is caused by an increase in hedges in the HTCS portfolios.
Credit spread risk in the banking book (Audited)
Credit spread risk in the banking book (CSRBB) refers to risk driven by changes of the market price for credit risk, for liquidity and for potentially other characteristics of credit-related instruments, which is not captured by another existing prudential framework such as IRRBB or by expected credit/(jump-to-) default risk.
The bank's CSRBB risk management framework is aligned with European Banking Authority (EBA) guidelines and incorporates European Banking Federation (EBF) interpretations. Risk metrics are based on economic value, net interest income measures, and market value changes. These metrics and associated limits are subject to monthly monitoring and reporting to the Asset and Liability Committee (ALCO).
Market risk in the trading book
ASN Bank does not consider the trading book as a core activity, but it has to classify certain activities to the trading book, as per the Capital Requirements Regulation (CRR). The trading book may contain exposure to interest rate risk, credit spread risk and currency risk. There is no mandate in the trading book for equity or commodity risk. The bank does not trade in credit default swaps.
Market risk in the trading book is measured and monitored on a daily basis using Value at Risk (VaR), Expected Shortfall (ES) and dedicated stress‑testing indicators. These metrics support internal risk oversight and are evaluated against formally established limits.
VaR and ES are calculated using a one‑day horizon and confidence levels of 99% and 97.5% respectively. The VaR methodology is based on historical simulation and incorporates the risk factors relevant to the trading book, including interest rate, currency and credit spread movements.
The VaR and ES model forms part of the bank’s internal model inventory. In line with internal governance standards, the model undergoes independent validation to ensure continued robustness and appropriateness.
For more information, please see the Section Market risk exposure.
Based on the nature of the assets in the trading book (a concentration of government and investment grade financials) combined with the relatively limited scale of activities climate and environmental events are assessed as non-material.
Currency risk (Audited)
Foreign exchange risk (or currency risk) is the risk arising from adverse foreign exchange rate movements that may change the value or the cash flows of financial instruments. Currency risk is managed by the Financial Markets & Treasury Department for both the banking book and trading book.
ASN Bank has a low risk appetite for currency risk. Currency risk is mitigated by hedging most of our foreign currency exposures through foreign exchange swaps. Currency risk is managed on a day-to-day basis. To avoid concentration risk in one single foreign currency, limits are used for the positions in each currency. These limits are reviewed periodically. All portfolios that are allowed to contain currency risk are actively monitored to ensure that they remain within the approved limits
The equivalent of the total net foreign currency exposure of the bank at the end of 2025 was € 4.6 million (2024: € 8.6 million).
in € millions | 2025 | 2024 |
|---|---|---|
Total net foreign currency exposure | 4.6 | 8.6 |
Currency exposure as a % Total capital | 0.1% | 0.2% |
Equity risk
With equity holdings in other companies totalling € 15 million (2024: € 16 million), the equity (price) risk is small.
Commodity risk
ASN Bank does not have any exposure to commodities.
Liquidity risk and funding strategy
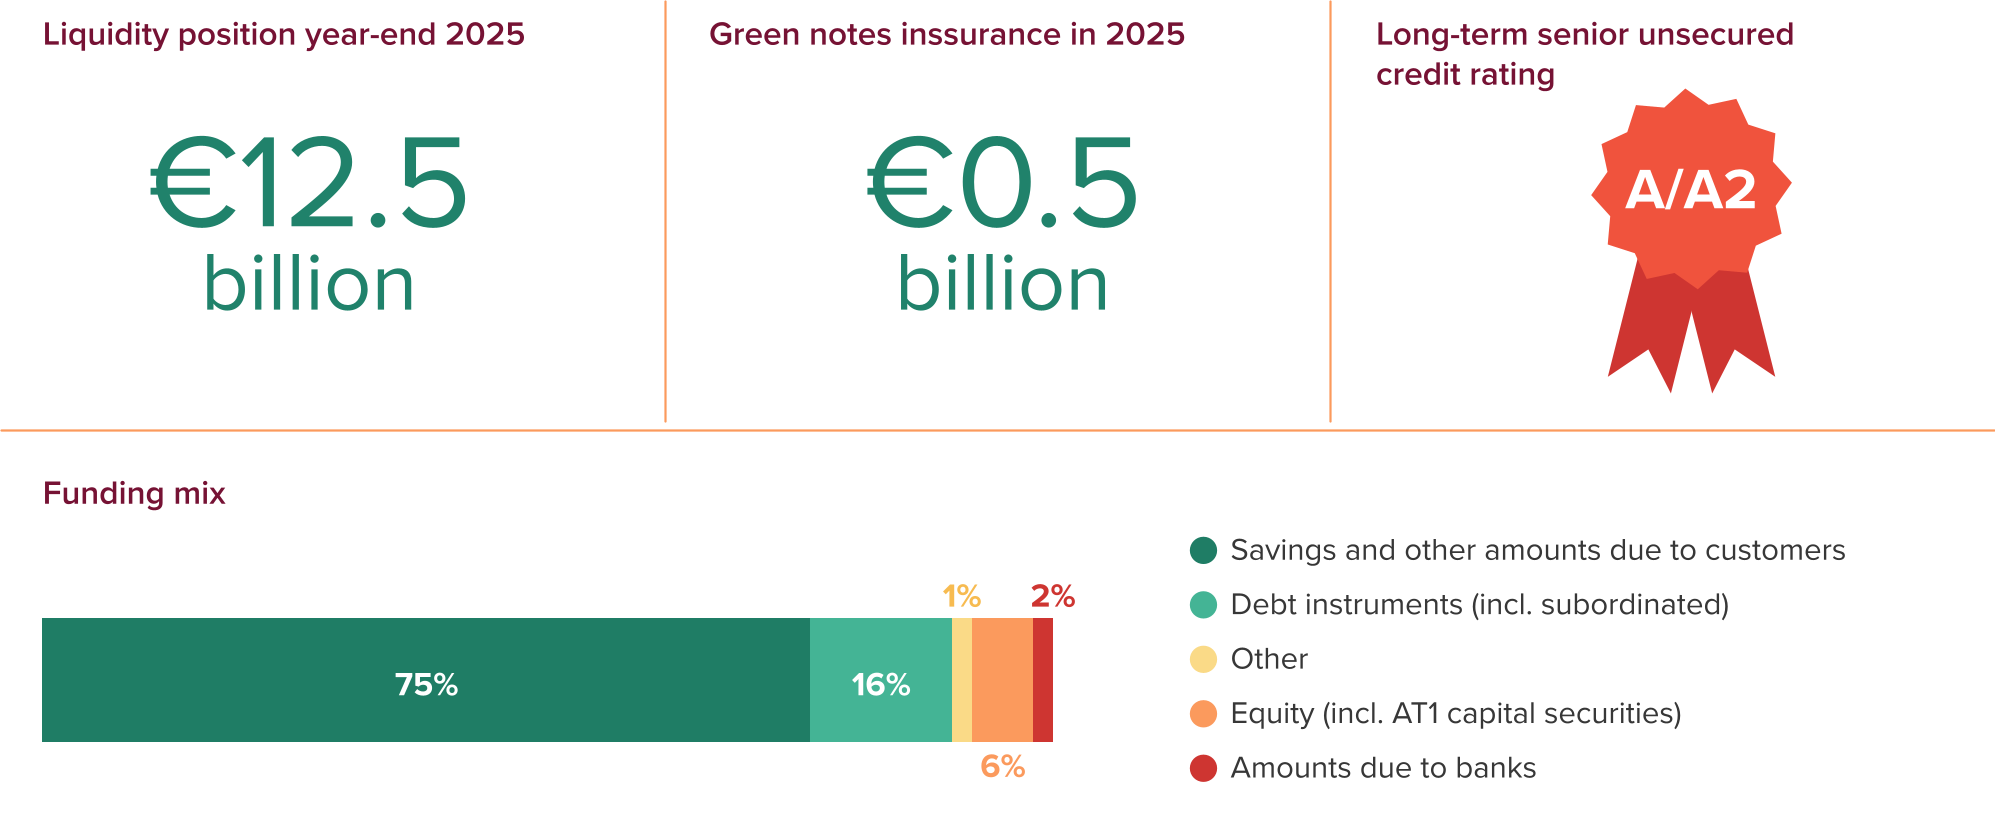
Liquidity risk is the risk that ASN Bank, under normal circumstances as well as in times of stress, has insufficient liquid assets available in the short, medium or long-term to meet its financial obligations without incurring unacceptable costs or losses. Liquidity risk also includes the situation in which the balance sheet structure develops in such a way that ASN Bank suffers excessive exposure to a disruption of its funding sources.
Our liquidity management framework is designed to maintain an adequate liquidity and funding profile to support ASN Bank’s strategy within our risk appetite.
Risk profile
ASN Bank has a strong liquidity position, enabling the bank to meet its financial obligations at all times. We manage our liquidity position such that we are able to absorb the consequences of bank-specific and market-wide stress factors, such as stress in the money and/or capital markets or a strong outflow of savings and current account balances.
To fund our liquidity needs, we seek to diversify our funding sources in accordance with our funding strategy.
Management and control (Audited)
ASN Bank centrally manages its liquidity position, cash flows and liquidity risks.
The risk management cycle, defined in the Section Risk management that we use to manage liquidity risk, constitutes the Internal Liquidity Adequacy Assessment Process (ILAAP). This process is performed to monitor ASN Bank's liquidity profile on a continuous basis and to ensure the timely awareness of developments that may require action. The objective of the ILAAP is to ensure that liquidity risk and control elements are adequately covered, and to evaluate how planned and expected developments could influence the adequacy of ASN Bank's liquidity profile. The risk management lifecycle applies to liquidity risk management in the following way:
Identification of liquidity risks: we continuously aim to identify all potential risks within the scope of liquidity management. For example, we perform an independent risk review of all relevant liquidity management-related proposals.
Assessment of liquidity risks: one element of the ILAAP is that we continuously assess the adequacy of our liquidity profile and liquidity risk management. We present the outcome of our assessment in the annual ILAAP Liquidity Adequacy Statement (LAS) report. We compare the current and expected risk profile with the risk limits we have established. We not only use our findings to make adjustments to the actual liquidity profile, risk appetite, policy or guidelines, but also to improve the risk management process. The assessment of liquidity risks within the liquidity risk management lifecycle also entails:
The recalibration of the liquidity management strategy. We draw up guidelines for a balance sheet structure with optimum efficiency from a liquidity risk perspective.
The definition of actions in the Capital and Liquidity Plan. We do this at least once a year, giving substance to the anticipated funding and liquidity needs ensuing from the Financial Plan & Budget, which has a multi-year horizon. To this end, we make forecasts of relevant risk indicators compared with the internal thresholds and work out various scenarios.
The updating of forecasts in the liquidity part of the monthly Balance Sheet Management (BSM) Asset and Liability Committee (ALCO) report. The forecasts are updated every month based on the most recent insights and reported to the ALCO. The BSM ALCO report is reviewed by the second line, with specific attention to the current risk profile versus the risk thresholds and a forward-looking assessment.
Regular stress testing to provide insight into the key vulnerabilities and to assess the resilience of the liquidity position to severe but plausible adverse (economic) conditions. The results are included in the BSM ALCO report.
Drawing up a recovery plan and contingency plan for adverse circumstances. These plans contain possible measures to strengthen ASN Bank's liquidity position. An annual update of the recovery plan contributes to ASN Bank's continuity. For more information, see the Section Management and control.
Risk response to liquidity risks: every year, we determine the Risk Appetite Statement (RAS) for liquidity risk in conjunction with ASN Bank’s general risk appetite and strategic objectives. To monitor liquidity risk, we use specific risk indicators and we determine the level we feel comfortable with on the basis of the liquidity risk appetite.
Monitoring of liquidity risks: we monitor specific indicators on a daily basis and monitor early warning indicators defined in the RAS for liquidity risk on a regular basis in the Treasury Committee. On top of this, the ALCO monitors the RAS indicators in the BSM ALCO report on a monthly basis.
Residual risk: because of (unexpected) balance sheet or regulatory developments, we may not be able to identify or fully manage liquidity risks at all times. By carrying out the liquidity risk management lifecycle, we aim to identify any such risks and formulate a risk response.
Reporting of liquidity risk indicators: we prepare regulatory and internal reports to measure, monitor and manage ASN Bank’s liquidity profile on an ongoing basis.
In order to be able to instantly absorb unexpected increases in its liquidity need when necessary, ASN Bank maintains a liquidity position, which includes the central bank reserves. In addition, the liquidity position comprises a liquidity portfolio with unencumbered (highly) liquid investments that are eligible as ECB collateral and are registered in the ECMS (Eurosystem Collateral Management System) collateral pool. Investments in our liquidity portfolio are required to meet our sustainability criteria.
Besides the central bank reserves, the liquidity position mainly consists of government (guaranteed) bonds and bonds of ASN Bank’s own securitisations, known as Residential Mortgage-Backed Securities (RMBS), backed by mortgages issued by ASN Bank. We determine the liquidity value of bonds in the liquidity position on the basis of the fair value of the bonds after applying the percentage haircuts as determined by the ECB.
We test the robustness of the liquidity position by means of stress tests. To this end, we have defined various scenarios, of which the so-called combined severe stress test has the highest impact. In this scenario we take the following into account:
a strong outflow of savings and current account balances;
a lack of funding options in money and capital markets;
a decline in the fair value of bonds in the liquidity position;
additional collateral requirements in the event of a 3-notch downgrade in our credit rating;
additional collateral requirements caused by margin requirements on derivatives;
a possible liquidity outflow in the event that committed credit lines are drawn down.
The objective of ASN Bank’s liquidity management is to survive this severe stress scenario for a certain period of time. The impact of this stress scenario on the liquidity position therefore serves as input to determine and monitor ASN Bank’s risk capacity and risk appetite.
We perform the combined severe stress test every month and review the stress test scenarios every year.
The Liquidity Coverage Ratio (LCR) indicates whether we have adequate liquid assets to absorb a prescribed 30-day liquidity stress scenario. The Net Stable Funding Ratio (NSFR) serves to determine the extent to which longer-term assets are financed with more stable forms of funding. Both liquidity standards are subject to a 100% regulatory minimum.
In addition to the LCR and NSFR, we manage the Loan-to-Deposit (LtD) ratio and the degree of asset encumbrance. Whereas the liquidity position focuses on liquidity that is instantly available to function as counterbalancing capacity when necessary, we also manage liquidity with a short-term horizon through short-term loans and investments and money market funding. Apart from this, we monitor the liquidity that may potentially be generated from our assets. On this basis, we assess the extent to which we can absorb certain stress and extreme outflows of funds.
Figures, ratios and trends
In 2025, the liquidity position remained above ASN Bank’s own minimum target and regulatory minimum requirements. We consider the size and composition of our liquidity position sufficiently robust, and in managing the liquidity position we have prudently considered any possible impact from the strategic transformation.
Liquidity indicators
2025 | 2024 | |
|---|---|---|
LCR | 194% | 191% |
NSFR | 142% | 157% |
Loan-to-Deposit ratio1 | 104% | 99% |
Liquidity position (in € millions) | 12,519 | 13,355 |
- For the measurement methodology of this KPI, see Section Reconciliation of alternative performance measures.
The LtD ratio increased to 104% at year-end 2025, from 99% at year-end 2024. This increase was driven by € 4.5 billion loan growth accompanied by a € 1.6 billion increase in deposits.
The Liquidity Coverage Ratio (LCR) and the Net Stable Funding Ratio (NSFR) remained above the regulatory minimum of 100%. At year-end 2025, the LCR stood at 194% (2024: 191%) and the NSFR at 142% (2024: 157%). While the LtD-increase lowered available liquidity, the downward impact on the LCR was offset by attracting more money market funding longer than 30 days and by the increased investment of available liquidity with several counterparties in the money market within the 30-day LCR window to manage our liquidity position.
Fundamental changes in the LCR are mainly driven by net cash flows resulting from loan growth, deposit changes, capital market funding developments and the net cash collateral position related to derivative positions. However, the resulting net cash impact is not necessarily reflected in actual withdrawable central bank reserves as part of high-quality liquid assets, because ASN Bank invests part of its available liquidity with several counterparties in the money market and also attracts money market funding. These cash management choices affect the liquidity included in the scope of the 30-day LCR window via both high-quality liquid assets and cash inflows and outflows.
The reduction in the NSFR is mainly explained by an increase in required stable funding due to the implementation of CRR 3 and an increase in our residential mortgage portfolio.
Liquidity position (Audited)
in € millions | 2025 | 2024 |
|---|---|---|
Central bank reserves | 1,677 | 3,281 |
Sovereigns | 1,389 | 1,378 |
Regional/local governments and Supranationals | 2,109 | 2,118 |
Eligible retained RMBS | 4,932 | 4,549 |
Other liquid assets | 2,412 | 2,029 |
Liquidity position | 12,519 | 13,355 |
The liquidity position amounted to € 12.5 billion at year-end 2025 (2024: € 13.4 billion).
In 2025, cash outflows exceeded cash inflows driven by growth of the residential mortgage portfolio. Central bank reserves decreased from € 3.3 billion at year-end 2024 to € 1.7 billion. The reduction was partly offset by attracting more money market funding. At the same time the available liquidity being invested for cash management purposes increased to € 8.2 billion at year-end 2025 (2024: € 7.4 billion). Of this amount, € 3.8 billion was held at Swiss cantonal banks (2024: € 3.7 billion). Attracted money market funding amounted to € 3.2 billion at year-end 2025 (2024: € 1.5 billion), mainly due to a higher amount of Commercial Paper.
The liquidity value of bonds in the ECMS collateral pool increased to € 10.8 billion at year-end 2025 (2024: € 10.1 billion). This increase mainly resulted from a lower ECB-haircut for our eligible retained RMBS and from registering a higher amount of ECB-eligible collateral in the ECMS collateral pool at year-end 2025.
Encumbered and unencumbered assets
The level of asset encumbrance provides insight into the amount of assets that have been pledged or are subject to any form of arrangement to secure, collateralise or credit enhance any transaction from which they cannot be freely withdrawn.
Encumbered assets | Unencumbered assets | |||||||
|---|---|---|---|---|---|---|---|---|
Carrying amount | Fair value | Carrying amount | Fair value | |||||
2025 | 2024 | 2025 | 2024 | 2025 | 2024 | 2025 | 2024 | |
Equity securities | -- | -- | 13 | 13 | 13 | 13 | ||
Debt securities | 617 | 520 | 606 | 504 | 6,176 | 6,663 | 6,162 | 6,634 |
Other assets | 7,466 | 8,189 | 62,391 | 58,298 | ||||
- of which mortgage loans | 7,154 | 7,253 | 50,782 | 46,024 | ||||
Assets of the reporting institution | 8,083 | 8,709 | 68,580 | 64,974 | ||||
ASN Bank's main sources of funding are savings deposits and current account balances. In addition, we attract funding from the capital market through various funding instruments, as explained in more detail in the Section Funding strategy. These funding instruments include secured debt instruments such as covered bonds and securitisations. We have encumbered a limited part of our loan portfolio in these secured transactions. Other sources that contribute to asset encumbrance are the margining of derivative exposures to manage interest rate risk, a savings-based mortgage arrangement with Athora Netherlands.
At year-end 2025, € 8.1 billion of the assets was encumbered (2024: € 8.7 billion), mainly on account of:
outstanding covered bonds;
collateral deposited in connection with derivative transactions;
a savings-based mortgage arrangement with Athora Netherlands;
outstanding securitisations;
foreign exchange transactions;
payment transactions.
The decrease in 2025 was primarily due to the cash reserve requirement no longer being reported as encumbered based on an updated interpretation of an EBA Q&A. At year-end 2025, the bank had € 6.8 billion (2024: € 7.5 billion) in liabilities secured by the encumbered assets.
The unencumbered part of the assets amounted to € 68.6 billion at year-end 2025 and may partly be converted into cash, for example through a securitisation. Securitised mortgages of which the bank itself holds the bonds are considered to be unencumbered, except if these bonds are used as collateral, for instance in a repurchase transaction.
At year-end 2025, ASN Bank received a total amount of € 1.4 billion in collateral (2024: € 1.2 billion), consisting entirely of cash deposits that serve as collateral for the positive fair value of outstanding derivative positions.
Funding strategy
ASN Bank's funding strategy supports its overall strategy.
Retail savings are ASN Bank’s main source of funding. We attract funding by providing demand deposits, term deposits and current accounts to retail customers. We also attract funding by providing savings and current accounts to SME customers. In 2025, retail deposits increased to € 57.3 billion, from € 55.7 billion at year-end 2024.
The objective of our funding strategy is to optimise the bank’s liquidity and funding profile and to ensure access to diversified funding sources to maintain the bank’s short-term and long-term funding position.
Therefore, in addition to attracting customer deposits, we also attract long-term funding from capital markets. For regulatory purposes and funding diversification, this funding is attracted through various instruments with different terms and investor types spread over regions.
In addition to (subordinated) capital market funding to strengthen the bank's capital and MREL position, ASN Bank can issue capital market funding with maturities over one year through:
senior (unsubordinated) unsecured debt;
(mortgage) securitisations (RMBS);
covered bonds.
The covered bond programme not only permits the issue of public covered bonds but also of private placements.
We issue short-term funding with a term of up to one year in the money markets via our Euro Commercial Paper (ECP) and Negotiable European Commercial Paper (NEUCP) programmes.
The overview below presents the various public funding programmes, including maximum amounts and outstanding nominal value available to ASN Bank at year-end 2025. The overview also includes other important funding sources.
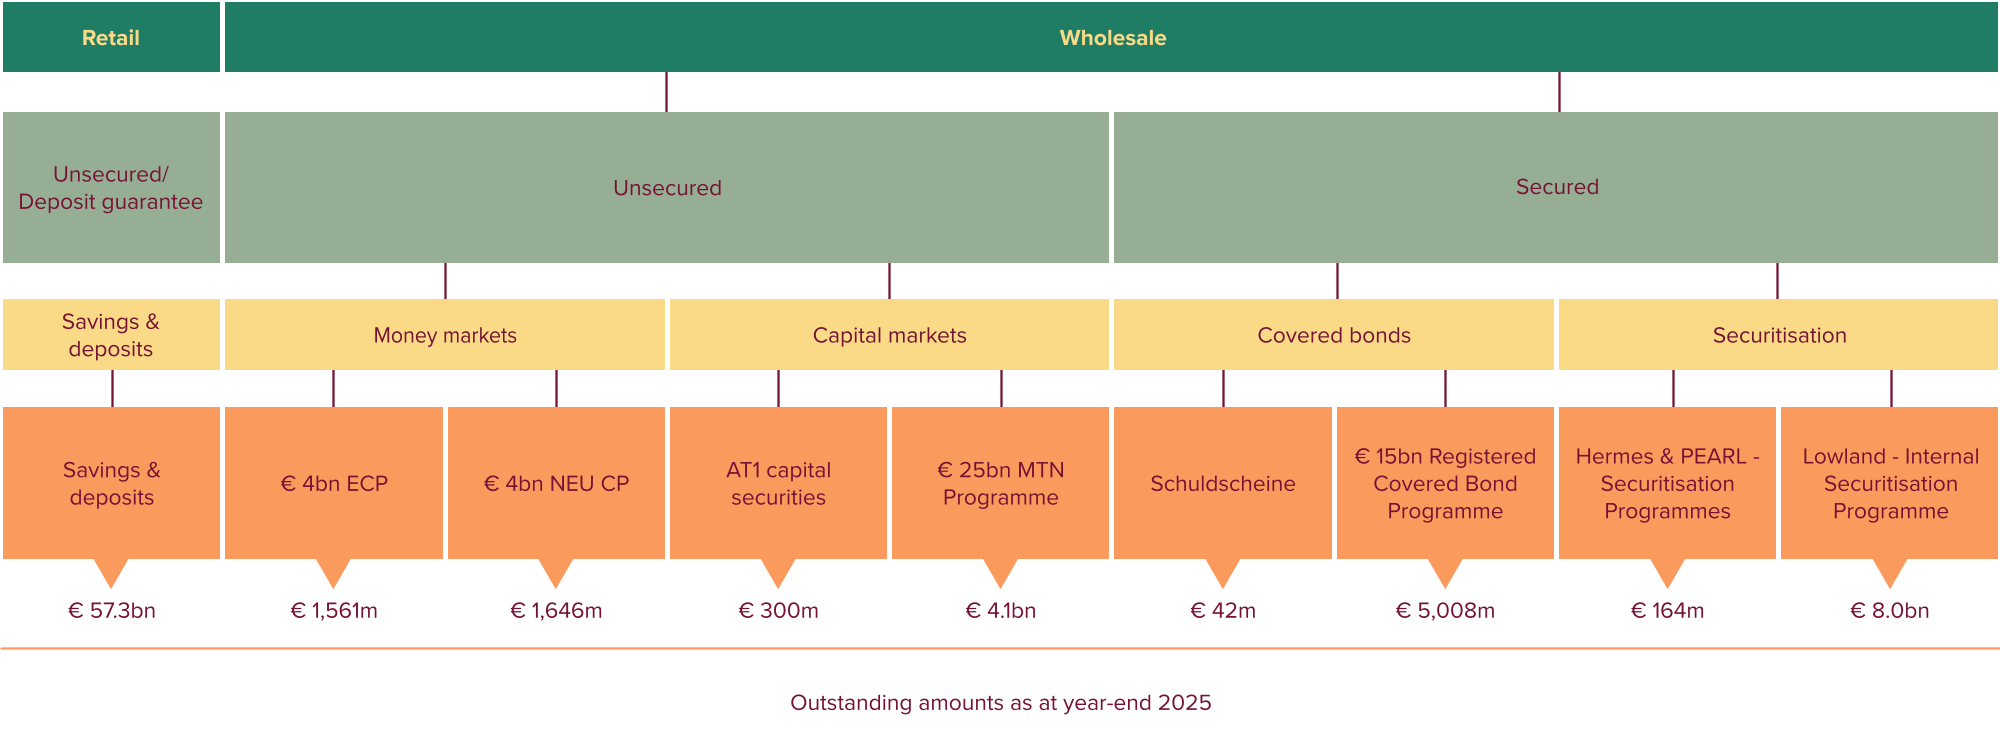
2025: € 76.7 billion | 2024: € 73.7 billion | |
|---|---|---|
Amounts due to customers | 75% | 76% |
Debt instruments (incl. subordinated) | 16% | 14% |
Equity (incl. AT1 capital securities) | 6% | 5% |
Amounts due to banks | 2% | 2% |
Other | 1% | 2% |
The table above provides an overview of the book value-based composition of equity and total liabilities at year-end 2025 and 2024. The percentage of our funding comprising savings and other amounts due to customers declined to 75% (year-end 2024: 76%), mainly due to an increase in money market funding.
The table below provides an overview of the outstanding Commercial Paper (CP) and capital market funding with an original term of more than one year at year-end 2025 and 2024.
in € millions | 2025 | % of total | 2024 | % of total |
|---|---|---|---|---|
AT1 and Tier 2 capital instruments | 800 | 6% | 1,300 | 12% |
Of which green bonds | 800 | 1,300 | ||
Senior non-preferred | 3,500 | 27% | 3,000 | 28% |
Of which green bonds | 3,500 | 3,000 | ||
Senior preferred | 163 | 1% | 257 | 2% |
Of which green bonds | -- | -- | ||
Covered bonds | 5,008 | 39% | 5,053 | 46% |
RMBS | 164 | 1% | 198 | 2% |
Commercial Paper | 3,207 | 25% | 1,096 | 10% |
Total CP and capital market funding | 12,842 | 100% | 10,904 | 100% |
Of which green bonds | 4,300 | 4,300 |
For an explanation of the bank's green bond framework, see our website Green Bonds/ASN Bank.
In 2025, ASN Bank successfully executed a capital market funding transaction to strengthen its MREL position, in anticipation of an outstanding SNP instrument becoming MREL ineligible in 2026:
€ 0.5 billion in green senior non-preferred debt with a 7-year maturity;
As capital market funding redemptions in 2025 were limited to € 0.7 billion, capital market funding decreased from € 9.8 billion to € 9.6 billion.
During 2025, ASN Bank has increased the issued amount of Commercial Paper to € 3.2 billion (2024: € 1.1 billion) to support the efficient use of this funding tool.
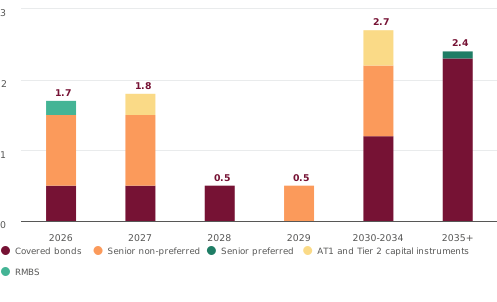
The bar chart presents an overview of the maturity calendar of the capital market funding outstanding with an original maturity of more than one year. In this chart we apply the assumption that this funding will be redeemed at the first call dates.
Capital management
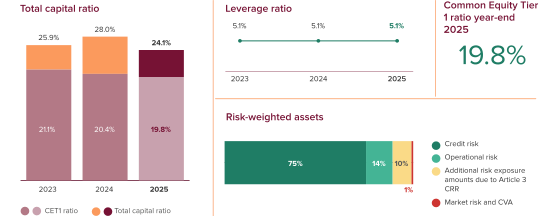
The primary objective of capital management is to ensure that the amount of ASN Bank’s available capital is sufficient to support our corporate strategy. Our capital targets are determined on the basis of the bank’s strategy, risk appetite and exposures, now and in the future. We take into account the supervisory authorities' requirements, rating agencies' expectations and customers' and investors' interests, while aiming to deliver an adequate return for the shareholder. We also steer to meet our internal targets that are in line with our strategy to be a stable bank with a moderate risk profile.
Capital requirements
With effect from 1 January 2025, ASN Bank is required to meet a minimum total Overall Capital Requirement (OCR) of 16.2%, of which at least 11.1% has to be composed of Common Equity Tier 1 (CET1) capital. This obligation stems from the Supervisory Review and Evaluation Process (SREP) performed by the ECB in 2025.
The OCR includes the 8.0% Pillar 1 capital requirement and the 3.5% Pillar 2 capital requirement – together forming the Total SREP Capital Requirement (TSCR) – and the Combined Buffer Requirement (CBR). The Pillar 2 capital requirement is unchanged relative to the previous SREP decision.
Total capital | of which | of which CET1 capital | |
|---|---|---|---|
Pillar 1 requirement | 8.00% | 6.00% | 4.50% |
Pillar 2 requirement | 3.50% | 2.63% | 1.97% |
Total SREP Capital Requirement (TSCR) | 11.50% | 8.63% | 6.47% |
Capital conservation buffer | 2.50% | 2.50% | 2.50% |
O-SII buffer | 0.25% | 0.25% | 0.25% |
Countercyclical capital buffer | 1.91% | 1.91% | 1.91% |
Combined Buffer Requirement (CBR) | 4.66% | 4.66% | 4.66% |
Overall Capital Requirement (OCR) | 16.16% | 13.29% | 11.13% |
The CBR, to be held in the form of CET1 capital, consists of a capital conservation buffer, a capital buffer for Other Systemically Important Institutions (O-SII buffer) and a countercyclical capital buffer. As at 1 January 2026, ASN Bank's capital conservation buffer equalled 2.50% and the O-SII buffer 0.25%. The countercyclical capital buffer for exposures to counterparties is currently 1.91%. This buffer is intended to protect banks against cyclical risks arising from excessive credit growth.
Based on the current capital requirements and the capital position at year-end 2025, the Maximum Distributable Amount (MDA) trigger level amounted to 11.8% of CET1 capital, including a 0.5% Additional Tier 1 (AT1) shortfall and 0.2% Tier 2 (T2) shortfall. In case of a breach of the MDA trigger level, the maximum amount available for dividend payments and/or AT1 coupon distributions would be restricted in accordance with the Capital Requirements Directive (CRD).
ASN Bank sets its target for the leverage ratio at a level of at least 4.5% and for the CET1 ratio target at a level of at least 17.0%. Our leverage ratio target of at least 4.5% is in line with the leverage ratio of comparable European banks and includes an ample management buffer to withstand severe stress situations.
The CET1 ratio target of at least 17% includes an ample management buffer - above the current CET1 OCR of 11.1% - to withstand severe stress scenarios and to provide flexibility to absorb potentially higher capital requirements.
Capital expected to sustainably exceed our minimum targets is available for distribution, subject to regulatory approval.
On 18 December 2025 the National Resolution Authority (NRA) updated the Minimum Requirement for Own Funds and Eligible Liabilities (MREL) requirements for ASN Bank with effect from 18 December 2025. The MREL requirement based on the non-risk weighted leverage ratio exposure (LRE) amounts to 7.91% and the MREL requirement based on RWA to 21.56%, excluding the Combined Buffer Requirement. Both the LRE and RWA MREL requirements are to be fully met with subordinated instruments, i.e. Tier 1 capital, Tier 2 capital and senior non-preferred (SNP) notes with a residual contractual maturity of at least 1 year. The non-risk-weighted MREL requirements are more restrictive for ASN Bank than the risk-weighted MREL requirements.
In 2025, ASN Bank successfully executed a capital market funding transaction to strengthen its MREL position in anticipation of expected future redemptions:
€ 0.5 billion in green SNP debt with a 7-year maturity.
Including this instrument ASN Bank operates well above the MREL requirements.
Management and control (Audited)
Our capital strategy incorporates the objective of having a solid capital position at our disposal to support ASN Bank’s corporate strategy, combined with an adequate Return on Equity (RoE). As for the RoE, ASN Bank applies a (long-term) target in the range of 8-10%. The basic principle for the capital amount held is that the bank maintains buffers in addition to the minimum amount of capital required by the supervisory authority to guarantee sufficient capitalisation in the event of a severe yet plausible stress scenario.
The minimum amount of capital required by law, i.e. regulatory capital, is based on risk-weighted capital ratios (CET1 capital, Tier 1 capital, total capital) and the required non-risk-weighted capital ratio, i.e. the leverage ratio. The minimum capital ratios are based on the SREP. In addition to these required capital ratios, ASN Bank is subject to the Minimum Requirement for Own Funds and Eligible Liabilities (MREL) on both a risk-weighted and non-risk-weighted basis.
ASN Bank manages its capital from several perspectives, as is shown in the figure.
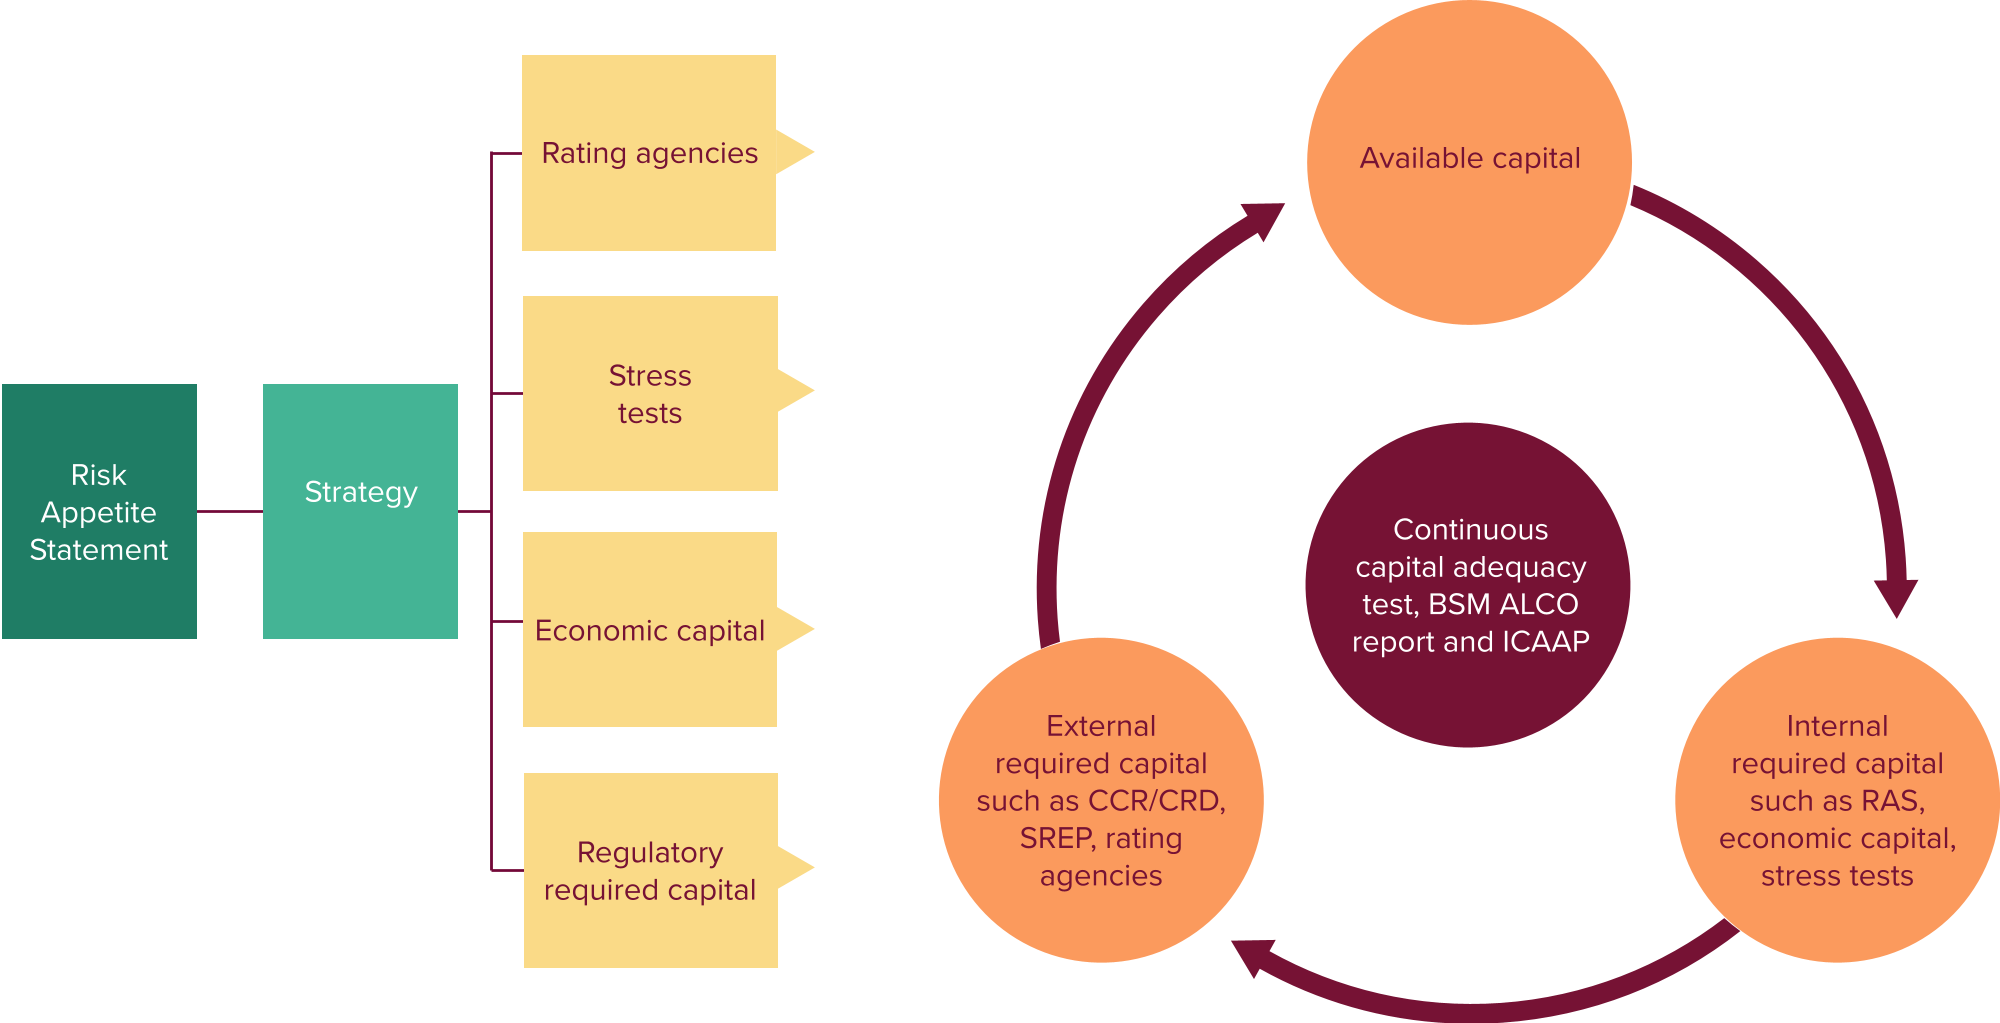
ASN Bank also makes its own internal (economic) estimate of the amount of capital required. This differs from regulatory capital in two significant respects, namely:
We include in our calculations of economic capital risks from which material losses may ensue within a one-year horizon according to internal insights. This means that we consider more types of risk than in regulatory capital calculations.
We use our own insights to translate our risk appetite into (expected) internal capital requirements going forward.
We share the economic capital requirements with the supervisory authority. This is part of the Internal Capital Adequacy Assessment Process (ICAAP). We also use the economic capital requirements to determine our internal capital targets and thresholds for specific types of risk, as applied in the Risk Appetite Statement (RAS).
Every year, ASN Bank performs several stress tests to test the robustness of capital adequacy and examine other financial aspects, such as in the areas of liquidity and profitability. Stress tests may either be initiated internally or requested by supervisory authorities.
The scenarios to be calculated are drafted on the basis of a detailed risk identification that considers both systemic risks and idiosyncratic risks, i.e. financial system-related risks and ASN Bank-specific risks. In addition to scenario analyses, used to calculate the impact of, for example, a macroeconomic scenario on ASN Bank’s capital position, we also perform sensitivity analyses and reverse stress tests. The latter starts from a pre-determined outcome, such as a situation in which the bank is unable to meet its minimum capital requirements, and then looks at events that could lead to such a situation.
For the scenarios for which the impact is calculated by means of a stress test, we estimate the development of unemployment, economic growth, the interest rate and other factors. In these stress tests, the macroeconomic variables adversely impact aspects such as the net interest margin, the creditworthiness of the outstanding loan portfolio and the fair value of the interest-bearing investment portfolio.
This subsequently results in a deterioration of the bank’s capital position. The stress test results are not only used to analyse the bank’s sensitivity to various types of stress, but also as input to determine risk appetite-related thresholds and management buffers to set the internal capital ratio target levels. Finally, they are used as input for ASN Bank’s recovery plan.
The bank’s creditworthiness is assessed by credit rating agencies S&P, Moody’s and Fitch. To determine a credit rating, they look at aspects such as our capital position. To ensure that our capital ratios are in line with our credit rating ambition, we include the corresponding capital requirements in our capital planning.
Credit ratings
Long-term rating | Short-term rating | Outlook | |
S&P | A | A-1 | Negative |
Moody's | A2 | P-1 | Stable |
Fitch | A- | F1 | Stable |
In 2025, rating agencies S&P, Moody’s and Fitch all reaffirmed ASN Bank’s credit ratings. In March 2025, Moody’s changed its outlook on our credit ratings to stable. The rating agencies’ rating reports are available on our website.
The risk management lifecycle applies to capital management by:
Identifying risks within the scope of capital adequacy: we continuously aim to identify that all potential, material and emerging risks are within the scope of capital adequacy. For example, we perform an independent risk review of all relevant capital adequacy-related proposals.
Assessing the risk profile against the risk thresholds by comparing the risk exposure to the available capital from own funds and MREL eligible liabilities: as part of the ICAAP, we continuously assess the adequacy and effectiveness of the risk management framework as far as capital adequacy and its compliance with internal policies and the risk appetite framework are concerned. ICAAP provides input for the ECB's SREP. We present the outcome of the assessment in the annual ICAAP Capital Adequacy Statement (CAS) report. The assessment of (expected future) capital exposure and developments also comprises the:
recalibration of the capital management strategy;
definition of actions in the capital and liquidity plan that we draw up at least once a year, giving substance to the anticipated capital needs ensuing from the Financial Plan & Budget (FP&B). As the FP&B has a multi-year horizon, we make forecasts of relevant risk indicators and compare these with the internal thresholds. We work out various scenarios, taking into account the anticipated effects of future regulations when applicable;
update of forecasts in the capital part of the monthly Balance Sheet Management (BSM) Asset and Liability Committee (ALCO) report. The BSM ALCO report is reviewed by the second line with specific attention to the current risk profile versus the risk thresholds and a forward-looking assessment;
regular stress tests to provide insight into the key vulnerabilities and to assess the resilience of the capital position to severe but plausible adverse (economic) conditions. The results are used to set the risk appetite thresholds.
Defining the risk response to capital adequacy: every year, we determine the RAS for capital adequacy in conjunction with the bank’s general risk appetite and strategic objectives. To monitor capital adequacy, we use specific risk indicators and determine the level above which we feel comfortable based on the risk appetite for capital adequacy.
Monitoring capital adequacy: the Treasury Committee monitors early warning indicators defined in the RAS for capital adequacy on a regular basis. The ALCO monitors the actual and forecasted development of the RAS indicators in the BSM ALCO report on a monthly basis.
Identifying residual risk: not all risks to capital adequacy are identified or fully managed at all times, because of expected or unexpected balance sheet or regulatory developments. By following the capital adequacy lifecycle, we intend to identify these risks and formulate a risk response.
Reporting capital adequacy indicators: we prepare regulatory and internal reports to measure, monitor and manage the bank’s capital adequacy on an ongoing basis.
Contingency planning, i.e. the planning for unforeseen events, is part of the bank’s recovery plan. This plan's key objective is to prepare ASN Bank for a crisis in a way that enables us to recover independently and safeguard the bank’s continuity.
Contingency planning encompasses the drafting and implementation of an action plan that allows us to take prompt measures as soon as our capital position deteriorates as anticipated or unexpectedly, for example as a result of financial market conditions. In addition to capital aspects, we also monitor the situation with respect to potential liquidity problems, both of which are identified by frequently monitoring early warning indicators. Changes in these indicators may be a first sign of stress.
On top of early warning indicators, we have defined recovery indicators that may trigger activation of the recovery plan. Applying the recovery plan-based measures helps us reinforce the capital ratios and recover independently. The scope of these measures is wide and not only relates to capital and liquidity, but also to operations and communications. The nature and severity of the deteriorating conditions will determine the measures, for example capital strengthening options, lowering the risk-weighted assets or raising funding, whatever is appropriate.
Besides a description of the available measures and conditions to be met before any measures are implemented, the recovery plan also contains an analysis of the expected recovery capacity. The analysis is supported by several (severe) stress scenarios in which the effectiveness of these measures has been assessed, the so-called recoverability assessment.
Every year, the recovery plan is updated and discussed with the Joint Supervisory Team (JST) of the ECB. At the latter's request, the recovery plan for 2025 included four scenarios that addressed system-wide macroeconomic and idiosyncratic stress. This analysis proved ASN Bank's capital and liquidity recoverability capacity to be adequate.
Developments in capital requirements
As of 1 January 2025, we report our regulatory capital metrics and risk exposures in line with Capital Requirements Regulation 3 (CRR 3) instead of CRR 2, with a first-time adoption effect of + 0.2 percentage points on ASN Bank’s Common Equity Tier 1 (CET1).
The increase of the CET1 ratio of 0.2% mainly follows from a € 0.4 billion decrease in ASN Bank’s Internal Ratings Based (IRB) risk-weighted assets (RWA), a € 0.1 billion decrease in RWA for credit risk calculated according to the Standardised Approach (SA) and a € 7 million increase in CET1 capital, largely offset by a € 0.4 billion increase in RWA for operational risk.
The downward impact of CRR 3 on IRB-based RWA is due to the removal of a 1.06 scaling factor to determine residential mortgage-related RWA and the adjustment of the credit conversion factor for off-balance sheet items under the revised IRB approach. These effects were to a large extent offset by applying a 18% floor for the calculated residential mortgage-related IRB-based risk weight to include additional conservatism in agreement with prudential requirements. The upside impact of CRR 3 on RWA for operational risk is due to a changed methodology that also takes into account the administrative fines and provision for AFC remediation in 2024.
Under CRR 3, ASN Bank applies the substitution approach for the credit risk calculation of NHG-guaranteed mortgages. At year-end 2025, the application of the substitution approach results in a € 21 million reduction of expected losses and a € 1.9 billion reduction of the reported IRB RWA for credit risk because NHG-guaranteed mortgages are effectively reported as 0% risk-weighted SA exposures to central government. Pending further refinements to be made in IRB modelling regarding non-NHG mortgages, currently the overall impact is neutralised by applying an Article 3 CRR CET1 capital deduction and an Article 3 CRR RWA add-on of equal size.
From 1 January 2022, DNB applies a minimum risk weighting for mortgage portfolios of Dutch banks, with the exception of mortgages with (partial) National Mortgage Guarantee (NHG) coverage, to banks that use internal risk models to calculate capital requirements for their mortgage portfolios, such as ASN Bank. In 2024 the regulation was extended until 30 November 2026. As at year-end 2025, this measure had no impact on ASN Bank, given the bank's RWA level for residential mortgages.
ASN Bank deducts any insufficient coverage for non-performing exposures (NPEs) under the CRR statutory backstop from its CET1 capital. As at year-end 2025 this CET1 capital deduction amounted to € 4 million. The prudential provisions for outstanding NPEs according to the ECB expectations and SREP recommendation resulted in an additional Article 3 CRR CET1 capital deduction of € 14 million at year-end 2025.
Figures, ratios and trends
In € millions | 2025 | 2024 | 2024 |
|---|---|---|---|
CRR 3 | CRR 3 | CRR 2 | |
CET1 capital | 3,613 | 3,448 | 3,442 |
Tier 1 capital | 3,911 | 3,746 | 3,740 |
Tier 2 capital | 494 | 997 | 997 |
Total capital | 4,405 | 4,743 | 4,737 |
Senior non-preferred (SNP) liabilities with remaining maturity >1 year | 3,000 | 3,000 | 3,000 |
Total capital and eligible SNP liabilities (MREL) | 7,405 | 7,743 | 7,737 |
Risk-weighted assets | 18,259 | 16,931 | 17,059 |
Exposure measure (CRR) | 76,810 | 73,112 | 73,383 |
Common Equity Tier 1 ratio1 | 19.8% | 20.4% | 20.2% |
Tier 1 capital ratio | 21.4% | 22.1% | 21.9% |
Total capital ratio | 24.1% | 28.0% | 27.8% |
MREL (Total capital and eligible SNP liabilities) (LRE) | 9.6% | 10.6% | 10.5% |
MREL (Total capital and eligible SNP liabilities) (RWA) | 40.6% | 45.7% | 45.4% |
Leverage ratio | 5.1% | 5.1% | 5.1% |
- CET1 Capital / risk-weighted assets.
ASN Bank's CET1 ratio decreased to 19.8%, well above our target of at least 17%. While our CET1 capital increased due to the addition of interim profits, the amount of RWA increased relatively more as the bank initiated additional asset growth, thus optimising our risk-return profile.
In 2025, total equity rose by € 283 million to € 4,331 million due to the net profit of € 268 million and € 36 million increase in the fair value reserve and cash flow reserve, offset by the payment of AT1 coupons of € 21 million. Available distributable items1 amounted to € 3,682 million (2024: € 3,436 million).
In € millions | 2025 | 2024 |
|---|---|---|
CRR 3 | CRR 2 | |
Total equity | 4,331 | 4,048 |
Non-eligible interim profits | -213 | -139 |
Additional Tier 1 capital | -298 | -298 |
Total equity for CRD purposes | 3,820 | 3,611 |
Cashflow hedge reserve | -11 | -13 |
Other prudential adjustments | -4 | -5 |
Total prudential filters | -15 | -18 |
Intangible assets | -5 | -5 |
IRB shortfall1 | -147 | -128 |
Insufficient coverage for non-performing exposures | -4 | -- |
Additional deductions of CET1 capital due to Article 3 CRR | -36 | -18 |
Total capital deductions | -192 | -151 |
Total regulatory adjustments to total equity | -207 | -169 |
CET 1 capital | 3,613 | 3,442 |
Additional Tier 1 capital | 298 | 298 |
Tier 1 capital | 3,911 | 3,740 |
Eligible Tier 2 | 494 | 997 |
IRB Excess1 | -- | -- |
Tier 2 capital | 494 | 997 |
Total capital | 4,405 | 4,737 |
Ratios: | ||
Common equity Tier 1 ratio | 19.8% | 20.2% |
Tier 1 capital ratio | 21.4% | 21.9% |
Total capital ratio | 24.1% | 27.8% |
- The IRB shortfall/excess is the difference between the expected loss under the CRR/CRD and the IFRS provision for the residential mortgage portfolio.
Total equity according to the Capital Requirements Directive (CRD) is determined by deducting non-eligible interim profits and the amount of Additional Tier 1 capital of € 298 million from total equity.
After profit appropriation by the General Meeting of Shareholders (GMS) in April 2025, the € 139 million non-eligible interim profits as at year-end 2024 were added to CET1 capital.
Profit not yet eligible as equity for CRD purposes for 2025, namely € 213 million, is made up of 60% of the net profit for the first half of 2025 (€ 138 million) and the full net profit for the second half of 2025 (€ 131 million).
CET1 capital is determined by subtracting multiple regulatory and other adjustments from total equity for CRD purposes. At year-end 2025 these regulatory adjustments amounted to € 207 million (2024: € 169 million), consisting mainly of a € 147 million deduction related to the IRB shortfall and an € 36 million deduction due to the Article 3 CRR deduction. This Article 3 CRR deduction consists of € 14 million following the ECB's guidelines on non-performing exposures (NPEs), deduction of € 1 million related to interest-only mortgages and a deduction of € 21 million related to the substitution approach for the credit risk calculation of NHG-guaranteed mortgages.
The IRB shortfall is the result of our Advanced Internal Ratings Based (AIRB) model calculations. To determine the credit risk in our residential mortgage portfolio, ASN Bank avails itself of an AIRB model entitled Particuliere Hypotheken Interne Rating Model (PHIRM). This model is continuously updated to comply with new rules and regulations.
Our CET1 capital rose by € 171 million to € 3,613 million. Tier 2 capital decreased by € 503 million due to call of the green Tier 2 capital instrument that was issued in 2020. This had already been anticipated in 2024 with the issuance of € 0.5 billion in a green Tier 2 capital instrument.
in € millions | Maturity date | First possible call date | Nominal amount | |
|---|---|---|---|---|
2025 | 2024 | |||
Bond loan (subordinated) | 22-10-2030 | 22-07-2025 | -- | 500 |
Green bond loan (subordinated) | 27-11-2035 | 27-11-2030 | 500 | 500 |
Total | 500 | 1,000 | ||
- Equaling the sum of share premium, other reserves including retained earnings and net result for the period.
Pillar 1 sets the minimum capital requirements based on the risk-weighted assets (RWA) for three types of risk: credit risk, market risk and operational risk.
In addition to using the AIRB model PHIRM to determine the credit risk in our residential mortgage portfolio, we use the SA - rather than internal models - to calculate the credit risk of other portfolios (including non-residential mortgages and loans to governments, businesses and financial institutions), market risk and operational risk. For more information on credit risk, please refer to the Section Credit risk, on market risk to the Section Market risk and on operational risk to the Section Non-financial risks.
In 2025, total RWA rose by € 1.2 billion to € 18.3 billion, including the € 0.1 billion downward impact of CRR 3 (see paragraph implementation CRR3). The € 1.3 billion RWA increase during 2025 was mainly caused by a € 0.9 billion increase resulting from residential mortgage volume growth, a € 0.2 billion increase in RWA for operational risk and a € 0.2 billion increase in RWA for credit risk calculated according to the SA, primarily caused by increased exposures to financial institutions.
The RWA for credit risk based on the AIRB approach mainly decreased due to the impact of the substitution approach for the credit risk calculation of NHG-guaranteed mortgages, neutralised by applying an Article 3 CRR RWA add-on of equal size.
The RWA for market risk increased by € 33 million. The RWA for the Credit Valuation Adjustment and securitisation notes increased slightly by € 22 million in total.
The following table shows the RWA per type of risk, exposure category and method of calculation.
in € millions | EAD | RWA | 8% Pillar 1 capital requirement | |||
|---|---|---|---|---|---|---|
2025 | 2024 | 2025 | 2024 | 2025 | 2024 | |
CRR 3 | CRR 2 | CRR 3 | CRR 2 | CRR 3 | CRR 2 | |
Credit risk AIRB approach | ||||||
Residential mortgages | 44,667 | 53,972 | 8,519 | 9,938 | 682 | 795 |
Total credit risk AIRB approach | 44,667 | 53,972 | 8,519 | 9,938 | 682 | 795 |
Additional risk exposure amounts due to Article 3 CRR1 | 1,880 | 150 | ||||
Total Residential mortgages | 10,399 | 9,938 | 832 | 795 | ||
Credit risk standardised approach | ||||||
Central governments and central banks | 16,550 | 5,857 | -- | -- | -- | -- |
Regional governments and local authorities | 1,673 | 1,335 | 64 | 103 | 5 | 8 |
Public sector entities | 1,190 | 1,276 | 36 | 42 | 3 | 3 |
Multilateral development banks | 400 | 444 | -- | -- | -- | -- |
International organisations | 387 | 310 | -- | -- | -- | -- |
Financial institutions | 7,760 | 6,897 | 1,809 | 1,738 | 144 | 140 |
Corporates2 | 2,311 | 1,811 | 145 | |||
Other corporates2 | 1,638 | 907 | 73 | |||
Specialised lending2 | 774 | 776 | 62 | |||
Retail excl. mortgages | 233 | 540 | 151 | 351 | 12 | 28 |
Secured by mortgages on immovable property | 1,556 | 1,066 | 784 | 431 | 63 | 34 |
Exposures in default | 69 | 37 | 85 | 44 | 7 | 4 |
Covered bonds | 1,112 | 947 | 111 | 95 | 9 | 8 |
Shares | 15 | 16 | 38 | 16 | 3 | 1 |
Other Items | 381 | 329 | 296 | 288 | 24 | 23 |
Total credit risk standardised approach | 33,738 | 21,365 | 5,057 | 4,919 | 405 | 394 |
Securitisation positions | 269 | 222 | 27 | 28 | 2 | 2 |
Total credit risk | 78,674 | 75,559 | 15,483 | 14,885 | 1,239 | 1,191 |
Market risk standardised approach | ||||||
- Specific risk | 10 | -- | -- | -- | -- | -- |
- General risk | -- | -- | 192 | 159 | 15 | 13 |
Operational risk | ||||||
- Standardised approach | -- | -- | 2,507 | 1,961 | 201 | 157 |
Total market- and operational risk | 10 | -- | 2,699 | 2,120 | 216 | 170 |
Credit Valuation Adjustment (CVA) | -- | 77 | 54 | 6 | 4 | |
Total | 78,684 | 75,559 | 18,259 | 17,059 | 1,461 | 1,365 |
- This is an Article 3 CRR add-on pending further refinements to be made in IRB modelling regarding non-NHG mortgages.
- Corporates under CRR2 is split in Other corporates and Specialised lending under CRR3.
The Exposure at Default (EAD) from ASN Bank's total assets increased from € 75.6 billion at year-end 2024, to € 78.7 billion at the end of 2025. The residential mortgage portfolio EAD decreased from € 54.0 billion to € 44.7 billion driven by the application of the substitution approach for NHG-guaranteed residential mortgages. NHG-guaranteed residential mortgages (€ 13.1 billion) are now reported as exposures to Central governments and central banks.
The EAD for specific risk on traded debt instruments amounted to € 10 million per year-end 2025 (nil per year-end 2024).
The leverage ratio is the ratio between a bank’s amount of Tier 1 capital and its total risk exposure. To prevent banks from building up excessive debts a minimum Pillar 1 requirement for the leverage ratio of 3.0% applies with effect from June 2021. As from 2022, the ECB also assesses the risk of excessive leverage among supervised banks. This has not resulted in an additional Pillar 2 leverage ratio requirement for ASN Bank.
To manage the risk of excessive leverage, leverage ratio control is part of our continuous capital planning process as explained in the Section Management and control. Wholesale funding that affects the leverage ratio denominator is only attracted when this is consistent with our liquidity management and funding strategy. For more information, please refer to the Section Liquidity risk and funding strategy.
The table below presents ASN Bank's leverage ratio according to the composition of the CRR-prescribed risk exposure measure.
The leverage ratio remained unchanged from year-end 2024 at 5.1%, balanced by the € 171 million increase in CET1 capital and the € 3.4 billion increase in the exposure measure.
The 5.1% leverage ratio is well above the regulatory requirement of 3.0% and above our target of at least 4.5%.
in € millions | 2025 | 2024 |
|---|---|---|
CRR 3 | CRR 2 | |
Tier 1 capital | 3,911 | 3,740 |
Exposure values: | ||
Derivatives: market value | 17 | 24 |
Derivatives: add-on mark-to-market method | 754 | 647 |
Off-balance: medium/low risk | 1,430 | 1,480 |
Off-balance: other | 3 | 3 |
Regular-way purchases and sales awaiting settlement | 106 | |
Other assets | 74,768 | 71,550 |
Receivables for cash variation margin provided in derivatives transactions | -62 | -152 |
Regulatory adjustments (Tier 1) | -206 | -169 |
Exposure measure (CRR) | 76,810 | 73,383 |
Leverage ratio | 5.1% | 5.1% |
The table below presents the risk-weighted and non-risk-weighted MREL ratios of ASN Bank.
Total capital and eligible SNP liabilities fell by € 0.3 billion to € 7.4 billion. This was the result of € 0.5 billion of outstanding SNP debt no longer being MREL eligible and the call of an outstanding green Tier 2 capital instrument of € 0.5 billion, partly compensated by a € 171 million increase in CET1 capital and the issuance of € 0.5 billion in green SNP debt.
At year-end 2025, the non-risk-weighted MREL ratio based on the LRE stood at 9.6% (2024: 10.5%), including total capital and SNP liabilities eligible for MREL.
The risk-weighted MREL ratio stood at 40.6% (2024: 45.4%).
in € millions | 2025 | 2024 |
|---|---|---|
CRR 3 | CRR 2 | |
Total capital | 4,405 | 4,737 |
Senior non-preferred (SNP) liabilities with remaining maturity >1 year | 3,000 | 3,000 |
Total capital and eligible SNP liabilities | 7,405 | 7,737 |
MREL BRRD2 exposure measures: | ||
Exposure measure (CRR) | 76,810 | 73,383 |
Risk-weighted assets | 18,259 | 17,059 |
MREL LRE: | ||
MREL (Total capital and eligible SNP liabilities) (LRE) | 9.6% | 10.5% |
MREL RWA: | ||
MREL (Total capital and eligible SNP liabilities) (RWA) | 40.6% | 45.4% |
Dividend
ASN Bank has set a target range of 40%-60% of net profit for regular dividend distribution.
For the financial year 2025 we propose a dividend amount of € 124 million, which corresponds to a pay-out ratio of 50% of the net profit attributable to the shareholder.
For the 2024 financial year, ASN Bank decided in its General Meeting of Shareholders (GSM) in April 2025 to retain the net profit.
Sustainability risk (In scope of CSRD)
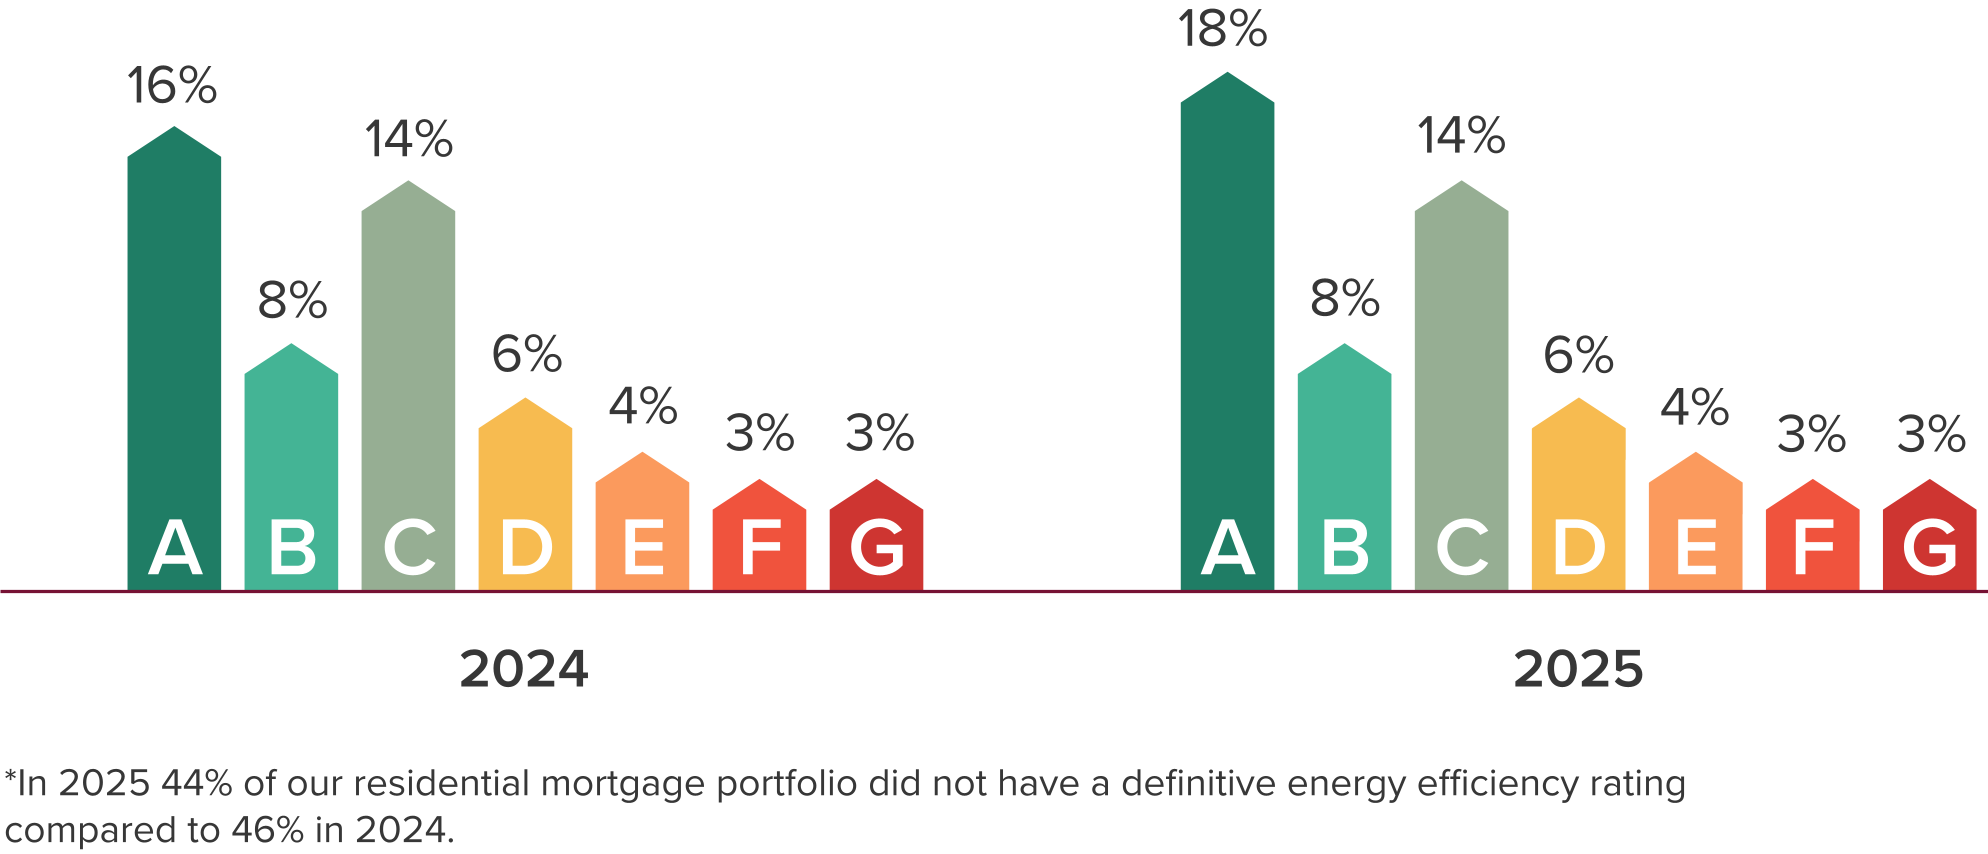
The figure above shows our residential mortgage portfolio broken down by energy efficiency rating category. The energy efficiency ratings serve as an identification of transition risk and indicate the environmental performance of the properties.
Sustainability risk is one of ASN Bank's strategic risks and is part of the bank's risk taxonomy as a stand-alone risk type. This categorisation supports the bank's aim of developing a holistic approach to the incorporation of ESG risk drivers into its overall business strategy, governance, risk management framework, organisational structure and reporting.
We define sustainability risk as the risk arising from Environmental, Social or Governance-related (ESG) factors over the short, medium or long-term that may have an (in)direct financial or reputational impact on ASN Bank - either directly or by acting as a driver for other risk types. In addition, the risk arising from the value chain of ASN Bank which may have an (in)direct negative impact on the environment or society.
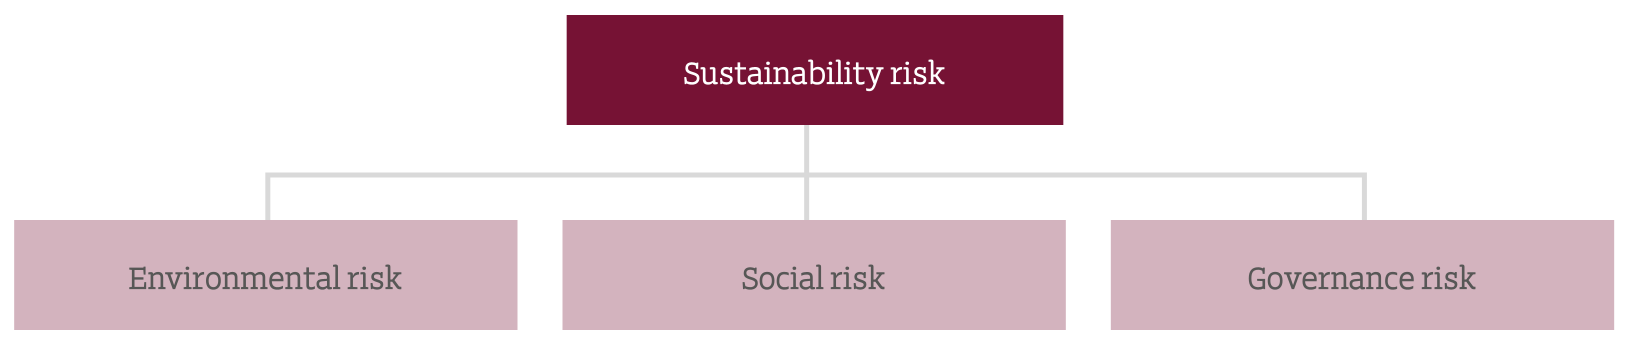
As shown in the figure, we divide sustainability risk into sub-risk types and define them as follows.
Environmental risk is the risk of (in)direct financial or reputational damage to the bank due to acute or chronic physical environmental events or the role in the transition to an environmentally sustainable economy of the bank itself or of parties with which the bank may interact. In addition, the risk arising from the value chain of ASN Bank which may have a (in)direct negative impact on the environment.
Social risk is the risk of (in)direct financial or reputational damage to the bank due to social events or the role in the transition to a social sustainable economy of the bank itself or by parties with which the bank may interact. In addition, the risk arising from the value chain of ASN Bank, that may have a negative impact on social topics such as human rights and privacy.
Governance risk is the risk of (in)direct financial or reputational damage to the bank due to governance-related events or the role in the transition to a sustainable economy. In addition, the risk arising from the value chain of ASN Bank, which may have a negative impact on environment or society due to inadequate corporate governance, ethical management or transparency.
Sustainability risk management refers to the management of all risk drivers that may affect our risk profile, or the environment or society. In this respect, sustainability risk management concerns the control of outside-in risks and the risks arising from negative inside-out impacts.
Risk profile
ASN Bank has a low appetite for sustainability risk, our risk profile is mainly driven by the bank’s business model and strategy. Being a retail bank with a high concentration of residential mortgage loans in the Netherlands, the risk profile is impacted as follows:
Physical risk: The intensity and frequency of wet and at the same time longer dry periods are increasing and homes will consequently be impacted by the deterioration of foundations and soil. We closely monitor these developments.
Transition risk: The exposure to transition risk largely depends on the transition to a more sustainable housing sector. We actively encourage and support customers to reduce their energy costs by making their home more sustainable.
Gross carrying amount | GHG financed emissions2 | |||
|---|---|---|---|---|
In € millions | 2025 | 2024 | 2025 | 2024 |
Exposures towards sectors that highly contribute to climate change | 1,576 | 1,616 | 107,791 | 102,126 |
A - Agriculture, forestry and fishing | 1 | 1 | 118 | 98 |
B - Mining and quarrying | -- | -- | -- | -- |
C - Manufacturing | 116 | 174 | 56,641 | 54,746 |
D - Electricity, gas, steam and air conditioning supply | 833 | 849 | 28,677 | 20,879 |
E - Water supply; sewerage, waste management and remediation activities | -- | -- | 5 | 7 |
F - Construction | 64 | 59 | 3,481 | 2,671 |
G - Wholesale and retail trade; repair of motor vehicles and motorcycles | 133 | 125 | 8,961 | 8,025 |
H - Transportation and storage | 114 | 94 | 5,929 | 6,535 |
I - Accommodation and food service activities | 2 | 2 | 34 | 27 |
L - Real estate activities | 313 | 312 | 3,945 | 9,138 |
Exposures towards sectors other than those that highly contribute to climate change | 10,748 | 9,616 | -- | -- |
K - Financial and insurance activities | 10,353 | 9,190 | -- | -- |
Exposures to other sectors (NACE codes J, M - U) | 395 | 426 | -- | -- |
Total3 | 12,324 | 11,232 | 107,791 | 102,126 |
- This includes loans and advances, and debt securities to non-financial corporations.
- Scope 1, scope 2 and scope 3 emissions of the counterparty (in tonnes of CO2 equivalents).
- In accordance with the Commission Delegated Regulation (EU) 2020/1818 supplementing Regulation (EU) 2016/1011 as regards minimum standards for EU Climate Transition Benchmarks and EU Paris-aligned Benchmarks - Climate Benchmark Standards Regulation - Recital 6: Sectors listed in Sections A to H and Section L of Annex I to Regulation (EC) No 1893/2006.
The table 'Banking book - Indicators of potential climate change transition risk' shows the loans and advances and debt securities to non-financial corporates by sector as indicators of our exposure to potential climate change transition or physical risks. ASN Bank has exposures in sectors that significantly contribute to climate change, mostly in the electricity, gas and steam sectors. However, we assess our exposure to transition risk in these sectors to be low, as our project finance portfolio solely consists of renewable energy companies within that sector and does not include any customers in the (fossil) gas sector.
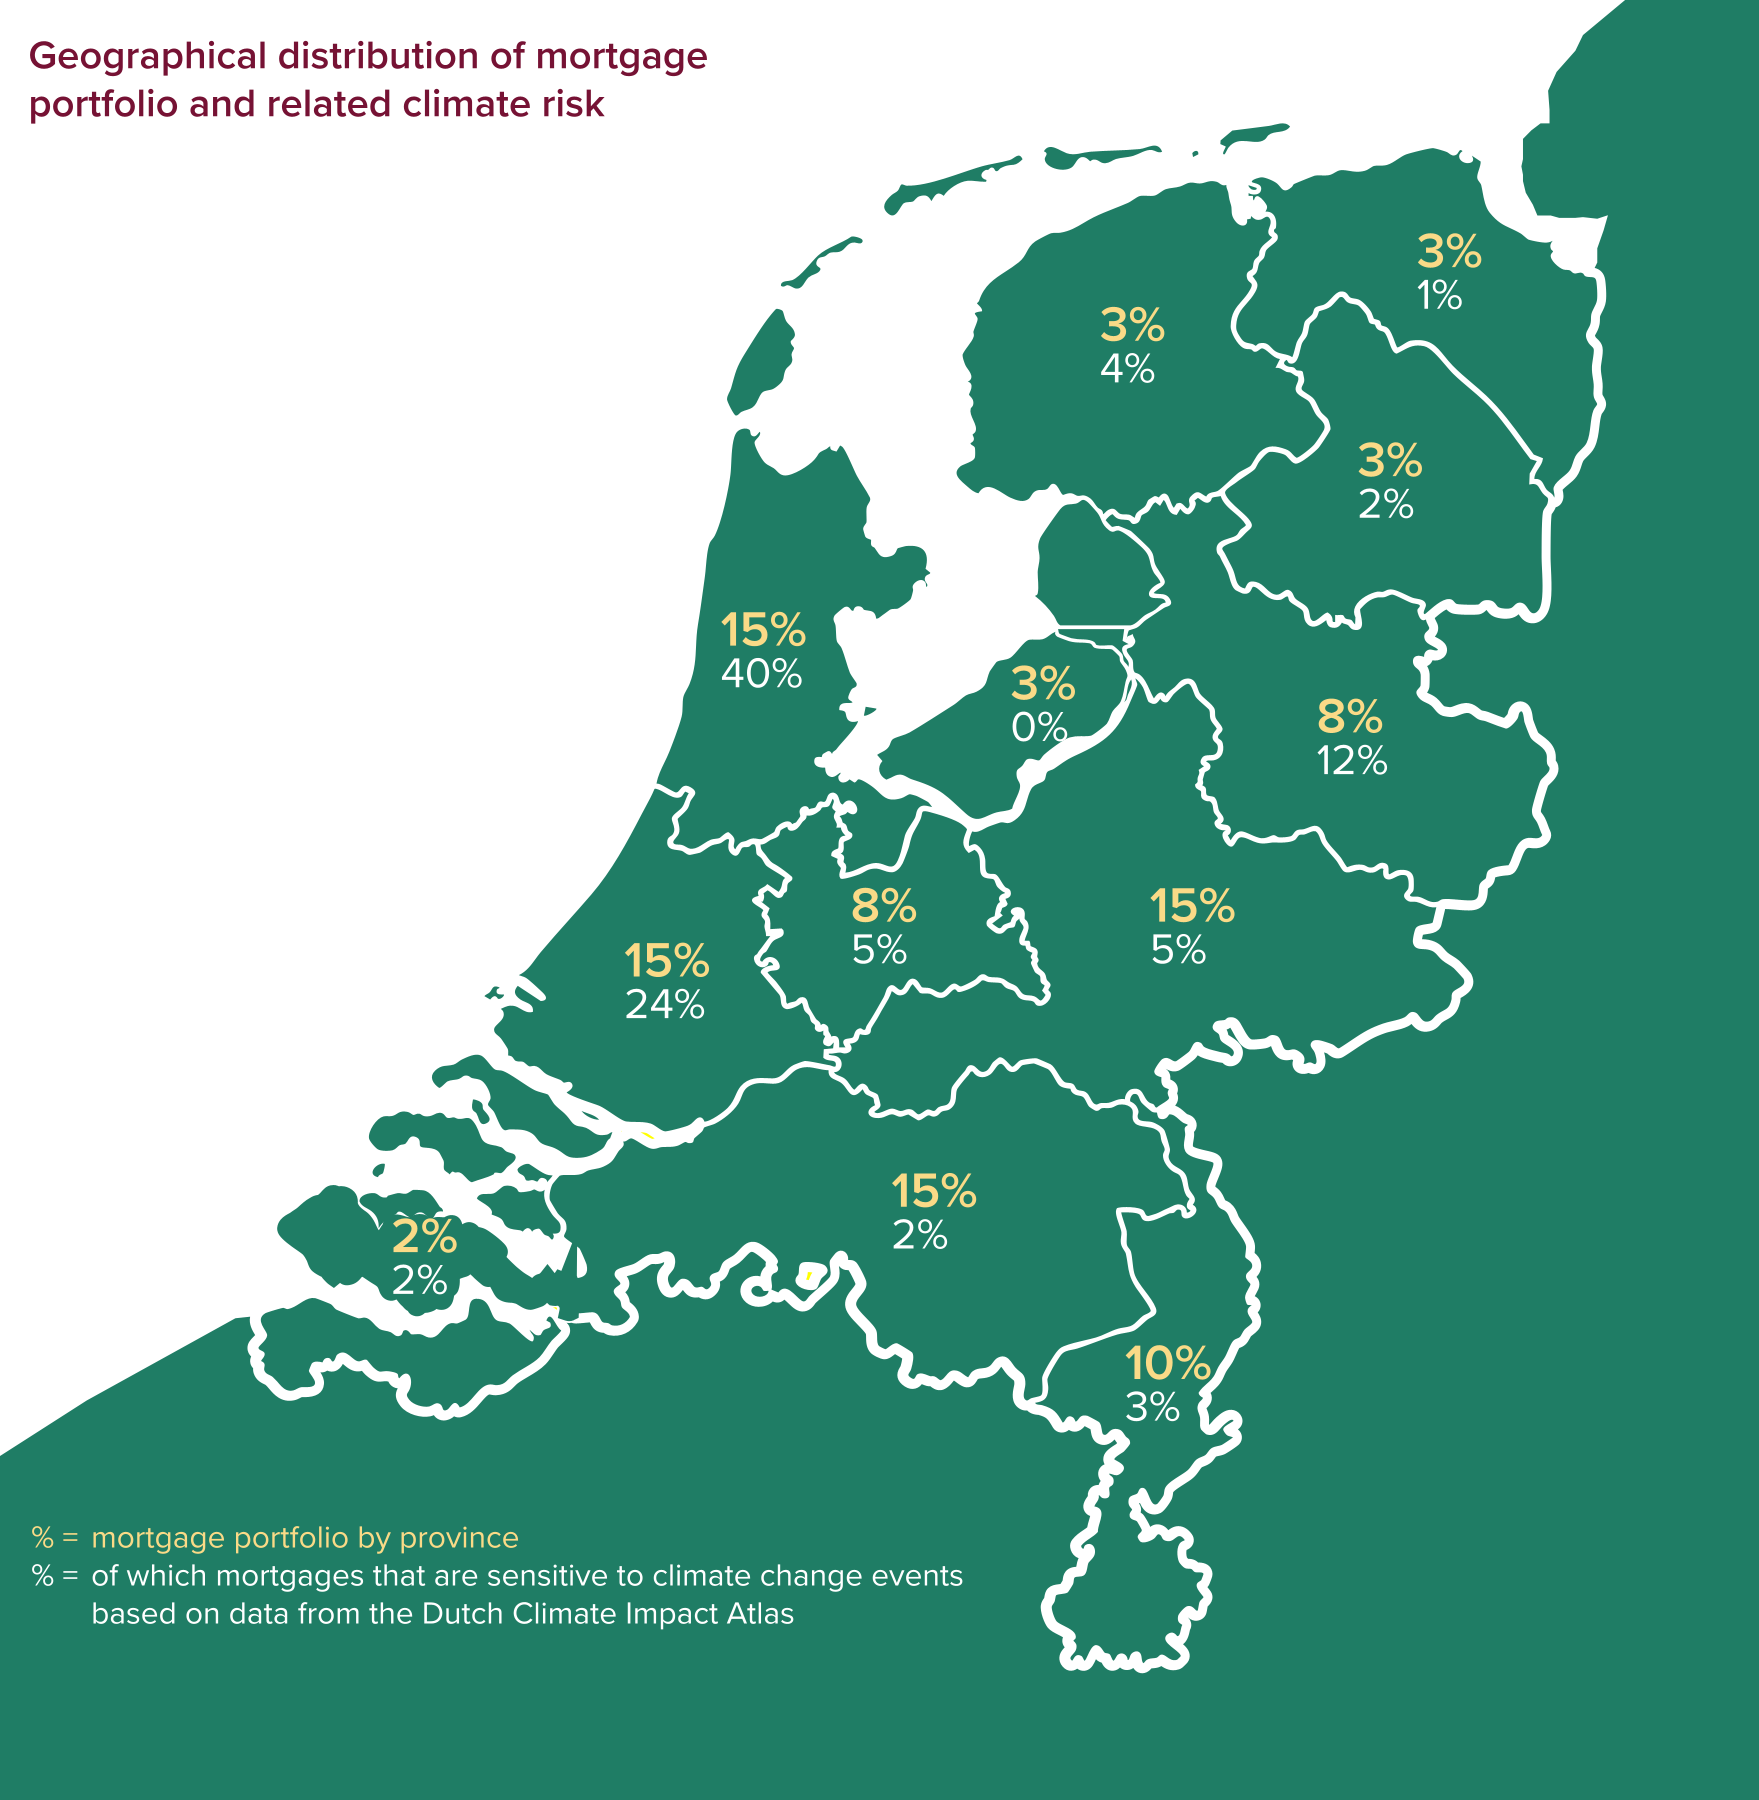
The figure 'Geographical distribution of mortgage portfolio and related climate risk' shows our mortgage portfolio by province and the share of mortgages that is sensitive to climate change events by province, which indicates potential climate change physical risks. To assess which exposures within our mortgage portfolio are sensitive to climate change events, we consulted the data from the Dutch Climate Impact Atlas (Klimaateffectatlas), an initiative of the Dutch government. All maps in the atlas are available at the level of the collateral's coordinates.
We mapped the coordinates of the underlying collateral in our database to the coordinates of the maps in the atlas, irrespective of the (loan) portfolio. Exposures considered as sensitive to climate change events:
Regions with a high or very high risk exposure to pole rot and/or soil subsidence according to the maps in the Climate Impact Atlas, with the scenario 2050 Low.
Regions with a flood of 50 cm and a probability of 1/300 and higher according to the maps of the Climate Impact Atlas, with 2050 as reference point.
Management and control
Clear roles and responsibilities are preconditions for an effective risk governance framework. To manage sustainability risk appropriately, ASN Bank has implemented the three lines model.
A sustainability risk management framework is in place, covering:
A sustainability risk management policy which describes the way ASN Bank complies with all ESG-relevant laws and regulations, establishes a Sustainability risk management framework and defines the mandatory requirements for managing Sustainability risks within the Bank.
A procedure and guidance document on how to conduct the ESG risk materiality assessment. It defines the methodology to systematically identify, evaluate, and mitigate sustainability risks. The requirements set out in the procedure are based upon the ECB Guide on CER, EBA Guidelines on ESG Risk Management and the European Sustainability Reporting Standards.
A Risk Appetite Statement (RAS) which includes a paragraph on the KRIs set for Sustainability risk.
The risk management cycle is the basis for identifying, assessing, prioritising and monitoring risks and their financial impact. There is a transmission channel in place that translates ESG risk drivers to the risk types included in the ASN Bank risk taxonomy.
To monitor sustainability risk, we have developed sustainability key risk indicators (KRIs) with the corresponding thresholds. Since sustainability risk is considered both a stand-alone risk type and a risk driver for other risk types within the risk framework of ASN Bank, specific sustainability key risk indicators (KRIs) are included in the RAS for sustainability risk. For ESG risks that are translated into other risk types, for instance credit risk and reputational risk, KRIs are included in the respective RAS. There are also KRIs not specific to sustainability risk, but which do include the impact of sustainability as a risk driver. For example, the KRI regarding compliance with prudential laws and regulations includes ESG regulations. The determination of the indicators and the associated thresholds is an annual process and is approved by the ExBo.
The KRIs are monitored and steered upon, for instance if a main KRI breaches the thresholds a path-to-green is required. ASN Bank has monthly and quarterly risk reports on the progress of the KRIs, see the Section Sustainability governance for more information.
The table below gives an overview of the 2025 KRIs. The outcomes of the ESG risk materiality assessment of 2025, which are input for the RAS-process, will be reflected in the KRIs set for 2026.
Risk Appetite Statement | Risk indicator | Quantitative threshold |
|---|---|---|
Sustainability risk – environmental risk | Growth of ASN Bank’s Sustainable Finance portfolio - monitors the expected total volume of CO2e compensated by sustainable projects financed | Yes |
Average energy efficiency rating of the residential mortgage portfolio - monitored in kWh/m2 | Yes | |
Credit risk – environmental risk | Share of customers classified as high sustainability risk regarding drought | Yes |
Share of customers classified as high sustainability risk regarding flooding | Yes | |
Sustainability risk – social risk | Percentage of IT contracts for which the production location is known | Yes |
Compliance risk – governance risk | Conduct: number of observed incidents with employees | Yes |
Privacy: non-compliance with GDPR | Yes | |
Reputational risk – | A significant deterioration of the RepTrak – ESG score1 as opposed to the previous quarter and/or a lasting negative deviation from the long-term average | No |
- The RepTrak – ESG score is calculated through an assessment of what stakeholders think of the bank, specifically in relation to ESG, by means of nine indicators (three for Environmental, three for Social and three for Governance).
The main KRIs for sustainability risk are included in the monthly integrated risk report. This report is discussed monthly within the ExBo and quarterly with the Risk & Compliance Committee. All risk committees receive a quarterly risk report, which includes the KRIs that apply to their domain. For Sustainability risk, the ESG Impact Committee (ESG IC) receives a quarterly report. The quarterly report is also submitted to the ExBo and ESG Committee of the Supervisory Board.
Areas of focus and activities
ASN Bank conducts an annual ESG risk materiality assessment that reveals institution-specific ESG risks, considering the specificities of the business model, operating environment and risk profile. Its primary objective is to identify material risks arising from ESG risk drivers. The scope of this assessment encompasses aspects of our own business operations as well as of the upstream and downstream value chain, i.e. all ASN Bank's activities, including all underlying legal entities, departments and portfolios.
In assessing ESG risks, important considerations are ASN Bank’s business model, products and services, geographical coverage and customers. ASN Bank also has risk assessment tools in place for other risk types (see previous paragraphs on other risk types) and the risks related to the various risk types are taken into account for decision-making. There is always a rationale behind prioritising risks.
In the identification and assessment process of ASN Bank's ESG risks drivers, we identified and assessed ESG events, including climate-related hazards and transition events to determine whether and how our assets and business activities are exposed to events. The following time horizons are considered:
Short-term (< 1 year)
Medium-term (1 –5 years)
Long-term (> 5 years, including a time horizon of at least 10 years)
The time horizons are aligned with the expected lifetime of our assets, strategic planning and capital allocation plans. As such, the medium-term time horizon (1-5 years) is in line with the (annual) business planning cycle and capital stress testing horizons of three years. The long-term time horizon is beyond five years due to the long-term nature of our assets: residential mortgages have an average maturity of around eight years. Our GHG emission reduction targets (SBTs) are also aligned with the long-term time horizon.
The ESG risk materiality assessment process started with a long list of potential material ESG topics. The following information feeds into the longlist:
Climate-related hazards,
Topics included in the European Sustainability Reporting Standards (ESRS),
Physical risks included in the European Climate Adaptation Platform, Climate-ADAPT,
Expert insights, and
Other available information.
A panel of experts, comprising of first and second line staff members across the business units and business lines, assessed the longlist on relevance and possible material impact. This resulted in a shortlist of ESG topics.
The likelihood and financial impact of the short list risk drivers are assessed for all the portfolios of ASN Bank. Thresholds for financial impact are defined as:
Percentage of portfolio
The amount of expected loss
Loss amount (for operational events)
Available data (internal and external) is a limitation to conducting a full quantitative assessment. Hence, the assessment is enhanced with a qualitative assessment by all relevant stakeholders and participants.
To assess our own business operations to climate risk, we conducted a Location Impact Assessment for two data centres, the head office vicinity and IT office. The following risk drivers are considered: floods, wildfires, (urban) heat islands, pole rot and subsidence on a scale of none, very small, small, medium, medium-high and high. This location assessment was conducted in Q3 of 2024, and served as input for the ESG RMA of 2025. To assess our mortgage portfolio to climate risk, we plotted the property locations by means of the Climate Impact Atlas.
We identified and assessed transition events in each time horizon to determine whether and how our assets and business activities are exposed to these events. In the ESG risk assessment, the transition events from the ESRS were considered to determine whether they were relevant to ASN Bank, enriched with expert insights and other available information. We did not consider the climate-related scenario analysis consistent with the Paris Agreement. Instead, we considered high-emission climate scenarios, such as the high scenario of KNMI’14, which is in line with the IPCC SSP5 8.5 pathway (4 degree Celsius warming by 2100).
We identified which assets are compatible with the transition to a climate-neutral economy according to the requirements for EU Taxonomy alignment under Commission Delegated Regulation (EU) 2021/2139. The residential mortgage category is the largest on the balance sheet. For that part of the mortgage portfolio that is not Taxonomy aligned, we recognise that a significant effort is needed, we aim to enthuse homeowners to make their home more sustainable.
In 2025, we continued to improve our ESG risk materiality assessment. We paid special attention to the quantification of the ESG risks with data, when available. We analysed our own operations and assets on the balance sheet, including our residential mortgage and SME portfolio, liquidity portfolio and sustainable finance projects, and assessed the ESG risks related to those portfolios.
Portfolio | Time horizon1 | ||||||||||
|---|---|---|---|---|---|---|---|---|---|---|---|
Type | Environmental risk | Risk type | Description | Residential mortgages | SME loans | Sustainable financeloans | Financial Markets loans | Own operations | Short -term | Medium- term | Long -term |
Environmental risk - Physical risk | Pole rot following drought | Credit risk | Pole rot occurs when wooden poles under a foundation decay due to severe drought, harming the house's foundation. This can reduce collateral value (increasing LGD) and burden borrowers with repair costs, potentially lowering repayment ability and raising probability of default (PD). | • | • | • | • | ||||
Subsidence following drought | Credit risk | Differential settlement occurs when buildings sink unevenly on non-uniformly compacted soil, potentially reducing collateral value (increasing LGD) and burdening borrowers with repair costs that may impair repayment ability and raise probability of default (PD). | • | • | • | • | |||||
Flood | Credit risk and operational risk | Flood damage risk (coastal, fluvial, groundwater, pluvial) can increase LGD through property devaluation and increase of PD via repair costs and higher insurance premiums. Operational risks include potential impact to the Zwolle datacenter. | • | • | • | • | • | • | |||
Environmental risk - Transition risk | Legal and regulatory changes - GHG emissions | Credit risk and compliance risk | Strict requirements regarding energy labels may reduce collateral values and increase LGD, while adaptation costs strain borrowers' repayment capacity. Operationally, the bank may face challenges with suppliers unable or unwilling to meet sustainability reporting requirements | • | • | • | • | • | |||
Greenwashing | Compliance risk and reputational risk | With an ESG Strategy that needs to be further operationalised and evolving regulations, ASN Bank faces challenges that may lead to compliance, and eventually, reputational risk. | • | • | • | • | |||||
Social Risk | Working conditions (own workforce) | People risk | The transformation of ASN Bank may impact the working environment as the associated unclarity of roles and responsibilities and potential increased work-related stress could lead to higher sickness rate, lower productivity, resignation of key persons and/or insufficient inflow of capable staff. | • | • | • | • | ||||
Data & Privacy | Operational risk and reputational risk | Data breaches and cybersecurity threats pose significant risks through unauthorised access and data compromise, potentially causing privacy violations and reputational damage. Poor data quality and unethical data practices can lead to operational failures, discriminatory outcomes, and regulatory penalties, ultimately resulting in financial losses and damaged customer relationships. | • | • | • | • | |||||
Governance risk | Financial crime | Compliance risk, legal risk and reputational risk | Financial crime risk represents potential losses from illegal activities utilising financial systems, including fraud, money laundering, terrorist financing, and corruption, with impacts across individual, business, and global economic levels. | • | • | • | • | ||||
- Time horizons as determined during the workshops in May 2025. The quantitative assessment was focused on the long term only.
- This ESG Risk was not assessed per portfolio but is included in own operations.
The results of the 2025 ESG risk materiality assessment are presented in the table above. We assessed the impact of sustainability risk as a material risk driver for the following risk types: credit risk, reputational risk, operational risk (people risk and legal risk are sub-risk types of operational risk) and compliance risk. The assessment is based partly on qualitative judgements, internal and external studies and the impact of upcoming regulations, and partly on quantitative information (where possible).
We conclude that for the following other financial risk types, the climate-related and environmental (C&E) risk drivers are not material:
Liquidity risk: C&E risks potentially have a long-term impact and arise from the securitised portfolio. In the short term, they are not considered material.
Credit spread and interest rate risk in the banking book: we did not identify any material C&E risk drivers. We developed a quantification method to enrich the analysis for credit spread risk.
Market risk: for the trading book portfolio, we applied the concept of proportionality. This means that, due to the relatively small risk exposures of our trading book portfolio, we did not consider any risk quantification methods.
These assessment results were then used to formulate mitigating actions. We will continue to improve our ESG risk management. The outcomes of the ESG risk materiality assessment of 2025, which are input for the RAS-process, will be reflected in the KRIs set for 2026.
As the integration of ESG risk in risk management framework is constantly evolving, we continue to analyse the data requirements and the availability of data sources for risk assessments and processes. The data and methodologies of the Dutch Climate Impact Atlas (Klimaateffectatlas) are currently used to measure the physical risks in our residential mortgage portfolio. To improve data quality and accuracy on foundation related risks, in 2026 a pilot with external data sources for example the Dutch Knowledge Center for Handling of Foundation Problems (KCAF) and/or FunderMaps will be conducted to determine whether an alternative source can provide us with more accurate data. To manage transition risks, we retrieve information on energy labels from the Netherlands Enterprise Agency (RVO). In 2025, ASN Bank conducted two pilot projects aimed at improving data on expired or missing energy labels for residential mortgages. The insights gained during these pilots contribute towards data improvement initiatives and underscore the importance of robust quality controls when applying new technologies.
Sustainability risk is part of the Economic Capital (EC) model. Quantification methods and risk appetite thresholds are in place to ensure adequate capital allocation for sustainability risks.
The EC quantification for Sustainability Risk focuses on physical environmental risks that could damage collateral in the residential real estate mortgage portfolio, specifically flooding and drought-related risks. Flooding probability data is mapped to ASN Bank's mortgage portfolio to calculate average collateral damage based on flooding severity levels. These damages are translated into three distinct Downturn Loss Given Default (DT LGD) scaling factors corresponding to different flooding levels, which are then used to calculate unexpected losses. Drought-related damages follow a similar methodology but utilise a single DT LGD scaling factor to determine unexpected losses. The combined unexpected losses from both flooding and drought risks constitute the base EC for Sustainability Risk. Below we explain how data from the Dutch Climate Impact Atlas (Klimaateffectatlas) is used to calculate EC.
To assess the exposure of the bank's mortgage portfolio to flood risk for EC, the geographic distribution of the mortgage portfolio is mapped to the location-specific probabilities of three different flood depths (>20 cm, >50 cm and >200 cm) occurring by 2050. In our model to calculate economic capital for sustainability risk, the probabilities of flooding are classified into different risk categories. We also make a prudent choice by defining a cut-off at the flooding probability levels of exceeding 1/3,000, for which economic capital is calculated, so as to correspond to the Economic Capital confidence level (1/1,000) as much as possible with the available Dutch Climate Impact Atlas (Klimaateffectatlas) data.
Probability | Annual likelihood |
|---|---|
High probability | >1/30 per year |
Moderate-to-high probability | 1/300 to 1/30 per year |
Low probability | 1/3,000 to 1/300 per year |
Very low probability | 1/30,000 to 1/3,000 per year |
Extremely low probability | <1/30,000 per year |
Drought risk encompasses two primary components: differential settlement (the uneven sinking or settling of different parts of a structure's foundation) and pole rot foundation risk. In the context of EC, drought-related foundation vulnerabilities are measured using the 2050 High scenario from the Dutch Climate Impact Atlas (Klimaateffectatlas) for both risk types. Both differential settlement and pole rot risks are categorised into five risk buckets according to their respective measurement scales. Rank 1 represents a very low probability of drought-affected foundation damage, while rank 5 indicates a very high probability. For prudency, the higher rank of the two primary components is used. For EC calculations, only collateral with risk ranks 3 to 5 are considered.
Probability | Risk rank |
|---|---|
Very high probability | Rank 5 |
High probability | Rank 4 |
Moderate probability | Rank 3 |
Low probability | Rank 2 |
Very low probability | Rank 1 |
Stress testing and scenario analysis offer valuable insights for strategic choices and capital planning. As part of our ICAAP and the Single Supervisory Mechanism (SSM) EU-wide stress testing exercise, ASN Bank conducts capital stress tests that comprise material risks expected to negatively affect capitalisation over the short, medium and long-terms.
For capital planning, we assess our capital adequacy under a credible baseline scenario and specific adverse scenarios. The stress test scenarios may include among others macroeconomic risks, cyber risk, and climate risk. For physical climate risks, ASN Bank uses scenarios aligned with scientific climate change pathways, sourcing flood and drought data from the Dutch Climate Impact Atlas (Klimaateffectatlas) for property damage amounts. The bank considers how climate-related and environmental risks could evolve under various scenarios, recognising that these risks are not fully reflected in historical data.
In accordance with the ECB Guide with respect to ICAAP, the normative perspective for capital stress testing covers a four-year forward-looking horizon. ASN Bank takes developments beyond this horizon into account in its strategic planning if they are expected to have a material impact. To capture the interaction of various types of risk, the bank uses a holistic capital stress testing framework, incorporating climate- related risks.
The SSM EU-wide stress testing exercise, the ICAAP stress test and mid-year stress test included scenarios with severe stress. Based on the results, we concluded that ASN Bank’s capital position is resilient and can withstand severe climate stress.
The mid-year capital stress test outcomes are submitted to and discussed in the Asset and Liability Committee (ALCO) and the Credit Committee. The ICAAP and SSM stress test results are also on the agenda of the Executive Board (ExBo) and Supervisory Board (SB). Further, the outcomes are used to calibrate Risk Appetite Statement (RAS) thresholds for capital adequacy.
ASN Bank analysed the possible impact of ESG developments on all material risk types. It was concluded that the relevant ESG elements are included in the current liquidity stress testing framework and scenarios. Moreover, the impact of ESG risks on liquidity are expected to materialise on the medium to long run (>1 year). While their impact may rise over time, acute events are not expected to exceed current short-term stress impact. These risks are thus outside the scope of liquidity stress testing, which is and should remain focused on the short-term given the mostly short-term nature of liquidity risk.
The outcomes of the ESG risk materiality assessment, stress testing and scenario analysis help us assess the resilience of our business model and strategy in relation to material risks in 2025. The annual Strategic Risk Assessment (SRA) is an important tool to recalibrate the strategy against internal and external trends, including important developments in ESG risks. The outcomes of the ESG risk materiality assessment, stress testing and SRA may result in adjustments to our strategy and business model for the short, medium or long-term in the following areas:
securing ongoing access to finance at an affordable cost of capital
the ability to redeploy, upgrade or decommission existing assets
shifting the products and services portfolio
reskilling the workforce
There are several areas of uncertainty in the analyses, as the development of ESG risk drivers depends on various uncertain factors that may materialise in different time frames. Our assets and business activities at risk are assessed within the definition of our strategy (through the SRA), within our investment decisions (through our sustainability policies) and within current and planned mitigating actions (through our ESG risk materiality assessment). Although we see some material physical and transitional risks, we expect that our strategy and business model are resilient in the short, medium and long-terms in relation to climate change. We reached this conclusion based on the results of the ESG risk materiality assessment, stress testing and scenario analysis and the SRA. We did not exclude any identified material physical and transition risks from the assessment.
The periodic update of the macroeconomic scenarios takes the impact of ESG events into consideration, including the transition to a lower carbon and resilient economy such as energy prices and net congestion, on macroeconomic levels. In 2026 ASN Bank will conduct an Environmental Resilience Analysis in accordance with the EBA Guidelines on ESG scenario analysis.
Material risks stemming from ESG events or climate-related hazards are evaluated on existing effective risk control mechanisms. If considered necessary additional risk responses are developed. Below are some examples of mitigating controls and commitments included in the 2025 ESG risk materiality assessment:
The existing controls for the risk of Greenwashing, which can result in compliance risk and reputational risk, are 1) the product approval and review process which contains sustainability criteria; 2) content creation process during which amongst others sustainability claims are assessed; 3) and the process in which the feasibility of compliance to sustainability covenants and commitments are assessed.
The mitigating measures for anti-financial crime, possibly leading to compliance risk, legal risk and reputational risk. Multiple programmes and enhanced resource allocation are in place to remediate shortcomings that were identified in 2023. ASN Bank is executing a multi-year Remediation Programme to ensure adequate control and demonstrable management of AFC risks.
For people risk, we actively monitor retention rates and focus on positioning ASN Bank as an employer of choice. Supporting employee wellbeing also remains a priority through our 'Vitaal & Gezond' platform.
Data & privacy, possibly leading to operational risk and reputational risk. ASN Bank invests in employee awareness as our human firewall through continuous programmes and also provides training to employees on privacy.
Additionally, ASN Bank has sustainability policies which also act as an important mitigant of our exposure to outside-in ESG risk drivers and risk arising from negative inside-out impacts, see Section Sustainability policies.
ASN Bank has integrated ESG-risks throughout its credit process, from initial due diligence to ongoing monitoring, ensuring that climate and environmental risks are assessed, managed and aligned with our overarching strategy and risk appetite. Some key ESG-risk management measures and commitments relating to credit risk are:
Portfolio-specific approaches with tailored ESG considerations for residential mortgages, commercial real estate, SME loans, Financial Markets & Treasury and sustainable finance projects
Comprehensive due diligence assessing both physical risks (drought, foundation issues) and transition risks (energy efficiency)
Sustainability policies applied to sectors and counterparties, with regular policy updates
Advanced risk classification system using segmentation matrices that combine climate risk scores with financial resilience metrics
Incentivised pricing mechanisms including interest rate discounts for energy-efficient properties (Bespaarhypotheek) and lower return targets for sustainable projects (4% for sustainable projects vs 8% bank-wide target)
Continuous monitoring systems utilising dashboards and key risk indicators to track geographic and sectoral risk concentrations throughout loan lifecycles
ESG-risk is incorporated in the Risk Appetite of credit risk to enable strategic steering towards a sustainable portfolio.

Sustainability statements
Sustainability statements
This section provides insight into how ASN Bank deals with important environmental, social, and governance (ESG) topics. We describe how we determine our material ESG topics and how we relate to them.
General information
Basis for preparation
ASN Bank prepares the Sustainability statements in accordance with the European Sustainability Reporting Standards (ESRS) as adopted by the European Commission and based on the outcome of our double materiality assessment. The Corporate Sustainability Reporting Directive (CSRD) has not yet been transposed into Dutch National Law as of the publication of this Annual Report. As part of the Sustainability statements, ASN Bank also prepares disclosures in accordance with Article 8 of Regulation (EU) 2020/852 (Taxonomy Regulation), including all relevant directives and annexes. Simplified EU Taxonomy disclosure rules, which were proposed by the European Commission as part of the ‘Omnibus I’ package in 2025, apply to this reporting period and are used by ASN Bank.
The ESRS provides detailed disclosure requirements on ten ESG topics. In addition, we are committed to the UN Principles for Responsible Banking, of which we provide an overview in the Section Principles for Responsible Banking.
The scope of sustainability statements coincides with the financial statements. It regards ASN Bank N.V. and its subsidiaries, considering all our upstream and downstream activities and own operations, as indicated in the Section How we create value. The reporting period covers the period 1 January 2025 up to 31 December 2025. During this reporting period, ASN Bank did not use the option to omit information corresponding to intellectual property, know-how or the results of innovation. Nor did we use the exemption from disclosure due to impending developments or matters in the course of negotiation, as provided for in Articles 19a(3) and 29a(3) of Directive 2013/34/EU.
The Sustainability statements are provided with limited assurance, conducted by our auditor EY Accountants B.V. Please see our auditor's assurance report for more information.
In the Sustainability statements and our double materiality assessment (DMA) we used the time horizons as defined by ESRS 1:
Short-term: <1 year;
Medium-term: ≥1 year and ≤5 years; and
Long-term: >5 years
Several metrics are (partly) based on value chain data estimations, such as sector-average data. We include a reference when estimations are used. The following information with regard to data is described in the corresponding topical section in the Sustainability statements: the methodology, sources of uncertainty, assumptions and approximations, the resulting level of accuracy and planned actions to improve the accuracy of data.
These are the metrics that are subject to a high level of measurement uncertainty:
CO2e emissions in our own operations, upstream and downstream value chain (including our investments) see the Section Gross Scope 1, 2, 3 and Total GHG emissions. Regarding the methodology, please see Appendix Methodology financed emissions and Appendix Methodology own operations and upstream and downstream emissions.
Energy consumption, see the Section Energy use.
Some ESRS disclosure requirements are closely linked to other regulatory requirements which are disclosed in other parts of the Annual Report. These requirements are therefore not included in the Sustainability statements but incorporated by reference. An overview of the requirements that are 'incorporated by reference' is included in the Section ESRS content index. The sub-sections in other sections that are incorporated by reference have been labelled with 'In scope of CSRD'.
Environmental and social developments
Geopolitical tensions continued to dominate the news in 2025. This again pushed long-term international cooperation goals for climate, biodiversity and poverty reduction to the background.
Despite these tensions, the 30th UN Climate Conference of the Parties took place in Belém, Brazil in November 2025. Ahead of COP30, the EU announced their new National Determined Contribution: A reduction of net GHG emissions by 66.25% to 72.5% below 1990 levels by 2035, covering all sectors of the economy and all GHGs. This is part of the new EU target to reduce GHG emissions by 90% in 2040, as compared to 1990 levels. Despite initial optimism for COP30, the outcome was still largely disappointing. Although some agreements were made, more climate action is needed to achieve the Paris Agreement goals.
In the Netherlands, new elections were held in October 2025. A more centrist coalition is likely to affect environmental and social policies. In December 2025, the Wennink report was published advising the Dutch government to improve Dutch competitiveness and to make progress on social transitions.
The European Commission (EC) aims to boost EU competitiveness by simplifying regulatory burdens and reporting obligations. In February 2025, the Omnibus I package was proposed, which included simplification measures for corporate sustainability reporting and due diligence requirements. The package was formally adopted in December.
This process of regulatory simplification has led to reduced regulatory predictability and reverses the trend of a continuous increase in sustainability legislation in the EU. Sustainability legislation that was introduced but not yet fully implemented is already being amended. The trade-off between reducing unnecessary burdens and inconsistencies on one hand, and maintaining transparency, reliability, and diligence on the other, is not always clear. Despite the simplification of legislation for companies in the EU, supervisory expectations related to ESG for financial institutions are in fact becoming more stringent.
The effects of climate change are becoming increasingly evident. 2025 was one of the hottest years on record, continuing the trend of exceptional warming. Floods, droughts and wildfires are becoming more common and more severe. Examples include the Los Angeles wildfires in January, heatwaves across all of Europe, and record-breaking wildfires in the Iberian peninsula. These extreme weather and climate events not only incur costs from direct damage, but also the costs for countries and corporations of financing mitigation and adaptation measures.
Furthermore, the loss of biodiversity also leads to rising costs for the preservation and strengthening of ecosystem services, such as food supply, water purification and pollination.
Strategy
During 2025, we concluded the execution of our strategy 2021-2025: 'Better for each other – from promise to impact'. This strategy had two main pillars aimed at strengthening our distinctive capabilities: to be the bank with the strongest customer relationship and to have a substantial and measurable positive impact on society. While significant progress was made in realising the core ambitions of the 2021-2025 strategy, economic circumstances and customer needs continued to evolve. This prompted the development of a new strategy with a strong focus on simplification and growth.
On 13 November 2025, we announced our new strategy 'Simplify and Grow'. We aim to achieve growth through our core activities: mortgages, savings, and payments, and enhance the effectiveness and efficiency of business operations, internal processes, and systems. Building on the strong ASN Bank brand and our distinctive social profile, the new strategy sets out three priorities:
Grow our business
Increase sustainable and social impact
Simplify the way we operate
Further information about the new strategy and our transformation can be found in the Section Our strategy. Our value creation model, visualises how we create long-term value for our stakeholders, see Sections How we create value and Company profile. And for more information about current and anticipated effects and adjustments to our strategy and our business model that may impact the relationship and how we deal with our interests and vision of our stakeholders, please refer to Sections Transformation programme and Our stakeholders.
ASN Bank remains committed to contributing to a sustainable and fair future for everyone. We help customers improve their homes' energy efficiency and explore new investment opportunities that support the energy transition and sustainable economy through financial solutions. This also contributes to the resilience of ASN Bank against sustainability-related transition and physical risks. For more information regarding these topics, see Sections Sustainability governance, Double materiality assessment and Sustainability risk.
During 2025, we concluded the execution of our strategy 2021-2025 related ESG targets which are disclosed in the table below. These targets applied to the bank until the announcement of the new strategy in November 2025. This is the last time we will report on these topics in this way in our sustainability statements.
Definition | Target | More in chapter |
|---|---|---|
Net zero | Net zero by 2050 | |
Employee engagement | > 8.0 in 2025 | |
Net Promoter Score | +7 in 2025 | |
Number of active multi-customers | 1.3 million in 2025 |
Our new strategy, with a focus on simplification and growth, includes the non-financial targets as disclosed in the table below. From the reporting year 2026 onwards, the new metrics will be fully integrated into the sustainability statements.
Definition | Target | More in chapter |
|---|---|---|
Net zero | Towards Net zero by 2050 | |
Employee engagement | > 8.0 | |
Net Promoter Score | Leading position | |
Number of primary customers | > 1.5 million |
ASN Bank conducts a strategy review on an annual basis to assess, adjust and reconfirm long-term targets and strategic decisions based on internal and external factors, market developments (such as capital market changes, customer demand, and crisis impacts) and stakeholder interests. The process is continuously evaluated and updated short-term (1 year) when needed. Key inputs include the double materiality assessment (DMA), Strategic Risk Assessment (SRA) (covering climate and environmental risks), ESG assessments, risk appetite statements, financial business reports, sustainability scenarios, stakeholder consultations and stress tests. The annual SRA is crucial for recalibrating strategy against internal and external trends, including ESG risk developments.
KPI and target adjustments are aimed at strengthening stakeholder relationships, transparency, responsiveness, interest alignment and resilience of the bank. Adjustments stem from reassessing strengths and weaknesses along with opportunities, impacts and risks, as well as strategic goals and business model implications. This enables the bank to become more efficient and adaptable to regulatory requirements, technological developments, economic shifts, evolving customer needs and physical environmental changes. Our findings are detailed in our DMA section and the respective corresponding chapters, for more information see the Sections Double materiality assessment, Climate change, Own workforce, Customer relationship and Anti-financial crime.
ASN Bank aims to have a strategy and business model that is sustainable from a long-term perspective and is focused on achieving our strategic goals. To monitor progress and gain insight into the key challenges and solutions related to our strategy's ESG objectives, we have established short-, medium-, and long-term targets supported by performance indicators.
In 2025, ASN Bank has been working on revising the Net zero transition plan and we continue to work on a holistic ESG transition plan, which is guided by the regulatory requirements and recommendations of the EBA as well as the provisions of CRD VI. The transition plan serves as a strategic guide for ASN Bank to systematically manage the shift towards a more sustainable business and investment practice. The plan defines the necessary measures, timelines, and responsibilities to transparently manage ESG risks across the bank’s lending and investment portfolios, thereby ensuring the long-term sustainability of its business model.
How we create value
As a financial institution, we play an important role in the Dutch economy and society. We help households and businesses protect their savings, process (online) payment services and provide (mortgage) loans. We are an insurance agency and manage sustainable investment funds in which our customers may invest. These activities create value for our retail customers, small businesses and our chain partners throughout the Netherlands, and society as a whole. Furthermore, we consider our gatekeeper function in countering financial crime to be an integral part of our business operations.
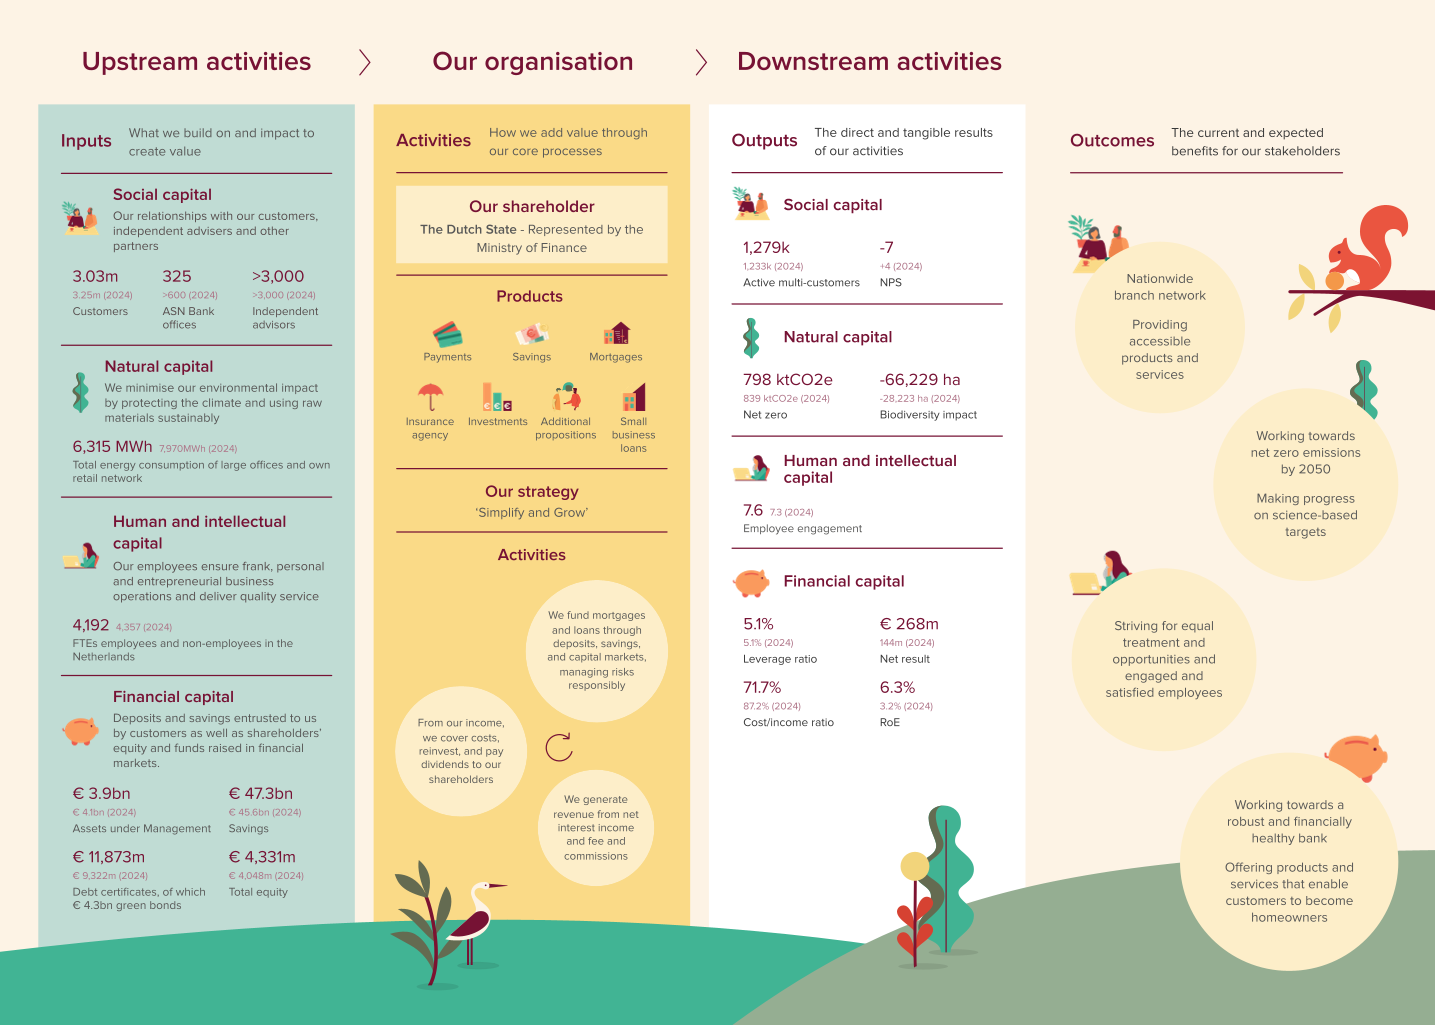
With our strategy and business activities we contribute to five of the UN Sustainable Development Goals.
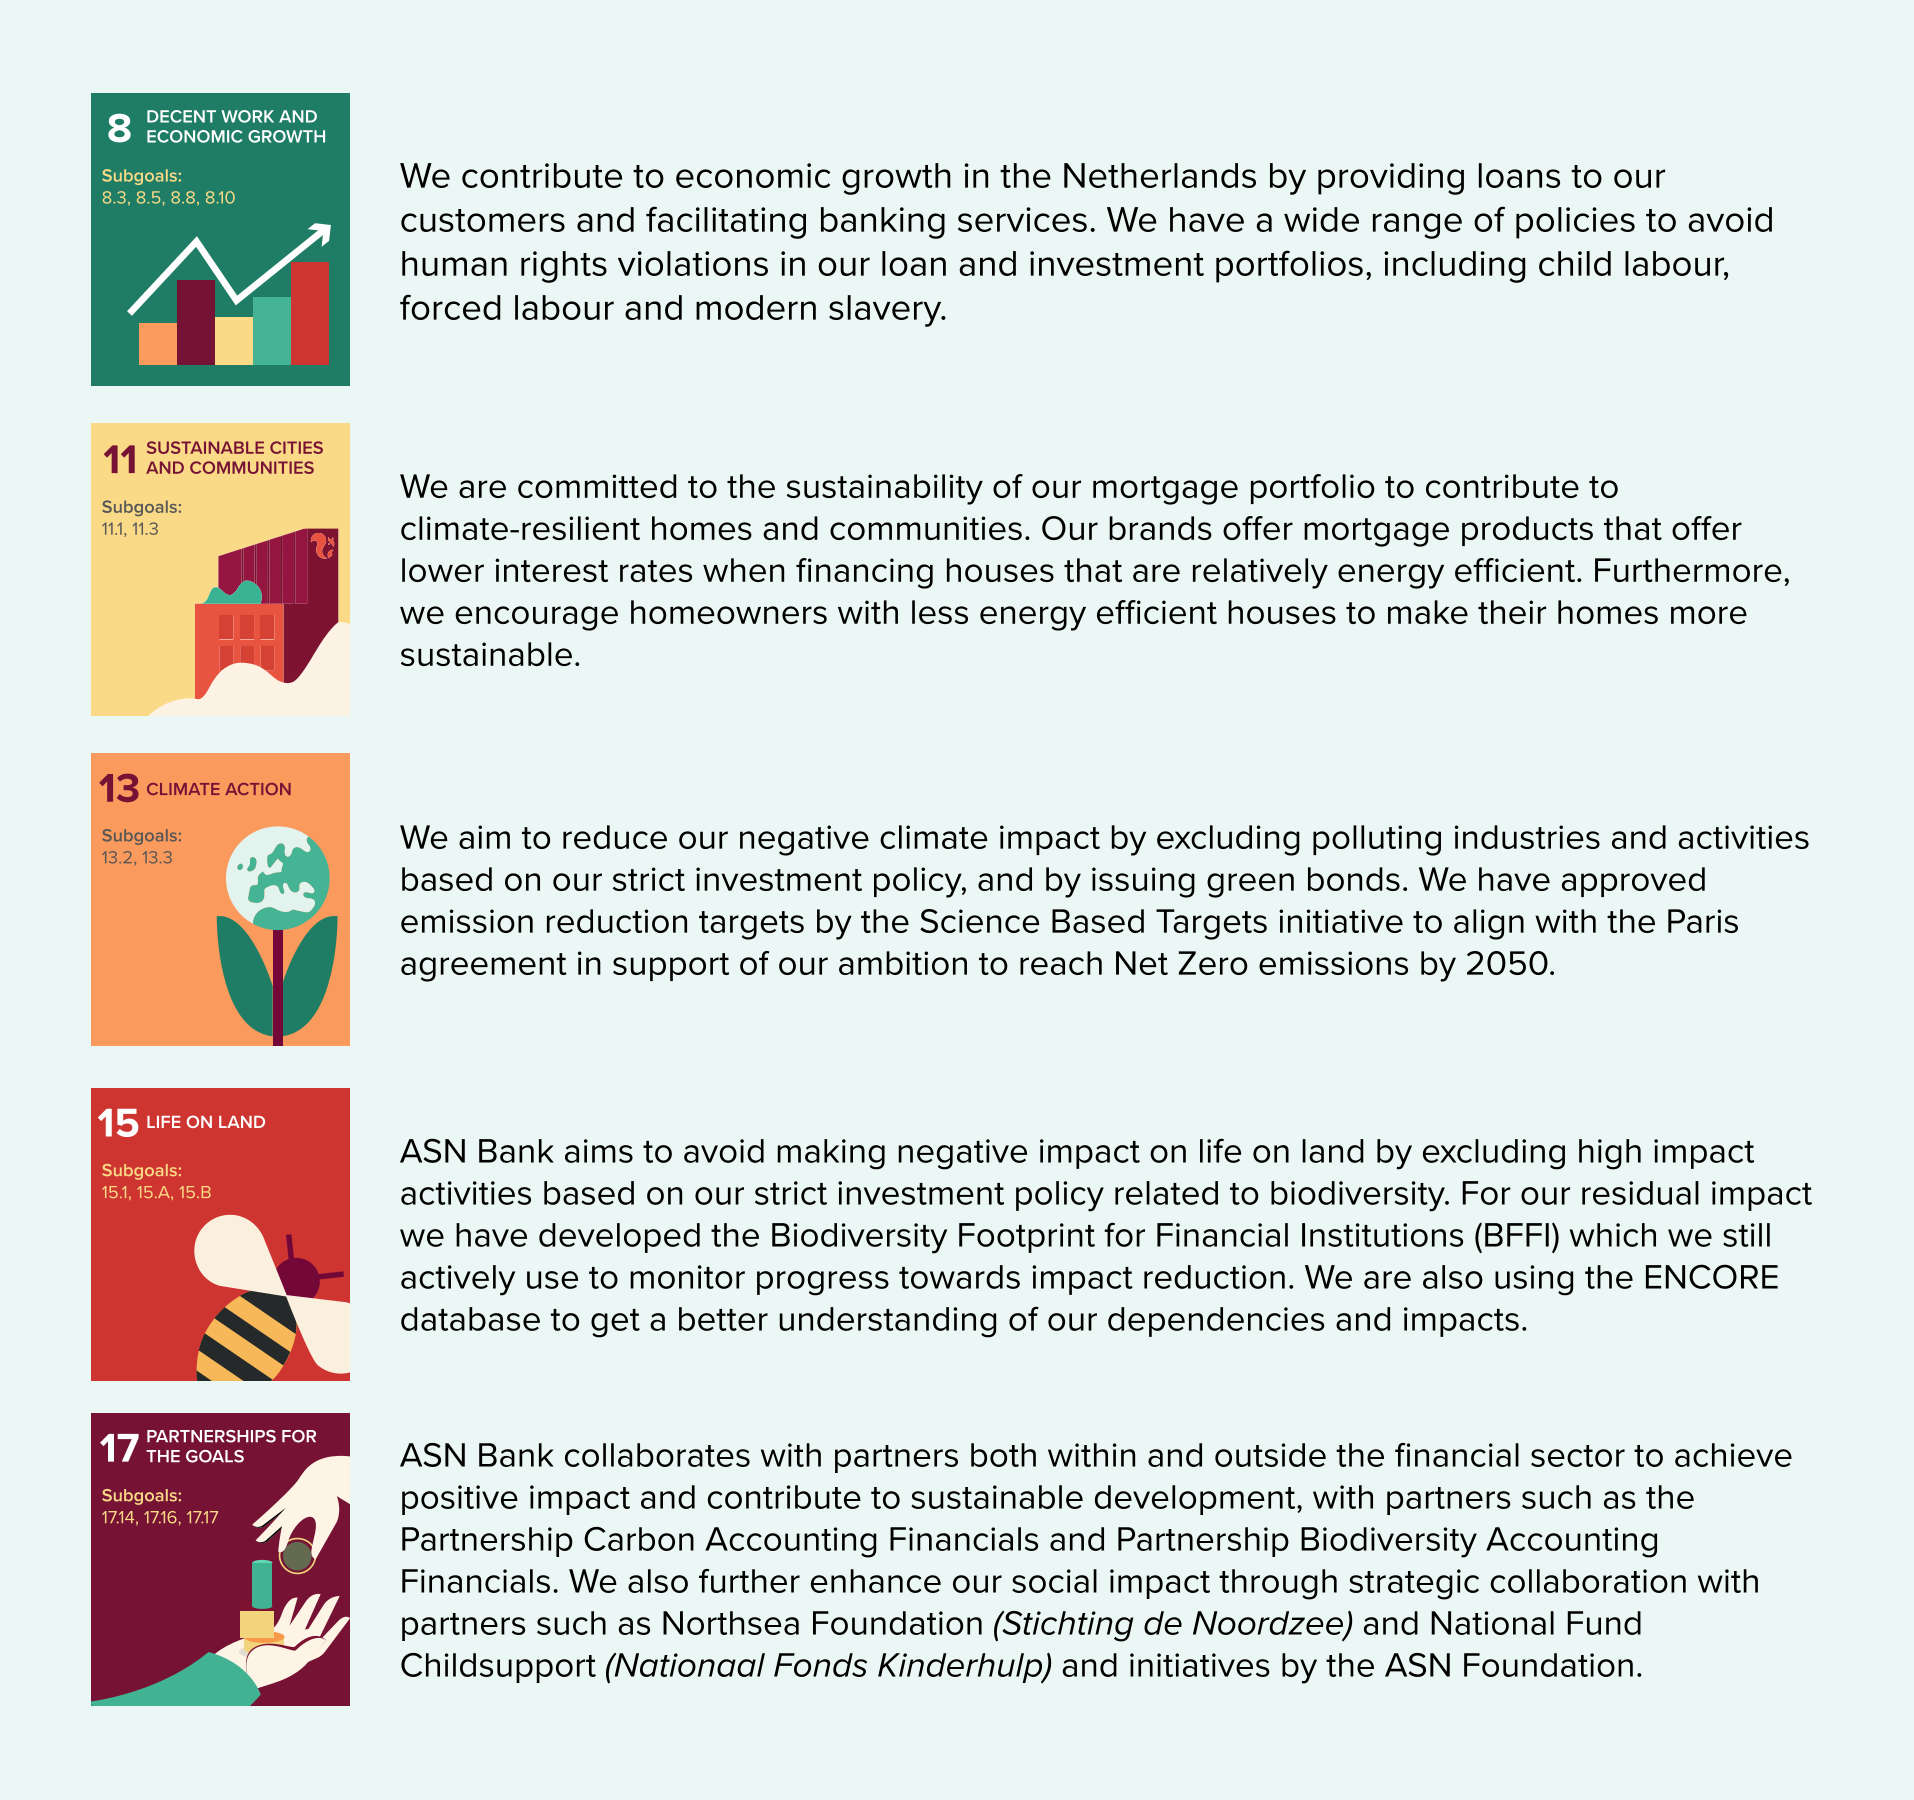
Our stakeholders
We identified and categorised our stakeholders with a clear objective: to listen, engage and collaborate effectively to create value for them. Nature is a silent stakeholder, within society, acknowledging the interlinkage between society and nature. The interest of nature and society are considered through engagement with NGOs and other organisations. ASN Bank considers the interests of its stakeholders when formulating or adapting its strategy and business model. The views of our stakeholders provide input for our double materiality assessment (DMA). These serve as input for our strategic review activities, which may lead to refinements to our strategy and sustainability efforts, including our strategic (sustainability) KPIs and targets. Our sustainability policies are publicly available.
Our key stakeholders | How we engage with the stakeholder1 | Purpose of engagement1 | Examples of outcomes from engagement1 |
|---|---|---|---|
Our customers | |||
Retail and SME customers |
|
|
|
Society | |||
National and European authorities, advice organisations, NGOs, nature, community |
|
|
|
Our employees | |||
All our employees |
|
|
|
Our shareholder | |||
NLFI is sole shareholder in ASN Bank on behalf of the Dutch State |
|
|
|
Other stakeholders | |||
Suppliers and franchisees |
|
|
|
- This list is non-exhaustive
- See section Employee engagement
Double materiality assessment
This section describes our DMA process, in which we have identified our material impacts, risks and opportunities (IROs). To identify physical and transition risk for various risk types, we have performed an ESG risk materiality assessment, for more information, see the Section Sustainability risk.
Double materiality means that a sustainability matter can be material either from a financial perspective (‘financial materiality’) because it has a financial effect on our business and/or (‘impact materiality’) because of the impact that our business has on people and/or the environment. These impacts may be positive or negative and actual or potential. Furthermore, topics may be material from an impact perspective or a financial perspective or from both perspectives.
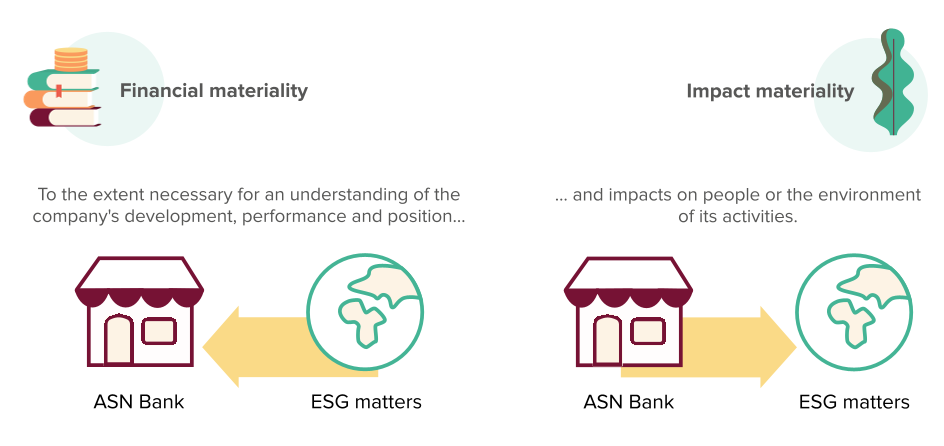
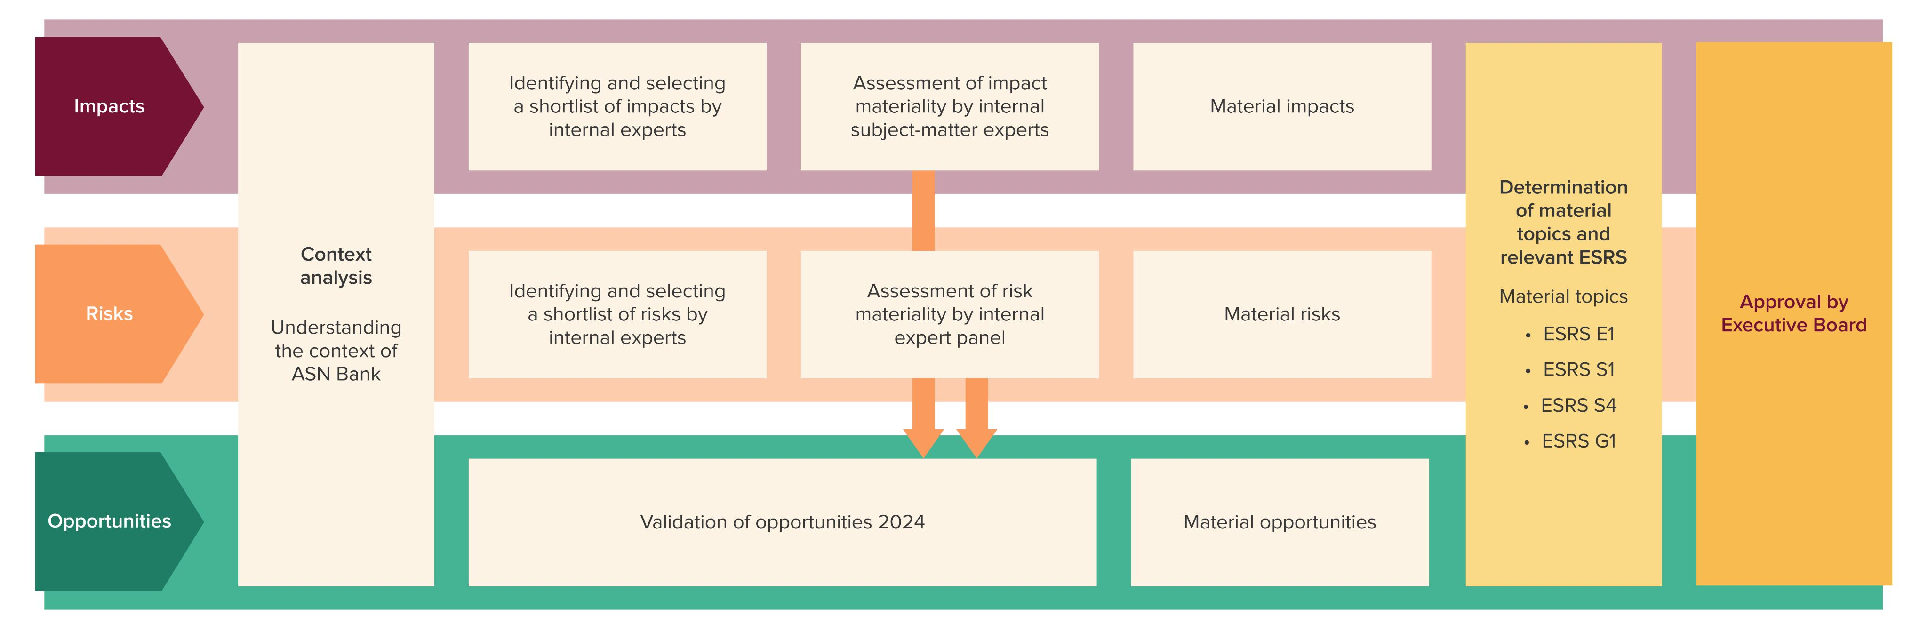
As a starting point for our DMA, we conducted a value chain and stakeholder analysis to understand the context in which we operate. Our DMA covers impacts, risks and opportunities connected with the bank through the entire value chain: our own operations and the upstream and downstream activities. The value chain is shown in the Section How we create value. All of ASN Bank's activities, including all underlying legal entities, brands, departments and portfolios, were considered in the DMA. As ASN Bank mainly operates in the Netherlands, the Netherlands were considered as specific geographical area. We also considered activities with possible heightened risk of adverse impacts.
ASN Bank’s due diligence process informed the context analysis and identification of impacts, risks and opportunities by establishing where and in which sectors our customers operate. This due diligence process is part of our sustainability policy, as described in the Section Sustainability policies. Our daily operations, policies and negotiations with third-parties relationships mitigate the exposure to material impacts, risks and opportunities in our value chain.
For the 2025 DMA the shortlist of topics from 2024 was reviewed in two separate processes to determine if new topics should be added or removed. This resulted in a shortlist for risks and a shortlist of impacts. In 2025, we included input from stakeholders through ongoing stakeholder engagement activities to understand how our stakeholders may be impacted by our business activities. This input was directly added to the shortlist of impacts.
Internal experts from different departments assessed the shortlisted sustainability topics. Experts scored the topics on scale, scope, irremediability, likelihood and human rights impacts, using a five-point Likert scale. When the scores met a predefined threshold a topic is considered material. When human rights are assessed, the severity of the impact takes precedence over likelihood. The assessment included an identification of where the impacts occur or might occur in our value chain.
The assessment of risks for shortlisted sustainability topics was carried out by topic experts and risk experts. Any dependence on natural or social resources was taken into account. A heatmap was used with the potential size of the impact on the x-axis and the likelihood of the impact on the y-axis. This resulted in risks in the categories low, medium or high. All risks plotted in the medium or high category were considered material and reviewed by risk experts for a final conclusion on materiality.
Internal experts validated whether the existing assessment of opportunities is still material, and whether there are any new opportunities. No changes in material opportunities were identified.
The assessment of impacts and risks was based on quantitative data as much as possible. However, the assessment has many subjective steps in the process and therefore qualitative expert judgement is crucial. For the topics climate change and customer relationship, we were able to use data based on the PCAF methodology and customer relationship scores. The last step in the DMA process was to assess whether the (new) material impacts result in risks and opportunities, experts concluded that this was not the case.
We link the material topics to the topical ESRS standards and disclosure requirements. Furthermore, a material IRO is linked to an entity-specific topic (anti-financial crime). We exclude disclosures when information is not material or not applicable for ASN Bank. The materiality of information was assessed from one or both of the following perspectives: the significance of the information to the matter and/or the capacity of the information to meet the decision-making needs of the user of that information. The ESRS content index shows which standards and disclosure requirements are made public, including a reference to the relevant chapter. We considered a list of qualitative criteria, such as industry standards or relevance to the user of the sustainability statements, to determine whether information on metrics or disclosure requirements were to be disclosed. Therefore, no thresholds were used.
The outcomes of the DMA followed the regular governance and were reviewed, discussed and ultimately approved by the ESG Impact Committee. The results were ultimately approved by the Executive Board and the ESG Committee of the Supervisory Board.
In 2025, we refined the process and made the following changes:
More quantitative data to substantiate the impact and risk assessment.
The impact assessment was executed separately from the risk assessment.
Through ongoing stakeholder engagement information was collected to identify shortlist IROs.
The outcome of the opportunity assessment 2024 was validated by internal experts. The identified opportunities remain relevant and no new opportunities were identified.
The DMA process requires us to make key judgements and make use of thresholds. Therefore, the sustainability statements may not include every impact, risk and opportunity or additional entity-specific disclosure that each individual stakeholder (group) may consider important in its own particular assessment.
We will further improve our materiality assessment in 2026 if necessary and where possible.
Sustainability risk is one of the strategic risks of ASN Bank and is incorporated in the risk taxonomy as a stand-alone risk type with the aim of developing a holistic approach to the incorporation of ESG risk drivers into the bank's overall business strategy, governance, risk management framework, organisational structure and reporting practices. The opportunities identified and assessed as part of the DMA are input for ASN Bank's strategy review process. The identification, assessment and classification of all material risks related to external and internal developments and the business strategy take place in the annual Strategic Risk Assessment and have been approved by the Executive Board.
The current financial effects related to a material risk or opportunity on the financial position, financial performance and cash flow are disclosed in the financial statements by incorporation by reference, including where there is a significant risk of a material adjustment within the next annual reporting period to the carrying amount of the assets and liabilities reported.
The table below shows the list of material and non-material topics resulting from our DMA 2025. For each material topic it is indicated whether it has been assessed as material from an impact or financial perspective, or from both perspectives.
ESRS | Sustainability topic | Impact materiality | Financial materiality | |
|---|---|---|---|---|
Risk | Opportunity | |||
Environmental | ||||
E1 | Climate change | √ | √ | |
E2 | Pollution | |||
E3 | Water and marine resources | |||
E4 | Biodiversity and ecosystems | |||
E5 | Resource use and circular economy | |||
Social | ||||
S1 | Own workforce | √ | √ | √ |
S2 | Workers in the value chain | |||
S3 | Affected communities | |||
S4 | Customers and end-users1 | √ | √ | √ |
Governance | ||||
G1 | Business conduct - Anti-financial crime2 | √ | ||
- In our Annual Report this topic is called Customer relationship
- Entity-specific topic
ASN Bank acknowledges the importance of all ESRS topics, but the topics Pollution, Water and marine resources, Biodiversity and Resource use and circular economy are not material. However, we do have policies on many of these topics; for more details see the Section Sustainability policies.
ASN Bank did screen its site locations and business activities and did not identify actual and potential pollution impacts, risks or opportunities in its own operations or upstream and downstream activities, because as a financial service provider it has no or limited exposures to polluting substances in its own operations. Consequently, no affected communities were consulted.
ASN Bank did screen its site locations and business activities and did not identify actual and potential water and marine resource-related impacts, risks or opportunities, because as a financial institution it only has exposure to water impact through household activities in its own operations and upstream and downstream activities. Consequently, no affected communities were consulted.
We are actively exploring the concept of nature as one overarching topic as we acknowledge that pollution, loss of ecosystems and biodiversity and climate change all contribute to a broader nature loss. We are committed to protect and support restoration of nature through our finance activities and investments. Our commitment is shown by having signed the Finance for Biodiversity Pledge in 2020. For a holistic approach we consider the impact, dependencies, risks and opportunities of nature loss.
In our DMA we screened our site locations and business activities and identified a non-material impact on biodiversity and ecosystem services and no material risks and opportunities. The materiality assessment covered our own operations, as well as our upstream and downstream value chain. The three main biodiversity impact categories are climate change, land use and water use.
We use the Biodiversity Footprint for Financial Institutions(BFFI) methodology to assess the expected impact on biodiversity of our investments and loans. In 2025 we aligned the biodiversity impact methodology with the PBAF Footprinting Standard and our net zero emissions 2050 KPI.
In 2025 our total biodiversity impact was -66,229 ha (-28,222 ha in 2024). The negative biodiversity impact was -97,549 ha (-61,922 ha in 2024), the avoided impact was 31,231 ha (33,699 in 2024). The increase in negative impact is mainly caused by aligning our methodology with PCAF. Firstly, we applied the actual attribution based on the Loan-to-Value of our mortgage portfolio instead of a 100% attribution, lowering our negative impact. Secondly, by implementing the PBAF Footprinting standard on government bonds, aligned with the PCAF approach, our negative impact increased significantly. We report avoided impact and negative impact separately following the PBAF Footprinting standard.
Since we have minimal investments in high-impact sectors, we assessed that our transition risks related to biodiversity are low. As a financial institution, we do not source raw materials in our own operations and therefore we have no impact on ecosystem services of relevance to potentially affected communities. Consequently, we did not conduct consultations with affected communities in our DMA. We have a limited number of offices that are located in populated areas. We therefore assume that we have a limited impact on biodiversity and ecosystems, or threatened species associated with our offices.
ASN Bank did screen its site locations and business activities and did not identify actual and potential resource use or circular economy-related impacts, risks and opportunities, because as a financial institution we make limited use or resources in our own operations and upstream and downstream activities. Consequently, no affected communities were consulted.
ASN Bank evaluated the impact on workers in the value chain during and after the transformation. We transitioned branch offices and shops into independent franchises, simplifying our commercial distribution network. Although this had an impact on shop owners and their employees, no material impacts, risks or opportunities were identified, as they could make use of ASN Bank's social plan.
Our banking services operate without material impact on local communities. Since our financing activities are mainly concentrated in the Netherlands, there are no actual or potential impacts on indigenous people. Through our sustainability policies, we exclude high-risk industries and sectors, as such we have a low risk exposure to affected communities in our value chain. In addition, we did not identify material opportunities that directly contribute to the livelihood of local communities or indigenous people.
The following tables list the sustainability-related impacts, risks and opportunities (IROs) we have identified and assessed as material as a result of our DMA, and briefly describes the material IROs. The risks 'climate change adaptation', 'wind', 'legal and regulatory changes with regard to insulation/renovation of collateral' and the potential negative impact 'equal treatment' were assessed as material in 2024 but are not material in 2025 due to new insights and an improved scoring method. On the same grounds we identified new material impacts 2025, indicated by the footnote in the following tables. More information on the effects of our IROs on our strategy or business model is included in the topical sustainability sections.
Value chain location | Time horizon | |||||||
|---|---|---|---|---|---|---|---|---|
Description | IRO | Up-stream | Own operations | Down-stream | Short-term | Medium-term | Long-term | |
E1 - Climate change | ||||||||
Climate change mitigation: The emissions associated with our business operations and financing activities have an actual negative impact on climate change. | Actual negative impact | • | • | • | • | • | ||
Climate change mitigation: The scope 3 emissions associated with the investment funds of our subsidiary ASN Impact Investors have an actual negative impact on climate change. | Actual negative impact | • | • | • | • | • | ||
Climate change mitigation: There is a potential negative impact associated with the ineffective implementation of our ESG transition plan, resulting in insufficient reduction of our emitted or financed emissions. | Potential negative impact1 | • | • | • | • | |||
Climate change mitigation: Through our contribution to the energy transition leading to emissions reduction inside and outside our value chain, there is an actual positive impact. | Actual positive impact1 | • | • | • | • | • | ||
Climate change mitigation: There is a potential positive impact associated with an increased or a more effective contribution to the energy transition leading to emission reductions in- and outside our value chain | Potential positive impact1 | • | • | • | • | • | ||
Pole rot following drought: Pole rot occurs when wooden poles under a foundation decay due to severe drought, harming the house's foundation. This can reduce collateral value (increasing LGD) and burden borrowers with repair costs, potentially lowering repayment ability and raising probability of default (PD). | Risk | • | • | • | • | |||
Subsidence following drought: Differential settlement occurs when buildings sink unevenly on non-uniformly compacted soil, potentially reducing collateral value (increasing LGD) and burdening borrowers with repair costs that may impair repayment ability and raise probability of default (PD). | Risk | • | • | • | • | |||
Flood: Flood damage risk (coastal, fluvial, groundwater, pluvial) can increase LGD through property devaluation and increase of PD via repair costs and higher insurance premiums. Operational risks include potential impact on datacenters. | Risk | • | • | • | • | • | ||
Legal and regulatory changes with regard to greenhouse gas emissions: In our downstream activities strict requirements regarding energy labels may reduce collateral values and increase LGD, while adaptation costs strain borrowers' repayment capacity. Regarding our own operations, the bank may face challenges with suppliers unable or unwilling to meet sustainability reporting requirements. | Risk | • | • | • | • | • | ||
Greenwashing: With an ESG strategy that needs to be further operationalised and evolving regulations, ASN Bank faces challenges that may lead to compliance, and eventually, reputational risk. | Risk | • | • | • | • | |||
S1 - Own workforce | ||||||||
Secure employment: The transformation of ASN Bank was a strategic decision to become more efficient and enhance its ability to adapt not only in response to regulatory requirements, but also to technological developments, shifting economic conditions and changing customer requirements. In the short term, the resulting reorganisation and related outflow of employees inevitably led to a material negative impact on our employees in 2025. | Actual negative impact | • | • | • | ||||
Working conditions: ASN positively impacts employees through the collective labour agreement, wellbeing/vitality/health offerings, training and development offerings. Working conditions will remain a priority because ASN Bank has to compete for employees with other employers. | Actual positive impact | • | • | • | • | |||
Equal treatment: Employees of ASN Bank are offered a working environment where we promote equal treatment and opportunities for all. ASN Bank has a DEI policy through which it positively impacts employees. | Actual positive impact1 | • | • | • | • | |||
Working conditions: The transformation of ASN Bank may impact the working environment as the associated unclarity of roles and responsibilities and potential increased work-related stress could lead to higher sickness rate, lower productivity, resignation of key persons and/or insufficient inflow of capable staff. | Risk | • | • | • | • | |||
Attracting and retaining employees: By offering good working conditions and providing equal treatment and opportunities for all, we nourish the reputation of an attractive employer, which strengthens our position to attract and retain employees. | Opportunity | • | • | |||||
Developing a workforce with the right skills: We offer all employees equal treatment and opportunities regarding training and skills development, for them to acquire, maintain and develop the right skills now and in the future. | Opportunity | • | • | |||||
Enabling employees to perform to their full potential: We enable our employees to perform to their full potential by helping them retain their mental, physical and financial health. | Opportunity | • | • | |||||
S4 - Customers & end-users | ||||||||
Social inclusion: The introduction of e.g. KYC measures can potentially cause discrimination or might complicate opening a bank account or access to other banking products. These impacts are assessed as severe for the customers. | Potential negative impact1 | • | • | • | • | |||
Social inclusion: We focus on making a positive impact on our customers through the banking products and services that we offer. A personal customer approach through seamless and pleasant interactions and suitable propositions are key for us. | Actual positive impact | • | • | • | • | |||
Customer relationship: Through building strong customer relationships, we see opportunities to retain our customer base, to cross-sell to satisfied customers, and to attract new customers. | Opportunity | • | • | • | • | |||
Information-related impacts for consumers and/or end-users: Data breaches and cybersecurity threats pose significant risks through unauthorised access and data compromise, potentially causing privacy violations and reputational damage. Poor data quality and unethical data practices can lead to operational failures, discriminatory outcomes, and regulatory penalties, ultimately resulting in financial losses and damaged customer relationships. | Risk | • | • | • | • | |||
G1 - Business conduct - Anti-financial crime2 | ||||||||
Financial crime: Financial crime risk represents potential losses from illegal activities utilising financial systems, including fraud, money laundering, terrorist financing, and corruption, with impacts across individual, business, and global economic levels. | Risk | • | • | • | • | |||
- New material IRO in 2025
- Entity-specific topic
Sustainability governance and policies
The Supervisory Board exercises oversight over the exposures and responses relating to ESG risks. It sets performance objectives for the Executive Board (ExBo), including performance objectives for our impact on society and aligned with (long-term) strategic objectives. By doing so, they consider ASN Bank’s desired ESG related risk profile in the Supervisory Board’s ESG Committee. In accordance with the suitability requirements, the management body has an induction and lifelong learning programme. On 18 December 2025, an educational session was organised for the Supervisory Board and Executive Board on sustainability and climate and environmental risks.
The ExBo is responsible for managing the overall sustainability objectives and ESG risks, and is the highest governing body for sustainability. The ExBo approves the strategic direction and targets, oversees our performance on material sustainability impacts, risks and opportunities (IROs) as well as policies, actions and targets, and approves the double materiality assessment results annually. The ExBo is presented with a progress update quarterly across strategic priorities and targets to further integrate the developments into its execution and oversight of the overall strategy.
The ExBo and its members are both individually and collectively responsible for sustainability and for identifying, monitoring and signalling developments in the exposures for sustainability risk. To increase efficiency and allow greater focus in specific risk areas and/or business themes, the ExBo has established committees to properly manage sustainability topics and the daily management for sustainability is taken care of within the COO domain.
The ESG Impact Committee (ESG IC) is a risk committee chaired by the CRO. The ESG IC steers and monitors the implementation of ASN Bank’s Sustainability strategy (including approval of ASN Bank's sustainability policy) and monitors compliance with regulations, guidelines and commitments. The committee also oversees all ESG-related KRIs in the risk taxonomy.
Risk and Compliance departments (second line) are responsible for monitoring that ESG risks are adequately controlled and that laws and regulations are implemented by the first line. Internal Audit, as the third line, is responsible for assessing whether the interaction between the first and second lines functions smoothly and providing an objective independent judgement on this.
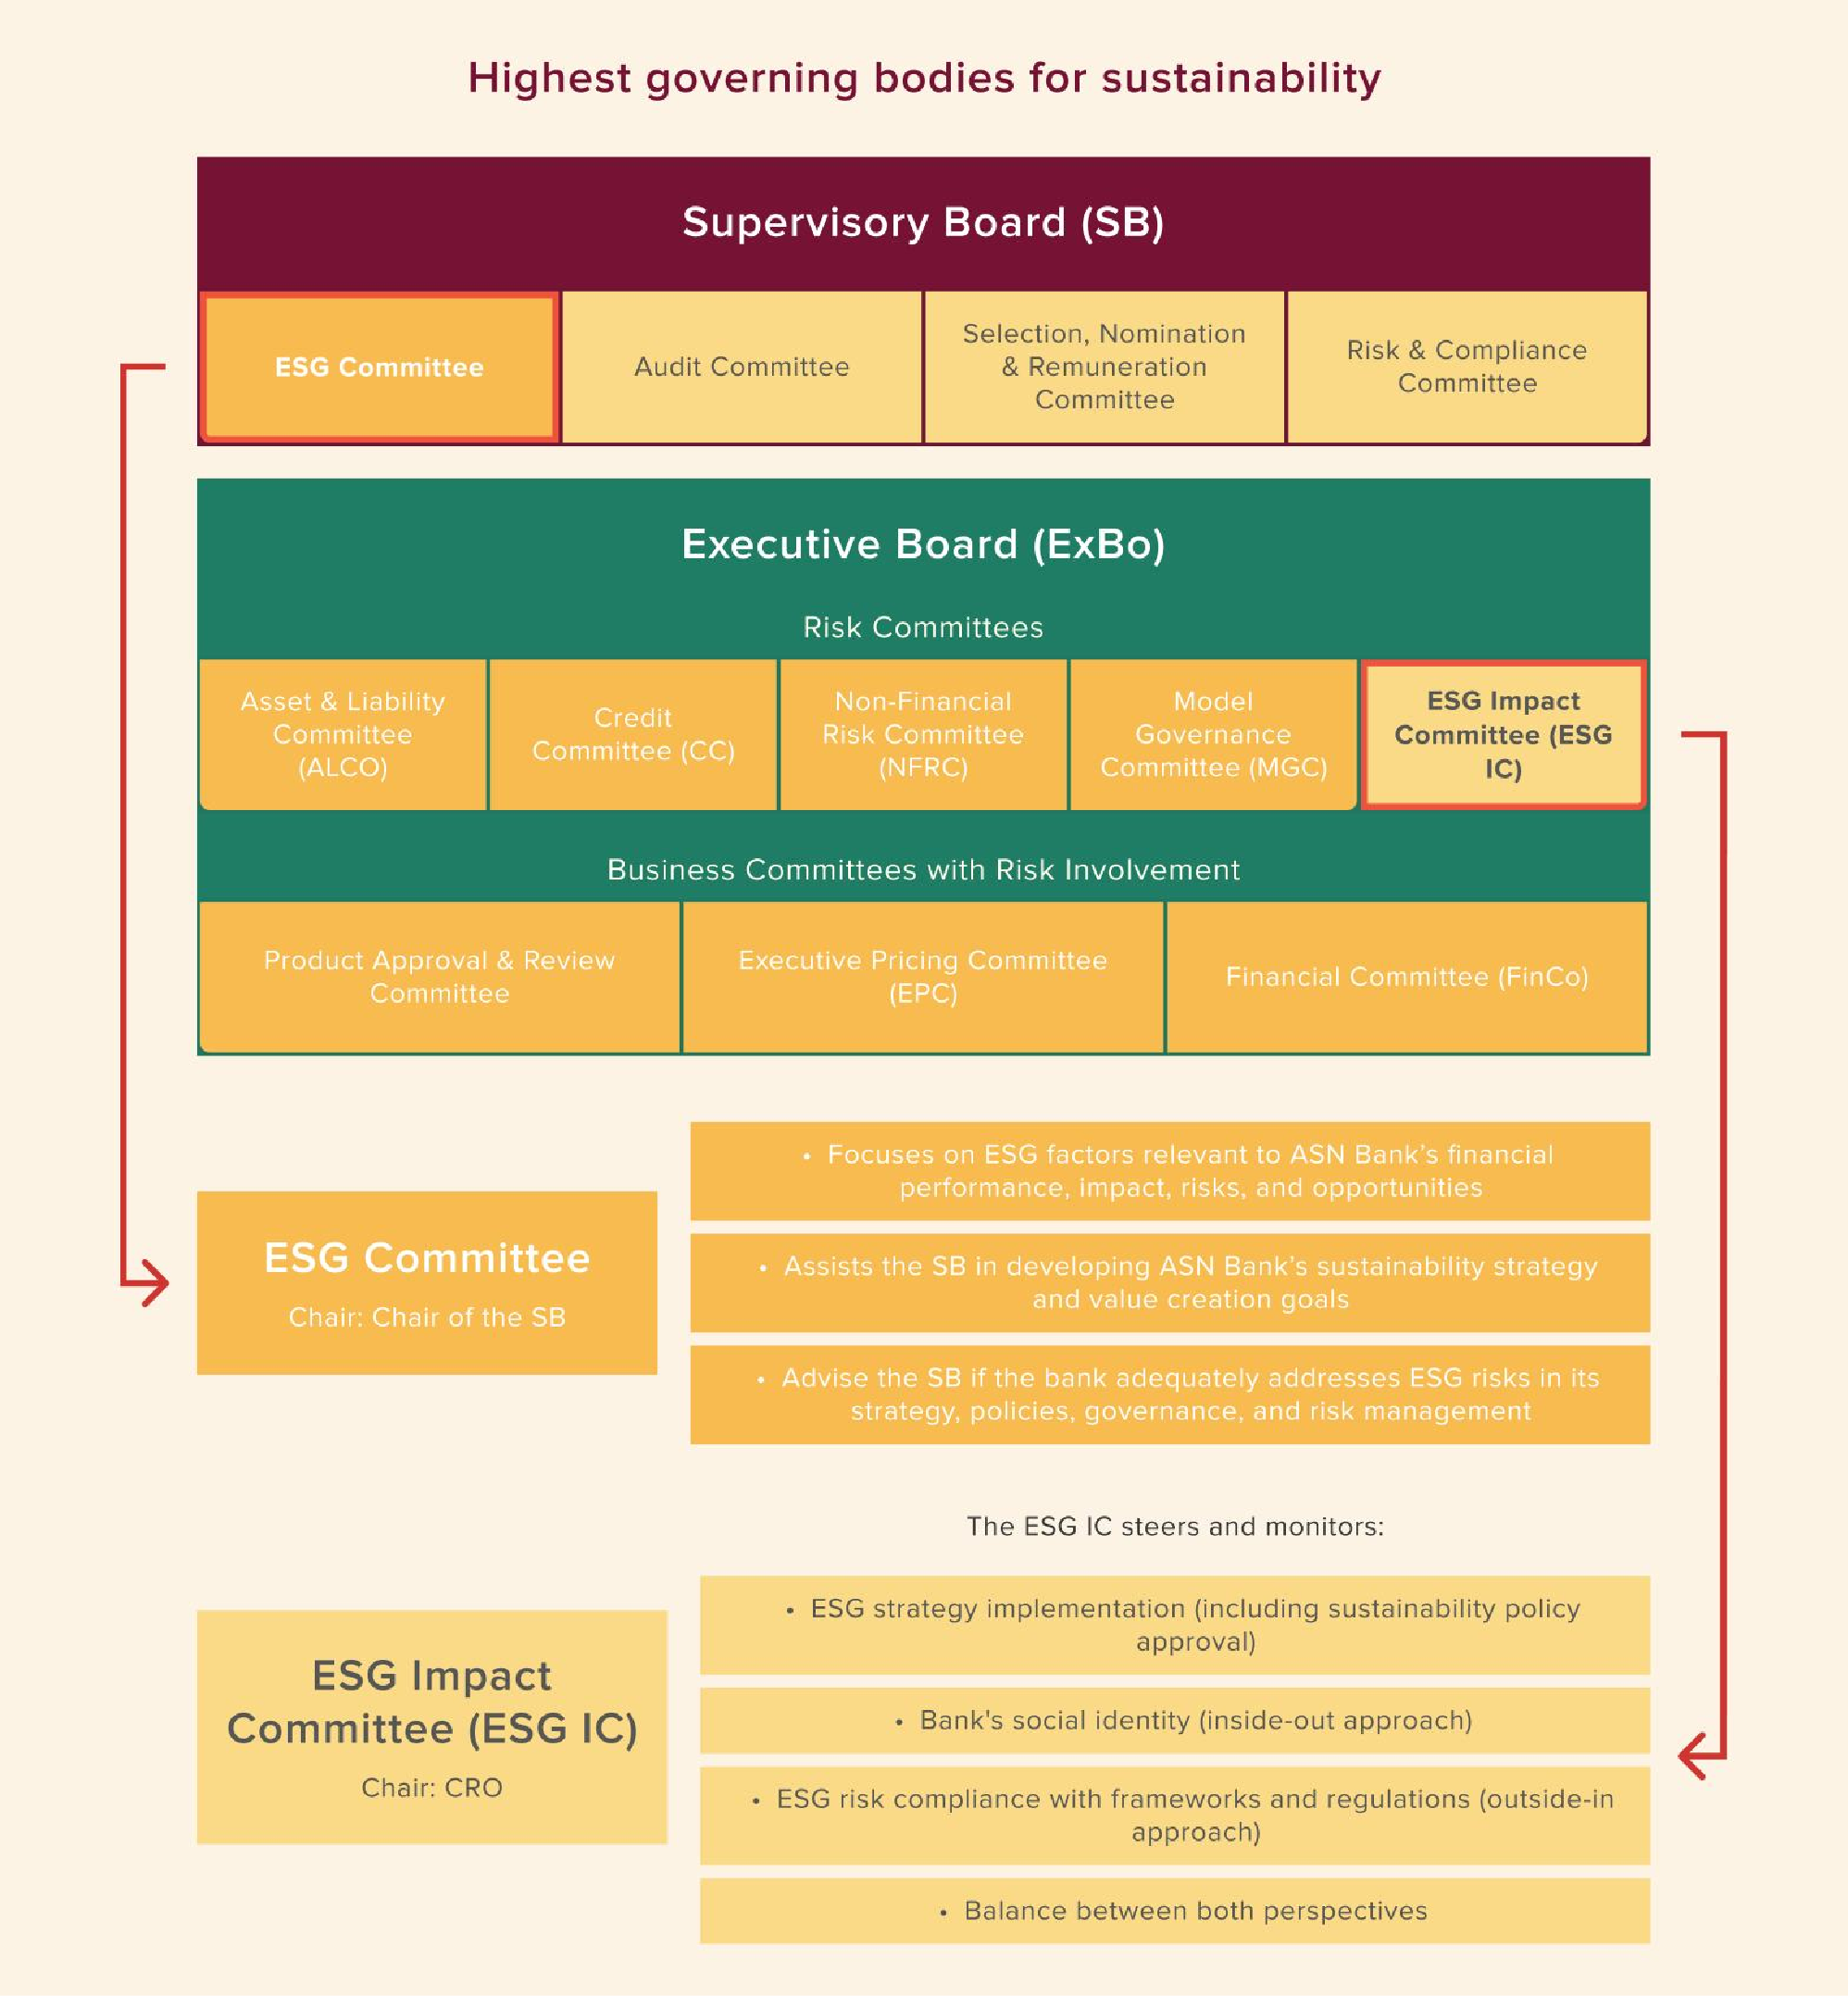
ASN Bank has monthly and quarterly risk reports in place, which include ESG risks. These monitoring reports consist of two levels:
Level 1: Enterprise level (ASN Bank)
Level 2: Business line level (i.e. department level)
Level 1 risk indicators are reported to the ExBo and Supervisory Board by the second line. Level 2 indicators are reported to specific risk committees by the first line or the second line. KRIs with an actual risk profile outside the ESG-related risk appetite must receive heightened management oversight and attention from the risk committee. The first line must define and execute actions to have these KRIs comply with the risk appetite again. The first line also submits a progress report on the progress made towards fulfilling the net zero KPI.
The ESG IC also regularly receives implementation progress reports on the fulfilment of ESG laws and regulations, such as the progress on the implementation of the EBA Guidelines on management of ESG Risk.
The expected impact of decisions on our four stakeholder groups, i.e. customers, society, employees and the shareholder, is included in the decision-making in all ExBo and ESG IC meetings. For detailed information on ASN Bank's governance structure, the role of the highest governance bodies and their composition and diversity, please refer to the Section Leadership and governance.
ASN Bank has no variable remuneration scheme. Nevertheless, every year the Supervisory Board sets performance objectives for the ExBo, including performance objectives for our impact on society. These objectives are derived from ASN Bank’s (long term) strategic objectives, and in setting them the Supervisory Board takes into account ASN Bank’s desired ESG risks-related risk profile. For details, see the Section Performance objectives and the link with remuneration.
The purpose of our sustainability policies is to minimise the negative impact and increase our positive impact we have through our investments and loans. We also use the sustainability policies for due diligence and to identify, monitor and mitigate ESG risks as much as possible.
These policies cover all our investments, financing activities and own operations. As our sustainability policies and criteria continue to evolve, or where issuers of bonds become involved in controversies, certain legacy bond holdings may no longer align with our current sustainability standards. In such cases, we do not initiative new investments in the affected counterparties. However existing holdings may be retained and managed in a prudent manner rather than divested immediately. Several components of our policies relate to how counterparties approach ESG risks. We apply our policies at three levels: sustainability policies, specific sustainability policies and applied sustainability policies.
The Sustainability Policies (SPs) have three pillars: climate, biodiversity and human rights. We assess countries, organisations and businesses based on these sustainability policies. The approach to our SPs consists of two elements: 1) a set of sustainability criteria to exclude or avoid investments that have a negative impact and 2) a set of criteria to assess how to support investments that contribute to sustainability. Below, we elaborate on the two elements of our approach for each pillar.
In 2026, we will review and align our sustainability policies with our new strategy, enabling the bank to support transition and to grow in sustainable products and services and incorporate recent developments. The SPs and Specific Sustainability Policies (SSPs) contain information regarding the sustainability criteria for our investments in for example corporate and sustainable bonds. We engage with our stakeholders including NGOs, other financial institutions, academics, politicians and the media. Our policies are available for our stakeholders on our website. In SSPs, we provide additional guidance and criteria for specific topics or sectors.
Our sustainability criteria exclude entities with a substantial negative impact on climate change. Instead, we support investments that contribute to combating climate change. We do not invest in fossil fuel exploration, production, or fossil-fuelled electricity generation.
Our biodiversity criteria are in line with the main threats concerning loss of nature and biodiversity: land use change, overexploitation, climate change, invasive and exotic species, and pollution. We promote projects that aim to protect nature and relieve the pressure that society puts on it. This includes renewable energy and circular economy projects that lead to lower natural resources consumption.
We have a wide range of policies to avoid violations of human rights in our loan and investment portfolios. Direct investments in companies that are involved in the development and manufacturing of or trade in armaments are therefore excluded. All listed companies are screened and then monitored periodically to ensure they meet this policy. We can, however, invest in government bonds, non-combat equipment, and dual-use technologies and goods, which can serve both civilian and defence purposes.
Examples of criteria to support investments that uphold collective, human and labour rights are: equal treatment and anti-discrimination, no forced or child labour, safe and healthy working conditions, freedom of association and respect for the rights of local communities and indigenous people. This is in line with the Core Conventions of the International Labour Organization. Our policy also addresses human rights in our own operations and own workforce, consumers and end users in scope.
Our human rights policy prescribes how we conduct our human rights due diligence. In 2023, we conducted a salience risk analysis following the United Nations Guiding Principles for Business and Human Rights. This analysis showed that the risks of forced labour and degradation of livelihoods in the mining and metals chain are the most salient human rights risks through for example our investments related to renewable energy. Yet these risks are not assessed as material for ASN Bank. In 2026, we aim to conduct a new human rights salience analysis, the results of the 2023 analysis remain relevant for our sustainability policies.
Our sustainable energy policy strengthens our focus on identifying and addressing human rights risks throughout the supply chain. We pay particular attention to the risk of forced labour in solar panel and battery supply chains. ASN Bank is also a supporting partner of the IRBC covenant for the renewable energy sector. The purpose is to jointly tackle and prevent risks in the area of human rights violations and environmental damage by collaborating with solar and wind energy companies, industry associations, the Dutch government, knowledge institutes, NGOs and trade unions.
Several components of our policies are related to how our counterparties deal with social risks, such as their attitude towards human rights, the (local) community and society, employee relationships and labour standards, customer protection and product responsibility, healthcare, a living wage, privacy, housing, and social needs.
The Applied Sustainability Policies specify how our sustainability policies are implemented in various processes. The responsibility for implementing these operational policies lies with the relevant departments.
ASN Bank is guided by international treaties and conventions as fundamental starting points for our sustainability policies, aimed at a sustainable society for current and future generations. For an overview of guiding principles see the image Foundation of our policies.

As we invest in several different asset classes with different risks profiles, the way these policies are implemented varies. As described in this section, the sustainability policies also relate to the governance performance of our counterparties. The governance concerning the sustainability performance of these asset classes differs.
In general, ASN Bank has no specific governance body responsible for deciding whether or not to do business with a counterparty. Our Sustainability team develops sustainability policies. These policies are discussed with all relevant internal stakeholders, who can give their input. The ESG Impact Committee is responsible for approving and implementing the sustainability policies. The Sustainability team analyses whether a potential loan or investment is in line with our Sustainability Policies. The Sustainability team advises the departments responsible for purchasing or investing in the counterparties. In addition, we do not systematically take into account the role of a counterparty’s highest governing body in the approval of its non-financial reporting. This applies to all the categories listed below.
We conduct an assessment for corporate (green) bonds by analysing whether the activities or projects that are financed with the bond or loan involve activities we exclude or avoid. For corporate bonds, we assess whether the company has policies in place for sustainability risks, including integrity-related risks, and check if the company is not listed as an UN Global Compact violator.
Within ASN Bank, the Sustainability team is responsible for assessing counterparties’ policies on these topics. In addition, we monitor if companies are involved in ESG-related misconduct, using a data provider (RepRisk). When the company is involved in serious misconduct, we engage with the company to seek further clarification.
Companies approved for ASN Impact Investors' investment universe are also eligible for corporate bond investments. The companies that fall within the investment universe of ASN Impact Investors are assessed in the onboarding process; among others, this review covers aspects such as ethics, strategy and risk management, inclusiveness, transparency and management of conflict of interest.
For green bonds, we assess the framework but do not necessarily evaluate the issuer's highest governing body (as is also the case for corporate bonds). Additionally, we always include a second opinion in our assessment. If this opinion contains recommendations, we may verify whether the issuer has addressed them or set their implementation as a condition for investment.
Government bonds and loans must meet our exclusion criteria as described in our specific policy for government bonds. We periodically update the countries that are eligible for our government bond portfolio and analyse whether financial institutions comply with our sustainability policies. We base these criteria on the endorsement of relevant international conventions, through ratification or accession. After, the performance of non-excluded countries is assessed based on a number of relevant indexes, as democracy, LGBTIQ+ rights, level of corruption, forced labour, protected areas of nature, etc. In this way, considerations of ethics, strategy and risk management, inclusiveness, transparency and management of conflict of interest are taken into account in the assessment of the counterparty. Internal communication on critical concerns is not considered at the moment. In consequence, we select countries that meet the exclusion criteria based on sustainability criteria for climate, biodiversity and human rights. Some countries are therefore excluded from our investment portfolio, for instance when they do not actively reduce their impact on climate change.
For project financings in the Sustainable finance portfolio we have developed a tool which is used to determine whether a potential project meets our sustainability criteria or whether extra research is required. Under this portfolio, as we only invest in projects within the Netherlands or North-West Europe, local legislation is considered sufficient as governance screening criteria. Since early 2025, we have suspended new sustainable finance loan origination, while reviewing our strategy and focus in this area. We are currently investigating whether and in what form the portfolio can possibly grow again in the future.
We do not assess our SME customers on specific governance aspects, since these criteria are considered disproportionate for this customer group. But we do exclude certain businesses. We base that on SBI-codes/ their core business. For example, we exclude business in the fossil fuel sector.
It is important that the collateral of our mortgage portfolio becomes more energy efficient. In our ESG transition plan we describe our ambitions and actions to further improve the energy efficiency of our residential mortgage portfolio. In our mortgage products, we do not exclude (potential) homeowners with low energy efficiency ratings. However, we do proactively engage with our customers by offering products and services aimed at home energy efficiency improvement.
We have continuous monitoring and periodic assessments in place to ensure that our current and potential investments and loans remain within the limits of our sustainability criteria. We also monitor and actively engage with companies in case of observed controversies or misconduct. In case of serious misconduct, we approach the relevant stakeholder and engage in a conversation to set up a request for action. If the stakeholder cannot uphold this request, we may decide to withdraw as an investor or financier.
The table below states where in our sustainability statements we provide information about our due diligence process, including how we apply the main aspects and steps of our due diligence process.
Core element of due diligence | Climate change | Own workforce | Customer relationship | Anti-financial crime |
|---|---|---|---|---|
a) Embedding due diligence in governance, strategy and business model | ||||
b) Engaging with affected stakeholders | ||||
c) Identifying and assessing negative impacts on people and the environment | ||||
d) Taking action to address negative impacts on people and the environment | Actions and resources in relation to climate change policies | |||
e) Tracking the effectiveness of these efforts | ||||
Our ESG risk management and internal controls are integrated in our existing Risk Management framework and three lines model. This ensures a consistent approach to risk management across the bank, including the alignment of sustainability reporting with financial and non-financial reporting. See for more information Risk management1.
The process of preparing the Sustainability Statements is aligned with the Annual Report process and governance, where necessary, specific ESG bodies are embedded.
The sustainability reporting process includes both manual and automated controls and oversight procedures. Since sustainability reporting is still developing, we are also still developing and improving our risk management framework implementation.
- Not in scope of limited assurance.
Environmental information
Climate change mitigation is key to our sustainability strategy. Our commitment to reduce our environmental impact is embedded within our organisation through our sustainability policies and enforced by our transition plan. ASN Bank is committed to the National Climate Agreement, the Science Based Target initiative and the Paris Agreement.
We identified the following impacts, risks and opportunities:
Actual and potential negative impact from our emissions through our own operations and financing activities, and a negative impact from our assets under management,
Actual and potential positive impact through our financing activities in the energy sector.
Risks on our collateral as a result of pole rot, subsidence and floods.
Risk regarding legal and regulatory changes and green washing.
No opportunities are identified.
Transition plan, policies, actions, targets and metrics
ASN Bank is developing a holistic ESG transition plan, including our actions to reduce our environmental impact and to mitigate climate and environmental risks.
Our sustainability policies provide practical guidance for decision-making regarding our investments, financing activities and own operations.
All our relevant business and financing activities are included in our net zero by 2050 KPI.
To support the net zero KPI, ASN Bank has validated Science Based Targets. They express which emissions we need to reduce and at what speed.
We calculate our environmental impact in accordance with the Greenhouse Gas Protocol and PCAF.
176 tonnes CO2e reduction in our own operations, contributing to our net zero by 2050 KPI.
41,311 tonnes CO2e reduction in our financing activities, contributing to our net zero by 2050 KPI.
We neutralise 1,345 tonnes CO2e through nature-based removal projects.
Climate change
In response to the 2015 Paris Agreement, the Dutch financial sector committed itself to the National Climate Agreement of the Netherlands (het Klimaatakkoord). In 2019, ASN Bank (at the time de Volksbank) endorsed the Financial Sector Climate Commitment. Following up on the commitment, ASN Bank published its Climate Action Plan in 2022, stating the ambition to reach net zero emissions by 2050. To support our 2050 ambition ASN Bank has near-term Science Based Targets (SBTs) validated by the Science Based Targets initiative since November 2022. Since then, we moved beyond the Climate Action Plan and are developing a holistic ESG transition plan to support our impact ambitions and ensure resilience to ESG risks.
Through our own operations, investments and financing activities, we emit greenhouse gases into the atmosphere, contributing to climate change and impacting nature. This negative impact on the environment is considered a material impact in our double materiality assessment (DMA). In our DMA we also concluded that there are material climate and environmental risks.
To identify and assess our environmental impact, we measure, report and set targets. In 2025, our total scope 1, 2 and 3 emissions were 1,376 ktCO2e, excluding scope 3 emissions from our assets under management activities. For more details about our emissions and GHG protocol, see Section Gross scope 1, 2, 3 and Total GHG emissions.
The impact from our business operations on the environment is limited at 2% of our total emissions. Business travel, commuting, heating and IT hardware and software contribute the most to our business operations emissions. Since our branch offices and shops are now independent franchises, we disclose their emissions separately.
The remaining 98% of emissions occur in our value chain through our business relationships, specifically from our investments and financing activities. Our sovereign bond and mortgage portfolio of residential and commercial real estate, especially properties with a low energy efficiency rating contribute the most to the negative impact.
ASN Bank makes a positive contribution to climate change mitigation through investments in renewable energy projects and projects that aim to accelerate the energy transition, like energy storage. We are committed to only finance renewable forms of energy through the Science Based Targets initiative (SBTi). This is an integral part of our strategy and commitment to the Financial Sector Climate Commitment.
By supporting our mortgage customers with banking and non-banking products, we have an indirect positive impact as well, either via our own banking products or through products and services from partners. With our nature inclusive mortgage, we offer mortgage products for renovations that stimulate energy efficiency, climate adaptivity and nature inclusiveness. Doing so we encourage our customers to make their homes more sustainable and improve living comfort.
We participate in various working groups to co-create uniform sustainability definitions, methodologies and reporting methods for the financial sector. This resulted, among other things, in the development of the Partnership for Carbon Accounting Financials (PCAF), of which we are co-initiators. The PCAF developed an internationally recognised method to measure and monitor the financed emissions of loans and investments. Other initiatives in which we participate include the Partnership for Biodiversity Accounting Financials (PBAF), and the Energy Efficient Mortgage NL Hub.
In our DMA we included the risks that were identified in our ESG risk materiality assessment (ESG RMA). In the ESG RMA we considered climate related hazards to identify and assess climate change related physical risks, and we considered transition events to identify and assess transition risk relevant to ASN Bank. In Section Sustainability risk, we specify the time horizons, likelihood, magnitude and duration of identified hazards, events and risks and we describe the identified material risks and how they interact with our business activities, strategy and investment capacity.
The identified risks could potentially have a financial impact on the bank. To mitigate the potential impact, we have an overlay for ESG risks for our mortgage portfolio. Physical environmental risk associated with i.e. the risk of flood and drought are considered for that overlay, see Section Developments per portfolio - Management overlay. To calculate the overlay, we used the same scenarios of the Dutch Climate Impact Atlas (Klimaateffectatlas) as we did to determine the IROs. We disclose our physical and transition risk in the ESG materiality table in Areas of focus and activities in the Sustainability risk Section.
We did not identify any material opportunities in the DMA regarding climate change mitigation and adaptation and have therefore not included opportunities in policies, targets, metrics and other analyses.
In December 2022, we published our Climate Action Plan (CAP), describing our impact reduction ambitions and possibilities on how to reach them. In 2024, the CAP was succeeded by the Net zero transition plan, specifying our actions and aimed at accelerating our emission reductions. In 2025 we worked on an integrated ESG transition plan expanding the scope to incorporate ESG risks. We have the ambition to finalise the ESG transition plan in 2026. The ESG transition plan serves as a strategic guide for ASN Bank to systematically manage the shift towards a sustainable business and investment practice, given changing prudential circumstances and varying customer behaviour. Below we visualise how our strategy, targets and transition plan relate to each other.
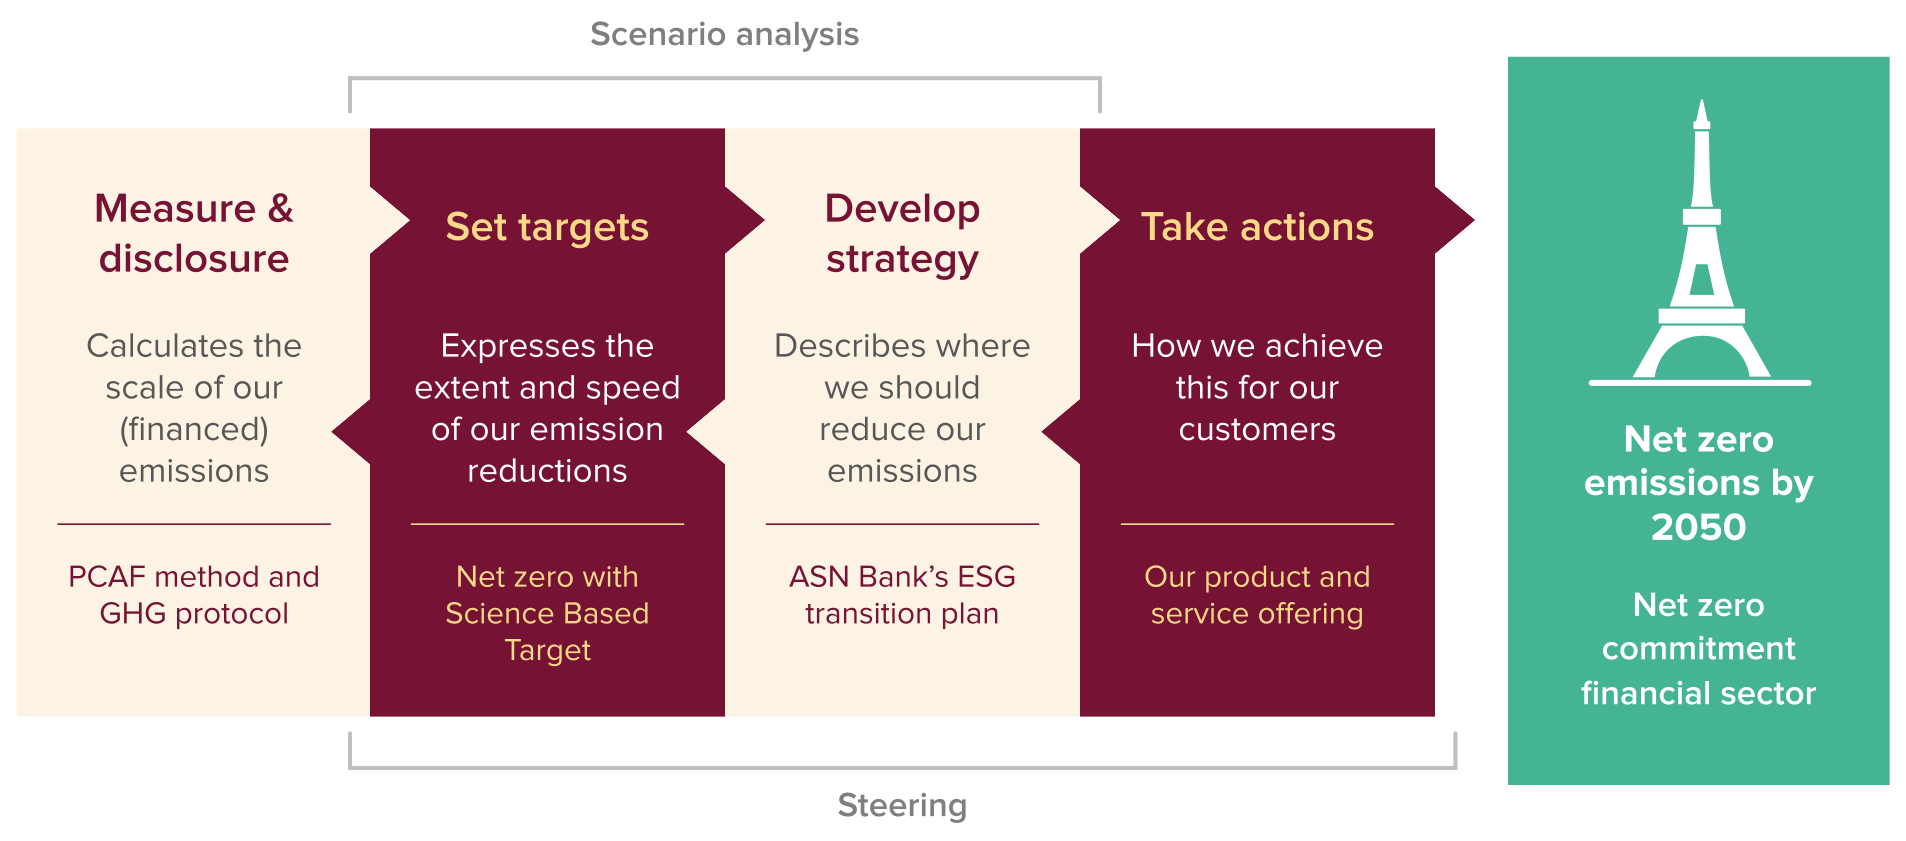
ASN Bank’s strategy 'Simplify and Grow' sets out three priorities: growth in mortgages, savings and payments, increase sustainable and societal impact, and simpler and faster operations. These priorities define the direction of the ESG transition plan and contribute to a sustainable and fair future for everyone.
Our overarching objective to transition planning is to embed sustainability at the core of our business strategy and risk management, ensuring the bank’s activities are compatible with the transition to net zero and a more sustainable economy. This implies that ASN Bank aims to address ESG risks in the short, medium and long term, in line with the overall business strategy, risk appetite and regulatory requirements. For example, the bank helps customers make their homes more energy efficient. ASN Bank is also looking into whether, in addition to existing impact funds, it can offer more funds that stimulate the energy transition. Or invest in the transition to a more sustainable economy and society through financing.
This high-level objective drives the bank’s ESG initiatives and aligns with regulatory expectations, and EU and Dutch policy goals (e.g. the European Climate Law target of net zero by 2050, and interim -55% emissions by 2030). The plan considers the requirements from both the ESRS and CRD, including underlying guidelines and introduces a structured annual ESG transition planning cycle. It covers ASN Bank’s own operations and financing activities with emphasis on retail lending.
Furthermore, the new strategy also emphasises the focus on mortgages while ‘simpler and faster’ acts as a pre-condition and enables ASN Bank to offer sustainable finance solutions to homeowners at an affordable price. To reduce our environmental impact, ASN Bank aspires that products and services offered to customers — from green mortgages to sustainable investment solutions — actively contribute to building a more socially responsible and environmentally sustainable asset portfolio, while driving measurable positive impact for its customers and communities. Regarding our mortgage portfolio, sustainable actions will help to transform the traditional mortgage lending operation into a catalyst for sustainable housing transition. In Section Strategy, business model and value chain we explain how we operationalise the ‘Simplify and Grow’ strategy.
To implement the overarching objective we have defined specific short-term, medium-term, and long-term strategic goals that detail how ESG priorities will be achieved over time. These objectives are aligned with the bank’s overall corporate strategy and ensure ESG risks are managed within the risk appetite at each stage. We outline these strategic ESG objectives by time horizon, showing how the bank will progress from immediate integration steps to long-term net zero alignment, while ensuring adequate risk management on ESG risks. With the short-term objectives (2026) we continue to strengthen the foundation for ESG integration across all operations and support the quantification of our decarbonisation levers. Our mid-term ambitions (2027-2030) regard scaling sustainable finance solutions and ensure adequate and proportionate ESG risk management. Achieving net zero alignment and play a leading role in sustainable finance are key in our long-term objectives (2031-2035+).
Our net zero KPI is central in the ESG transition plan. Net zero entails that we have to reduce our emissions from our own operations and the emissions from our investments and financing activities to as close to zero as possible, and neutralise the residual emissions. The ESG transition plan covers relevant activities of the bank: residential mortgages, business mortgages and corporate bonds and also project finance for renewable energy projects. The data and calculation method for determining the progress on the KPI are registered and monitored in automated IT processes. On a quarterly basis ExBo and the ESG Impact Committee (ESG IC) are informed. Every month a performance report is shared with the first line.
ASN Bank has taken important steps to expand ESG related human and financial resources in 2025. Key expertise has been established in climate scenario analysis, portfolio alignment methodologies, ESG data management and risk materiality assessments. We also have enhanced our capabilities to improve the availability, quality, and integration of ESG data across core systems. At the same time, foundational governance structures—such as the ESG Impact Committee, ESG specific RACI allocation, and strengthened first and second-line monitoring responsibilities—are now in place to support implementation. In 2026 ASN Bank will work on further strengthening several areas where upskilling and improved capabilities ought to be required.
ASN Bank's climate policy, see Section Sustainability policies, forms one of the foundation for the ESG transition plan and sets sustainability criteria to inform our lending and investments decisions. The climate policy is accompanied by our risk management policies to manage climate-related financial risks. Finally, the policy explains how different stakeholder groups are consulted and affected. We put our intentions into practice with the Climate change mitigation hierarchy. A tool that sets priorities to reduce our negative impact. The hierarchy is structured as follows:
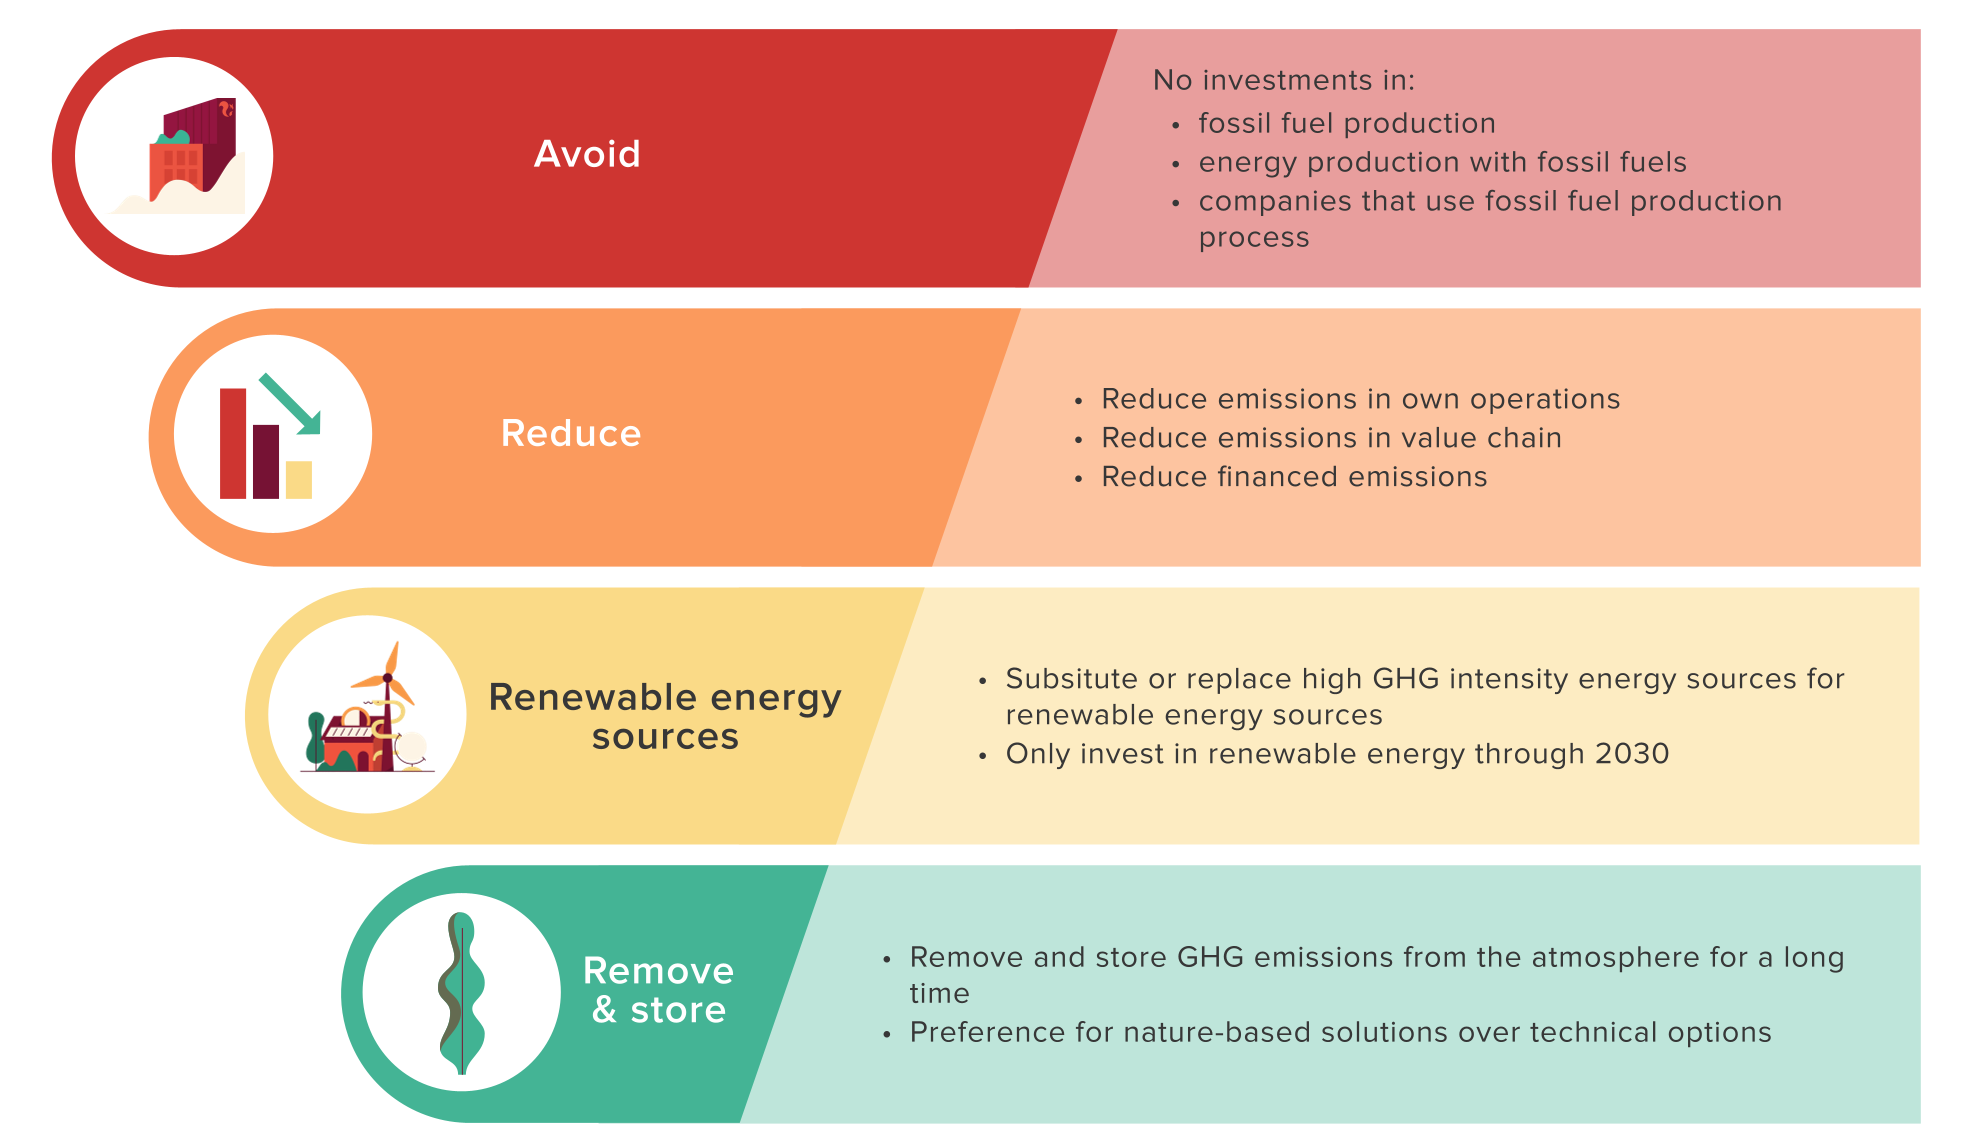
We have policies in place to manage our impacts, risks and opportunities related to climate change mitigation and adaptation. See the Section Sustainability policies for more information and how we engage with our stakeholders.
Our policies describe how we intend to contribute to climate change mitigation and include climate change adaptation measures for our homeowners. We explain how investments in energy efficiency, in the renewable energy transition and other initiatives can improve climate, the environment and nature as a whole.
Of our total emissions (excluding the scope 3 emissions of our asset manager), 35% originate from our loan portfolio from the provision of private and business mortgages. Since we include the emissions of our mortgage portfolio in our GHG inventory, we have developed activities to reduce these emissions. These activities are considered in our ESG transition plan, in which we indicate the actions and financial resources for the coming year.
In our investment policies, see Section Sustainability policies, we explain our investment criteria to exclude certain investments or to support investments in combating climate change and the transition towards a sustainable economy. In line with the climate mitigation hierarchy and aligned with our sustainability criteria, we exclude investments in the following three categories:
The production of electricity and heat involving high emissions.
The production of electricity and heat based on lignite, coal, shale gas and oil (such as tar sands oil) accounts for the largest share of GHG emissions per unit of energy generated. Although these emissions can be reduced by improving efficiency, we do not consider this sufficient. We do not regard ‘clean coal-fired power plants’ as a sustainable energy source, not even if the CO2e is stored in gas fields, for example by Carbon Capture and Storage.
Activities that emit high levels of substances during production.
Activities that emit large amounts of greenhouse gases include mining, the extraction and production of lignite, coal, oil (e.g. tar sands oil) and gas (e.g. shale gas), basic chemicals (including petrochemistry), base metals, and cement production.
Products that emit high levels of substances during the use phase.
This includes products from transport, agriculture and livestock farming.
Since we avoid heavily polluting sectors, we do not have specific sector targets in our transition plan. We do support investments that contribute to combating climate change and the energy transition. Additionally, we realise that climate change is inevitable and therefore we invest in climate adaptation measures. We offer discounts to homeowners when they want to finance climate adaptive measures, like water retainment and more greenery in their garden.
Every year we provide qualitative and quantitative data to report our progress on the Financial Sector Climate Commitment. ASN Bank cannot be excluded from the EU Paris-aligned benchmarks.
Throughout 2025, we continued scenario analyses to determine the rate at which we need to reduce our emissions. The ExBo has approved the scenario that is aligned with our science-based targets for 2030. For this analysis we developed an internal tool to assess different scenarios to determine the impact of our actions on the target and target year. A scenario in line with the Paris Agreement and a conservative scenario were considered. The difference between the two scenarios determined the decarbonisation levers and their effectiveness and appropriateness for our financed emissions.
In this respect, we considered a change in emissions related to portfolio growth, autonomous development due to external factors such as policy, legislation and regulations, as well as market fluctuations. The remaining emissions must be reduced through our products and services.
Decarbonisation levers are the products, services and other actions that are implemented to reduce emissions and to achieve our climate mitigation goals. To reach net zero emissions by 2050 we are investigating the potential decarbonisation levers for both our banking and non-banking products. For scope 1 and 2 we have quantified our decarbonisation levers, while for our scope 3 categories we have set reduction targets for our most impactful activities, but have yet to quantify the decarbonisation levers. Consequently, for our scope 3 emissions we have not identified dependencies, risk and financial effects for decarbonisation levers.
Decarbonisation levers that address the scope 1 and 2 emission reduction targets include moving to smaller offices with better energy performance in 2026. We estimated in 2024 that moving offices could lead to a scope 1 and scope 2 (location-based) emission reduction of 570 to 700 tCO2e per year, depending on the amount of floor space we need. In 2025 we reduced our emissions with approximately 125 tCO2e by moving our offices in ‘s Hertogenbosch. Moving offices in Utrecht could potentially reduce the emissions with 440 to 560 tCO2e, aligning with our estimated total reduction.
The 'Simplify and Grow' strategy has reconfirmed our net zero ambitions by 2050 which are supported by our SBTs. In 2026 we are identifying, quantifying and optimising our decarbonisation levers to achieve our GHG emission reduction targets in scope 3. Supported by the climate mitigation hierarchy, as described in the Section Transition plan for climate change mitigation, we have identified various decarbonisation levers.
To reach net zero emissions by 2050 we are investigating the potential decarbonisation levers for both our banking and non-banking products. Costs were included in the Financial Plan & Budget for 2025.
Banking products and services to retail customers
We offer several banking products and services that could serve as decarbonisation levers. These products and services either attract new customers with more energy efficient collateral, or help existing customers improve the energy efficiency of their current home. These products and services include: Bespaarhypotheek, an ASN mortgage including a loan component for sustainable housing, a personal loan for sustainability, and advice for sustainable renovation.Non-banking products and services
In November 2025 ASN Bank started a pilot to support customers with improving the energy efficiency of their homes. This pilot will run until December 2026 to investigate which measurements are most effective in actually motivating home owners to take action. Together with partners ASN Bank offers 1,600 existing customers a free energy efficiency rating, including personal advice. With this pilot we aim to gain valuable insights in how to motivate customers to take action, which in turn contributes to our net zero KPI.
Removing CO2e from the atmosphere
For the remaining emissions, such as emissions from generated waste, the last step of the carbon mitigation hierarchy, is to extract those emissions from the atmosphere and store them for a long period of time. We set requirements on CO2e removal and storage in line with the four principles of carbon dioxide removal as stated in paragraph Climate change mitigation hierarchy.
In the ESG transition plan, budget is allocated to reduce the CO2e emissions of our mortgages. We continue to invest in our sustainability strategy and a specialised team to reach our targets. Initially, the budget will be used to improve data quality, develop non-banking products such as energy-saving advice or an insulation voucher, and carry out pilots to gain experience with direct customer approach. The resources are only allocated to the ESG transition plan in order to reduce CO2e emissions; sustainable financing instruments are excluded from this budget. To determine a precise budget, we are improving our understanding of the effect of the decarbonisation levers.
No significant monetary amounts of CapEx or OpEx were required to implement the actions in 2025. The ESG transition plan is evaluated annually to include changes in data, scenario analysis or organisational changes, to determine what resources are necessary.
Locked-in emissions are the future emissions that are likely to be emitted over the lifetime of the key assets of ASN Bank. Our main assets are residential and business mortgages. As part of our social profile, our policy is to finance homes with the entire range of energy efficiency ratings (A-G), to keep the financing of these homes accessible. We develop products and initiate partnerships on sustainable housing to increase the energy efficiency of these homes, allowing homeowners with a low energy efficiency rating to implement measures to make their home more sustainable. However, we are dependent on homeowners, asset characteristics and external factors, in reducing our mortgage portfolio emissions.
The dependency on homeowners is linked to their willingness and ability to make their homes more sustainable. If they do not want or are not able to make their house more sustainable, the energy efficiency rating of their home and consequently our mortgage portfolio will not improve. For some of our assets, for example monumental real estate, increasing the energy efficiency rating is challenging as options for improvement are limited. Finally, external factors – such as effective government policy implementation, macro-economic development and the high energy prices – play a significant role.
Currently we have not determined the extent to which locked-in GHG emissions are present in the financial assets of ASN Bank. In 2025, we increased our insights to determine the potential locked-in emissions in order to identify potential transition or physical risks. You can read more about our risks in Section Sustainability risk.
Since climate change is the main driver of our identified climate and environmental physical and transition risks, our efforts to mitigate climate change contribute to the mitigation of these risks. Our net zero KPI is central in the ESG transition plan. Net zero entails that we have to reduce our emissions from our own operations and the emissions from our investments and financing activities by 90%-95% and neutralise the residual emissions. By externally validating our targets via the Science Based Target initiative (SBTi), we take action to mitigate impact and reduce risks.
Since 2015 we have been monitoring our impact on climate change on all our financing activities with the aim at reducing our negative impact. We started with the Climate-neutral balance sheet and now ASN Bank's investment policy and decision-making are aligned with the net zero by 2050 KPI. To identify and assess our climate impacts, we measure, report and set targets for our emissions, aligned with our ESG transition plan.
Net zero KPI
The net zero KPI covers all relevant scope 1, 2 and 3 emissions within our organisational boundaries (own operations, upstream and downstream activities, but excludes our subsidiaries) and does not include greenhouse gas removals. As we do not expect to be able to completely reduce all emissions to zero by 2050, we finance nature-based carbon removal projects, that neutralise our residual emissions. By aligning our business operations and investments with the net zero KPI, we contribute to mitigating our negative impact on the environment.
We have validated Science Based Targets (SBTs) for the emissions of our own operations related to scope 1 and 2 and we have scope 3 category 15 targets for the most relevant loans and investments. This covers 35% of our GHG inventory. For scope 3 category 1 to 14 we do not have validated targets. The SBTs express which emissions we need to reduce and the required rate to align with the 1.5°C Paris Agreement scenario; see table 'Validated Science Based Targets'. The SBTs contribute to the near-term target, to ensure sufficient progress to stay on track for our net zero KPI and to align our activities with the Paris Agreement. For 2050 we do not have validated targets by the SBTi.
The scope 1 and 2 SBT is aimed at our own operations, where we have direct influence on our car fleet, our energy consumption and our renewable energy contracts, see Section Gross Scope 1, 2, 3 and total GHG emissions. We have three SBTs for our scope 3 emissions relating to our investments. The first scope 3 target supports our ambition to contribute positively to climate change mitigation by contributing to the energy transition. The second scope 3 target pertains to the reduction of our mortgage portfolio’s emissions. The third commitment reflects our ambition to have a corporate bond portfolio where our counterparties have set SBTi validated targets themselves. The objective is to increase our positive impact by means of motivating our business partners to commit to reduction targets in line with the 1.5°C scenario, which in turn leads to a reduction of the emissions from our portfolio.
The target for the mortgage portfolio is determined with a sectoral decarbonisation approach using the net zero emissions 2050 scenario from the International Energy Agency (2021) as a benchmark. This target is expressed as an intensity metric (kgCO2e /m2) and is obtained by dividing the total emissions of the mortgage portfolio by the total floor area.
Base year 2020 value | 2024 value | 2025 value | 2030 target value | % scope/category emissions | % of total emissions | |
|---|---|---|---|---|---|---|
Scope 1 and 2 target: ASN Bank commits to reduce absolute scope 1 and 2 GHG emissions with 45% by 2030 compared to the base year 2020 | ||||||
Absolute | 582.4 tCO2e1 | 498.0 tCO2e1 | 322.1 tCO2e | 320.3 tCO2e1 | 100% | 0.02% |
% | 0% | -14% | -45% | -45% | ||
Scope 3 target: ASN Bank commits to continue financing only renewable electricity | ||||||
% | 100% | 100% | 100% | 100% | n.a. | n.a. |
Scope 3 target: ASN Bank commits to reduce its mortgage portfolio GHG emissions with 59% per square metre, by 2030 compared to the base year 2020 | ||||||
Absolute | 34.4 kgCO2e/m2 | 20.5 kgCO2e/m2 | 20.1 kgCO2e/m2 | 14.1 kgCO2e/m2 | 36% | 35% |
% | 0% | -40% | -41% | -59% | ||
Scope 3 target: ASN Bank commits to 29% of its corporate bond portfolio by total value held, have set SBTi validated targets by 2025, and 53% by 2030. | ||||||
% | 5% | 39% | 55% | 53% | n.a. | n.a. |
- Comparative figures updates to align methodology, scope and emissions factors with current reporting year, related to franchises.
In the table ‘Financed emission per asset class’ an overview is provided of the financed emissions. The table excludes non-financial assets, cash and cash balances at central banks, derivatives and short-term exposures. The emissions of government bonds are not included in the net zero KPI as they fall outside the scope of our validated SBTs. No changes were made to targets and corresponding metrics of the underlying measurement methodologies.
We continuously measure our impact on climate change and we monitor the progress of our portfolio targets on a monthly basis and discuss the progress on a quarterly basis in the ESG Impact Committee (ESG IC), which includes internal stakeholders, like the Marketing & Proposition and Lending.
To monitor the negative impact of our offices and our vehicle fleet, we have set a medium-term target (2030) and a long-term target (2050). If interim targets are not achieved, a proposal for adjustment is drawn up in consultation with internal stakeholders. The proposal is sent to the ESG IC for decision-making.
We periodically reassess our investments to determine whether they are still appropriate and comply with our sustainability policies. See Section Sustainability policies for more insights in our sustainability criteria and how we engage with our business partners.
2025 - Financed emissions (Scope 3, category 15)1 | 2024 - Financed emissions (Scope 3, category 15)2 | |||||||||||||||||
|---|---|---|---|---|---|---|---|---|---|---|---|---|---|---|---|---|---|---|
Asset class | in € millions | Scope 1 emissions (tCO2e) | Scope 2 emissions (tCO2e) | Scope 3 emissions (tCO2e) | Total emissions (tCO2e) | Of which biogenic emissions | Emission removals (tCO2e) | GHG intensity (tCO2e/ M€) | Data quality score | in € millions | Scope 1 emissions (tCO2e) | Scope 2 emissions (tCO2e) | Scope 3 emissions (tCO2e) | Total emissions (tCO2e) | Of which biogenic emissions | Emission removals (tCO2e) | GHG intensity (tCO2e/ M€) | Data quality score |
Business loans | 275 | 6,324 | 2,092 | 6,098 | 14,514 | - | - | 53 | 4 | 341 | 9,231 | 3,599 | 7,125 | 19,955 | - | - | 58 | 4 |
Unlisted equity | 16 | 2 | 2 | 179 | 183 | - | - | 11 | 3 | 16 | 1 | 2 | 95 | 98 | - | - | 6 | 3 |
Listed equity | 0 | 0 | 0 | 0 | 0 | - | - | 731 | 2 | 0 | 0 | 0 | 0 | 0 | - | - | 660 | 2 |
Corporate bonds3 | 4,624 | 24,748 | 11,194 | 188,502 | 224,445 | - | - | 49 | 3 | 4,408 | 31,196 | 16,319 | 199,724 | 247,240 | - | - | 56 | 3 |
Government bonds4 | 2,282 | 276,215 | 5,972 | 265,741 | 547,927 | - | - | 240 | 2 | 2,866 | 412,113 | 10,268 | 335,643 | 758,024 | - | - | 264 | 2 |
Retail mortgages | 57,280 | 326,357 | 112,083 | - | 438,440 | - | - | 8 | 3 | 52,571 | 322,974 | 118,324 | - | 441,298 | - | - | 8 | 2 |
Business mortgages | 1,452 | 31,293 | 8,217 | - | 39,510 | - | - | 27 | 5 | 1,388 | 35,380 | 9,421 | - | 44,801 | - | - | 32 | 5 |
Project finance | 1,150 | 81,055 | - | - | 81,055 | 7100 | -15,097 | 70 | 3 | 1,262 | 86,065 | - | - | 86,065 | 3,555 | - | 68 | 3 |
Total | 67,079 | 745,994 | 139,560 | 460,520 | 1,346,074 | 7,100 | -15,097 | 20 | 3 | 62,852 | 896,960 | 157,934 | 542,588 | 1,597,482 | 3,555 | - | 25 | 2 |
- The reported assets (67,079 EUR millions) in this table do not fully reconcile with the reported value of assets in the financial statements (76,664 EUR millions). This is due to the exclusion of certain asset classes, e.g. non-financial assets, derivatives and cash and balances at central banks and a different calculation methodology in accordance with PCAF 2022.
- The reported assets (62,852 EUR millions) in this table do not fully reconcile with the reported value of assets in the financial statements (73,680 EUR millions). This is due to the exclusion of certain asset classes, e.g. non-financial assets, derivatives and cash and balances at central banks and a different calculation methodology in accordance with PCAF 2022.
- Money markets with current year value of 8,956 EUR million (prior year 9,328 EUR million) are out of scope of the net zero KPI due to the short-term nature of the funds and are therefore not seen as causing changes in the real economy.
- The emissions of government bonds are not included in the net zero KPI.
To reach our scope 1 and 2 target, we aim to reduce our energy use in our own operations or to increase our share of renewable energy in our energy consumption. We do this by procuring green energy for entities of which we have operational control.
Since branches are now independent franchises, their energy use is no longer included in our energy mix. We have therefore restated the 2024 energy use figure in the table 'Energy consumption and mix'. With the adjusted 2024 figures, the total energy consumption increased by 7%. This is the result of reopening our offices on Friday. The share of renewable energy was stable.
20241 | 2025 | Δ | |
|---|---|---|---|
Total fossil energy consumption (MWh) | 2,7092 | 2,918 | 8% |
Share of fossil sources in total energy consumption (%) | 39% | 40% | 1% |
Consumption from nuclear sources (MWh) | - | - | - |
Fuel consumption for renewable sources, including biomass3 | - | - | - |
Consumption of purchased or acquired energy (MWh)4 | 4,186 | 4,430 | 6% |
The consumption of self-generated non-fuel renewable energy (MWh) | - | - | - |
Total renewable energy consumption (MWh) | 4,186 | 4,430 | 6% |
Share of renewable sources in total energy consumption (%) | 61% | 60% | -1% |
Total energy consumption (MWh) | 6,895 | 7,348 | 7% |
- Comparative figures updates to align methodology, scope and emissions factors with current reporting year, related to franchises.
- For 2024 we disclose 188 MWh less compared to reporting year 2024. This figure includes actual energy use, whereas figure from previous reporting year reported estimated energy use.
- Biomass also includes industrial and municipal waste of biologic origin, biogas, renewable hydrogen
- Energy from electricity, heat, steam, and cooling from renewable sources.
The emissions from scope 1, scope 2 and the relevant scope 3 categories are calculated in accordance with the Greenhouse Gas Protocol ‘Corporate Value Chain Standard’, following the financial control approach to determine which categories and activities are relevant to ASN Bank. In our GHG accounting and reporting, we follow the principles of relevance, completeness, consistency, transparency and accuracy.
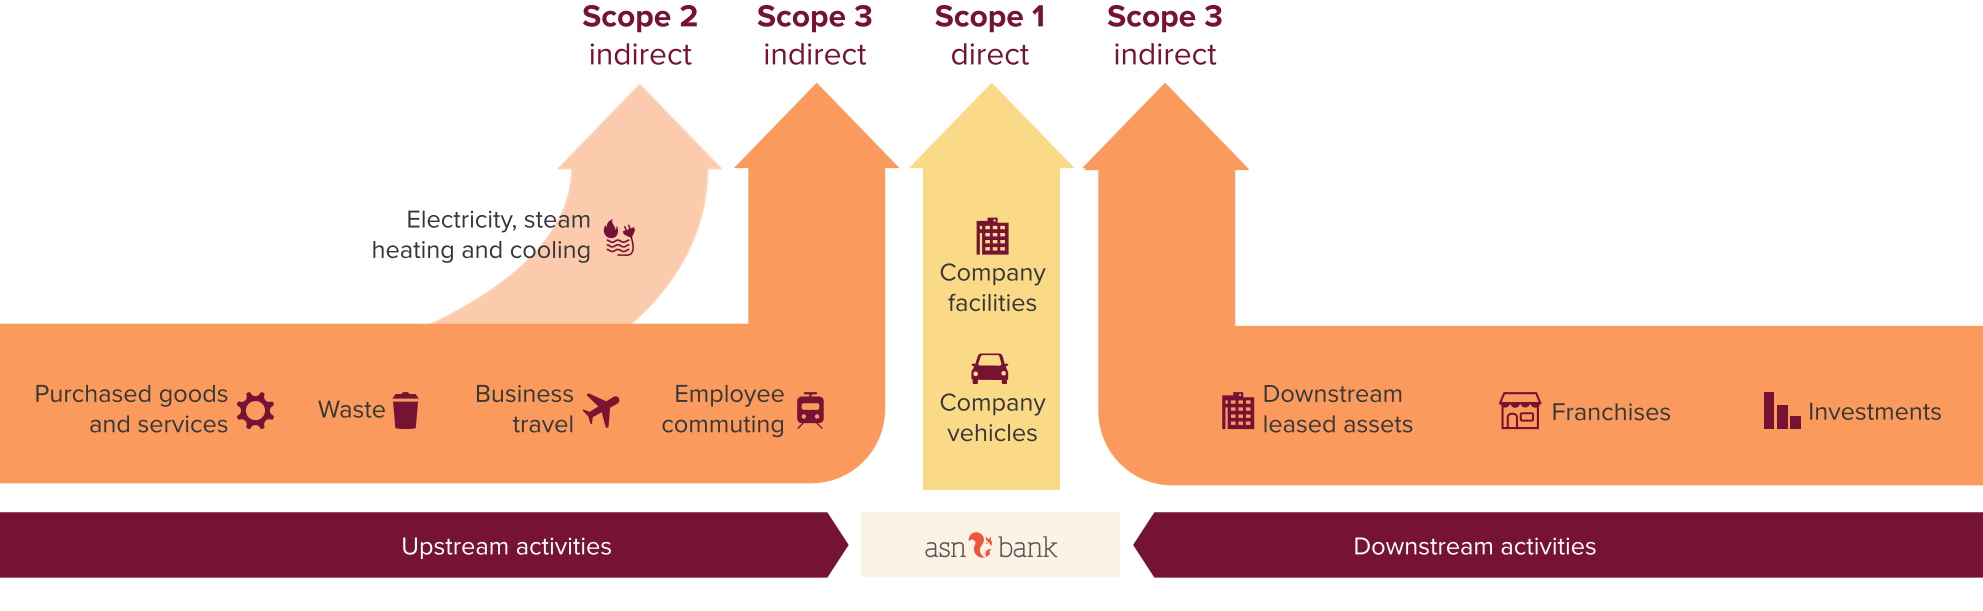
We included emissions within our organisational boundaries covering our business operations, upstream and downstream activities, except the investment funds of ASN Impact Investors. We apply recognised standards and protocols to measure and report company-wide GHG emissions using an additive approach under operational and financial control. The reporting boundary aligns with the financial reporting boundary, as the group does not exercise operational control over non-consolidated investees. Emissions caused upstream or downstream in our value chain are reported in scope 3 if the emission data is considered sufficiently reliable, influenceable, significant and quantifiable.
Compared to the previous reporting year we included the scope 3 category 14: Franchise emissions. With the transformation independent franchises are now central in our distribution model and data is available and of sufficient quality to make a representative calculation. In previous years, we had included the emissions of 45 shops in our scope 1 and 2. In addition, this is the first year we disclose cloud computing and data centre services separately. To ensure comparability over time, we have calculated the emissions for 2023 and 2024.
Despite the increase in energy use, the emissions in scope 1 and 2 decreased due to lower emission factors. Emissions in category 1: Purchased goods and services have increased significantly. This is partly because some of our suppliers, adhering to reporting guidelines and regulations such as the CSRD, now disclose a broader range of emission categories (related to scope 3). As a result, their reported emissions intensity has risen, which in turn elevates the emission factors we use in our calculations. In all other scope 3 categories the emissions reduced. 98% of our GHG emissions are from category 15: Investments. In table 'Financed emissions per asset class', a breakdown per asset class is provided. In comparison to reporting year 2024, our total emissions decreased by 14%.
Unit | 2023 | 2024 | 2025 | ∆ year to year | 2030 target | 2050 target | |
|---|---|---|---|---|---|---|---|
Gross scope 1 GHG emissions | |||||||
Scope 1 GHG emissions | tonnes | 3221 | 2202 | 142 | -35% | SBTs3 | In scope |
Gross scope 2 GHG emissions | |||||||
Location-based scope 2 GHG emissions | tonnes | 1,8894 | 1,5645 | 1,508 | -4% | n.a. | n.a. |
Market-based scope 2 GHG emissions | tonnes | 2616 | 2787 | 180 | -35% | SBTs3 | In scope |
Gross scope 3 GHG emissions | |||||||
Total scope 3 GHG emissions | tonnes | - | 1,604,921 | 1,376,306 | -14% | n.a. | n.a. |
1. Purchased goods and services | tonnes | 3,477 | 2,829 | 26,574 | 839% | n.a. | n.a. |
of which cloud computing and data centre services | tonnes | 476 | 540 | 489 | -9% | n.a. | n.a. |
5. Waste generated in own operations | tonnes | 49 | 42 | 15 | -64% | n.a. | n.a. |
6. Business travel | tonnes | 530 | 477 | 311 | -35% | n.a. | n.a. |
7. Employee commuting | tonnes | 649 | 761 | 666 | -12% | n.a. | n.a. |
13. Downstream leased assets | tonnes | 38 | 74 | 30 | -59% | n.a. | n.a. |
14. Franchises | tonnes | 3,532 | 3,256 | 2,636 | -19% | n.a. | n.a. |
15. Investments8 | tonnes | - | 1,597,483 | 1,346,074 | -16% | SBTs9 | In scope |
of which biogenic CO2e emissions from biomass projects | tonnes | 4,412 | 3,555 | 7,100 | 100% | n.a. | n.a. |
Total gross GHG emissions | |||||||
Total GHG emissions location-based | tonnes | n.a. | 1,607,211 | 1,377,956 | -14% | n.a. | n.a. |
Total GHG emissions market-based | tonnes | n.a. | 1,605,926 | 1,376,628 | -14% | n.a. | n.a. |
- Revision related to the change of branch offices and shops to franchises with an impact of -49 tCO2eq.
- Revision related to the change of branch offices and shops to franchises, with an impact of -27 tCO2eq.
- The target is validated by SBTi and combines scope 1 and 2 GHG emissions.
- Revision related to the change of branch offices and shops to franchises, with an impact of -390 tCO2eq.
- Revision related to the change of branch offices and shops to franchises, with an impact of -334 tCO2eq. And a revision of -17 tCO2eq. related to data quality improvement from estimated to actual energy consumption data.
- Revision related to the change of branch offices and shops to franchises, with an impact of -101 tCO2eq.
- Revision related to the change of branch offices and shops to franchises, with an impact of -89 tCO2eq. And a revision of -24 tCO2eq. related to data quality improvement from estimated to actual energy consumption data.
- The emissions do not include the scope 3 emissions from our asset manager.
- For category 15 we have a SBTi validated reduction target for our mortgage portfolio.
Due to timing issues and methodological differences, and ambiguity within the financial sector about the obligatory nature of including the financed emissions of asset managers, ASN Bank does not consolidate scope 3 GHG emission information from the asset management activities of ASN Impact Investors. In 2026, ASN Bank is taking steps to further analyse and solve the issues regarding timing and methodology. In anticipation of more guidance on this topic, ASN Bank may reconsider the need to include this information in the sustainability statements.
Metrics
In the Appendix Methodology own operations and upstream and downstream emissions and in Appendix Methodology financed emissions, we disclose assumptions, limitations and approximations, our control approach, emission factors, use of primary data and our application of the GHG protocol and PCAF. We also explain why we exclude certain scope 3 categories.
To reach our net zero KPI we have to neutralise 100% of the residual emission by 2050. We do this by financing nature-based CO2e removal projects. We consider the supply chain of these projects and consider direct and indirect land use, the use of raw materials, social consequences and the impact on the environment and biodiversity. Nature-based removal projects are effective and benefit both climate and biodiversity.
We offset the market-based CO2e emissions by purchasing carbon credits from Trees for All. For 2024, we offset 1,991 tonnes of CO2e emissions, in 2025 we offset 1,345 tonnes of CO2e emissions. The carbon credits are verified by Plan Vivo. Furthermore, the offsets for reporting year 2025 will be cancelled after one year, when we buy carbon credits for reporting year 2026. Finally, the projects which we buy into are monitored by Trees for All for 10 years to manage non-performance.
Part of the CO2e-emissions of ASN Bank were offset using carbon credits. In 2025, and previously in 2024:
ASN Bank purchased 0% carbon credits related to reduction projects
100% of the carbon credits were related to removal projects, derived from projects related to biogenic sinks
100% of the carbon credits have a Plan Vivo certification
0% of the carbon credits have been issued by projects within the European Union
0% of the carbon credits qualifies as a corresponding adjustment under Article. 6 of the Paris Agreement.
EU Taxonomy
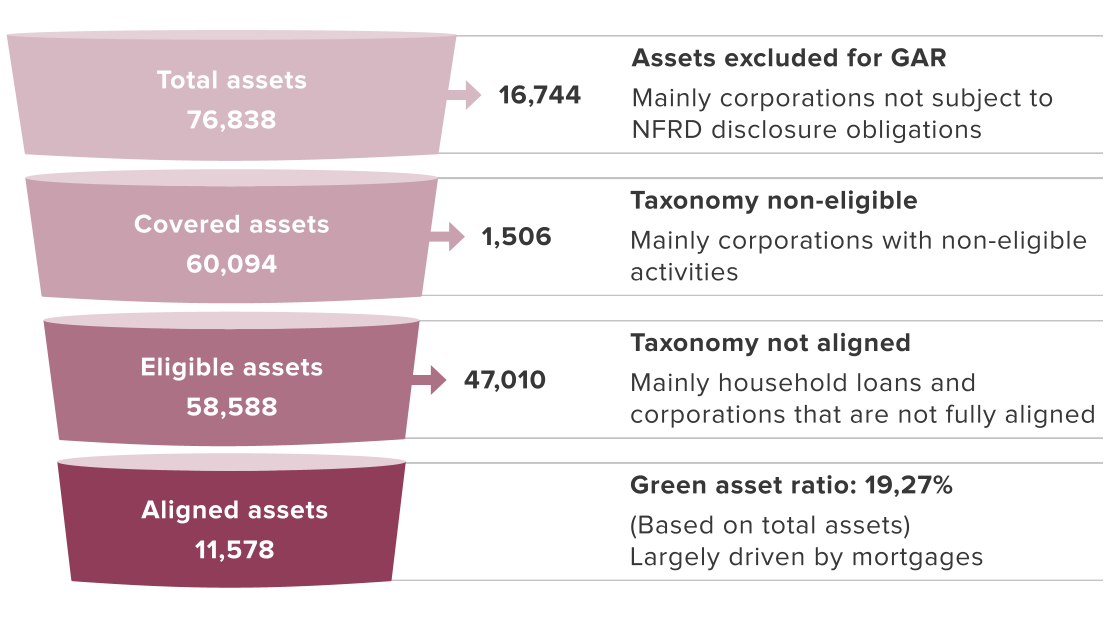
The EU Taxonomy Regulation requires ASN Bank to include information at entity and product level with regard to certain financial products. The information has to outline whether or not ASN Bank takes into account adverse sustainability impact, whether or not it promotes environmental or social characteristics and whether or not it meets one or more of the environmental objectives as set out in the EU Taxonomy Regulation.
Taxonomy eligible determines if an economic activity we finance is in scope of the EU Taxonomy Regulation, in other words, if it is potentially environmentally sustainable. Taxonomy aligned means that the economic activity we finance meets the requirements and is actually environmentally sustainable according to the EU Taxonomy Regulation.
The regulation comprises the following six environmental objectives:
Climate change mitigation (CCM);
Climate change adaptation (CCA);
Sustainable use and protection of water and marine resources (WTR);
Transition to a circular economy (CE);
Pollution prevention and control (PPC);
Protection and restoration of biodiversity and ecosystems (BIO).
Simplified EU Taxonomy disclosure rules, which were proposed by the European Commission as part of the ‘Omnibus I’ package in 2025, apply to this reporting period and are used by ASN Bank. Simplification measures mainly relate to the reporting templates, materiality thresholds for assessing eligibility and alignment, and the calculation method of the Green Asset Ratio (GAR).
The EU Taxonomy tables, which can be found in the appendix to this sustainability statement in the Section EU Taxonomy tables, are based on the exposures of ASN Bank within the prudential scope of consolidation, which is the same scope that we use for this Annual Report (AR). We report on the new simplified templates and recalculated the GAR. The denominator of the GAR is amended to exclude exposures that could never be aligned with the EU Taxonomy. Exposures to, for example, SMEs, NFCs and non-EU counterparties not subject to CSRD disclosure obligations and derivatives are now removed from the denominator. Exposures to central governments, central banks, supranational issuers and the trading book were already excluded from the denominator. Because of the amendments, the denominator decreased and hence the GAR improved.
We assess whether our counterparties are required to publish non-financial information pursuant to Article 19a or 29a of Directive 2013/34/EU (CSRD) on the basis of internally or publicly available information. EU Taxonomy eligible and alignment exposure to non-financial corporations subject to CSRD only relate to debt securities.
We determined the Taxonomy eligibility and alignment of our financial and non-financial counterparties using the published percentages in their annual reports or sustainability reports for 2024. We were unable to obtain information in a very limited number of cases, which we then assessed as non-eligible and not aligned. Environmentally sustainable bonds are included up to the value of Taxonomy eligible and aligned economic activities financed by the proceeds of those bonds based on information provided by the counterparty. Non-EU counterparties are included in the assessment of bonds with known use of proceeds.
To assess Special Purpose Vehicles (SPVs), we use a look-through approach on a best-effort basis. This implies that if an CSRD counterparty has control over the SPV, we used the eligibility and alignment of the CSRD counterparty.
All our retail mortgages collateralised by residential immovable property are eligible and form the largest part of the Taxonomy eligibility and alignment percentage.
We have chosen to apply the materiality threshold for building renovation loans and motor vehicle loans. For these exposures, we lack the necessary data related to the technical screening criteria that are dictated by the EU Taxonomy Regulation. These exposures have a cumulative value well below 10% of all on-balance sheet assets of which the use of proceeds is known. These loans relate to the following economic activities:
Renovation of existing buildings (CCM 7.2).
Installation, maintenance and repair of energy efficient equipment (CCM 7.3).
Installation, maintenance and repair of renewable energy technologies (CCM 7.6).
Transport by motorbikes, passenger cars and light commercial vehicles (CCM 6.5). This activity is about the purchasing of electric and hybrid vehicles (in category M1, N1 or L) by our customers.
The KPIs have previously been prepared in accordance with the reporting requirements of the Disclosures Delegated Act that were applicable before the amendments introduced by the Omnibus Delegated Act. For the 2025 disclosures, the Omnibus amendments came into force and are applied by ASN Bank. As a result, the 2025 KPIs are considerably higher due to the exclusion of derivatives, cash and cash equivalents, on demand interbank loans, non-NFRD/CSRD exposures and other categories of assets, including goodwill and commodities in the denominators of these KPIs.
31-12-2024 | |||||||||||||
|---|---|---|---|---|---|---|---|---|---|---|---|---|---|
in € millions | Total environmentally sustainable assets (numerator) | Total GAR assets (denominator) | KPI reported 2024 | Omnibus adjustments denominator1 | Adjusted GAR denominator | Adjusted KPI 2024 | |||||||
Turnover-based | CapEx-based | Turnover-based | CapEx-based | Turnover-based | CapEx-based | Turnover-based | CapEx-based | Turnover-based | CapEx-based | Turnover-based | CapEx-based | ||
Main KPI | GAR stock | 9,470 | 9,484 | 65,066 | 65,066 | 14.55% | 14.58% | -9,807 | -9,807 | 55,259 | 55,259 | 17.14% | 17.16% |
GAR flow | 1,706 | 1,720 | 14,611 | 14,611 | 11.68% | 11.77% | -5,574 | -5,574 | 9,037 | 9,037 | 18.88% | 19.03% | |
AuM | 52 | 51 | 3,684 | 3,684 | 1.42% | 1.41% | -2,883 | -2,883 | 801 | 801 | 6.55% | 6.38% | |
- Derivatives, cash and cash equivalents, on demand interbank loans, non-NFRD exposures and other categories of assets, including goodwill and commodities
31-12-2025 | ||||||||
|---|---|---|---|---|---|---|---|---|
Total exposure to Taxonomy-aligned activities | KPI (%)1 | KPI (%)2 | % coverage (over total assets) (%) | non assessed exposures (% of covered assets) (%) | ||||
Turnover-based | CapEx-based | Turnover-based | CapEx-based | Turnover-based | CapEx-based | |||
Main KPI | Green asset ratio (GAR) stock | 11,578 | 11,595 | 19.27% | 19.29% | 78.21% | 0.07% | 0.07% |
Total exposure to Taxonomy-aligned activities | KPI (%)1 | KPI (%)2 | % coverage (over total assets) | non assessed exposures (% of covered assets) (%) | non assessed exposures (% of covered assets) (%) | |||
Turnover-based | CapEx-based | Turnover-based | CapEx-based | Turnover-based | CapEx-based | |||
Additional KPIs | GAR (flow) | 2,298 | 2,297 | 22.08% | 22.07% | 59.15% | 0.24% | 0.24% |
Financial guarantees | ||||||||
Assets under management | 92 | 90 | 11.38% | 11.16% | 21.00% | 0.00% | 0.00% | |
- Based on the Turnover KPI of the counterparty
- Based on the CapEx KPI of the counterparty
31-12-2024 | ||||||||
|---|---|---|---|---|---|---|---|---|
Total exposure to Taxonomy-aligned activities | KPI (%)1 | KPI (%)2 | % coverage (over total assets) (%) | non assessed exposures (% of covered assets) (%) | ||||
Turnover-based | CapEx-based | Turnover-based | CapEx-based | Turnover-based | CapEx-based | |||
Main KPI | Green asset ratio (GAR) stock | 9,470 | 9,485 | 17.14% | 17.16% | 74.74% | n.a. | n.a. |
Total exposure to Taxonomy-aligned activities | KPI (%)1 | KPI (%)2 | % coverage (over total assets) | non assessed exposures (% of covered assets) (%) | non assessed exposures (% of covered assets) (%) | |||
Turnover-based | CapEx-based | Turnover-based | CapEx-based | Turnover-based | CapEx-based | |||
Additional KPIs | GAR (flow) | 1,706 | 1,720 | 12.00% | 11.77% | 75.26% | n.a. | n.a. |
Financial guarantees | ||||||||
Assets under management | 52 | 51 | 6.55% | 6.38% | 19.00% | n.a. | n.a. | |
- Based on the Turnover KPI of the counterparty
- Based on the CapEx KPI of the counterparty
We have assessed all six environmental objectives for EU Taxonomy alignment across several portfolios and identified where alignment occurs, which we will explain further.
For this category, we use the counterparties’ annual reports and their impact and allocation reports when it concerns green bonds for the respective EU Taxonomy information.
For this category, we use the counterparties’ annual reports and their impact and allocation reports when it concerns green bonds for the respective EU Taxonomy information.
Our loans collateralised by residential immovable property are related to the CCM activity 7.7: acquisition and ownership of buildings. We have assessed the loans collateralised by residential immovable property to the respective technical screening criteria as dictated by the EU Taxonomy Regulation. For the interpretation thereof, ASN Bank is also a member of the Energy Efficient Mortgages (EEM) NL Hub. This is a (financial) sector initiative that published the Dutch Energy Efficient Mortgage Framework (DEEMF), describing in detail the application of the EU Taxonomy to the Dutch residential mortgage market and its limitations. In short, the technical screening criteria for activity 7.7 are as follow:
Buildings built before 2021 should have an Energy Performance Certificate (EPC) class A or should fall within the top 15% of the national or regional building stock for residential buildings expressed as operational Primary Energy Demand (PED). To obtain information on the EPCs, we make use of the EP-online database of the Dutch Government. To define the top 15% most energy efficient residential buildings in the Netherlands, we selected a cut-off year of 2006, using a publicly available source.
For buildings built after 2021, the PED needs to be at least 10% lower than the threshold set for nearly zero-energy building (NZEB) requirements.
The DNSH adaptation criteria dictate that we should perform a climate and vulnerability assessment. As this is a real estate-related activity, we use the location of the collateral for an internal risk assessment. ASN Bank considers pole rot, soil subsidence and flooding as relevant physical climate hazards for the real estate in the Netherlands that we finance. We plotted the collateral to the following relevant maps and thresholds in the Climate Impact Atlas (Klimaateffectatlas):
pole rot with the low 2050 scenario and a high or very high-risk threshold.
soil subsidence with the low 2050 scenario and a high or very-high risk threshold.
≥50 cm flood with the low 2050 scenario and a probability of 1/300 and higher.
In the event of a material physical climate risk, we take a conservative approach and do not consider the respective exposure to be Taxonomy aligned. In principle, if our customers plan and implement adaptation solutions within five years, it would mitigate the relevant risk, in which case the respective exposure may be considered as Taxonomy aligned. However, at this stage we are not able to track the plans and implementation of adaptation solutions.
Q&A number 37 of the Commission Notice of November 2024, refers to MS for households. The relevant Delegated Act requires compliance with MS only for undertakings. As households do not qualify as undertakings and are not considered to carry out an economic activity, we conclude that this FAQ is not applicable for loans collateralised by residential immovable property.
As we were unable to fulfil all technical screening criteria dictated by the EU Taxonomy Regulation due to insufficient data availability and quality, it should be noted that we were unable to establish Taxonomy alignment for the following economic activities in our household portfolio:
Construction of new buildings (CCM 7.1).
For this category, funds containing listed equity and/or green bonds are relevant. For listed equity subject to CSRD, we use MSCI data on reported EU Taxonomy alignment which in turn are based on annual reports of the listed undertakings. Where data is missing or inaccurate in MSCI, we use the annual reports directly. For the green bonds, we use the counterparties impact and allocation reports.
ASN Bank does not have financial guarantees exposures, therefore the KPI and related rows in the EU taxonomy tables have been left empty.
The demand for more sustainable financial products and investments is slowly rising and is expected to further grow in the upcoming years. This will lead to more exposures which will be eligible and/or aligned under the EU Taxonomy. The information and data available of our counterparties and, for example, on physical climate risks is also expected to improve. These developments may have an impact on our reported EU Taxonomy figures.
Our GAR KPIs based on Turnover improved from 17.14% in 2024 to 19.21% in 2025. This is mainly because the total exposures of our household portfolio of which loans collateralised by residential immovable property increased. This increase included relatively more EU taxonomy-aligned residential immovable property.
ASN Bank invests in EU Taxonomy aligned activities in the following portfolios:
Household portfolio of which loans collateralised by residential immovable property.
Financial corporation subject to CSRD disclosure obligations and, for bonds with known use of proceeds, CSRD and non-CSRD financial corporations.
Non-financial corporations subject to CSRD and, for bonds with known use of proceeds, CSRD and non-CSRD counterparties.
Regarding future investments, we expect the EU Taxonomy Regulation KPI scores to improve while progressing on our net zero goal, Science Based Targets, Climate Action Plan goals and by pursuing our sustainability policies. We will continue to engage with retail mortgage customers to encourage them to make their homes more sustainable.
ASN Bank has expanded the Product Approval Process framework and Product Review Process framework to include ESG questions, such as: does the product or service actively contribute to the realisation of one of the bank's non-financial objectives (e.g. our net zero target) and is it in line with the principles of our sustainability policy.
Information on ASN Bank’s sustainability policies can be found in the Section Sustainability policies. These policies can be considered to be our own taxonomy as they describe our DNSH criteria and MS in detail. They also provide guidance on the type of activities that could have a positive impact on the climate, biodiversity or human rights.
Social information
Own workforce
With the transformation of ASN Bank and the launch of our new organisational structure, employee health and wellbeing remained our priority in 2025. The transformation presented both challenges and opportunities as we aligned our workforce capabilities with our strategic objectives. Throughout this period of change, we maintained our focus on supporting our people through our employment practices, dedicated resources, and enhanced development opportunities.
We identified multiple IROs, including but not limited to:
ASN Bank's strategic transformation aimed to improve efficiency and adaptability to regulatory, technological, economic and customer requirements. The resulting restructuring and employee outflow inevitably created challenges for our workforce in 2025.
ASN Bank positively impacts employees through our Collective Labour Agreement (CLA), vitality offerings and training and development opportunities. Our working environment promotes equal treatment and opportunities for all, which enables us to attract and retain entrepreneurial professionals who effectively deliver on our strategy.
We enable our employees to perform to their full potential by helping them maintain or strengthen their mental, social, physical and financial health.
The transformation and restructuring processes, along with the associated employee outflow, resulted in a material negative effect on our workforce during 2025
Our main policies and actions for our employees are:
Collective Labour Agreement (CLA);
Social Plan to support employees impacted by the transformation and restructuring;
Health and Safety management system including our "Vital & Healthy" platform
"My Performance" - new performance management process
Diversity, equity and inclusion (DEI) policy
Targets & metrics:
Employee engagement score: 7.6/10 (target: ≥8.0/10)
Gender balance: 40-60% male-female ratio across all management levels; and
Gender pay gap: ≤1.0%
ASN Bank’s own workforce falls within the scope of the materiality assessment of the bank’s impacts, risks and opportunities. Working conditions as well as equal treatment and opportunities for all have been assessed as material in relation to the own workforce. No specific subgroups were identified in the double materiality assessment. For the complete list of all our material IROs, please refer to the Section Double materiality assessment.
Impacts
ASN Bank positively impacts employees in various ways: by providing good working conditions such as those outlined in our CLA, vitality activities, and training and development offerings, and by providing a working environment where equal treatment and opportunities for all is promoted. We strive to prevent bias in our recruiting procedure and adhere to our DE&I policy, which positively impacts employees.
The transformation of ASN Bank was a strategic decision to become more efficient and to enhance our ability to adapt not only in response to regulatory requirements, but also to technological developments, shifting economic conditions and changing customer requirements. In the short term, the resulting restructuring and related outflow of staff inevitably led to a material negative impact on our employees in 2025 in terms of secure employment. This negative impact will continue in 2026 given the next phase of the transformation as part of ASN Bank's new strategy. The new strategy was announced on 13 November and builds on the foundations of our ongoing transformation. At the same time, we announced an additional FTE reduction by 850-950 FTEs positions until the end of 2026, partly by cutting external staff and not filling vacancies. For more information on the announced transformation and provisions, please see Sections Transformation programme (2025-2027) and Note 15 Provisions.
Risks
To deliver on our strategy, it is crucial that our workforce is aligned with organisational needs – meaning that we must ensure that we have the right number of staff, with the right mindset and skillset, to support ASN Bank’s strategy for the coming years. Given ASN Bank’s ongoing transformation, it was anticipated that these changes may impact the working environment and staff morale. The associated lack of clarity about roles and responsibilities and potential work-related stress could lead to higher absenteeism, lower productivity, resignation of key people, and insufficient inflow of capable staff.
Opportunities
Offering good working conditions and providing equal treatment and opportunities for all enables ASN Bank to attract and retain entrepreneurial professionals who effectively deliver on our strategy. We provide all employees with training and skills development opportunities for them to acquire, maintain and develop the right skills in alignment with the organisational needs. Furthermore, we encourage our employees to maintain or strengthen their mental, social, physical, and financial health, which enables them to perform to their full potential.
ASN Bank's approach to workforce management during the transformation creates substantial opportunities across these three critical dimensions that will drive long-term organisational success.
In this section, we describe the policies that we have in place related to our own workforce. Furthermore, we outline the actions that we have taken on material impacts on our own workforce, as well as the processes to remediate negative impacts and channels for own workers to raise concerns.
ASN Bank has allocated the following resources to the management of material impacts on our workforce: HR staff, all leads, members of the Works Council, an occupational health and safety service, and (internal and external) confidential counsellors. ASN Bank reaches out to its employees on a regular basis, for example through the Works Council and employee surveys, gathering feedback on own practices to ensure these practices do not cause or contribute to avoidable material negative impacts on our own workforce.
Policies related to own workforce
ASN Bank's business operations are based in the Netherlands and our employees are employed in the Netherlands. The following social factors or matters, amongst other things, exist within the Dutch jurisdiction:
Limits on renewing temporary contracts
Social protection
Limitations on overtime
Adequate wages (ASN Bank considers the legal minimum wage to be a suitable benchmark for adequate wages)
Social dialogue (ASN Bank complies with the legal requirement to have a Works Council)
Health and safety (including the Working Conditions Act)
Provision of family leave
Prohibition of child labour, forced or compulsory labour and trafficking in human beings
In addition to what is covered by Dutch law, ASN Bank has several policies in place to manage impacts on our workforce as well as the associated risks and opportunities related to working conditions and equal treatment and opportunities for all. The Executive Board is accountable for these policies, regarding which it consults with the Works Council and, where applicable, trade unions.
ASN Bank has several arrangements and frameworks in place with respect to employment conditions for our employees, i.e. a CLA, Staff Guide, Remuneration Policy, Social Plan, and Pension Scheme. Our working conditions apply to all employees with a permanent or temporary contract with ASN Bank.
Effective 1 January 2025, ASN Bank’s new CLA and Social Plan came into effect. These plans were established in agreement with the trade unions FNV Finance, CNV and De Unie and are valid for two and three years respectively, to offer employees clarity and security for a longer period. The new Social Plan is largely similar to the previous Social Plan (2024). The new CLA includes arrangements on wages, work-life balance, and learning and development opportunities. To comply with the Future Pensions Act (Wet Toekomst Pensioenen) ASN Bank has an agreement on a new pension scheme with the aforementioned trade unions, which is expected to come into effect on 1 January 2027. Employees of ASN Bank receive a Personal Choice Budget (Individueel Keuzebudget - IKB). Each year, ASN Bank decides whether, and if so which, tax-friendly goals the IKB may be used for, in addition to the standard allocation purposes. In 2025, employees were allowed to use their IKB to repay student loans.
During the first months of 2025, the previously submitted framework request for advice was further refined. Based on these details, employees received further information about the new organisational structure and potential impacts and consequences. On 1 July 2025, the new organisation was launched. Our Social Plan supports employees who are impacted by the restructuring by offering facilities to increase their employability. It also provides timely support to employees who become redundant. These employees are admitted to our Mobility Centre and for a period of six months receive redundancy payment and coaching to help them find new work. During this period, they are exempt from work, to enable them to fully focus on finding another job outside (or occasionally inside) ASN Bank.
In our ‘Vision on Work’ policy we describe how we help employees perform their work to the best of their ability, regardless of their place of work. Employees can partially decide when and where they work, unless the work is location-bound. They receive a budget for setting up their home office and a monthly allowance for working from home.
Our Code of Conduct helps create a psychologically safe working environment, by articulating how we treat each other and our customers. We promote a culture of accountability, meaning that we hold each other responsible for our actions and behaviour. To ensure that our workforce exemplifies respectful, honest and professional behaviour, we screen all internal employees and external (non-)employees prior to and during their employment in line with the Financial Supervision Act (Wet op het financieel toezicht - Wft). Our pre-and in-employment screening process was updated in 2025 and now involves security screenings in additional registers. Furthermore, we have decided to integrate the screening process for our non-employees into our internal screening process to ensure consistency among our workforce. Once new hires have officially joined ASN Bank, they are required to take the Banker’s Oath for employees of Dutch financial institutions, which provides important guidelines for appropriate professional behaviour. By taking the oath, ASN Bank’s internal employees and external (non-)employees officially declare and promise that they will perform their duties ethically and with care, put customers’ interest first and adhere to disciplinary law.
ASN Bank has a Health and Safety management system in place which encourages proactive risk management and consists of several policies.
Our Health and Safety Policy is based on well-being as a core principle, aiming to create a culture of shared responsibility for the health and well-being of our employees. ASN Bank strictly adheres to Dutch health and safety legislation. Our Company Emergency Response (Bedrijfshulpverlening – BHV) policy and organisation helps to ensure immediate response capabilities for workplace incidents.
In line with our Safe Customer Contact policy (Veilig Klantcontact), we take measures to reduce safety risks and to protect and support colleagues who might be harmed by violence or aggression while working, especially in branches and contact centres.
To lower absenteeism, which continued to be above the desired level in 2025, ASN Bank actively promotes vitality across the organisation. ASN Bank's vitality programme covers multiple dimensions of employee health through workshops, (vitality) coaching services, company counsellors, and the Financial Health for Employees programme. Our internal platform Vital & Healthy (Vitaal & Gezond) provides access to resources covering mental health, physical health, social health, and financial health, enabling employees to access support. Furthermore, our CLA includes arrangements to safeguard our employees’ work-life balance. As part of the Financial Health programme, employees were able to conduct a financial health check and attend workshops to strengthen their financial health.
We recognise that our organisational transformation may impact employee wellbeing and lead to elevated absenteeism. Therefore, ASN Bank has proactively introduced additional support measures and will continue to highlight these throughout the transformation. These measures include expanded access to vitality coaching and company counselling services specifically designed to help employees cope with transformation-related stress and physical or mental symptoms. Furthermore, all managers were trained to recognise the needs of their team members and to support them throughout the transformation.
In line with our transformation and new organisation, ASN Bank introduced a new employer brand called 'Shape Tommorrow. Start Today' (Maak je sterk voor morgen. Start vandaag). This campaign showcases how our transformation becomes reality, demonstrating that our vision translates into tangible results. Rooted in our brand promise ‘Good for you. Good for the future' (Goed voor jou. Goed voor de toekomst) and our aligned Employee Value Proposition (Empower yourself for the future), the new employer brand sets us apart in competing for top talent.
Achieving a proportional gender distribution across all job grades remains a point that requires attention. Our commitment to preventing bias in our recruiting procedure helps with achieving this objective.
In line with our EVP Empower yourself for the future, ASN Bank recognises the importance of providing training and development opportunities for all employees. For that reason, we have structured learning and development processes in place. In addition to training and development offerings provided across the organisation, departmental and individual development budgets are allocated to all employees for training and coaching. Employees can use their individual development budget for external training offerings through our new procurement portal Bloomville. Furthermore, all employees have limitless access to training activities via Good Habits and LinkedIn Learning.
This section outlines several initiatives and targeted actions that took place in 2025 in line with our vision on learning and development.
In 2025, we initiated a mandatory banking masterclass for all employees, focusing on understanding banking operations, the importance of customer trust, and revenue generation. This initiative aimed to enhance knowledge and improve integrated collaboration across teams.
To ensure all employees and designated target groups maintain awareness and knowledge of AFC and Anti-Money Laundering and Anti-Terrorist Financing Act (Wet ter voorkoming van witwassen en financieren van terrorisme – Wwft) guidelines, we implemented new AFC training modules. Furthermore, e-learning modules on discrimination prevention were implemented across the organisation. In line with our Professional Competence (Vakbekwaamheid) policy, all employees with Wft obligations achieved recertification before 1 April 2025, ensuring compliance with applicable legislation in the financial sector.
Furthermore, all managers participated in 'ASN Values and Leadership' workshops, familiarising them with the new ASN Bank brand, organisational values, and their roles, while practicing storytelling techniques for their teams. Additionally, problem-solving training was provided to approximately 40 team leads, teaching analytical skills and solution development rather than escalating questions to management.
In 2025, we introduced our updated performance process My Performance. This process is available to all employees and ensures they are clear about what is expected of them at work. The process includes periodic conversations and evaluations between the employee and their manager regarding performance, well-being, and development. To help employees and managers prepare for goal setting and performance conversations, we deployed an AI-based online training platform. This tool provides unlimited access to safe learning environments where employees and managers can experiment with new approaches and behaviours while receiving avatar-based feedback.
To help new employees kickstart their career at ASN Bank, we launched our new onboarding programme A Strong Start (Sterk van Start). This programme introduces new hires to ASN Bank, their colleagues, and the role they will play within the organisation. Furthermore, the programme helps them understand how they can contribute to the growth of ASN Bank, and what this means for their own growth and development.
ASN Bank has committed to various third-party standards on human rights as described in our Human Rights policy, including the Universal Declaration of Human Rights, the OECD Guidelines for Multinational Enterprises, and the United Nations Guiding Principles for Business and Human Rights (UNGPs). Additionally, we are a signatory of the Dutch SER Diversity Charter. These external standards provide a framework for our internal policies and practices related to our own workforce. These policies are accessible to our own workforce via our intranet. Where applicable, these policies are available to external stakeholders via the ASN Bank website. For more information, see the Section Sustainability policies.
ASN Bank aims to ensure that all employees are treated equally and are given equal opportunities. To further solidify this commitment, we have a Diversity, Equity, and Inclusion policy in place which is currently under review to ensure alignment with ASN Bank’s new strategy. To promote social cohesion and to provide a support network within the organisation, employees could participate in the activities of the Staff Association, and colleagues under the age of 36 may participate in the activities of Young ASN (the network for employees up to 35 years old).
Furthermore, we pay extra attention to the following groups of people at ASN Bank: women, people who need extra support towards employment, people from different (bi)cultural backgrounds, and people who identify with the LGBTQIA+ community. Other grounds for discrimination, such as religion and political opinion, are implicitly covered by our Diversity, Equity, and Inclusion policy. ASN Bank has processes in place to ensure that discrimination is prevented, mitigated and acted upon once detected. More information can be found in the Section Processes to remediate negative impacts and channels for own workers to raise concerns.
At ASN Bank, our employees are the most closely involved stakeholder group of our organisation. For that reason, we practice continuous engagement with our employees at all levels of the organisation. Employees are regularly informed about relevant matters, including the transformation, via a variety of channels and sources, to ensure that these matters do not cause or contribute to avoidable material negative impacts on our own workforce.
The Works Council at ASN Bank plays an important role in the engagement with our employees. The Works Council, which represents 100% of our employees, exercises influence on important decisions that impact the organisation and its staff through its right of advice and consent. Depending on the topic, the Works Council is either informed, consulted, or asked for consent in a timely manner. Topics that require engagement include the Strategic Plan and KPIs, transformations, working conditions and management information on diversity, equity and inclusion. The Works Council and members of the Executive Board (and in some cases Supervisory Board) meet at least once every six weeks. Furthermore, the Works Council meets with the trade unions when relevant. Ultimate operational responsibility for ensuring engagement with the workforce or workers’ representatives lies with the Executive Board.
Throughout the transformation, the Works Council plays an important role in representing employees. The Works Council ensures that employees are adequately informed about upcoming changes and provides them with the opportunity to address concerns.
ASN Bank is committed to creating a safe working environment where everyone is treated fairly and with respect and in line with our Code of Conduct. However, situations of misconduct, complaints, or incidents might occur. In these instances, it is important that our workers feel safe to speak up and report their concerns when necessary.
At ASN Bank, we offer various channels to raise concerns or grievances. Workers who encounter misconduct or undesirable behaviour are encouraged to discuss this with, for example, their manager or an internal or external Confidential Counsellor. Alternatively, they can file a report through one of the available reporting channels, including the Incident Reporting Center (Meldpunt Incidenten). These channels are easily accessible to all workers via intranet or intranet and include the option to file an anonymous report via a Confidential Counsellor or our external professionally managed SpeakUp channel. Undesirable behaviour can be reported to the Unacceptable Behavior Committee. Furthermore, grievances and complaints related to employee matters can be submitted to the Complaints Desk or Works Council.
ASN Bank actively monitors issues that are raised and addressed and ensures that these are handled effectively. We have procedures in place for receiving and investigating reports, which are assessed every three years. ASN Bank actively informs workers about the existence of these procedures, for example during the onboarding of new workers and through periodic communication. The level of trust in these mechanisms is monitored via our regularly conducted integrity survey (most recently in January 2025).
Our grievance and complaints procedures ensure protection against retaliation for individuals who use these procedures and are in alignment with the Dutch Whistleblower Protection Act (Wet Bescherming Klokkenluiders, based on EU Directive 2019/1937). For more information, see the Section Business conduct.
ASN Bank has defined the following targets and metrics related to managing material negative impacts, advancing positive impacts, and managing material risks and opportunities. Most of the set targets are continuous, therefore they do not include a baseline or base year from which progress is measured. The Works Council is engaged in the process of setting targets during consultation meetings and is informed of the progress against targets on a quarterly basis. This enables the Works Council to bring up lessons learned or improvements regarding our performance. The metrics are not validated by an external body.
Employee engagement
As part of our transformation to ASN Bank, the decision was made to replace our People KPI 'Genuine Attention' with Employee engagement as our new Main People KPI as part of our ASN Bank strategy. Employee engagement was already measured on a yearly basis in previous years via our Employee Listening Survey. Starting this year, this survey is conducted in partnership with a new external partner. All employees and temporary agency workers were invited to complete the survey. In 2025, the completion rate of the Employee Listening survey was 72.2%, resulting in an Employee engagement score of 7.6 (2024: 7.3). Although this score is below target, Employee engagement increased in times of transformation.
KPI1 | 20252 | 2024 | 2023 | 2022 | Target 2025 |
|---|---|---|---|---|---|
Employee engagement3 | 7.64 | 7.3 | 7.5 | 7.4 | ≥8.0 |
- On a scale from 1-10
- Employees who were part of the mobility center during the fielding period of the Employee Listening Survey were excluded from the survey
- Employee engagement is measured on a yearly basis via our Employee engagement Survey. The 2025 Employee engagement Survey was conducted from 14 October – 3 November (in line with previous years), which was prior to the announcement of the next phase of the transformation.
- As of 2025, Employee engagement is measured using a new set of questions, resulting in a 1-10 score. This resulted in a score of 7.6, with a target of at least 8. For comparison reasons, Employee engagement was also measured with the four previously used questions. This also resulted in an Employee engagement score of 7.6. Going forward, Employee engagement will only be measured using the new set of questions.
As part of our Diversity, Equity and Inclusion policy, which is currently under review, we have defined the following targets to promote equal treatment and opportunities for all. These targets (which we introduced in 2023) remained unchanged in 2025.
A male-female ratio between 40% and 60% across all levels of management (2025: 33% female and 2024: 38% female)
The gender pay gap is no more than 1.0% (2025: 0.6% and 2024: 0.9%).
≥ 80% of our employees feel at home at ASN Bank (2025: 79% and 2024: 81%)
Key characteristics of our internal employees and external (non-)employees
Headcount by gender | 2025 | 2024 |
|---|---|---|
Male | 1,899 | 1,966 |
Female | 1,557 | 1,724 |
Other1 | -- | 1 |
Not reported | -- | -- |
Total employees | 3,456 | 3,691 |
Total employees in FTE | 3,388 | 3,602 |
- In all other tables including disclosure of breakdown by gender (male vs. female) , colleagues in the gender category "Other" are included in the minority group.
Headcount | Female | Male | Other | Not disclosed | Total | |||||
|---|---|---|---|---|---|---|---|---|---|---|
2025 | 2024 | 2025 | 2024 | 2025 | 2024 | 2025 | 2024 | 2025 | 2024 | |
Total employees | 1,557 | 1,724 | 1,899 | 1,966 | -- | 1 | -- | -- | 3,456 | 3,691 |
Permanent employees | 1,445 | 1,540 | 1,699 | 1,756 | -- | -- | -- | -- | 3,144 | 3,296 |
Temporary employees1 | 112 | 184 | 200 | 210 | -- | 1 | -- | -- | 312 | 395 |
Full-time employees | 1,087 | 1,146 | 1,751 | 1,818 | -- | -- | -- | -- | 2,838 | 2,964 |
Part-time employees | 470 | 578 | 148 | 148 | -- | 1 | -- | -- | 618 | 727 |
- In the Section Operating expenses and FTEs in transformation programme, 'Temporary FTEs' refers to non-structural full-time equivalents whose costs are required to cover remediation work, with a focus on anti-financial crime and risk management-related topics. This deviates from the definition under CSRD.
In addition to our 3,456 internal employees who have a permanent or temporary contract with ASN Bank and are covered by our Collective Labour Agreement (CLA), our workforce consists of 796 external (non-)employees, who are self-employed workers or temporary workers provided by employment agencies. ASN Bank does not have any contracts with non-guaranteed hours.
Own workforce distribution in headcount | 2025 | 2024 | ||
|---|---|---|---|---|
Internal employees | 3,456 | 81% | 3,691 | 83% |
External (non-)employees | 796 | 19% | 759 | 17% |
Headcount | Female | Male | Total | |||
|---|---|---|---|---|---|---|
2025 | 2024 | 2025 | 2024 | 2025 | 2024 | |
Temporary agency workers | 221 | 131 | 393 | 337 | 614 | 468 |
Contractors (self-employed) | 40 | 64 | 142 | 227 | 182 | 291 |
Total non-employees | 261 | 195 | 535 | 564 | 796 | 759 |
Total non-employees in FTE | 804 | 755 | ||||
The share of external (non-)employees as part of the workforce increased to 19% (2024: 17%). Hiring external (non-)employees helps with temporarily filling vacancies and is the preferred solution to dealing with specific temporary staffing needs
Employees1 | 2025 | 20242 | ||
|---|---|---|---|---|
Inflow | 425 | 12.0% | 559 | 15.4% |
Outflow (turnover) | 1,1373 | 32.0% | 435 | 12.0% |
- For more accurate calculation of turnover rates in line with common practice, turnover rates are now calculated based on headcount average (average year-start headcount and year-end headcount). 2024 Turnover rates included in this report have been updated accordingly for comparison reasons.
- In ASN Bank’s annual report 2024, employee inflow and turnover was calculated based on year-end headcount, resulting in an inflow of 15.1%, and an outflow(turnover) of 11.8%.
- Due to the transformation, outflow and turnover rates for 2025 were significantly higher than previous year(s).
In 2025, we saw a 6.4% decrease in the number of internal employees and a 4.9% increase in the number of external (non-)employees, resulting in an overall workforce decrease of 4.4%. This decrease excludes 348 employees who were placed in our Mobility Centre. For more information, see the Section Working conditions.
In line with the transformation, new employees were recruited to help deliver on our new ambitions as ASN Bank. To attract these new employees, we launched our new campaign Shape Tomorrow. Start Today (Maak je sterk voor morgen. Start vandaag). This campaign helped us attract 425 new employees, resulting in an inflow of 10.4%.
Collective bargaining coverage and social dialogue
At ASN Bank, 99% of our employees are covered by collective bargaining i.e. the Collective Labour Agreement (CLA), including financial and non-financial benefits. The remaining 1% consist of employees remunerated at levels above the CLA. The latter category has its own arrangements that largely follow those of the CLA. All employees are covered by social dialogue as the Works Council represents 100% of our employees.
Diversity metrics
It is our ambition to grow the proportion of women in leadership positions. Our target for 2025 is for women to hold at least 40% of these positions. At year-end 2025, this proportion was 33% (2024: 38%). Currently, 40% (2024: 40%) of the Supervisory Board positions and 40% (2024: 50%) of the Executive Board positions are held by women.
Within ASN Bank, we consider CLA+ (internal employees and external (non-)employees with job levels above CLA) as Top Management. Our Top Management consists of 29 men (69%; 2024: 69%) and 13 women (31%; 2024: 31%).
We empower our employees to shape their working conditions according to their personal needs instead of assuming what is preferred based on their age. For example, the leave hours are the same for all ages. In addition to this equal treatment principle, there are some evident topics that apply to specific age groups, like the right to retire.
Age group | Employees 2025 | Employees 2024 | Non-employees 2025 | Non-employees 2024 |
|---|---|---|---|---|
Total | 3,456 | 3,691 | 796 | 1,023 |
< 30 | 374 | 470 | 213 | 133 |
< 30 in percentage | 11.0% | 13.0% | 26.8% | 17.5% |
30-50 | 1,956 | 2,010 | 440 | 447 |
30-50 in percentage | 57.0% | 54.0% | 55.3% | 58.9% |
>50 | 1,126 | 1,211 | 143 | 179 |
>50 in percentage | 33.0% | 33.0% | 18.0% | 23.6% |
Adequate wages
Based on the legal minimum wage set by the Dutch government, 100% of our employees earn an adequate wage. In 2025, ASN Bank applied € 16.01 per hour as the minimum wage, which is higher than the statutory minimum wage. Starting salaries are set at 75% of the maximum salary for each scale.
Social protection
All our employees (100%) are covered by social protection, through public programmes or through benefits offered, against loss of income due to sickness, unemployment, employment injury and acquired disability, parental leave, and retirement.
Training and skills development
To monitor performance and promote professional maturity, 100% of our employees participate in our performance management process. This process was further developed in 2025. 99% of eligible employees completed a performance and career development review; 99% of the male and 99% of the female employees (98% completed in 2024; 98% of male and 98% of female employees). Employees who have been absent for six months (for example due to illness) or who started working at ASN Bank after July are not eligible for a performance and career development review.
ASN Bank offers employees a wide range of opportunities to develop their professional and personal skills. As of 2021, all employees of ASN Bank receive an annual personal development budget (PDB) of € 750. As of 2025, the PDB can be accumulated for four years, up to a maximum of € 3,000.
Since we do not have insight into training hours, we report training costs, similar to previous years. In 2025, investments in employee training and development amounted to € 6.9 million (2024: € 7.3 million), or € 1,954 per employee based on yearly headcount average (2024: € 2,018). Besides the PDB, employees can use our Learning Experience Platform (LXP), which offers training courses and tools to acquire new knowledge and skills.
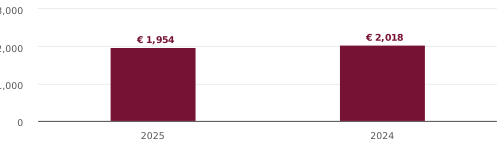
- In € per headcount based on yearly headcount average
- In ASN Bank’s annual report 2024, investments in training and development per employee in 2024 was calculated based on FTE and amounted to €2,032.
- For consistency with the disclosure of other reported metrics and given that development budgets are allocated based on headcount, investments in training and development per employee are now calculated based on headcount. Furthermore, for a more representative calculation, investment per employee is now calculated based on headcount average (average year-start headcount and year-end headcount). 2024 Investments in training and development per employee included in this report have been updated accordingly for comparison reasons.
Health and safety
At ASN Bank, we have a health and safety management system in place for 100% of our workforce via our Working Conditions and Health Policy. Our policies regarding absenteeism and rehabilitation only cover our employees.
As anticipated given the transformation, ASN Bank’s absenteeism rate increased to 5.6% (2024: 5.4%). When absenteeism is work-related, workload stress remains the main underlying cause. In the Netherlands it is not allowed to further disclose the nature of sickness because of Dutch privacy legislation.
Work-life balance
To support employees with maintaining a healthy work-life balance, all employees (100%) have several options to apply for family-related leave. These range from long-term leave types such as maternity leave and parental leave to occasional arrangements such as care leave.
Compensation indicators
One of ASN Bank's aspirations with respect to equal treatment is equal pay. We offer new employees a salary that fits the position, rather than matching the salary earned in a previous job. We measure and analyse our gender pay gap (the difference between the average salary of men and women) on an annual basis. For this calculation, we use the Total Fixed Income as the basis for the average salary. In December 2025, the average monthly salary, adjusted to a 36-hour working week, of women was 13.2% lower than that of men. This is what we call the unadjusted pay gap.
For the calculation of the gender pay gap in the light of equal treatment (equal pay for equal work), we take ‘equal work’ into consideration. With the available data we therefore adjust for job grade as an approximation of job difficulty (equal work) and age (work experience). When adjusting for job grade, the remaining gender pay gap is 1.3% in favour of men. We then carried out further corrections for years of work experience, through age groups. The remaining gender pay gap for 2025 was 0.6%, showing a decrease compared to previous year’s gender pay gap (2024: 0.9%, 2023: 0.07%).
ASN Bank pays the Chair of the Executive Board (the highest-paid individual in our organisation) 6:1 compared to the median salary of all other employees. For details and extra information, see the Section Remuneration report, pay ratios.
Incidents, complaints and severe human rights impacts
In 2025, no severe human rights incidents connected to our own workforce (e.g., forced labour, human trafficking or child labour) occurred. Furthermore, no fines, penalties and compensations for damages were paid for work-related incidents and/or complaints and severe human rights impacts within our own workforce.
A single potential work-related complaint of discrimination and harassment was brought to the attention of the Complaints Desk. Furthermore, several employees reached out to our team of Confidential Counsellors to discuss potential incidents of discrimination and harassment. Ultimately, none of these instances led to the filing of an official complaint of discrimination or harassment. Therefore, no discrimination- or harassment-related complaints were submitted to the Committee on Undesirable Behaviour.
In case potential abuse is reported, the report is reviewed to assess whether it is considered as potential abuse in accordance with the definition under the Whistleblowers Protection Act. Should there be a potential case of abuse, the matter will be submitted to the Committee for Behavioural Incidents and Abuse for further consideration. None of the reports filed in 2025 were classified as potential cases of abuse, therefore no reports were ultimately brought to the committee for a ruling.
Over the same period, we received several complaints from employees regarding their individual situation, but no complaints were filed to raise concerns related to broader employee matters affecting our own workforce.
Customers & end-users
ASN Bank wants to stand out from its peers as the bank with the strongest customer relationships. We aim to meet the financial needs of our customers in a people-oriented, efficient and sustainable manner, while putting our customers' interest first. To do this, we continuously work on understandable and transparent products, and ensure a strong local presence through our branches. We continue to enhance compliance with the applicable privacy rules and regulations to secure our customers' data protection and privacy.
Our socially responsible approach towards customers and end-users is defined by our mission 'banking with a human touch' (to be replaced by ‘commitment to a sustainable and fair future for all' under our new strategy). With 3.03 million customers and end-users and a national coverage of 325 branches, we influence society via our strong customer relationships. We consequently identified customers and end-users as material through our double materiality assessment (DMA).
We identified the following impacts, risks and opportunities (IROs):
Our extensive network of 325 branches positively impacts our customer relationships, allowing us to offer our products and services and be more accessible. This in turn poses an opportunity to retain and attract new customers.
Anti-Money Laundering Regulation (ALMR) / Know Your Customer (KYC) regulatory requirements have resulted in increased documentation standards and additional compliance checkpoints, which can lead to a potential negative impact on social inclusion.
The organisational transformation to ASN Bank presents a privacy risk, due to potential data breaches, cybersecurity threats, and poor data practices.
Our main policies, actions, metrics and targets regarding customers and end-users are:
Product Approval and Review Process (PARP) Policy; and Privacy Policy.
Through continuous engagement with our customers, we monitor and work on ways to solve the most recurring issues that our customers complain about. This, in turn, helps us to improve customer satisfaction levels.
We monitor the NPS and the number of active multi-customers to track progress on customer satisfaction levels and attract and retain customers.
A new Customer Experience (CX) Strategy has been developed for 2026-2028 to gain more promoters and capitalise on material opportunities.
We are also continuously making improvements in relation to privacy risk management and General Data Protection Regulation (GDPR) compliance.
In our 2025 DMA, we have assessed 'customers and end-users' as a material topic, including all our customers in its scope. As approximately 90% of our customer base consists of retail customers, our main focus in this section is on this group.
Our DMA identified a positive material impact on our retail customers, stemming directly from our core strategy and business model. As a customer-oriented Dutch bank, aimed at retail customers and small businesses, we offer relevant, fair, and transparent banking products (mainly banking, savings, and mortgages) alongside customer-friendly services tailored to our customers' needs.
Building strong customer relationships forms one of the two main pillars of our strategy. This is one of the reasons why, on 1 July, we transformed our bank from five brands to one, further strengthening our ability to serve our customers effectively. In addition, central to our approach is the belief that simplicity drives true customer value. This principle shapes our customer journey design, which prioritises people over technology and underpins our new strategic direction: 'Digital first' as our primary distribution channel to remain competitive and current, complemented by 'personal when it matters': personal interaction through our nationwide branch network remains available for customers who value human connection. This approach requires close collaboration with our franchisees and intermediary channels. We thus remain close and accessible to our customers, who can easily manage their banking needs through our app, visit one of our branches, or simply call us. This multi-channel approach ensures we stay connected and maintain strong relationships with our customers in the short-, medium-, and long-term.
Beyond our broader transformation efforts, we must continuously update our systems where we can. To strengthen our Know Your Customer (KYC) compliance, we have initiated a comprehensive reidentification program that requires all customers to reverify their identity through our mobile app. However, this process presents significant challenges for customers who are not digitally active, particularly elderly customers and vulnerable groups, who must instead complete reidentification via passport verification at our branches. We understand by vulnerable groups or customers: people who due to personal circumstances or external factors are especially susceptible to harm, disadvantage, or poor outcomes when engaging with financial products or services. Financial firms have a duty of care to ensure that vulnerable groups are protected from unfair treatment or exclusion. Hence, while stricter Anti-Money Laundering and KYC regulatory requirements are necessary, we have observed substantial customer impact. This impact is systemic in nature as it affects our entire customer base, creating widespread barriers to service access that impact vulnerable groups across all contexts where we provide banking services. We anticipate that such measures may lead to increased discrimination complaints and create barriers to products and services and limit access in the short-, medium- and long-term, which conflicts with our customer-oriented business model.
We identified a material risk for this topic in our DMA, related to privacy. Firstly, if we are not transparent about the processing of our customers' personal data, it may impinge on our customers' privacy rights. Secondly, if we do not process our customers' data in a legitimate manner, privacy breaches may occur. These risks may result in reputational damage, sanctions, and litigation costs for ASN Bank. When complaints about the use of personal data are received, or personal data breaches occur, ASN Bank might suffer reputational harm or might become subject to regulatory measures imposed by the Data Protection Authority (DPA), which might result in customers leaving ASN Bank. In addition, it may also put the sound relationship with our customers under pressure. Please see the Privacy Section for further information on our actions to manage privacy risks.
Having satisfied customers is a key element to the business success of ASN Bank. Hence, we identified customer relationships as a financially material topic for our organisation. Creating a positive customer experience will result in the opportunity to potentially cross-sell products (especially in the active multi-customer group), retain customers and attract new customers.
To actively pursue such an opportunity, which arises from our fundamental dependency on maintaining positive customer relationships for sustainable business growth, ASN Bank has implemented an ambitious savings growth strategy. We are pursuing significant expansion in savings volumes to support increased mortgage financing capacity. In December 2025, we launched our major Savings Campaign promoting the message ‘Save with the bank that thinks about you and the future’. To enhance accessibility, we removed barriers by allowing private customers to open savings accounts without requiring a current account (effective November 1, 2025) and aligned our savings rates more competitively with market standards.
Looking ahead to 2026, we are exploring other ways to make saving even easier and more attractive.
To manage our customer-related impacts, risks and opportunities, we have policies in place that are applicable to all our customers. The scope of these policies is limited to the Netherlands as that is our only market.
Policies related to customers and end-users
Our policy on Product Approval and Review Process (PARP) sets out our processes for developing and launching new products and reviewing and making changes to existing products, in line with our customers’ interests. It defines and considers how to address the target audience, the scenario analyses and determines and prepares the distribution method and information provision for new products.
As we are to provide our customers with accurate and accessible product- or service-related information, we ensure that this information is clear, concise and easy to find. We also make certain that the adviser has the correct product information to give customers accurate advice. By providing the correct information to both customers and advisers, we strive to offer the right product to the right customer base.
Our PARP policy applies to all products and services that have been, or will be, developed, marketed and distributed by ASN Bank. Furthermore, this policy supports our growth objective through enhanced customer experience, which builds the trust that is essential to our customer relationship model.
We have incorporated the ‘CUSU’ (Cost Efficiency, Usefulness, Safety and Understandability) criteria, developed by the Dutch Authority for the Financial Markets (AFM), in our PARP policy. These criteria reflect how we balance all our stakeholders’ interests in product development and distribution management.
To assess whether our products and services still meet the requirements set out in our PARP policy, we conduct periodic reviews for every product and service. The Product Approval and Review Committee (PARC) is responsible for approving these reviews as well as the introduction of new products and services and making changes to existing ones. The committee is chaired by the Chief Operating Officer (COO), who is ultimately accountable for the implementation of our PARP policy. This policy is accessible to all our employees. In 2025, we made no significant changes to our PARP policy.
Protecting our customers' and third parties’ (such as payment counterparties) privacy and personal data is of great importance to ASN Bank and that is why we continuously enhance privacy compliance. Our Privacy policy describes how we manage privacy risks (for example, how we store and manage customers’ personal data). In general, our customers may expect us to process personal data with the same care and reliability as we manage the (savings) money entrusted to us.
This policy applies to all departments within ASN Bank and third parties supporting our processes. In our own operations we have processes in place to ensure we adhere to the General Data Protection Regulation (GDPR). In our annual policy review, the views and interests of our key stakeholders are taken into account. This reporting year, we did not make any significant changes to our Privacy policy.
We assigned specific functions and roles within the organisation to monitor the implementation of our Privacy policy, such as the Data Protection Officer, Privacy Officer and Privacy Employee. The Data Protection Officer is responsible for monitoring privacy compliance and our privacy-related risk appetite. Our Chief Risk Officer is ultimately accountable for the policy implementation.
Information about personal data processing is available to our customers and other external stakeholders on our website and upon request. Our Privacy policy is accessible to all our employees and all staff are required to follow an e-learning each year on privacy, the surrounding rules and regulations and their application within ASN Bank. Furthermore, the policy is incorporated in processes, procedures and work instructions with which employees put their knowledge and awareness into practice in their daily work.
ASN Bank is committed to various human rights standards as described in our human rights policy, see the Section Sustainability policies. In relation to customers, we specifically address freedom from discrimination and the right to privacy in our human rights policy.
We organise various initiatives and have several feedback mechanisms in place to directly allow customers to share their views, opinions, experiences and suggestions. The Chief Sales & Marketing Officer (CSMO), together with the COO, are responsible for ensuring that customers are engaged and that such input serves to improve our products.
We offer both online and offline opportunities for customers to provide feedback. Customers may call our Customer Contact Centre or walk into an ASN Bank branch and talk to an adviser. They are asked about their experience on completion of every online self-service process, such as a change of address or after opening a bank account. ASN Bank's website also has a feedback button and we periodically gauge customer and adviser satisfaction on various topics through (online) surveys.
Apart from the abovementioned channels, we organise various activities throughout the year to receive feedback from customers, such as:
On May 13, we held our very first Accessibility Experience Day, where colleagues were introduced to the importance of digital accessibility. We also launched an e-learning regarding digital accessibility for all colleagues.
During the ‘Week of Digital Participation’ (Week van Digitaal Meedoen) in November, we performed workshops and presentations in our branches. We also published a study on illiteracy to emphasise the importance of continuous attention on this topic and affected customers.
Through The Future Council, we offer young people aged 18-35, from different regions and diverse backgrounds, an opportunity to contribute ideas, provide advice, and share their vision on issues that affect them, with the aim to incorporate their interests in our policies and decisions.
The ASN Flagship store strengthens our social engagement and is a platform for customer experiences through training and seminars on topics relevant to customers such as safe banking.
Our user Experience Lab involves persons with disabilities, a low level of literacy and elderly people, with the aim of researching to make our products and services understandable, functional and more accessible.
ASN Bank also supports projects that deliver positive societal impact through the ASN Foundation. The Foundation specifically targets project financing within the domains of housing, financial wellbeing and sustainability.
Through our Eurowijs partnership, ASN Bank employees delivered 687 Eurowijs guest lessons and 456 Bank voor de klas sessions at primary schools in 2025. ASN Bank co-founded the Eurowijs programme in 2013 and continues to act as a strategic partner for financial education to Dutch schoolchildren, ensuring the delivery of free educational materials to over 300,000 students annually.
ASN Bank supports customers with making their homes more sustainable. We launched a green roof e-learning with Naturalis, addressing research-backed demand for practical environmental solutions.
Customers who experience dissatisfaction with our products or services may submit a complaint. We support the availability of grievance channels by maintaining both online and offline complaint options and by collaborating with the Dutch Institute for Financial Disputes (KIFID) to provide customers with access to external mediation and arbitration services when internal resolution is not satisfactory. Customers who wish to file a complaint anonymously can make use of our online SpeakUp channel (for further information see Business conduct).
When we receive a complaint, we contact the customer in question. The employee handling the complaint aims for a careful, verifiable and consistent complaints procedure and is given the time and, if required, resources to do so. If it turns out that ASN Bank has made a mistake and the customer has suffered damage because of this, they will be compensated. Minor complaints are dealt with directly in the first line customer contact and other complaints are dealt with on a case-by-case basis. The considerations underlying compensation are recorded internally. If a customer does not agree with the solution to the complaint, they can make an appeal or approach KIFID to request a mediation process or a decision by KIFID's Arbitration Commission.
In 2025 we received a total of 13,147 complaints, an increase compared to 11,636 in 2024. Our transition toward one unified ASN Bank is progressing, and with that comes a period of significant organisational change, new systems, revised governance structures, updated processes, and new colleagues taking on key roles. While this transformation is necessary, it does create movement across the organisation and places pressure on the stability and continuity experienced by our customers. We consider it essential that customers feel able to report any (perceived) discrimination. For that reason, we explicitly encourage this through a statement on the complaints page of our website.
In case of human rights impacts, remedy is determined on a case-by-case approach and tailor-made to the customer's personal situation. A complaint mechanism for external stakeholders to report grievances is also currently in development. We acknowledge our responsibility in situations where our processes may inadvertently impact customers' fundamental rights, as exemplified by a recent case where a customer with a post-COVID disability faced challenges regarding the recognition of his WGA wage supplement benefit in mortgage qualification criteria. ASN Bank determined that there was indirect discrimination but ruled it justified due to legitimate risk of the uncertain nature of WGA benefits. However, policy clarification was recommended to explicitly state that customised assessments are possible for WGA benefits.
We have also created a multidisciplinary team, consisting of colleagues who represent the entire organisation, to structure and improve our non-discrimination efforts. We are drawing up a roadmap based on 4 pillars, i.e. policies, processes, training and awareness and communication, to actively prevent these types of customer experiences from happening in the future and improving in our responses to these types of complaints. Firstly, a ‘combating discrimination’ strategy was launched and aligned with the corporate strategy. Through the 4 pillars, policies have been updated with definitions and examples. Work instructions have been adjusted and updated to support our employees who are in direct contact with our customers to minimise our (in)direct impact. Furthermore, almost all employees who have direct customer contact have been trained in ‘combating discrimination’ and unconscious bias.
ASN Bank does not have a separate policy to protect individuals against retaliation when they make use of our complaints mechanisms.
Besides our own complaints procedure, we also encourage the businesses we invest in and partners we work with to have a complaint mechanism in place to ensure consumer protection. This is a criterion which is part of sustainability policies. Read more about our sustainability policies in the Section Sustainability governance and policies.
ASN Bank is continuously working on improving customer satisfaction levels to strengthen our customer relationships and mitigate or remediate any negative impacts on our customer base. On the one hand we are working on solving the key dissatisfiers experienced by our customers. Dissatisfiers are the most reoccurring issues that our customers complain about. In 2025 we worked primarily on resolving the issues for customers stemming from their re-identification and the transformation to ASN Bank. On the other hand, we have developed a Customer Experience (CX) Strategy for 2026-2028, to gain more promoters and capitalise on the material opportunity. Promoters are customers who are highly satisfied with our products or services and are likely to recommend it to others. We are also continuously making improvements in relation to privacy risk management. The scope of these activities includes our upstream activities, our own operations and our downstream activities, and cover all banking products and services for retail customers in the Netherlands.
Our CX Strategy is also key to managing material impacts on customers, by establishing positive customer and brand experience in all customer journeys. During 2025, we focused on implementing and optimising our customer bereavement journey (nabestaandendesk), savings and re-identification journey.
In addition, to enhance financial resilience and deliver positive impact, we discontinued 'basic banking' fees, eliminating charges for savings-only customers.
Beyond operational improvements, we are committed to financial inclusion and responsible banking practices. Through fair and transparent products and services, always putting our customers’ interests first, we contribute to people's financial resilience and provide equal opportunities, enabling everyone to participate in society from a financial perspective. We also help customers to become or remain financially healthy and offer them financial inclusion, for example by providing savings tips. Our financial advisors help customers with suitable products. We do not use debt collection agencies and look for long-term solutions in consultation with vulnerable customers who are experiencing financial difficulties.
To evaluate our performance and the effectiveness of our actions in relation to customer relationships, we defined two metrics, i.e. the customer- weighted Net Promoter Score (NPS), and the number of active multi-customers. To manage the identified privacy risks and monitor compliance with the applicable rules and regulations, we have a key risk indicator 'Privacy'. However, due to the sensitivity of the information, we do not disclose this metric in this report.
The NPS is a customer-loyalty and satisfaction metric. The score tells us how likely it is that customers will recommend our products and services to others. It expresses customer satisfaction. A high score means that customers are satisfied, which contributes to the positive impact that we aim to have on our customers.
The NPS metric is measured on a quarterly basis. The input for the NPS is gathered by means of a survey. A representative sample is drawn for each (ex) brand from an external consumer panel. The sample size varies per (ex) brand and ranges from 500 to 1,000 customers. The NPS indicates the ratio between the so-called detractors and promoters on a scale from 0 to 10. Respondents are grouped as follows:
Detractors (scores 0-6), customers are on average unhappy and can damage and impede our growth through negative word-of-mouth.
Passives (scores 7-8), customers are on average satisfied but unenthusiastic and are vulnerable to competitive offerings.
Promoters (scores 9-10), are most likely enthusiastic loyal customers who will keep buying and recommend us to others, fuelling growth.
The NPS is calculated by subtracting the percentage of detractors from the percentage of promoters. This figure may be somewhere between -100% and +100%. The total result of the NPS for ASN Bank NV is calculated as a weighted average based on the total number of retail customers per (ex) brand and is reported based on the last quarter's results.
We work together with a market research agency that carries out the fieldwork for monitoring the NPS. This agency is ISO certified and ensures quality and consistency in questionnaire, sampling, data weighing and reporting. The measurement of the metric is also validated by our assurance provider.
Despite the NPS being used around the world, the methodology is subject to some assumptions and limitations. The methodology assumes that customers adequately assess the likelihood of recommending a product or service and also that it is a good measure of customer loyalty or relationship strength. NPS is not based on a customer relationship model, which is a limitation of the methodology.
The number of active multi-customers reflects our most loyal customers and the customers which are most likely to cross sell products. An active multi-customer is a customer with an active current account1 and at least one product from another product group (like savings, lending, etc.). The metric is measured monthly, based on the data in our data warehouse, and the measurement is only validated through our assurance provider. Furthermore, the active multi-customer metric has not been impacted by the brand consolidation to ASN Bank, as it represents the combined total across all previously separate brands.
In our new strategy, we discontinued our KPI ‘Active multi-customers’ and introduced the KPI ‘Primary customers'. A primary customer is a compliant customer in the role of primary and/or joint account holder, who receives at least € 800 in monthly funding across their combined payment accounts over the past 3 months (minimum € 10 for youth accounts). Funding refers to all positive credits excluding interest credits and internal transfers between accounts within the brand. For more information, please see Our strategy Section.
The decision to rebrand all four brands under the new ASN Bank identity negatively impacted the NPS. Both existing and new customers do not yet recommend ASN Bank, as these customers have insufficient experience with the new brand. Therefore, the NPS came under pressure, reaching -7 by year-end 2025. Converting customers into brand promoters is a time-intensive process. Additionally, mandatory customer re-identification procedures—required for data consolidation yet providing no customer benefit—have further negatively impacted NPS performance. The transformation and the recent strategy change leads to a new relative NPS target: the highest NPS position among the major systemic Dutch banks. At year-end 2025, we ended in joint second position, driven by the transformation impact. For more information, please see Our strategy Section.
As the methodology to determine the NPS remained the same, the adjustment in targets does not have an effect on the comparability of our actual performance over time. Furthermore, the number of active multi-customers increased by 46 thousand to 1,279 thousand (year-end 2024: 1,233 thousand), slightly below the 2025 target of 1.3 million due to the transformation. The targets were approved by our Executive Board.
While stakeholders are not directly involved in target setting, we do take insights from customer complaints into account. Our customers are informed about our performance against these targets through publication in our Annual Report and Interim Financial Report. Through the various activities that we organise to foster customer engagement, we continuously identify lessons learned and potential improvements together with our customers, allowing us to adjust our products and services to their needs.
Metric | Baseline value | Baseline year | Year-end 2025 | Target 2025 |
|---|---|---|---|---|
Customer-weighted average NPS1 | -9 | 2016 | -7 | +7 |
Number of active multi-customers (in 1,000)2 | 948 | 2020 | 1,279 | 1,300 |
- The customer-weighted NPS involves the retail customer expressing a satisfaction rating (in terms of probability of recommendation). The higher the score, the more satisfied the customer is. The score and target are expressed in NPS points. Only the total number of retail customers in our downstream activities are in scope; SME customers are excluded.
- An active multi-customer is a customer with an active current account and at least one product from another product group. Both a retail customer and a business customer may be an active multi-customer.
- An active current account is a current account on which the customer initiated more than ten transactions for three months in a row. For customers under the age of 18, six transactions for three months in a row is sufficient.
Governance information
In this section, we will firstly give an overview of our approach to anti-financial crime (AFC). Through our double materiality assessment (DMA), it was determined that:
Financial crime risk represents potential losses from illegal activities utilising financial systems, including fraud, money laundering, terrorist financing, and corruption, with impacts across individual, business, and global economic levels.
Key actions, policies, metrics and targets on AFC are:
With effect from 1 February 2025, a renewed AFC organisation has been implemented.
During 2025 we have made substantial progress in reducing AFC risks by, among other things, further improvements in sanctions screening processes and systems.
ASN Bank has further clarified and strengthened the governance to manage AFC risks and monitor progress of Wwft remediation.
The AFC Policy and Mandatory Requirements together with the Standards and Procedures constitute the main anchor points in our risk-based Policy and Procedures framework.
Our remediation goals are to comply with all relevant laws and regulations, to have real time AFC risk-related insight in customer risk profiles and to have an effective Systematic Integrity Risk Analysis (SIRA) in place.
Furthermore, this section will provide readers with an understanding of our approach, processes and procedure as well as our performance in respect of business conduct, including our Ethics Committee framework, whistleblower protection mechanisms, and comprehensive anti-corruption measures.
Anti-financial crime
ASN Bank has a holistic approach to anti-financial crime (AFC). This approach is part of the gatekeeper function of ASN Bank and addresses the risk of money laundering (AML), terrorist financing (CFT), sanctions violations, bribery and corruption, and tax evasion. The Chief Financial Crime Officer (CFCO), also Executive Board member, is responsible for overseeing compliance with the Anti-Money laundering and Anti-Terrorist Financing Act (Wet ter voorkoming van witwassen en financieren van terrorisme - Wwft) and the Sanctions Act (Sanctiewet - SW) and ensures that the AML, CFT and Sanctions policies, procedures and internal control measures are adequate and proportionate for ASN Bank. The CFCO is also accountable as day-to-day policy maker.
With effect from 1 February 2025, a renewed AFC organisation has been implemented. The bank introduced a simplified organisational structure across all three lines with clear mandates and responsibilities to manage and mitigate the AFC risks that the bank is potentially exposed to. We are committed to a healthy risk culture and managing our customer portfolio within the boundaries of our risk appetite.
ASN Bank’s CFCO domain includes Intelligence & Security AFC Operations, Innovation & Client Remediation for remediation of client data and innovation and Reporting & Oversight. The second line Compliance AFC function provides AFC advice and conducts independent monitoring to ensure effective compliance with the Wwft and Sw.
AFC is part of the sustainable way forward within ASN Banks’ mission and strategy. The bank wants to prevent and detect financial crime threats and the misuse of the financial system by third parties. In our AFC approach, we incorporate insights from the sector, for example in the areas of proportionality and discrimination and take into account the potential negative effects on society.
In 2023, De Nederlandsche Bank (DNB) concluded that ASN Bank (then: de Volksbank) violated the Wwft and DNB imposed an instruction to remediate the SIRA. In 2024, ASN Bank complied with DNB's instruction and in 2025 further improved multiple aspects of the SIRA for it to serve as an adequate management instrument for the broader Wwft remediation.
To remediate identified shortcomings and ensure adequate control, we have implemented multiple programmes and allocated additional resources. ASN Bank is executing a multi-year Remediation Programme to ensure adequate control and demonstrable management of AFC risks. The impact is severe due to additional expenses and efforts for remediation activities, as well as ongoing AML/CFT risk exposure during the remediation period. For more information on AFC expenses, see the Section AFC costs.
In 2024, ASN Bank recognised a provision related to our AFC remediation programme, aimed at the recovery of missing and/or incorrect customer data from our existing customer base as well as a reassessment of customers after data-recovery to their correct risk profile. For more details, see Note 15 Provisions - AFC remediation.
In 2025, DNB imposed a fine of € 5 million for deficiencies under the Wwft in the period from 2020 up to and including 2023. For more details, see Note 15 Provisions - Administrative fines.
The AFC Policy and underlying Mandatory Requirements primarily link to the applicable regulatory compliance requirements (particularly the Wwft, SW, and tax integrity regulatory frameworks including IRS FACTCA directive pillar 2 Client ID and OECD CRS directive Client ID) and to the higher AFC risks identified and assessed in the Systematic Integrity Risk Assessment (SIRA). The AFC Policy and Mandatory Requirements together with the Standards and Procedures constitute the main anchor points in our risk-based Policy and Procedures framework.
The scope of AFC policies and standards applies to ASN Bank and its subsidiaries. In line with this, all our employees are deemed to have ample knowledge to prevent and detect financial crime activities. We have recruited professionals with in-depth Wwft knowledge to organise and execute the Remediation Plan. To guarantee the knowledge of our employees, we (re)designed employee learning materials, awareness training courses and bank-wide training programmes.
In their examinations of compliance pursuant to Wwft, DNB identified deficiencies, including inadequate risk monitoring and consequently the failure to identify risks, or the failure to identify them in time. The system that generates alerts about customers and their transactions did not function properly. To structurally give substance to the above-mentioned deficiencies ASN Bank’s Remediation Programme provides for a full scope redesign of the end-to-end Wwft policies and processes, the strengthening of the SIRA methodology, the redesign of underlying alert frameworks and a risk control framework to provide a self-assessing and a learning environment within the AFC organisation. This includes the remediation of missing and/or incorrect customer data from our existing customer base as well as the risk reassessment of all customers.
During 2025 ASN Bank has made substantial progress in reducing AFC risks by:
Advanced in-depth insights in AFC risks as part of our SIRA 2024 and the necessary requirements to further mitigate these risks.
Reduction in operational backlogs for transaction monitoring and customer due diligence.
Further improvements in sanctions screening processes and systems.
Start of large-scale customer data remediation and customer risk reassessment.
Development of AFC standards and risk frameworks in line with market practices.
We maintain a continuous dialogue with our supervisory authorities on the progress of all ongoing improvements, as strict compliance with laws and regulations and meeting the requirements set by supervisory authorities remains crucial for ASN Bank.
ASN Bank has further clarified and strengthened the governance to manage AFC risks and monitor progress of the Wwft remediation. The Executive Board (ExBo) is provided with a bi-weekly progress report on AFC risks and the remediation, and the Risk & Compliance Committee and the Supervisory Board receive a quarterly report. AFC objectives on which the ExBo steers have been cascaded to the domains and teams. Progress on these objectives is discussed monthly with the ExBo.
The Client Integrity Remediation Board is responsible for the implementation and quality of the AFC remediation. It is mandated to make all necessary decisions about the scope and priorities of remediation-related topics. The Remediation Board comprises representatives from the CFCO, CSMO, COO, CRO domain and Compliance, and is chaired by the CFCO. Program Boards monitor progress on the multiple underlying programmes and report to the Remediation Board. AFC risk decisions are submitted to the Client Integrity Remediation Committee, a second-line body chaired by the CRO.
Remediation also involves rework on existing customers. This may impact the current customer portfolio as insights in AFC risk exposure will improve in the coming years.
To be effective in its remediation activities, ASN Bank increased the number of employees involved in AFC activities from 800 FTE at year-end 2024 to approximately 1.000 FTE at year-end 2025. This includes approximately 200 FTEs allocated to the remediation activities. These cost and additional remediation cost are charged to the provision, read more in Note 15 Provisions.
ASN Bank’s remediation goals are to comply with all relevant laws and regulations. This means that we continuously monitor our risks and the implemented measures to effectively control them. Our strategic report includes metrics and targets on the composition of our portfolio, also in relation to risk appetite limits and SIRA outcomes, and the effectiveness of controls.
For the remediation, the bank has set interim milestones. Progress and timely delivery are closely monitored. This foresees e.g. in targets for effective delivery in relation to planning, remediation of missing and/or incorrect customer data and progress on customer risk reassessment. In 2025, ASN Bank met internal remediation targets, including number of deliverables completed in time ≥ 90%.
It's ASN Bank's ambition to have completed the remediation efforts by the end of 2027 and hence is demonstrably and sustainable in control on our gatekeeper role.
Business conduct
Ethical conduct begins with our Executive Board members embodying ASN Bank's Values and Behaviours, Code of Conduct, and policies. By setting this example, the tone from the top is reflected throughout the organisation. When every team member upholds these principles, we build the trust and credibility essential to being the professional, expert, and ethical bank our stakeholders expect.
ASN Bank aims for strong customer relationships where we carefully balance customer interests with operational interests. This is reflected in our risk policies on topics such as whistleblowing, sustainability, and a Code of Conduct, and we have set up our business operations in such a way that we achieve highly controlled and ethical business conduct. These policies and related procedures have been communicated throughout the entire organisation, including our ExBo members.
On our intranet, we have a section that contains all policy documents and is accessible to all our employees. Based on these policies, we have implemented relevant control frameworks. In addition, ASN Bank strengthens its corporate (risk) culture by securing the required risk awareness and risk capabilities throughout the organisation.
In 2025, the Ethics Committee met five times and played a crucial role in addressing significant normative questions and providing guidance on bank-wide ethical dilemmas. The committee comprises members from the ExBo, senior management, the Works Council, and representatives from various first- and second-line functions. Beyond promoting ethical conduct and raising awareness of social responsibility, the committee has contributed to building ‘moresprudence’, i.e. morality jurisprudence, which is the process of knowledge acquisition, and understanding, of how to deal with ethical dilemmas within the organisation.
To meet the EU Directive on raising concerns and protecting whistleblowers (EU Directive 2019/1937), ASN Bank has implemented the required safe reporting channels and procedures for employees and other internal and external stakeholders. In addition to the new external reporting channel, any concerns about the organisation's unethical or unlawful conduct may also be voiced through the regular internal reporting channels and procedures. Violations of the Code of Conduct may be reported via the Incident Reporting Desk. Compliance investigates all reported (possible) violations of the Code of Conduct. Depending on the seriousness of the incident, a report may be submitted to the Committee for Incidents of Unacceptable Behaviour and Wrongdoing (Commissie Gedragsincidenten en Misstanden). Compliance also carries out monitoring investigations into, for example, ancillary activities of employees and senior management, or behaviour and corporate culture from which (follow-up) recommendations emerge. These channels may also be used to report unethical or unlawful business conduct, such as bribery or corruption.
A well-spread network of certified Confidential Advisers is available to provide support in case anyone experiences abuse, misconduct or inappropriate behaviour and to give guidance on reporting procedures and follow-up. The ExBo and Works Council are kept informed on all reports made via the annual Complaints and Incidents Report.
The protection of employees is guaranteed in various ways, such as by:
handling reports confidentially, executing and recording fact-finding investigations carefully,
having a network of Confidential Counsellors,
having the possibility to make a report anonymously via an external desk and Confidential Counsellors,
providing available guidance for the accused and providing clear information via policies and intranet.
When a report is recorded, it is guaranteed that any signals of retaliation that have been received are also recorded.
ASN Bank has committed to the Dutch Whistleblower Protection Act and guarantees an open culture in which employees are encouraged to report wrongdoings with full protection against any negative consequences. Information and training is provided on the reporting procedure and the employees protection (against retaliation) as stipulated in the Whistleblower Protection Act.
The Whistleblowing Policy is aligned with the Dutch Whistleblower Protection Act (Wet Bescherming Klokkenluiders, based on EU Directive 2019/1937) in which extra requirements have been introduced in 2024, such as reference to the free legal support for whistleblowers. Thereby, the name of the policy was changed to SpeakUp Regulations. The process is designed to make it easier to raise concerns anonymously. Besides dealing with abuse, this policy also focuses on misconduct and inappropriate behaviour and explains the simplified reporting procedures within ASN Bank.
While our policies do not distinguish which functions are most at risk in respect of corruption and bribery, in order to prevent the risk of involvement in corruption, ASN Bank subjects all its employees, partners, customers and third parties with whom it conducts business to due diligence or a screening. To this end, we have the Customer Acceptance, Monitoring and Review Policy (Beleid Klant Acceptatie Monitoring en Review KAMeR) and Procurement policy in place. Upon entering employment, all (internal and external) employees and members of senior management are subjected to a screening in accordance with the pre-employment and in-employment screening policy.
While ASN Bank does not have a separate policy on anti-corruption and anti-bribery, we have preventive controls in place and additional policies with controls with respect to customer acceptance, procurement and outsourcing, as well as screening policies for new employees, investments and business relationships. All are included in the Risk policy crime and Code of Conduct, as well as topics such as fraud related to payments and mortgages. A conflict of interest may lead to corruption and may occur in either business or personal situations. Regulations on dealing with a personal conflict of interest as well as on a conflict of interest with regard to the bank’s management and the supervision thereof, are described in ASN Bank’s Code of Conduct.
In 2025, as in 2024, no incidents of corruption and bribery were reported. This also entails that no employees were dismissed, disciplined or fined, and that none of our contracts with business partners were terminated or not renewed following our careful monitoring on corruption and related aspects. As a consequence, no public legal cases were brought against ASN Bank or its employees.
Within its integrated risk management, ASN Bank has a procedure for reporting and handling incidents. Reports of suspected corruption will be investigated by the Corporate Security & Investigation team. In 2025, ASN Bank did not receive any convictions or fines for violation of anti-corruption and anti-bribery laws.
The Compliance department is independent from ASN Bank’s brands and business units, and takes into account the interests of all stakeholders in its judgement. As for the reporting lines, compliance officers hierarchically report to the Director of Compliance, who hierarchically reports to the CRO. The Director of Compliance has a functional reporting line to the CEO and has the option to escalate the issue to the Chair of the Supervisory Board of ASN Bank or the Chair of the Risk & Compliance Committee.
When a high-impact incident occurs, there may be grounds to inform the supervisory authority (AFM, DNB, or ECB) and/or to report to the police. In case an employee is involved, a report can also be filed with the Foundation for Banking Ethics Enforcement. The Complaints and Incidents Regulations apply to the application and imposition of sanctions on employees.
It is required to safeguard independence of the investigation and impartial treatment of the reported issue. Therefore, members of the Committee for Incidents of Unacceptable Behaviour and Wrongdoing may not be directly or indirectly involved in the issue for which a complaint has been filed, or an incident of inappropriate behaviour or wrongdoing reported. In this case, the complainant/reporting person and/or defendant may challenge a member of the Committee or the entire Committee. A challenge must be properly motivated. Committee members may apply for recusal and must withdraw on their own initiative as soon as it has become clear that a potential conflict of interest exists. In the event of challenge and/or recusal, the place of the member of the Committee in question will be taken by a replacement from the pool. A request to challenge a member of the Committee or the entire Committee will be granted or rejected by the Committee dealing with the issue. This assessment will be made based on preventing (the appearance of) a conflict of interest as much as possible. This procedure is set out in the Supplement to the SpeakUp Regulations.
As from 2020, we generate an annual report on complaints, inappropriate behaviour, incidents and wrongdoings. This report provides insight into the number and nature of the complaints, incidents and wrongdoings, and is submitted to the Director of Compliance, CRO, ExBo, SB and Works Council.
ASN Bank wants to prevent exposure to unethical behaviour (for criminal purposes) for itself, its customers, and its systems. The Code of Conduct sets out that employees are expected not to engage in any form of corruption, bribery or conflict of interest, nor to arouse suspicion thereof. These rules also set out how employees can recognise and prevent this. For example, employees must be attentive when accepting or giving away business gifts and when performing an external function. Violations of the Code of Conduct, including conflict of interest-related violations, may be reported to the Incident Reporting Desk (detection).
The Code of Conduct provides a framework for employees to guide ethical conduct. This is important, as we understand that employee conduct impacts the stability of and trust in ASN Bank and the financial sector. For that reason, the Code of Conduct contains rules on topics such as ancillary activities, private financial transactions, ethical decision-making, and confidential and price-sensitive information. In that sense, the Code of Conduct is an elaboration on the sector-wide Code of Conduct of the Dutch Banking Association (NVB), of the Banker’s Oath, and the Corporate Governance Code, to which ASN Bank has committed itself.
The ExBo is responsible for the content, execution, and monitoring of the Code of Conduct. ASN Bank monitors if its employees’ conduct is compliant with the Code of Conduct, investigates and sanctions breaches of ethical conduct, and sees to an effective awareness campaign.
Additional rules with respect to conflicts of interest, ancillary activities and private investments apply for the members of the ExBo and Supervisory Board of ASN Bank, the management of ASN Impact Investors and the Supervisory Board of ASN Beleggingsfondsen N.V.
The Code of Conduct is published on ASN Bank’s website, so that customers, business relations and other stakeholders can hold the employees of ASN Bank accountable to their conduct.
ASN Bank does not have a dedicated anti-corruption and anti-bribery training course, nor do we distinguish specific functions at risk in respect of corruption and bribery who should be covered by training programmes on this topic. At ASN Bank, all employees, including management, ExBo and SB members, are yearly prompted to read the applicable Code of Conduct. After careful reading, employees are required to sign and confirm they are aware of the Code of Conduct and will comply with it. New employees are required to do this as well. In addition, members of the management body receive dedicated compliance training by a senior manager compliance on the Code of Conduct, which includes provisions on conflicts of interests, inside information, anti-corruption and bribery.
Appendix to the sustainability statements
ESRS content index
Our sustainability statement disclosures are based on our material topics.
The tables also show where we have placed information relating to a specific disclosure requirement that lies outside of the sustainability statements and is ‘incorporated by reference’ to other sections within this annual report.
ESRS | Disclosure requirement | Section reference Sustainability statements | Incorporation by reference | |
|---|---|---|---|---|
General disclosures | ||||
ESRS 2 | BP-1 | General basis for preparation of sustainability statements | ||
ESRS 2 | BP-2 | Disclosures in relation to specific circumstances | ||
ESRS 2 | GOV-1 20a | The composition and diversity of the administrative, management and supervisory bodies | Executive Committee - Composition and diversity | |
ESRS 2 | GOV-1:20b | The roles and responsibilities of the administrative, management and supervisory bodies in exercising oversight of the process to manage material impacts, risks and opportunities , including management’s role in these processes | ||
ESRS 2 | GOV-1:20c | The expertise and skills of its administrative, management and supervisory bodies on sustainability matters or access to such expertise and skills. | Executive Committee - Personal details | |
ESRS 2 | GOV-1:21a | The number of executive and non-executive members | Executive Committee - Personal details | |
ESRS 2 | GOV-1:21b | Representation of employees and other workers | Own workforce - employee engagement | |
ESRS 2 | GOV-1:21c | Experience relevant to the sectors, products and geographic locations of the undertaking | Executive Committee - Personal details | |
ESRS 2 | GOV-1:21d | Percentage by gender and other aspects of diversity that the undertaking considers. The board's gender diversity (shall be calculated as an average ratio of female to male board members | Executive Committee - Composition and diversity | |
ESRS 2 | GOV-1:21e | The percentage of independent board members . For undertakings with a unitary board, this corresponds to the percentage of independent non-executive board members. For undertakings with a dual board, it corresponds to the percentage of independent members of the supervisory body. | ||
ESRS 2 | GOV-1:22a | The identity of the administrative, management and supervisory bodies (such as a board committee or similar) or individual(s) within a body responsible for oversight of impacts, risks and opportunities | ||
ESRS 2 | GOV-1:22b | How each body’s or individual’s responsibilities for impacts, risks and opportunities are reflected in the undertaking’s terms of reference, board mandates and other related policies | ||
ESRS 2 | GOV-1:22c | A description of management’s role in the governance processes, controls and procedures used to monitor, manage and oversee impacts, risks and opportunities, including: i. whether that role is delegated to a specific management-level position or committee and how oversight is exercised over that position or committee, ii. information about the reporting lines to the administrative, management and supervisory bodies and iii. whether dedicated controls and procedures are applied to the management of impacts, risks and opportunities and, if so, how they are integrated with other internal functions | ||
ESRS 2 | GOV- 1:22d | How the administrative, management and supervisory bodies and senior executive management oversee the setting of targets related to material impacts, risks and opportunities, and how they monitor progress towards them. | ||
ESRS 2 | GOV-1:23a and b | (23a) The sustainability-related expertise that the bodies, as a whole, either directly possess or can leverage, for example through access to experts or training | Personal details | |
ESRS 2 | GOV-2:26a | Whether, by whom and how frequently the administrative, management and supervisory bodies, including their relevant committees, are informed about material impacts, risks and opportunities, the implementation of due diligence, and the results and effectiveness of policies, actions, metrics and targets adopted to address them; | ||
ESRS 2 | GOV-2:26b | How the administrative, management and supervisory bodies consider impacts, risks and opportunities when overseeing the undertaking’s strategy, its decisions on major transactions, and its risk management process, including whether they have considered trade-offs associated with those impacts, risks and opportunities | Double materiality assessment (paragraph: Integration of material impacts, risks and opportunities in our management process, strategy and business model) | |
ESRS 2 | GOV-2:26c | A list of the material impacts, risks and opportunities addressed by the administrative, management and supervisory bodies, or their relevant committees during the reporting period. | Sustainability governance | |
ESRS 2 | GOV-3:29a | A description of the key characteristics of the incentive schemes | ||
ESRS 2 | GOV-3:29b | Whether performance is being assessed against specific sustainability-related targets and/or impacts, and if so, which ones | ||
ESRS 2 | GOV-3:29c | Whether and how sustainability-related performance metrics are considered as performance benchmarks or included in remuneration policies | ||
ESRS 2 | GOV-3:29d | The proportion of variable remuneration dependent on sustainability-related targets and/or impacts | Introduction | |
ESRS 2 | GOV-3:29e | The level in the undertaking at which the terms of incentive schemes are approved and updated | Introduction | |
ESRS 2 | GOV-4 | Statement on due diligence | ||
ESRS 2 | GOV-5 | Risk management and internal controls over sustainability reporting | ||
ESRS 2 | SBM-1 | Strategy, business model and value chain | Strategy, business model and value chain | |
ESRS 2 | SBM-2 | Interests and views of stakeholders | ||
ESRS 2 | SBM-3 | Material impacts, risks and opportunities and their interaction with strategy and business model | Double materiality assessment | |
ESRS 2 | IRO-1 | Description of the process to identify and assess material impacts, risks and opportunities | ||
ESRS 2 | IRO-2 | Disclosure requirements in ESRS covered by the sustainability statement |
ESRS | Disclosure requirement | Section reference Sustainability statements | Incorporation by reference | |
|---|---|---|---|---|
Climate change | ||||
ESRS 2 | SBM-3 | Material impacts, risks and opportunities and their interaction with strategy and business model | Double materiality assessment | |
ESRS E1 | E1-1 | Transition plan for climate change mitigation | ||
ESRS E1 | E1-2 | Policies related to climate change mitigation and adaptation | ||
ESRS E1 | E1-3 | Actions and resources in relation to climate change policies | ||
ESRS E1 | E1-4 | Targets related to climate mitigation and adaptation | Gross Scope 1, 2, 3 and Total GHG emissions | |
ESRS E1 | E1-5 | Energy consumption and mix | Actions and resources in relation to climate change policies | |
ESRS E1 | E1-6 | Gross Scope 1, 2 and 3 and Total GHG emissions | Gross scope 1, 2, 3 and total GHG emissions | |
ESRS E1 | E1-7 | GHG removals and GHG mitigation projects financed through carbon credits |
ESRS | Disclosure requirement | Section reference Sustainability statements | Incorporation by reference | |
|---|---|---|---|---|
Own workforce | ||||
ESRS 2 | SBM-3 | Material impacts, risks and opportunities and their interaction with strategy and business model | ||
ESRS S1 | S1-1 | Policies related to own workforce | ||
ESRS S1 | S1-2 | Processes for engaging with own workforce and workers’ representatives about impacts | ||
ESRS S1 | S1-3 | Processes to remediate negative impacts and channels for own workforce to raise concerns | ||
ESRS S1 | S1-4 | Taking action on material impacts on own workforce, and approaches to managing material risks and pursuing material opportunities related to own workforce, and effectiveness of those actions | ||
ESRS S1 | S1-5 | Targets related to managing material negative impacts, advancing positive impacts, and managing material risks and opportunities | ||
ESRS S1 | S1-6 | Characteristics of the undertaking’s employees | Key characteristics of our internal employees and external (non-)employees | |
ESRS S1 | S1-7 | Characteristics of non-employees in the undertaking’s own workforce | ||
ESRS S1 | S1-8 | Collective bargaining coverage and social dialogue | ||
ESRS S1 | S1-9 | Diversity metrics | ||
ESRS S1 | S1-10 | Adequate wages | ||
ESRS S1 | S1-11 | Social protection | ||
ESRS S1 | S1-13 | Training and skills development metrics | ||
ESRS S1 | S1-14 | Health and safety metrics | ||
ESRS S1 | S1-15 | Work-life balance metrics | ||
ESRS S1 | S1-16 | Compensation metrics (pay gap and total remuneration) | ||
ESRS S1 | S1-17 | Incidents, complaints and severe human rights impacts | ||
Consumers and end-users | ||||
ESRS S4 | SBM-3 | Material impacts, risks and opportunities and their interaction with strategy and business model | ||
ESRS S4 | S4-1 | Policies related to consumers and end-users | ||
ESRS S4 | S4-2 | Processes for engaging with consumers and end-users about impacts | Process for engaging with customers and end-users about impacts | |
ESRS S4 | S4-3 | Processes to remediate negative impacts and channels for consumers and end-users to raise concerns | Process to remediate negative impacts and channels for customers and end-users to raise concerns | |
ESRS S4 | S4-4 | Taking action on material impacts on consumers and end- users, and approaches to managing material risks and pursuing material opportunities related to consumers and end-users, and effectiveness of those actions | Taking action on material impacts on customers and end-users | |
ESRS S4 | S4-5 | Targets related to managing material negative impacts, advancing positive impacts, and managing material risks and opportunities |
ESRS | Disclosure requirement | Section reference Sustainability statements | Incorporation by reference | |
|---|---|---|---|---|
Business conduct - Anti-financial crime | ||||
ESRS 2 | SBM-3 | Material impacts, risks and opportunities and their interaction with strategy and business model | ||
ESRS 2 | GOV-1 | The role of the administrative, management and supervisory bodies | ||
ESRS G1 | G1-1 | Business conduct policies and corporate culture | ||
ESRS G1 | G1-2 | Management of relationships with suppliers | Not material | |
ESRS G1 | G1-3 | Prevention and detection of corruption and bribery | ||
ESRS G1 | G1-4 | Incidents of corruption or bribery | ||
ESRS G1 | G1-5 | Political influence and lobbying activities | Not material | |
ESRS G1 | G1-6 | Payment practices | Not material | |
Entity- specific | Anti-financial crime | |||
Entity- specific | MDR-A | Anti-financial crime |
List of disclosure requirements and data points deriving from other EU-regulations
Disclosure requirement and related datapoint | SFRD reference | Pillar 3 reference | Benchmark Regulation reference | EU Climate Law reference | Material / not material | Section |
|---|---|---|---|---|---|---|
ESRS 2 GOV-1 Board's gender diversity paragraph 21 (d) | Indicator number 13 of Table #1 of Annex 1 | Commission Delegated Regulation (EU)2020/1816, Annex II | Material | |||
ESRS 2 GOV-1 Percentage of board members who are independent paragraph 21 (e) | Delegated Regulation (EU) 2020/1816, Annex II | Material | ||||
ESRS 2 GOV-4 Statement on due diligence paragraph 30 | Indicator number 10 Table #3 of Annex 1 | Material | ||||
ESRS 2 SBM-1 Involvement in activities related to fossil fuel activities paragraph 40 (d) i | Indicators number 4 Table #1 of Annex 1 | Article 449a Regulation (EU) No 575/2013; Commission Implementing Regulation (EU) 2022/2453 ( 28 ) Table 1: Qualitative information on Environmental risk and Table 2: Qualitative information on Social risk | Delegated Regulation (EU) 2020/1816, Annex II | Not applicable | ||
ESRS 2 SBM-1 Involvement in activities related to chemical production paragraph 40 (d) ii | Indicator number 9 Table #2 of Annex 1 | Delegated Regulation (EU) 2020/1816, Annex II | Not applicable | |||
ESRS 2 SBM-1 Involvement in activities related to controversial weapons paragraph 40 (d) iii | Indicator number 14 Table #1 of Annex 1 | Delegated Regulation (EU) 2020/1818 ( 29 ) , Article 12(1) Delegated Regulation (EU) 2020/1816, Annex II | Not applicable | |||
ESRS 2 SBM-1 Involvement in activities related to cultivation and production of tobacco paragraph 40 (d) iv | Delegated Regulation (EU) 2020/1818, Article 12(1) Delegated Regulation (EU) 2020/1816, Annex II | Not applicable | ||||
ESRS E1-1 Transition plan to reach climate neutrality by 2050 paragraph 14 | Regulation (EU) 2021/1119, Article 2(1) | Material | ||||
ESRS E1-1 Undertakings excluded from Paris-aligned Benchmarks paragraph 16 (g) | Article 449a Regulation (EU) No 575/2013; Commission Implementing Regulation (EU) 2022/2453 Template 1: Banking book-Climate Change transition risk: Credit quality of exposures by sector, emissions and residual maturity | Delegated Regulation (EU) 2020/1818, Article12.1 (d) to (g), and Article 12.2 | Material | Policies related to climate change mitigation and adaptation | ||
ESRS E1-4 GHG emission reduction targets paragraph 34 | Indicator number 4 Table #2 of Annex 1 | Article 449a Regulation (EU) No 575/2013; Commission Implementing Regulation (EU) 2022/2453 Template 3: Banking book – Climate change transition risk: alignment metrics | Delegated Regulation (EU) 2020/1818, Article 6 | Material | ||
ESRS E1-5 Energy consumption from fossil sources disaggregated by sources (only high climate impact sectors) paragraph 38 | Indicator number 5 Table #1 and Indicator n. 5 Table #2 of Annex 1 | Not applicable | ||||
ESRS E1-5 Energy consumption and mix paragraph 37 | Indicator number 5 Table #1 of Annex 1 | Material | ||||
ESRS E1-5 Energy intensity associated with activities in high climate impact sectors paragraphs 40 to 43 | Indicator number 6 Table #1 of Annex 1 | Not applicable | ||||
ESRS E1-6 Gross Scope 1, 2, 3 and Total GHG emissions paragraph 44 | Indicators number 1 and 2 Table #1 of Annex 1 | Article 449a; Regulation (EU) No 575/2013; Commission Implementing Regulation (EU) 2022/2453 Template 1: Banking book – Climate change transition risk: Credit quality of exposures by sector, emissions and residual maturity | Delegated Regulation (EU) 2020/1818, Article 5(1), 6 and 8(1) | Material | ||
ESRS E1-6 Gross GHG emissions intensity paragraphs 53 to 55 | Indicators number 3 Table #1 of Annex 1 | Article 449a Regulation (EU) No 575/2013; Commission Implementing Regulation (EU) 2022/2453 Template 3: Banking book – Climate change transition risk: alignment metrics | Delegated Regulation (EU) 2020/1818, Article 8(1) | Not applicable | ||
ESRS E1-7 GHG removals and carbon credits paragraph 56 | Regulation (EU) 2021/1119, Article 2(1) | Material | GHG removals and GHG mitigation projects financed through carbon credits | |||
ESRS E1-9 Exposure of the benchmark portfolio to climate-related physical risks paragraph 66 | Delegated Regulation (EU) 2020/1818, Annex II Delegated Regulation (EU) 2020/1816, Annex II | Phased in - Not disclosed | ||||
ESRS E1-9 Disaggregation of monetary amounts by acute and chronic physical risk paragraph 66 (a) ESRS E1-9 Location of significant assets at material physical risk paragraph 66 (c). | Article 449a Regulation (EU) No 575/2013; Commission Implementing Regulation (EU) 2022/2453 paragraphs 46 and 47; Template 5: Banking book - Climate change physical risk: Exposures subject to physical risk. | Phased in - Not disclosed | ||||
ESRS E1-9 Breakdown of the carrying value of its real estate assets by energy efficiency classes paragraph 67 (c). | Article 449a Regulation (EU) No 575/2013; Commission Implementing Regulation (EU) 2022/2453 paragraph 34;Template 2:Banking book -Climate change transition risk: Loans collateralised by immovable property - Energy efficiency of the collateral | Phased in - Not disclosed | ||||
ESRS E1-9 Degree of exposure of the portfolio to climate- related opportunities paragraph 69 | Delegated Regulation (EU) 2020/1818, Annex II | Phased in - Not disclosed | ||||
ESRS E2-4 Amount of each pollutant listed in Annex II of the E-PRTR Regulation (European Pollutant Release and Transfer Register) emitted to air, water and soil, paragraph 28 | Indicator number 8 Table #1 of Annex 1 Indicator number 2 Table #2 of Annex 1 Indicator number 1 Table #2 of Annex 1 Indicator number 3 Table #2 of Annex 1 | Not material | ||||
ESRS E3-1 Water and marine resources paragraph 9 | Indicator number 7 Table #2 of Annex 1 | Not material | ||||
ESRS E3-1 Dedicated policy paragraph 13 | Indicator number 8 Table 2 of Annex 1 | Not material | ||||
ESRS E3-1 Sustainable oceans and seas paragraph 14 | Indicator number 12 Table #2 of Annex 1 | Not material | ||||
ESRS E3-4 Total water recycled and reused paragraph 28 (c) | Indicator number 6.2 Table #2 of Annex 1 | Not material | ||||
SRS E3-4 Total water consumption in m 3 per net revenue on own operations paragraph 29 | Indicator number 6.1 Table #2 of Annex 1 | Not material | ||||
ESRS 2- SBM 3 - E4 paragraph 16 (a) i | Indicator number 7 Table #1 of Annex 1 | Not material | ||||
ESRS 2- SBM 3 - E4 paragraph 16 (b) | Indicator number 10 Table #2 of Annex 1 | Not material | ||||
ESRS 2- SBM 3 - E4 paragraph 16 (c) | Indicator number 14 Table #2 of Annex 1 | Not material | ||||
ESRS E4-2 Sustainable land / agriculture practices or policies paragraph 24 (b) | Indicator number 11 Table #2 of Annex 1 | Not material | ||||
ESRS E4-2 Sustainable oceans / seas practices or policies paragraph 24 (c) | Indicator number 12 Table #2 of Annex 1 | Not material | ||||
ESRS E4-2 Policies to address deforestation paragraph 24 (d) | Indicator number 15 Table #2 of Annex 1 | Not material | ||||
ESRS E5-5 Non-recycled waste paragraph 37 (d) | Indicator number 13 Table #2 of Annex 1 | Not material | ||||
ESRS E5-5 Hazardous waste and radioactive waste paragraph 39 | Indicator number 9 Table #1 of Annex 1 | Not material | ||||
ESRS 2- SBM3 - S1 Risk of incidents of forced labour paragraph 14 (f) | Indicator number 13 Table #3 of Annex I | Not material | ||||
ESRS 2- SBM3 - S1 Risk of incidents of child labour paragraph 14 (g) | Indicator number 12 Table #3 of Annex I | Not material | ||||
ESRS S1-1 Human rights policy commitments paragraph 20 | Indicator number 9 Table #3 and Indicator number 11 Table #1 of Annex I | Material | ||||
ESRS S1-1 Due diligence policies on issues addressed by the fundamental International Labor Organisation Conventions 1 to 8, paragraph 21 | Delegated Regulation (EU) 2020/1816, Annex II | Not material | ||||
ESRS S1-1 processes and measures for preventing trafficking in human beings paragraph 22 | Indicator number 11 Table #3 of Annex I | Not material | ||||
ESRS S1-1 workplace accident prevention policy or management system paragraph 23 | Indicator number 1 Table #3 of Annex I | Not material | ||||
ESRS S1-3 grievance/complaints handling mechanisms paragraph 32 (c) | Indicator number 5 Table #3 of Annex I | Material | ||||
ESRS S1-14 Number of fatalities and number and rate of work-related accidents paragraph 88 (b) and (c) | Indicator number 2 Table #3 of Annex I | Delegated Regulation (EU) 2020/1816, Annex II | Not material | |||
ESRS S1-14 Number of days lost to injuries, accidents, fatalities or illness paragraph 88 (e) | Indicator number 3 Table #3 of Annex I | Not material | ||||
ESRS S1-16 Unadjusted gender pay gap paragraph 97 (a) | Indicator number 12 Table #1 of Annex I | Delegated Regulation (EU) 2020/1816, Annex II | Material | |||
ESRS S1-16 Excessive CEO pay ratio paragraph 97 (b) | Indicator number 8 Table #3 of Annex I | Material | ||||
ESRS S1-17 Incidents of discrimination paragraph 103 (a) | Indicator number 7 Table #3 of Annex I | Material | ||||
ESRS S1-17 Non-respect of UNGPs on Business and Human Rights and OECD Guidelines paragraph 104 (a) | Indicator number 10 Table #1 and Indicator n. 14 Table #3 of Annex I | Delegated Regulation (EU) 2020/1816, Annex II Delegated Regulation (EU) 2020/1818 Art 12 (1) | Material | |||
ESRS 2- SBM3 – S2 Significant risk of child labour or forced labour in the value chain paragraph 11 (b) | Indicators number 12 and n. 13 Table #3 of Annex I | Not material | ||||
ESRS S2-1 Human rights policy commitments paragraph 17 | Indicator number 9 Table #3 and Indicator n. 11 Table #1 of Annex 1 | Not material | ||||
ESRS S2-1 Policies related to value chain workers paragraph 18 | Indicator number 11 and n. 4 Table #3 of Annex 1 | Not material | ||||
ESRS S2-1Non-respect of UNGPs on Business and Human Rights principles and OECD guidelines paragraph 19 | Indicator number 10 Table #1 of Annex 1 | Delegated Regulation (EU) 2020/1816, Annex II Delegated Regulation (EU) 2020/1818, Art 12 (1) | Not material | |||
ESRS S2-1 Due diligence policies on issues addressed by the fundamental International Labor Organisation Conventions 1 to 8, paragraph 19 | Delegated Regulation (EU) 2020/1816, Annex II | Not material | ||||
ESRS S2-4 Human rights issues and incidents connected to its upstream and downstream value chain paragraph 36 | Indicator number 14 Table #3 of Annex 1 | Not material | ||||
ESRS S3-1 Human rights policy commitments paragraph 16 | Indicator number 9 Table #3 of Annex 1 and Indicator number 11 Table #1 of Annex 1 | Not material | ||||
ESRS S3-1 non-respect of UNGPs on Business and Human Rights, ILO principles or OECD guidelines paragraph 17 | Indicator number 10 Table #1 Annex 1 | Delegated Regulation (EU) 2020/1816, Annex II Delegated Regulation (EU) 2020/1818, Art 12 (1) | Not material | |||
ESRS S3-4 Human rights issues and incidents paragraph 36 | Indicator number 14 Table #3 of Annex 1 | Not material | ||||
ESRS S4-1 Policies related to consumers and end-users paragraph 16 | Indicator number 9 Table #3 and Indicator number 11 Table #1 of Annex 1 | Material | ||||
ESRS S4-1 Non-respect of UNGPs on Business and Human Rights and OECD guidelines paragraph 17 | Indicator number 10 Table #1 of Annex 1 | Delegated Regulation (EU) 2020/1816, Annex II Delegated Regulation (EU) 2020/1818, Art 12 (1) | Material | Process to remediate negative impacts and channels for customers and end-users to raise concerns | ||
ESRS S4-4 Human rights issues and incidents paragraph 35 | Indicator number 14 Table #3 of Annex 1 | Material | Process to remediate negative impacts and channels for customers and end-users to raise concerns | |||
ESRS G1-1 United Nations Convention against Corruption paragraph 10 (b) | Indicator number 15 Table #3 of Annex 1 | Material | ||||
ESRS G1-1 Protection of whistle-blowers paragraph 10 (d) | Indicator number 6 Table #3 of Annex 1 | Material | ||||
ESRS G1-4 Fines for violation of anti-corruption and anti-bribery laws paragraph 24(a) | Indicator number 17 Table #3 of Annex 1 | Delegated Regulation (EU) 2020/1816, Annex II | Material | |||
ESRS G1-4 Standards of anti-corruption and anti-bribery paragraph 24 (b) | Indicator number 16 Table #3 of Annex 1 | Material |
Methodology own operations and upstream and downstream emissions
Scope 1, 2 and 3 are calculated in accordance with the Greenhouse Gas Protocol ‘Corporate Value Chain Standard’. The GHG protocol offers guidance to identify and report on relevant emission categories. In our GHG accounting and reporting, we follow the principles of relevance, completeness, consistency, transparency and accuracy.
The organisational boundary determines which operations and subsidiaries are included in the bank’s carbon accounting. We include emissions within our organisational boundaries covering our own operations, upstream and downstream activities. This includes the following entities: ASN Bank and its subsidiaries, such as ASN Impact investors (without the scope 3 financed emission) and Fitrex.
The consolidation approach determines which emissions are categorised as direct and indirect emissions within the organisational boundaries, which affects under which scopes certain emissions are reported. We apply operational control as our consolidation approach, which means that the activities leading to emissions over which ASN Bank has direct control over, are part of scope 1 and scope 2. All other emissions are considered to be part of the value chain, thus Scope 3. We chose this approach, because we deem ourselves responsible for the emissions caused by our own activities.
We include the emissions from scope 1 and 2 and scope 3 categories 1, 5, 6, 7, 13 and 14. We include Cloud service separately in Category 1 and Category 14: Franchises for the first time. Category 15 is included in our scope, the methodology is explained in Appendix Methodology financed emissions.
We exclude scope 3 categories in our calculations when they are not relevant or material to ASN Bank or when emission data is considered sufficiently reliable, influenceable, significant and quantifiable. The following categories are excluded:
Category 2: Capital goods is excluded as our capital goods are considered in category 1: Purchased goods and services.
Category 3: Fuel and energy-related activities is excluded as we disclose these emissions in scope 1 and 2.
Category 4: Upstream transport and distribution is excluded as our financial services do not require transportation or distribution.
Category 8: Upstream leased assets is excluded as the emissions of our leased vehicles are included in scope 1.
Category 9: Downstream transportation is excluded as we outsource transportation to a post-service company, we included these emissions in category 1: Purchased goods and services.
Category 10: Processing of sold products is not applicable since we do not sell physical products.
Category 11: Use of sold products is not applicable since we do not sell physical products.
Category 12: End-of-life treatment of sold products is not applicable since we do not sell physical products
All seven greenhouse gases under the Kyoto protocol are considered and expressed in CO2 equivalents using the 100-year time horizon global warming potentials determined by the Intergovernmental Panel on Climate Change (IPCC). To align with the methodology as stated in the ESRS we adjusted the emission factors for our market-based and location-based emissions in scope 2.
We apply the GHG protocol to calculate our scope 1, 2 and 3 emissions. Depending on data availability we applied the activity-based or spend-based approach to calculate the emissions. We multiply the activity-based or spend-based data with the corresponding emissions factor of the activity.
Scope 1: Direct GHG emissions are calculated using activity-specific data for natural gas use and fuel-use for company-controlled vehicles.
Scope 2: Indirect GHG emissions are calculated with both the market-based and the location-based emissions factors for electricity. Location-based emissions are average country-based emissions, while market-based emissions include renewable electricity, and regular electricity is regarded as residual energy. We have adopted a conservative approach to market-based emissions.
For district heating we apply grid-specific emission factors in the market-based approach.
Scope 3 Category 1: Purchased goods and services is calculated using a hybrid method, combing supplier specific data with average data and supplemented with spend-based data. We calculate the emissions from our IT and cloud services.
Scope 3 Category 5: Waste generated in own operations is calculated using supplier-specific and waste-type specific data. This is provided by the bank’s external waste management partner.
Scope 3 Category 6: Business travel is calculated using the distance-based method. We consider distance travelled and the mode of transport. When distance-based data was unavailable, we include spend-based data.
Scope 3 Category 7: Employee commuting is calculated using the distance-based method. We consider distance travelled and the mode of transport.
Scope 3 Category 13: Downstream leased assets is calculated with the leased floor space and the scope 1 and market-based scope 2 emissions from our own offices.
Scope 3 Category 14: Franchises is calculated by considering the scope 1 and the market-based scope 2 emissions from our franchises and an average attribution factor related to the revenue of ASN Bank products.
Scope 3 Category 15: Investments is calculated in accordance with PCAF global GHG Accounting and Reporting Standard. For details see Appendix Methodology financed emissions.
We use CO2emissiefactoren.nl for the emission factors of energy and transport in Scope 1, 2 and the Scope 3 categories 6, 7, 13 and 14. In Scope 3, category 1 we used annual reports from our suppliers to determine the emission factor based on revenue and their scope 1, 2 and 3 emissions. In Scope 3, category 5 we used the emission factors provided by our waste service provider.
We collaborate with energy providers to collect data and apply conversion factors when necessary.
Assumptions, limitations and approximations in our own operations emissions calculations increase to measurement uncertainty. To mitigate the uncertainty we include primary data where possible. In addition, we prefer activity-based data over spend-based data. Spend-based data is less accurate as it considers monetary value, which is subject to inflation and price differences – either over time or between suppliers – and the emission factors are a sector average. In the case that data was unavailable (<5%) for a category, an extrapolation of the existing data was made. We assume that the emission intensity is comparable to the available data.
In our scope 1 calculations, the electricity required to charge company vehicles at home is also covered by renewable energy contracts through our company policy, which mandates that employees with company lease car, to charge their car with renewable electricity at home. Following the principles of the GHG protocol, our location-based scope 2 emissions are not influenced by contractual instruments.
For our market-based scope 2 emissions we use renewable energy certificates as contractual instruments to ensure that we do not emit greenhouse gases of our electricity use. 100% of these instruments imply that the electricity is generated using renewable energy sources. Of which 12% is bundled with a renewable energy contract of Dutch wind or solar energy and 88% are purchased with an unbundled renewable energy certificate for European wind or solar energy.
Data is considered primary data when input from specific activities within the entity’s upstream and downstream value chain are included in the activity data or from the reported emissions from our business partners. In our scope 3 calculations, 15% of the emissions are calculated with primary data. Increasing the level primary data, improves the level of accuracy of the calculation.
In our scope 3 emission calculations, we used where possible, emission data from the 2024 annual reports of companies in our value chain. When the annual reports of our counterparties could not provide the necessary information, we opted for emission data based on macroeconomic key figures and sectoral emission data. In 2023 the effects of the energy crisis, caused by the war in Ukraine, might have had a diminishing effect on energy use and, consequently the emissions of the companies in our value chain. The same applies to the 2023 emission calculations, where 2022 emission data was used, while there were still Covid-19-related measures in place leading to lower scope 1 and 2 emissions.
Methodology financed emissions
The GHG Protocol ‘Corporate Value Chain Standard’ offers guidance to identify and report on emissions from relevant loans. These include emissions from loans and investments reported under scope 3, category 15: Investments, which is the banks’ most material category to take into account. We report on our GHG emissions in our annual reports in conjunction with our full-year financial results.
Emissions from all relevant balance sheet items of ASN Bank are included. Cash and balances at central banks do not lead to changes in the real economy because they are temporary balances and are left out of scope. Derivatives are also out of scope to avoid double counting. Tax assets, and ‘other assets’ do not cause GHG emissions and are therefore set at zero emissions. Tangible and intangible assets are already taken into account in the emission calculations of the business operations. Consumer loans are not yet incorporated in the calculation as the amount of loans is negligible. The financed emissions from our asset manager ASN II are not included. The rest of the accounting balance sheet is taken into account. The CO2e emission calculations are performed in accordance with the GHG Protocol's operational control approach. In our GHG accounting and reporting, we follow the principles of relevance, completeness, consistency, transparency and accuracy. Furthermore, financed emissions are always accounted for with the prudence principle in mind.
All seven greenhouse gases under the Kyoto protocol are taken into account and expressed in CO2 equivalents using the 100-year time horizon global warming potentials determined by the Intergovernmental Panel on Climate Change (IPCC). We disclose the financed scope 1, 2 and 3 emissions of all our relevant loans and investments. Financed carbon removals are calculated and reported separately from financed emissions. For the mortgage portfolio, we also report on the energy efficiency rating distribution based on the latest available registered energy efficiency ratings (Rijksdienst Voor Ondernemend Nederland, RVO).
For new loans and green bonds the most recent emissions data is used. Emission factors and data sources used for the calculations are updated annually in the fourth quarter to ensure we use recent data in our calculations. Our Sustainability team collects emission data and financial data from investees and prepares financed emissions calculations on a monthly basis. The results are discussed and approved by the ESG Impact Committee on a quarterly basis. The results are also processed in relevant management and risk reports.
In 2022 PCAF published the global GHG Accounting and Reporting Standard. We apply this version of the methodology for the financed emissions in relation to our net zero KPI in our scope 3, category 15: Investments. The methodology is validated by an external body. In 2025 PCAF published a new version of their standard. We will adopt that version coming reporting year.
For each of the asset classes, we apply the corresponding data quality scores of the PCAF methodology. The weighted average data quality score for all assets was calculated at 2.7 (1 = highest data quality; 5 = lowest data quality). We continually strive to increase the data quality of the data in our calculations, as it increases the accuracy of our calculations and reduces the measurement uncertainty. In 2024, we updated the anonymised energy consumption data of the customers in our mortgage portfolio. In order to do so, we clustered the mortgage portfolio of our four brands, definitive or preliminary energy efficiency rating, and the EPC score (A++++ to G). The grid operators linked gas- and electricity consumption to the portfolio and returned the results aggregated on cluster level. As such, characteristics like the presence of a preliminary energy efficiency rating are only used to cluster and not directly for carbon accounting purposes.
For the asset class-specific considerations, description of data sources used in our calculations and the data quality score (DQS), see the table below.
There is measurement uncertainty as data sources are subject to change during or after the reporting period.
Asset class | Chapter in PCAF global GHG standard (2022) | Considerations on attribution | Data sources used in calculations | PCAF DQS |
|---|---|---|---|---|
Unlisted Equity | 5.2. Business loans and unlisted equity | Attribution based on book value | Annual and sustainability reports of counterparties. When unavailable, we apply emission factors based on sector averages. | 2.6 |
Sovereign bonds | 5.7 Sovereign debt | Attribution based on outstanding nominal amount | Emissions are calculated based on the PCAF web-based emission factors database for sovereign bonds. We use consumption based emissions including LULUCF1. | 1.6 |
Corporate bonds | 5.1. Listed equity and Corporate bonds | Attribution based on outstanding nominal amount | Reported emissions derived from annual or sustainability reports. When unavailable, we use sector averages emission factors. In the case of earmarked bonds, for example in the case of green bonds, reported emissions or carbon removals are used. | 3.2 |
Retail mortgages | 5.5. Mortgages | Attribution based on Loan to Value at origination. | Emissions are calculated based on standardised annual gas and electricity consumption data as per reference date 1-1-2025. This anonymised data is retrieved from Partners in Energie and is applicable to our entire residential mortgage portfolio. The gas and electricity use is converted to CO2-equivalents using the Tank-to-Wheel value for natural gas from co2emissiefactoren.nl (updated in December 2024), and the emission factor for electricity in 2024, as calculated by the Dutch statistics agency (CBS) using the integral method. | 3.2 |
Business mortgages | 5.5. Mortgages | Attribution based on market value | Emissions are calculated based on the PCAF web-based emission factors database with Dutch emission factors per sector based on asset value (db.carbonaccountingfinancials.com). | 5.0 |
Business loans | 5.2. Business loans and unlisted equity | Attribution based on book value | Klimaatmonitor Waterschappen (2024), Regionale klimaatmonitor Rijksoverheid (2024), AEDES benchmark (2022), annual and sustainability reports of counterparties. When data was unavailable, we apply the PCAF web-based emission factor database with the Dutch emission factors per sector based on asset value (db.carbonaccountingfinancials.com). | 4.4 |
Project finance | 5.3. Project finance | Attribution based on book value | Ex-ante estimates of emissions based on P90 energy generation values from due diligence reports. In some cases, we use actual annual energy production data. | 2.9 |
- Land Use, Land-use Change and Forestry
EU Taxonomy tables
Disclosure 31-12-2025 (stock) | |||||||||||||||||
|---|---|---|---|---|---|---|---|---|---|---|---|---|---|---|---|---|---|
Million EUR | a | b | c | d | e | f | g | h | i | j | k | l | m | n | o | p | |
Total [gross] carrying amount | Of which Taxonomy-eligible | Of which Taxonomy-aligned | Non-assessed | ||||||||||||||
Breakdown per environmental objective | Of which Use of Proceeds | Of which transitional | Of which enabling | Of which financing | Of which exposures | Of which not assessed | |||||||||||
Climate Change Mitigation (CCM) | Climate Change Adaptation (CCA) | Water and marine resources (WTR) | Circular economy (CE) | Pollution (PPC) | Biodiversity and Ecosystems (BIO) | ||||||||||||
1 | GAR - Covered assets in both numerator and denominator | 60,094 | 58,588 | 11,578 | 11,578 | - | - | - | - | - | 11,435 | 22 | 29 | 40 | - | - | 40 |
2 | Loans and advances, debt securities and equity instruments not HfT eligible for GAR calculation | 60,094 | 58,588 | 11,578 | 11,578 | - | - | - | - | - | 11,435 | 22 | 29 | 40 | - | - | 40 |
3 | Financial undertakings | 2,913 | 1,553 | 364 | 364 | - | - | - | - | - | 310 | 2 | 1 | - | - | - | - |
4 | Loans and advances | 986 | 337 | 26 | 26 | - | - | - | - | - | 1 | 1 | - | - | - | - | - |
5 | Debt securities, including UoP | 1,927 | 1,216 | 338 | 338 | - | - | - | - | - | 309 | 1 | 1 | - | - | - | - |
6 | Equity instruments | 0 | - | - | - | - | - | - | - | - | - | - | - | - | - | - | |
7 | Non-financial undertakings | 565 | 419 | 226 | 226 | - | - | - | - | - | 137 | 20 | 28 | - | - | - | |
8 | Loans and advances | - | - | - | - | - | - | - | - | - | - | - | - | - | - | - | |
9 | Debt securities, including UoP | 565 | 419 | 226 | 226 | - | - | - | - | - | 137 | 20 | 28 | - | - | - | |
10 | Equity instruments | - | - | - | - | - | - | - | - | - | - | - | - | - | - | ||
11 | Households | 56,616 | 56,616 | 10,988 | 10,988 | - | - | 10,988 | - | - | 40 | - | 40 | ||||
12 | of which loans collateralised by residential immovable property | 56,576 | 56,576 | 10,988 | 10,988 | - | - | 10,988 | - | - | - | - | - | ||||
13 | of which building renovation loans | 16 | 16 | - | - | - | - | - | - | - | 16 | - | 16 | ||||
14 | of which motor vehicle loans | 24 | 24 | - | - | - | - | - | 24 | - | 24 | ||||||
15 | Local governments financing | - | - | - | - | - | - | - | - | - | - | - | - | - | - | - | |
16 | Housing financing | - | - | - | - | - | - | - | - | - | - | - | - | ||||
17 | Other local government financing | - | - | - | - | - | - | - | - | - | - | - | - | - | - | - | |
18 | Collateral obtained by taking possession: residential and commercial immovable properties | - | - | - | - | - | - | - | - | - | - | - | - | ||||
19 | Exposures included on a voluntary basis | - | - | - | - | - | - | - | - | - | - | - | |||||
20 | Total GAR assets | 60,094 | 40 | - | - | 40 | |||||||||||
21 | Assets not covered for GAR calculation | 16,744 | |||||||||||||||
22 | Central governments and Supranational issuers | 4,694 | |||||||||||||||
23 | Central banks exposure | 1,677 | |||||||||||||||
24 | Trading book | 243 | |||||||||||||||
25 | Undertakings and entities not subject to CSRD | 8,988 | |||||||||||||||
26 | SMEs and NFCs (other than SMEs) not subject to CSRD disclosure obligations | 3,147 | |||||||||||||||
27 | Loans and advances | 2,607 | |||||||||||||||
28 | - of which loans collateralised by commercial immovable property | 771 | |||||||||||||||
29 | - of which building renovation loans | - | |||||||||||||||
30 | Debt securities | 537 | |||||||||||||||
31 | Equity instruments | 3 | |||||||||||||||
32 | Non-EU country counterparties not subject to CSRD disclosure obligations | 5,841 | |||||||||||||||
33 | Loans and advances | 5,515 | |||||||||||||||
34 | Debt securities | 314 | |||||||||||||||
35 | Equity instruments | 12 | |||||||||||||||
36 | Derivatives | 12 | |||||||||||||||
37 | On demand interbank loans | 42 | |||||||||||||||
38 | Cash and cash-related assets | - | |||||||||||||||
39 | Other assets (e.g. Goodwill, commodities etc.) | 1,088 | |||||||||||||||
40 | Total assets | 76,838 | |||||||||||||||
Off-balance sheet exposures - Undertakings subject to NFRD disclosure obligations | |||||||||||||||||
41 | Financial guarantees | ||||||||||||||||
42 | Assets under management | 808 | 423 | 92 | 91 | 1 | - | 1 | - | - | 9 | 0 | 71 | - | - | - | - |
43 | of which debt securities | 148 | 97 | 9 | 9 | - | - | - | - | - | 9 | - | 5 | - | - | - | - |
44 | of which equity instruments | 661 | 326 | 83 | 81 | 1 | - | 1 | - | - | - | 0 | 65 | - | - | - | - |
Disclosure 31-12-2025 (flow) | |||||||||||||||||
|---|---|---|---|---|---|---|---|---|---|---|---|---|---|---|---|---|---|
Million EUR | a | b | c | d | e | f | g | h | i | j | k | l | m | n | o | p | |
Total [gross] carrying amount | Of which Taxonomy-eligible | Of which Taxonomy-aligned | Non-assessed | ||||||||||||||
Breakdown per environmental objective | Of which Use of Proceeds | Of which transitional | Of which enabling | Of which financing | Of which exposures | Of which not assessed | |||||||||||
Climate Change Mitigation (CCM) | Climate Change Adaptation (CCA) | Water and marine resources (WTR) | Circular economy (CE) | Pollution (PPC) | Biodiversity and Ecosystems (BIO) | ||||||||||||
1 | GAR - Covered assets in both numerator and denominator | 10,409 | 9,591 | 2,298 | 2,298 | - | - | - | - | - | 2,230 | 6 | 0 | 23 | - | - | 23 |
2 | Loans and advances, debt securities and equity instruments not HfT eligible for GAR calculation | 10,409 | 9,591 | 2,298 | 2,298 | - | - | - | - | - | 2,230 | 6 | 0 | 23 | - | - | 23 |
3 | Financial undertakings | 1,268 | 461 | 51 | 51 | - | - | - | - | - | 16 | 6 | - | - | - | - | - |
4 | Loans and advances | 960 | 329 | 24 | 24 | - | - | - | - | - | 1 | 1 | - | - | - | - | - |
5 | Debt securities, including UoP | 308 | 132 | 27 | 27 | - | - | - | - | - | 15 | 5 | 0 | - | - | - | - |
6 | Equity instruments | - | - | - | - | - | - | - | - | - | - | - | - | - | - | - | |
7 | Non-financial undertakings | 111 | 100 | 65 | 65 | - | - | - | - | - | 32 | - | - | - | - | - | |
8 | Loans and advances | - | - | - | - | - | - | - | - | - | - | - | - | - | - | - | |
9 | Debt securities, including UoP | 111 | 100 | 65 | 65 | - | - | - | - | - | 32 | - | - | - | - | - | |
10 | Equity instruments | - | - | - | - | - | - | - | - | - | - | - | - | - | - | ||
11 | Households | 9,030 | 9,030 | 2,182 | 2,182 | - | - | 2,182 | - | - | 23 | - | 23 | ||||
12 | of which loans collateralised by residential immovable property | 9,007 | 9,007 | 2,182 | 2,182 | - | - | 2,182 | - | - | - | - | - | ||||
13 | of which building renovation loans | 9 | 9 | - | - | - | - | - | - | - | 9 | - | 9 | ||||
14 | of which motor vehicle loans | 14 | 14 | - | - | - | - | - | 14 | - | 14 | ||||||
15 | Local governments financing | - | - | - | - | - | - | - | - | - | - | - | - | - | - | - | |
16 | Housing financing | - | - | - | - | - | - | - | - | - | - | - | - | ||||
17 | Other local government financing | - | - | - | - | - | - | - | - | - | - | - | - | - | - | - | |
18 | Collateral obtained by taking possession: residential and commercial immovable properties | - | - | - | - | - | - | - | - | - | - | - | - | ||||
19 | Exposures included on a voluntary basis | - | - | - | - | - | - | - | - | - | - | - | |||||
20 | Total GAR assets | 10,409 | 23 | - | - | 23 | |||||||||||
21 | Assets not covered for GAR calculation | 7,191 | |||||||||||||||
22 | Central governments and Supranational issuers | 1,476 | |||||||||||||||
23 | Central banks exposure | - | |||||||||||||||
24 | Trading book | - | |||||||||||||||
25 | Undertakings and entities not subject to CSRD | 5,558 | |||||||||||||||
26 | SMEs and NFCs (other than SMEs) not subject to CSRD disclosure obligations | 523 | |||||||||||||||
27 | Loans and advances | 404 | |||||||||||||||
28 | - of which loans collateralised by commercial immovable property | 166 | |||||||||||||||
29 | - of which building renovation loans | - | |||||||||||||||
30 | Debt securities | 119 | |||||||||||||||
31 | Equity instruments | - | |||||||||||||||
32 | Non-EU country counterparties not subject to CSRD disclosure obligations | 5,035 | |||||||||||||||
33 | Loans and advances | 5,035 | |||||||||||||||
34 | Debt securities | - | |||||||||||||||
35 | Equity instruments | - | |||||||||||||||
36 | Derivatives | - | |||||||||||||||
37 | On demand interbank loans | - | |||||||||||||||
38 | Cash and cash-related assets | - | |||||||||||||||
39 | Other assets (e.g. Goodwill, commodities etc.) | 157 | |||||||||||||||
40 | Total assets | 17,600 | |||||||||||||||
Off-balance sheet exposures - Undertakings subject to NFRD disclosure obligations | |||||||||||||||||
41 | Financial guarantees | ||||||||||||||||
42 | Assets under management | 289 | 152 | 27 | 27 | 0 | - | - | - | - | - | 0 | 21 | - | - | - | - |
43 | of which debt securities | 80 | 40 | - | - | - | - | - | - | - | - | - | - | - | - | - | - |
44 | of which equity instruments | 208 | 112 | 27 | 27 | 0 | - | - | - | - | - | 0 | 21 | - | - | - | - |
Disclosure 31-12-2025 | ||||||||||
|---|---|---|---|---|---|---|---|---|---|---|
a | b | c | d | e | f | g | h | i | j | |
Breakdown by sector - NACE 4 digits level (code and label) in Million EUR | Total [Gross] carrying amount | Of which Taxanomy eligible | Of which Taxanomy aligned | Climate Change Mitigation (CCM) | Climate Change Adaptation (CCA) | Water and marine resources (WTR) | Circular economy (CE) | Pollution (PPC) | Biodiversity and Ecosystems (BIO) | |
1 | 35.13 - Distribution of electricity | 185 | 185 | 120 | 120 | - | - | - | - | - |
2 | 49.39 - Other passenger land transport n.e.c. | 86 | 86 | 62 | 62 | - | - | - | - | - |
3 | 46.43 - Wholesale of electrical household appliances | 83 | 30 | - | - | - | - | - | - | - |
4 | 68.10 - Buying and selling of own real estate | 46 | 37 | 8 | 8 | - | - | - | - | - |
5 | 58.11 - Book publishing | 35 | 3 | - | - | - | - | - | - | - |
6 | 43.99 - Other specialised construction activities n.e.c. | 28 | 27 | 21 | 21 | - | - | - | - | - |
7 | 52.29 - Other transportation support activities | 24 | 19 | 12 | 12 | - | - | - | - | - |
8 | 27.90 - Manufacture of other electrical equipment | 21 | 17 | 3 | 3 | - | - | - | - | - |
9 | 61.10 -Wired telecommunications activities | 21 | - | - | - | - | - | - | - | - |
10 | 20.59 - Manufacture of other chemical products n.e.c. (not elsewhere classified) | 17 | 1 | - | - | - | - | - | - | - |
11 | Nuclear activities | - | - | - | ||||||
12 | Fossil gas activities | - | - | - | ||||||
13 | Of which non-assessed exposures | - |
Disclosure 31-12-2025 | ||||||||||||||
|---|---|---|---|---|---|---|---|---|---|---|---|---|---|---|
% (compared to corresponding total covered assets in the denominator) | a | b | c | d | e | f | g | h | i | j | k | l | m | |
Taxonomy-eligible | Taxonomy-aligned | Proportion of Taxonomy aligned in Taxonomy eligible | Non-assessed exposures | |||||||||||
Breakdown per environmental objective | Of which Use of Proceeds | Of which transitional | Of which enabling | |||||||||||
Climate Change Mitigation (CCM) | Climate Change Adaptation (CCA) | Water and marine resources (WTR) | Circular economy (CE) | Pollution (PPC) | Biodiversity and Ecosystems (BIO) | |||||||||
1 | GAR - Covered assets in both numerator and denominator | 97.49 | 19.27 | 19.27 | - | - | - | - | - | 19.03 | 0.04 | 0.05 | 19.76 | 0.07 |
2 | Loans and advances, debt securities and equity instruments not HfT eligible for GAR calculation | 97.49 | 19.27 | 19.27 | - | - | - | - | - | 19.03 | 0.04 | 0.05 | 19.76 | 0.07 |
3 | Financial undertakings | 53.33 | 12.49 | 12.49 | - | - | - | - | - | 10.61 | 0.06 | 0.02 | 23.41 | - |
4 | Loans and advances | 34.20 | 2.63 | 2.63 | - | - | - | - | - | 0.11 | 0.11 | - | 7.70 | - |
5 | Debt securities, including UoP | 63.11 | 17.52 | 17.52 | - | - | - | - | - | 15.98 | 0.03 | 0.03 | 27.77 | - |
6 | Equity instruments | - | - | - | - | - | - | - | - | - | - | - | - | |
7 | Non-financial undertakings | 74.13 | 39.99 | 39.99 | - | - | - | - | - | 24.27 | 3.55 | 4.93 | 53.95 | - |
8 | Loans and advances | - | - | - | - | - | - | - | - | - | - | - | - | - |
9 | Debt securities, including UoP | 74.13 | 39.99 | 39.99 | - | - | - | - | - | 24.27 | 3.55 | 4.93 | 53.95 | - |
10 | Equity instruments | - | - | - | - | - | - | - | - | - | - | - | - | |
11 | Households | 100 | 19.41 | 19.41 | - | - | 19.41 | - | - | 19.41 | 0.07 | |||
12 | of which loans collateralised by residential immovable property | 100 | 19.42 | 19.42 | - | - | 19.42 | - | - | 19.42 | - | |||
13 | of which building renovation loans | 100 | - | - | - | - | - | - | - | - | 100 | |||
14 | of which motor vehicle loans | 100 | - | - | - | - | - | - | 100 | |||||
15 | Local governments financing | - | - | - | - | - | - | - | - | - | - | - | - | - |
16 | Housing financing | - | - | - | - | - | - | - | - | - | - | |||
17 | Other local government financing | - | - | - | - | - | - | - | - | - | - | - | - | - |
18 | Collateral obtained by taking possession: residential and commercial immovable properties | - | - | - | - | - | - | - | - | - | - | |||
19 | Exposures included on a voluntary basis | - | - | - | - | - | - | - | - | - | ||||
20 | GAR - Total GAR Assets | 97.49 | 19.27 | 19.27 | - | - | - | - | - | 19.03 | 0.04 | 0.05 | 19.76 | 0.07 |
Disclosure 31-12-2025 | ||||||||||||||
|---|---|---|---|---|---|---|---|---|---|---|---|---|---|---|
% (compared to corresponding total covered assets in the denominator) | a | b | c | d | e | f | g | h | i | j | k | l | m | |
Taxonomy-eligible | Taxonomy-aligned | Proportion of Taxonomy aligned in Taxonomy eligible | Non-assessed exposures | |||||||||||
Breakdown per environmental objective | Of which Use of Proceeds | Of which transitional | Of which enabling | |||||||||||
Climate Change Mitigation (CCM) | Climate Change Adaptation (CCA) | Water and marine resources (WTR) | Circular economy (CE) | Pollution (PPC) | Biodiversity and Ecosystems (BIO) | |||||||||
1 | GAR - Covered assets in both numerator and denominator | 92.14 | 22.08 | 22.08 | - | - | - | - | - | 21.43 | 0.05 | - | 23.96 | 0.22 |
2 | Loans and advances, debt securities and equity instruments not HfT eligible for GAR calculation | 92.14 | 22.08 | 22.08 | - | - | - | - | - | 21.43 | 0.05 | - | 23.96 | 0.22 |
3 | Financial undertakings | 36.35 | 4.10 | 4.10 | - | - | - | - | - | 1.31 | 0.44 | 0.01 | 11.28 | - |
4 | Loans and advances | 34.22 | 2.63 | 2.63 | - | - | - | - | - | 0.07 | 0.11 | - | 7.68 | - |
5 | Debt securities, including UoP | 42.98 | 8.69 | 8.69 | - | - | - | - | - | 5.17 | 1.47 | 0.05 | 20.23 | - |
6 | Equity instruments | - | - | - | - | - | - | - | - | - | - | - | - | |
7 | Non-financial undertakings | 90.52 | 58.36 | 58.36 | - | - | - | - | - | 28.97 | - | - | 64.47 | - |
8 | Loans and advances | - | - | - | - | - | - | - | - | - | - | - | - | - |
9 | Debt securities, including UoP | 90.52 | 58.36 | 58.36 | - | - | - | - | - | 28.97 | - | - | 64.47 | - |
10 | Equity instruments | - | - | - | - | - | - | - | - | - | - | - | - | |
11 | Households | 100 | 24.16 | 24.16 | - | - | 24.16 | - | - | 24.16 | 0.25 | |||
12 | of which loans collateralised by residential immovable property | 100 | 24.22 | 24.22 | - | - | 24.22 | - | - | 24.22 | - | |||
13 | of which building renovation loans | 100 | - | - | - | - | - | - | - | - | 100 | |||
14 | of which motor vehicle loans | 100 | - | - | - | - | - | - | 100 | |||||
15 | Local governments financing | - | - | - | - | - | - | - | - | - | - | - | - | - |
16 | Housing financing | - | - | - | - | - | - | - | - | - | - | - | - | - |
17 | Other local government financing | - | - | - | - | - | - | - | - | - | - | - | - | - |
18 | Collateral obtained by taking possession: residential and commercial immovable properties | - | - | - | - | - | - | - | - | - | - | |||
19 | Exposures included on a voluntary basis | - | - | - | - | - | - | - | - | - | - | |||
20 | GAR - Total GAR Assets | 92.14 | 22.08 | 22.08 | - | - | - | - | - | 21.43 | 0.05 | - | 23.96 | 0.22 |
Disclosure 31-12-2025 | |||||||||||||
|---|---|---|---|---|---|---|---|---|---|---|---|---|---|
% (compared to corresponding total off-balance sheet assets) | a | b | c | d | e | f | g | h | i | j | k | l | |
Taxonomy-eligible | Taxonomy-aligned | Non-assessed | |||||||||||
Breakdown per environmental objective | Of which Use of Proceeds | Of which transitional | Of which enabling | ||||||||||
Climate Change Mitigation (CCM) | Climate Change Adaptation (CCA) | Water and marine resources (WTR) | Circular economy (CE) | Pollution (PPC) | Biodiversity and Ecosystems (BIO) | ||||||||
1 | Financial guarantees (FinGuar KPI) | ||||||||||||
2 | Assets under management (AuM KPI) | 52.33 | 11.38 | 11.23 | 0.08 | - | 0.07 | - | - | 1.15 | 0.04 | 8.76 | - |
Disclosure 31-12-2025 | |||||||||||||
|---|---|---|---|---|---|---|---|---|---|---|---|---|---|
% (compared to corresponding total off-balance sheet assets) | a | b | c | d | e | f | g | h | i | j | k | l | |
Taxonomy-eligible | Taxonomy-aligned | Non-assessed | |||||||||||
Breakdown per environmental objective | Of which Use of Proceeds | Of which transitional | Of which enabling | ||||||||||
Climate Change Mitigation (CCM) | Climate Change Adaptation (CCA) | Water and marine resources (WTR) | Circular economy (CE) | Pollution (PPC) | Biodiversity and Ecosystems (BIO) | ||||||||
1 | Financial guarantees (FinGuar KPI) | ||||||||||||
2 | Assets under management (AuM KPI) | 52.70 | 9.27 | 9.20 | 0.02 | - | 0.05 | - | - | 0.00 | 0.00 | 7.40 | - |
Disclosure 31-12-2025 (stock) | |||||||||||||||||
|---|---|---|---|---|---|---|---|---|---|---|---|---|---|---|---|---|---|
Million EUR | a | b | c | d | e | f | g | h | i | j | k | l | m | n | o | p | |
Total [gross] carrying amount | Of which Taxonomy-eligible | Of which Taxonomy-aligned | Non-assessed | ||||||||||||||
Breakdown per environmental objective | Of which Use of Proceeds | Of which transitional | Of which enabling | Of which financing | Of which exposures | Of which not assessed | |||||||||||
Climate Change Mitigation (CCM) | Climate Change Adaptation (CCA) | Water and marine resources (WTR) | Circular economy (CE) | Pollution (PPC) | Biodiversity and Ecosystems (BIO) | ||||||||||||
1 | GAR - Covered assets in both numerator and denominator | 60,094 | 58,473 | 11,595 | 11,595 | - | - | - | - | - | 11,446 | 6 | 42 | 40 | - | - | 40 |
2 | Loans and advances, debt securities and equity instruments not HfT eligible for GAR calculation | 60,094 | 58,474 | 11,595 | 11,595 | - | - | - | - | - | 11,446 | 6 | 42 | 40 | - | - | 40 |
3 | Financial undertakings | 2,913 | 1,428 | 372 | 372 | - | - | - | - | - | 321 | 1 | 1 | - | - | - | - |
4 | Loans and advances | 986 | 324 | 26 | 26 | - | - | - | - | - | 0 | 1 | - | - | - | - | - |
5 | Debt securities, including UoP | 1,927 | 1,104 | 346 | 346 | - | - | - | - | - | 321 | 0 | 1 | - | - | - | - |
6 | Equity instruments | 0 | - | - | - | - | - | - | - | - | - | - | - | - | - | - | |
7 | Non-financial undertakings | 565 | 429 | 235 | 235 | - | - | - | - | - | 137 | 5 | 41 | - | - | - | |
8 | Loans and advances | - | - | - | - | - | - | - | - | - | - | - | - | - | - | - | |
9 | Debt securities, including UoP | 565 | 429 | 235 | 235 | - | - | - | - | - | 137 | 5 | 41 | - | - | - | |
10 | Equity instruments | - | - | - | - | - | - | - | - | - | - | - | - | - | - | ||
11 | Households | 56,616 | 56,616 | 10,988 | 10,988 | - | - | 10,988 | - | - | 40 | - | 40 | ||||
12 | of which loans collateralised by residential immovable property | 56,576 | 56,576 | 10,988 | 10,988 | - | - | 10,988 | - | - | - | - | - | ||||
13 | of which building renovation loans | 16 | 16 | - | - | - | - | - | - | - | 16 | - | 16 | ||||
14 | of which motor vehicle loans | 24 | 24 | - | - | - | - | - | 24 | - | 24 | ||||||
15 | Local governments financing | - | - | - | - | - | - | - | - | - | - | - | - | - | - | - | |
16 | Housing financing | - | - | - | - | - | - | - | - | - | - | - | - | ||||
17 | Other local government financing | - | - | - | - | - | - | - | - | - | - | - | - | - | - | - | |
18 | Collateral obtained by taking possession: residential and commercial immovable properties | - | - | - | - | - | - | - | - | - | - | - | - | ||||
19 | Exposures included on a voluntary basis | - | - | - | - | - | - | - | - | - | - | - | |||||
20 | Total GAR assets | 60,094 | 40 | - | - | 40 | |||||||||||
21 | Assets not covered for GAR calculation | 16,744 | |||||||||||||||
22 | Central governments and Supranational issuers | 4,694 | |||||||||||||||
23 | Central banks exposure | 1,677 | |||||||||||||||
24 | Trading book | 243 | |||||||||||||||
25 | Undertakings and entities not subject to CSRD | 8,988 | |||||||||||||||
26 | SMEs and NFCs (other than SMEs) not subject to CSRD disclosure obligations | 3,147 | |||||||||||||||
27 | Loans and advances | 2,607 | |||||||||||||||
28 | - of which loans collateralised by commercial immovable property | 771 | |||||||||||||||
29 | - of which building renovation loans | - | |||||||||||||||
30 | Debt securities | 537 | |||||||||||||||
31 | Equity instruments | 3 | |||||||||||||||
32 | Non-EU country counterparties not subject to CSRD disclosure obligations | 5,841 | |||||||||||||||
33 | Loans and advances | 5,515 | |||||||||||||||
34 | Debt securities | 314 | |||||||||||||||
35 | Equity instruments | 12 | |||||||||||||||
36 | Derivatives | 12 | |||||||||||||||
37 | On demand interbank loans | 42 | |||||||||||||||
38 | Cash and cash-related assets | - | |||||||||||||||
39 | Other assets (e.g. Goodwill, commodities etc.) | 1,088 | |||||||||||||||
40 | Total assets | 76,838 | |||||||||||||||
Off-balance sheet exposures - Undertakings subject to NFRD disclosure obligations | |||||||||||||||||
41 | Financial guarantees | ||||||||||||||||
42 | Assets under management | 808 | 387 | 90 | 90 | 0 | - | 0 | - | - | - | 1 | 71 | - | - | - | - |
43 | of which debt securities | 148 | 80 | - | - | - | - | - | - | - | - | - | - | - | - | - | - |
44 | of which equity instruments | 661 | 307 | 90 | 90 | 0 | - | 0 | - | - | 2 | 71 | - | - | - | - | |
Disclosure 31-12-2025 (flow) | |||||||||||||||||
|---|---|---|---|---|---|---|---|---|---|---|---|---|---|---|---|---|---|
Million EUR | a | b | c | d | e | f | g | h | i | j | k | l | m | n | o | p | |
Total [gross] carrying amount | Of which Taxonomy-eligible | Of which Taxonomy-aligned | Non-assessed | ||||||||||||||
Breakdown per environmental objective | Of which Use of Proceeds | Of which transitional | Of which enabling | Of which financing | Of which exposures | Of which not assessed | |||||||||||
Climate Change Mitigation (CCM) | Climate Change Adaptation (CCA) | Water and marine resources (WTR) | Circular economy (CE) | Pollution (PPC) | Biodiversity and Ecosystems (BIO) | ||||||||||||
1 | GAR - Covered assets in both numerator and denominator | 10,409 | 9,544 | 2,297 | 2,297 | - | - | - | - | - | 2,229 | 1 | 0 | 23 | - | - | 23 |
2 | Loans and advances, debt securities and equity instruments not HfT eligible for GAR calculation | 10,409 | 9,544 | 2,297 | 2,297 | - | - | - | - | - | 2,229 | 1 | 0 | 23 | - | - | 23 |
3 | Financial undertakings | 1,268 | 414 | 49 | 49 | - | - | - | - | - | 15 | 1 | - | - | - | - | - |
4 | Loans and advances | 960 | 316 | 25 | 25 | - | - | - | - | - | - | 1 | - | - | - | - | - |
5 | Debt securities, including UoP | 308 | 98 | 24 | 24 | - | - | - | - | - | 15 | - | 0 | - | - | - | - |
6 | Equity instruments | - | - | - | - | - | - | - | - | - | - | - | - | - | - | - | |
7 | Non-financial undertakings | 111 | 100 | 66 | 66 | - | - | - | - | - | 32 | - | - | - | - | - | |
8 | Loans and advances | - | - | - | - | - | - | - | - | - | - | - | - | - | - | - | |
9 | Debt securities, including UoP | 111 | 100 | 66 | 66 | - | - | - | - | - | 32 | - | - | - | - | - | |
10 | Equity instruments | - | - | - | - | - | - | - | - | - | - | - | - | - | - | ||
11 | Households | 9,030 | 9,030 | 2,182 | 2,182 | - | - | 2,182 | - | - | 23 | - | 23 | ||||
12 | of which loans collateralised by residential immovable property | 9,007 | 9,007 | 2,182 | 2,182 | - | - | 2,182 | - | - | - | - | - | ||||
13 | of which building renovation loans | 9 | 9 | - | - | - | - | - | - | - | 9 | - | 9 | ||||
14 | of which motor vehicle loans | 14 | 14 | - | - | - | - | - | 14 | - | 14 | ||||||
15 | Local governments financing | - | - | - | - | - | - | - | - | - | - | - | - | - | - | - | |
16 | Housing financing | - | - | - | - | - | - | - | - | - | - | - | - | ||||
17 | Other local government financing | - | - | - | - | - | - | - | - | - | - | - | - | - | - | - | |
18 | Collateral obtained by taking possession: residential and commercial immovable properties | - | - | - | - | - | - | - | - | - | - | - | - | ||||
19 | Exposures included on a voluntary basis | - | - | - | - | - | - | - | - | - | - | - | |||||
20 | Total GAR assets | 10,409 | 23 | - | - | 23 | |||||||||||
21 | Assets not covered for GAR calculation | 7,191 | |||||||||||||||
22 | Central governments and Supranational issuers | 1,476 | |||||||||||||||
23 | Central banks exposure | - | |||||||||||||||
24 | Trading book | - | |||||||||||||||
25 | Undertakings and entities not subject to CSRD | 5,559 | |||||||||||||||
26 | SMEs and NFCs (other than SMEs) not subject to CSRD disclosure obligations | 524 | |||||||||||||||
27 | Loans and advances | 405 | |||||||||||||||
28 | - of which loans collateralised by commercial immovable property | 166 | |||||||||||||||
29 | - of which building renovation loans | - | |||||||||||||||
30 | Debt securities | 119 | |||||||||||||||
31 | Equity instruments | - | |||||||||||||||
32 | Non-EU country counterparties not subject to CSRD disclosure obligations | 5,035 | |||||||||||||||
33 | Loans and advances | 5,035 | |||||||||||||||
34 | Debt securities | - | |||||||||||||||
35 | Equity instruments | - | |||||||||||||||
36 | Derivatives | - | |||||||||||||||
37 | On demand interbank loans | - | |||||||||||||||
38 | Cash and cash-related assets | - | |||||||||||||||
39 | Other assets (e.g. Goodwill, commodities etc.) | 156 | |||||||||||||||
40 | Total assets | 17,600 | |||||||||||||||
Off-balance sheet exposures - Undertakings subject to NFRD disclosure obligations | |||||||||||||||||
41 | Financial guarantees | ||||||||||||||||
42 | Assets under management | 289 | 129 | 31 | 31 | 0 | - | - | - | - | - | 0 | 24 | - | - | - | - |
43 | of which debt securities | 80 | 40 | - | - | - | - | - | - | - | - | - | - | - | - | - | - |
44 | of which equity instruments | 208 | 89 | 31 | 31 | 0 | - | - | - | - | - | 0 | 24 | - | - | - | - |
Disclosure 31-12-2025 | ||||||||||
|---|---|---|---|---|---|---|---|---|---|---|
a | b | c | d | e | f | g | h | i | j | |
Breakdown by sector - NACE 4 digits level (code and label) in Million EUR | Total [Gross] carrying amount | Of which Taxanomy eligible | Of which Taxanomy aligned | Climate Change Mitigation (CCM) | Climate Change Adaptation (CCA) | Water and marine resources (WTR) | Circular economy (CE) | Pollution (PPC) | Biodiversity and Ecosystems (BIO) | |
1 | 35.13 - Distribution of electricity | 185 | 185 | 127 | 127 | - | - | - | - | - |
2 | 49.39 - Other passenger land transport n.e.c. | 86 | 86 | 62 | 62 | - | - | - | - | - |
3 | 46.43 - Wholesale of electrical household appliances | 83 | 40 | - | - | - | - | - | - | - |
4 | 68.10 - Buying and selling of own real estate | 46 | 39 | 10 | 10 | - | - | - | - | - |
5 | 58.11 - Book publishing | 35 | - | - | - | - | - | - | - | - |
6 | 43.99 - Other specialised construction activities n.e.c. | 28 | 25 | 21 | 21 | - | - | - | - | - |
7 | 52.29 - Other transportation support activities | 24 | 19 | 12 | 12 | - | - | - | - | - |
8 | 27.90 - Manufacture of other electrical equipment | 21 | 18 | 3 | 3 | - | - | - | - | - |
9 | 61.10 -Wired telecommunications activities | 21 | 1 | - | - | - | - | - | - | - |
10 | 20.59 - Manufacture of other chemical products n.e.c. (not elsewhere classified) | 17 | 3 | - | - | - | - | - | - | - |
11 | Nuclear activities | - | - | - | ||||||
12 | Fossil gas activities | - | - | - | ||||||
13 | Of which non-assessed exposures | - |
Disclosure 31-12-2025 | ||||||||||||||
|---|---|---|---|---|---|---|---|---|---|---|---|---|---|---|
% (compared to corresponding total covered assets in the denominator) | a | b | c | d | e | f | g | h | i | j | k | l | m | |
Taxonomy-eligible | Taxonomy-aligned | Proportion of Taxonomy aligned in Taxonomy eligible | Non-assessed exposures | |||||||||||
Breakdown per environmental objective | Of which Use of Proceeds | Of which transitional | Of which enabling | |||||||||||
Climate Change Mitigation (CCM) | Climate Change Adaptation (CCA) | Water and marine resources (WTR) | Circular economy (CE) | Pollution (PPC) | Biodiversity and Ecosystems (BIO) | |||||||||
1 | GAR - Covered assets in both numerator and denominator | 97.30 | 19.29 | 19.29 | - | - | - | - | - | 19.05 | 0.01 | 0.07 | 19.83 | 0.07 |
2 | Loans and advances, debt securities and equity instruments not HfT eligible for GAR calculation | 97.30 | 19.29 | 19.29 | - | - | - | - | - | 19.05 | 0.01 | 0.07 | 19.83 | 0.07 |
3 | Financial undertakings | 49.01 | 12.77 | 12.77 | - | - | - | - | - | 11.01 | 0.05 | 0.05 | 26.05 | - |
4 | Loans and advances | 32.91 | 2.64 | 2.64 | - | - | - | - | - | 0.03 | 0.11 | - | 8.02 | - |
5 | Debt securities, including UoP | 57.25 | 17.95 | 17.95 | - | - | - | - | - | 16.62 | 0.02 | 0.07 | 31.36 | - |
6 | Equity instruments | - | - | - | - | - | - | - | - | - | - | - | - | |
7 | Non-financial undertakings | 75.97 | 41.53 | 41.53 | - | - | - | - | - | 24.27 | 0.80 | 7.21 | 54.67 | - |
8 | Loans and advances | - | - | - | - | - | - | - | - | - | - | - | - | - |
9 | Debt securities, including UoP | 75.97 | 41.53 | 41.53 | - | - | - | - | - | 24.27 | 0.80 | 7.21 | 54.67 | - |
10 | Equity instruments | - | - | - | - | - | - | - | - | - | - | - | - | |
11 | Households | 100 | 19.41 | 19.41 | - | - | 19.41 | - | - | 19.41 | 0.07 | |||
12 | of which loans collateralised by residential immovable property | 100 | 19.42 | 19.42 | - | - | 19.42 | - | - | 19.42 | - | |||
13 | of which building renovation loans | 100 | - | - | - | - | - | - | - | - | 100 | |||
14 | of which motor vehicle loans | 100 | - | - | - | - | - | - | 100 | |||||
15 | Local governments financing | - | - | - | - | - | - | - | - | - | - | - | - | - |
16 | Housing financing | - | - | - | - | - | - | - | - | - | - | |||
17 | Other local government financing | - | - | - | - | - | - | - | - | - | - | - | - | - |
18 | Collateral obtained by taking possession: residential and commercial immovable properties | - | - | - | - | - | - | - | - | - | - | |||
19 | Exposures included on a voluntary basis | - | - | - | - | - | - | - | - | - | ||||
20 | GAR - Total GAR Assets | 97.30 | 19.29 | 19.29 | - | - | - | - | - | 19.05 | 0.01 | 0.07 | 19.83 | 0.07 |
Disclosure 31-12-2025 | ||||||||||||||
|---|---|---|---|---|---|---|---|---|---|---|---|---|---|---|
% (compared to corresponding total covered assets in the denominator) | a | b | c | d | e | f | g | h | i | j | k | l | m | |
Taxonomy-eligible | Taxonomy-aligned | Proportion of Taxonomy aligned in Taxonomy eligible | Non-assessed exposures | |||||||||||
Breakdown per environmental objective | Of which Use of Proceeds | Of which transitional | Of which enabling | |||||||||||
Climate Change Mitigation (CCM) | Climate Change Adaptation (CCA) | Water and marine resources (WTR) | Circular economy (CE) | Pollution (PPC) | Biodiversity and Ecosystems (BIO) | |||||||||
1 | GAR - Covered assets in both numerator and denominator | 91.69 | 22.07 | 22.07 | - | - | - | - | - | 21.42 | 0.01 | - | 24.07 | 0.22 |
2 | Loans and advances, debt securities and equity instruments not HfT eligible for GAR calculation | 91.69 | 22.07 | 22.07 | - | - | - | - | - | 21.42 | 0.01 | - | 24.07 | 0.22 |
3 | Financial undertakings | 32.67 | 3.88 | 3.88 | - | - | - | - | - | 1.24 | 0.08 | 0.02 | 11.87 | - |
4 | Loans and advances | 32.90 | 2.63 | 2.63 | - | - | - | - | - | - | 0.11 | - | 7.98 | - |
5 | Debt securities, including UoP | 31.95 | 7.78 | 7.78 | - | - | - | - | - | 5.12 | - | 0.09 | 24.34 | - |
6 | Equity instruments | - | - | - | - | - | - | - | - | - | - | - | - | |
7 | Non-financial undertakings | 90.72 | 59.89 | 59.89 | - | - | - | - | - | 28.97 | - | - | 66.02 | - |
8 | Loans and advances | - | - | - | - | - | - | - | - | - | - | - | - | - |
9 | Debt securities, including UoP | 90.72 | 59.89 | 59.89 | - | - | - | - | - | 28.97 | - | - | 66.02 | - |
10 | Equity instruments | - | - | - | - | - | - | - | - | - | - | - | - | |
11 | Households | 100 | 24.16 | 24.16 | - | - | 24.16 | - | - | 24.16 | 0.25 | |||
12 | of which loans collateralised by residential immovable property | 100 | 24.22 | 24.22 | - | - | 24.22 | - | - | 24.22 | - | |||
13 | of which building renovation loans | 100 | - | - | - | - | - | - | - | - | 100 | |||
14 | of which motor vehicle loans | 100 | - | - | - | - | - | - | 100 | |||||
15 | Local governments financing | - | - | - | - | - | - | - | - | - | - | - | - | - |
16 | Housing financing | - | - | - | - | - | - | - | - | - | - | |||
17 | Other local government financing | - | - | - | - | - | - | - | - | - | - | - | - | - |
18 | Collateral obtained by taking possession: residential and commercial immovable properties | - | - | - | - | - | - | - | - | - | - | |||
19 | Exposures included on a voluntary basis | - | - | - | - | - | - | - | - | - | ||||
20 | GAR - Total GAR Assets | 91.69 | 22.07 | 22.07 | - | - | - | - | - | 21.42 | 0.01 | - | 24.07 | 0.22 |
Disclosure 31-12-2025 | |||||||||||||
|---|---|---|---|---|---|---|---|---|---|---|---|---|---|
% (compared to corresponding total off-balance sheet assets) | a | b | c | d | e | f | g | h | i | j | k | l | |
Taxonomy-eligible | Taxonomy-aligned | Non-assessed | |||||||||||
Breakdown per environmental objective | Of which Use of Proceeds | Of which transitional | Of which enabling | ||||||||||
Climate Change Mitigation (CCM) | Climate Change Adaptation (CCA) | Water and marine resources (WTR) | Circular economy (CE) | Pollution (PPC) | Biodiversity and Ecosystems (BIO) | ||||||||
1 | Financial guarantees (FinGuar KPI) | - | - | - | - | - | - | - | - | - | - | - | - |
2 | Assets under management (AuM KPI) | 47.91 | 11.16 | 11.11 | 0.01 | - | 0.03 | - | - | 0.00 | 0.07 | 8.78 | - |
Disclosure 31-12-2025 | |||||||||||||
|---|---|---|---|---|---|---|---|---|---|---|---|---|---|
% (compared to corresponding total off-balance sheet assets) | a | b | c | d | e | f | g | h | i | j | k | l | |
Taxonomy-eligible | Taxonomy-aligned | Non-assessed | |||||||||||
Breakdown per environmental objective | Of which Use of Proceeds | Of which transitional | Of which enabling | ||||||||||
Climate Change Mitigation (CCM) | Climate Change Adaptation (CCA) | Water and marine resources (WTR) | Circular economy (CE) | Pollution (PPC) | Biodiversity and Ecosystems (BIO) | ||||||||
1 | Financial guarantees (FinGuar KPI) | - | - | - | - | - | - | - | - | - | - | - | - |
2 | Assets under management (AuM KPI) | 44.61 | 10.71 | 10.67 | 0.00 | - | 0.03 | - | - | 0.00 | 0.05 | 8.39 | - |
For better interconnectivity between the financial statements and the sustainability statements, the EU Taxonomy information is given based on the IFRS balance sheet below.
31-12-2025 | ||||||||||||
|---|---|---|---|---|---|---|---|---|---|---|---|---|
Before result appropriation and in € millions | Carrying amount | Impairments | Total [gross] carrying amount | Of which Taxonomy-eligible | Of which Taxonomy-aligned | Breakdown per environmental objective | Taxonomy non-eligible or excluded from the GAR calculation | |||||
Climate Change Mitigation (CCM) | Climate Change Adaptation (CCA) | Water and marine resources (WTR) | Circular economy (CE) | Pollution (PPC) | Biodiversity and Ecosystems (BIO) | |||||||
Cash and cash equivalents | 1,720 | - | 1,720 | - | - | - | - | - | - | - | - | 1,720 |
Derivatives | 1,789 | - | 1,789 | - | - | - | - | - | - | - | - | 1,789 |
Investments | 6,809 | -5 | 6,896 | 1,635 | 564 | 564 | - | - | - | - | - | 5,261 |
Loans and advances to banks | 6,782 | -2 | 6,784 | 337 | 26 | 26 | - | - | - | - | - | 6,447 |
Loans and advances to customers | 59,172 | -85 | 59,257 | 56,616 | 10,988 | 10,988 | - | - | - | - | - | 2,641 |
Tangible and intangible assets | 48 | - | 48 | - | - | - | - | - | - | - | - | 48 |
Tax assets | 3 | - | 3 | - | - | - | - | - | - | - | - | 3 |
Other assets | 341 | - | 341 | - | - | - | - | - | - | - | - | 341 |
Total assets | 76,664 | -92 | 76,838 | 58,588 | 11,578 | 11,578 | - | - | - | - | - | 18,250 |
The mandatory EU Taxonomy report is primarily based on exposures to retail customers and large CSRD counterparties. However, the business model of ASN Bank focuses on retail customers and non-CSRD or SME customers. The latter may be active in economic activities mentioned in Annex I and/or Annex II of the EU Taxonomy, and could, therefore, be considered eligible or aligned. Accordingly, on a best effort basis, we have established taxonomy eligibility and/or alignment information for:
Our project financing portfolio, which only includes non-financial corporations not subject to the CSRD. We assessed all our projects in relation to renewable energy such as solar, wind, biomass, underground thermal energy storage on a best effort, case-by-case basis to the relevant technical EU taxonomy screening criteria. This is especially challenging since our counterparties are often SPVs and/or SMEs and, given their size, we do not have all relevant information. Not all activities could in our view be considered taxonomy aligned. The main reason for this is a lack of data to establish compliance with either exact, equivalent, or near-estimate information. In this light, we also did consider part of our legacy solar parks to be non-compliant with the MSS and, therefore, not taxonomy aligned. The reason for this is that suppliers of these projects had a high risk on forced labour as indicated by the Sheffield Report 1. These reports published by the Sheffield Hallam University, which provide insight in the supply chain of solar production and the risk to forced labour in the Xinjiang region, are considered leading. To cover every aspect, we note that since the insights from the first Sheffield report in the solar supply chain, we no longer finance new projects if suppliers are at high risk of using forced labour on the basis of these reports or other credible sources.
Our commercial mortgage portfolio, whereby our loans collateralised by commercial immovable property are also related to CCM activity 7.7: the acquisition and ownership of buildings. In this regard, we assessed collateral with surface area of less than 830 m2 as the cut-off point for large non-residential buildings, as we do not have insight into the energy performance monitoring and assessment. Collateral under this threshold with an EPC label A was assessed as meeting the substantial screening criteria if the collateral is built before 2021. For buildings built after 2021, the Primary Energy Demand needs to be at least 10% lower than the threshold set for nearly zero-energy building (NZEB) requirements. We also performed a Do No Significant Harm (DNSH) assessment using the location of the collateral for an internal risk assessment. ASN Bank considers pole rot, soil subsidence and flooding as relevant physical climate hazards for the real estate in the Netherlands that we finance. We plotted the collateral to the following relevant maps and thresholds in the Climate Impact Atlas:
pole rot with the low 2050 scenario and a high or very high risk threshold.
soil subsidence with the low 2050 scenario and a high or very high risk threshold.
≥50 cm flood with the low 2050 scenario and a probability of 1/300 and higher.
Supranationals with green or sustainable bonds if the counterparty indicates them as taxonomy eligible and aligned.
31-12-2025 | ||||||||||||
|---|---|---|---|---|---|---|---|---|---|---|---|---|
Before result appropriation and in € millions | Carrying amount | Impairments | Total [gross] carrying amount | Of which Taxonomy-eligible | Of which estimated Taxonomy-aligned | Breakdown per environmental objective | Taxonomy non-eligible or excluded from the GAR calculation | |||||
Climate Change Mitigation (CCM) | Climate Change Adaptation (CCA) | Water and marine resources (WTR) | Circular economy (CE) | Pollution (PPC) | Biodiversity and Ecosystems (BIO) | |||||||
Cash and cash equivalents | 1,720 | - | 1,720 | - | - | - | - | - | - | - | - | 1,720 |
Derivatives | 1,789 | - | 1,789 | - | - | - | - | - | - | - | - | 1,789 |
Investments | 6,809 | -5 | 6,896 | 2,637 | 564 | 564 | - | - | - | - | - | 4,259 |
Loans and advances to banks | 6,782 | -2 | 6,784 | 337 | 26 | 26 | - | - | - | - | - | 6,447 |
Loans and advances to customers | 59,172 | -85 | 59,257 | 58,226 | 11,637 | 11,637 | - | - | - | - | - | 1,031 |
Tangible and intangible assets | 48 | - | 48 | - | - | - | - | - | - | - | - | 48 |
Tax assets | 3 | - | 3 | - | - | - | - | - | - | - | - | 3 |
Other assets | 341 | - | 341 | - | - | - | - | - | - | - | - | 341 |
Total assets | 76,664 | -92 | 76,838 | 61,200 | 12,227 | 12,227 | - | - | - | - | - | 15,638 |

Leadership and governance
Leadership and governance
Supervisory Board and Executive Board
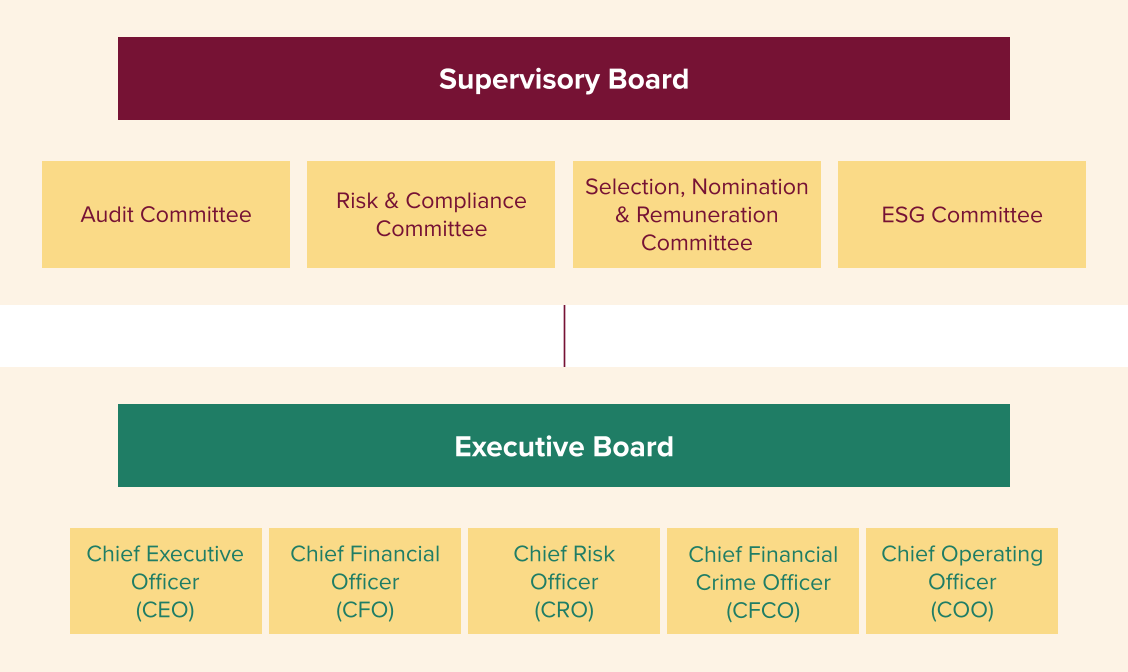
Executive Board
Changes to the governance structure and composition
In 2025, several changes were made in the governance structure of ASN Bank as well as in the composition of the Executive Board:
With effect from 1 March 2025, the Executive Committee (consisting of both statutory and non-statutory members), was replaced by an Executive Board (ExBo) with statutory members only.
On 1 March 2025, the position of CFCO was added to the Executive Board with Gwendolyn van Tunen, already appointed on a non-statutory basis as CFCO, now serving as a statutory member of the ExBo.
On that same date, Isold Heemstra joined the ExBo as CCO and statutory member.
Subsequently, on 1 July 2025, Isold Heemstra was appointed as COO with the CCO title ceasing to exist.
Name | Appointed until | |
|---|---|---|
Roland Boekhout | CEO | GMS 2028 |
André Haag | CFO | GMS 2026 |
Saskia Hoskens | CRO | GMS 2028 |
Isold Heemstra | COO | GMS 2029 |
Gwendolyn van Tunen | CFCO | GMS 2028 |
Roles and responsibilities (In scope of CSRD)
ASN Bank has a two-tier governance model consisting of a Supervisory Board and an Executive Board (ExBo). The Supervisory Board performs its oversight and advisory role 100% independently, in accordance with applicable laws, regulations and corporate governance standards. The ExBo is ASN Bank's statutory managing board (statutair bestuur) within the meaning of section 2:129 of the Dutch Civil Code and is entrusted with the management of ASN Bank. The ExBo is the part of ASN Bank's management body in its executive function as defined in the Capital Requirement Directive VI (2024/1619/EU) (CRD VI).
The ExBo is charged with and responsible for (i) the day-to-day management of ASN Bank, ensuring compliance with laws and regulations and the adequate financing of its activities; (ii) the continuity of ASN Bank and its business, aimed at sustainable long-term value creation for ASN Bank and taking into account the interests of all relevant stakeholders, and (iii) implementing ASN Bank’s mission, vision, strategy, risk appetite, corporate standards and values, including business conduct and reporting its findings to the Supervisory Board, risk framework, main policies, budgets, financial and non-financial targets, with the aim to contribute to sustainable long-term value creation by ASN Bank and to build and maintain the culture required for that purpose.
The ExBo ensures close cooperation with the Supervisory Board while discharging its responsibilities and seeks supervision and advice from the Supervisory Board for the bank-wide strategy and strategy implementation. The ExBo is accountable to the Supervisory Board and to the General Meeting of Shareholders (GMS) for the performance of its duties. With respect to the latter, the ExBo develops a view on sustainable long-term value creation for ASN Bank and its business, while considering the interests of all relevant stakeholders.

From left to the right: André Haag, Saskia Hoskens, Roland Boekhout, Gwendolyn van Tunen and Isold Heemstra
Composition and diversity (In scope of CSRD)
In 2025, the ExBo consists of the Chief Executive Officer (CEO), Chief Financial Officer (CFO), Chief Risk Officer (CRO), Chief Operating Officer (COO), and Chief Financial Crime Officer (CFCO).
The ExBo’s composition is based on ASN Bank’s Diversity and Inclusion Policy which focuses on recognising and valuing both customers' and employees' diversity. The purpose of the policy is to optimally contribute to the execution of the bank’s strategy. The Supervisory Board (SB) draws up job profiles for the ExBo in consultation with the ExBo itself. The job profiles specify the required knowledge, suitability, expertise, integrity and availability of the ExBo and its members. As far as education and professional experience are concerned, the profiles set out the relevant aspects of diversity and inclusion, such as nationality, age, gender and background with regard to education and professional experience.
As from 1 January 2022, the Dutch Gender Balance Act came into force. This Act requires the supervisory boards of Dutch listed companies in the Netherlands top have at least one-third male and one-third female members. Although ASN Bank is not a listed company, and its shares are privately held by NLFI, the bank voluntarily applies the Gender Balance Act. In addition, ASN Bank has appropriate and ambitious targets to promote gender diversity across the organisation and is required to report on said above targets, plans and progress. ASN Bank's 2025 target has been set at a female/ male ratio of between 40% and 60% at all management levels. At year-end 2025, the percentage of women on the ExBo was 40%. This percentage is in line with the Gender Balance Act.
In succession planning and when filling vacancies, ASN Bank gives due consideration to any applicable diversity requirements in its search for suitable new ExBo members who meet the fit and proper requirements stipulated in the Dutch Financial Supervision Act (Wet op het financieel toezicht - Wft) and CRD VI.
Appointment, suspension and dismissal
Members of the ExBo are appointed and reappointed by NLFI on nomination by the SB and after approval by the supervisory authorities. Both NLFI and the SB hold the right to suspend members of the ExBo, whereas NLFI can also dismiss members of the ExBo. When considering approval the SB will take into account the advice of the Selection, Nomination and Remuneration Committee (SNRC). ExBo members are appointed and reappointed for a maximum term of four (4) years, in accordance with the rotation scheme.
When preparing the appointment and reappointment of the members of the ExBo, the SNRC and SB consider the diversity objectives laid down in ASN Bank's internal policies such as the Diversity and Inclusion Policy. To be eligible for appointment candidates are required to pass fit and proper assessments under the Wft. The Works Council has the right to prior consultation on the appointment of members of the ExBo. The SB notifies the GMS of the intended appointment or reappointment of an ExBo member, accompanied by the candidate’s short resume, including age, gender, educational and professional background.
Further information on the suspension and dismissal procedure of the ExBo is provided in ASN Bank's Articles of Association as published on our website.
Functioning
The Articles of Association of ASN Bank contain a list of the duties of the ExBo and the rules governing its functioning. Additional practical arrangements on how the ExBo is to exercise its duties and powers are defined in the ExBo's Rules of Procedure and in the Memorandum of Understanding (MoU) between NLFI and ASN Bank.
The Rules of Procedure for the ExBo were updated on 1 March 2025 and on 1 November 2025. The ExBo meets on a weekly basis and takes decisions by a majority of votes with the CEO having a casting vote if necessary. In fulfilling ASN Bank's mission and ambition, the ExBo continuously and explicitly weighs up the interests of all stakeholders.
Personal details (In scope of CSRD)
The following is a concise description of the ExBo members’ professional experience as at 31 December 2025:
Roland Boekhout
1963 – Nationality: Dutch – Gender: Male
Roland Boekhout was appointed Chief Executive Officer and Chair of the Executive Board with effect from 22 May 2024. In addition to his role at ASN Bank, Roland serves as a board member of the German-Dutch Chamber of Commerce and as board member of the Dutch Banking Association (Nederlandse Vereniging van Banken).
André Haag
1982 – Nationality: German – Gender: Male
André Haag was appointed as Chief Financial Officer and member of the Executive Board with effect from 1 August 2022. André holds no other board positions.
Saskia Hoskens
1970 – Nationality: Dutch – Gender: Female
Saskia Hoskens was appointed as Chief Risk Officer and member of the Executive Board with effect from 10 April 2024. Saskia holds no other board positions.
Isold Heemstra
1973 – Nationality: Dutch – Gender: Male
Isold Heemstra was first appointed Chief Customer Officer and member of the Executive Board at 1 March 2025 and as of 1 July 2025 he is Chief Operating Officer. Isold also serves as a board member of ASN Duurzame Deelnemingen N.V., a 100% subsidiary of ASN Bank N.V.
Gwendolyn van Tunen
1965 - Nationality: Dutch - Gender: Female
Gwendolyn van Tunen was appointed as statutory Chief Financial Crime Officer (CFCO) with effect from 1 March 2025. Gwendolyn holds no other board positions.
Supervisory Board
Roles and responsibilities
The Supervisory Board (SB) oversees, advises, challenges and supports the ExBo in the exercising of its powers and duties. The SB together with the ExBo is accountable for ASN Bank's sustainable long-term value creation, requiring members to execute their duties in a sustainable manner with due observance of the sustainable long-term viability of the strategy pursued. The SB is the part of ASN Bank's management body in its supervisory function as defined in CRD VI.
In discharging its task, the SB takes into account the dynamics in and the relationship with the ExBo and its members. The SB’s early and close involvement with the ExBo is required when formulating the bank-wide strategy and targets in line with the pursued culture aimed at sustainable long-term value creation. In performing their duties, the members of the SB are guided by the interests of ASN Bank and its businesses, taking due consideration of the legitimate interests of all the bank's stakeholders.
Appointment, suspension and dismissal
Members of the SB are appointed and reappointed by the General Meeting of Shareholders (GMS), upon nomination by the SB itself. To be eligible for appointment, candidates are required to pass fit and proper assessments under the Wft.
The GMS and the Works Council may recommend candidates to the SB to be nominated as members of the SB. The diversity objectives laid down in ASN Bank's internal policies are taken into consideration when preparing the appointment and reappointment of the members of the SB. The SB notifies the GMS of the intended appointment or reappointment of a member of the SB, accompanied by a short resume of the candidate, including the candidate’s age, gender, educational and professional background and geographical provenance.
The SB is required to nominate a candidate recommended by the Works Council in respect of one third of the members of the SB (the ‘enhanced right of recommendation’). The SB is to accept the recommendation of the Works Council unless it believes that the candidate recommended is unsuitable to fulfil the duties of a member of the SB or if the SB would not be properly composed if the appointment was made as recommended. The SB may suspend any of its members at any time. In the event of lack of confidence in the SB, the GMS may dismiss the SB in its entirety.
Further information on the appointment, suspension and dismissal procedure of the members of the SB is provided in ASN Bank's Articles of Association as published on our website.
Functioning (In scope of CSRD)
In performing its duties, the SB continuously weighs up the interests of all its stakeholders to fulfil the mission and ambition of ASN Bank. SB members operate independently of each other within the meaning of the Dutch Corporate Governance Code and in accordance with the De Nederlandsche Bank's (DNB) position on the independent functioning of the SB. In November 2025 ASN Bank updated the Code of Conduct. The Code of Conduct contains a conflict of interest procedure and a procedure for respectful and professional conduct. In addition, the Articles of Association contain a list of the duties and rules governing the functioning of the SB. Both the Rules of Procedure for the SB and the MoU agreed with NLFI include additional agreements how the SB should exercise its duties and powers as well as on the appointment of the Chair of the SB and the CEO. The Rules of Procedure for the SB were last amended on 1 November 2025. The SB meets at least six times a year and takes decisions by a majority of votes.
Ancillary positions and conflicting interests
Members of the SB may hold and are to disclose other positions, including directorships. CRD VI and the Dutch Corporate Governance Code (DCGC) restrict the total number of SB positions or non-executive directorships that may be held by a SB member, if the SB member also has an executive board position. It is the responsibility of the individual SB member and the SB to ensure that the directorship duties are performed properly and are not affected by any other positions held by the individual member outside ASN Bank and its group structure.
SB members are to report any (potential) conflicts of interests and to provide all relevant information relating to them. The SB, excluding the member concerned, decides whether a conflict of interest exists. If it does, the relevant member of the SB abstains from discussions and decision-making on a subject or transaction in relation to which the relevant SB member has a (potential) conflict of interest.
In accordance with the DCGC and the SB's Rules of Procedure every transaction with one or more SB members that is of material significance to ASN Bank and involves (potential) conflict of interests, will be disclosed in the management report, stating the conflict of interest.

From left to right: Gerard van Olphen, Jeanine Helthuis, Aloys Kregting, Petra van Hoeken and Jos van Lange
Composition and diversity (In scope of CSRD)
The SB is composed in such a way that it has sufficient expertise to properly perform its duties. The SB draws up a generic profile for its members. This profile specifies the required knowledge, suitability, expertise, integrity and availability of the SB and its members.
It also sets out the relevant aspects of diversity and inclusion, such as nationality, age, gender and background in relation to education and professional experience. At the end of 2025 40% of the SB positions were filled by women, in line with ASN Bank's objective for 2025 and the Gender Balance Act.
ASN Bank's Diversity and Inclusion Policy focuses on recognising and valuing both customers’ and employees’ diversity. This policy also applies to the SB. The generic profile of the SB has been approved by NLFI and is published on our website. The generic profile of the SB was last amended on 1 November 2025. When a new member is appointed, the SB will propose a candidate to the GMS, taking this profile into account.
Personal details (In scope of CSRD)
The Supervisory Board of ASN Bank N.V. constituted of the following members as at 31 December 2025:
Gerard van Olphen
1962 – Nationality: Dutch – Gender: Male
Gerard van Olphen was appointed as a member and Chair of the Supervisory Board of ASN Bank N.V. (then de Volksbank N.V.) on 13 August 2021, and reappointed as such on 17 April 2025. Gerard is also a member of the Selection, Nomination and Remuneration Committee (SNRC) and Chair of the ESG Committee. His term of office will expire on the date of the General Meeting of Shareholders (GMS) of 2029.
Other positions held by Gerard on 31 December 2025:
Vice-Chair of the Supervisory Board of ASR and member of the Audit and Risk Committee and Nomination & ESG Committee
Chair of the Stakeholders’ Body for Professional Regulation of the Royal Dutch Professional Organisation of Accountants (NBA)
Chair of the Supervisory Board of Robidus
Chair of the Supervisory Board of Mollie B.V.
Jeanine Helthuis
1962 – Nationality: Dutch – Gender: Female
Jeanine Helthuis was appointed to the Supervisory Board on 20 September 2021, and reappointed on 17 April 2025. Jeanine is also Chair of the SNRC and a member of the Risk & Compliance Committee (R&CC) and ESG Committee. Her term of office will expire on the date of the GMS of 2029.
Other positions held by Jeanine on 31 December 2025:
Member of the Supervisory Board of Transdev Nederland Holding N.V. / member of the Audit & Compliance Committee and Selection, Nomination and Remuneration Committee
Member of the Supervisory Board of CAB Payments Europe
Petra van Hoeken
1961 – Nationality: Dutch – Gender: Female
Petra van Hoeken was appointed as a member of the Supervisory Board on 20 September 2021, and reappointed on 17 April 2025. Petra is also Chair of the R&CC and a member of the Audit Committee (AC) and ESG Committee. Her term of office will expire on the date of the GMS of 2029.
Other positions held by Petra on 31 December 2025:
Non-executive board member of Nordea Bank / chair of the Board Risk Committee and member of the Board Audit Committee
Advisor to the Ministry of Economic Affairs and Climate Policy / Chair of the Credit Committee of the Corporate Finance Guarantee Scheme
Board member of the foundation managing RDS (Dutch Shell) employee share plans
Member of the Supervisory Board of NSI N.V. and chair of the Audit Committee
Board member of the Female Cancer Foundation
Aloys Kregting
1967 – Nationality: Dutch – Gender: Male
Aloys Kregting was appointed as a member of the Supervisory Board on 24 August 2018 and was reappointed on 21 April 2022. His term of office will expire on the date of the GMS of 2026. Aloys is also member of the AC, SNRC and ESG Committee.
Other positions held by Aloys on 31 December 2025:
Head of Global Enabling Services, ASML
Jos van Lange
1956 – Nationality: Dutch – Gender: Male
Jos van Lange was appointed as a member of the Supervisory Board on 1 May 2018 and was reappointed on 21 April 2022. On 31 October 2022 Jos was appointed as Vice-Chair of the Supervisory Board. His term of office will expire on the date of the GMS of 2026. On 20 September 2021, Jos took the reins as Chair of the AC and remained a member of the R&CC and ESG Committee.
Other positions held by Jos on 31 December 2025:
Vice-chair of the Supervisory Board and chair of the Audit, Risk & Compliance Committee of Bouwinvest N.V.
Member of the Investment Advisory Committee of DELA
Chair of the Landgoed Kasteel Geldrop Foundation
Profile (In scope of CSRD)
The Supervisory Board possesses knowledge and expertise in the following areas within their profile.
31-12-2025 | Social identity | Strategy | Customers | Distribution | People and | Innovation | Sustainability | IT | Data | Finance | Risk, compliance, |
Gerard van Olphen | • | • | • | • | • | • | • | • | • | ||
Jeanine Helthuis | • | • | • | • | • | • | • | ||||
Petra van Hoeken | • | • | • | • | • | • | • | • | • | ||
Aloys Kregting | • | • | • | • | • | • | • | ||||
Jos van Lange | • | • | • | • | • | • | • |
Report of the Supervisory Board
Looking back and ahead with the Chair of the Supervisory Board

In 2021, as the Supervisory Board of what was then de Volksbank, we identified several key priorities that required sustained focus: strengthening board dynamics, improving execution power for systemic and organisational changes, enhancing earnings capacity, improving risk management and culture and creating clarity on the exit strategy for the shareholder. In recent years it became clear that significant remediation efforts were needed in anti-financial crime (AFC) and risk management at the bank. I am happy to conclude that in all these areas, the Supervisory Board observed significant progress last year, all set in motion by a relatively new yet determined and capable Executive Board, and that 2025 has been a successful year for what now is ASN Bank.
The Supervisory Board is pleased to report that its cooperation with the Executive Board last year was strong, built on foundations of trust, transparency and shared commitment to the ASN Bank’s mission and long‑term interests. The Supervisory Board expresses confidence in the Executive Board team as a whole and feels increasingly comfortable adopting a more oversight‑focused role, based on stronger board dynamics, clear and timely reporting, and the solid financial and commercial performance delivered by the Executive Board.
Good performances never go unnoticed and in that regard the Supervisory Board emphasises the retention risk among executive management and key specialists. This risk is driven in part by the bank’s continued below‑market remuneration framework, a result of state ownership. The Supervisory Board reiterates its longstanding view that the current remuneration regime for the management body of ASN Bank is unsustainable in the short and long term.
A prime example of execution power and organisational change was the successful completion of the first phase of the transformation programme. The most salient milestones were the major rebranding operations, which represented more than just a change in name and visual identity, reflecting a deliberate strategic choice to operate under one strong, socially oriented, future‑proof brand: ASN Bank. The Supervisory Board has been closely involved in the planning, risk assessment and execution oversight of this transition and is satisfied with the thoroughness, professionalism and dedication with which the Executive Board and the rest of the organisation managed the process.
During these turbulent and dynamic times, the Supervisory Board places great value on its relationship with the Works Council. Each year, a day is organised during which the Works Council, Supervisory Board and Executive Board reflect on their cooperation and the current state and future of the bank. Last year, not one but two of these events were held, reflecting the intensity of the transformation agenda and the importance of close, ongoing dialogue.
The transformation programme ran parallel with two significant remediation programmes initiated after DNB imposed two administrative fines in January 2025. For the Supervisory Board, the bank’s progress on its AFC remediation efforts and broader risk‑management improvements have logically been a significant focus area last year. The Supervisory Board challenged the recalibration of the AFC remediation plan and was involved in the annual systemic integrity risk analysis (SIRA), which now provides a more accurate and data‑driven assessment of inherent and residual risks. The Supervisory Board also observed the significant steps that have been taken in re‑establishing a robust, reliable risk‑control environment including increased risk awareness.
It is the view of the Supervisory Board that the dialogue with supervisory authorities has become more positive and forward‑looking. At the same time, the Supervisory Board notes that supervisory expectations remain high and continued focus will remain crucial in the coming years.
A key consideration during periods of substantial organisational change is maintaining operational continuity. Despite the transformation, and in some respects precisely of it the organisation achieved a solid financial and commercial performance in 2025. Mortgage production increased significantly, driven by improved customer engagement and a simplified proposition under the ASN Bank brand. The volume of household deposits also increased. The ExBo had set ambitious performance objectives for 2025 and while the SB has determined the realisation at 61%, the SB is of the view that the progress made and the impact delivered by the ExBo in 2025 have been substantial.
The solid financial performance also allows for the resumption of dividend payments. The Supervisory Board supports the proposal to distribute a dividend of €124 million to our shareholder NLFI, corresponding to a 50% pay‑out ratio.
The Supervisory Board carefully assessed, discussed and formally approved the 'Simplify & Grow' corporate strategy, which makes it clear that ASN Bank opts for a strong focus on its core activities of mortgages, savings and payments. The Supervisory Board fully supports this strategy that articulates a renewed emphasis on improving cost efficiency, enhancing customer propositions and securing a resilient and future‑proof operational landscape while, as an accessible bank, maintaining its commitment to a sustainable society for the Netherlands.
The Supervisory Board concludes that ASN Bank made significant progress on all defined key priorities plus both remediation programmes. However, one priority remains unaddressed: the future ownership of ASN Bank. The Supervisory Board reiterates its view that the most logical future ownership options for ASN Bank remain either a private sale to a strong strategic partner or an Initial Public Offering (IPO). In mid-2024 our shareholder NLFI concluded that a private sale could be realised in one to three years. Based on the solid results and significant progress achieved last year, the Supervisory Board is confident that in 2027 NLFI can make a recommendation to the Minister of Finance about the future of ASN Bank.
On behalf of the Supervisory Board of ASN Bank,
Chair
Meetings
During 2025, the Supervisory Board (SB) held five regular meetings according to the pre-set schedule and six additional meetings. These additional meetings were required to closely monitor and discuss ASN Bank's key projects, including - but not limited to - the remediation plans for anti-financial crime and risk management and the new corporate strategy. Most meetings were held physically and, insofar as this was not feasible, meetings were held using video conferencing. Both the regular and additional meetings were attended by most of the members of the SB. Regular SB meetings take place after the meetings of the AC, R&CC, SNRC and ESG Committee. These committees report to the SB on their deliberations and findings after their meeting, and the SB takes their recommendations and outcomes into consideration. The Company Secretary and Deputy Company Secretary attend all SB and SB committee meetings. Every SB meeting started with a conflict of interest check to determine whether any SB member is conflicted regarding one or more of the agenda items.
Total meetings per Supervisory Board member | SB | AC | R&CC | SNRC | ESG |
|---|---|---|---|---|---|
Gerard van Olphen | 11/11 | 6/6 | 5/5 | ||
Jeanine Helthuis | 11/11 | 7/7 | 6/6 | 5/5 | |
Petra van Hoeken | 11/11 | 5/5 | 7/7 | 5/5 | |
Aloys Kregting | 9/11 | 4/5 | 5/6 | 5/5 | |
Jos van Lange | 11/11 | 5/5 | 7/7 | 5/5 | |
Total attendance | 96% | 93% | 100% | 94% | 100% |
In 2025 topics discussed by the SB in regular meetings included, but were not limited to:
Transformation programme, rebranding and strategy
The transformation and the new corporate strategy have been key topics for both the ExBo and the SB and were discussed in several meetings throughout 2025. Persistently high costs and pressure on revenues underscored the need for it's transformation programme. The mantra is: simpler, faster and smarter. A fundamental step in the simplification of the organisational structure was the successful launch of the new ASN Bank on 1 July 2025, which involved an optimisation of the distribution network and the rebranding of SNS and de Volksbank to one strong retail brand. The RegioBank rebranding took place at the end of 2025 and BLG Wonen followed on 1 March 2026 The execution of the transformation programme has laid the foundation for the further development and optimisation of the new strategy, which was discussed with the SB in the second half of 2025, including a high-level risk assessment, and eventually approved by the SB in November.
Financial Plan & Budget 2026-2030
The Financial Plan & Budget (FPB) process for 2026-2030 was conducted using a bank-wide top-down approach and was completed in three data rounds between October and November 2025. The planning was carried out in a continuously changing macroeconomic environment in 2025 and taking into account (future) uncertainties due to ongoing geopolitical events impacting the forward-looking parameters used to determine ASN Bank's net profit for the period 2026-2030. The FPB, supported by detailed and substantiated second-line advice, was properly discussed with the Audit Committee and eventually approved in the SB meeting of 18 December 2025.
Reappointment members of the Supervisory Board
On 17 April 2025, the GMS adopted the proposal by the Supervisory Board to reappoint Gerard van Olphen, Jeanine Helthuis and Petra van Hoeken as members of the Supervisory Board for another period of four years, effective from the close of the General Meeting of Shareholders 2025 and ending at the close of the General Meeting of Shareholders in 2029. In 2026, Jos van Lange and Aloys Kregting will both finish their second and final terms. The recruitment and selection process for their successors began in 2025, and two new candidates have been nominated for appointment at the GMS of 16 April 2026.
Cybercrime and cyber risks
In 2025, the Supervisory Board devoted considerable attention to cybercrime and cyber security risks as part of its broader oversight of operational and non‑financial risks. The Board discussed cybercrime as one of the bank’s key risks. The SB was updated on a regular basis on developments and measures taken. In this context, the control framework and IT general controls are continuously improved and tested.
Remediation anti-financial crime and risk management
In parallel to the transformation, the Supervisory Board has noted that in 2025 ASN Bank has substantially stepped up remediation efforts to address the shortcomings in anti-money laundering and risk management that resulted in two fines imposed by De Nederlandsche Bank (DNB) in January 2025. ASN Bank is making progress in both areas and is in continuous dialogue with the supervisory authorities. The progress on ASN Bank’s anti-financial crime remediation plan was discussed every meeting in the presence of the full SB. In 2025, ASN Bank was in touch with DNB on its progress on the SIRA and remediation plan. During this period, ASN Bank transparently kept DNB up to date about its progress, new insights in the depth and scope of its remediation efforts and its approach to compliance with all requirements of Anti-Money Laundering and Anti-Terrorist Financing Act (Wwft). The information provided in this context included opinions of the three lines.
Risk Appetite Statement
In December, after first having discussed within the Risk & Compliance Committee, the Supervisory Board approved the 2026 Risk Appetite Statement, noting the significant enhancements made to the framework, including incorporation of supervisory recommendations. The Supervisory Board emphasised that the strengthened risk appetite framework provides a more robust basis for monitoring the bank’s risk profile, improving resilience to market and regulatory developments, and supporting long‑term, sustainable value creation. The updated RAS more clearly defines the limits within which ASN Bank aims to pursue its strategic 'Simplify and Grow' agenda and contains clearer calibration of key risk indicators.
General topics
Anti-financial crime (KYC, CDD, AML, CFT etc.)
ESG risks, implementation of laws and regulations
Quarterly reports drawn up by Audit and EY
Quarterly Integrated Risk reports
Quarterly reports from the Supervisory Office
Follow-up to the joint EY and Audit management letter
Annual Report, Interim Financial Report, related press releases and Pillar 3 and ESG reports
Annual review and risk analysis of the Remuneration Policy of the ExBo and SB
Realisation of KPIs of the ExBo for 2025 and setting KPIs of the ExBo for 2026
Annual suitability re-assessment of the SB and ExBo
Supervisory Board Rules of Procedures and Committee Charters
Dutch Corporate Governance Code and Dutch Banking Code Statements
Statement on Risk management (Verklaring Omtrent Risicobeheersing) (VOR)
Finance and risk
Financial Plan & Budget, including risk opinion
Monthly Financial Business Report, interim and annual figures, related press releases, Pillar 3 and ESG reports
Internal Capital Adequacy Assessment Process (ICAAP) and Internal Liquidity Adequacy Assessment Process (ILAAP) reports
Litigation statement and non-credit risk provisioning
2025 SREP decision
In-control statement
Supervisory quality assurance and self-assessment (In scope of CSRD)
A Permanent Education plan is in place to deepen and broaden SB's and ExBo's knowledge. In 2025, the SB, together with the ExBo, attended PE sessions on the following subjects:
Customer care and centricity (Klantbelang Centraal) (SB only)
Prudential supervision
Data
Cyber Crime & Architecture
Agentic GenAI
Environmental, Social and Governance (ESG)
The SB and the ExBo assess their own functioning on an annual basis. In October and November 2025, the Supervisory Board engaged an external party to coordinate a self-assessment process. This process included interviews with all members of the Supervisory Board, the ExBo, and other relevant stakeholders such as the Chair of the Works Council and the Company Secretary. Additionally, a survey was completed. Insights from this evaluation were shared and discussed during a Supervisory Board offsite meeting in November 2025.
In 2025, no transactions took place in which there were conflicts of interest with SB members that are of material significance to ASN Bank or the SB members. The Supervisory Board in its current composition meets best practices provisions 2.1.7 thru 2.1.9 of the Dutch Corporate Governance Code, concerning requirements of independency.
Employees and employee participation (In scope of CSRD)
In 2025, the number of requests for advice and information for the Works Council increased steadily. A significant increase was the result of the transformation programme, which gives substance to the transition towards a more efficient organisational structure with a simplified and improved business model. Two 'Drieradendagen' were organised in 2025 in which the Supervisory Board, Executive Board and Works Council together reflect on their cooperation and the state and future of the bank. The first of these took place on 23 April 2025 and the second one on 20 November. The November meeting followed after the Works Council elections in October and was particularly an opportunity to introduce and build relationships with newly elected Works Council members.
The Works Council exercised its right to speak at the GMS of 1 7 April 2025. During this meeting the Works Council also looked back on the activities it performed in the period May 2024 - April 2025.
In 2025, the Works Council, the ExBo and the Supervisory Board met on a regular basis in various combinations. The topics discussed in these meetings included:
The future of ASN Bank
Transformation programme
Know your customer (KYC)
The collective agreement and Social Plan
Pension scheme
Execution of the Strategic Plan 2021-2025
Financial and commercial updates
Annual Report of the Works Council
Results of the employee surveys
Performance management
Social impact
Safe working environment
Employee participation
Absenteeism
Long-term office housing plan
Committees of the Supervisory Board
The SB has formed the following committees from within its own ranks: the Audit Committee (AC), the Risk & Compliance Committee (R&CC), Selection, Nomination & Remuneration Committee (SNRC) and the Environment, Social and Governance Committee (ESG Committee). The task of these committees is to prepare the decision- making of the SB and to support the SB in overseeing the ExBo and its management of ASN Bank and by providing advice on various topics. The SB has drawn up charters for each of these committees and appoints the chairs.
AC | R&CC | SNRC | ESG Committee | |
Gerard van Olphen | - | - | Member | Chair |
Jeanine Helthuis | - | Member | Chair | Member |
Petra van Hoeken | Member | Chair | - | Member |
Aloys Kregting | Member | - | Member | Member |
Jos van Lange | Chair | Member | - | Member |
Audit Committee
The AC advises and assists the SB in its decision making by, inter alia, reviewing the:
(i) reliability of the financial reporting process and risk assessment of issues that may influence financial reporting;
(ii) structure and functioning of the internal risk management system in all matters related to accounting and tax policies and practices, and the internal control system, and relevant statutory and regulatory compliance; and
(iii) independence and functioning of the internal and external auditors.
The AC is composed of at least three members. On 31 December 2025, the committee comprised the following members: Jos van Lange (Chair), Petra van Hoeken and Aloys Kregting. Unless the AC determines otherwise, the CEO, the CFO, the CRO, the Director of Audit and the external auditor (EY) are permanent attendees at every meeting. The Chair of the AC may invite other persons to attend the meeting. The Chair of the AC, the Director of Audit and the external auditor hold a preliminary consultation prior to the meeting, unless they decide otherwise. At least once a year, an AC meeting is held at which the Director of Audit and the external auditor are present outside the presence of the ExBo.
The Charter for the AC was last amended on 1 November 2025.
The AC held five regular meetings in 2025. At each meeting, the AC discussed the reports issued by Audit and received regular updates, either in writing or verbally from EY, the external auditor. Top risks related to both the internal control risks and financial risks were explicitly addressed. Also, the quarterly results were discussed in depth each quarter. The design, existence and operation of the internal control systems were also regularly on the agenda, with the AC paying specific attention to the improvement programmes that were put in place to strengthen internal control and to make the reporting processes more robust.
The Audit Committee reviewed quarterly and annual (financial) reports, internal and external audit findings, and the status of key projects and risk closures, as detailed in audit reports and the joint management letter of EY and Internal Audit. For more information, see the Section Management statement and Independent auditor's report.
In 2025, the Audit Committee focused on enhancing financial reporting controls, independent oversight of reporting risk, and data governance initiatives within the bank. In each meeting of the Supervisory Board, the Chair of the Audit Committee provided a verbal summary of all deliberations, conclusions and recommendations of the AC.
The AC was also informed on a quarterly basis of developments in the field of IT, including key controls reporting, cybersecurity and progress on the BCBS239 programme.
Specific topics discussed in the AC in 2025 included:
1. As regards the reliability of the financial and sustainability reporting process:
Annual Report
Monthly Financial Business Reports, interim and annual figures, related press releases and Pillar 3 reports
Planned dividend distribution for 2025
Management reports
Accounting issues
Financial Plan & Budget
Non-credit risk provisioning and Litigation Statement
Periodic tax updates
New general ledger
Change of external accountant
Statement on Risk Management (Verklaring omtrent Risicobeheersing, VOR)
2. As regards the structure and functioning of matters concerning accounting and tax policies and practices, internal control, and relevant statutory and regulatory compliance:
(Quarterly) reports drawn up by Audit and EY
Quarterly reports drawn up by CIO domain
Tax policy and updates
Data management
Risk Review of the Operational Plan
Joint management letter of EY and Audit
Joint Audit/EY meeting on the functioning and behaviour of the ExBo (tone at the top)
2026 Audit Plan
Quarterly reports drawn up by the Supervisory Office
3. As regards the independence and functioning of the internal and external auditors:
2026 Audit charter
Internal Audit performance assessment
EY Audit plan, risk assessment and (budget) updates
Performance assessment of the external auditor
Risk & Compliance Committee
The R&CC assists and advises the SB on the functioning of the internal risk management system (three lines) and control system, in conjunction with the bank's overall risk appetite, risk profile and strategic objectives.
The R&CC is composed of at least three members. On 31 December 2025, the R&CC comprised the following members: Petra van Hoeken (Chair), Jeanine Helthuis and Jos van Lange. The CEO, CRO, CFO, and the Directors of Audit and Compliance have a standing invitation to attend the meetings of the R&CC. The Chair of the R&CC may invite other persons to attend a meeting. In 2025, the external auditor (EY) also attended the meetings of the R&CC.
Prior to a meeting of the R&CC, the Committee’s Chair has a preliminary consultation with the CRO. The Chair of both the SB and of the R&CC also have regular meetings with the Director of Compliance. The Charter for the R&CC was last amended on 1 November 2025.
The R&CC held six regular meetings and one joint meeting with the SNRC in 2025. In every regular meeting, the R&CC reflected on the financial, non-financial and strategic risks subsequent to discussing the risk context and the risk management function.
The R&CC facilitates the Supervisory Board’s decision-making by overseeing the integrity and quality of the bank’s risk governance framework, risk control systems, and risk appetite development and implementation. This is also a prerequisite for providing reliable financial and operational figures, which demonstrate the coherence between the preparatory work of the R&CC and AC towards the SB.
Additionally, the R&CC provided guidance to the SB on approving the Risk Appetite Statement, ensuring consistency with ASN Bank's Financial Planning and Budget process. The AC provides recommendations on the Financial Planning and Budget before it is submitted to the SB for final approval.
Specific topics discussed in the R&CC in 2025 included:
Quarterly Integrated Risk Reports
Strategic Risk Assessment
2026 Risk Appetite Statement (RAS) including interim updates
ICAAP (Internal Capital Adequacy Assessment Process) and ILAAP (Internal Liquidity Adequacy Assessment Process)
In-control statements and Statement on Risk Management (VOR)
Draft and final 2025 SREP letter
Quarterly reports drawn up by the Supervisory Office
Updates on the residential real estate mortgage portfolio including interest only mortgages
Annual Report on whistle-blowers’ scheme
Cybersecurity risks
Quarterly Compliance reports
Compliance Charter
Annual plan Compliance
Anti-financial crime (KYC, CDD, AML, CFT etc.)
Periodic updates on the various loan portfolios
Remuneration risk analysis
Recovery Plan
Annual evaluation effectiveness Risk Management function and Compliance function
Selection, Nomination & Remuneration Committee
The SNRC, up to 1 July 2025 called the People & Organisation Committee (P&OC), assists and advises the SB in matters that include the (i) Remuneration Policy and terms of employment of the members of the ExBo, senior management and employees; (ii) Appointment Policy of the SB, the ExBo and senior management; (iii) organisational changes and internal succession issues; (iv) supervision on how the ExBo performs its employer's duties; (iv) ensuring that the individual and collective suitability assessments of members of the SB, ExBo and senior management are carried out; and (v) execution assessments on structure, size, composition, functioning and talent management of the ExBo.
The SNRC is composed of at least three members. On 31 December 2025, the committee comprised the following members: Jeanine Helthuis (Chair), Aloys Kregting and Gerard van Olphen. The SNRC may invite members of the ExBo or other persons to attend a meeting such as the CHRO and Director HR. The SNRC meets at least once a year with the R&CC in a joint meeting to discuss people risk and how remuneration outcomes reflect risk. The Chair has regular meetings with the Chair of the Works Council. The Charter for the SNRC was last amended on 1 November 2025. The SNRC held six regular meetings in 2025, and one joint meeting with the R&CC.
Specific topics discussed in the SNRC in 2025 included:
1. As regards the remuneration policy and terms of employment of the members of the ExBo, senior management and employees:
Succession planning
Remuneration report
KPI assessment and achievements by the ExBo and senior management
Progress updates on KPIs for ExBo and senior management
Proposal and realisation on KPIs for the ExBo for 2025 and 2026
2. As regards the appointment policies of the SB, the ExBo and senior management:
Succession planning
Annual self-assessment and permanent education of the ExBo and SB
3. As regards the organisational changes and internal succession topics:
Updates in relation to the transformation
Amendments to the ExBo job profiles
Future of learning and development
4. As regards the supervision of the way in which the ExBo performs its employer's duties:
Employee survey results / Employee Listening
Employer Valuation Proposition
Leadership and Culture
Diversity, Equity and Inclusion Policy
Discussion of HR dashboard, including sickness absence, staff turnover and other indicators of the quality of the work environment
Performance management
Report on the gender pay gap at ASN Bank
Environmental Social and Governance Committee (In scope of CSRD)
The Environmental Social and Governance Committee (ESG Committee), that held its first meeting in December 2024, assists and advices to the SB on matters that focus on the environmental, social and human rights, and governance factors that are relevant to ASN Bank and its stakeholders. This can be either from a financial or from an impact, risk or opportunity perspective. The topics are related to the current transformation ASN Bank is undergoing or will undergo in the future that regard these factors, and how these factors and transitions translate to ASN Bank’s business and the challenges that arise in this context. Furthermore, the ESG Committee assists the SB in its role in developing the bank’s view regarding sustainable long-term value creation by ASN Bank and formulating ASN Bank’s sustainability strategy and related sustainability objectives.
The ESG Committee is composed of at least three members. On 31 December 2025, the ESG Committee comprised all members of the SB: Gerard van Olphen (Chair), Jos van Lange, Petra van Hoeken, Jeanine Helthuis and Aloys Kregting. The Chair of the ESG Committee may invite members of the ExBo, the Head of Sustainability or other persons to attend its meeting. The ESG Committee held five regular meetings in 2025.
The ESG Committee addressed CSRD implementation, reviewed the Double Materiality Assessment (DMA) methodology and results, and advised the Supervisory Board to approve the outcome of the DMA. The ESG Committee also evaluated sustainability reporting readiness for financial year 2025, discussed implementation plans, and considered current challenges.
Specific topics discussed in the ESG Committee in 2025 included:
Sustainability strategy
Transition to Net zero
Quarterly Integrated Sustainability Risk Reports
Double Materiality Assessment (DMA)
CSRD oversight and regulations
Application with ESG laws and regulations
Relationship and meetings with the shareholder
NL Financial Investments (NLFI) is the sole shareholder of ASN Bank. NLFI and ASN Bank signed a Memorandum of Understanding (MoU) in 2019 and this MoU contains agreements governing the relations between NLFI and ASN Bank. NLFI, the ExBo and (representative of) the SB meet periodically in accordance with an annual meeting calendar. In separate meetings between the SB and NLFI various topics including the assessment of the SB and the ExBo are discussed. In addition, the GMS is prepared in consultation with NLFI.
In 2025, the General Meeting of Shareholders (GMS) was held on 17 April. As the sole shareholder of ASN Bank N.V. (until 1 July 2025 called ‘de Volksbank N.V.’), NLFI reports to the Minister of Finance every year by means of a progress report. This report provides an overview of the extent to which ASN Bank is implementing its strategy and assesses whether ASN Bank is ready for a future independent of the Dutch State. On 30 June 2025, the Minister of Finance informed the House of Representatives of the state of affairs based on NLFI’s progress report dated June 2025. In this report, NLFI stated that ASN Bank, by then still called de Volksbank, has made some progress in implementing its strategy, but that it is not yet sufficiently healthy and stable to allow a definitive decision on its future (such as privatisation). NLFI emphasised that critical programmes – including remediation of Anti-Financial Crime (AFC), risk management improvements and IT/data quality transformation – are essential for strengthening the bank’s operational and commercial results.
Financial statements and dividend proposal
At the GMS on 17 April 2025, NLFI agreed to ASN Bank’s proposal to retain the net profit for the financial year 2024. Prior to publication, the Supervisory Board discussed the 2024 financial statements with the ExBo, internal auditor and external auditor (EY) and took note of the unqualified external auditor’s report that EY issued on the annual accounts in 2024. The Supervisory Board advised the GMS to adopt the 2024 annual accounts and dividend proposal.
Remuneration report
Introduction
This report covers the remuneration of ASN Bank's Executive Board (ExBo) and Supervisory Board (SB). ASN Bank is committed to a sustainable and fair future for everyone which also effects its remuneration policy. In equal situations, equal remuneration is provided; factors such as gender or ethnicity have no influence on remuneration and/or recognition. This also applies to the ExBo and SB. No variable remuneration arrangements apply.
Executive Board Remuneration policy
Remuneration elements
Appointments to the ExBo are made for four years, and are based on a contract of service. The remuneration consists of a director's fee, a pension contribution and fringe benefits, such as compensation for the loss of pension accrual above € 137,800 and a lease car.
Director's fee
The director's fee of the ExBo has been increased, in line with the collective agreement increase, just like the salaries of employees, by 3.5% as of 1 February, 2025 and by 1.75% as of 1 May 2025. The CFO's director's fee has been increased due to an expansion of the role. As of 1 May 2025, the director's fee of the ExBo members amounts to:
CEO: € 501,735
CFO, CRO, COO and CFCO: € 410,726
On the one hand, it is understandable restrictions have been imposed in exchange for the State aid received and it was ASN Bank’s own decision not to want to offer compensation at top market level. On the other hand, the salary freeze, which has been in force for many years now, is increasingly becoming a barrier to attract and retain executive directors for ASN Bank. While regulatory requirements imposed on executive directors have increased enormously in recent years, and more and more is expected of them in terms of content. However, legislation does not allow remuneration to be set at an appropriate level, which represents a strategic risk for the company going forward.
Labour market comparison
Every two to three years we compare the director's fee of the ExBo with the remuneration of a reference group with comparable financial and non-financial companies. This comparative study was last conducted in August 2025, and shows that the director's fee of the CEO is 23% (2023: 21%) below the median of the reference group. When also considering variable remuneration, the director's fee is 46% (2023: 43%) below the market median.
The director's fee of the CFO, CRO, COO and CFCO is on average 10% (2023: 20%) below the median of the reference group. When also considering variable remuneration, the director's fee is 43% (2023: 36%) below the market median.
Pension
The ExBo has the same pension scheme as ASN Bank employees with no additional pension rights granted. To compensate for the lack of pension accrual above € 137,800, the directors receive a gross allowance of 16.35% of the director's fee above that threshold as compensation.
Other
The fringe benefits of the ExBo are largely equal to the fringe benefits of ASN Bank employees.
In case of interim contract termination at the initiative of ASN Bank the ExBo member receives a one-off severance payment not exceeding the applicable annual director's fee.
Performance objectives and link with remuneration (In scope of CSRD)
The SB determines the performance objectives for the ExBo annually. These are derived from the strategic (long-term) objectives of ASN Bank. In doing so, the SB takes into account the desired risk profile, sustainability legislation (ESG) and the sustainability ambitions of ASN Bank. These themes are safeguarded every year. Furthermore, the SB takes into consideration the interests of all stakeholders of ASN Bank. The performance objectives are converted into measurable and achievable KPIs at ExBo level, after which they are cascaded to the relevant functions. The performance objectives and corresponding KPIs are evaluated annually. In exceptional circumstances, the ExBo has the opportunity to adjust one or more KPIs to reflect changing circumstances and business objectives
Because the ExBo members receive a fixed director's fee, there are no remuneration incentives that could proritise individual short-term interests above collective long-term objectives. After each performance period, the SB assesses the ExBo on the realisation of the KPIs. The SB also evaluates the progress of the long-term objectives.
The performance objectives for 2025 and 2026 are included in the tables below.
Aspect | Associated Main KPIs, if applicable | Weight |
|---|---|---|
Finance | Adjusted Cost/income ratio | 15% |
Adjusted Return on Equity | ||
Common Equity Tier 1 ratio | ||
Leverage ratio | ||
Transformation | 20% | |
Retail | Net Promoter Score | 20% |
Number of active multi-customer | ||
Operations & IT | 15% | |
Risk & Compliance | 20% | |
ESG | Climate neutral balance sheet | 5% |
Staff | Employee engagement | 5% |
100% |
Aspect | Associated Main KPIs, if applicable | Weight |
|---|---|---|
Finance | Adjusted Cost/income ratio | 15% |
Adjusted Return on Equity | ||
Common Equity Tier 1 ratio | ||
Leverage ratio | ||
Commercial: | Net Promotor Score | 20% |
Increase sustainable impact | Towards net zero in 2050 | 10% |
Right size and simplify organisation | 15% | |
Modernise IT & Data | 15% | |
In control & Risk Appetite | 15% | |
Increase execution power | Employee engagement | 10% |
100% |
At the end of each year the SB assesses to what extent the performance objectives have been achieved. The SB has determined the realisation for 2025 at 61%. The SB emphasises that this realisation should be viewed in the context of the highly ambitious performance objectives that were set for 2025. While the numerical score of 61% does possibly not fully capture this context, the SB is of the view that the progress made and the impact delivered by the ExBo in 2025 have been substantial and appreciated.
Remuneration of the Executive Board
The table below provides a total overview of the remuneration of each ExBo member. In 2024, ASN Bank reported on the remuneration of the other three members of the Executive Committee, in addition to the statutory directors. As from 2025, following the changes in governance structure, ASN Bank has changed the scope of its Remuneration report to the statutory directors. As a result, these non-statutory directors are no longer included in the comparable figures 2024. On 1 March 2025, Gwendolyn van Tunen (former Executive Committee member) and Isold Heemstra joined the ExBo.
in € thousands | Position | Fixed annual income | Pension1 | Other2 | Severance pay | Total | |||||
|---|---|---|---|---|---|---|---|---|---|---|---|
2025 | 2024 | 2025 | 2024 | 2025 | 2024 | 2025 | 2024 | 2025 | 2024 | ||
Roland Boekhout3 | CEO | 497 | 290 | 27 | 16 | 77 | 46 | -- | -- | 601 | 352 |
André Haag | CFO | 403 | 361 | 27 | 26 | 73 | 69 | -- | -- | 503 | 456 |
Saskia Hoskens3 | CRO | 407 | 281 | 27 | 19 | 75 | 51 | -- | -- | 509 | 351 |
Isold Heemstra3 | COO | 341 | -- | 22 | -- | 934 | -- | -- | -- | 456 | -- |
Gwendolyn van Tunen3 | CFCO | 341 | -- | 22 | -- | 56 | -- | -- | -- | 419 | -- |
Martijn Gribnau5 | -- | 180 | -- | 10 | -- | 51 | -- | -- | -- | 241 | |
Jeroen Dijst5 | -- | 97 | -- | 7 | -- | 15 | -- | -- | -- | 119 | |
Marinka van der Meer5 | -- | 180 | -- | 13 | -- | 32 | -- | 71 | -- | 296 | |
Total Executive Board | 1,989 | 1,389 | 125 | 91 | 374 | 264 | -- | 71 | 2,488 | 1,815 | |
Former directors: | |||||||||||
Marinka van der Meer5 | -- | 180 | -- | 13 | -- | 32 | -- | -- | -- | 225 | |
Total current and former Executive Board members | 1,989 | 1,569 | 125 | 104 | 374 | 296 | -- | 71 | 2,488 | 2,040 | |
- The pension is the employer contribution minus the employee’s personal pension contribution.
- 'Other’ includes all remaining remuneration, including the supplement as compensation for the loss of the pension accrual in excess of € 137,800, the addition for the use of a company car and social security contributions.
- The following members joined the Executive Board, with their remuneration included from their respective start dates: S. Hoskens (10 March 2024), R. Boekhout (22 May 2024), I. Heemstra (1 March 2025) and G. van Tunen (1 March 2025)
- In connection with the recruitment of Mr. Heemstra, relocation costs have been reimbursed.
- The following members stepped down: M. van der Meer (stepped down as a member on 1 July 2024 and left the bank on 31 December 2024), M. Gribnau (22 May 2024) and J. Dijst (10 April 2024).
Pay ratios (In scope of CSRD)
ASN Bank strives to ensure that the remuneration of the ExBo is reasonably proportionate to the remuneration of the employees and to the average remuneration in the Netherlands. Because different regulations with different requirements apply, such as the Global Reporting Initiative and the Corporate Sustainability Reporting Directive, ASN Bank reports below both figures relative to the median and the average.
The remuneration of the CEO, the highest remuneration, has increased by 4.7% over the past year and the median remuneration of employees (excluding CEO) has increased by 10.3% over the past year.
These ratios are determined based on base salary/director's fee, allowances, pension and social security contributions but without fringe benefits such as lease car or WIA insurance premium.
Pay ratios over the past five years (as at 31 December) are as follows:
2025 | 2024 | 2023 | 2022 | 2021 | |
|---|---|---|---|---|---|
Internal | |||||
Ratio between CEO remuneration and the average employee salaries | 5:1 | 6:1 | 6:1 | 6:1 | 6:1 |
Ratio between CEO remuneration and the median employee salaries | 6:11 | 6:1 | 6:1 | 6:1 | 7:1 |
Ratio between the average remuneration of ExBo members and the average employee salaries | 4:1 | 4:1 | 4:1 | 4:1 | 4:1 |
Ratio between the CEO remuneration and the maximum of the lowest pay grade as at 31 December | 17:1 | 20:1 | 19:1 | 20:1 | 20:1 |
External | |||||
Ratio CEO remuneration and the average pay in the Netherlands according to the OECD | N/A2 | 9:1 | 9:1 | 9:1 | 9:1 |
Ratio between the average remuneration of ExBo members and the average pay in the Netherlands according to the OECD | N/A2 | 6:1 | 7:1 | 7:1 | 7:1 |
- In scope for CSRD
- At the time of publication, the OECD figure was not yet known and no ratio for 2025 could, therefore, be presented. These figures will be included in next year’s annual report.
Share ownership
The ExBo members do not hold any shares in ASN Bank. All shares are 100% owned by NLFI, which has issued share certificates to the Dutch State in return.
Loans
As at 31 December 2025, there were no outstanding loans to board members.
Supervisory Board Compensation Policy
In September 2024, we benchmarked the compensation of the SB with a reference group of comparable financial and non-financial companies. This shows that the compensation is on average 16% (2022: 30%) below the median of the reference group.
In 2023, the shareholder decided to index the compensations of the SB from 1 January 2023 with the collective agreement increases for employees of ASN Bank. For 2023, 2024 and 2025, a catch-up indexation was also agreed for the missed indexation from 2018 to 2022. In 2025, as of 1 March the compensation was increased by 2.6% of the amount that was applicable on 31 December 2022.
The table below provides an overview of the fixed annual compensation for the members of the SB and the compensation per committee. Members of the SB can also claim travel expenses related to ASN Bank.
in € | Remuneration 1-1-2025 | 3.5% CA increase as from 1-2-2025 | Catch-up indexation 2.6% as from 1-3-2025 | 1.75% CA increase as from 1-5-2025 |
|---|---|---|---|---|
Chair of the Supervisory Board | 50,319 | 52,081 | 53,225 | 54,156 |
Vice Chair of the Supervisory Board | 38,960 | 40,323 | 40,3231 | 41,029 |
Member of the Supervisory Board | 35,224 | 36,456 | 37,257 | 37,909 |
Committee Chair2 | 8,005 | 8,286 | 8,468 | 8,616 |
Committee member2 | 5,604 | 5,800 | 5,927 | 6,031 |
- The position of Vice Chair is a new role created in 2023 for which no catch-up indexation is applicable.
- There are four committees: Audit Committee; Selection, Nomination and & Remuneration Committee; Risk and Compliance Committee and ESG Committee.
Compensation of the Supervisory Board
The table below provides a total overview of the actual compensation per member of the SB:
in € thousands | 2025 | 2024 |
|---|---|---|
Gerard van Olphen (Chair) | 68 | 58 |
Jos van Lange (Vice Chair) | 61 | 54 |
Jeanine Helthuis | 58 | 50 |
Petra van Hoeken | 58 | 50 |
Aloys Kregting | 55 | 47 |
Total | 300 | 259 |
Share ownership
The members of the SB do not hold any shares in ASN Bank. All shares are 100% owned by NLFI, which has issued share certificates to the Dutch State in return.
Loans
As of 31 December 2025, there were no outstanding loans to members of the SB.
Remuneration oversight (In scope of CSRD)
Both the SB and the ExBo are responsible for remuneration oversight within ASN Bank. Other involved parties include the Selection, Nomination & Remuneration Committee (SNRC) of the SB, the control departments, Compliance, Risk and Internal Audit and the staff departments Legal and Human Resources.
Supervisory Board
The SB, upon the proposal of the SNRC, draws up this remuneration report.
The SB is responsible for the implementation and evaluation of the remuneration policy for the members of the ExBo. The shareholder is responsible for approving the remuneration policy for the ExBo.
The SB, with due regard of the advice of the SNRC, approves the general remuneration policy for employees of ASN Bank, as proposed by the ExBo and oversees its implementation. Material exceptions to this policy require the prior approval of the SB, with due regard of the advice of the SNRC.
The SB also directly oversees the remuneration of the ultimately responsible directors of Compliance, Risk and Internal Audit. The SB may call upon the expertise of independent remuneration experts where necessary.
The SB discusses material retention, sign-on and severance payments and ensures that these fit within the established remuneration policy of ASN Bank and are not excessive.
The SB ensures at least once a year a central and independent internal assessment of (the application of) the remuneration policy by Internal Audit.
Executive Board
The ExBo is responsible for implementing the general remuneration policy for employees of ASN Bank.
The ExBo is responsible for the approval of non-material retention, sign-on and severance payments for employees of ASN Bank.
The ExBo has the discretionary authority to deviate in exceptional situations from the general remuneration policy for employees of ASN Bank in a motivated manner and within the frameworks of laws and regulations. A process including appropriate control measures has been established for this. Any material exceptions require the prior approval of the SB, with due regard of the advice of the SNRC.
The ExBo is responsible for the approval of market comparisons of remuneration.
Control and staff departments
The control departments Compliance and Risk and the staff departments Legal and Human Resources each oversee the remuneration policy and its compliance from their respective roles. The Internal Audit department periodically conducts independent audits into the design and implementation of the remuneration policy.
Legal structure of ASN Bank
Stichting administratiekantoor beheer financiële instellingen (NL Financial Investments; NLFI) holds 100% of the share capital of ASN Bank on behalf of the Dutch State. NLFI is a foundation with a statutory task established by the Minister of Finance and was established to exercise the shareholder rights on behalf of the Dutch State in a number of financial institutions in a commercial, non-political manner and a transparent separation of interests.
The overview below comprises a statement of all wholly-owned subsidiaries as at 31 December 2025.
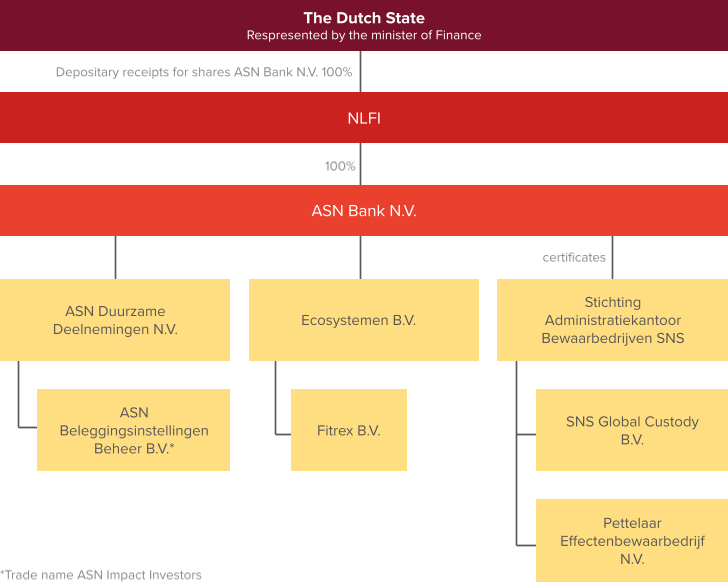
Other governance information
Banking Code
The Banking Code (Code Banken) was drawn up by the Netherlands Bankers’ Association (NVB) to ensure that Dutch banks commit to and account for treating their customers with care, whilst balancing the interests of various stakeholders. The Banking Code contains a Social Charter and rules of conduct for people employed in the Dutch banking sector. Subsequently, the Banking Code lays out the principles that Dutch banks should take into account in terms of corporate governance, risk management, audit and sound remuneration. The Banking Code is a form of self-regulation to which banks themselves apply the “comply or explain" principle.
ASN Bank strongly supports the principles of the Banking Code to ensure stability and protection of the interests of its stakeholders. ASN Bank applies the principles of the Banking Code in full for the financial year 2025. For more detailed information on how ASN Bank applies the Code, please refer to the statement on our website.
Dutch Corporate Governance Code
The Dutch Corporate Governance Code 2025 (DCGC) contains principles and best practice provisions that regulate relations between, inter alia, the ExBo, the Supervisory Board, the general meeting and other stakeholders. In 2025, the DCGC was updated to introduce the Statement on Risk Management (Verklaring Omtrent Risicobeheersing) (VOR). Accordingly, from 2025 onwards, the VOR has been fully incorporated into the management statement.
ASN Bank applies the DCGC on a voluntary basis. Although ASN Bank is not a listed company and all its shares are held by NLFI, ASN Bank considers the principles of the DCGC to reflect widely accepted best practises for sound and responsible governance. Where applicable, ASN Bank applies the DCGC in full, except where certain provisions are not applicable due to its legal structure, ownership structure or governance model, or where deviations are justified in light of statutory remuneration restrictions applicable to financial institutions.
For more detailed information on how ASN Bank applies the DCGC, please refer to the statement on our website.
Control over financial and sustainability reporting
The management and control systems for financial reporting form an integral part of ASN Bank risk management and control systems. Sustainability reporting has recently been added to these systems and we are now fully integrating these activities into these systems to reduce the risk of reporting errors and omissions. The most important principal bodies and elements to manage ASN Bank's financial and sustainability reporting are the:
Leadership Team of Finance, which sets the framework for the policies and organisation of financial accounting systems and processes;
Our Accounting Manual and ESRS policies, which describe the principles for financial and sustainability reporting;
Departments, which are responsible for the correct and complete administration of the products, execution of maintenance activities and recording of transaction data, so as to produce accurate and truthful reports;
Administrative and reporting departments, whose system of financial and sustainability key controls monitors the proper functioning of the management and control system for financial and sustainability reporting purposes;
Assessments, which are partially based on the results of the key controls, periodic management reports and KPI dashboards with an analysis of financial and non-financial figures by the Leadership Team of Finance;
ExBo, which approves the findings of the reporting process and the financial and sustainability reporting itself, both of which are subsequently discussed in the Audit Committee. Additionally, the latter monitors our sustainability reporting processes, including the plans for improvements, risks, internal controls, and their operating effectiveness; and
Internal Audit department, which examines the system's operation.
In 2025, we have updated and expanded our Financial Key Control Framework to ensure we have a complete inventory of key controls to substantiate the complete, accurate and timeliness of our statutory disclosures.
Responsible tax policy
ASN Bank and its associated brands are fully committed to a responsible and transparent tax policy. The bank recognises taxation as a key mechanism for promoting sustainable and responsible corporate behaviour, contributing to public goods and the Sustainable Development Goals (SDGs). ASN Bank adheres to all relevant laws and regulations and has formally adopted the VNO-NCW Tax Governance Code. Transparency and public accountability are central: the tax policy is reviewed annually and disclosed in the annual and financial reports.
The bank is dedicated to full compliance with tax laws and the spirit of the legislation. ASN Bank does not engage in aggressive tax planning, does not use tax havens, and does not enter into confidential agreements with tax authorities. Tax considerations do not drive business decisions. Any tax benefits are only utilised if they align with the bank’s corporate social responsibility commitments.
Internationally, ASN Bank supports initiatives against tax avoidance, such as those led by the OECD and the EU. The bank’s operations are limited to the Netherlands, so international reporting requirements (such as country-by-country reporting) do not apply. The introduction of the global minimum tax (Pillar II) is expected to have an administrative filing impact only, as ASN Bank’s effective tax rate consistently exceeds 15%.
ASN Bank maintains a proactive, transparent, and trust-based relationship with the Dutch tax authorities. Since 2023, ASN Bank has been classified as a Top post 100 company and operates under an Individual Monitoring Plan. Regular meetings and open communication are standard practice. Any errors are corrected in consultation with the tax authorities.
The tax organisation falls under the CFO and consists of qualified professionals. Tax positions are periodically reviewed by the relevant committees and the external auditor. Risk management is embedded in the Integrated Control Framework and follows the Three Lines Model. Customer tax integrity and transaction tax risks are carefully monitored; ASN Bank does not knowingly offer products or services to parties involved in tax evasion or aggressive tax planning.
Apart from corporate income tax, ASN Bank is subject to several other taxes. More information regarding these taxes and amounts for 2025, can be found in the Section Taxation.
Environmental taxes, such as carbon, plastic, sugar tax or tax credits for renewable energy investments, are not included, as they generally do not apply to our business and to the organisation. This may change in the future due to new tax reforms.
Statement on Risk management
In accordance with best practice of the 2025 Dutch Corporate Governance Code, the Executive Board (ExBo) of ASN Bank N.V. (ASN Bank) states that it is responsible for the design, implementation and functioning of ASN Bank’s internal risk management and control systems.
The Executive Board (ExBo) of ASN Bank N.V. is responsible for the set-up, presence, and operation of the (risk) management and control system. This system is designed to manage risks, to support ASN Bank in achieving its strategic, operational and financial objectives, and to ensure that reporting on financial and sustainability performance indicators is reliable and that laws and regulations are complied with.
The bank applies the Three Lines Model with an organisational structure and accompanying accountability structure, as laid down in governance and risk committees. To manage risks, the bank applies the COSO Enterprise Risk Management (ERM) Framework. The Risk Management Framework (RMF) enables ASN Bank to properly apply all COSO ERM elements and serves as a generic tool for both the first line and second line. The RMF ensures consistent terminology and provides a compatible methodology for the identification, assessment, measurement, monitoring, management and reporting of key risks.
The bank’s risk management is also further refined in the annual Financial Plan & Budget (FP&B) cycle, which translates strategic objectives and risk appetite into key risk and performance indicators and operational objectives for the years ahead. The main risks associated with the FP&B implementation are identified. This cycle is carried out in all parts of the organisation. The business units report on their performance and risks. The effectiveness of the key control measures and controls is regularly examined and tested.
In 2025, the ExBo assessed the strategic risks including sustainability, operational, financial, reporting and compliance risks. In addition, the ExBo periodically had the effectiveness of the design and operation of the risk management and control system tested, as described in the Section Risk management. Therefore, the ExBo has the oversight over the effectiveness of the internal risk management and control systems. The ExBo managed a portfolio of projects that improved the effectiveness of the risk management and control system. The results were discussed with the Risk & Compliance Committee and shared with the Audit Committee and the Supervisory Board, and discussed with the external auditor.
Based on the aforementioned, the ExBo declares that:
The management report provides sufficient insights into any failings of the effectiveness of the internal risk management and control systems.
The internal risk management and control system provides reasonable assurance that the financial reporting in the ASN Bank Annual Report 2025 does not contain material inaccuracies and limited assurance that the sustainability reporting in the ASN Bank Annual Report 2025 does not contain material inaccuracies.
The ExBo is not aware that our internal risk management and control systems do not provide sufficient comfort that the identified operational and compliance risks faced by the company over the year are effectively controlled or addressed in remediation programmes as disclosed in the Risk management section. 'Sufficient comfort' means comfort that takes into account our risk appetite, organisational complexity, system limitations, and related disclosures in our management report.
Based on the current state of affairs, it is justified that the financial reporting in the ASN Bank Annual Report 2025 is prepared on a going-concern basis.
The ASN Bank Annual Report 2025 states the material risks and uncertainties, to the extent that they are relevant to the expectation of ASN Bank NV’s continuity for the period of 12 months after the preparation of this report.
However, it should be noted that the internal risk management system does not provide absolute assurance that it can prevent all inaccuracies, errors, fraud, or non-compliance with laws and regulations at all times.
At the end of every year, the bank executes an internal review of all identified deviations to a proper functioning of the internal control system. These deviations are translated into arears of attention, which are ultimately reviewed by the ExBo for their overall impact and required actions. For 2025, the recognised topics are clearly addressed ASN Bank's risk appetite and embedded in the organisation through mitigating measures and remediation plans. The main topics are:
Risk management and risk culture
Data management
Models
Laws & regulations and Supervisory expectations
Anti-financial crime
Privacy
Safety, continuity and cyber
Definitions and mitigating measures are described in the Section Risk management.
Responsibility statement
The members of the ExBo declare that:
The consolidated and company 2025 Financial Statements of ASN Bank have been prepared in accordance with IFRS Accounting Standards as adopted by the European Union and with Part 9 of Book 2 of the Netherlands Civil Code, and that they give, to the best of our knowledge, a true and fair view of the assets, liabilities, size and composition of the equity, the financial position as at 31 December 2025, the result and cash flows, and companies included in the consolidation;
The Sustainability statements have been prepared in accordance with the ESRS requirements. In anticipation of transposition of the CSRD into Dutch law, ASN Bank decided to voluntarily use this framework and to adhere with the CSRD;
In response to the European Commission's recently proposed Omnibus amendments, ASN Bank assessed the implications of the proposed changes to ensure continued compliance with evolving European regulatory standards;
The Annual Report 2025, to the best of our knowledge, gives a true and fair view of the situation as at the balance sheet date and of the course of events during the financial year; and
The Annual Report 2025 describes the main risks faced by ASN Bank.
Utrecht, 12 March 2026
Roland Boekhout (Chair)
André Haag
Saskia Hoskens
Isold Heemstra
Gwendolyn van Tunen

Financial statements
Consolidated financial statements
Before result appropriation and in € millions | Notes | 31-12-2025 | 31-12-2024 |
|---|---|---|---|
Assets | |||
Cash and balances at central banks | |||
Derivatives | |||
Investments | |||
Loans and advances to banks | |||
Loans and advances to customers | |||
Tangible and intangible assets | |||
Tax assets | |||
Other assets | |||
Total assets | |||
Liabilities | |||
Derivatives | |||
Amounts due to banks | |||
Amounts due to customers | |||
Debt certificates | |||
Subordinated debts | |||
Provisions | |||
Tax liabilities | |||
Other liabilities | |||
Total liabilities | |||
Equity | |||
Share capital | |||
Reserves | |||
Net result for the period | |||
AT1 capital securities | |||
Total equity | |||
Total equity and liabilities |
in € millions | Notes | 2025 | 2024 |
|---|---|---|---|
Income | |||
Interest income calculated using the effective interest method | |||
Other interest income | |||
Interest expense calculated using the effective interest method | |||
Other interest expense | |||
Net interest income | |||
Fee and commission income | |||
Fee and commission expenses | |||
Net fee and commission income | |||
Investment income (losses) | - | ||
Other results on financial instruments | |||
Total income | |||
Expenses | |||
Staff costs | |||
Depreciation and amortisation of tangible and intangible assets | |||
Other operating expenses | |||
Total operating expenses | |||
Impairment charges (releases) on financial assets | - | - | |
Total expenses | |||
Result before taxation | |||
Taxation | |||
Net result for the period | |||
Attributable to: | |||
Owners of the parent company |
in € millions | 2025 | 2024 |
|---|---|---|
Net result for the period | ||
Other comprehensive income (after taxation): | ||
Items that are reclassified to the income statement: | ||
Change in cashflow hedge reserve | - | - |
Change in fair value reserve | ||
Total items that are reclassified to the income statement (after taxation) | - | |
Total comprehensive income for the period (after taxation) | ||
Attributable to: | ||
Owners of the parent company |
in € millions | Notes | Issued share capital | Share premium reserve | Cashflow hedge reserve | Fair value reserve | Other reserves including retained earnings | Net result for the period | AT1 capital securities | Total equity |
|---|---|---|---|---|---|---|---|---|---|
Balance as at 1 January 2025 | - | - | |||||||
Net result | |||||||||
Other comprehensive income | - | ||||||||
Total comprehensive income | - | ||||||||
Transfer of net result | - | ||||||||
Paid interest on AT 1 capital securities | - | - | |||||||
Dividend | |||||||||
Other movements | |||||||||
Balance as at 31 December 2025 | - | - |
in € millions | Notes | Issued share capital | Share premium reserve | Cashflow hedge reserve | Fair value reserve | Other reserves including retained earnings | Net result for the period | AT1 capital securities | Total equity |
|---|---|---|---|---|---|---|---|---|---|
Balance as at 1 January 2024 | - | - | |||||||
Net result | |||||||||
Other comprehensive income | - | - | |||||||
Total comprehensive income | - | ||||||||
Transfer of net result | - | ||||||||
Paid interest on AT 1 capital securities | - | - | |||||||
Dividend | - | - | |||||||
Other movements | - | - | |||||||
Balance as at 31 December 2024 | - | - |
in € millions | Notes1 | 2025 | 2024 |
|---|---|---|---|
Cashflow from operating activities | |||
Result before taxation | |||
Adjustments for | |||
Depreciation and amortisation of tangible, intangible assets and right-of-use assets | |||
Changes in other provisions and deferred tax | - | ||
Impairment charges and reversals on financial assets | - | - | |
Unrealised results on investments through profit or loss | - | - | |
Tax paid | - | - | |
Changes in operating assets and liabilities | |||
Change in advances to customers | - | - | |
Change in liabilities to customers | |||
Change in derivatives assets | |||
Change in derivatives liabilities | - | - | |
Change in advances to banks | - | - | |
Change in liabilities to banks | - | - | |
Change in trading portfolio | - | ||
Change in other operating activities | - | ||
Net cashflow from operating activities | - | - | |
Cashflow from investment activities | |||
Sale and redemption of investments | |||
Purchase of property and equipment | - | - | |
Purchase of investments | - | - | |
Net cashflow from investment activities | - | ||
Cashflow from finance activities | |||
Proceeds from subordinated loans | |||
Proceeds from debt certificates | |||
Repayment of subordinated loans | - | ||
Repayment of debt certificates | - | - | |
Payment of lease liabilities | - | - | |
Interest paid on AT1 capital securities | - | - | |
Dividends paid | - | ||
Net cashflow from financing activities | |||
Net increase of cash and cash equivalents | - | - | |
Cash and cash equivalents at beginning of period | |||
Cash and cash equivalents at end of period | |||
Additional disclosure with regard to cashflows from operating activities | |||
Interest received | |||
Dividends received | |||
Interest paid |
- The references next to the items relate to the notes to the consolidated financial statements.
Notes to the consolidated financial statements
Accounting principles for the consolidated financial statements
This section describes ASN Bank’s material accounting policies and critical accounting estimates or judgements relating to the consolidated annual financial statements. If an accounting policy or a critical accounting estimate relates to a specific note, it is included in the disclosures of the relevant note.
To combine disclosures where possible and to reduce duplication, the IAS 1 capital management disclosures and IFRS 7 risk disclosures regarding financial instruments have been integrated in the Section Risk, funding and capital for those marked with the label 'Audited'. These disclosures are an integral part of the consolidated annual financial statements and as such, support the compliance with these IFRS Accounting Standards requirements.
General information
Adoption of the financial statements
The consolidated financial statements of ASN Bank for the year ended 31 December 2025 were drawn up by the Executive Board and authorised for publication following approval by the Supervisory Board on 12 March 2026. The financial statements will be submitted for adoption to the General Meeting of Shareholders which will be held on 16 April 2026. The General Meeting of Shareholders is permitted to amend the financial statements.
Basis of preparation
Statement of IFRS Accounting Standards compliance
ASN Bank prepares the consolidated financial statements in accordance with International Financial Reporting Standards (IFRS Accounting Standards), as adopted within the European Union. Pursuant to the option offered under Book 2, Title 9 of the Dutch Civil Code, ASN Bank prepares its company financial statements in accordance with the same accounting principles as those used for the consolidated financial statements. The presentation and notes in the company financial statements are based on Title 9, Book 2 of the Dutch Civil Code.
ASN Bank's annual financial statements have been prepared on a going-concern basis and there are no significant doubts about the ability of ASN Bank to continue as a going concern.
Changes in published Standards and Interpretations
The following standards and interpretations issued by the International Accounting Standards Board (IASB) and the IFRS Interpretations Committee (IFRIC), respectively were adopted by the EU and are applicable in the current financial year:
Amendments to IAS 21 The Effects of Changes in Foreign Exchange Rates: Lack of Exchangeability (endorsed by the EU).
This amendment does not have a material impact on the condensed consolidated interim financial statements.
In 2025, the following standards and interpretations issued by the International Accounting Standards Board (IASB) and the IFRS Interpretations Committee (IFRIC) respectively, were adopted by the European Union (effective as at 1 January 2026):
Annual Improvements Volume 11 (issued on 18 July 2024)
Contracts Referencing Nature-dependent Electricity – Amendments to IFRS 9 and IFRS 7 (issued on 18 December 2024)
Amendments to the Classification and Measurement of Financial Instruments – Amendments to IFRS 9 and IFRS 7 (issued on 30 May 2024)
IFRS 18 Presentation and Disclosure in Financial Statements ( issued on 9 April 2024 and effective 1 January 2027)
The following standards and interpretations issued by the International Accounting Standards Board (IASB) and the IFRS Interpretations Committee (IFRIC) respectively are not endorsed yet by the European Union.
IFRS 19 Subsidiaries without Public Accountability: Disclosures (issued on 9 May 2024)
Amendments to IFRS 19 Subsidiaries without Public Accountability: Disclosures (issued on 21 August 2025)
Amendments to IAS 21 The Effects of Changes in Foreign Exchange Rates: Translation to a Hyperinflationary Presentation Currency (issued on 13 November 2025)
Although the expected impact of the amendments and improvements from IFRS 18 are currently under review, it is expected that the abovementioned standards and amendments to existing standards will not have a material impact on the financial statements. The effect of IFRS 18 is explained below.
In April 2024 the IASB published the new standard IFRS 18 Presentation and Disclosure in Financial Statements which will replace IAS 1 Presentation of Financial Statements.
IFRS 18 sets out general and specific requirements for presentation and disclosures in financial statements with focus on the income statement and reporting of financial performance. This standard also sets out requirements for the disclosure of information in the notes and enhanced requirements for grouping (aggregation and disaggregation) of information. The new standard is effective on 1 January 2027.
As IFRS 18 will not change ASN Bank’s recognition and measurement, this will not affect the net result for the period. However, it will impact the structure of the income statement by adding two new defined subtotals and the application of a consistent classification of income and expenses into operating, investing and financing categories. In addition, IFRS 18 requires disclosures of management-defined performance measures.
ASN Bank is currently assessing the impact of the standard on the presentation and disclosures in the financial statements.
Changes in accounting policies, estimates and presentation
ASN holds foreign currency deposits and economically hedges the related exposure using foreign currency swaps. These swaps comprise both an interest (forward points) component and a foreign currency component. Previously, ASN presented both components within Other results on financial instruments.
In 2025, ASN Bank voluntarily changed its accounting policies regarding the presentation of the economic hedges by presenting the interest component (forward points) in Other income and Other interest expense while continuing to present the foreign currency component in Other result on financial instruments. This change in accounting policies leads to more relevant information as it better represents the economic reality as the economic hedge effect is presented in the same line as the exposure it is intended to mitigate. This further contributes to an improved insight in the composition of Net interest income. The comparative figures in the respective line items for the period ended 31 December, 2024 have been adjusted accordingly reducing Other results on financial instruments by € 113 million and increasing Other interest income by € 146 million and Other interest expense by € 33 million. The effect of this change in accounting policy in 2025 is an increase of € 122 million in Other interest income, an increase of € 32 million in Other interest expense and a € 90 million reduction on Other result on financial instruments. As this change in accounting policies entails a reclassification from Other results on financial instruments to Other interest income and Other interest expense, there is no impact on equity as per 31 December 2024 neither on net result for the period ended 31 December 2024. For the updated policy, please refer to the Accounting policy for net interest income.
In 2025, we implemented an enhanced IFRS 9 Expected Credit Loss (ECL) model for residential mortgages. This new model version was developed to address identified shortcomings, while delivering improvements in model methodology and performance. This had a downward impact of € 18 million on the provision for credit losses as at 31 December 2025.
Accounting principles for the consolidated financial statements
The accounting principles set out below have been applied consistently to all the periods presented in these consolidated financial statements. All subsidiaries applied the accounting principles consistently, for the purposes of these consolidated financial statements.
Functional currency and reporting currency
The consolidated financial statements have been prepared in millions of euros (€). The euro is the functional and reporting currency of ASN Bank. All financial data presented in euros are rounded to the nearest million, unless stated otherwise. Counts are based on unrounded figures.
Material accounting policies
The use of judgements, estimates and assumptions in the preparation of the financial statements
- Impairment losses on loans and receivables – refer to the Section Provisioning methodology;
- Valuation of fair value of financial instruments (including prepayment assumption mortgages and amortisation hedge accounting) – refer to Note 20 Specific disclosures of financial instruments;
- Employee benefits, restructuring provisions and other provisions– refer to Note 15 Provisions;
- Outcome of legal and/or arbitration proceedings - refer to Note 19 Contingent liabilities and commitments and Legal proceedings.
Basis for consolidation
Subsidiaries, i.e. all companies and other entities, including special purpose entities, which are controlled by ASN Bank, are consolidated in accordance with IFRS 10 Consolidated Financial Statements.
Subsidiaries are fully consolidated from the date on which control is transferred to ASN Bank. They are de-consolidated from the date control ceases. The financial statements of these subsidiaries, drafted for the purpose of ASN Bank's financial statements, are fully consolidated and aligned with the accounting principles applied by ASN Bank. Non-controlling interests are initially stated at their share in the fair value of the net assets on the acquisition date and subsequently adjusted for the non-controlling share in changes in the subsidiary's equity.
ASN Bank accounts for business combinations when control is obtained by the bank. All items of the consideration are measured and recognised at fair value at acquisition date. The excess of consideration over the share of the fair value of the identifiable net assets acquired is recorded as goodwill. Transaction costs in connection to the purchase of the business combination are expensed as incurred.
Elimination of group transactions
Intra-group transactions, intra-group balances and unrealised gains and losses arising from intra-group transactions are eliminated in the preparation of the consolidated financial statements.
Unrealised gains on transactions between ASN Bank and its associates are eliminated to the extent of ASN Bank’s interest in these investments.
Unrealised losses are eliminated in the same way as unrealised gains, but only to the extent that there is no evidence of impairment.
Segmented information
ASN Bank's Executive Board (ExBo) discusses and makes decisions on the operational plan and the key internal financial management reports. Hence, the ‘Chief Operating Decision Maker’ (CODM) as described in IFRS 8 Operating Segments is the ExBo. When making decisions on the deployment of resources and performance measurement, the CODM of ASN Bank does not distinguish between the different brands or products. Based on the analysis of the IFRS 8 requirements the bank operates and reports a single segment.
Foreign currencies
Upon initial recognition, transactions in foreign currencies are converted into euros against the exchange rate at the transaction date. Monetary balance sheet items denominated in foreign currencies are translated into euros at the exchange rate applicable on the reporting date. Exchange rate differences from these transactions and from converting monetary balance sheet items expressed in foreign currencies are recorded in the income statement under ‘investment income’ or ‘results on financial instruments’, depending on the balance sheet item to which they relate.
Accounting based on transaction date and settlement date
All purchases and sales of financial instruments, which have been settled in accordance with standard market practices, are recognised on the transaction date, more specifically, the date on which ASN Bank commits itself to buy or sell the asset or liability. We use settlement date accounting for 'loans and advances to customers' and 'amounts due to customers'.
Classification of financial assets
ASN Bank measures financial assets at amortised cost only if both of the following conditions are met:
The financial asset is held within a business model with the objective to hold financial assets in order to collect contractual cash flows; and
The contractual terms of the financial asset give rise on specified dates to cash flows that are solely payments of principal and interest (SPPI) on the principal amount outstanding.
ASN Bank determines its business model based on the risks that affect the performance of the business model (and the financial assets held within that business model) and, in particular, the way those risks are managed. The expected frequency, value and timing of sales are also important aspects of ASN Bank’s assessment. If cash flows, after initial recognition, are realised in a way that is different from our original expectations (e.g. cash flow realisation by selling a debt security that was held in a Hold to Collect business model), ASN Bank does not change the classification of the remaining financial assets held in that Hold to Collect business model, but incorporates such information when assessing the proper business model classification of newly originated or newly purchased financial assets going forward.
As a second step in the financial assets classification process ASN Bank assesses the contractual terms of the financial asset to identify whether they, on specified dates, give rise to cash flows that are solely payments of principal and interest (SPPI) on the principal amount outstanding. The most significant elements of interest within a lending arrangement are typically the consideration for the time value of money and credit risk. To make the SPPI assessment, ASN Bank applies judgement and considers relevant factors such as the period for which the interest rate has been set. In contrast, contractual terms that create more than a minimal exposure to risks or volatility in cash flows, unrelated to a basic lending arrangement, do not result in cash flows consisting solely of principal and interest payments. In such cases, the financial asset is required to be measured at fair value through profit or loss.
ASN Bank issues loans containing features that change the contractual cash flows based on the borrower meeting certain contractually specified environmental criteria (ESG linked loans). Based on the analysis of these loans ASN Bank concluded that the ESG feature results in a de minimis exposure to risks or volatility in the contractual cash flows. Therefore, the ESG-linked loans meet the SPPI test and are measured at amortised cost using the effective interest method.
Derecognition
A financial asset is derecognised when the rights to receive cashflows from the asset have expired. ASN Bank also derecognises the assets if it has both transferred the asset, and the transfer qualifies for derecognition. A transfer only qualifies for derecognition if ASN Bank has:
Transferred substantially all the risks and rewards of the asset; or
Neither transferred nor retained substantially all the risks and rewards of the asset, but has transferred control of the asset.
When terms and conditions of a financial asset are renegotiated or otherwise modified, ASN Bank assesses to which extent the modifications are substantial. The assessment is made in both quantitative and qualitative terms. In case the modification is to the extent that, substantially it becomes a new financial asset, ASN Bank derecognises the financial asset with the difference recognised in the income statement, to the extent that an impairment loss has not already been recorded.
If the modification does not result in derecognition, the gross carrying amount of the financial asset is recalculated, based on the net present value of the new contractual cash flows, and discounted at the financial asset’s original effective interest rate. The effect is recognised as a modification gain or loss. Credit related modification gains or losses (i.e. due to forbearance measures) are recognised in the income statement and presented under impairment charges on financial instruments.
A financial liability is derecognised when the obligation under the liability is discharged, cancelled or expired. Where an existing financial liability is replaced by another from the same lender on substantially different terms, or the terms of an existing liability are substantially modified, such an exchange or modification is treated as a derecognition of the original liability and the recognition of a new liability. The difference between the carrying value of the original financial liability and the consideration paid is recognised in profit or loss.
Offsetting of financial instruments
Financial assets and liabilities are offset and the net amount is reported on the balance sheet if there is a legally enforceable right to set off the recognised amounts, and there is an intention to settle the items on a net basis, or to settle the asset and the liability simultaneously. There is an enforceable right to set off, provided it is not dependent on a future event and is legally enforceable under normal circumstances as well as in bankruptcy. If these conditions are not met, amounts will not be offset.
Cashflow statement
The cashflow statement is prepared according to the indirect method, and distinguishes between cashflows from operational, investment and financing activities. Cashflows in foreign currency are converted at the exchange rate applicable on the transaction date. With regard to cashflow from operations, operating results before taxation are adjusted for gains and losses that did not result in income and payments in the same financial year and for movements in provisions and accrued and deferred items.
Investments in subsidiaries and associates are stated under cashflow from investing activities. The cash and cash equivalents available at the acquisition date are deducted from the purchase price.
In the context of the cashflow statement, cash and balances at central bank are equal to the balance sheet item cash and balances at central bank.
Acquisitions and disposals
In 2024 there were no acquisitions or disposals of businesses. In 2025 ASN Bank completed the purchase of the remaining 10% shares in Fitrex BV. For more information see Note 8 Tangible and intangible assets.
1 Financial assets and liabilities
in € millions | Amortised cost | Fair value through OCI | Fair value through P&L | Total |
|---|---|---|---|---|
Cash and balances at central banks | 1,178 | -- | -- | 1,178 |
Derivatives | -- | -- | 1,789 | 1,789 |
Investments | 2,554 | 4,232 | 23 | 6,809 |
Loans and advances to banks | 7,323 | -- | -- | 7,323 |
Loans and advances to customers | 59,172 | -- | -- | 59,172 |
Other assets | 342 | -- | -- | 342 |
Total financial assets | 70,569 | 4,232 | 1,812 | 76,613 |
Derivatives | -- | -- | 509 | 509 |
Amounts due to banks | 1,117 | -- | -- | 1,117 |
Amounts due to customers | 57,759 | -- | 52 | 57,811 |
Debt certificates | 11,873 | -- | -- | 11,873 |
Subordinated debt | 494 | -- | -- | 494 |
Other liabilities | 264 | -- | -- | 264 |
Total financial liabilities | 71,507 | -- | 561 | 72,068 |
in € millions | Amortised cost | Fair value through OCI | Fair value through P&L | Total |
|---|---|---|---|---|
Cash and balances at central banks | 2,834 | -- | -- | 2,834 |
Derivatives | -- | -- | 2,141 | 2,141 |
Investments | 3,256 | 3,931 | 12 | 7,199 |
Loans and advances to banks | 6,710 | -- | -- | 6,710 |
Loans and advances to customers | 54,494 | -- | -- | 54,494 |
Other assets | 247 | -- | -- | 247 |
Total financial assets | 67,541 | 3,931 | 2,153 | 73,625 |
Derivatives | -- | -- | 1,105 | 1,105 |
Amounts due to banks | 1,401 | -- | -- | 1,401 |
Amounts due to customers | 56,085 | -- | 68 | 56,153 |
Debt certificates | 9,322 | -- | -- | 9,322 |
Subordinated debt | 997 | -- | -- | 997 |
Other liabilities | 240 | -- | -- | 240 |
Total financial liabilities | 68,045 | -- | 1,173 | 69,218 |
2 Cash and balances at central banks
Cash and balances at central banks includes cash, the overnight deposits with the Dutch Central Bank (DNB) and advances from the activities to credit institutions with an original remaining maturity of less than one month. Cash and balances at central banks are measured at amortised cost using the effective interest method.
This item does not include the restricted cash at DNB, which is included in note 6 Loans and advances to banks.
in € millions | 2025 | 2024 |
|---|---|---|
Balances held at central banks | 1,136 | 2,763 |
Short-term bank balances | 42 | 38 |
Cash | -- | 33 |
Total | 1,178 | 2,834 |
Cash decreased by € 1.7 billion as part of cash and capital management. The opposite effect was partly visible in higher loans to banks.
3 Derivatives
Derivatives are recognised at fair value upon entering into the contract and are subsequently measured at fair value. The fair value of publicly traded derivatives is based on listed prices.
The fair value of non-publicly traded derivatives depends on the type of instrument and is based on a discounted cashflow model or an option valuation model. ASN Bank recognises derivatives with a positive market value as assets and derivatives with a negative market value as liabilities.
in € millions | 2025 | 2024 | ||||
|---|---|---|---|---|---|---|
Nominal amounts | Fair value | Nominal amounts | Fair value | |||
Positive | Negative | Positive | Negative | |||
Macro fair value hedge - interest rate | 41,729 | 1,550 | 315 | 47,882 | 1,655 | 664 |
Micro fair value hedge - interest rate | 102 | 6 | -- | 161 | 10 | -- |
Micro fair value hedge - currency | -- | -- | -- | -- | -- | -- |
Total micro fair value hedge | 102 | 6 | -- | 161 | 10 | -- |
Total fair value hedge | 41,831 | 1,556 | 315 | 48,043 | 1,665 | 664 |
Cash flow hedge - currency contracts | -- | -- | -- | 2 | -- | -- |
Economic hedge - interest rate | 655 | 9 | 3 | 729 | 13 | 3 |
Economic hedge - currency | 6,860 | 39 | 9 | 8,561 | 36 | 13 |
Total economic hedge | 7,515 | 48 | 12 | 9,290 | 49 | 16 |
Trading- interest rate | 9,803 | 22 | 20 | 11,080 | 30 | 33 |
Trading- currency | 28,558 | 163 | 162 | 25,864 | 397 | 392 |
Total trading | 38,361 | 185 | 182 | 36,944 | 427 | 425 |
Total | 87,707 | 1,789 | 509 | 94,279 | 2,141 | 1,105 |
Most derivatives are held to hedge against undesired markets risks. This is explained in Note 4 Hedging and hedge accounting.
Economic hedges relate to the hedges that are held for balance sheet management, for which no hedge accounting is applied.
The nominal amounts show the units of account that relate to the derivatives, indicating the relationship with the underlying values of the primary financial instruments. These nominal amounts provide no indication of the size of the cashflows, and the market and credit risks related to the transactions.
4 Hedging and hedge accounting
ASN Bank uses derivatives as part of its asset and liability management and risk management. Derivatives are used to hedge interest rate and foreign currency risks in assets and liabilities. The accounting treatment of the hedged item and the hedging instrument depends on whether the hedge relationship qualifies for hedge accounting in accordance with the EU carve out version of IAS 39 Financial Instruments: Recognition and Measurement.
Under IFRS Accounting Standards, derivatives are measured at fair value in the balance sheet and any change in the fair value is accounted for in the income statement. In the event that changes in fair value of hedged risks are not recognised through the income statement, an accounting mismatch occurs, causing volatility in the results. In these cases, hedge accounting is applied (when possible) to mitigate as much as possible the accounting mismatch and volatility. The IFRS 9 standard provides users with the option of starting to apply the IFRS 9 hedge accounting rules or to continue to apply the (EU carve out version of) IAS 39 hedge accounting rules. ASN Bank has decided to continue to apply the EU carve out version of IAS 39 hedge accounting requirements. ASN Bank designates certain derivatives as a hedge of either:
The risk of changes in the fair value of a recognised asset or liability or firm commitment (fair value hedge); or
The variability of future cashflows that can be attributed to a particular risk associated with a recognised asset or liability or a highly probable forecast transaction (cashflow hedge).
Both at the inception of the hedge accounting and on an ongoing basis, ASN Bank assesses whether the derivatives used in its hedging transactions have been highly effective in offsetting changes in the fair value or variability of the cashflows of the hedged item, insofar as they are attributable to the hedged risk, and the actual results remain within a range of 80% to 125% of the expected outcome. Hedge ineffectiveness and gains and losses on components of a derivative that are excluded from the assessment of hedge effectiveness are recorded directly in the income statement in the line item Other results on financial instruments. Hedge ratios follow from the choices made for hedging of interest and currency risks. Ineffectiveness in hedge relationships might be caused by differences in maturities of the swap and the hedged item; and by the fair value of the floating leg of the interest rate swap, which is not reflected in the fair value of the hedged item attributable to the change in interest rate.
ASN Bank discontinues hedge accounting when the hedge relationship ceased to be effective or when the derivative or hedged item is sold or otherwise terminated.
The changes in fair value for derivatives that hedge economic risks and do not comply with the conditions of the EU carve out version of IAS 39 for hedge
accounting or for which it is not cost-efficient to apply hedge accounting, are recognised directly in the income statement.
Derivatives that are designated as hedging the fair value of recognised assets or liabilities are recognised as a fair value hedge. Gains or losses on remeasurement of both the hedging instrument and the hedged item are recognised in the Income statement within Other results on financial instruments.
The same goes for the corresponding adjustment of the fair value of the hedged asset or hedged liability attributable to the specific hedged risk. Hedge effectiveness for fair value hedges is measured as the amount by which the changes in fair value of the derivatives compensates the changes in the fair value of the hedged item.
When a fair value hedge of interest rate risk is terminated, any value adjustment to the carrying amount of the hedged item is amortised to the income statement. The approach determines the amortisation period on the underlying remaining interest rate maturity of the hedged item. As a result, value adjustments for individual contracts are amortised over the respective maturity bucket. The moment the hedged position is no longer recognised, i.e. is sold or redeemed, the non-amortised part of the fair value adjustment of the hedged asset is recognised directly in the profit or loss.
ASN Bank applies fair value hedge accounting for portfolio hedges of interest rate risk as allowed under the EU carve out version of IAS 39. The EU carve out enables a group of derivatives (or proportions thereof) to be viewed in combination and jointly designated as the hedging instrument in the bank’s macro fair value hedging models and removes some of the limitations in macro fair value hedge accounting with respect to under hedging strategies. In addition, some restrictions on under-hedging strategies for fair value macro hedge accounting do not apply. ASN Bank applies micro fair value hedging to hedge separate hedged positions, which may be assets or liabilities.
Derivatives can be designated to hedge the risk of variability of future cashflows of a recognised asset or liability or highly probable forecast transaction. Hedge ineffectiveness for cashflow hedges is measured as the amount by which the changes in the fair value of the derivative are in excess of changes in the fair value of the expected cashflow in the cashflow hedge. The effective part of any gain or loss on remeasurement of the hedging instrument is recognised directly in the cashflow hedge reserve as a separate component of total equity. Any ineffective part of the cashflow hedge is recognised in Other results on financial instruments immediately. The valuation of the hedged item included in the cashflow hedge relationship, remains unchanged.
If the forecast transaction leads to the recognition of an asset or a liability, the accumulated gains and losses that were previously taken to the cashflow hedge reserve are transferred to the income statement and classified as income or expense in the period during which the hedged transaction influences the result.
If the hedging instrument itself expires or is sold or terminated, or no longer meets the conditions for hedge accounting, the accumulated result that was included in the cashflow hedge reserve fully remains in the cashflow hedge reserve in other comprehensive income (OCI) until the expected transaction occurs.
If the hedged transaction is no longer expected to occur, the accumulated result reported in OCI is directly recycled to the income statement.
Hedging
ASN Bank uses derivatives for the following objectives:
To manage interest rate risk in the banking book and trading book;
To hedge foreign exchange risks by converting non-euro funding and investments into euro;
To use as economic hedging instrument for the prepayment risk on mortgage loans.
For a total overview of the derivatives, see Note 3 Derivatives.
In most of the hedging strategies explained above, ASN Bank applies hedge accounting. In addition to the main distinction between fair value hedges and cashflow hedges, there is also a distinction between micro hedges and macro hedges in hedge accounting. Micro hedging is a technique used to hedge individual contracts. Macro hedging is a technique used to hedge the risk on a portfolio of contracts. The types of hedge accounting applied by ASN Bank are explained below.
The portfolio hedged comprises fixed-rate mortgages of ASN Bank. The hedging instruments are interest rate swaps entered into as part of the interest rate risk management in the ALM process. The risk hedged is the risk of change in fair value of the portfolio attributable to movements in market interest rates. The hedge is set up and terminated at least once a month. Effectiveness assessments are performed on a prospective and retrospective basis and are measured using the dollar offset method.
The interest rate risk on fixed-income investments is hedged by swapping the coupon to a floating interest rate with interest swaps. The country or credit spread risk component is not hedged. The hedges provide protection for the risk of change in fair value of the portfolio attributable to movements in market interest rates of the relevant fixed-income investments. The hedge is set up and terminated at least once a month. Effectiveness assessments are performed on a prospective and a retrospective basis and are measured using the dollar offset method.
The interest rate risk on fixed rate funding transactions is hedged by swapping the coupons to €STR with interest swaps. The hedges provide protection for the risk of change in fair value of the portfolio attributable to movements in market interest rates of the relevant fixed rate funding transactions. The hedge is set up and terminated at least once a month. Effectiveness assessments are performed on a prospective and a retrospective basis and are measured using the dollar offset method.
Furthermore, ASN Bank conducts micro hedging for certain funding transactions to convert fixed-rate funding into floating interest rates by means of interest rate swaps. If such funding is denominated in a foreign currency, cross-currency swaps are entered into. The hedge is set up once and will not be terminated. Effectiveness assessments are performed on a prospective and retrospective basis and are measured using the dollar offset method.
In addition to converting foreign currencies into euros and fixed-rate funding into floating-rate funding, ASN Bank also uses derivatives to convert structured funding into floating-rate funding. In structured funding, the funding charge is related to, for example, developments in an equity index or inflation. The funding programme also includes interest rate structures such as floating-rate coupons with a multiplier or a leverage factor. ASN Bank fully hedges the structured element and the interest rate risk on these structures.
In previous years, ASN Bank also applied cashflow hedge accounting to hedge the risk of floating interest rate cashflows on the cash position, floating interest rate mortgages, quotations and floating-rate (foreign exchange) funding by entering into (cross currency) interest rate swaps and basis swaps. These hedges no longer exist. The value of these former hedges accrued in total equity was € 15 million positive (gross) as at 31 December 2025 (2024: € 18 million positive (gross)).
in € millions | Carrying amount of the hedged item | Accumulated amount of fair value hedge adjustments on the hedged item | ||
|---|---|---|---|---|
2025 | 2024 | 2025 | 2024 | |
ASSETS | ||||
Macro fair value hedges | ||||
Loans and advances - interest rate risk | 16,272 | 13,841 | -1,5451 | -1,0932 |
Investments FVOCI - interest rate risk | 3,548 | 3,175 | -60 | -9 |
Investments AC - interest rate risk | 1,537 | 1,720 | -49 | -53 |
LIABILITIES | ||||
Macro fair value hedges | ||||
Issued debt - interest rate risk | 4,831 | 3,834 | 2 | 12 |
Issued subordinated debt - interest rate risk | 494 | 997 | -5 | -2 |
Micro fair value hedges | ||||
Issued debt - interest rate risk | 98 | 161 | 5 | 7 |
- The macro hedge adjustment of € 1,545 million negative consists of € 1,197 million negative active hedges and € 348 million negative for discontinued hedges which are amortised.
- The macro hedge adjustment of € 1,093 million negative consists of € 810 million negative active hedges and € 283 million negative for discontinued hedges which are amortised.
in € millions | 2025 | 2024 |
|---|---|---|
Fair value movements hedging instruments | 523 | -274 |
Fair value movements hedged item attributable to hedged risks | -512 | 277 |
Ineffectiveness macro fair value hedges | 11 | 3 |
Fair value movements hedging instruments | -2 | -1 |
Fair value movements hedged item attributable to hedged risks | 2 | 2 |
Ineffectiveness micro fair value hedges | -- | 1 |
The ineffectiveness of fair value hedges is recognised in the income statement within Other results on financial instruments. The ineffectiveness of fair flow hedges was less than € 1 million at year-end 2025 and 2024.
in € millions | Maturity | Fair value | ||||
|---|---|---|---|---|---|---|
≤1 year | > 1 year | > 5 years | Total | Positive | Negative | |
Issued debt | 25 | 60 | 17 | 102 | 6 | -- |
Interest rate risk micro hedges | 25 | 60 | 17 | 102 | 6 | -- |
in € millions | Maturity | Fair value | ||||
|---|---|---|---|---|---|---|
≤1 year | > 1 year | > 5 years | Total | Positive | Negative | |
Issued debt | 14 | 55 | 92 | 161 | 10 | -- |
Interest rate risk micro hedges | 14 | 55 | 92 | 161 | 10 | -- |
The weighted average fixed rate of the interest rate swaps (receivers) included in micro hedge relationships is 4.6% as at 31 December 2025 (4.5% as at 31 December 2024).
5 Investments
An investment in debt instruments is measured at amortised cost if it is held as part of a portfolio with an underlying business model to collect contractual cash flows until maturity (hold to collect (HTC)). The cash flows of the investment shall solely consist of interest payments and principal repayments (Solely Payments of Principal and Interest, or SPPI).
An investment in debt instruments is measured at fair value through OCI less any impairment losses if it is held as part of a portfolio with an underlying business model to collect contractual cash flows and to sell in the interim (hold to collect and sale (HTCS)). The cash flows of the investment in debt instruments shall solely consist of interest payments and principal repayments. When the investments are sold, the related accumulated fair value adjustments are recognised in the income statement as Investment income. ASN Bank applies the average cost method to determine these results, where necessary.
An investment in debt or equity instruments is measured at fair value through profit or loss if it is held as part of a portfolio with an underlying business model that qualifies as 'other' and/or the investment does not meet the IFRS 9 criteria that the cash flows of the investment solely consist of interest payments and principal. The business model 'other' is a business model that does not qualify as HTC or HTCS and may consist of trading portfolios. Realised and unrealised gains and losses are recognised directly in the income statement under Investment income. Interest income earned on securities is recognised as interest income. Dividend received is recorded under Investment income.
Fair value changes of equity investments are recognised in profit or loss or in OCI following an irrevocable election at initial recognition. This choice is made separately for each equity investment.
An expected credit loss (ECL) model is applied to financial assets valued at amortised cost and to financial assets valued at fair value through other comprehensive income (OCI). Under the ECL model, ASN Bank calculates the probability that a default (PD) occurs at different moments in time. This is multiplied by the difference between contractual cash flows due and the expected cash flows to be received, i.e. cash shortfall. The provision is the sum of all cash shortfalls multiplied by the PD at the different moments in time. The ECL calculations contain information about the past, present and future. In order to calculate the ECL, the applicable PD, EAD and LGD are multiplied and discounted.
Impairment losses for interest-bearing investments measured at amortised cost or fair value through OCI are determined based on ECL's. Impairment losses are recognised directly in the income statement under Impairment charges (reversals) of financial assets. For further information on impairment losses on financial assets and the model-based assumptions for the determination of ECL, please refer to the Section Provisioning methodology.
in € millions | Equity securities | Debt securities | Total | |||
|---|---|---|---|---|---|---|
2025 | 2024 | 2025 | 2024 | 2025 | 2024 | |
Amortised cost | -- | -- | 2,554 | 3,256 | 2,554 | 3,256 |
Fair value through OCI | 3 | 4 | 4,229 | 3,927 | 4,232 | 3,931 |
Fair value through P&L | 12 | 12 | 11 | -- | 23 | 12 |
Total | 15 | 16 | 6,794 | 7,183 | 6,809 | 7,199 |
The total value of investments decreased from € 7,199 million in 2024 to € 6,809 million in 2025 as part of cash management activities. Amortised cost investments decreased by € 0.7 billion due to redemptions of T-bills. Fair value through OCI investments increased by € 0.3 billion as a result of purchased bonds.
As in 2024, all debt securities were allocated to stage 1. The provision for credit losses on debt securities amounted € 6 million (2024: € 7 million).
At year-end 2025, part of the securities were pledged as collateral for derivative contracts and collateral with DNB, totalling € 617 million (2024: € 520 million). For more details, refer to Note 24 Transferred and encumbered assets.
At the end of 2025, ASN Bank invested in certain debt securities issued by securitisation vehicles set up by other parties, and outside the scope of ASN Bank's consolidation, amounting to € 269 million (2024: € 222 million). The increase is the result of three investments in 2025 in the highest tranche of Dutch Residential Mortgage-Backed Securities. All outstanding debt securities concern mortgage-backed investments with an investment grade rating, which expose the bank to limited credit risk by being senior in the payment waterfall of the securitisation vehicles.
in € millions | Fair value through OCI | Fair value through P&L | Total | |||
|---|---|---|---|---|---|---|
2025 | 2024 | 2025 | 2024 | 2025 | 2024 | |
Opening balance | 4 | 3 | 12 | 11 | 16 | 14 |
Purchases and advances | -- | 1 | -- | -- | -- | 1 |
Disposals | -- | -- | -- | -2 | -- | -2 |
Revaluations | -- | -- | -- | 3 | -- | 3 |
Impairments | -1 | -- | -- | 3 | -1 | 3 |
Closing balance | 3 | 4 | 12 | 12 | 15 | 16 |
(Amortised) cost price | 4 | 4 | 12 | 12 | 16 | 16 |
Provision for credit losses | -1 | -- | -- | -- | -1 | -- |
Total | 3 | 4 | 12 | 12 | 15 | 16 |
in € millions | Amortised cost | Fair value through OCI | Fair value through P&L | Total | ||||
|---|---|---|---|---|---|---|---|---|
2025 | 2024 | 2025 | 2024 | 2025 | 2024 | 2025 | 2024 | |
Opening balance | 3,256 | 3,426 | 3,927 | 3,276 | -- | 17 | 7,183 | 6,719 |
Purchases and advances | 2,202 | 2,020 | 795 | 1,055 | -- | -- | 2,997 | 3,075 |
Disposals | -12 | -- | -320 | -363 | -- | -- | -332 | -363 |
Redemptions | -2,929 | -2,218 | -190 | -111 | -- | -- | -3,119 | -2,329 |
Revaluations | -- | -- | 3 | 54 | -- | -- | 3 | 54 |
Change in fair value as result of hedge accounting | 4 | 39 | -- | -- | -- | 4 | 39 | |
Change in trading portfolio | -- | -- | -- | -- | 11 | -17 | 11 | -17 |
Exchange rate differences | 6 | -27 | -- | -- | -- | -- | 6 | -27 |
Impairments | 1 | 1 | 1 | -1 | -- | -- | 2 | -- |
Accrued interest | -- | -- | 6 | 13 | -- | 6 | 13 | |
Amortisation | 26 | 15 | 7 | 4 | -- | -- | 33 | 19 |
Closing balance | 2,554 | 3,256 | 4,229 | 3,927 | 11 | -- | 6,794 | 7,183 |
(Amortised) cost price | 2,556 | 3,258 | 4,353 | 4,053 | 11 | -- | 6,920 | 7,311 |
Provision for credit losses | -2 | -2 | -3 | -5 | -- | -- | -5 | -7 |
Unrealised gains (losses) | -- | -- | -121 | -121 | -- | -- | -121 | -121 |
Total | 2,554 | 3,256 | 4,229 | 3,927 | 11 | -- | 6,794 | 7,183 |
All debt securities are listed.
In 2025, disposals from the amortised cost category consisted of a debt security that was sold because its credit rating following restructuring no longer met our investment mandate. In 2024, no disposals were made from the HTC portfolio.
in € millions | Amortised | Fair value | Fair value | Total | ||||
|---|---|---|---|---|---|---|---|---|
2025 | 2024 | 2025 | 2024 | 2025 | 2024 | 2025 | 2024 | |
Equity securities | ||||||||
Financial corporations | -- | -- | 3 | 4 | 12 | 12 | 15 | 16 |
Debt securities | ||||||||
General governments | 1,203 | 1,986 | 2,269 | 2,280 | 11 | -- | 3,483 | 4,266 |
Credit institutions | 997 | 944 | 1,150 | 902 | -- | -- | 2,147 | 1,846 |
Other financial corporations | 245 | 196 | 306 | 268 | -- | -- | 551 | 464 |
Non-financial corporations | 109 | 130 | 504 | 477 | -- | -- | 613 | 607 |
Total debt securities | 2,554 | 3,256 | 4,229 | 3,927 | 11 | -- | 6,794 | 7,183 |
of which: green and sustainable bonds | 1,229 | 1,291 | 994 | 812 | -- | -- | 2,223 | 2,103 |
Total investments | 2,554 | 3,256 | 4,232 | 3,931 | 23 | 12 | 6,809 | 7,199 |
in € millions | Amortised | Fair value | Fair value | Total | ||||
|---|---|---|---|---|---|---|---|---|
2025 | 2024 | 2025 | 2024 | 2025 | 2024 | 2025 | 2024 | |
AAA | 1,511 | 1,551 | 2,407 | 2,049 | -- | -- | 3,918 | 3,600 |
AA | 494 | 657 | 587 | 886 | -- | -- | 1,081 | 1,543 |
A | 499 | 652 | 968 | 652 | 11 | -- | 1,478 | 1,304 |
BBB | 50 | 71 | 267 | 340 | -- | -- | 317 | 411 |
< BBB | -- | -- | -- | -- | -- | -- | -- | -- |
No rating | -- | 325 | 3 | 4 | 12 | 12 | 15 | 341 |
Total | 2,554 | 3,256 | 4,232 | 3,931 | 23 | 12 | 6,809 | 7,199 |
in € millions | Amortised | Fair value | Fair value | Total | ||||
|---|---|---|---|---|---|---|---|---|
2025 | 2024 | 2025 | 2024 | 2025 | 2024 | 2025 | 2024 | |
Netherlands | 508 | 470 | 1,030 | 893 | -- | -- | 1,538 | 1,363 |
Austria | 70 | 71 | 148 | 156 | -- | -- | 218 | 227 |
Belgium | 309 | 363 | 625 | 456 | -- | -- | 934 | 819 |
Finland | 235 | 200 | 31 | 32 | -- | -- | 266 | 232 |
France | 303 | 381 | 731 | 568 | -- | -- | 1,034 | 949 |
Germany | 691 | 735 | 881 | 875 | -- | -- | 1,572 | 1,610 |
Ireland | 25 | 25 | 20 | 20 | -- | -- | 45 | 45 |
Italy | -- | -- | 23 | 23 | -- | -- | 23 | 23 |
Japan | -- | 323 | -- | -- | -- | -- | -- | 323 |
Luxembourg | 196 | 160 | 205 | 252 | -- | -- | 401 | 412 |
Spain | 24 | 23 | 214 | 339 | 11 | -- | 249 | 362 |
Sweden | -- | -- | 12 | 22 | -- | -- | 12 | 22 |
Other countries | 193 | 505 | 312 | 295 | 12 | 12 | 517 | 812 |
Total | 2,554 | 3,256 | 4,232 | 3,931 | 23 | 12 | 6,809 | 7,199 |
6 Loans and advances to banks
Loans and advances to banks are measured at amortised cost using the effective interest method. Any impairment losses are based on an expected credit loss (ECL) model. This item includes receivables from banks with a remaining maturity of one month or more. This item relates to loans and advances to banks, excluding interest-bearing securities, and demand deposits with the Dutch Central Bank (DNB).
in € millions | 2025 | 2024 |
|---|---|---|
Deposits | 6,784 | 6,195 |
Mandatory cash reserve at Dutch Central Bank | 541 | 518 |
Provision for credit losses | -2 | -3 |
Total | 7,323 | 6,710 |
in € millions | 2025 | 2024 |
|---|---|---|
Netherlands | 708 | 844 |
Austria | -- | 118 |
Czech Republic | 351 | -- |
Denmark | 359 | 151 |
Finland | 298 | 326 |
France | 33 | -- |
Germany | 54 | 613 |
Japan | 202 | -- |
Norway | 45 | 16 |
Spain | -- | 29 |
Switzerland | 4,637 | 4291 |
United Kingdom of Great Britain and Northern Ireland | 625 | 192 |
Other countries | 11 | 130 |
Total | 7,323 | 6,710 |
Loans and advances to banks increased by € 0.6 billion to € 7.3 billion, as part of cash management activities. All loans and advances to banks are classified in stage 1 within the three stage credit risk provision model. The provision for credit losses decreased to € 2 million (2024: € 3 million). In 2025, credit spreads further decreased compared to 2024.
The loans and advances to banks amounted for € 70 million of collateral posted on derivative transactions (2024: € 368 million).
7 Loans and advances to customers
Loans and advances to customers are measured at amortised cost using the effective interest method.
Expected credit loss (ECL) provisions are recognised for credit exposures measured at amortised cost and loan commitments and financial guarantee contracts (off-balance sheet items). Under the ECL model, ASN Bank calculates the probability that a default (PD) occurs at different moments in time. This is multiplied by the difference between contractual cash flows due and the expected cash flows to be received, i.e. ‘cash shortfall’. The provision is the sum of all cash shortfalls multiplied by the PD at the different moments in time. The ECL calculations contain information about the past, present and future. In order to calculate the ECL, the applicable PD, EAD and LGD are multiplied and discounted.
A three-stage model is used under IFRS 9. In stage 1, ASN Bank recognises credit exposures that have shown no significant increase of credit risk since initial recognition and a 12-month expected loss is determined. Stage 2 comprises credit exposures that show a significant increase of credit risk relative to initial recognition but that are not credit impaired. For these credit exposures, a lifetime expected credit loss is determined. Credit exposures that are credit impaired are recognised in stage 3, for which also a lifetime expected credit loss is determined. ASN Bank applies a specific default definition for each portfolio for which loan loss provisions are determined under IFRS 9. For more information about the stage allocation process, please refer to the Section Provisioning methodology.
in € millions | 31-12-2025 | 31-12-2024 | ||||
|---|---|---|---|---|---|---|
Gross carrying amount | Provision for credit losses | Book value | Gross carrying amount | Provision for credit losses | Book value | |
Residential mortgages | 56,482 | -53 | 56,429 | 52,003 | -80 | 51,923 |
Consumer loans | 76 | -6 | 70 | 67 | -7 | 60 |
SME loans | 1,541 | -12 | 1,529 | 1,393 | -15 | 1,378 |
Other corporate and government loans | 2,695 | -14 | 2,681 | 2,261 | -40 | 2,221 |
IFRS fair value adjustments1 | -1,537 | -- | -1,537 | -1,088 | -- | -1,088 |
Total | 59,257 | -85 | 59,172 | 54,636 | -142 | 54,494 |
- Consisting of fair value adjustments from hedge accounting and amortisations.
ASN Bank has securitised part of the mortgage loans. The remaining principal of the securitised portfolio amounts to € 8.4 billion (2024: € 8.4 billion), of which € 8.2 billion (2024: € 8.2 billion) is on its own book. There is a limited transfer of risks and benefits for the securitised mortgage loans. Therefore, they are not derecognised from the balance sheet. Further information on securitisation transactions is provided under Note 13 Debt certificates, and for more information on intra-group transactions, see Note 23 Related parties. More information on asset encumbrance can be found in Note 24 Transferred and encumbered assets.
The total provision for loans and advances amounted to € 85 million as at 31 December 2025 (year-end 2024: € 142 million). The decrease in provisions was mainly driven by lower provisions for the residential mortgages portfolio due to the implementation of an enhanced IFRS 9 Expected Credit Loss (ECL) model and a decrease in the management overlay. Also recoveries in the SME portfolio and the write-off in the Sustainable Finance portfolio contributed to lower provisions for credit losses.
More information on loans and advances to customers can be found in the Section Provisioning methodology, which describes the breakdown of the stages and gives information on the models used and in the Sections Additional credit risk information up to and including the Section Additional disclosures on other corporate and government loans labelled 'Audited', for quantitative and qualitative information on the portfolios.
8 Tangible and intangible assets
Accounting policy for tangible assets
Property in own use mainly comprises offices (land and buildings) and is measured at cost net of accumulated depreciation and, if applicable, impairment losses.
Buildings are depreciated over their economic life using the straight-line method, with a maximum of 50 years. Land is not depreciated. An assessment is made whether there is an indication that land and buildings may be impaired.
All other tangible assets included in this item are measured at cost net of accumulated depreciation and, if applicable, accumulated impairment losses.
The cost price comprises the expenses directly attributable to the acquisition of the assets and is depreciated on a straight- line basis over the useful life, taking into account any residual value. The estimated useful life may vary from 3 to 10 years.
ASN Bank accounts for business combinations when control is obtained by the bank. All items of the consideration are measured and recognised at fair value at acquisition date. The excess of consideration over the share of the fair value of the identifiable net assets acquired is recorded as goodwill. Transaction costs in connection to the purchase of the business combination are expensed as incurred.
Any change, in the fair value of acquired assets and liabilities at the acquisition date, determined within one year after acquisition, is recognised as an adjustment charged to goodwill. Adjustments that occur after a period of one year are recognised in the income statement.
Intangible assets are measured at cost net of accumulated amortisation and, if applicable, accumulated impairment losses.
Costs that are directly related to the development of identifiable software products that ASN Bank controls and that are likely to generate economic benefits that exceed these costs, are capitalised as intangible assets. The direct costs comprise external costs and staff costs directly attributable to software development. All other costs associated with the development or maintenance of software are included as an expense in the period during which they are incurred.
The other intangible assets of ASN Bank consist of distribution networks and are amortised in accordance with the straight-line method over their estimated useful life, generally between five and fifteen years. If objective indications require so, an impairment test will be performed.
Goodwill created with the acquisition of subsidiaries, associated companies and joint ventures is allocated to cash-generating units (CGU). The book value of the CGU, including goodwill, is compared to the calculated recoverable value, determined on the basis of value-in-use. If the recoverable value is lower than the book value, the difference will be recognised as impairment in the income statement. Assumptions used in these goodwill impairment tests are value-in-use based on the business plans and the allocated discount rate based on the risk profile of the CGU.
An asset is subject to impairment if its book value exceeds the recoverable amount from continued use (value-in-use) or sale of the asset. The recoverable amount is the highest value of the fair value less costs of disposal and the value in use. The recoverable amount of assets is estimated if there are indications of impairment of the asset. Intangible assets not yet available for use are tested for impairment at least once a year. If such intangible assets are initially recognised during the reporting period, they are tested for impairment before the end of the reporting period.
On each reporting date, the capitalised costs for software, distribution channels and customer portfolios are reviewed for indicators of potential impairments.
Except for goodwill, impairment losses on property, equipment and intangible assets are reversed if there is proof that a change in the estimates used to determine the recoverable amount occurred after the impairment loss was recognised. The reversal is included under depreciations in the income statement. The book value after reversal may never exceed the amount before recognition of the impairment loss.
Tangible and intangible assets
in € millions | 2025 | 2024 |
|---|---|---|
Land and buildings | 6 | 7 |
IT equipment | 7 | 9 |
Other tangible assets | 15 | 12 |
Right of use assets | 16 | 22 |
Total property and equipment | 44 | 50 |
Goodwill | 4 | 4 |
Other intangible assets | -- | 1 |
Total intangible assets | 4 | 5 |
Total | 48 | 55 |
For a more detailed explanation on right of use assets, see Note 17 Leases. All subleases are treated as finance subleases. As a consequence, net investment in the subleases are recognised under Note 10 Other assets.
Property and equipment
in € millions | Land and buildings | IT equipment | Other tangible assets | Total | ||||
|---|---|---|---|---|---|---|---|---|
2025 | 2024 | 2025 | 2024 | 2025 | 2024 | 2025 | 2024 | |
Accumulated acquisition costs | 8 | 9 | 20 | 48 | 36 | 100 | 64 | 157 |
Accumulated depreciation and impairments | -2 | -2 | -13 | -39 | -21 | -88 | -36 | -129 |
Closing balance | 6 | 7 | 7 | 9 | 15 | 12 | 28 | 28 |
Opening balance | 7 | 8 | 9 | 10 | 12 | 22 | 28 | 40 |
Investments | -- | -- | 3 | 3 | 7 | 1 | 10 | 4 |
Divestments | -1 | -1 | -- | -- | -- | -- | -1 | -1 |
Depreciation | -- | -- | -5 | -4 | -3 | -6 | -8 | -10 |
Impairments | -- | -- | -- | -- | -1 | -5 | -1 | -5 |
Closing balance | 6 | 7 | 7 | 9 | 15 | 12 | 28 | 28 |
At year-end 2025, the renovations to the leased office premises not yet in use amounted to € 0 million (2024: € 0 million).
Intangible assets
in € millions | Goodwill | Other intangible assets | Total | |||
|---|---|---|---|---|---|---|
2025 | 2024 | 2025 | 2024 | 2025 | 2024 | |
Accumulated acquisition costs | 5 | 5 | 1 | 1 | 6 | 6 |
Accumulated amortisation and impairments | -1 | -1 | -1 | -- | -2 | -1 |
Closing balance | 4 | 4 | -- | 1 | 4 | 5 |
Opening balance | 4 | 4 | 1 | 1 | 5 | 5 |
Amortisation purchases | -- | -- | -1 | -- | -1 | -- |
Impairments | -- | -- | -- | -- | -- | -- |
Closing balance | 4 | 4 | -- | 1 | 4 | 5 |
On 1 September 2021, ASN Bank completed the acquisition of 90% of the shares in the property valuation platform Fitrex B.V. The total purchase price amounted to € 8 million. In line with IFRS 3 Business Combinations, the transaction results in a goodwill amount of approximately € 5 million. The amount of goodwill is assessed annually for impairment, in 2025, there were no goodwill impairments (2024: € 0 million). On 28 August 2025, ASN Bank purchased the remaining 10% shares of the property valuation platform Fitrex B.V.
Other intangibles amounted to € 1 million in 2024 and were largely attributable to the customer base for intermediaries, with a 5-year amortisation period, this amortisation period has largely been realised during 2025.
Depreciation and amortisation
in € millions | 2025 | 2024 |
|---|---|---|
Depreciation on tangible assets | 8 | 10 |
Impairments on tangible assets | 1 | 6 |
Depreciation of right of use assets (leases) | 11 | 11 |
Impairment on intangible assets | -- | -- |
Total | 20 | 27 |
9 Tax assets and liabilities
Corporate income tax relates to payable or recoverable tax on the taxable profit for the period under review, and taxes due from previous periods. If any corporate income tax includes dividend withholding tax, this is settled through the corporate income tax return. Current tax recoverables and payables are measured at nominal value according to the tax rate applicable at the reporting date.
Deferred tax assets and liabilities are recognised for tax losses carried forward and for temporary differences between the tax base of assets and liabilities and the book value. This is based on the tax rates applicable as at the balance sheet date and the tax rates that will apply in the period in which the deferred tax assets or tax liabilities are settled. Deferred taxes are measured at nominal value.
Deferred tax assets are recognised only to the extent that it is probable that future taxable profits will allow the deferred tax asset to be recovered. Deferred tax assets are assessed at balance sheet date.
The valuation of financial instruments in the tax return is based on the same accounting principles as applied in the consolidated financial statements with exception of items that are recognised in the revaluation reserve for which applies that profits are only recognised in so far as in earlier years losses have been deducted.
In addition to the difference described for items that are recognised in the revaluation reserve, there are temporary differences relating to lease obligations and employee benefits and, as far as acquisitions are concerned, from the difference between (a) the fair value of the acquired net assets and (b) the tax value.
Deferred tax assets and liabilities are offset only when there is a legal enforceable right to set off tax assets against tax liabilities and income tax is levied by the same taxation authority on the same taxable entity.
in € millions | Tax assets | Tax liabilities | ||
|---|---|---|---|---|
2025 | 2024 | 2025 | 2024 | |
Corporate income tax | 3 | -- | -- | 6 |
Deferred taxes | -- | -- | 2 | 3 |
Total | 3 | -- | 2 | 9 |
in € millions | Opening balance | Change through P&L | Change through OCI | Other movements | Closing balance |
|---|---|---|---|---|---|
Property and equipment | -9 | -- | 3 | -- | -6 |
Derivatives | -5 | -- | 1 | -- | -4 |
Provisions | 2 | -- | -- | -- | 2 |
Other liabilities | 9 | -- | -3 | -- | 6 |
Total | -3 | -- | 1 | -- | -2 |
in € millions | Opening balance | Change through P&L | Change through OCI | Other movements | Closing balance |
|---|---|---|---|---|---|
Property and equipment | -11 | 1 | 1 | -- | -9 |
Derivatives | -5 | -- | -- | -- | -5 |
Provisions | 2 | -- | -- | -- | 2 |
Other liabilities | 12 | -- | -3 | -- | 9 |
Total | -2 | 1 | -2 | -- | -3 |
in € millions | 2025 | 2024 |
|---|---|---|
Change in revaluation reserve | -13 | -3 |
Change in cashflow hedge reserve | 1 | 1 |
Total | -12 | -2 |
10 Other assets
Other assets comprise amounts to be settled, accrued assets and other, including other taxes. The other taxes are recognised at nominal value. The remaining amounts to be settled, accrued assets and other are recognised at amortised cost. The net amount of receivables in relation to the Deposit Guarantee Scheme (DGS) is recorded under other advances.
in € millions | 2025 | 2024 |
|---|---|---|
Trade and other receivables | 33 | 41 |
Amounts to be settled | 260 | 155 |
Sublease | 3 | 7 |
Accrued assets | 42 | 34 |
Other | 4 | 10 |
Total | 342 | 247 |
Trade and other receivables relates to various receivables in the normal course of business which includes short-term receivables relating to mortgage and other amounts receivables from customers.
Amounts to be settled primarily include transactions not settled at balance sheet date. The nature of these transactions is short term and are expected to settle shortly after the closing date of the balance sheet.
11 Amounts due to banks
Amounts due to banks comprise unsubordinated debts to credit institutions. Amounts due to banks include private placements, current accounts and repurchase agreements.
At initial recognition, amounts due to banks in the banking book are measured at fair value, including transaction costs incurred. Thereafter, they are measured at amortised cost.
Any difference between the measurement at initial recognition and the redemption value is recognised under interest expense in the income statement during the term of these amounts owed by using the effective interest method.
Amounts due to banks held for trading are measured at fair value through profit or loss. Unrealised and realised gains or losses are recognised in Other results on financial instruments.
in € millions | 2025 | 2024 |
|---|---|---|
Cash collateral transactions | 1,078 | 1,205 |
Current accounts | 1 | 1 |
Deposits with agreed maturity | 38 | 195 |
Total | 1,117 | 1,401 |
Amounts due to banks decreased by € 284 million due to a decrease in deposits as well as in the received cash collateral, this decrease related to the reclassification of a counterparty from loans to banks to loans to customers as a result of a change in nature of the counterparty.
12 Amounts due to customers
Amounts due to customers represent unsubordinated debts to non-banks, other than in the form of debt certificates. This item mainly comprises deposits due on demand, deposits with agreed maturity and current accounts.
At initial recognition amounts due to customers are measured at fair value, including transaction costs incurred. Thereafter, they are measured at amortised cost.
Any difference between the measurement at initial recognition and the redemption value is recognised under interest expense in the income statement during the term of these amounts owed by using the effective interest method.
Amounts due to customers held for trading are measured at fair value through profit or loss. Unrealised and realised gains or losses are recognised in Other results on financial instruments.
in € millions | 2025 | 2024 |
|---|---|---|
Households | ||
Deposits due on demand | 41,868 | 39,892 |
Deposits with agreed maturity | 5,463 | 5,747 |
Total household deposits | 47,331 | 45,638 |
Current accounts | 5,844 | 5,856 |
Savings deposits mortgages | 619 | 598 |
Investment portfolio mortgages | 16 | 15 |
53,810 | 52,107 | |
Other corporates and governments | ||
Current accounts | 777 | 764 |
Deposits due on demand | 1,610 | 1616 |
Deposits with agreed maturity | 485 | 482 |
of which deposits held for trading | 52 | 68 |
Savings deposits mortgages | 1,129 | 1,184 |
4,001 | 4,046 | |
Amounts due to customers | 57,811 | 56,153 |
In 2025, total amounts due to customers rose by € 1.7 billion to € 57.8 billion. Amounts due to households increased by € 1.7 billion.
The increase in amounts due to households was partly offset by a € 45 million decrease in amounts due to other corporates and governments.
Deposits due to other corporate and governments relates for the amount of € 45 million to the placement of debt instruments (Schuldscheine) at pension funds and insurance companies (2024: € 141 million). The large decrease is caused by many loans reaching maturity in 2025.
Part of the deposits due to other corporates and governments are private loans issued under ASN Bank's covered bond programme. The book value of the private loans amounts to € 112 million (2024: € 158 million). Additional repayment security for these private loans was given by the ASN Covered Bond Company. For more information on the covered bond programme, reference is made to Note 13 Debt certificates.
As part of savings mortgage arrangement, ASN Bank and insurer Athora Netherlands have agreed that the savings premiums received from the customer by the insurer will be held by the bank. These savings premiums and the interest credited (the savings capital designated for mortgage redemption) mean that, in principle, the insurer has an unsecured claim against the bank. To spread the insurer’s default risk, a cession/retrocession agreement was concluded under which the insurer transfers the savings capital to the bank in exchange for a partial and joint right to the savings-based mortgage claims. In 2025, the savings capital accrued totalled € 1,129 million (2024: € 1,184 million).
13 Debt certificates
Debt certificates include non-subordinated bonds and other debt certificates with a fixed or variable interest rate. At initial recognition outstanding debt certificates are measured at fair value, which corresponds to the issue proceeds (the fair value of the payment received) net of the transaction costs incurred. Subsequently, these instruments are measured at amortised cost, using the effective interest method.
When ASN Bank purchases its own debt securities, these debt securities are derecognised.
in € millions | 2025 | 2024 |
|---|---|---|
Medium-term notes (MTN) | 8,522 | 8,031 |
Certificates of deposits | 3,187 | 1,093 |
Debt certificates issued under Pearl and Lowland Securitisation programmes | 164 | 198 |
Total | 11,873 | 9,322 |
in € millions | Medium Term Notes | Certificates of Deposit | Issued under securitisation programmes | Total | ||||
|---|---|---|---|---|---|---|---|---|
2025 | 2024 | 2025 | 2024 | 2025 | 2024 | 2025 | 2024 | |
Opening balance | 8,031 | 7,705 | 1,093 | -- | 198 | 230 | 9,322 | 7,935 |
Issues | 496 | 996 | 16,094 | 14,518 | -- | -- | 16,590 | 15,514 |
Redemptions | -- | -705 | -14,027 | -13,455 | -34 | -32 | -14,061 | -14,192 |
Revaluations | -6 | -1 | -- | -- | -- | -- | -6 | -1 |
Amortisation | 10 | 10 | 42 | 24 | -- | -- | 52 | 34 |
Change accrued interest | 3 | 14 | -- | -- | -- | -- | 3 | 14 |
Change in fair value as a result of hedge accounting | -17 | 12 | -- | -- | -- | -- | -17 | 12 |
Exchange rate differences | -- | -- | -15 | 6 | -- | -- | -15 | 6 |
Other movements | 5 | -- | -- | -- | -- | -- | 5 | -- |
Closing balance | 8,522 | 8,031 | 3,187 | 1,093 | 164 | 198 | 11,873 | 9,322 |
Medium Term Notes
in € millions | Coupon rate | Book value | Nominal value | Book value | Nominal value |
|---|---|---|---|---|---|
2025 | 2025 | 2024 | 2024 | ||
ASN Bank N.V. | Fixed | 8,446 | 8,443 | 7,948 | 7,943 |
ASN Bank N.V. | Structured | 76 | 75 | 83 | 75 |
Total | 8,522 | 8,518 | 8,031 | 8,018 |
The Medium Term Notes (MTN) comprises of both private placements and public placements issued under the EMTN programme. Of the Medium Term Notes € 3,527 million is senior non-preferred (2024: € 3,036 million).
For a total of € 4.9 billion (2024: € 4.9 billion) of MTNs, bonds were issued under the Covered Bond programme by ASN Bank. Payment of interest and principal is guaranteed by a SPV (Special Purpose Vehicle), ASN Covered Bond Company BV (‘CBC’). To enable CBC to fulfil its guarantee, ASN Bank legally transferred Dutch mortgage loans originated by ASN Bank to CBC. See Note 24 Transferred and encumbered assets. Furthermore, ASN Bank offers protection against the deterioration of the mortgage loans. CBC is fully consolidated by ASN Bank.
With regard to the covered bond programme, ASN Bank undertakes at the request of CBC to offer to transfer eligible assets to CBC, provided that CBC shall only request a transfer of eligible assets if it determines that the Asset Cover Test has been breached. The Asset Cover Test is an arithmetic test that determines the minimum amount of assets needed to cover the liabilities guaranteed by CBC.
Certificates of deposit
Certificates of deposit are debt securities with a fixed interest rate and a short-term maturity. At year-end 2025, ASN Bank issued (net of redemptions) € 2.1 billion (2024: € 1.1 billion) in Certificates of deposit in order to support efficient market access.
Securitisation programmes
ASN Bank entered into securitisation programmes to obtain funding and to improve liquidity. Within these programmes ASN Bank sells own-originated mortgage receivables to a SPV. The SPV issues securitised notes that are eligible collateral for the ECB. In most programmes, ASN Bank acts as investor of the securitised notes. As the SPVs are set up for the benefit of ASN Bank and given the limited transfer of risks and rewards, ASN Bank continues to consolidate the SPVs.
Debt certificates issued under Pearl and Lowland securitisation programmes
ASN Bank has securitised part of its mortgage loans. In these securitisation transactions, the economic ownership of mortgage loans is transferred to separate companies. These loans were transferred at nominal value plus a deferred purchase price. A positive result within the SPV's leads to the creation of a positive value of the deferred purchase price. ASN Bank thus retains an economic interest in these companies. On the basis of this economic interest and other criteria established by IFRS Accounting Standards for control, ASN Bank has these companies fully consolidated in the financial statements.
Securitisation transactions have a so-called call + step-up structure. This means that after a specific call date, the company will have the right to redeem the bonds early. Additionally, on this specific date, the coupon on the bonds will be subject to a rise in interest rate (step-up). Under normal market conditions, this creates an economic incentive to redeem the bonds early. An overview of the securitisations as at 31 December is provided below:
in € millions | Initial | Start of | Book value | First call-option date | Contractual expiration | |
|---|---|---|---|---|---|---|
2025 | 2024 | |||||
Pearl 1 | 1,014 | 09-2006 | 241 | 276 | 18-09-2026 | 18-09-2047 |
Lowland 7 | 8,000 | 04-2023 | 7,953 | 7,930 | 18-04-2028 | 18-04-2060 |
Total | 8,194 | 8,206 | ||||
On own book | -8,030 | -8,008 | ||||
Total | 164 | 198 | ||||
At year-end 2025, ASN Bank held securitisation programme bonds on its own book at an amortised cost of € 8.0 billion (2024: € 8.0 billion).
Part of the senior tranches of Pearl 1 and Lowland 7 are held for own account and qualify as eligible assets at the ECB.
14 Subordinated debts
Subordinated debt is measured at fair value upon initial recognition, which corresponds to the proceeds net of the transaction costs incurred. Subsequently, these instruments are measured at amortised cost, using the effective interest method.
The subordinated debts of ASN Bank form part of the eligible own funds, which are used in determining the solvency position of ASN Bank.
in € millions | 2025 | 2024 |
|---|---|---|
Opening balance | 997 | 500 |
Issues | -- | 496 |
Redemptions | -500 | -- |
Revaluations | 4 | -2 |
Movement in accrued interest | -2 | 3 |
Other adjustments | -5 | -- |
Closing balance | 494 | 997 |
The subordinated bonds have a book value of € 494 million (2024: € 997 million) and relate to a green subordinated Tier 2 capital instrument note for an amount of € 0.5 billion issued in 2024. The Tier 2 capital instrument that was issued in 2020 was called in 2025.
The bonds issued in 2024, with a maturity of 10 years and a fixed rate of 4.13%, have a call option during a 6-month period starting on 27 November 2030.
15 Provisions
Provisions are recognised if ASN Bank has a present obligation, legally or constructive, arising from events in the past, and to which it is more likely than not that the settlement of the obligation requires an outflow of assets, and for which a reliable estimate of the size of the obligation can be made. Provisions are measured at the present value of the expected future cashflows. Additions and any subsequent releases are recorded in the related line item in the income statement.
ASN Bank recognises a provision for employee commitments including various forms of employee benefit plans such as health insurance, savings, mortgages and jubilee benefits schemes. The measurement is based on the net present value taking into account actuarial assumptions.
The restructuring provision is a specific provision that consists of anticipated severance payments and other costs that are directly related to restructuring programmes. These costs are accounted for in the period in which a legally enforceable or constructive obligation to make the payment arises. No provision is formed for costs or future operating losses stemming from continuing operations.
ASN Bank recognises severance payments if ASN Bank has demonstrably committed itself, to:
the termination of the employment contracts of current employees in accordance with an announced detailed formal plan without the option of the plan being withdrawn; or
the payment of severance payments as a result of an offer to encourage voluntary redundancy that cannot be withdrawn. Severance payments that are due after more than twelve months after the balance sheet date are discounted.
Other provisions include legal provisions. ASN Bank recognises a provision for legal proceedings at the balance sheet date for the estimated liability. The provision comprises an estimate of the payments due during the course of the legal proceedings. Where relevant, any possible external coverage of the legal claim will result in the recognition of an asset if and when payment to ASN Bank becomes virtually certain.
Expected credit loss (ECL) provisions are recognised for loan commitments and financial guarantee contracts (off-balance sheet items). For further information on impairment losses, please refer to Note 7 Loans and advances to customers.
in € millions | 2025 | 2024 |
|---|---|---|
Restructuring provision | 69 | 129 |
Employee benefits | 12 | 12 |
Other provisions | 178 | 256 |
Provision for credit losses for off-balance sheet items | 4 | 8 |
Total | 263 | 405 |
For a more detailed explanation of the main pending legal proceedings against ASN Bank see Note 19 Contingent liabilities and commitments.
Employee benefits and other provisions are predominantly long-term in nature.
in € millions | Restructuring | Employee | Other | Provision for | Total | |||||
|---|---|---|---|---|---|---|---|---|---|---|
2025 | 2024 | 2025 | 2024 | 2025 | 2024 | 2025 | 2024 | 2025 | 2024 | |
Opening balance | 129 | 9 | 12 | 12 | 256 | 12 | 8 | 11 | 405 | 44 |
Additions | 69 | 124 | 3 | 2 | 2 | 249 | 1 | 3 | 75 | 378 |
Amounts used | -129 | -4 | -3 | -2 | -78 | -4 | -- | -- | -210 | -10 |
Releases | -- | -- | -- | -- | -2 | -1 | -5 | -6 | -7 | -7 |
Closing balance | 69 | 129 | 12 | 12 | 178 | 256 | 4 | 8 | 263 | 405 |
Movements in the loan loss provision related to off-balance sheet items are shown the table Changes in the provision for credit losses in the Section Additional credit risk information.
Restructuring provision
In 2025, ASN Bank adopted a new strategy which marks the next phase of its ongoing transformation that began at the end of 2024. The aim of the new strategy is to achieve growth for its core activities of mortgages, savings and payments and simplify business operations, internal process and systems. In 2026, the transformation programme is expected to lead to a further simplification of the organisational structure and an additional reduction in total FTEs of 850 to 950, partly by cutting external staff and not filling vacancies. For internal staff a restructuring provision is recognised.
The net addition of € 69 million consists of the following three main components:
An employee redundancy provision in 2025 connected to an additional reduction in internal FTEs.
An additional charge related to the 2024 employee redundancy provision, driven by a higher number of substantially changed job functions than initially assumed combined with more internal employees deciding to leave the bank.
Further, the restructuring provision related to optimising our distribution network was updated, resulting in a small charge.
In 2024, an initial restructuring provision of € 124 million has been made in connection with the transformation programme. This comprises two main components: a provision for employee redundancy and a provision for optimisation of the distribution network. The 2024 restructuring provision has been largely utilised, as both the internal redundancy process and the distribution network optimisation envisaged in 2024 are nearing completion. A provision has been maintained for the remaining amounts.
Other provisions
AFC remediation
In 2024, we recognised a € 196 million provision for a multi-year AFC remediation programme to address Wwft compliance shortcomings. The provision is related to parts of the general remediation programme, in particular the recovery of missing and/or incorrect customer data from our existing customer base as well as the reassessment of customers after data recovery in their correct risk profile. In 2025, € 29 million of this provision was utilised, bringing the AFC remediation provision to € 167 million as at 31 December 2025.
Administrative fines
In 2024 we recognised a provision totalling € 20 million for two administrative fines imposed by DNB at the end of January 2025, consisting of a fine related to the shortcomings in compliance with laws and regulations with respect to combating money laundering and terrorist financing (Wwft) of € 5 million and a second fine of € 15 million concerning shortcomings in risk management as a result of which the bank does not meet the sound business operations-related requirements included in the Wft. ASN Bank paid these fines at the end of February 2025.
Other
At year-end 2024, we recognised a € 30 million provision for legal proceedings after reaching an agreement to settle the long pending claims initiated by Bernie Madoff's trustee and the liquidators of three Madoff-feeders Funds (the 'Feeder Funds') claims. The settlement payment was made at the end of January 2025.
At year-end 2025, € 11 million in total has been provided for mainly:
Restoration costs of buildings in relation to the planned relocation of our head offices
Legal proceedings – Harbi Vastgoed B.V.
ASN Bank, as a legal successor of RegioBank, is involved in proceedings against nonprofessional investors who have invested in Harbi Vastgoed B.V., which went bankrupt in March 2014. ASN Bank has been held liable by various investors and some investors started a class action lawsuit against ASN Bank. The District Court of Midden-Nederland ruled that ASN Bank is liable towards certain investors who entered into a Harbi investment product via an intermediary on the basis of its contractual duty of care (contractuele zorgplicht). ASN Bank and the intermediary have lodged an appeal against the judgment.
Provision for credit losses of off-balance sheet items
For quantitative and qualitative information on the portfolios, more information on off-balance sheet items can be found in the Section Additional credit risk information up to and including the Section Additional disclosures on other corporate and government loans labelled 'Audited'.
16 Other liabilities
Other liabilities consist of other taxes, other liabilities and lease liabilities. Other taxes are recognised at nominal value. Other liabilities are recognised at amortised cost.
in € millions | 2025 | 2024 |
|---|---|---|
Other taxes | 20 | 19 |
Accruals | 112 | 107 |
Lease liabilities | 17 | 28 |
Other | 115 | 86 |
Total | 264 | 240 |
For the accounting principles and a more detailed explanation to the lease liabilities, see Note 17 Leases.
Other mainly relates to amounts payable to customers and suppliers.
17 Leases
A lease exists if control over the use of an identified asset for a certain period has been obtained in exchange for consideration. The main leases entered into by ASN Bank concern property leases.
ASN Bank recognises a lease liability if it has control over the underlying asset. The lease obligation is valued at the present value of the lease payments that have not yet been made at that time. Because the implicit interest rate of the leases cannot be easily determined, the incremental borrowing rate of ASN Bank is used. The lease payments are discounted using this incremental borrowing rate. During the term of a contract, the lease liability is increased with accrued interest and reduced by lease payments. The lease liability is adjusted for indexations of the lease payments, any changes to the contract or a modified estimate of any extension or termination options.
The right-of-use asset is measured at cost minus cumulative depreciation and impairment. The lease payments included in the initial measurement of the lease liability, initial direct costs and advance payments form part of the cost price. Any corrections to the lease liability are accordingly processed in the right-of-use asset. The right-of-use asset is depreciated on a straight-line basis over the remaining duration of the contract.
Leases for buildings are usually entered into for a contractual period of 5 years. Extension and termination options that are outside this 5-year period are not included in the determination of the lease liability, because there is no reasonable certainty these options will be effected.
ASN Bank uses the option not to include short-term leases and low-value leases on the balance sheet, but to include them in the result as an expense.
A number of store locations are subleased to franchisees. In addition, part of the head office is sublet to third parties. As substantially all of the risks and rewards associated with the right to use of the underlying asset have been transferred to the sublessee, they are qualified as finance subleases. A net investment in the lease is recognised as a receivable in Other assets. The net investment in the lease is measured using the discount rate used for the head lease.
in € millions | 2025 | 2024 |
|---|---|---|
Opening balance | 22 | 32 |
Additions | 4 | 3 |
Derecognition in ROU assets related to sublease | 1 | -2 |
Depreciation expense | -11 | -11 |
Closing balance | 16 | 22 |
in € millions | 2025 | 2024 |
|---|---|---|
Opening balance | 28 | 41 |
Additions | 4 | 3 |
Interest expenses | -- | 1 |
Lease payments | -15 | -17 |
Closing balance | 17 | 28 |
Expenses relating to short-term leases and expenses relating to low-value assets were both nil (2024: nil).
The total cash flow from leases during the financial year amounted to € 15 million (2024: € 13 million).
For an overview of the future cash flows from leases, refer to the table Remaining contractual maturity of assets and liabilities in the Section Funding strategy.
Income from property sublease amounts to € 0.6 million (2024: € 0.4 million).
in € millions | 2025 | 2024 |
|---|---|---|
1 year | 2 | 4 |
2 years | -- | 2 |
3 years | -- | 1 |
4 years | -- | -- |
5 years | -- | -- |
> 5 years | -- | -- |
Total | 2 | 7 |
Unearned finance income | -- | -- |
Total net investment in the lease | 2 | 7 |
18 Equity
The issued share capital is fully paid up and comprises of ordinary shares.
The fair value reserve includes the gains and losses, net of tax, resulting from a change in the fair value of debt instruments measured at FVOCI. When the instruments are sold or otherwise disposed of, the related cumulative gain or loss recognised in equity is recycled to the income statement.
The cash flow hedging reserve comprises the effective portion of the cumulative net change in the fair value of cash flow hedging instruments, net of taxes, that are recycled to the income statement if the hedged transactions have an impact on profit or loss.
Other reserves mainly comprise retained earnings and profit for the period.
Dividends on ordinary shares classified as equity are recognised as a distribution of equity in the period in which they are approved by shareholders.
Undated, deeply subordinated, resettable, callable capital securities are classified as Additional Tier 1 (AT1) capital, under total equity.
Share capital
The issued share capital is fully paid up and comprises 840,008 ordinary shares with a nominal value of € 453.79 per share.
Reserves in equity
The share premium reserve did not change during the year.
In € millions | Cashflow hedge reserve | Fair value reserve | ||
|---|---|---|---|---|
2025 | 2024 | 2025 | 2024 | |
Balance as at 1 January | 13 | 15 | -80 | -81 |
Unrealised revaluations | -- | -- | 40 | -12 |
Realised revaluations through P&L | -2 | -2 | -2 | 13 |
Balance as at 31 December | 11 | 13 | -42 | -80 |
The cashflow hedge reserve decreased slightly by € 2 million to € 11 million (year-end 2024: € 13 million).
The fair value reserve rose by € 38 million, mainly caused by unrealised revaluations.
The other reserves including retained earnings increased due to result appropriation of the previous year by € 144 million (2024: € 267 million). This was partly offset by the interest paid on AT 1 capital securities in the amount of € 21 million (2024: € 21 million).
AT1 capital securities
Undated, deeply subordinated, resettable, callable capital securities are classified as Additional Tier 1 (AT1) capital, under total equity. In June 2022, ASN Bank issued its first AT1 notes. The perpetual callable AT1 notes amounted to € 298 million (nominal value: € 300 million) and have a coupon rate of 7.00% up to the first reset date on 15 December 2027.
Dividend
Earnings per share are calculated by dividing the (proposed) dividend by the outstanding ordinary shares. The Executive Board of ASN Bank proposes to pay out a dividend of €
In 2025 a final dividend payment of € 0 million (2024: € 164 million) was paid to our shareholder NLFI in relation to the previous financial year. This came down to a dividend per share of €
Non-controlling interest
On 28 August 2025 ASN Bank purchased the remaining 10% shares of the property valuation platform Fitrex B.V. As a result the non-controlling interest was removed ( € 0.2 million at year-end 2024).
19 Contingent liabilities and commitments
A contingent liability is a possible obligation that arises from past events and its existence will be confirmed only by the occurrence or non-occurrence of one or more uncertain future events not wholly within the control of ASN Bank. A contingent liability may also be a present obligation that arises from past events but is not recognised because it is either not probable that an outflow of economic benefits will be required to settle the obligation, or the amount of the obligation cannot be measured reliably. Contingent liabilities are not recognised in the statement of financial position, but are disclosed in the notes unless the possibility of the outflow of economic benefits is remote.
A financial guarantee contract requires ASN Bank to make specified payments to the holder if certain conditions are met. The holder of the contract is reimbursed for a loss it incurs if a specified debtor fails to make payment when due under the original or modified terms of a debt instrument.
Loan commitments are commitments to provide credit under pre-specified terms and conditions. The amounts shown in the table for guarantees and commitments represent the maximum amount ASN Bank is exposed to if the contract parties completely fail to perform as agreed. The ‘nominal amount’ best represents the bank’s maximum exposure to credit risk without taking account of any collateral held or other credit enhancements.
Impairment losses for off-balance sheet items such as loan commitments and financial guarantee contracts are recognised in the line item 15 Provisions. For further information on impairment losses, please refer to Note 7 Loans and advances to customers.
Commitments and guarantees
in € millions | 2025 | 2024 |
|---|---|---|
Financial guarantees given | 2 | 3 |
Loan commitments given | 3,585 | 3,041 |
Of which: Deposit Guarantee Fund | 375 | 375 |
Other commitments | 38 | 39 |
Of which: irrevocable IT contracts | 38 | 39 |
Total | 3,625 | 3,083 |
ASN Bank provides financial guarantees to guarantee customers' performance to third parties.
The loan commitments given mainly consist of credit facilities granted to customers, but against which no claim has yet been made, such as unused portions of irrevocable credit facilities granted to SME and corporate customers, new loan offers, approved but undrawn loans, revolving facilities, underwriting facilities and home construction accounts. These facilities are granted for a fixed term and at a variable interest rate. Collateral has been secured for a part of the credit facilities.
ASN Bank's share in the credit facility to the Deposit Guarantee Fund (DGF) for purposes of liquidity support granted by the largest Dutch banks was € 375 million (2024: 375 million).
Future commitments
ASN Bank concluded some large long-term IT support contracts in the amount of € 38 million (2024: € 39 million).
in € millions | 2025 | 2024 |
|---|---|---|
To be received within < 1 year | 22 | 16 |
To be received within 1 - 5 years | 16 | 23 |
To be received after 5 years | -- | -- |
Total | 38 | 39 |
Contingent liabilities
ASN Bank and its subsidiaries are and may from time to time become involved in legal, regulatory and/or arbitration proceedings that relate to claims by and against the bank, ensuing from its normal business operations. In presenting the Consolidated Financial Statements, management estimates the outcome of any of these proceedings and recognises provisions when it considers there is a present obligation, when it is probable that a cash outflow is required and when the amount can be estimated with sufficient reliability. The most important proceedings are described below. For the legal proceedings described below, there is a possible obligation for which a cash outflow is not considered probable. As such, these matters are regarded as contingencies
Various former holders of the securities and capital components expropriated in 2013 have initiated legal proceedings to seek compensation for damages as a result of the nationalisation. At the time the financial statements were drawn up, no court proceedings had (yet) been initiated against ASN Bank other than those stated below. As the outcomes of possible legal proceedings cannot be predicted with any certainty, it cannot be ruled out that a negative outcome may have a material negative financial impact on ASN Bank's capital position, results and/or cashflows, however due to the uncertainty no reliable estimate of the financial effect on ASN Bank can be made. For this reason, at year-end 2025 no provisions were made in respect of any of these possible legal actions.
In November 2014, the Dutch Investors’ Association (Vereniging van Effectenbezitters; VEB) and other investors filed a petition with the Enterprise Chamber of the Amsterdam Court of Appeal (the Enterprise Chamber) for an inquiry into the management (mismanagement- wanbeleid) of SNS REAAL, currently SRH, SNS Bank, currently ASN Bank, and former SNS Property Finance, currently Propertize.
The Enterprise Chamber ordered an inquiry into the management and course of events at SRH and ASN Bank for the period from 1 July 2006 until 1 February 2013 and have appointed investigators. On 30 November 2022, the Enterprise Chamber ruled that no mismanagement (wanbeleid) had been found with regard to SRH and ASN Bank. The VEB's claims have all been rejected, although the Enterprise Chamber did rule that errors were made in some areas. None of the parties lodged an appeal in cassation, as a result of which the decision of the Enterprise Chamber has force of judgement. The VEB announced by letter that they intend to initiate mass claim proceedings. As a precondition for starting mass claim proceedings, negotiations for an amicable solution are taking place. Due to the ongoing nature of negotiations and due to contractual confidentiality obligations ASN Bank applies IAS 37.92.
On 1 December 2025, two former note holders summoned SRH and ASN Bank claiming for allegedly withholding price-sensitive information regarding SNS REAAL bonds and SNS Bank bonds before the nationalisation. Claimants argue that with proper information disclosure, they would have sold their bonds and invested their money elsewhere. ASN Bank has several legal defences. Although ASN Bank considers it not probable that any such claims will be successful, the possibility that they will succeed cannot be ruled out.
20 Specific disclosures of financial instruments
The fair value of financial assets and liabilities is determined on the basis of quoted prices where available. Such quoted prices are primarily derived from transaction prices for listed instruments. If quoted prices are not available, market prices from independent market participants or other experts are used. ASN Bank applies an exit price when determining fair value, therefore financial assets are recognised at their bid prices and financial liabilities at their offer prices.
In markets where activity has decreased or in inactive markets, the range of prices from different sources can be significant for a certain financial instrument. Selecting the most appropriate price requires management judgement.
For certain financial assets and liabilities, no market price is available. The fair value of these financial assets and liabilities is determined using valuation techniques, which may vary from discounted cashflow calculation to valuation models that use generally accepted economic methodologies. Observable market information, where available, is used as input for the valuation models. All valuation methods used are assessed and approved in-house according to ASN Bank’s governance procedures.
ASN Bank determines the fair value hierarchy for all financial instruments at each reporting moment.
The following techniques and assumptions have been used to determine the fair value of financial instruments.
The fair values of shares are based on quoted prices in active markets or other available market data. The fair values of interest-bearing securities, excluding mortgage loans, are also based on quoted market prices or, when actively quoted market prices are not available, on the present value of expected future cashflows. These present values are based on the relevant market interest rate, taking account of the liquidity, creditworthiness and maturity of the relevant investment.
The fair value of mortgages is determined on the basis of a present value method. The yield curve used to determine the present value of expected cashflows of mortgage loans is the average of the five lowest mortgage rates in the market, adjusted for interest rates that are considered not to be representative (‘teaser rates’). These rates may differ for each sub-portfolio due to differences in maturity, Loan-to-Value class and form of repayment. In determining the expected cashflows, any expected future early redemptions are taken into account.
The fair value of other loans and advances to customers has been determined by the present value of the expected future cashflows. Various surcharges on the yield curve were used for the calculation of the present value. In this respect, a distinction was made by type of loan and customer group to which the loan relates.
The fair values of nearly all derivatives are based on observable market information, such as market rates and foreign exchange rates. To determine the fair value of instruments for which not all information is observable in the market, estimates or assumptions are used within a net discounted cashflow model or an option valuation model. In determining the fair value, the credit risk that a market participant would include in his valuation is taken into account.
Given the short-term nature of the loans that are classified as loans and advances to banks, the book value is considered to be a reasonable approximation of the fair value.
Because of the predominantly short-term nature of other assets, the book value is considered to be a reasonable approximation of the fair value.
The book value of the cash and bank balances at central banks is considered to be a reasonable approximation of the fair value.
The fair values of subordinated debt are based on quoted prices in active markets or other available market data.
The fair values of debt certificates are based on quoted prices in active markets or other available market data. When actively quoted market prices are not available, the fair value of debt certificates is estimated on the basis of the present value of the cashflows, making use of the prevailing interest rate plus a risk surcharge. The risk surcharge is based on the credit risk assumed by the market for holding such instruments issued by ASN Bank, determined by maturity and type of instrument.
The fair value of readily available savings and term deposits differs from the nominal value because the interest is not adjusted on a daily basis and because, in practice, customers leave their savings in their accounts for a longer period of time. The fair value of these deposits is calculated based on the net present value of the relevant portfolios’ cashflows using a specific discount curve. For savings covered by the Deposit Guarantee Scheme (DGS), the discount curve is based on the average current rates of several Dutch market parties. ASN Bank’s Funds Price-curve (FTP) was used for savings not covered by the DGS. The calculated fair value of amounts due to customers with a demand feature cannot be less than the amount payable on demand.
The fair value of amounts due to banks is estimated on the basis of the present value of the expected future cashflows, using the interest rate plus a risk surcharge. The risk surcharge is based on the credit risk assumed by the market for holding such instruments issued by ASN Bank, differentiated to maturity and type of instrument. The book value of any amount due within one month is considered to be a reasonable approximation of the fair value.
The book value of other liabilities is considered to be a reasonable approximation of its fair value.
A part of the financial instruments is measured in the balance sheet at fair value. In addition, the fair value of the other financial instruments is disclosed. The fair value level classification is not disclosed for financial assets and liabilities where the book value is a reasonable approximation of the fair value.
For financial instruments measured at fair value on the balance sheet or for which the fair value is disclosed, this fair value is classified under a level. This level depends on the parameters used to determine the fair value and provides further insight into the valuation. The levels are explained below:
For all financial instruments in this valuation category, stock prices are observable and publicly available from stock exchanges, brokers or pricing institutions. In addition, these financial instruments are traded on an active market, which allows for the stock prices to accurately reflect current and regularly recurring market transactions between independent parties. The investments in this category mainly include listed shares and bonds.
The category includes financial instruments for which no quoted prices are available but whose fair value is determined using models where the parameters include available market information. These instruments mostly contain privately negotiated derivatives. This category also includes investments for which prices have been issued by brokers, but which are also subject to inactive markets. In that case, the available prices are largely supported and validated using market information, including market rates and actual risk surcharges related to different credit ratings and sector classifications.
A significant part of the financial instruments in this category has been determined using assumptions and parameters that are not observable in the market, such as assumed default rates belonging to certain ratings. The level 3 valuations of investments (shares) are based on quotes from illiquid markets. The derivatives in level 3 are related to some mortgage securitisations and the valuation is partly dependent on the underlying mortgage portfolios and movements in risk spreads.
in € millions | Book value | Level 1 | Level 2 | Level 3 | Total fair value |
|---|---|---|---|---|---|
Financial assets measured at fair value | |||||
Derivatives | 1,789 | -- | 1,789 | -- | 1,789 |
Investments - fair value through OCI | 4,232 | 4,205 | -- | 27 | 4,232 |
Investments - fair value through P&L | 23 | 10 | 12 | 1 | 23 |
Financial assets not measured at fair value | |||||
Cash and balances at central banks | 1,178 | 1,178 | -- | -- | 1,178 |
Investments - amortised costs | 2,554 | 1,919 | 364 | 245 | 2,528 |
Loans and advances to banks | 7,323 | -- | 7,323 | -- | 7,323 |
Loans and advances to customers | 59,172 | -- | -- | 56,836 | 56,836 |
Other assets | 342 | -- | 342 | -- | 342 |
Total financial assets | 76,613 | 7,312 | 9,830 | 57,109 | 74,251 |
Financial liabilities measured at fair value | |||||
Derivatives | 509 | -- | 509 | -- | 509 |
Amounts due to customers | 52 | -- | 52 | -- | 52 |
Financial liabilities not measured at fair value | |||||
Amounts due to customers | 57,759 | -- | 53,871 | 3,934 | 57,805 |
Amounts due to banks | 1,117 | -- | 1,117 | -- | 1,117 |
Debt certificates | 11,873 | -- | -- | 11,067 | 11,067 |
Other liabilities | 264 | -- | 264 | -- | 264 |
Subordinated debts | 494 | 501 | -- | -- | 501 |
Total financial liabilities | 72,068 | 501 | 55,813 | 15,001 | 71,315 |
The table provides information on the fair value of the financial assets and liabilities of ASN Bank. For a number of fair value measurements estimates have been used. This table only includes financial assets and liabilities. Balance sheet items that do not meet the definition of a financial asset or liability are not included. The total of the fair value presented above does not reflect the underlying value of ASN Bank and should, therefore, not be interpreted as such.
in € millions | Book value | Level 1 | Level 2 | Level 3 | Total fair value |
|---|---|---|---|---|---|
Financial assets measured at fair value | |||||
Derivatives | 2,141 | -- | 2,141 | -- | 2,141 |
Investments - fair value through OCI | 3,931 | 3,903 | -- | 28 | 3,931 |
Investments - fair value through P&L | 12 | -- | 11 | 1 | 12 |
Financial assets not measured at fair value | |||||
Cash and balances at central banks | 2,834 | 2,834 | -- | -- | 2,834 |
Investments - amortised costs | 3,256 | 2,651 | 337 | 223 | 3,211 |
Loans and advances to banks | 6,710 | -- | 6,710 | -- | 6,710 |
Loans and advances to customers | 54,494 | -- | -- | 52,378 | 52,378 |
Other assets | 247 | -- | 247 | -- | 247 |
Total financial assets | 73,625 | 9,388 | 9,446 | 52,630 | 71,464 |
Financial liabilities measured at fair value | |||||
Derivatives | 1,105 | -- | 1,105 | -- | 1,105 |
Amounts due to customers | 68 | -- | 68 | -- | 68 |
Financial liabilities not measured at fair value | |||||
Amounts due to customers | 56,085 | -- | 52,628 | 3,515 | 56,143 |
Amounts due to banks | 1,401 | -- | 1,401 | -- | 1,401 |
Debt certificates | 9,322 | -- | -- | 8,367 | 8,367 |
Other liabilities | 240 | -- | 240 | -- | 240 |
Subordinated debts | 997 | 992 | -- | -- | 992 |
Total financial liabilities | 69,218 | 992 | 55,442 | 11,882 | 68,316 |
The fair values represent the amounts at which the financial instruments could have been sold or transferred at balance sheet date between market parties in an orderly transaction. The fair value of financial assets and liabilities is based on quoted market prices, where observable. If actively quoted market prices are not available, various valuation techniques have been used to measure the fair value of these instruments. Parameters used in such valuation techniques may be subjective and are based on various assumptions, for instance certain discount rates and the timing and size of expected future cashflows. The degree of subjectivity affects the fair value hierarchy, which is discussed in the beginning of the paragraph. Wherever possible and available, the valuation techniques make use of observable inputs in relevant markets. Changes in the assumptions can significantly influence the estimated fair values. The main assumptions for each balance sheet item are explained in the section below.
in € millions | Fair value through P&L | Fair value through OCI | Derivatives assets | Derivatives liabilities |
|---|---|---|---|---|
Opening balance | 1 | 28 | -- | -- |
Purchases/advances | -- | -- | -- | -- |
Disposals | -- | -1 | -- | -- |
Unrealised gains or losses recognised in P&L1 | -- | -- | -- | -- |
Transfer between levels | -- | -- | -- | -- |
Closing balance | 1 | 27 | -- | -- |
- Included in the line item Results on financial instruments.
in € millions | Fair value through P&L | Fair value through OCI | Derivatives assets | Derivatives liabilities |
|---|---|---|---|---|
Opening balance | 11 | 3 | 3 | 3 |
Purchases/advances | -- | 25 | -- | -- |
Disposals | -2 | -- | -- | -- |
Unrealised gains or losses recognised in P&L1 | 3 | -- | -3 | -3 |
Transfer between levels | -11 | -- | -- | -- |
Closing balance | 1 | 28 | -- | -- |
- Included in the line item Results on financial instruments.
in € millions | 2025 | 2024 |
|---|---|---|
Equity securities | 4 | 4 |
Debt securities | 24 | 25 |
Total assets | 28 | 29 |
The level 3 bonds measured at fair value through OCI are valued using pricing information from a third-party data vendor. This third-party pricing information is based on level 3 unobservable inputs. For ASN Bank, the inputs for the pricing information are also unobservable. It is expected that a change in any unobservable would lead to a change in the pricing by the third-party data vendor, and, thereby, the outcome of the fair value measurement.
In 2024 we effected a transfer from level 3 to level 2 for equity investments at fair value through profit and loss. We did so because the value was no longer significantly impacted by the unobservable input that restricted the liquidity of the securities. In 2025, no significant movements occurred.
21 Maturities of assets and liabilities
We can break down the assets and liabilities according to the remaining contractual term. The net maturing nominal amounts, i.e. assets minus liabilities per maturity are an indication of the:
liquidity risk;
obligations that may not be met on time from inflows.
The table on the next page represents ASN Bank’s liquidity profile at year-end on the basis of the earliest possible remaining contractual maturity. Demand deposits and current account balances are presented in the ‘<1 month’ column. In the tables, we maintain the contractual maturity without taking into account behavioural aspects such as mortgage prepayments.
We do however, take into account behavioural aspects in the bank’s asset and liability management. A shorter term to maturity is used for mortgages due to anticipated prepayments. A longer term to maturity is used for demand deposits and balances in customers’ current accounts as, in normal circumstances, customers tend to hold on to such products for longer periods of time.
Loans and advances to banks and amounts due to banks also include collateral delivered and received in relation to derivative transactions. This collateral is allocated to the maturity buckets in accordance with the maturity classification of the derivative contracts.
in € millions | < 1 month | 1 - 3 months | 3 months - 1 year | 1 - 5 years | > 5 years | Not determined | Total | |||||||
|---|---|---|---|---|---|---|---|---|---|---|---|---|---|---|
2025 | 2024 | 2025 | 2024 | 2025 | 2024 | 2025 | 2024 | 2025 | 2024 | 2025 | 2024 | 2025 | 2024 | |
Assets | ||||||||||||||
Investments | 140 | 373 | 255 | 143 | 527 | 805 | 3,262 | 3,152 | 2,611 | 2,710 | 15 | 16 | 6,809 | 7,199 |
Derivatives | 112 | 197 | 61 | 154 | 59 | 241 | 415 | 424 | 1,141 | 1,125 | -- | -- | 1,789 | 2,141 |
Loans and advances to customers | 462 | 456 | 351 | 315 | 1,633 | 1,024 | 5,326 | 4,704 | 51,399 | 47,995 | -- | -- | 59,172 | 54,494 |
Loans and advances to banks | 3,552 | 2,223 | 1379 | 1,532 | 2,179 | 2,263 | 160 | 517 | 52 | 175 | 0 | -- | 7,323 | 6,710 |
Cash and balances at central banks | 1,178 | 2,834 | -- | -- | -- | -- | -- | -- | -- | -- | -- | -- | 1,178 | 2,834 |
Tangible and intangible assets | 1 | 1 | 2 | 2 | 6 | 7 | 4 | 11 | 3 | 1 | 33 | 33 | 48 | 55 |
- of which right of use assets | 1 | 1 | 2 | 2 | 6 | 7 | 4 | 11 | 3 | 1 | -- | -- | 16 | 22 |
Tax assets | - | -- | -- | -- | -- | -- | 3 | -- | -- | -- | 0 | 11 | 3 | 11 |
Other assets | 107 | -- | 1 | 1 | 1 | 3 | 79 | 243 | 154 | -- | -- | -- | 342 | 247 |
Total assets | 5,553 | 6,084 | 2,049 | 2,147 | 4,406 | 4,343 | 9,250 | 9,051 | 55,359 | 52,006 | 48 | 60 | 76,664 | 73,691 |
Equity and liabilities | ||||||||||||||
Total equity | - | -- | - | -- | 1 | 1 | 298 | 298 | -- | -- | 4,032 | 3,749 | 4,331 | 4,048 |
Subordinated debts | - | -- | - | -- | - | 499 | 494 | -- | -- | 498 | -- | -- | 494 | 997 |
Debt certificates | 797 | 513 | 2,499 | 583 | 1,585 | 20 | 2,576 | 4,269 | 4,416 | 3,937 | -- | -- | 11,873 | 9,322 |
- of which senior unsecured | - | -- | 500 | -- | 533 | -- | 1,560 | 2,594 | 1,057 | 573 | -- | -- | 3,650 | 3,167 |
- of which covered bonds | 497 | -- | - | -- | - | -- | 1,016 | 1,500 | 3,358 | 3,364 | -- | -- | 4,872 | 4,864 |
- of which RMBS | - | -- | 7 | 8 | 156 | 15 | -- | 175 | -- | -- | -- | 164 | 198 | |
Derivatives | 89 | 155 | 58 | 101 | 31 | 161 | 107 | 162 | 224 | 525 | -- | -- | 509 | 1,105 |
Amounts due to customers | 54,936 | 53,392 | 35 | 65 | 167 | 207 | 765 | 729 | 1,908 | 1,760 | -- | -- | 57,811 | 56,153 |
- of which due on demand | 43,519 | 39,930 | - | -- | - | -- | -- | -- | -- | -- | -- | -- | 43,519 | 39,930 |
- of which senior unsecured | - | 46 | - | 21 | - | 31 | 38 | 21 | 9 | 24 | -- | -- | 46 | 143 |
- of which covered bonds | - | -- | - | -- | - | 46 | 21 | -- | 91 | 112 | -- | -- | 112 | 158 |
Amounts due to banks | 41 | 307 | 5 | 87 | 35 | 136 | 54 | 239 | 983 | 633 | -- | -- | 1,117 | 1,401 |
- of which senior unsecured | - | -- | - | -- | - | -- | -- | -- | -- | -- | -- | -- | -- | -- |
- of which other | 41 | 307 | 5 | 87 | 35 | 136 | 54 | 239 | 983 | 633 | -- | -- | 1,117 | 1,401 |
Provisions | - | -- | - | -- | - | -- | -- | -- | -- | -- | 263 | 405 | 263 | 405 |
Tax liabilities | - | -- | - | -- | - | -- | -- | -- | -- | -- | 2 | 20 | 2 | 20 |
Other liabilities | 235 | 199 | 3 | 3 | 5 | 11 | 5 | 12 | 3 | 1 | 13 | 14 | 264 | 240 |
- of which lease liabilities | 1 | 1 | 3 | 3 | 5 | 11 | 5 | 12 | 3 | 1 | -- | -- | 17 | 28 |
Total equity and liabilities | 56,098 | 54,566 | 2,600 | 839 | 1,825 | 1,035 | 4,298 | 5,710 | 7,533 | 7,354 | 4,310 | 4,188 | 76,664 | 73,691 |
The table below provides a breakdown of the liquidity profiles for financial liabilities and derivatives on the liability side of the balance sheet at year-end. The table also shows the related future undiscounted contractual cashflows.
In € millions | < 1 month | 1 - 3 months | 3 months - 1 year | 1 - 5 years | > 5 years | Total | ||||||
|---|---|---|---|---|---|---|---|---|---|---|---|---|
2025 | 2024 | 2025 | 2024 | 2025 | 2024 | 2025 | 2024 | 2025 | 2024 | 2025 | 2024 | |
Subordinated debts | -- | -- | -- | -- | 21 | 529 | 583 | 83 | -- | 521 | 603 | 1,133 |
Debt certificates | 801 | 520 | 2,556 | 636 | 1,685 | 101 | 2,941 | 4,159 | 4,701 | 4,752 | 12,685 | 10,167 |
Amounts due to customers | 54,937 | 53,394 | 35 | 65 | 171 | 166 | 777 | 752 | 1,919 | 1,841 | 57,839 | 56,217 |
Amounts due to banks | 41 | 307 | 5 | 87 | 35 | 136 | 54 | 239 | 983 | 633 | 1,117 | 1,401 |
Lease obligations | 1 | 1 | 3 | 3 | 5 | 11 | 5 | 12 | 3 | 1 | 17 | 28 |
Total | 55,780 | 54,221 | 2,599 | 790 | 1,917 | 943 | 4,359 | 5,244 | 7,607 | 7,748 | 72,262 | 68,946 |
Derivatives | ||||||||||||
Interest rate derivatives | 7 | 11 | 27 | 9 | 62 | 88 | 182 | 349 | 94 | 317 | 373 | 774 |
Currency contracts | 84 | 143 | 55 | 108 | 26 | 166 | 6 | 4 | -- | -- | 171 | 422 |
Total | 92 | 155 | 82 | 117 | 88 | 254 | 188 | 353 | 94 | 317 | 544 | 1,196 |
Off-balance sheet commitments | ||||||||||||
Loan commitments given | 3,585 | 3,041 | -- | -- | -- | -- | -- | -- | -- | -- | 3,585 | 3,041 |
Financial guarantees and other commitments | 2 | 3 | -- | -- | -- | -- | -- | -- | -- | -- | 2 | 3 |
Total off-balance sheet commitments | 3,587 | 3,044 | -- | -- | -- | -- | -- | -- | -- | -- | 3,587 | 3,044 |
The following table provides an overview of the amounts estimated to mature within twelve months and after twelve months based on the behavioural maturity profile.
in € millions | Up to one year | More than one year | Total | |||
|---|---|---|---|---|---|---|
2025 | 2024 | 2025 | 2024 | 2025 | 2024 | |
Assets | ||||||
Investments | 921 | 1,321 | 5,888 | 5,878 | 6,809 | 7,199 |
Derivatives | 233 | 592 | 1,556 | 1,549 | 1,789 | 2,141 |
Loans and advances to customers | 5,113 | 4,214 | 54,059 | 50,280 | 59,172 | 54,494 |
Loans and advances to banks | 7,111 | 6,018 | 212 | 692 | 7,323 | 6,710 |
Cash and balances at central banks | 1,178 | 2,834 | -- | -- | 1,178 | 2,834 |
Tangible and intangible assets | 9 | 10 | 39 | 45 | 48 | 55 |
Tax assets | -- | -- | 3 | 11 | 3 | 11 |
Other assets | 108 | 3 | 234 | 244 | 342 | 247 |
Total assets | 14,673 | 14,992 | 61,991 | 58,699 | 76,664 | 73,691 |
Liabilities | ||||||
Subordinated debts | -- | 499 | 494 | 498 | 494 | 997 |
Debt certificates | 4,881 | 1,116 | 6,992 | 8,206 | 11,873 | 9,322 |
Derivatives | 178 | 417 | 331 | 688 | 509 | 1,105 |
Amounts due to customers | 4,094 | 5,188 | 53,717 | 50,965 | 57,811 | 56,153 |
Amounts due to banks | 81 | 529 | 1,036 | 872 | 1,117 | 1,401 |
Provisions | -- | -- | 263 | 405 | 263 | 405 |
Tax liabilities | -- | -- | 2 | 20 | 2 | 20 |
Other liabilities | 243 | 213 | 21 | 27 | 264 | 240 |
Total liabilities | 9,477 | 7,962 | 62,856 | 61,681 | 72,333 | 69,643 |
For Loans and advances to customers and Amounts due to customers, the behavioural maturity profile differs from the contractual cash flows. A shorter term to maturity is used for mortgages due to anticipated prepayments based on an internally developed prepayment model. A longer term to maturity is used for demand deposits and balances in customers’ current accounts based on an internally developed liquidity maturity model. This reflects that, in normal circumstances, customers tend to hold on to such products for longer periods of time. The models are based on historically observed customer behaviour and use a combination of internal and external risk drivers. We use the models for monitoring the bank’s liquidity mismatch position.
22 Market risk exposure
The overview below presents the balance sheet broken down by the risks associated with the banking book and the trading book.
The market risk exposure of the trading book decreased to a carrying amount of € 185 million for assets, and decreased to € 182 million for liabilities (2024: € 427 million and € 425 million respectively).
in € millions | Carrying amount | Market risk measure | Carrying amount | Market risk measure | Primary risk sensitivity | ||
|---|---|---|---|---|---|---|---|
Non-trading | Trading | Non-trading | Trading | ||||
2025 | 2025 | 2025 | 2024 | 2024 | 2024 | ||
Assets subject to market risk | |||||||
Investments fair value through P&L | 23 | 23 | -- | 12 | 12 | -- | interest rate, exchange rate, credit spread |
Investments fair value OCI | 4,232 | 4,232 | -- | 3,931 | 3,931 | -- | interest rate, exchange rate, credit spread |
Investments amortised costs | 2,554 | 2,554 | -- | 3,256 | 3,256 | -- | interest rate, exchange rate, credit spread |
Derivatives | 1,789 | 1,604 | 185 | 2,141 | 1,714 | 427 | interest rate, exchange rate |
Loans and advances to customers | 59,172 | 59,172 | -- | 54,494 | 54,494 | -- | interest rate |
Loans and advances to banks | 7,323 | 7,323 | -- | 6,710 | 6,710 | -- | interest rate, exchange rate |
Cash and cash equivalents | 1,178 | 1,178 | -- | 2,834 | 2,834 | -- | interest rate |
Other | 393 | 393 | -- | 302 | 313 | -- | |
Total assets | 76,664 | 76,479 | 185 | 73,680 | 73,264 | 427 | |
Liabilities subject to market risk | |||||||
Subordinated debts | 494 | 494 | -- | 997 | 997 | -- | interest rate |
Debt certificates | 11,873 | 11,873 | -- | 9,322 | 9,322 | -- | interest rate |
Derivatives | 509 | 327 | 182 | 1,105 | 680 | 425 | interest rate, exchange rate |
Amounts due to customers | 57,811 | 57,811 | -- | 56,153 | 56,153 | -- | interest rate |
Amounts due to banks | 1,117 | 1,117 | -- | 1,401 | 1,401 | -- | interest rate |
Other | 4,860 | 4,860 | -- | 4,702 | 4,713 | -- | |
Total liabilities | 76,664 | 76,482 | 182 | 73,680 | 73,266 | 425 | |
23 Related parties
Identity of related parties
Parties are considered to be related if one party has the ability to control the other party or exercise significant influence over the other party in making financial or operating decisions. As a part of its ordinary business operations, ASN Bank maintains various forms of ordinary business relationships with related companies and parties. Related parties of ASN Bank are associated companies, joint ventures, SNS REAAL Pensioenfonds, Stichting administratiekantoor beheer financiële instellingen (NLFI), the Dutch State and senior executives and their close family members. Transactions with these related parties mainly concern day-to-day matters in the field of banking, taxation and other administration.
Transactions with related parties have been conducted under normal market terms and conditions, except where stated otherwise. In the transactions with related parties, best practices provisions 2.7.2, 2.7.3, 2.7.4, 2.7.5 and 2.7.6 of the Dutch Corporate Governance Code were complied with.
Positions and transactions with related parties
ASN Bank N.V. forms a fiscal unity with some of its subsidiaries for corporate income tax and Value Added Tax (VAT) purposes. ASN Bank N.V. and its subsidiaries that are part of a fiscal unity are jointly and severally liable for corporate income tax liabilities and VAT obligations arising from the relevant fiscal unity.
For more information on the current recoverable and payable corporate income tax, reference is made to Note 9 Tax assets and liabilities of the consolidated financial statements. Settlements of corporate income tax paid or received are executed by ASN Bank N.V.
ASN Bank pays pension premiums for its employees to the SNS REAAL pension fund in the amount of € 52 million (2024: € 46 million).
Positions and transactions with managers in key positions
At year-end 2025 ASN Bank's top management consists of the Executive Board (ExBo). The ExBo consist of five statutory Executive Board members, under the Articles of Association ('statutaire Directie').
In 2025 , several changes were made in the governance structure of ASN Bank as well as in the composition of the Executive Board. In 2024 ASN Bank's top management consisted of the Executive Committee (ExCo) (consisting of both statutory and non-statutory members), with effect from 1 March 2025 this was replaced by an Executive Board with statutory members only.
In 2025, no ExBo members resigned from their positions and two members were appointed to the ExBo. Because of the above mentioned changes three non-statutory members of the former ExCo are no longer considered to be members of ASN Bank's top management. At the end of 2025, five persons were regarded as managers in key positions (year-end 2024: 6 persons).
in € thousands | Statutory | Non-statutory | Total | |||
|---|---|---|---|---|---|---|
2025 | 2024 | 2025 | 2024 | 2025 | 2024 | |
Fixed annual income | 2,364 | 1,653 | -- | 1,269 | 2,364 | 2,922 |
Pension contribution | 125 | 91 | -- | 88 | 125 | 179 |
Severance payments | -- | 71 | -- | -- | -- | 71 |
Total | 2,489 | 1,815 | -- | 1,357 | 2,489 | 3,172 |
Fixed annual income includes all remuneration components paid by the employer with the exception of the pension contribution and severance payments presented separately in the table.
Pension contribution means the pension contribution paid by the employer, after deduction of the contribution paid by the employee. Extra payments to compensate for the loss of pension exceeding € 137,800 are included in the table under fixed annual income.
On 31 December 2025, no loans granted to managers in key positions were outstanding.
The remuneration of individual members of the Executive Board and members of the Supervisory Board are explained in more detail in the tables in Section Remuneration report.
Subsidiaries of ASN Bank N.V.
Place of business | Proportion of ordinary shares | |
|---|---|---|
Ecosystemen B.V. | Utrecht | 100% |
ASN Beleggingsinstellingen Beheer B.V. | The Hague | 100% |
Stichting Administratiekantoor Bewaarbedrijven SNS | Utrecht | 100% |
SNS Global Custody B.V. | Utrecht | 100% |
Pettelaar Effectenbewaarbedrijf N.V. | Utrecht | 100% |
ASN Duurzame Deelnemingen N.V. | Utrecht | 100% |
Fitrex B.V. | Amsterdam | 100%1 |
- As at 31 December 2024 the proportion in Fitrex was 90%
The above mentioned subsidiaries are consolidated in the consolidated financial statements of ASN Bank.
Consolidated structured entities
According to IFRS Accounting Standards, the structured entities over which ASN Bank can exercise control are consolidated. ASN Bank's activities involving structured entities are broken down into the following categories:
Securitisation programme
Covered bond programme
ASN Bank does not have a contractual obligation to provide financial support other than liquidity facilities to its consolidated structured entities. The liquidity facilities refer to cash advance facilities provided to securitisation entities that have been structured by ASN Bank (e.g. Lowlands). Any drawing under the cash advance facility can only be made on a notes payment date in case of a temporary shortfall in the available revenue funds of the structured entity. Neither of the consolidated structured entities have taken benefit of the liquidity facilities, nor has ASN Bank provided voluntary non-contractual financial support to the Loan Loss Provision (LLP) over the reported periods.
Place of business | Proportion of ordinary shares | |
|---|---|---|
Pearl Mortgage Backed Securities 1 B.V. | Amsterdam | 0% |
Lowland Mortgage Backed Securities 7 B.V. | Amsterdam | 0% |
ASN Covered Bond Company B.V. | Amsterdam | 0% |
For more information on the consolidated structured entities, see Note 13 Debt certificates.
24 Transferred and encumbered assets
Accounting policy for transferred and encumbered assets
Transferred financial assets are transactions for which ASN Bank has:
transferred the contractual rights to receive the cashflows of the financial asset to a third party or parties, or;
retained the contractual rights to receive the cashflows of that financial asset, but assumes a contractual obligation to pay the cashflows to a third party or parties.
Depending on additional circumstances regarding the transfer of risks and rewards, the transfer of the cash flows may either result in the financial assets being derecognised or in financial assets that continue to be recognised on the balance sheet. If transferred financial assets continue to be recognised on the balance sheet, ASN Bank is still exposed to changes in the fair value of the assets.
Encumbered assets are assets that can be used as collateral for funding, for example mortgages used as collateral for covered bond programs, securitised assets and collateral for certain repurchase agreement (repo) transactions. In addition, the mandatory cash reserve is also included in encumbered assets. Assets that are committed to undrawn credit facilities are not regarded as encumbered, for example, securitisation notes held by the bank itself which qualify as eligible collateral for the European Central Bank.
The following table shows the transferred assets from which the contractual rights to receive a cashflow have been transferred. The transferred assets mainly consist of securitised mortgages that have been transferred to a third party. The related liabilities are also presented in this table. The structured entities for the securitisations are consolidated. In all these cases the transfer of contractual rights to receive a cashflow did not result in the transfer of risks and rewards. Therefore, the assets continue to be recognised on both the consolidated and the company balance sheet.
in € millions | Securitisations | Repurchase transactions | ||
|---|---|---|---|---|
2025 | 2024 | 2025 | 2024 | |
Transferred assets | ||||
Loans and advances | 206 | 242 | -- | -- |
Total transferred assets as per year-end | 206 | 242 | -- | -- |
Debt certificates | 164 | 198 | -- | -- |
- Issued under securitisation programme Pearl | 164 | 198 | -- | -- |
Total transferred liabilities as per year-end | 164 | 198 | -- | -- |
For more information, see Note 13 Debt certificates - Medium Term Notes and 13 Debt certificates - Securitisation programmes of the consolidated financial statements.
in € millions | Covered bonds and secu- | Deriva- | Repur- | Other | Central banks | Total 2025 |
|---|---|---|---|---|---|---|
Investments - debt securities | -- | 475 | -- | -- | 142 | 617 |
Loans and advances to banks | -- | 312 | -- | -- | -- | 312 |
Loans and advances to customers | 5,469 | -- | -- | 1,6851 | -- | 7,154 |
Total encumbered assets | 5,469 | 787 | -- | 1,685 | 142 | 8,083 |
- Pledged to savings premiums received in savings mortgage arrangement for € 1,129 million.
in € millions | Covered bonds and secu- | Deriva- | Repur- | Other | Central banks | Total 2024 |
|---|---|---|---|---|---|---|
Investments - debt securities | -- | 263 | -- | -- | 257 | 520 |
Loans and advances to banks | -- | 418 | -- | -- | 518 | 936 |
Loans and advances to customers | 5,480 | -- | -- | 1,7731 | -- | 7,253 |
Total encumbered assets | 5,480 | 681 | -- | 1,773 | 775 | 8,709 |
- Pledged to savings premiums received in savings mortgage arrangement for € 1,184.
The encumbered assets consist of the assets lodged as collateral and the mandatory cash reserve at DNB. The encumbered assets are shown at book value at the end of the year. On the balance sheet date, there were no significant restrictions accompanying financial assets from non-controlling interests' proportionate share.
25 Post balance sheet events
There were no material post balance sheet events that required disclosure or adjustment to the 31 December 2025 financial statements.
26 Net interest income
Interest income comprises of interest income on financial assets that is attributable to the period. Interest results on instruments classified at Amortised Cost, assets measured at FVOCI and derivatives in a hedge accounting relationship are presented in ‘Interest income using the effective interest rate method’. Interest component on financial assets and liabilities at FVTPL and derivatives in economic hedges are presented in ‘Other interest income/(expense)’.
The effective interest method is based on the estimated future cash flows, taking into account the risk of early redemption of the financial instruments and the direct costs and income, such as the transaction costs charged, brokerage fees and discounts or premiums. If the risk of early redemption cannot be reliably determined, ASN Bank calculates the cash flows over the full contractual term of the financial instruments.
Commitment fees, together with the related direct costs, are included in Interest income (expense) using the effective interest rate method.
For credit-impaired assets valued at amortised cost, i.e. less any impairment losses, interest income consists of the time value of money.
Interest expenses comprise of interest expenses arising from financial liabilities. Interest expenses on financial liabilities that are valued at amortised cost are presented in Interest expense using the effective interest method, whereas interest expenses on financial liabilities that are classified at fair value through profit or loss and derivatives in so-called economic hedges are accounted for based on nominal interest rates and presented in Other interest expense.
in € millions | 2025 | 2024 |
|---|---|---|
Interest income calculated using the effective interest method | 2,075 | 2,230 |
Other interest income | 122 | 146 |
Interest expense calculated using the effective interest method | 1,043 | 1,103 |
Other interest expense | 32 | 33 |
Net interest income | 1,122 | 1,240 |
A change in accounting policy was processed regarding the presentation of the interest component of economic hedge derivatives, which was included in Trading result derivatives, investments and other financial instruments. The interest component was reclassified from Other results on financial instruments to Other interest income and Other interest expense. For more information, see Changes in accounting policies, estimates and presentation.
Net interest income decreased by € 118 million to € 1,122 million (-10%), and the net interest margin declined to 1.50% (2024: 1.72%). Both decreases were mainly driven by lower net interest income on cash management activities, due to the decline in the ECB deposit facility rate and less cash volume year-on-year.
Commercial interest income1 on residential mortgages increased, despite a competitive domestic market, driven by portfolio growth in combination with a broadly stable portfolio margin in basis points. The residential mortgage portfolio, excluding IFRS value adjustments2, rose to € 56.5 billion (year-end 2024: € 52.0 billion). Commercial interest income on savings remained virtually stable in 2025.
- Commercial interest income consists of the margin in €.
- Consist of fair value adjustments from hedge accounting and amortisations.
in € millions | 2025 | 2024 | ||||
|---|---|---|---|---|---|---|
Gross interest income | Hedging results | Total interest income | Gross interest income | Hedging results | Total interest income | |
Residential mortgages | 1,476 | 159 | 1,635 | 1,312 | 260 | 1,572 |
Cash and balances at central banks | 40 | -- | 40 | 122 | -- | 122 |
Other loans and advances to customers | 138 | -- | 138 | 144 | -- | 144 |
Loans and advances to banks | 87 | -- | 87 | 187 | -- | 187 |
Investments | 143 | 32 | 175 | 109 | 95 | 204 |
Other | -- | -- | -- | 1 | -- | 1 |
Interest income calculated using the effective interest method | 1,884 | 191 | 2,075 | 1,875 | 355 | 2,230 |
Other interest income | 122 | -- | 122 | 146 | -- | 146 |
Total interest income | 2,006 | 191 | 2,197 | 2,021 | 355 | 2,376 |
in € millions | 2025 | 2024 | ||||
|---|---|---|---|---|---|---|
Gross interest expenses | Hedging results | Total interest expenses | Gross interest expenses | Hedging results | Total interest expenses | |
Debt certificates | 197 | 2 | 199 | 167 | 7 | 174 |
Subordinated debt | 26 | -- | 26 | 11 | -- | 11 |
Amounts due to customers | 771 | -1 | 770 | 827 | 1 | 828 |
Amounts due to banks | 48 | -- | 48 | 93 | -- | 93 |
Other | -- | -- | -- | -3 | -- | -3 |
Interest expense calculated using the effective interest method | 1,042 | 1 | 1,043 | 1095 | 8 | 1,103 |
Other interest expense | 32 | -- | 32 | 33 | -- | 33 |
Total | 1,074 | 1 | 1,075 | 1,128 | 8 | 1,136 |
27 Net fee and commission income
Fee and commission income consists of income from securities transactions of customers, asset management, payment services and other related services offered by ASN Bank.
Fee and commission income is recognised at an amount that reflects the consideration to which the bank expects to be entitled in exchange for providing the services. At inception of the contract, the performance obligations, including the timing of satisfaction, are identified and determined. Fee and commission income is invoiced and immediately due upon satisfaction of the service provided at a point in time or invoiced at the end of the contract period for services provided over time. Fee and commission income is recognised in the reporting period in which the services are rendered.
Commission expenses and management fees are accounted for as ‘fee and commission expenses’ to the extent services are acquired in the reporting period.
in € millions | 2025 | 2024 |
|---|---|---|
Fee and commission income | ||
Money transfer and payment charges | 102 | 91 |
Advice and agency activities | 25 | 27 |
Management fees | 50 | 54 |
Insurance agency activities | 20 | 18 |
Other activities | -- | 1 |
Total fee and commission income | 197 | 191 |
Fee and commission expenses | ||
Money transfer and payment charges | 22 | 20 |
Advice and agency activities | 3 | 2 |
Management fees | 19 | 20 |
Insurance agency activities | 1 | 1 |
Fee franchise | 69 | 71 |
Total fee and commission expenses | 114 | 114 |
Total | 83 | 77 |
Gross fee and commission income rose by € 6 million to € 197 million (+3%), while total fee and commission expenses remained stable at € 114 million. Net fee and commission income rose by € 6 million to € 83 million (+8%), mainly due to higher payment fees as a result of the customer base growth and repricings. Management fees were slightly below 2024. At year-end 2025, assets under management stood at € 3.9 billion, lower than compared to year-end 2024 (€ 4.1 billion).
28 Investment income (losses)
Investment income (losses) consists of dividend income and unrealised and realised gains or losses for debt- and equity securities.
Dividend income is recognised in the income statement when entitlement is established. For listed securities, this is the date on which these securities are quoted ex-dividend.
This includes the unrealised and realised gains or losses for investments in the following categories:
Amortised cost (realised);
Fair value through other comprehensive income (realised);
Fair value through profit or loss (unrealised and realised).
Investments included in a fair value hedge accounting relationship are reported in Other results on financial instruments.
in € millions | Realised gains (losses) | Unrealised gains (losses) | Total | |||
|---|---|---|---|---|---|---|
2025 | 2024 | 2025 | 2024 | 2025 | 2024 | |
Debt securities - amortised cost | -- | -- | -- | -- | -- | -- |
Debt securities - fair value through OCI | 3 | -17 | -- | -- | 3 | -17 |
Equity securities - fair value through P&L | -- | -- | 3 | -- | 3 | |
Total | 3 | -17 | -- | 3 | 3 | -14 |
Investment income amounted to € 3 million, compared to € 14 million negative in 2024, which consisted of realised results on fixed-income investments, in the light of our regular asset and liability management.
In 2025, disposals from the amortised cost category consisted of a debt security that was sold because its credit rating following restructuring no longer met our investment mandate. In 2024, no disposals were made from the HTC portfolio.
29 Other results on financial instruments
This line item includes revaluation results on derivatives and other financial instruments classified as fair value through profit and loss. Derivatives are recognised at fair value. For derivatives that are designated as a hedging instrument and economic hedges interest income and expense is presented in Net interest income.
For derivatives in a cash flow hedge relation the revaluation results are recognised in the cash flow hedge reserve.
Fair value movements in the hedged item attributable to hedged risk in a fair value hedge relation are included in this line item as well as the ineffective portion of any gains or losses of hedge relations.
Furthermore, this line item includes realised results from buy backs of own debt certificates.
in € millions | 2025 | 2024 |
|---|---|---|
Ineffectiveness fair value hedge accounting | 11 | 4 |
Foreign exchange results | 4 | 8 |
Valuation results of liabilities measured at FVPL and related economic hedge derivatives | 1 | -1 |
Results trading derivatives and other financial instruments | -4 | -6 |
Result on buy back of debt instruments | -1 | -- |
Total | 11 | 5 |
A change in accounting policy was processed regarding the presentation of the interest component of economic hedge derivatives, which was included in Trading result derivatives, investments and other financial instruments. The interest component was reclassified from Other results on financial instruments to Other interest income and Other interest expense. For more information, see Changes in accounting policies, estimates and presentation.
Other results on financial instruments amounted to € 11 million compared to € 5 million in 2024. In both periods, these mainly consisted of hedge ineffectiveness results.
30 Staff costs
These costs comprise all costs related to personnel. This includes salaries, social security costs, pension costs and other salary-related costs. Staff costs are recognised in the period in which the employees provide the services to which the payments relate. The accounting policies for employee benefits are included in Note 15 Provisions.
in € millions | 2025 | 2024 |
|---|---|---|
Salaries | 255 | 274 |
Pension costs | 52 | 46 |
Social security | 47 | 44 |
Other staff costs | 210 | 357 |
Total | 564 | 721 |
In 2025, staff costs decreased by € 157 million to € 564 million (2024: € 721 million). In 2025, staff costs were negatively impacted by incidental items totalling € 65 million, consisting of an addition to the restructuring provision related to the transformation programme. In 2024 they were negatively impacted by incidental items totalling € 207 million, consisting of charges to the provision for the transformation programme and the AFC remediation programme. For more information see Note 15 Provisions
Excluding incidental items, staff costs decreased by € 15 million to € 499 million. Staff costs declined as reductions in structural FTEs resulting from the transformation outweighed the impact of wage inflation and an increase in temporary FTEs covering remediation work on anti-financial crime and risk management-related topics. The total reported number of FTEs dropped by 165 to 4,192 compared to year-end 2024.
Pension rights of ASN Bank employees are included in the Defined Contribution Plan of the independent SNS REAAL Pension Fund Foundation. ASN Bank pays an employer pension contribution for the accrual of new rights, linked to the target accrual of 1.875%. However, this contribution is capped at 24% of gross wages. In 2025, a percentage of 23.72% of gross wages was paid (2024: 17.55%). As there is no commitment either enforceable by law or otherwise to pay additional contributions, pension benefits and related investments are not included in the balance sheet. The employee contribution is 5% (2024: 0%) of the pensionable wage. The employee contribution is part of the employer pension contribution and is paid simultaneously to the pension fund.
As of 1 January 2028, ASN Bank will transition to the new pension system (Future Pensions Act) and will switch to a Flexible Premium Scheme with a collective payout phase and a risk-sharing reserve for retirees. This scheme will also be implemented by the SNS REAAL Pension Fund Foundation.
FTEs | 2025 | 2024 |
|---|---|---|
Number of internal FTEs | 3,388 | 3,602 |
Number of external FTEs | 804 | 755 |
Total number of FTEs | 4,192 | 4,357 |
The variable remuneration for senior management was abolished in 2018 and no variable remuneration has been paid out since then.
31 Other operating expenses
Costs are recognised at nominal value in the period in which services have been provided and to which the payments relate. The other operating expenses comprise costs for housing, information technology, marketing, consultancy and other operating costs and prudential costs.
in € millions | 2025 | 2024 |
|---|---|---|
Housing costs | 7 | 17 |
Information technology costs | 105 | 98 |
Marketing and public relations costs | 28 | 20 |
Consultancy costs and audit fees | 89 | 70 |
Regulatory levies | -4 | 11 |
Other costs | 65 | 176 |
Total | 290 | 392 |
In 2025, Other operating expenses decreased by € 102 million to € 290 million (2024: € 392 million), largely as a result of a lower negative impact from incidental items- in 2024. These incidental items consisted of charges to the provision for the transformation programme, the AFC remediation programme and the settlement of legal proceedings. For more information see Note 15 Provisions
Excluding incidental items, operating expenses increased by € 58 million. This was driven by increases totalling € 34 million relating to information technology, marketing as well as consultancy costs as a direct consequence of the transformation programme.
in € millions | 2025 | 2024 |
|---|---|---|
Deposit Guarantee Scheme | 5 | 11 |
Single Resolution Fund | -9 | -- |
Total | -4 | 11 |
The European Deposit Guarantee Scheme Directive was implemented in Dutch legislation on 26 November 2015. This directive establishes common standards across the EU and aims to strengthen the protection of depositors. It ensures that depositors will continue to benefit from a guaranteed coverage up to € 100,000 in case of bankruptcy. This will be backed by funds that will be collected from the banking sector. A significant component of the rules is a pre-funded Deposit Guarantee Scheme (DGS). In the DGS, banks pay quarterly contributions into a Deposit Guarantee Fund (DGF). The level of the contribution paid by ASN Bank depends on the amount of guaranteed deposits at ASN Bank and the risk profile, partly in relation to the other banks that are part of the scheme. The target size of the DGF is equal to 0.8% of the total guaranteed deposits of the banks collectively, a target that had to be reached by 2024.
Regulatory levies in the reporting period (€ 5 million) were entirely linked to the ex-ante DGS contribution (2024: € 11 million).
In order to finance an orderly winding up of failing banks, a National Resolution Funds (NRF) was established in 2015, which is ex-ante financed by contributions raised from the banks. The NRF was replaced by the Single Resolution Fund (SRF) as from 2016. The SRF builds up over eight years, reaching a target level of at least 1% of the amount of covered deposits of all credit institutions of all the participating member states.
In 2025, and also in 2024, ASN Bank did not include contribution as the target level of this fund had been reached in 2023, marking the end of the build-up phase. We recorded our contributions to the SRF as an expense under Other operating expenses and we do not use the option to meet these contributions as irrevocable payment obligations.
Levies in 2025 consisted of a € 9 million refund of a prior year’s contribution to the SRF.
Audit fees
in € thousands, excluding applicable VAT | EY Accountants | |
|---|---|---|
2025 | 2024 | |
Statutory audit of annual accounts, including the audit of the financial statements and other statutory audits of subsidiaries and other consolidated entities | 2,518 | 2,510 |
Other assurance services | 2,101 | 2,129 |
Tax advisory services | -- | -- |
Other non-audit services | -- | -- |
Total | 4,619 | 4,639 |
Audit fees relate to the financial year to which the financial statements pertain, regardless of whether the external auditor and the audit firm performed the work during the financial year.
In addition to the statutory audit and the performance of other statutory audits, the auditor also provides a number of other assurance services. These other assurance services consist of the fees for assurance on sustainability statements, review of interim financial information, the assessment of non-financial information as included in the Annual Report, internal control (ISAE 3402) reports and activities related to the separation of assets, cost price model, prospectuses and bond issues. Furthermore, these activities include reporting activities to the regulatory authority and securitisations and the covered bond programme in relation to mortgage pools within the context of outsourcing.
32 Impairment charges (releases) on financial assets
Financial assets measured at amortised cost and fair value through OCI, including loan commitments and financial guarantee contracts (off-balance sheet positions) are subject to impairments. An impairment is recognised in the income statement. The accounting principles for impairment are explained in more detail in the accounting principles of the balance sheet items that are subject to impairments. For more information about the stage allocation process and associated provisioning methodology, please refer to the Section Provisioning methodology.
in € millions | 2025 | 2024 |
|---|---|---|
Investments | -1 | -- |
Loans and advances to banks | -1 | -1 |
Loans and advances to customers | -30 | -50 |
Of which residential mortgages | -38 | -48 |
Of which consumer loans | 1 | -- |
Of which SME loans | -3 | -7 |
Of which other corporate and government loans | 10 | 5 |
Total | -32 | -51 |
Total impairment charges of financial assets consisted of a release of 32 million, compared to a release of € 51 million in 2024. For a more detailed description of the impairments based on the Expected Credit Loss model in line with IFRS 9, see the Section Credit risk.
For residential mortgages the bank recorded an impairment release of € 38 million, compared to a release of € 48 million in 2024. The release in 2025 was mainly attributable to lower modelled provisions due to the implementation of an enhanced IFRS 9 Expected Credit Loss (ECL) model and a € 7 million decrease in the management overlay. The new model shows lower expected credit losses (ECL) compared to the previous model, primarily because of lower loss given default (LGD) rates driven by positive house price developments, methodological improvements in modelling and the incorporation of more recent and enhanced data.
The release in 2024 was mainly related to a decrease in the modelled provision, driven by an improved macroeconomic outlook and higher house prices at the time, which also led to a shift of mortgages to lower LtV buckets.
Incurred credit losses (write-offs) on residential mortgages were negligible (zero bps) in both years, reflecting the strong underlying credit quality of our portfolio.
Impairment charges on consumer loans amounted to a small charge of € 1 million (2024: nil), reflecting the small size of the portfolio and a virtually unchanged credit quality.
Impairment charges on SME loans consisted of a release of € 3 million compared to a release of € 7 million in 2024. The reversal in 2025 was driven by a decrease in the number of defaults within stage 3 and arrears within stage 2. The release in 2024 was partly driven by the full release of the management overlay for SME customers who might be affected by high inflation. The credit quality of the SME loan portfolio remained sound and incurred credit losses were very limited.
Impairment charges on other corporate and government loans consisted of a charge of € 10 million compared to a charge of € 5 million in 2024, in both periods consisting of impairments on certain individual corporate loans as a result of increased credit risk.
Slightly decreased credit spreads resulted in a release of € 1 million on loans to banks in both reporting periods. Impairments on investments were also a release of € 1 million in 2025 (2024: nil).
33 Taxation
Income tax consists of current and deferred tax. Income tax is recognised in the income statement in the period in which profits arise and measured using tax rates enacted at the balance sheet date.
in € millions | 2025 | 2024 |
|---|---|---|
In financial year | 109 | 76 |
Prior year adjustments | -- | -- |
Corporate income tax due | 109 | 76 |
Due to temporary differences | -- | -1 |
Deferred tax | -- | -1 |
Total | 109 | 75 |
in € millions | 2025 | 2024 |
|---|---|---|
Statutory income tax rate | 25.8% | 25.8% |
Result before taxation | 377 | 219 |
Statutory corporate income tax amount | 97 | 57 |
Thin cap rule | 17 | 23 |
Permanent differences | -5 | -5 |
Total | 109 | 75 |
Effective tax rate | 28.9% | 34.2% |
ASN Bank recognised € 109 million in corporate income tax, corresponding to an effective tax rate of 28.9% (2024: 34.2%), above the nominal rate of 25.8%. This was the result of the interest deduction limitation on borrowed capital (thin cap rule). This was partly offset by the tax impact from interest expenses related to Additional Tier 1 capital securities recognised directly in shareholders' equity.
Income tax consequences of dividend
Dividends are subject to a 15% withholding tax in The Netherlands. In 2025 ASN Bank did not pay out any dividend and therefore withheld € 0 million (2024: € 25 million) of dividend withholding tax on dividends paid to its shareholders.
Country-by-country reporting
On the basis of Article 89 (1) of CRD IV, financial institutions are required to disclose the Member States and third countries in which they operate. ASN Bank is not active abroad and does not have any subsidiaries abroad. All its activities take place in the Netherlands. For more information on the subsidiaries and consolidated structured entities of ASN Bank, see Note 23 Related parties.
Name | ASN Bank | |
|---|---|---|
Nature of activities | Credit institution | |
Geographical location | The Netherlands | |
in € millions | 2025 | 2024 |
Turnover | 1,219 | 1,308 |
Revenues from third-party sales | -- | -- |
Revenues from intra-group transactions with other tax jurisdiction | n.a. | n.a. |
Number of FTEs on a full-time basis | 4,192 | 4,357 |
Tangible assets other than cash and cash equivalents | 44 | 50 |
Profit before taxation | 377 | 219 |
Corporate income tax on profit | 109 | 75 |
Corporate income tax on profit paid on a cash basis | 132 | 133 |
Payroll tax and social security contributions | 144 | 125 |
Non-recoverable VAT | 70 | 67 |
Bank tax | -- | -- |
Dividend tax | -- | 25 |
Public subsidies received | n.a. | n.a. |
Authorisation of the consolidated annual financial statements
Utrecht, 12 March 2026
Roland Boekhout (Chair)
André Haag
Saskia Hoskens
Isold Heemstra
Gwendolyn van Tunen
Gerard van Olphen (Chair)
Jos van Lange (Vice chair)
Jeanine Helthuis
Petra van Hoeken
Aloys Kregting
Company financial statements
Before result appropriation and in € millions | Notes | 31-12-2025 | 31-12-2024 |
|---|---|---|---|
Assets | |||
Cash and balances at central banks | 1,176 | 2,832 | |
Government paper eligible at the central bank | 1,153 | 1,197 | |
Loans and advances to banks | 7,323 | 6,710 | |
Loans and advances to customers | 59,172 | 54,494 | |
Debt securities | 5,640 | 5,986 | |
Equity securities | 13 | 13 | |
Investments in group companies | 92 | 84 | |
Tangible assets | 44 | 50 | |
Other assets | 2,350 | 2,580 | |
Total assets | 76,963 | 73,946 | |
Equity and liabilities | |||
Amounts due to banks | 1,117 | 1,401 | |
Amounts due to customers | 57,811 | 56,153 | |
Debt certificates | 11,709 | 9,124 | |
Other liabilities | 1,238 | 1,818 | |
Other provisions | 263 | 405 | |
Subordinated debts | 494 | 997 | |
Total liabilities | 72,632 | 69,898 | |
Share capital | 381 | 381 | |
Share premium reserve | 3,537 | 3,537 | |
Cashflow hedge reserve | 11 | 13 | |
Fair value reserve | -42 | -80 | |
Other reserves | -122 | -245 | |
Net profit for the period | 268 | 144 | |
AT1 capital securities | 298 | 298 | |
Total equity | 4,331 | 4,048 | |
Total equity and liabilities | 76,963 | 73,946 | |
Loan commitments given | 3,585 | 3,041 | |
Financial guarantees and other commitments | 58 | 42 |
in € millions | Notes | 2025 | 2024 |
|---|---|---|---|
Interest income | 2,197 | 2,376 | |
Interest expense | 1,075 | 1,136 | |
Net interest income | 1,122 | 1,240 | |
Investment income (losses) and result subsidiaries | 12 | -7 | |
Fee and commission income | 154 | 145 | |
Fee and commission expenses | 98 | 96 | |
Net fee and commission income | 56 | 49 | |
Other results on financial instruments | 12 | 8 | |
Other operating income | -- | -- | |
Total income | 1,202 | 1,290 | |
Salaries | 511 | 672 | |
Social security | 46 | 43 | |
Staff costs | 557 | 715 | |
Depreciation and amortisation of tangible and intangible assets | 20 | 27 | |
Other operating expenses | 283 | 384 | |
Impairment charges (releases) on financial assets | -32 | -51 | |
Total expenses | 828 | 1,075 | |
Result before taxation | 374 | 215 | |
Taxation | 106 | 71 | |
Net result for the period | 268 | 144 |
Company statement of changes in equity
in € millions | Issued capital | Share premium reserve | Cashflow hedge-reserve | Fair value reserve | Other reserves | Net result for the period | AT1 capital securities | Total Equity |
|---|---|---|---|---|---|---|---|---|
Balance as at 1 January 2025 | 381 | 3,537 | 13 | -80 | -245 | 144 | 298 | 4,048 |
Net result | 268 | 268 | ||||||
Other comprehensive income | -2 | 38 | 36 | |||||
Total comprehensive income | -2 | 38 | 268 | 304 | ||||
Transfer of result | 144 | -144 | 0 | |||||
Paid interest on AT1 capital securities | -21 | -21 | ||||||
Dividend | 0 | 0 | ||||||
Other movements | 0 | 0 | ||||||
Balance as at 31 December 2025 | 381 | 3,537 | 11 | -42 | -122 | 268 | 298 | 4,331 |
in € millions | Issued capital | Share premium reserve | Cashflow hedge-reserve | Fair value reserve | Other reserves | Net result for the period | AT1 capital securities | Total Equity |
|---|---|---|---|---|---|---|---|---|
Balance as at 1 January 2024 | 381 | 3,537 | 15 | -81 | -490 | 431 | 298 | 4,091 |
Net result | 144 | 144 | ||||||
Other comprehensive income | -2 | 1 | -1 | |||||
Total comprehensive income | -2 | 1 | 144 | 143 | ||||
Transfer of result | 267 | -267 | 0 | |||||
Paid interest on AT1 capital securities | -21 | -21 | ||||||
Dividend | -164 | -164 | ||||||
Other movements | -1 | -1 | ||||||
Balance as at 31 December 2024 | 381 | 3,537 | 13 | -80 | -245 | 144 | 298 | 4,048 |
The cashflow hedge reserve and fair value reserve are legal reserves.
Principles for the preparation of the company financial statements
When preparing the company financial statements, de ASN Bank N.V. makes use of the option offered in Book 2, Section 362 (8) of the Dutch Civil Code of applying the same principles for valuation and the determination of the results as are used in the consolidated financial statements for the company financial statements. Reference is made to the accounting principles for the consolidated financial statements. This also includes the change its accounting policies regarding the presentation of interest income and interest expense for economic hedged derivatives and reclassification of these results from Other results financial instruments to Other interest income and Other interest expense. The comparative figures in Other interest income increases by € 146 million, and other interest expense increases by € 33 million, and Other results financial instruments decreases by € 113 million for the period ended 31 December, 2024 have been adjusted accordingly. The presentation and notes in the company financial statements are based on Title 9, Book 2 of the Dutch Civil Code.
For additional information on items not explained further in the notes to the company statement of financial position, refer to the notes to the consolidated financial statements.
The overview as referred to in Book 2, Sections 379 and 414 of the Dutch Civil Code has been filed with the Trade Register of the Chamber of Commerce of Utrecht.
ASN Bank is located at Croeselaan 1, 3521 BJ Utrecht, the Netherlands (CoC 16062338 of Utrecht).
ASN Bank N.V. is as a public interest entity in accordance with Book 2, Section 398 (7) of the Dutch Civil Code. The company financial statements fully comply with the Dutch Annual Accounts Formats Decree (Besluit modellen jaarrekening), model K for the statement of financial position and model L for the income statement.
Subsidiaries are all companies and other entities in respect of which ASN Bank N.V. has the power to govern the financial and operating policies, whether directly or indirectly, and which are controlled by ASN Bank N.V. The subsidiaries are accounted for using the equity method. The subsidiaries are regarded as an asset and liability combination and not as an indivisible asset. The expected credit losses as prescribed in IFRS 9 on receivables from subsidiaries in the company financial statements are eliminated and included in the carrying amount of the receivables.
Changes in balance sheet values due to the results of subsidiaries, accounted for in accordance with ASN Bank N.V. accounting policies, are included in the income statement. The distributable reserves of subsidiaries are included in other reserves.
Receivables from and amounts due to subsidiaries are intercompany balances, and are valued at amortised cost.
The cashflow and fair value reserve qualify as legal revaluation reserves.
Liquid assets include the non-restricted demand deposits with the Dutch Central Bank and advances to credit institutions with a remaining maturity of less than one month.
Notes to the company financial statements
1 Cash and balances at central banks
in € millions | 2025 | 2024 |
|---|---|---|
Balances held at central banks | 1,136 | 2,763 |
Short-term bank balances | 40 | 36 |
Cash | -- | 33 |
Total | 1,176 | 2,832 |
2 Government paper eligible at the central bank
in € millions | 2025 | 2024 |
|---|---|---|
Short-term government paper - amortised costs | 558 | 879 |
Short-term government paper - fair value through OCI | 595 | 318 |
Total | 1,153 | 1,197 |
3 Loans and advances to banks
in € millions | 2025 | 2024 |
|---|---|---|
Deposits | 6,784 | 6,195 |
Mandatory cash reserve at Dutch Central Bank | 541 | 518 |
Provision for credit losses | -2 | -3 |
Total | 7,323 | 6,710 |
4 Loans and advances to customers
in € millions | 2025 | 2024 |
|---|---|---|
Residential mortgages | 54,892 | 50,835 |
Consumer loans | 70 | 60 |
SME loans | 1,529 | 1,378 |
Other corporate and government loans | 2,681 | 2,221 |
Total | 59,172 | 54,494 |
For more information on Loans and advances to customers, see Note 7 Loans and advances to customers of the consolidated financial statements.
5 Debt securities
in € millions | 2025 | 2024 |
|---|---|---|
Amortised cost | 1,996 | 2,377 |
Fair value through OCI | 3,633 | 3,609 |
Fair value through P&L | 11 | -- |
Total | 5,640 | 5,986 |
All debt securities are listed. For more information on Debt securities, see Note 5 Investments of the consolidated financial statements.
6 Equity securities
in € millions | 2025 | 2024 |
|---|---|---|
Fair value through OCI | 1 | 1 |
Fair value through P&L | 12 | 12 |
Total | 13 | 13 |
For more information on Equity securities, see Note 5 Investments of the consolidated financial statements.
7 Investments in group companies
in € millions | 2025 | 2024 |
|---|---|---|
Opening balance | 84 | 77 |
Result group companies | 9 | 7 |
Other movements | -1 | -- |
Closing balance | 92 | 84 |
Securitised mortgages are not derecognised from the company financial statements as the derecognition criteria are not met. For that reason, the equity values of subsidiaries that are presented in the company financial statements only relate to assets and liabilities of the subsidiary except securitised mortgages.
8 Tangible assets
in € millions | 2025 | 2024 |
|---|---|---|
Land and buildings | 6 | 7 |
IT equipment | 7 | 9 |
Other tangible assets | 15 | 12 |
Right of use assets | 16 | 22 |
Total | 44 | 50 |
For a more detailed explanation on the Right of use of assets, refer to Note 17 Leases in the Notes to the consolidated financial statements.
in € millions | Land and buildings | IT equipment | Other assets | Total | ||||
|---|---|---|---|---|---|---|---|---|
2025 | 2024 | 2025 | 2024 | 2025 | 2024 | 2025 | 2024 | |
Accumulated acquisition costs | 8 | 9 | 20 | 48 | 33 | 100 | 61 | 157 |
Accumulated amortisations and impairments | -2 | -2 | -13 | -39 | -19 | -88 | -33 | -129 |
Closing balance | 6 | 7 | 7 | 9 | 14 | 12 | 28 | 28 |
Opening balance | 7 | 8 | 9 | 10 | 12 | 22 | 28 | 40 |
Investments | -- | -- | 3 | 3 | 7 | 1 | 10 | 4 |
Divestments | -1 | -1 | -- | -- | -- | -- | -1 | -1 |
Depreciation | -- | -- | -5 | -4 | -3 | -6 | -8 | -10 |
Impairments | -- | -- | -- | -- | -1 | -5 | -1 | -5 |
Closing balance | 6 | 7 | 7 | 9 | 15 | 12 | 28 | 28 |
in € millions | 2025 | 2024 |
|---|---|---|
Depreciation on tangible assets | 8 | 10 |
Impairment on tangible assets | 1 | 6 |
Depreciation of right of use assets (leases) | 11 | 11 |
Total | 20 | 27 |
9 Other assets
in € millions | 2025 | 2024 |
|---|---|---|
Receivables from group companies | 218 | 195 |
Corporate income tax | 6 | -- |
Trade and other receivables | 28 | 38 |
Amounts to be settled | 260 | 155 |
Sublease | 3 | 7 |
Accrued assets | 42 | 34 |
Derivatives | 1,789 | 2,141 |
Other | 4 | 10 |
Total | 2,350 | 2,580 |
Other includes the advanced contribution of ASN Bank to the Dutch Central Bank of € 0 million (2024: € 3 million) under the DGS in relation to its share related to the bankruptcy of DSB bank.
10 Amounts due to banks
in € millions | 2025 | 2024 |
|---|---|---|
Cash collateral transactions | 1,078 | 1,205 |
Current accounts | 1 | 1 |
Deposits with agreed maturity | 38 | 195 |
Total | 1,117 | 1,401 |
For more information on Amounts due to banks, see Note 11 Amounts due to banks of the consolidated financial statements.
11 Amounts due to customers
in € millions | 2025 | 2024 |
|---|---|---|
Households | 53,810 | 52,107 |
Corporates | 4,001 | 4,046 |
Total | 57,811 | 56,153 |
For more information on Amounts due to customers, see Note 12 Amounts due to customers of the consolidated financial statements.
12 Debt certificates
in € millions | 2025 | 2024 |
|---|---|---|
Medium-term notes (MTN) | 8,522 | 8,031 |
Certificates of deposits | 3,187 | 1,093 |
Balance as at 31 December | 11,709 | 9,124 |
For more information on Debt certificates, see Note 13 Debt certificates of the consolidated financial statements.
in € millions | Medium Term Notes | Certificates of Deposit | Total | |||
|---|---|---|---|---|---|---|
2025 | 2024 | 2025 | 2024 | 2025 | 2024 | |
Opening balance | 8,031 | 7,705 | 1,093 | -- | 9,124 | 7,705 |
Issues | 496 | 996 | 16,094 | 14,518 | 16,590 | 15,514 |
Redemptions | -- | -705 | -14,027 | -13,455 | -14,027 | -14,160 |
Revaluations | -6 | -- | -- | -- | -6 | -- |
Amortisation | 10 | 10 | 42 | 24 | 52 | 34 |
Change accrued interest | 3 | 14 | -- | -- | 3 | 14 |
Other adjustments | -12 | 12 | -- | -- | -12 | 12 |
Exchange rate differences | -- | -- | -15 | 6 | -15 | 6 |
Closing balance | 8,522 | 8,031 | 3,187 | 1,093 | 11,709 | 9,124 |
13 Other liabilities
in € millions | 2025 | 2024 |
|---|---|---|
Amounts due to group companies | 469 | 474 |
Deferred tax liabilities | 2 | 3 |
Other taxes and social securities premiums | 20 | 19 |
Accruals | 108 | 103 |
Lease liabilities | 17 | 28 |
Derivatives | 508 | 1,105 |
Other | 114 | 86 |
Total | 1,238 | 1,818 |
For a more detailed explanation to the Lease liabilities, refer to Note 17 Leases in the Notes to the consolidated financial statements.
Other relates mainly to amounts payable to customers and suppliers.
14 Other provisions
in € millions | 2025 | 2024 |
|---|---|---|
Restructuring provision | 69 | 129 |
Employee benefits | 12 | 12 |
Other provisions | 178 | 256 |
Provision for credit losses for off-balance sheet items | 4 | 8 |
Total | 263 | 405 |
For more information on Other provisions, see Note 15 Provisions of the consolidated financial statements.
15 Subordinated debts
in € millions | 2025 | 2024 |
|---|---|---|
Bonds | 494 | 997 |
Total | 494 | 997 |
For more information on Subordinated debts, see Note 14 Subordinated debts of the consolidated financial statements.
16 Equity
The issued share capital is fully paid up and solely comprises ordinary shares. The nominal value of the ordinary shares is € 453.79.
In numbers | Number of shares | Amount of shares in € millions | ||
|---|---|---|---|---|
2025 | 2024 | 2025 | 2024 | |
Authorised share capital | 4,200,040 | 4,200,040 | 1,906 | 1,906 |
Share capital in portfolio | 3,360,032 | 3,360,032 | 1,525 | 1,525 |
Issued share capital as at 31 December | 840,008 | 840,008 | 381 | 381 |
17 Contingent liabilities and commitments
ASN Bank N.V. has provided guarantees as referred to in Book 2, Section 403 of the Dutch Civil Code for Pettelaar Effectenbewaarbedrijf N.V., SNS Global Custody B.V. and ASN Duurzame Deelnemingen N.V.
ASN Bank N.V. has provided a loan commitment to ASN Beleggingsinstellingen B.V. where the latter is a full subsidiary of ASN Duurzame Deelnemingen N.V.
For more information on the other contingent liabilities, see Note 19 Contingent liabilities and commitments of the consolidated financial statements.
18 Maturity of certain assets and liabilities
in € millions | On demand | ≤ 3 months | > 3 months | > 1 year | > 5 years | Total |
|---|---|---|---|---|---|---|
Assets | ||||||
Loans and advances to banks | -- | 4,932 | 2,179 | 160 | 52 | 7,323 |
Loans and advances to customers | -- | 813 | 1,633 | 5,326 | 51,400 | 59,172 |
Liabilities | ||||||
Amounts due to banks | -- | 46 | 35 | 54 | 982 | 1,117 |
Amounts due to customers | 43,519 | 11,452 | 167 | 765 | 1,908 | 57,811 |
Debt certificates | -- | 3,289 | 1,429 | 2,576 | 4,415 | 11,709 |
Subordinated debts | -- | -- | -- | -- | 494 | 494 |
in € millions | On demand | ≤ 3 months | > 3 months | > 1 year | > 5 years | Total |
|---|---|---|---|---|---|---|
Assets | ||||||
Loans and advances to banks | -- | 3,755 | 2,263 | 517 | 175 | 6,710 |
Loans and advances to customers | -- | 771 | 1,024 | 4,704 | 47,995 | 54,494 |
Liabilities | ||||||
Amounts due to banks | -- | 393 | 136 | 239 | 633 | 1,401 |
Amounts due to customers | 39,930 | 13,527 | 207 | 729 | 1,760 | 56,153 |
Debt certificates | -- | 1,088 | 5 | 4,094 | 3,937 | 9,124 |
Subordinated debts | -- | -- | 499 | -- | 498 | 997 |
19 Related parties
in € millions | Securitisation entities | Other | Total | |||
|---|---|---|---|---|---|---|
2025 | 2024 | 2025 | 2024 | 2025 | 2024 | |
Income received | 5 | 4 | 4 | 4 | 9 | 8 |
Expenses paid | -- | -- | 1 | -- | 1 | -- |
For more information, see Note 23 Related parties of the consolidated financial statements.
The receivables from subsidiaries and the amounts due to subsidiaries are included in Note 9 Other assets and Note 13 Other liabilities.
20 Post balance sheet events
There were no material post balance sheet events that required disclosure or adjustment to the 31 December 2025 financial statements.
21 Net interest income
in € millions | 2025 | 2024 |
|---|---|---|
Interest income debt securities | 175 | 204 |
Interest income balances at central banks | 40 | 122 |
Interest income residential mortgages | 1,635 | 1,572 |
Interest income other | 347 | 478 |
Interest expense banking activities | -1,075 | -1,136 |
Net interest income | 1,122 | 1,240 |
A change in accounting policy was processed regarding the presentation of interest income and interest expense for economic hedges which was reclassified from Results on financial instruments to Net interest income. For more information, see Change in accounting policy in the Notes to the Consolidated financial statements.
22 Investment income (losses) and result subsidiaries
in € millions | 2025 | 2024 |
|---|---|---|
Investment income (losses) - equity securities | 3 | 3 |
Investment income (losses) - debt securities | -- | -17 |
Result subsidiaries | 9 | 7 |
Total | 12 | -7 |
23 Net fee and commission income
in € millions | 2025 | 2024 |
|---|---|---|
Fee and commission income | ||
Money transfer and payment charges | 102 | 91 |
Advice and agency activities | 20 | 23 |
Management fees | 11 | 12 |
Insurance agency activities | 20 | 18 |
Other activities | 1 | 1 |
Total fee and commission income | 154 | 145 |
Fee and commission expenses | ||
Money transfer and payment charges | 22 | 20 |
Management fees | 6 | 4 |
Insurance agency activities | 1 | 1 |
Fee franchise | 69 | 71 |
Total fee and commission expenses | 98 | 96 |
Total | 56 | 49 |
For more information on the increase in Fee franchise, see Note 27 Net fee and commission income in the consolidated financial statements.
24 Other results on financial instruments
in € millions | 2025 | 2024 |
|---|---|---|
Ineffectiveness fair value hedge accounting | 11 | 4 |
Non-trading derivatives: economic hedges - interest rate | 1 | -1 |
Non-trading derivatives: economic hedges - currency | 4 | 8 |
Trading results derivatives, investments and other financial instruments | -3 | -3 |
Result on buy back of debt instruments | -1 | -- |
Total | 12 | 8 |
A change in accounting policy was processed regarding the presentation of interest income and interest expense for economic hedges which was reclassified from Results on financial instruments to Net interest income. For more information, see Change in accounting policy in the Notes to the Consolidated financial statements.
25 Staff costs
in € millions | 2025 | 2024 |
|---|---|---|
Salaries | 251 | 270 |
Pension costs | 51 | 46 |
Social security | 46 | 43 |
Other staff costs | 209 | 356 |
Total | 557 | 715 |
The average number of FTEs is 3,251 (2024: 3,526), all staff members are employed in the Netherlands.
26 Other operating expenses
in € millions | 2025 | 2024 |
|---|---|---|
Housing costs | 7 | 17 |
Information technology costs | 105 | 96 |
Marketing and public relations costs | 28 | 20 |
Consultancy costs and audit fees | 87 | 69 |
Regulatory levies | -4 | 11 |
Other costs | 60 | 171 |
Total | 283 | 384 |
For more information on the increase in Other operating expenses, see Note 31 Other operating expenses in the consolidated financial statements.
27 Impairment charges (releases) on financial assets
in € millions | 2025 | 2024 |
|---|---|---|
Investments | -1 | -- |
Loans and advances to banks | -1 | -1 |
Loans and advances to customers | -30 | -50 |
Of which residential mortgages | -38 | -48 |
Of which consumer loans | 1 | -- |
Of which SME loans | -3 | -7 |
Of which other corporate and government loans | 10 | 5 |
Total | -32 | -51 |
28 Taxation
in € millions | 2025 | 2024 |
|---|---|---|
In financial year | 106 | 72 |
Corporate income tax due | 106 | 72 |
Due to temporary differences | -- | -1 |
Deferred tax | -- | -1 |
Total | 106 | 71 |
The effective tax rate over 2025 amounts to 28.3% (2024: 33.0 %).
Profit or loss appropriation
ASN Bank proposes to pay out a dividend in the amount of € 124 million from the net result for the period for 2025, in 2024 the net profit was retained. The profit after dividend payment for the financial year 2025 will be added to the other reserves.
Authorisation of the company annual financial statement
Utrecht, 12 March 2026
Roland Boekhout (Chair)
André Haag
Saskia Hoskens
Isold Heemstra
Gwendolyn van Tunen
Gerard van Olphen (Chair)
Jos van Lange (Vice chair)
Jeanine Helthuis
Petra van Hoeken
Aloys Kregting

Other information
Other information
Provisions regarding profit or loss appropriation
Provisions of the Articles of Association regarding profit or loss appropriation
30.1 The profits as determined through the adoption of the annual accounts shall be at the disposal of the General Meeting. The General Meeting may decide to make a distribution, to the extent that the shareholders' equity exceeds the amount of the paid and called up part of the capital and the reserves that must be maintained by law.
30.2 For the purposes of calculating any distribution, shares held by the Company in its own capital shall not be included.
30.3 For the purposes of calculating the amount to be distributed on each share, only the amount of the mandatory payments towards the nominal value of the shares shall be taken into account.
30.4 If the General Meeting so determines on the proposal of the Management Board, an interim dividend will be distributed, including an interim dividend from reserves, but only with due observance of what is provided in Section 2:105(4) DCC.
30.5 Unless the General Meeting determines otherwise, distributions shall be payable immediately
30.6 A Shareholder's claim under this Article 30 shall lapse after five years.
Independent auditor's report
To: the shareholder and Supervisory Board of ASN Bank N.V.
Report on the audit of the financial statements 2025 included in the annual report
Our opinion
We have audited the accompanying financial statements 2025 of ASN Bank N.V. based in Utrecht, the Netherlands. The financial statements comprise the consolidated financial statements and the company financial statements.
In our opinion:
The consolidated financial statements give a true and fair view of the financial position of ASN Bank N.V. as at 31 December 2025 and of its result and its cash flows for 2025 in accordance with IFRS Accounting Standards as adopted in the European Union (IFRS Accounting Standards) and with Part 9 of Book 2 of the Dutch Civil Code
The company financial statements give a true and fair view of the financial position of ASN Bank N.V. as at 31 December 2025 and of its result for 2025 in accordance with Part 9 of Book 2 of the Dutch Civil Code
The consolidated financial statements comprise:
The consolidated statement of financial position as at 31 December 2025
The following statements for 2025: the consolidated income statement, the consolidated total comprehensive income, the consolidated statement of changes in equity, and the consolidated cashflow statement
The notes comprising material accounting policy information and other explanatory information
The company financial statements comprise:
The company statement of financial position as at 31 December 2025
The company income statement for 2025
The notes comprising a summary of the accounting policies and other explanatory information
Basis for our opinion
We conducted our audit in accordance with Dutch law, including the Dutch Standards on Auditing. Our responsibilities under those standards are further described in the Our responsibilities for the audit of the financial statements section of our report.
We are independent of ASN Bank N.V. (the company) in accordance with the EU Regulation on specific requirements regarding statutory audit of public-interest entities, the Wet toezicht accountantsorganisaties (Wta, Audit firms supervision act), the Verordening inzake de onafhankelijkheid van accountants bij assurance-opdrachten (ViO, Code of Ethics for Professional Accountants, a regulation with respect to independence) and other relevant independence regulations in the Netherlands. Furthermore, we have complied with the Verordening gedrags- en beroepsregels accountants (VGBA, Dutch Code of Ethics for Professional Accountants).
We believe the audit evidence we have obtained is sufficient and appropriate to provide a basis for our opinion.
Information in support of our opinion
We designed our audit procedures in the context of our audit of the financial statements as a whole and in forming our opinion thereon. The following information in support of our opinion and any findings were addressed in this context, and we do not provide a separate opinion or conclusion on these matters.
ASN Bank N.V. is a bank with a focus on mortgages, payments and savings as its most important products for Dutch retail customers. We paid specific attention in our audit to several areas in line with the operations of the company and based on our risk assessment.
We determined materiality and identified and assessed the risks of material misstatement of the financial statements, whether due to fraud or error in order to design audit procedures responsive to those risks and to obtain audit evidence that is sufficient and appropriate to provide a basis for our opinion.
In order to obtain sufficient and appropriate audit evidence to provide an opinion on the consolidated financial statements, we have performed a full-scope audit on the consolidated financial information of ASN Bank N.V. as a whole.
Materiality | € 20 million (2024: € 20 million) |
Benchmark applied | Approximately 0.5% of equity as at 31 December 2025 (2024: 0.5%) |
Explanation | Based on our professional judgment of financial information needs of users of the financial statements, a benchmark of 0.5% of equity is an appropriate quantitative indicator of materiality as it best reflects the financial position of ASN Bank N.V.. We determined materiality consistently with the previous financial year. |
We have also taken into account misstatements and/or possible misstatements that in our opinion are material for the users of the financial statements for qualitative reasons.
We agreed with the Supervisory Board that misstatements in excess of €1 million, which are identified during the audit, would be reported to them, as well as smaller misstatements that in our view must be reported on qualitative grounds.
We ensured that the audit team included the appropriate skills and competences which are needed for the audit of a bank. We included specialists in the areas of IT audit, forensics, income tax and capital ratios. Furthermore, we have made use of our own experts in the areas of provision for expected credit losses (i.e., credit risk modelling, collateral valuation, macro-economic forecasting), valuation of financial instruments, hedge accounting, legal and compliance, employee benefits, and fair value disclosures.
Climate change and the energy transition are high on the public agenda and lead to significant change for many businesses and society.
The Executive Board reported in “Sustainability statements” and the Section Sustainability risk in “Risk, funding & capital” how the company is addressing climate-related and environmental risks also taking into account related regulatory and supervisory ESG risk management guidelines and expectations. Furthermore, we refer to “Sustainability statements” where the Executive Board discloses its assessment and implementation plans in connection to climate-related risks and the effects of energy transition.
As part of our audit of the financial statements, we evaluated the extent to which climate-related risks and the possible effects of the energy transition and ASN Bank N.V.’s climate action plan, are taken into account in estimates and significant assumptions, including those related to the estimation of expected credit losses. Furthermore, we read the report of the Executive Board and considered whether there is any material inconsistency between the non-financial information in “Sustainability statements” and the Section Sustainability risk in “Risk, funding & capital” and the financial statements.
Based on the audit procedures performed, we do not deem climate-related risks to have a material impact on the financial reporting judgments, estimates or significant assumptions as at 31 December 2025.
Although we are not responsible for preventing fraud or non-compliance and we cannot be expected to detect non-compliance with all laws and regulations, it is our responsibility to obtain reasonable assurance that the financial statements, taken as a whole, are free from material misstatement, whether caused by fraud or error. The risk of not detecting a material misstatement resulting from fraud is higher than for one resulting from error, as fraud may involve collusion, forgery, intentional omissions, misrepresentations, or the override of internal control.
We identified and assessed the risks of material misstatements of the financial statements due to fraud. During our audit we obtained an understanding of the company and its environment and the components of the system of internal control, including the risk assessment process and the Executive Board’s process for responding to the risks of fraud and monitoring the system of internal control and how the Supervisory Board exercises oversight, as well as the outcomes. We refer to the Section Non-financial risks in “Risk, funding & capital” for the Executive Board’s (fraud) risk assessment.
We evaluated the design and relevant aspects of the system of internal control and in particular the fraud risk assessment, as well as the code of conduct, whistle blower procedures and incident registration, in close co-operation with our forensic specialists. We evaluated the design and the implementation and, where considered appropriate, tested the operating effectiveness, of internal controls designed to mitigate fraud risks.
As part of our process of identifying fraud risks, we evaluated fraud risk factors with respect to financial reporting fraud, misappropriation of assets and bribery and corruption, in close co-operation with our forensic specialists. We evaluated whether these factors indicate that a risk of material misstatement due to fraud is present.
We incorporated elements of unpredictability in our audit. We also considered the outcome of our other audit procedures and evaluated whether any findings were indicative of fraud or non-compliance.
We addressed the risks related to management override of controls, as this risk is present in all organisations. For these risks we have, among other things, performed procedures to evaluate whether the selection and application of accounting policies by the company, particularly those relating to subjective measurements and complex transactions, as disclosed in note “The use of judgments, estimates and assumptions in the preparation of the financial statements” to the consolidated financial statements, may be indicative to fraudulent financial reporting. We have also used data analysis to identify and address high-risk journal entries and other adjustments made in the financial reporting process. We evaluated the business rationale (or the lack thereof) of significant extraordinary transactions, including those with related parties.
Additionally, as described in our key audit matter on “Estimation of expected credit losses on residential mortgages”, we specifically considered the risk of management override of controls in connection with assumptions on forward-looking information in the determination of the expected credit losses that may represent a risk of material misstatement due to fraud.
When identifying and assessing fraud risks we presumed that there are risks of fraud in revenue recognition. We evaluated that this risk is present in areas that are complex or with higher subjectivity in meeting revenue recognition criteria, more specifically related to prepayment penalties in case of interest averaging on retail mortgages. We designed and performed audit procedures relating to revenue recognition responsive to this presumed fraud risk with support of our own experts.
We considered available information and made enquiries of relevant functions (including risk, compliance, financial crime, legal and internal audit), the Executive Board and the Supervisory Board.
The fraud risks we identified, enquiries and other available information did not lead to specific indications for fraud or suspected fraud potentially materially impacting the view of the financial statements.
We performed appropriate audit procedures regarding compliance with the provisions of those laws and regulations that have a direct effect on the determination of material amounts and disclosures in the financial statements. Furthermore, we assessed factors related to the risks of non-compliance with laws and regulations that could reasonably be expected to have a material effect on the financial statements from our general industry experience, through discussions with the Executive Board, inspection of the systematic integrity risk analysis (SIRA), reading minutes, inspection of risk, compliance and internal audit reports, and performing substantive tests of details of classes of transactions, account balances or disclosures.
We also inspected lawyers’ letters and correspondence with regulatory authorities and remained alert to any indication of (suspected) non-compliance throughout the audit. In case of potential non-compliance with laws and regulations that may have a material effect on the financial statements, we assessed whether the company has an adequate process in place to evaluate the impact of non-compliance for its activities and financial reporting and, where relevant, whether the company implemented remediation plans. Finally, we obtained written representations that all known instances of non-compliance with laws and regulations have been disclosed to us. Specifically with regard to the anti-financial crime remediation activities, we make reference to the key audit matter on “Estimation of other provisions and related disclosures”.
As disclosed in the Section “Basis of preparation” in the notes to the consolidated financial statements, the financial statements have been prepared on a going concern basis. When preparing the financial statements, the Executive Board made a specific assessment of the company’s ability to continue as a going concern and to continue its operations for the foreseeable future.
We discussed and evaluated the specific assessment with the Executive Board exercising professional judgment and maintaining professional skepticism. We considered whether the Executive Board’s going concern assessment, based on our knowledge and understanding obtained through our audit of the financial statements or otherwise, contains all relevant events or conditions that may cast significant doubt on the company’s ability to continue as a going concern and whether the company will continue to comply with prudential requirements. If we conclude that a material uncertainty exists, we are required to draw attention in our auditor’s report to the related disclosures in the financial statements or, if such disclosures are inadequate, to modify our opinion.
Based on our procedures performed, we did not identify material uncertainties about going concern or the Executive Board’s use of the going concern basis of accounting. Our conclusions are based on the audit evidence obtained up to the date of our auditor’s report. However, future events or conditions may cause a company to cease to continue as a going concern.
Key audit matters are those matters that, in our professional judgment, were of most significance in our audit of the financial statements. We have communicated the key audit matters to the Supervisory Board. The key audit matters are not a comprehensive reflection of all matters discussed.
In comparison with previous year, the nature of our key audit matters did not change.
Risk | |
Residential mortgages are measured at amortized cost less a provision for expected credit losses. The provision for credit losses represents the company’s best estimate of expected credit losses. At 31 December 2025, the total gross residential mortgage loan portfolio amounts to €56,5 billion (2024: €52,0 billion) and the provision for credit losses amounts to €53 million (2024: €80 million), as disclosed in note 7 to the consolidated financial statements. In the Section “Credit risk” in “Risk, funding & capital”, credit risk management practices, the provision methodology, and credit risk developments are disclosed. As described in “Provisioning methodology”, the expected credit losses are calculated based on risk staging of loans, using assumptions such as the probability of default, loss given default, macro-economic scenarios and other forward-looking information. ASN Bank N.V. also recognizes management overlays, when credit-related dynamics, such as in the macroeconomic environment, are not sufficiently captured in the credit risk models. The appropriateness of provisions for expected credit losses is a key area of judgment for the Executive Board. The identification of expected credit losses and the determination of the recoverability of residential mortgages are inherently uncertain. The use of alternative modelling techniques and assumptions could produce significantly different estimates of provisions for expected credit losses. As part of our risk assessment, we considered the potential risk of management override of controls and identified a significant risk with regard to collateral valuation as important factor for loss given default and thus the expected credit losses. Given the relative size of the residential mortgages of ASN Bank N.V. and the complexity of accounting requirements with respect to provisions for expected credit losses together with the subjectivity involved in the underlying judgments made, we considered this to be a key audit matter. | |
Our audit approach | |
Our audit procedures included, amongst others, evaluating the appropriateness of ASN Bank N.V.’s accounting policies related to expected credit losses in accordance with IFRS 9 “Financial Instruments” and whether the accounting policies have been applied consistently. We have obtained an understanding of the loan loss provisioning process, evaluated the design and the implementation and, where considered appropriate, tested operating effectiveness of controls across the processes relevant to the expected credit loss calculations, and performed substantive procedures. Our audit procedures addressed the allocation of loans to stages, model governance, data accuracy and completeness, arrears management, macro-economic scenarios, management overlays, journal entry testing and disclosures. | |
Our substantive procedures included testing the data used in the calculations and disclosures, and reconciliation of this data to source systems. Furthermore, we reperformed certain impairment calculations to assess mathematical accuracy. In response to the identified fraud risk related to management override of controls, we among others performed reconciliation procedures to the approved management overlays, macro-economic scenarios and other forward-looking information, and assessed material manual adjustments with underlying documentation. With the support of our modelling specialists, we assessed the appropriateness of the provisioning models used by ASN Bank N.V.. We performed an overall assessment of the provision levels by stage to determine if they were reasonable considering the risk profile of the residential mortgage portfolio, arrears management and credit risk management practices and the macro-economic environment. We challenged the criteria used to allocate loans to stages in accordance with IFRS 9 and tested loans for appropriate staging. With the assistance of our real estate valuation specialists, we tested the collateral values as this is an important factor for determining expected credit losses, in particular for stage 3 loans. We performed an independent valuation test for a sample of collateral. With the support of our macro-economic specialists, we assessed the base case and alternative economic scenarios including the impact of current macro-economic uncertainties and the recognition and documentation of management overlays. This included challenging probability weights and the macro-economic forecasts across scenarios, as well as assessing the sensitivity of changes in the assumptions in the calculations. We assessed the completeness and tested the appropriateness and associated considerations of management overlays. In this regard we also considered findings from regulatory inspections, industry developments, geopolitical developments and portfolio characteristics. Finally, we evaluated the completeness and accuracy of the disclosures relating to the provision for credit losses to evaluate compliance with disclosure requirements in accordance with IFRS Accounting Standards. In particular we evaluated that the disclosures adequately convey the degree of estimation uncertainty and the range of possible outcomes under the different macro-economic scenarios. | |
Key observations | |
Based on our procedures performed, we consider the provision for expected credit losses on residential mortgages to be reasonable and in compliance with IFRS Accounting Standards. |
Risk | |
In accordance with IAS 37 “Provisions, contingent liabilities and contingent assets”, ASN Bank N.V. provides for present obligations related to, among others, restructuring, legal claims and compliance matters when an outflow of resources is probable and can be reliably estimated. When an outflow of resources is possible but not probable or the amount of the obligation cannot be reliably estimated, a contingent liability is disclosed. As disclosed in note 15 to the consolidated financial statements, ASN Bank N.V. recognized at 31 December 2025, a restructuring provision of €69 million (2024: €129 million) and other (non-credit) provisions of €178 million (2024: €256 million). Contingent liabilities and legal proceedings are disclosed in note 19 of the consolidated financial statements. The estimation process in relation to provisions and contingent liabilities is inherently complex. This specifically relates to the determination of whether outflows of resources are probable and can be reliably estimated and the appropriateness of assumptions and judgments used in the estimation of the provisions and disclosure of contingent liabilities. Therefore, we considered the estimation of other provisions and related disclosures to be a key audit matter. | |
Our audit approach | |
We evaluated ASN Bank N.V.’s accounting policies related to provisions and contingent liabilities in accordance with IAS 37 and whether assumptions and the methods for making estimates are appropriate and have been applied consistently. We obtained an understanding of the entity-level controls and the legal and regulatory framework of the company. Furthermore, we evaluated the design and implementation of controls by ASN Bank N.V. to recognize and measure provisions, including assessing the completeness and accuracy of the method, data and assumptions used to measure provisions. For material provisions, such as the restructuring provision and anti-financial crime remediation provision, we challenged the provisioning method and tested the underlying data and assumptions used. For obligations that were settled, we verified the actual outflows and considered residual risks. In respect of legal settlements, we examined settlement agreements to evaluate the Executive Board’s assessment of the expected outflows. Also, we assessed to what extent judgments and decisions made by management indicated a possible bias in determining other provisions. For the restructuring provision, including employee redundancy and optimization of the distribution network, we evaluated whether the IAS 37 criteria to record provisions are met as at 31 December 2025. We performed audit procedures to assess the accuracy and completeness of the provision by testing the underlying data and assumptions used related to staff redundancy payments and compensation to franchisees. On a regular basis, we inquired with the financial crime, risk, compliance, legal and internal audit departments of ASN Bank N.V. to understand existing and potential new obligations and regulatory matters. We examined the relevant internal reports as well as regulatory correspondence to understand developments, and we performed procedures to assess the impact on the financial statements and the adequacy of disclosures. We obtained legal letters from external counsel and, where appropriate, we involved our legal and compliance specialists. | |
Furthermore, we evaluated whether the disclosures provided on the provisions regarding restructuring, legal claims and compliance matters and contingent liabilities are in accordance with IAS 37. | |
Key observations | |
Based on our procedures performed we consider the other provisions to be reasonable and in compliance with IAS 37. The disclosures on these provisions are considered adequate and appropriate and meet the disclosure requirements of IAS 37. |
Risk | |
The activities and financial reporting of ASN Bank N.V. are highly dependent on the reliability and continuity of the IT environment. Effective general IT controls with respect to change management, logical access, infrastructure and operations, support the integrity and continuity of the IT systems as well as the operating effectiveness of automated controls. The dependency on the IT environment could lead to undetected misstatements in financial reporting. There is a risk that the general IT control measures may not always operate as intended. Therefore, we identified the reliability and continuity of the IT environment as a key audit matter. | |
Our audit approach | |
IT audit specialists are an integral part of the engagement team and assess the reliability and continuity of the IT environment to the extent necessary for the scope of our audit of the financial statements. In this context, we evaluated the design of the IT processes and tested the operating effectiveness of general IT controls as well as well as application controls over data processing, data feeds and interfaces relevant for financial reporting. Furthermore, we obtained an understanding of the cybersecurity risks and related reporting. As ASN Bank N.V. has outsourced part of their IT organization, we evaluated the outsourced IT processes and IT general controls of the relevant service providers in the context of the financial statements audit of ASN Bank N.V.. We inspected the reports on the design and operating effectiveness of controls from these service providers, evaluated testing exceptions and how complementary user entity control considerations have been addressed. Following certain observations related to the demonstrability of controls related to among others logical access, change management and infrastructure management, we performed additional substantive procedures in the context of our audit of the financial statements. | |
Key observations | |
Our testing of the general IT controls and the substantive tests performed, provided sufficient evidence to enable us to rely on the adequate and continued operation of the IT systems relevant for our audit of the financial statements. |
Report on other information included in the annual report
The annual report contains other information in addition to the financial statements and our auditor’s report thereon.
Based on the following procedures performed, we conclude that the other information:
Is consistent with the financial statements and does not contain material misstatements
Contains the information as required by Part 9 of Book 2 of the Dutch Civil Code for the management report (excluding the sustainability statement) and the other information as required by Part 9 of Book 2 of the Dutch Civil Code
We have read the other information. Based on our knowledge and understanding obtained through our audit of the financial statements or otherwise, we have considered whether the other information contains material misstatements. By performing these procedures, we comply with the requirements of Part 9 of Book 2 of the Dutch Civil Code and the Dutch Standard 720. The scope of the procedures performed is substantially less than the scope of those performed in our audit of the financial statements.
The Executive Board is responsible for the preparation of the other information, including the management report in accordance with Part 9 of Book 2 of the Dutch Civil Code and other information required by Part 9 of Book 2 of the Dutch Civil Code.
Description of responsibilities regarding the financial statements
Responsibilities of the Executive Board and the Supervisory Board for the financial statements
The Executive Board is responsible for the preparation and fair presentation of the financial statements in accordance with IFRS Accounting Standards and Part 9 of Book 2 of the Dutch Civil Code.
Furthermore, the Executive Board is responsible for such internal control as the Executive Board determines is necessary to enable the preparation of the financial statements that are free from material misstatement, whether due to fraud or error.
As part of the preparation of the financial statements, the Executive Board is responsible for assessing the company’s ability to continue as a going concern. Based on the financial reporting framework mentioned, the Executive Board should prepare the financial statements using the going concern basis of accounting unless the Executive Board either intends to liquidate the company or to cease operations, or has no realistic alternative but to do so. The Executive Board should disclose events and circumstances that may cast significant doubt on the company’s ability to continue as a going concern in the financial statements.
The Supervisory Board is responsible for overseeing the company’s financial reporting process.
Our responsibilities for the audit of the financial statements
Our objective is to plan and perform the audit engagement in a manner that allows us to obtain sufficient and appropriate audit evidence for our opinion.
Our audit has been performed with a high, but not absolute, level of assurance, which means we may not detect all material misstatements, whether due to fraud or error during our audit.
Misstatements can arise from fraud or error and are considered material if, individually or in the aggregate, they could reasonably be expected to influence the economic decisions of users taken on the basis of these financial statements. The materiality affects the nature, timing and extent of our audit procedures and the evaluation of the effect of identified misstatements on our opinion.
We have exercised professional judgment and have maintained professional skepticism throughout the audit, in accordance with Dutch Standards on Auditing, ethical requirements and independence requirements. The Information in support of our opinion section above includes an informative summary of our responsibilities and the work performed as the basis for our opinion.
Our audit further included among others:
Performing audit procedures responsive to the risks identified, and obtaining audit evidence that is sufficient and appropriate to provide a basis for our opinion
Obtaining an understanding of internal control relevant to the audit in order to design audit procedures that are appropriate in the circumstances, but not for the purpose of expressing an opinion on the effectiveness of the company’s internal control
Evaluating the appropriateness of accounting policies used and the reasonableness of accounting estimates and related disclosures made by the Executive Board
Evaluating the overall presentation, structure and content of the financial statements, including the disclosures
Evaluating whether the financial statements represent the underlying transactions and events in a manner that achieves fair presentation
We communicate with the Supervisory Board regarding, among other matters, the planned scope and timing of the audit and significant audit findings, including any significant findings in internal control that we identify during our audit.
In this respect we also submit an additional report to the audit committee of the Supervisory Board in accordance with Article 11 of the EU Regulation on specific requirements regarding statutory audit of public-interest entities. The information included in this additional report is consistent with our audit opinion in this auditor’s report.
We provide the Audit Committee of the Supervisory Board with a statement that we have complied with relevant ethical requirements regarding independence, and to communicate with them all relationships and other matters that may reasonably be thought to bear on our independence, and where applicable, related safeguards.
From the matters communicated with the Supervisory Board, we determine the key audit matters: those matters that were of most significance in the audit of the financial statements. We describe these matters in our auditor’s report unless law or regulation precludes public disclosure about the matter or when, in extremely rare circumstances, not communicating the matter is in the public interest.
Report on other legal and regulatory requirements and ESEF
We were engaged by the Supervisory Board as auditor of ASN Bank N.V. on 12 October 2015, as of the audit for the year 2016 and have operated as statutory auditor ever since that date.
We have not provided prohibited non-audit services as referred to in Article 5(1) of the EU Regulation on specific requirements regarding statutory audit of public-interest entities.
ASN Bank N.V. has prepared the annual report in ESEF. The requirements for this are set out in the Delegated Regulation (EU) 2019/815 with regard to regulatory technical standards on the specification of a single electronic reporting format (hereinafter: the RTS on ESEF).
In our opinion, the annual report, prepared in the XHTML format, including the (partially) marked-up consolidated financial statements as included in the reporting package by ASN Bank N.V., complies in all material respects with the RTS on ESEF.
The Executive Board is responsible for preparing the annual report, including the financial statements, in accordance with the RTS on ESEF, whereby the Executive Board combines the various components into a single reporting package.
Our responsibility is to obtain reasonable assurance for our opinion whether the annual report in this reporting package complies with the RTS on ESEF.
We performed our examination in accordance with Dutch law, including Dutch Standard 3950N “Assurance-opdrachten inzake het voldoen aan de criteria voor het opstellen van een digitaal verantwoordingsdocument” (assurance engagements relating to compliance with criteria for digital reporting). Our examination included amongst others:
Obtaining an understanding of the company’s financial reporting process, including the preparation of the reporting package
Identifying and assessing the risks that the annual report does not comply in all material respects with the RTS on ESEF and designing and performing further assurance procedures responsive to those risks to provide a basis for our opinion, including:
- Obtaining the reporting package and performing validations to determine whether the reporting package containing the Inline XBRL instance document and the XBRL extension taxonomy files has been prepared in accordance with the technical specifications as included in the RTS on ESEF
- Examining the information related to the consolidated financial statements in the reporting package to determine whether all required mark-ups have been applied and whether these are in accordance with the RTS on ESEF.
Amsterdam, 12 March 2026
EY Accountants B.V.
signed by P.J.A.J. Nijssen
Limited assurance report of the independent auditor on the sustainability statement
To: the shareholder and supervisory board of ASN Bank N.V.
Our conclusions
We have performed a limited assurance engagement on the consolidated sustainability statement for 2025 of ASN Bank N.V. based in Utrecht (hereinafter: the company) in the Section ”Sustainability statements” of the accompanying management report including the information incorporated in the sustainability statement by reference (hereinafter: the sustainability statement).
Based on our procedures performed and the evidence obtained, nothing has come to our attention that causes us to believe that the sustainability statement is not, in all material respects:
prepared in accordance with the European Sustainability Reporting Standards (ESRS) as adopted by the European Commission and compliant with the double materiality assessment process carried out by the company to identify the information reported pursuant to the ESRS; and
compliant with the reporting requirements provided for in Article 8 of Regulation (EU) 2020/852 (Taxonomy Regulation).
Our conclusion has been formed on the basis of the matters outlined in this limited assurance report.
Basis for our conclusions
We have performed our limited assurance engagement on the sustainability statement in accordance with Dutch law, including Dutch Standard 3810N, “Assurance-opdrachten inzake duurzaamheidsverslaggeving” (Assurance engagements relating to sustainability reporting), which is a specified Dutch standard that is based on the International Standard on Assurance Engagements (ISAE) 3000 (Revised), “Assurance engagements other than audits or reviews of historical financial information”.
Our assurance engagement was aimed to obtain a limited level of assurance that the sustainability statement is free from material misstatements. The procedures vary in nature and timing from, and are less in extent, than for a reasonable assurance engagement. Consequently, the level of assurance obtained in a limited assurance engagement is substantially lower than the assurance that would have been obtained had a reasonable assurance engagement been performed.
Our responsibilities in this regard are further described in the Section ‘Our responsibilities for the limited assurance engagement on the sustainability statement’ of our report.
We are independent of ASN Bank N.V. in accordance with the Verordening inzake de onafhankelijkheid van accountants bij assurance-opdrachten (ViO, Code of Ethics for Professional Accountants, a regulation with respect to independence) and other relevant independence regulations in the Netherlands. This includes that we do not perform any activities that could result in a conflict of interest with our independent assurance engagement and we are not involved in the preparation of the sustainability statement, as doing so may compromise our independence. Furthermore, we have complied with the Verordening gedrags- en beroepsregels accountants (VGBA, Dutch Code of Ethics for Professional Accountants). The ViO and VGBA are at least as demanding as the International code of ethics for professional accountants (including International independence standards) of the International Ethics Standards Board for Accountants (the IESBA Code) as relevant to limited assurance engagements on sustainability statements of public interest entities in the European Union.
We believe that the assurance evidence we have obtained is sufficient and appropriate to provide a basis for our conclusion.
Inherent limitations associated with measurement or evaluation of sustainability information
Section “General information” paragraph “Basis for preparation” in the sustainability statement identifies the quantitative metrics that are subject to a high level of measurement uncertainty and discloses information about the sources of measurement uncertainty and the assumptions, approximations and judgements the company has made in measuring these in compliance with the ESRS. In the Section "Gross scope 1, 2, 3 and total GHG emissions", the significant uncertainty leading to the exclusion of Assets under Management from the measurement of Scope 3 GHG emissions is described.
The company provides additional entity-specific sustainability information in the paragraphs “Climate-neutral balance”, “Anti-financial crime”, “Employee engagement”, “Customer-weighted average Net Promoter Score” and “Active multi-customers”. The comparability of entity-specific sustainability information between entities and over time may be affected by the absence of a uniform practice or availability of external information sources to measure or evaluate this information that can support comparability. This allows for the application of different, but acceptable, measurement techniques.
The sustainability statement may not include every impact, risk and opportunity or additional entity-specific disclosure that each individual stakeholder (group) may consider important in its own particular assessment.
In reporting forward-looking information in accordance with the ESRS, the executive board describes the underlying assumptions and methods of producing the information, as well as other factors that provide evidence that it reflects the actual plans or decisions made by the company (actions). Forward-looking information relates to events and actions that have not yet occurred and may never occur. The actual outcome is likely to be different since anticipated events frequently do not occur as expected.
Responsibilities of the executive board and the supervisory board for the sustainability statement
The executive board is responsible for the preparation of the sustainability statement in accordance with the ESRS, including the double materiality assessment process carried out by the company as the basis for the sustainability statement and disclosure of material impacts, risks and opportunities in accordance with the ESRS. As part of the preparation of the sustainability statement, the executive board is responsible for compliance with the reporting requirements provided for in Article 8 of Regulation (EU) 2020/852 (Taxonomy Regulation).
The executive board is also responsible for selecting and applying additional entity-specific disclosures to enable users to understand the company’s sustainability-related impacts, risks or opportunities and for determining that these additional entity-specific disclosures are suitable in the circumstances and in accordance with the ESRS.
Furthermore, the executive board is responsible for such internal control as it determines is necessary to enable the preparation of the sustainability statement that is free from material misstatement, whether due to fraud or error.
The supervisory board is responsible for overseeing the sustainability reporting process including the double materiality assessment process carried out by the company.
Our responsibilities for the limited assurance engagement on the sustainability statement
Our responsibility is to plan and perform the limited assurance engagement in a manner that allows us to obtain sufficient and appropriate assurance evidence for our conclusion.
We apply the applicable quality management requirements pursuant to the Nadere voorschriften kwaliteitsmanagement (NVKM, regulations for quality management) and the International Standard on Quality Management (ISQM) 1, and accordingly maintain a comprehensive system of quality management including documented policies and procedures regarding compliance with ethical requirements, professional standards and other relevant legal and regulatory requirements.
Our limited assurance engagement included amongst others:
Performing inquiries and an analysis of the external environment and obtaining an understanding of relevant sustainability themes and issues, the characteristics of the company, its activities and the value chain and its key intangible resources in order to assess the double materiality assessment process carried out by the company as the basis for the sustainability statement and disclosure of all material sustainability-related impacts, risks and opportunities in accordance with the ESRS
Obtaining through inquiries a general understanding of the internal control environment, the company’s processes for gathering and reporting entity-related and value chain information, the information systems and the company’s risk assessment process relevant to the preparation of the sustainability statement and for identifying the company’s activities, determining eligible and aligned economic activities and prepare the disclosures provided for in Article 8 of Regulation (EU) 2020/852 (Taxonomy Regulation), without obtaining assurance information about the implementation or testing the operating effectiveness of controls
Assessing the double materiality assessment process carried out by the company and identifying and assessing areas of the sustainability statement, including the disclosures provided for in Article 8 of Regulation (EU) 2020/852 (Taxonomy Regulation), where misleading or unbalanced information or material misstatements, whether due to fraud or error, are likely to arise (‘selected disclosures’). Designing and performing further assurance procedures aimed at assessing that the sustainability statement is free from material misstatements responsive to this risk analysis
Considering whether the description of the double materiality assessment process in the sustainability statement made by the executive board appears consistent with the process carried out by the company
Performing analytical review procedures on quantitative information in the sustainability statement, including consideration of data and trends
Assessing whether the company’s methods for developing estimates are appropriate and have been consistently applied for selected disclosures. We considered data and trends, however our procedures did not include testing the data on which the estimates are based or separately developing our own estimates against which to evaluate the executive board’s estimates
Analyzing, on a limited sample basis, relevant internal and external documentation available to the company (including publicly available information or information from actors throughout its value chain) for selected disclosures
Reading the other information in the annual report to identify material inconsistencies, if any, with the sustainability statement
Considering whether the disclosures provided to address the reporting requirements provided for in Article 8 of Regulation (EU) 2020/852 (Taxonomy Regulation) for each of the environmental objectives, reconcile with the underlying records of the company and are consistent or coherent with the sustainability statement, appear reasonable, in particular whether the eligible economic activities meet the cumulative conditions to qualify as aligned and whether the technical screening criteria are met, and whether the key performance indicators disclosures have been defined and calculated in accordance with the Taxonomy delegated acts, and comply with the reporting requirements provided for in Article 8 of Regulation (EU) 2020/852 (Taxonomy Regulation), including the format in which the activities are presented
Considering the overall presentation, structure and fundamental qualitative characteristics of information (relevance and faithful representation: complete, neutral and accurate) reported in the sustainability statement, including the reporting requirements provided for in Article 8 of Regulation (EU) 2020/852 (Taxonomy Regulation)
Considering, based on our limited assurance procedures and evaluation of the evidence obtained, whether the sustainability statement as a whole, is free from material misstatements and prepared in accordance with the ESRS.
We communicate with the supervisory board regarding, among other matters, the planned scope and timing of the assurance engagement and significant findings that we identify during our assurance engagement.
Amsterdam, 12 March 2026
EY Accountants B.V.
signed by J. Niewold
Additional information
Definitions of strategic KPIs
Strategic KPI | Definition |
|---|---|
Customer-weighted average net promoter score (NPS) | The customer-weighted average Net Promoter Score (NPS) is measured among retail customers of ASN Bank's brands and expresses retail customers' satisfaction rating (in terms of probability of recommendation). A positive NPS requires the percentage of promoters to be higher than the percentage of detractors. Whether a customer is a ‘promoter’ (9-10), ‘passively satisfied’ (7-8) or a ‘detractor’ (0-6) is measured on a 0 to 10 scale. The NPS is calculated by subtracting the percentage of detractors from the percentage of promoters. The score may range from -100% to +100%. The higher the score, the satisfied the customer is on average. The NPS target setting is defined by realising a higher NPS than the three major systemic Dutch banks. |
Active multi-customers | An active multi-customer is either a retail or SME customer with a current account and at least one product from another product group, who has made more than ten customer-initiated transactions per month on his or her current account for three months in a row. |
Primary customers | A compliant customer in the role of primary and/or joint account holder, who receives at least € 800 in monthly funding across their combined payment accounts over the past 3 months (minimum € 10 for youth accounts). Funding refers to all positive credits excluding interest credits and internal transfers between accounts within the brand. |
Employee engagement | Employee engagement is measured on a yearly basis via our Employee Engagement Survey. As of 2025, Employee engagement is measured using a new set of questions, resulting in a 1-10 score, which provides an overview of the average employee engagement. |
Climate-neutral balance sheet | The climate-neutral balance sheet includes all relevant balance sheet items of ASN Bank. We consider our balance sheet climate-neutral when we avoid or remove as much CO2-equivalent (CO2e) emissions as we emit. When we accomplish that we report a 100% climate-neutral balance sheet. |
Net zero | Net zero entails that we have to reduce our emissions from our own operations and financing activities by 90-95% and neutralise the residual emissions. The net zero KPI covers all relevant scope 1, 2 and 3 emissions within our organisational boundaries (own operations, upstream and downstream activities, but excludes our subsidiaries) and does not include greenhouse gas removals. |
Return on Equity (RoE) | Annualised net result for the period, excluding interest expenses related to AT1 capital securities, as a percentage of the average month-end total equity, excluding AT1 capital securities, for the reporting period. For more information, please refer to the Section Reconciliation of alternative performance measures in this report. |
Methodology climate-neutral balance sheet
The GHG Protocol ‘Corporate Value Chain Standard’ offers guidance to identify and report on emissions from relevant loans. These include emissions from loans and investments reported under scope 3, category 15: Investments, which is the banks’ most material category to take into account. We report on our GHG emissions in our annual reports in conjunction with our full-year financial results, as well as in our interim financial results.
Emissions from all relevant balance sheet items of ASN Bank are included. Cash and balances at central banks do not lead to changes in the real economy because they are temporary balances and are therefore left out of scope. Derivatives are also out of scope to avoid double counting. Tax assets, and ‘other assets’ do not cause GHG emissions and are therefore set at zero emissions. Tangible and intangible assets are already taken into account in the emission calculations of the business operations. Consumer loans are not yet incorporated in the calculation as the amount of loans is negligible. The rest of the accounting balance sheet is taken into account. The CO2e emission calculations are performed in accordance with the GHG Protocol's operational control approach. In our GHG accounting and reporting, we follow the principles of relevance, completeness, consistency, transparency and accuracy. Furthermore, financed emissions are always accounted for with the prudence principle in mind.
All seven greenhouse gases under the Kyoto protocol are taken into account and expressed in CO2 equivalents using the 100-year time horizon global warming potentials determined by the Intergovernmental Panel on Climate Change (IPCC). We disclose the financed scope 1 and 2 emissions of all our relevant loans and investments, and scope 3 when relevant. Avoided emissions and carbon removals are calculated and reported separately from caused emissions. For the mortgage portfolio, we also report on the energy efficiency rating distribution based on the latest available registered energy efficiency ratings (Rijksdienst Voor Ondernemend Nederland, RVO).
In 2022 PCAF published the global GHG Accounting and Reporting Standard. We apply this version of the methodology but deviate on sovereign bonds and residential mortgages. On residential mortgages we apply a more strict approach and attribute full emissions to our assets instead of an attribution based on Loan-to-Value at origination. On sovereign bonds we still apply a calculation methodology developed within PCAF Netherlands instead of the methodology.
For new loans and green bonds the most recent emissions data is used. Emission factors and data sources used for the calculations are updated annually in the fourth quarter to ensure we use recent data in our calculations. Our Sustainability team collects emission data and financial data from investees and prepares financed emissions calculations on a monthly basis.
For each of the asset classes, we apply the corresponding data quality scores of the PCAF methodology. The weighted average data quality score for all assets was calculated at 2.8 (1 = highest data quality; 5 = lowest data quality). We continually strive to increase the data quality of the data in our calculations, as it increases the accuracy of our calculations. In 2024, we updated the anonymised energy consumption data of the customers in our mortgage portfolio. In order to do so, we clustered the mortgage portfolio of our four brands, definitive or preliminary energy efficiency rating, and the EPC score (A++++ to G). The grid operators linked gas- and electricity consumption to the portfolio and returned the results aggregated on cluster level. As such, characteristics like the presence of a preliminary energy efficiency rating are only used to cluster and not directly for carbon accounting purposes.
For the asset class-specific considerations, description of data sources used in our calculations and the data quality score (DQS), see the table below.
Asset class | Chapter in PCAF global GHG standard | Considerations on attribution | Data sources used in calculations | PCAF DQS |
|---|---|---|---|---|
Unlisted Equity | 5.2. Business loans and unlisted equity | Attribution based on book value | Annual and sustainability reports of counterparties. When unavailable, we apply emission factors based on sector averages. | 2.6 |
Sovereign bonds | 5.7 Sovereign debt | Attribution based on outstanding nominal amount | Emissions are calculated based on the PCAF web-based emission factors database for sovereign bonds. We use consumption based emissions including LULUCF1. | 4.9 |
Corporate bonds | 5.1. Listed equity and Corporate bonds | Attribution based on outstanding nominal amount | Reported emissions derived from annual or sustainability reports. When unavailable, we use sector averages emission factors. In the case of earmarked bonds, for example in the case of green bonds, reported emissions or carbon removals are used. | 4.4 |
Private mortgages | 5.5. Mortgages | Attribution based on market value. 100% of emissions are attributed instead of a Loan to Value at origination approach | Emissions are calculated based on standardised annual gas- and electricity consumption data as per reference date 1-1-2024. This anonymised data is retrieved from Partners in Energie and is applicable to our entire residential mortgage portfolio. The gas- and electricity use is converted to CO2-equivalents using the Tank-to-Wheel value for natural gas from co2emissiefactoren.nl (updated in January 2024), and the emission factor for electricity in 2022, as calculated by the Dutch statistics agency (CBS) using the integral method. | 3.2 |
Business mortgages | 5.5. Mortgages | Attribution based on market value | Emissions are calculated based on the PCAF web-based emission factors database with Dutch emission factors per sector based on asset value (db.carbonaccountingfinancials.com). | 5.0 |
Business loans | 5.2. Business loans and unlisted equity | Attribution based on book value | Klimaatmonitor Waterschappen (2023), Regionale klimaatmonitor Rijksoverheid (2023), AEDES benchmark (2022), annual and sustainability reports of counterparties. When data was unavailable, we apply the PCAF web-based emission factor database with the Dutch emission factors per sector based on asset value (db.carbonaccountingfinancials.com). | 4.4 |
Project finance | 5.3. Project finance | Attribution based on book value | Ex-ante estimates of emissions and avoided emissions based on P90 energy generation values from due diligence reports. In some cases, we use actual annual energy production data. | 2.9 |
- Land Use, Land-use Change and Forestry
Principles for Responsible Banking
Principle 1: Alignment | Principle 2: Impact & Target Setting | Principle 3: Clients & Customers |
Content | Content | Content |
ASN Bank is committed to a clearly defined mission: to foster a sustainable and fair future for everyone. Our new strategy 'Simplify and Grow' is based on three main priorities: grow our business, increase sustainable and societal impact, and simplify the way we operate. Sustainability is firmly integrated in the second priority and a vital aspect of our strategy. This strategy is aligned with the UN Sustainable Development Goals (SDGs) and the Paris Agreement. | ASN Bank is a retail bank that operates in the Netherlands, with a focus on consumer banking. Identified impacts are assessed at country level rather than local level, as we consider the local areas too small to divide into significant regions compared to the average size of other countries. We operate in the Dutch financial services sector, serving all types of customers, from low to high income individuals, of all genders, cultures and ages. In 2023, ASN Bank chose to utilise its Double Materiality Assessment (DMA) as an alternative to the UNEP FI Impact Analysis. ASN Bank's DMA gives insight into its core business and major activities. Consequently, our main operations are: mortgages, payments and savings as our main business activities in the consumer banking area. ASN Bank’s DMA effectively aligns with the PRB assessment requirements, as the DMA adheres to the ESRS standards. We conduct a comprehensive materiality assessment every other year. The 2025 DMA confirmed our key impact area of Climate Change, where we actively set, implement and monitor impacts and targets on a monthly basis. As described in our Annual Report 2024, the Transformation programme was launched in 2025. The programme focuses on improving our organisational structure by simplifying our commercial distribution network and streamlining business operations to develop a healthier and more resilient futureproof bank. In this context, we moved from four retail brands towards one strong brand, namely: ASN Bank. Our new strategy, launched in November 2025, builds on this simplification by focusing on organisational efficiency and market share growth. Sustainability remains a core pillar of our strategic approach, supported by our sustainability KPIs. | ASN Bank is the fourth-largest retail bank operating in the Dutch market, with over 3 million customers. We aim to meet the financial needs of our customers in a people-oriented, efficient and sustainable manner. We strive to build strong customer relationships as we work toward our mission of fostering a sustainable and fair future for everyone. In our 2025 DMA, we assessed consumers and end-users as a material topic. We believe we have a positive actual impact on our consumers through building strong relationships and offering accessible products and services both online and through our branches. At the same time, we see a material opportunity to increase our customer base through cross-selling products, improving customer retention, and attracting new customers, particularly primary customers. We constantly engage with our customers, both online and offline, to receive feedback and improve our customer relationships. Our customer base consists of retail customers, SMEs and (semi-) public customers. |
Links & references | Links & references | Links & references |
For more details on our business model, see Our strategy For more details on our strategy alignment and our priorities as a responsible bank, see Our strategic objectives, Sustainability governance and policies and Transition plan for climate change mitigation. | For more details on our impact analysis, see How we create value and Double materiality assessment outcome. For more details on target setting, implementation and monitoring, see Our strategy, Our stakeholders, Credit risk, Sustainability governance and policies, Environmental information and Social information. For information on the transformation and future options, see Our strategy . | For more details on customer engagement, see Customers & end-users and Our stakeholders. For more details on our other significant impact areas and business opportunities, see Sustainability governance and policies, Environmental information and Customers & end-users. |
Principle 4: Stakeholders | Principle 5: Governance & Culture | Principle 6: Transparency & Accountability |
Content | Content | Content |
We engage with different stakeholders, including customers, advisers, collaboration partners (such as Oranjefonds and the Dutch Debt Support Programme (Nederlandse schuldhulproute), installation companies, network organisations and society as a whole. Our CO2e. emissions are largely caused by our mortgage portfolio. To achieve a net zero balance sheet, it is important to reduce those emissions. As part of our social profile, we finance homes with the entire range of energy efficiency ratings (A-G), allowing homeowners with a low energy efficiency rating to implement measures to make their home more sustainable. However, the influence we can exert on our customers to invest in reducing the climate impact of their property is limited. Despite our lobbying and engagement efforts to try to increase our influence to achieve our objective, external factors - such as laws, regulations and high energy prices - have a great influence. | The ExBo is the highest governing body for sustainability. The Executive Board ultimately approves the strategic direction and targets, oversees our performance on material sustainability impacts, risks and opportunities (IROs), as well as policies, actions and targets, and approves the DMA results annually. The ExBo is presented with a progress update annually across material IROs and strategic priorities and targets to further integrate the developments into its execution and oversight of the overall strategy. ASN Bank has no variable remuneration scheme. Nevertheless, every year the Supervisory Board sets performance objectives for the ExBo, including performance objectives for our impact on society. The ESG Impact Committee (ESG IC) is a risk committee, chaired by the Chief Risk Officer. The ESG IC steers and monitors the implementation of ASN Bank's ESG strategy (including approval of ASN Bank's sustainability policies (inside-out) and monitors compliance with the ESG-aspects (sustainability risk) of the Risk Framework and regulations (outside-in). Furthermore, it steers and monitors the balance between the two. | Please see the 2025 Sustainability and Financial statements Audit reports included in the Annual Report. Further information on our sustainability plans can be found in the Climate Action Plan. |
Links & references | Links & references | Links & references |
For more details on stakeholder identification and consultation, see the following chapters: Our stakeholders,Governance information, Sustainability governance and policies, Own workforce and Customers & end-users. | The governance structure for implementation of the principles can be found in Governance information, Leadership & governance and Remuneration report We promote a culture of responsible banking, as described in Sustainability risk, Sustainability governance and policies and Climate change. | See Limited assurance report of the independent auditor on the sustainability statement and Independent auditor's report . |
Disclaimer
Certain statements contained in this report are not facts, including, without limitation, certain statements related to future expectations and other forward-looking statements that are based on ASN Bank’s current views and assumptions and involve known and unknown risks and uncertainties that could cause actual results, performance or events to differ from those expressed or implied in such statements. Factors that could cause actual results to deviate materially from those anticipated by forward-looking statement include, but are not limited to, macroeconomic, demographic, and political conditions and risks, actions taken and policies applied by governments, financial regulators and private organisations.
Any forward-looking statements made by or on behalf of ASN Bank speak only as of the date they are made. Subject to statutory obligations, ASN Bank assumes no obligation to publicly update or revise any forward-looking statement, whether as a result of new information or for any other reason. Neither does ASN Bank make any representation, warranty or prediction that the results anticipated by such forward-looking statements will be achieved, and such forward-looking statements represent, in each case, only one of many possible scenarios and should not be viewed as the most likely or standard scenario. This report should not be regarded as an opinion or recommendation concerning the purchase or sale of securities issued by ASN Bank.
This document may contain inactive textual addresses to internet websites operated by us and third parties. Reference to such websites is made for information purposes only, and information found at such websites is not incorporated by reference into this document. ASN Bank does not make any representation or warranty with respect to the accuracy or completeness of, or take any responsibility for, any information found at any websites operated by third parties and cannot guarantee that such website will not change following the publication of this document.