2025 highlights
At a glance

Market position#2 2024: #2 | Customer base(in million)5.2 2024: 4.5 | Employees(in FTE)8,689 2024: 7,373 |
Carbon footprint reduction(in %)8.6 2024: 5.3 | Impact investments(in % of total AuM)10.1 2024: 8.7 | Employee engagement(in percentile)771 2024: 73 |
Sustainable reputation(in %)41 2024: 39 | Gender diversity(female as % of total management)34 2024: 32 | NPS-i(-100 to 100)25.0 2024: 18.42 |
| 1 Based on the most recent pulse check assessment from January 2026. The annual extensive culture scan, conducted in February 2025 had 71 as a result. 2 Please note the 2024 figure represents the Q4 baseline value. |
Dividend per share | Market capitalisation(in € billion)12.7 2024: 9.7 | Total assets(in € billion)142.2 2024: 138.6 | Total equity(in € million)10,124 2024: 9,8881 |
Operating result(in € million)1,637 2024: 1,4631 | IFRS net result(in € million)565 2024: 9561 | Operating return on equity(in %)14.1 2024: 13.41 | |
Solvency II ratio2 | Organic capital creation(in € million)1,315 2024: 1,193 | ||
Credit rating(S&P, IFSR)A+ 2024: A | 1 This figure is restated. 2 The Group Solvency II ratio is based on the Partial Internal Model (PIM), applicable to Aegon Life, Aegon Spaarkas and a.s.r. Life. The other insurance entities calculate their solvency capital requirement using the Solvency II Standard Formula. The Group Solvency II ratio includes financial institutions. |
Integration Aegon Nederland N.V.
This section describes the progress that has been made in the integration of Aegon Nederland N.V. (Aegon NL) with ASR Nederland N.V. (a.s.r.). Following the closing of the transaction in July 2023, a.s.r. committed to completing the integration within three years, by mid 2026. Since then, numerous milestones have been completed and the integration is well on track.
a.s.r. is now positioned to leverage the unique strengths of both organisations in support of a.s.r.'s strategic goal of creating a leading insurer in the Netherlands, enhancing the company's ability to deliver value across non-life and life insurance, pensions, asset management activities and distribution services. With the integration approaching it's final phase, the commercial and financial performance so far confirm the strategic and financial benefits of the combination with Aegon NL. a.s.r. remains committed to executing the planned integration path and delivering on its objectives.
Since the closing of the transaction in July 2023, a.s.r. has expeditiously executed the integration plan for Aegon NL, successfully completing nearly all key milestones. Policy migrations across P&C, Disability, Mortgages, Individual life and Pension have been finalised, marking a significant achievement in the integration journey by transferring over two million active policies spread over the different business domains. The programme has now entered its final phase and remains firmly on track for full completion by mid-2026, as originally planned. The remaining activities are focused on decommissioning the IT infrastructure and phasing out residual dependencies on Aegon Group systems. This year's update will therefore mark the final dedicated integration update.
With this transition, a.s.r. is not only delivering on its integration promise but also reinforcing its position as a leading insurer in the Netherlands. The combination of two strong organisations has already translated into tangible commercial and financial benefits, enabling a.s.r. to create more value across non-life and life insurance, pensions, asset management, and distribution services.
Further progress towards key milestones
In 2025, a.s.r. achieved several important integration milestones. On 1 January 2025, the legal merger of the IORP pension entities - Aegon Cappital B.V. and ASR Premiepensioeninstelling N.V. - was completed. The full integration of asset management activities followed shortly thereafter, with all associated Transitional Service Agreements (TSAs) terminated. By year-end, all non-IT TSAs had been phased out. Final systems decommissioning is scheduled for June 2026.
Earlier, in 2024, a.s.r. completed the migration of all Property & Casualty and Disability insurance policies from Aegon NL into its core systems - covering more than one million policies - making non-life the first major business line fully integrated. This milestone brought unified policy administration and processes under one platform, significantly enhancing operational efficiency.
The divestment of Knab was finalised on 1 November 2024. Knab now operates independently, with no remaining TSAs and only minor trademark-related arrangements. In the Mortgages domain, the migration process was fully completed in 2025. New mortgage production transitioned to the Stater platform early in the year, and by October, approximately 300,000 active mortgage accounts had been successfully migrated. In parallel, the Individual life portfolio migration was executed in phases, with the final portfolio migrated in Q4 2025. In total, around 550,000 life insurance policies were consolidated onto a.s.r.’s LeanApps platform, enabling the shutdown of Aegon’s separate life-policy systems and streamlining operations under a single administration.
A major milestone was achieved in December 2025, when the Dutch Central Bank (De Nederlandsche Bank - DNB) approved the Partial Internal Model for ASR Levensverzekering N.V.
Successful integration through simplicity and discipline: thorough preparation, strong collaboration and monitoring of results, all while keeping the business running.
Manager Corporate Development
Final steps towards full integration
The final phase of integration in 2026 will focus on completing the remaining steps and consolidating the one-company operating model. Key milestones include the legal merger of the life entities (planned for mid-2026) and the full decommissioning of Aegon NL systems and IT services. By mid-2026, all ITSAs between a.s.r. and Aegon Ltd. will be terminated, enabling the combined business to operate entirely on a.s.r.’s IT infrastructure. The Leeuwarden office is scheduled to be vacated by year-end 2026, once teams are fully operational at the Utrecht location.
Further optimisation of the Pension business line will continue beyond 2026, with a longer-term horizon (2027–2028) to harmonise Defined Benefit (DB) administration platforms and transition all DC administration to the target platform Plexus.
Achieving full run-rate cost synergies remains a top priority. a.s.r. expects to realise the remaining synergy benefits primarily through the elimination of IT transitional services and rationalisation of supporting teams. By mid-2026, the total projected synergies from the integration are expected to be fully captured, in line with the financial objectives set at the time of acquisition.
Governance to completion
Throughout the final stretch of the integration, a.s.r. has maintained strong governance and oversight. The last user migrations have been successfully finalised, and the decommissioning of legacy IT systems is progressing on schedule.
a.s.r. continues to support employees affected by the integration, balancing the additional workload with business-as-usual operations and facilitating transitions to new roles within or outside the company. These risks have been effectively managed through detailed planning and proactive mitigation measures. Senior management engagement remains high, and the Integration Management Office and steering committees will continue to monitor progress until all milestones are completed.
By the end of 2026, with all planned legal entity mergers, migrations and system decommissions finalised, the integration programme will be completed. The combined company will then transition to business-as-usual operations, operating with a unified culture, a single set of systems and fully materialised synergies. The valuable integration capabilities and lessons learned will be leveraged to ensure the efficient integration of future acquisitions.
1 Message
from the
CEO
Message from the CEO
Full circle
Dear reader, before you lies a.s.r.’s Annual Report for 2025. It was, once again, an exceptional year in the long history of a.s.r. It was the year in which we completed the integration of Aegon Nederland’s business units into our organisation. Following the joint announcement in October 2022 of our intention to merge, we successfully achieved this objective within the targeted 2.5 years. By the end of 2025, all major migrations had been completed, resulting in one organisation with one way of working for all customers. This marks one of the largest integrations in the Dutch insurance market, and I am proud of everyone who has contributed to this milestone.
As the integration progressed, our business continued to deliver strong results. We strengthened a.s.r. through several important transactions, including the real estate transaction involving Amvest and the acquisition of the funeral insurance portfolio of the oldest insurer in the Netherlands. We also expanded our position in occupational health services and reintegration by becoming the 100% shareholder of HumanTotalCare. Early in 2026, we announced the intended acquisition of the insurance activities of Bovemij, further reinforcing our position in the Non-life market.
In 2025 we completed several pension buy-outs, ensuring pension security for many participants. We also concluded the long-running unit-linked file. More than 90% of affiliated customers accepted the agreement reached with interest groups. This brought collective proceedings to an end, with the groups agreeing not to initiate new proceedings. It closed a complex and impactful file constructively for all stakeholders.
These developments all contribute to our objective of creating long-term value creation for our stakeholders.
Our financial and non-financial results over 2025 are strong and meet or exceed our targets. The significant increase in customer appreciation is a welcome recognition of the dedication of our employees, to whom I am sincerely grateful. Employee satisfaction, measured again in January 2026, shows an upward trend - an outcome that reflects, among other things, the successful execution of the integration.
Every day, we work towards building a more sustainable world. We continued reducing the CO₂ footprint of our investment portfolio and increasing our impact investments. Our CO₂ footprint decreased by 8.6% in 2025, keeping us on track to achieve our 2030 target of 25%. Impact investments reached 10.1% of total investments, enabling us to meet our 2027 target of 10% ahead of schedule.
Our financial results underline a.s.r.’s strong position in the Dutch market. Premiums and DC inflow increased by 28.9%, and the operating result rose by 11.9%. Our capital position remains robust, with organic capital creation up by 10.2%. With the approval of the Partial Internal Model (PIM) for ASR Levensverzekering N.V., we now report under Solvency II based on the PIM for all Life entities. This contributed to the Solvency II ratio increasing to 218%. In 2025, we repurchased € 230 million of our own shares, and upon publishing our annual figures on 18 February 2026, we announced an additional repurchase of € 175 million - fully in line with our strategy to deploy capital to create value and efficiently return capital to shareholders.
As a Dutch insurer, we understand the local market well. At the same time, we remain mindful of shifting geopolitical dynamics that influence decisions related to investments, risk and long-term security. We take responsibility for societal themes where we can genuinely make an impact - such as the housing shortage, climate risks, sustainable employability and income security. We follow developments from the new government closely and are ready to contribute our insights to help build a better Netherlands for today and for future generations.

This is the eighteenth Annual Report of a.s.r. in its current form, and once again I have the privilege of addressing you as CEO and Chair of the Executive Board. Since 2008, a.s.r. has undergone several transitions. In our 2008 Annual Report, I wrote: 'In retrospect, 2008 has been a harsh learning experience for the financial sector. We cannot change the past, but we can change our future.' That was our impetus to return to the core of our company: insuring risks that people are unable or unwilling to bear themselves, and building capital for the future. Our guiding principle has been the Rijnlands model, ensuring that we consider the interests of all stakeholders. With that compass, I have dedicated myself to a.s.r. since then.
I began my career at Stad Rotterdam, then a listed and prominent insurer and one of the legal predecessors of a.s.r., with roots dating back to 1720. Through its incorporation into Fortis, the nationalisation in 2008, and our successful return to the private market through the IPO in 2016, we have built a strong team and a healthy, solid organisation. With a clear growth-oriented strategy, well positioned for the future. This is not the achievement of executives alone. Strategies and plans may set the direction, but real progress is driven by the commitment of colleagues who have contributed over the years. I would therefore like to express my sincere appreciation to all our employees for their dedication. I also thank our shareholders and customers for the trust and confidence they continue to show.
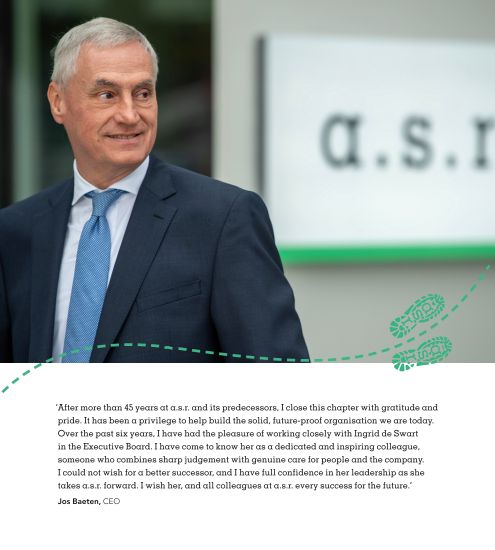
After more than 45 years at a.s.r. and its predecessors, the circle is complete for me. This 2025 report is my last Annual Report as CEO and I recognise that a long and rewarding period at a.s.r. is coming to an end. I am pleased that the Supervisory Board has nominated Ingrid as my successor. She has been a member of the Executive Board for 6.5 years, and during that time I – together with my colleagues in the MB - have worked with her with great pleasure and in a highly constructive manner. She is among the best executives in the Dutch insurance sector. Knowing that a.s.r. will be in excellent hands with her, I pass on the baton with full confidence. I wish her, and all colleagues at a.s.r., every success for the future.
Jos Baeten
CEO and chair of the Executive Board

2 Business and strategy
2.1 The story of a.s.r.
ASR Nederland N.V. (a.s.r.) is the second-largest insurer in the Netherlands and is listed on Euronext Amsterdam, where it is included in the AEX Index. a.s.r. offers services and products in the field of insurance, pension and mortgages, and acts as an asset manager for third parties.
Mission
The mission of a.s.r. is to help customers insure risks they are unwilling or unable to bear themselves, and to accumulate capital for later. It's products and services are designed for the long term, with future generations in mind, serving private individuals, self-employed professionals and businesses - now, later and always.
a.s.r. aims for sustainable growth, guided by the principle of value over volume. It does so by helping its customers strengthen their financial security, by expanding its role in society, and by investing in innovation that truly makes a difference.
Strategy
a.s.r. aims to create long‑term value for its key stakeholders: customers, employees, shareholders and society. It strives to be the leading pension provider in the Netherlands and a leading mortgage lender. Its ambition is to strengthen its position and pursue growth in Property and Casualty (P&C), Disability and Asset Management in the coming years, while maintaining its current position in Health and Individual life & Funeral. a.s.r. also seeks to expand its role in the value chain through distribution and service companies.
To become the best in the industry, a.s.r. embraces technological developments and applies them where they add value. a.s.r. operates cost‑efficiently and is financially robust, managing the funds entrusted to it by customers with care. Financial strength is essential to meet obligations and provide continuity for customers and employees. Shareholders are offered the prospect of a fair return.
Customers
a.s.r. strives to be the best financial service provider for its customers and intermediaries. It offers simple and transparent products and services that meet customers’ needs, including sustainable solutions. Customers can rely on a.s.r. to meet its obligations.
a.s.r. aims for customers and advisers to rate its products and services above average. To achieve this, a.s.r. works closely with intermediaries who understand customers’ personal situations and can provide tailored advice. Customers also have the flexibility to manage matters quickly and easily through the digital environment, or opt for personal contact when needed. a.s.r. is data‑driven and incorporates customer feedback into its decision‑making. By leveraging technological innovations, including Artificial Intelligence (AI), a.s.r. continuously improves its services.
Employees
Talented, skilled and vital employees are key to a.s.r.’s success. Every day, employees are committed to supporting customers and advisers in the best possible way. Everyone at a.s.r. works according to three core values to achieve this goal:
We are helpful – Acting with the customer and adviser in mind, understanding their needs, aligning carefully and honouring commitments.
We think ahead – Preparing thoroughly, listening attentively and providing appropriate solutions based on expertise, experience and dedication.
We achieve results – Focusing on content and process, taking responsibility and completing what has been started. In doing so, the desired outcome is achieved together.
a.s.r. aims to ensure that employees remain healthy and sustainably employable. With trust as its foundation, a.s.r. seeks to foster an inclusive culture and a supportive working environment with a strong customer focus.
Employees are expected to demonstrate courage and personal leadership. To support this, a.s.r. empowers employees to take ownership of their careers by investing in personal development and by offering opportunities to expand relevant knowledge and skills. In addition, a.s.r. actively promotes physical and mental health and encourages social engagement to help maintain a healthy work–life balance.
Shareholders
a.s.r.’s focus on long‑term value creation and pursuit of profitable growth, progressive dividends and additional capital returns supports shareholder value. Shareholders can rely on a.s.r. being financially robust and manage the capital entrusted to us responsibly. They may expect solid financial performance, a strong balance sheet, economically rational capital allocation, disciplined cost management and transparent reporting.
Society
As a major insurer, a.s.r. seeks to contribute to solving societal challenges by focusing on the three pillars where it can make the most impact:
Financial self-reliance and inclusion
a.s.r. helps people take responsible risks and make conscious financial choices. The aim is to prevent people from falling into debt or support them in resolving debt. Particular attention is given to the inclusion of diverse target groups, including vulnerable groups within society.
Vitality and sustainable employability
a.s.r. is committed to preventing illness, absenteeism and incapacity for work among employees, employers and healthcare customers. This approach enables people to work longer and healthier and continue to contribute to society.
Sustainable living and climate
To reduce its ecological footprint, as a major (real estate) investor, a.s.r. invests in activities that mitigate climate risks, support the energy transition and restore biodiversity. Customers are supported with insurance products and advice on how to live more sustainably. Within its own operations, a.s.r. makes conscious choices to minimise the environmental impact of offices, transport and procurement. And by making smart decisions and sustainable investment choices, its social impact develops alongside organisational growth.
Society can expect a.s.r. to integrate environmental, social and governance objectives into its strategy.
2.2 Business portfolio and group value chain
2.2.1 Business portfolio
a.s.r.'s business portfolio consists of five segments, as illustrated in the figure below. For more information about these segments, see section 4.
Non-life
The Non-life segment consists of the non-life insurance entities and their subsidiaries. These entities offer non-life insurance contracts such as P&C, disability and health.
P&C
a.s.r. ranks among the top three P&C insurers in the Netherlands, with a market share of 14.7% (2024: 14.7%) measured by GWP.1 a.s.r. offers the following P&C products:
Motor insurance;
Fire insurance;
Other insurance products, such as liability, legal aid, travel and recreation, pet and transport insurance.
These products are offered to both retail and commercial customers under the a.s.r. brand and the label Ik kies zelf van a.s.r. The a.s.r. brand serves retail and commercial markets primarily through independent advisors and mandated brokers. The Ik kies zelf van a.s.r. label focuses on direct online distribution to individuals and offers travel and leisure insurance via travel agents.
Disability
a.s.r. is the leading insurer in the disability market, offering income protection. It has an extensive range of products and services focusing on sustainable employability and on preventing and reducing absenteeism. Distribution of disability insurance products takes place mainly through insurance advisors. With the brands a.s.r. and Loyalis, a.s.r. is well positioned in this distribution channel, serving self-employed individuals, SMEs, corporates and the (semi-) public sector. a.s.r. is the market leader, with a market share of 39.5% (2024: 39.8)%1.Through its prevention and reintegration services, a.s.r. helps its customers to ensure optimal employability for themselves and their employees.
a.s.r.’s income protection insurance business offers various products divided into the following product groups:
Individual disability;
Sickness leave;
Group disability.
Health
a.s.r. offers basic health (medical) insurance under the Dutch Health Insurance Act (Nederlandse Zorgverzekeringswet) in combination with supplementary health insurance. It does so under the brand a.s.r. and under the label Ik kies zelf van a.s.r. With around 700,000 customers, a.s.r. is the seventh largest provider of health insurance on the Dutch market with a market share of 2.4% (2024: 3.2%).1
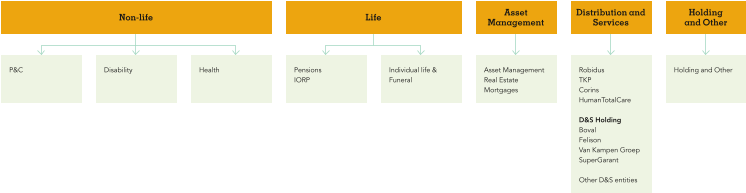
Life
The Life segment consists of Pensions, Individual life & Funeral. The Life segment has a market share of 24.2% (2024: 28.6%).1
Pensions
a.s.r. is a major provider of Defined Contribution (DC) pensions in the Netherlands. It provides different propositions for premium build-up with lifecycle solutions for SMEs and large-cap companies:
The Employee pension (Werknemerspensioen) (a.s.r. Life);
Doenpensioen van a.s.r. (a.s.r. IORP);
Cappital Pensioen (a.s.r. IORP).
Individual life & Funeral
Individual term life insurance is the only individual life product that a.s.r. actively sells. It guarantees payment of a death benefit to the insured's beneficiaries if the insured dies during the specified term.
a.s.r. is a top-three funeral insurer in the Netherlands, selling funeral capital insurance policies that enable customers to fund their own funeral.
Asset Management
The Asset Management segment involves all activities relating to asset management, including investment property management.
Asset Management
a.s.r. asset management (a.s.r. vermogensbeheer) manages assets for a.s.r.'s own account and offers asset management services for affiliated entities as well as third parties. The investment categories include primarily corporate bonds, government bonds and equity. This way, a.s.r. asset management offers investment solutions with attractive returns.
Real Estate
a.s.r. real estate invests in real estate and infrastructure (real assets) on behalf of a.s.r. and third-party institutional investors and manages real assets portfolios. a.s.r. owns a 50% interest in the joint venture Amvest Vastgoed B.V. And the joint venture Amvest Development Fund B.V. On 8 July 2025, a.s.r. and the Dutch pension fund for the care and welfare sector (Pensioenfonds Zorg en Welzijn - PFZW), agreed to divide Amvest's real estate activities. This transaction was approved by the Dutch Authority for Consumers and Markets (Autoriteit Consument & Markt - ACM) and the Dutch Authority for the Financial Markets (Autoriteit Financiële Markten - AFM) in November 2025 and the closing was early January 2026.
a.s.r. real assets investment partners develops investment strategies, ensures their implementation and gives institutional investors control over real asset portfolios through active monitoring, reporting and engagement.
Mortgages
a.s.r. mortgages operates in the residential mortgage market. a.s.r. also offers third party investors the opportunity to invest in Dutch residential mortgages. a.s.r. has a market share of approximately 7%.
a.s.r. mortgages offers its mortgage products to customers via intermediaries, under two different mortgage brands: a.s.r. and Aegon. Under the Aegon brand, standard products (annuity, linear and interest-only mortgages) are offered to a broad customer base. In addition to standard products, the a.s.r. brand offers specialised products for distinct customer groups. This includes products for first-time buyers, customers who want to finance sustainable home modifications and senior citizens.
Distribution and Services
The Distribution and Services (D&S) holding company is responsible for a.s.r.'s distribution and service entities. Companies under D&S are jointly responsible for developing a centralised strategy and promoting cooperation and synergy between the businesses. These companies retain their own unique identities and organisational structures. They continue to operate independently of a.s.r. but in line with the a.s.r. strategy.
Holding and Other
The Holding and Other segment (including eliminations) consists primarily of the following activities:
Holding activities of a.s.r., including group-related activities;
Other holding and intermediate holding companies, including:
ASR Real Estate Development B.V., the real estate development business;
ASR Vooruit B.V., the investment firm that performs activities relating to private investments for customers;
ASR Deelnemingen N.V.
- Market shares DNB 2024. Market shares 2025 are not available yet at time of publication of this report.
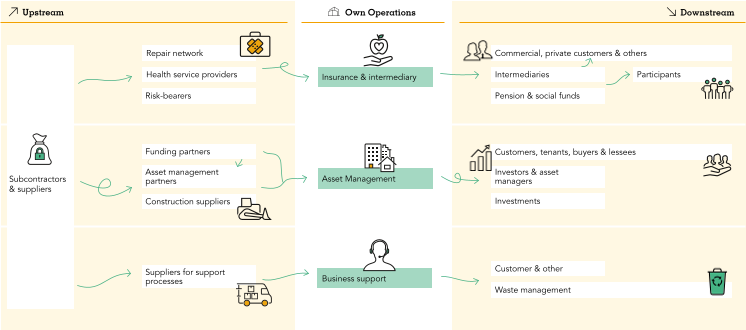
2.2.2 Group value chain
In accordance with the Corporate Sustainability Reporting Directive (CSRD), a.s.r. conducted a Double Materiality Assessment (DMA). This assessment is a crucial step in defining the organisation's reporting scope for its most material sustainability topics and in mapping its value chain. The value chain outlines a.s.r.'s business operations and its associated upstream and downstream business relationships.
Upstream value chain
The upstream part of the value chain comprises suppliers of goods and services, contractors and capital providers that are essential for the functioning of a.s.r.'s business activities.
Own operations
a.s.r.’s business activities cover a range of financial services, which are organised into five segments as outlined in the business portfolio (see section 2.2.1). These segments align with the group value chain according to their respective activities:
Insurance and intermediary: Combines three segments, Non-life, Life and Distribution and Services, based on their insurance-related activities.
Asset Management: Includes Mortgages, Real Estate and Asset Management.
Business support: Includes a.s.r.’s own workforce and the activities within the Holding and Other segment that provide staff and support functions. Certain activities within the Holding and Other segment, such as real estate developments, are presented under their respective business activities within the group value chain.
Downstream value chain
The downstream value chain includes a wide range of actors, such as consumers and end-users, intermediaries and waste management companies. a.s.r. offers non-life and life insurance products and services to both business and private customers via intermediaries, mandated brokers and direct online distribution.
a.s.r. is a multi-product organisation involving various internal and external stakeholders. The value chains of seperate product lines have been mapped and grouped into three overarching value chain segments based on the nature of their activities: Insurance and intermediary, Asset Management and Business support. Descriptions of these segments are provided in sections 2.2.1 and 6.1.4.4. The consolidated value chain, derived from these underlying value chains, is presented below.
- Section 2.2.2 is in scope of CSRD and limited assurance (ESRS 2 SBM-1)
2.3 How a.s.r. creates value
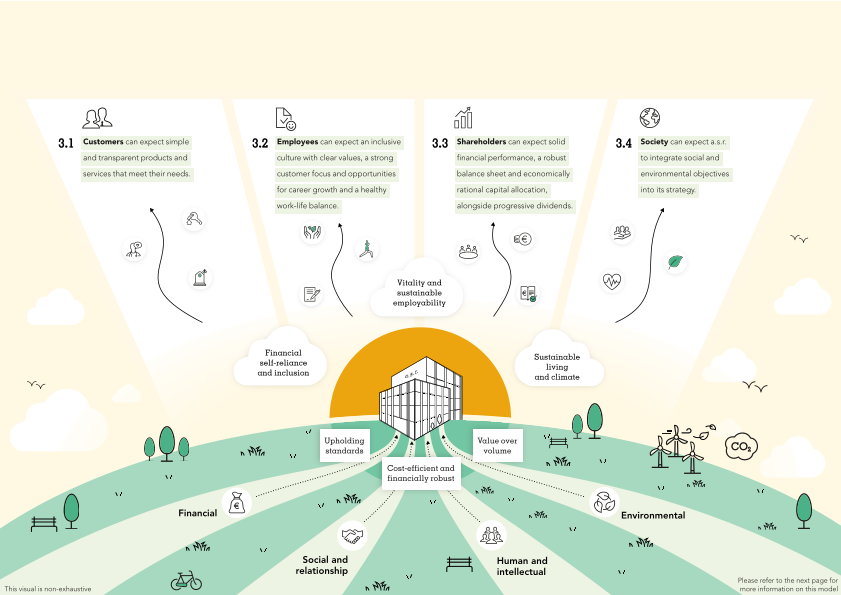
How a.s.r. creates value
The mission of a.s.r. is to help customers insure risks they are unwilling or unable to bear themselves, and to accumulate capital for later. This value creation model illustrates how a.s.r. translates this mission into long‑term value for its stakeholders. It provides a clear overview of how a.s.r. transforms resources into responsible outcomes, reinforcing the organisation's purpose and responsibilities.
The model starts at the bottom, where the inputs represent the essential resources on which a.s.r. depends: financial, social and relationship, human and intellectual, and environmental capital.
Moving upward, the model highlights a.s.r.’s guiding principles: upholding standards, prioritising long‑term value over volume and maintaining cost efficiency to ensure financial health. These guiding principles form the foundation on which the organisation's activities are carried out and enable resources to be transformed into long‑term value for stakeholders.
Building on this foundation, a.s.r.’s strategic agenda includes three sustainability pillars: Financial self-reliance and inclusion, Vitality and sustainable employability and Sustainable living and climate. These pillars guide the company's efforts to create positive impact for society and the environment, while minimising its negative impact.
At the top, the model presents the expected outputs and outcomes, organised by stakeholder group. These illustrate the results of a.s.r.’s actions:
Customers can rely on a.s.r.’s transparent and responsible products and services, and dedication to long-term financial security. The customer base mainly consists of private individuals, self‑employed professionals and businesses. For more information, see section 3.1.
Employees experience an inclusive culture that values respect and recognition, while supporting personal development and customer focus. For more information, see section 3.2.
Shareholders benefit from a.s.r.’s commitment to value creation, cost discipline, transparent reporting, and economic rational capital allocation. For more information, see section 3.3.
Society can expect a.s.r. to integrate social, environmental and governance considerations into its strategic agenda, while ensuring that its activities align with regulatory requirements. For more information, see section 3.4.
a.s.r. puts value over volume in pursuit of long-term value creation for all stakeholders.
Director Investor Relations and Ratings
2.4 Strategic targets and material topics
a.s.r. aims to achieve sustainable and profitable growth by executing a disciplined strategy centred on organic growth and efficient capital allocation. It prioritises value over volume, maintains strict cost discipline and selectively pursues bolt-on acquisitions. a.s.r. is committed to delivering attractive returns, safeguarding a resilient balance sheet and operational excellence across all product lines. By maintaining strong financial flexibility and a robust Solvency II ratio, a.s.r. positions itself as a leading insurer in the Netherlands, ready to capture growth opportunities while ensuring long term value creation.
a.s.r. embeds sustainability at the heart of its strategy, focusing on three key pillars: Financial self-reliance and inclusion, Vitality and sustainable employability and Sustainable living and climate. Through these pillars, a.s.r. seeks to contribute to solving societal challenges and aims to reduce its environmental footprint and support the transition to a low-carbon economy, promote healthy and future-proof lifestyles for customers and employees, and strengthen financial resilience and inclusion across society. By combining financial strength with societal impact, a.s.r. strives to accelerate the transition towards a sustainable economy.
2.4.1 Strategic targets
a.s.r.’s strategy, presented at the 2024 Capital Markets Day (CMD), focuses on long‑term sustainable value creation for all stakeholders. It is built on value‑over‑volume, financial discipline and the rational allocation of capital. The strategy is driven by clear priorities that support growth, efficiency, capital flexibility and ESG leadership:
Drive sustainable and profitable growth across all business lines, including Non-life, Life and Fee based businesses.
Strengthen customer and intermediary relationships.
Improve efficiency and enhance income through operational excellence and investment performance.
Pursue selective M&A to add scale and capabilities.
Optimise capital and financial flexibility.
Maintain leadership in ESG.
Profitable growth and sustainable value creation is underpinned by:
Proven track record in disciplined execution of strategy, strong performance and consistent delivery on ambitious targets.
Demonstrated performance in rational capital allocation and delivering attractive returns.
In 2025, a.s.r. delivered strong results and made significant progress towards achieving its ambitious goals for the 2024–2026 period.
2.4.1.1 Financial targets
The combined business is leading in various market segments, and a.s.r. sees ample opportunities for profitable growth and to create sustainable value for all stakeholders. a.s.r. is well-positioned to benefit from the structural pension market developments and continues to pursue profitable growth in P&C and Disability, maintaining a strong combined ratio and underwriting performance. Furthermore, a.s.r. aims to supplement organic growth with strategic bolt-on acquisitions to add scale and skills. This is reflected in ambitious group and business targets.
Solvency II ratio2

This metric is based on the Solvency II framework and represents the solvency position of a.s.r. The Solvency II ratio is an integral part of a.s.r.'s Solvency II management ladder. This ladder represents different levels of solvency that is required for paying dividends (>140%), being entrepreneurial (>160%) in terms of organic and inorganic growth and re-risking, and considering additional capital return to shareholders (>175%).
The Solvency II ratio increased to 218% (31 December 2024: 198%) with organic capital creation (OCC) (21%-points) offsetting the deployment of capital (-21%-points), including pension buy-outs, acquisitions and capital distributions. The positive impact of the implementation of the Partial internal model (PIM) for ASR Levensverzekering N.V. and related capital management actions is circa 12%-points on the group Solvency II ratio. Market and operational developments contributed positively (7%-points).
Organic capital creation

The OCC is an operating profit measure (after tax) within the Solvency II framework. The OCC reflects three key components: business capital generation, finance capital generation and net SCR impact.
The OCC increased by € 122 million to € 1,315 million (2024: € 1,193 million), primarily driven by higher finance capital generation, improved business performance and the realisation of cost synergies. The increased finance capital generation reflects a higher investment margin resulting from re-risking of the investment portfolio (mainly executed in second half of 2024), wider government bond spreads, positive equity and real estate revaluations and interest rate developments (e.g. a reduced UFR drag).
Operating return on equity3

Capital return4
Total capital return comprises dividends and share buybacks.
Dividend per share

a.s.r. strives to pay annual dividend that creates sustainable long-term value for its shareholders. From 2022 onwards, a.s.r.’s Dividend Policy offers a progressive dividend to shareholders. This dividend is determined discretionally and not tied directly to a single financial performance metric. Following the announcement of the Aegon NL transaction in 2022 a.s.r. announced that it intends to pay a progressive dividend that would grow ‘mid-to-high’ single digit annually until (and including) 2025. At the CMD on 27 June 2024 a.s.r. announced that the period will be extended until 2026.
a.s.r. proposes a final dividend for 2025 of € 2.14 per share, bringing the total dividend (including interim dividend of € 1.27 per share) to € 3.41 per share, an 9.3% increase versus 2024 (€ 3.12 per share).
Share buyback

The projected developments of a.s.r.'s OCC in combination with a robust balance sheet enable the resumption of supplementary capital distribution to shareholders. Alongside a progressive dividend a.s.r. intends to provide an attractive capital return in the years ahead, a.s.r. also intends to allocate € 525 million to share buybacks over the plan period (€ 125 million over 2024, € 175 million over 2025 and € 225 million over 2026).
The € 330 million cumulative share buyback refers to the € 100 million share buyback following the completion of the sale of Knab, executed in 2024. The € 125 million announced share buyback with the 2024 annual results in February and € 105 million in September as participation in the sell-down of Aegon Ltd., executed in 2025.
The share buyback of € 175 million announced on 18 February, 2026 (in line with the medium-term targets as presented at the 2024 CMD) will be executed in the first half of 2026 and deducted from HY 2026 Solvency II ratio.
Non-life combined ratio and revenue growth
Combined ratio

Revenue growth

The combination of these targets reflect a.s.r.'s aim for profitable growth in P&C and Disability, pairing a strong combined ratio with premium growth.
The organic growth in P&C and Disability amounted to 3.0%, within the 3-5% target range. Growth in P&C and Disability mainly reflects price increases to mitigate claims inflation.
Pensions and Annuities
Total inflow in Pensions includes € 2,810 million AuM in pension buy-outs, € 3,011 million DC inflow (+8.8% vs 2024) and € 646 million annuities inflow (+11.2% vs 2024).
Pension buy-outs

a.s.r. aims to acquire € 8 billion of assets under management related from corporate pension funds in the period 2024 – 2027. Pension buy-outs amounted to € 2.9 billion Assets under Management (AuM) in 2025.
Pension DC inflow

Pension DC inflow increased to € 3.0 billion (2024: € 2.8 billion) driven by organic growth. The annuity inflow increased to € 646 million (2024: € 581 million), reflecting higher DC accumulation and increased maturity of DC AuM.
Annuities

As part of the Life segment, a.s.r. expects to benefit from the pension reform in the Netherlands and grow in DC pensions and annuities. Growth in the pension DC business is measured by inflow of DC products, where a.s.r. targets € 8 billion of DC inflow cumulatively in the plan period 2024 – 2026. For annuities a.s.r. targets € 1.8 billion of inflow cumulatively in the plan period 2024 – 2026.
Fee-based business operating result
The operating result of the fee-based businesses comprises of the result from segment Asset Management and segment Distribution & Services.
Fee-based business operating result

The operating result of the fee-based businesses increased by € 36 million to € 186 million (2024: € 150 million).
Cost synergies
At the announcement of the Aegon NL transaction on 27 October 2022, an overall run-rate cost synergy target of € 185 million for the combined companies was announced. This was raised one year later at an Investor Update on 30 November 2023 to € 215 million, after further detailing the integration plan. a.s.r. is on track to achieve this € 215 run-rate cost synergies in 2026.
- Targets are based on the assumption of normal (financial) markets, environmental and economic conditions and no material regulatory changes.
- The Group Solvency II ratio is based on the Partial Internal Model (PIM), applicable to Aegon Life, Aegon Spaarkas and a.s.r. Life. The other insurance entities calculate their solvency capital requirement using the Solvency II Standard Formula. The Group Solvency II ratio includes financial institutions.
- The operating return on equity is calculated by dividing the (annualised) operating result after deduction of taxes (taking into account the structural tax exempt dividend results) by the annual average equity attributable to shareholders after deduction of the reserve for unrealised profits and losses and the equity for Knab (operating activities in ‘run-off’).
- In general, a.s.r. expects not to pay cash dividends if the SII ratio falls below 140%. For SBB, the Solvency II ratio needs to be at least 175% with sufficient OCC to fund capital distributions and no alternative deployment of capital delivering superior returns, and to be decided annually upon discretion by the Management Board.
2.4.1.2 Non-financial targets
This section presents the non‑financial targets introduced during the CMD 2024.1
Net Promoter Score-interaction
In 2025, for the first time, a.s.r. is reporting on its Net Promoter Score for customer interaction (NPS-i), a customer satisfaction metric based on both online and offline channels. NPS-i represents the weighted average score of the NPS-c (Net Promoter Score for contact moments between client and a.s.r.) and NPS-d (Net Promoter Score for digital client interaction, e.g. website or online portal). Closely monitored through NPS surveys, the NPS-i, gives insight into the customer experience and highlights areas for improvement. These surveys have provided valuable feedback during the integration and migration of Aegon NL customers to a.s.r. products. The target for NPS-i is +4 at year-end 2026, compared to the Q4 2024 baseline of 18.4.
NPS-i2

In 2025, a.s.r. made further progress in strengthening customer centricity and improving the customer experience across online and offline channels. The NPS‑c remained consistently high during 2025 and the NPS-d continued to improve in 2025 resulting in a yearly average of 25.0 for the NPS-i (Q4 2025: 27.3) More information about NPS-i, see section 3.1.1.1
Carbon footprint reduction
Climate change is a material topic for a.s.r. Through its asset management activities, a.s.r. potentially makes a difference by engaging with investees to reduce their carbon footprint. On the CMD in June 2024, a.s.r. announced its target to reduce the carbon footprint of its internally managed own account assets and 3rd party assets by 25% in 2030, compared to base year 2023. This target builds on the carbon footprint reduction of 69% achieved between 2015 and 2023. Calculation of emissions is in line with the GHG Protocol scope 3 category 15: investments and the PCAF methodology for financed emissions. For more information about the methodology and score, see section 6.2.1.6.
Carbon footprint reduction

The carbon footprint of the investment portfolio decreased by 8.6% at 31 December 2025 compared to base year 2023, remaining on track to meet the 2030 target of -25%. The reduction is driven by lower emissions across various asset classes, particularly in mortgages and real estate. For more information about a.s.r. climate ambitions, see section 6.2.1.6
Impact investing
a.s.r. aims to generate positive impact through its impact investments while also generating attractive investment returns. The impact investment target is 10% of own account assets and internally managed affiliated assets by 2027. In line with the Global Impact Investing Network (GIIN), a.s.r. defines an investment as impact investment when it seeks to generate positive, measurable social and environmental impact alongside financial return. For more information about the specific criteria that apply and the scope of impact investing, see section 3.1.3.4.
Impact investing

Impact investments accounted for 10.1% of the investment portfolio as at 31 December 2025, a 1.4%-points increase compared to 31 December 2024 (8.7%). This increase mainly relates to an increased allocation in labelled bonds and social impact investments. As a result, the target for 2027 has already been achieved. For more details on impact investing in the business lines Asset Management, Real Estate and Mortgages, see section 3.1.3.4.
Employee engagement
a.s.r. strives to be an attractive employer. Engaged employees are key for a.s.r. to successfully execute its strategy. a.s.r. measures employee engagement via the annual Denison scan. Four themes are central: vision, core values and behaviour, empowerment and knowledge development. The key performance indicator (KPI) is expressed as a percentile and compared against a large, global benchmark. The target covers all a.s.r. employees including contractors, temporary workers and seconded workers with an a.s.r. contract and interns. Employees of subsidiaries are not in scope of this target. For more information regarding this target, see section 6.3.1.4.
The 2024 score serves as a baseline measurement, as it was the first year in which the KPI was tracked for the combined company. For the 2024–2026 target period, a growth trajectory has been defined. The target for 2025 is set at a minimum of 80, and for 2026 at a minimum of 85.
Employee engagement3

During 2025, employee engagement further decreased to the 71st percentile, reflecting the effects of the integration with Aegon NL, which was completed this year. Significant differences in scores can be observed between business units. Business units where the integration has already been completed score considerably higher than those where the integration has only recently begun or has yet to start. A more recent shortened survey conducted in January 2026 measured an increase to the 77th percentile, indicating a shift in sentiment.
Sustainable reputation
a.s.r.’s sustainable reputation score is crucial for its corporate strategy and market positioning. The survey, conducted by an independent expert organisation, measures the score on the following attributes: honesty, sustainability, reliability, and social responsibility. This KPI shows a.s.r.'s score based on surveys under Dutch people aged 18 to 65 years, with respondents giving a score per attribute of between 0% and 100%. The target is to achieve a score of 38-43% in the period 2024-2026.
Sustainable reputation

The sustainable reputation score rose to 41% in 2025 (2024: 39%), remaining within the target range of 38–43%. The increase is supported by campaigns that focus on sustainable damage repair and the collaboration with the Royal Dutch Walking Association (Koninklijke Wandelbond Nederland - KWbN). These campaigns contributed to the strategic pillars Sustainable living and climate and Vitality and sustainable employability.
Gender diversity
a.s.r. strives for a workforce that reflects society. Studies show that diversity in the workforce provides broader perspectives and enriches decision-making. The diversity target applies to employees in management positions and aims for at least 40% women and at least 40% men within the Supervisory Board (SB), Management Board (MB) and management by 2026. Management includes senior, higher and team management. For more information on gender diversity in a.s.r.'s workforce, see section 6.3.1.
Supervisory Board

Management Board

Management

On Supervisory Board (SB) and Management Board (MB) level, the gender diversity remains unchanged. On management level, gender diversity improved slightly towards the target level of at least 40% at end of 2026. In 2025, initiatives were taken to further improve gender balance such as an adjusted hiring procedure and additional part-time options.
- a.s.r. explanatory notes to Alternative Performance Measure - Non-financial targets 2024-2026.
- Please note the 2024 figure represents the Q4 baseline value.
- Based on the most recent pulse check assessment from January 2026. The annual extensive culture scan, conducted in February 2025 had 71 as a result.
2.4.2 Material sustainability topics and connectivity
Introduction
As previously outlined, a.s.r.’s strategic agenda includes the three sustainability pillars where a.s.r. can make the greatest impact: Financial self-reliance and inclusion, Vitality and sustainable employability and Sustainable living and climate.
A key element of a.s.r.’s sustainability strategy is to identify the topics where the organisation has the greatest impact and which are most relevant to its business and stakeholders. To achieve this, a.s.r. regularly conducts a Double Materiality Assessment (DMA). This assessment considers both perspectives: the potential impact of a.s.r. on people and the environment (the ‘inside-out’ view) and the risks and opportunities that sustainability topics may present for a.s.r. itself (the ‘outside-in’ view).
By applying this double perspective, a.s.r. obtains a comprehensive picture of the sustainability issues most material to its long-term strategy. The 2025 update of the assessment resulted in ten material sustainability topics that represent a.s.r.’s most important impacts, risks and opportunities. For more details on the assessment and its outcomes, see sections 6.1.4.2. and 6.1.4.3.
To advance its strategy, a.s.r. has set specific targets to ensure strategic alignment and maintain focus. This balanced approach combines both financial and non-financial objectives. For more information, see section 2.4.1.
a.s.r. aims to contribute to a number of the the United Nations Sustainable Development Goals (SDGs) where they are connected with its strategic pillars. For more information on how a.s.r. contributes, see section 8.3.
Connectivity matrix
The elements of a.s.r.'s strategy are closely interconnected, with the three strategic pillars guiding actions to create long-term value for customers and intermediaries, employees, shareholders, and society. This integrated approach enables a.s.r. to address its most material impacts, risks and opportunities, while driving progress on strategic targets. The table on the next page illustrates the connectivity within a.s.r.'s strategy between the strategic pillars, the key stakeholders served by a.s.r., material topics identified through the DMA, strategic targets and contribution to the SDGs.
Connectivity matrix12
| Strategic pillars and guiding principles | Stakeholder | Material topic | Strategic targets | Progress 2025 | SDGs |
|---|---|---|---|---|---|
| Financial self-reliance and inclusion |  | Equal treatment and opportunities for all | Gender diversity | 34% female in Top management |   |
 | Consumers and end-users | Impact investing NPS-i | 10.1% 25.0 |   | |
 | Affected communities | - | - |  | |
| Vitality and sustainable employability | | Own workforce | Employee engagement | 773 | |
| Workers in the value chain | - | - | - | |
| Sustainable living and climate | | Climate change | Carbon footprint reduction | 8.6% | - |
| Impact investing | 10.1% |   | |||
| Biodiversity and ecosystems | Carbon footprint reduction | 8.6% |  | |
| Impact investing | 10.1% | | |||
| Resource use and circular economy | - | - | | |
| Upholding standards | | Business conduct and corporate culture | - | - | |
| Value over volume, cost-efficient and financially robust |  | - | Solvency II ratio | 218% | - |
| Organic capital creation | € 1,315 million | ||||
| Operating return on equity | 14.1% | ||||
| Dividend per share | € 3.41 | ||||
| Share buyback | € 230 million | ||||
| Combined ratio (P&C and Disability) | 92.2% | ||||
| Revenue growth (P&C and Disability) | 3.0% | ||||
| Pension buy-outs | € 2,810 million | ||||
| Pension DC inflow | € 3,011 million | ||||
| Annuities | € 646 million | ||||
| Fee-based business operating result | € 186 million |
- This connectivity matrix serves as overview of how a.s.r.'s strategy, stakeholder groups and material topics are connected. Please note that other connections that are not shown in this matrix may exist as well.
- Please note that the strategic target Sustainable reputation is an overarching target that cannot be linked directly to one or more material topics, and is rather an outcome of the efforts on all its material topics. For more information about this strategic target, see sections 2.4.1.2 and 6.5.
- Based on the most recent pulse check assessment from January 2026. The annual extensive culture scan, conducted in February 2025 had 71 as a result.
- Section 2.4.2 is in scope of CSRD and limited assurance (ESRS 2 SBM-1).
2.5 Trends and developments
Global and regional trends and developments continue to influence the environment in which a.s.r. operates. a.s.r. aims to adapt to these evolving circumstances and remains proactive in addressing risks and opportunities associated with these changes. Sections 5.4 and 7.8 provide further detail on the risk management approach, which forms an integral part of a.s.r.’s day-to-day operations. The trends and developments discussed in this section highlight the market dynamics most relevant to a.s.r., their impact on stakeholders and the organisation's response to these changes.
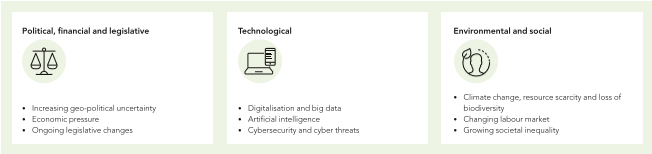
2.5.1 Political, financial and legislative
a.s.r. has identified three pivotal trends shaping the industry in the current political and financial market landscape:
Increased geopolitical uncertainty due to conflicts in several areas in the world, and recent election results affect international stability and increase trade tensions.
Economic pressure from wage increases, inflation, rising housing prices, and increasing labour shortages is significant.
Impact of legislative developments, such as the Future Pensions Act (Wet toekomst pensioenen - Wtp), sustainability regulations, Solvency II review and the European Artificial Intelligence (AI) Act.
Impact on a.s.r. and its stakeholders
Persistent inflation, volatile interest rates and geopolitical uncertainty have led to tempered growth projections of around 3% for the global economy. Although a decline in inflation is expected, it remains moderate to high, especially in the Netherlands. Uncertainty persists due to volatile interest rates and recession fears. Customers face uncertainty regarding resources, security and purchasing power, but this also might raise concerns about the stability and profitability of a.s.r.
Changes in the regulatory and supervisory environment could lead to stricter oversight and more frequent investigations, whilst many new regulations need to be interpreted and implemented within a short period of time, though not all regulations are final yet. The evolving regulatory landscape leads to increased internal costs and demands swift implementation of new rules. In the near term, the Wtp reshapes the Dutch pension market. Smaller insurers and intermediaries may struggle to comply with these developments, potentially leading to market consolidation and growth opportunities for a.s.r. Political pressure, especially from US stakeholders, challenges sustainability and diversity commitments.
a.s.r.'s response
a.s.r. assesses geopolitical developments and explores various potential economic scenarios. Financial planning includes scenario analysis and stress testing to ensure resilience under various macroeconomic conditions, while maintaining a cautious yet forward-looking approach in its capital allocation. a.s.r. aims to further diversify its investment portfolio; for more information, see section 7.8. In response to heightened protectionist policies, a.s.r. reviews operational dependencies and supplier risk exposure. Additionally, a.s.r. may adjust premiums, while remaining an affordable insurer for its consumers.
As pension funds reassess their strategic options under the new legislation, a.s.r. is well‑positioned to support them with de‑risking solutions such as full and partial buy‑outs, leveraging its expertise and ability to offer long‑term security for participants.
a.s.r. monitors and assesses relevant legislative and regulatory developments and implements appropriate control measures. To manage regulatory changes, a.s.r. initiates programmes for their implementation (e.g. CSRD, DORA, European AI Act). a.s.r. remains committed to ESG goals despite international developments, whilst closely monitoring the international regulatory climate to ensure alignment and credibility. For more details, see section 6.
2.5.2 Technological
The following three technological trends have the greatest impact on a.s.r.'s operating environment.
Digitalisation and big data continue to drive regulatory changes to balance innovation, customer protection and financial stability.
AI promises to deliver speed and simplicity in business processes and insurers are experimenting and implementing cost-efficient technologies at a faster pace, with the potential of gaining an competitive advantage.
Cyber security and cyber threats remain persistently high, which has resulted in new or renewed cyber and information security requirements, as well as data-focused legislation, including the DORA and the European AI Act.
Impact on a.s.r. and its stakeholders
Technological innovations are key for competitiveness and enable better services and efficiency, enhancing customer experience for clients for a.s.r. Generative AI and artificial general intelligence are reshaping services and risk modelling in the insurance industry. Insurers are developing and implementing cost-saving technologies in areas such as claims management, underwriting, risk prediction and customer contact moments. However, greater cloud presence and data sharing increase cyber risks, such as data leaks, hacks and social engineering. The increased risk of cyber attacks make financial institutions more vulnerable to cyberattacks1. Financial institutions are expected to accelerate automation and decision-making, while also raising new ethical, regulatory and operational considerations for insurers like a.s.r.
For customers, technological innovation leads to easier access to products and better customer service on the one hand, and to increased risk of cybercrime on the other2. Customers might also feel overwhelmed or dissatisfied with the shift towards digital services, which in turn might impact the customer experience.
The Dutch Central Bank (De Nederlandsche Bank - DNB) has warned the financial sector about increased cyber risk linked to geopolitical instability3, potentially leading to data breaches, financial losses and damage to reputation. In 2025, these global dynamics continued to evolve.
a.s.r.'s response
a.s.r. actively adopts AI and technological developments for automation and customer interaction, taking ethical, regulatory, security and sustainability considerations into account. Its customer contact strategy incorporates the requirements of the new European Accessibility Act and ensures consistent service, supported by tools such as chatbots that help claim handlers locate relevant policy provisions and generate draft responses to questions from customers. Another example is the digitalisation strategy of a.s.r. health, which has made significant progress in both digitalisation and the application of AI. For further details, see section 4.2.4. This strategy provides a strong foundation for broader application across a.s.r.
Cyber resilience is priority for a.s.r. It implements internal and supplier controls, collaborates with National Cyber Security Centre (NCSC) and the Digital Trust Centre (DTC), and invests in prevention, detection and response technologies. Awareness is being raised through gamification and phishing campaigns. For details, see section 5.4.3.
- Source: BCG (2024)
- Source: DNB (2024)
- Source: DNB (2024)
2.5.3 Environmental and social
a.s.r. outlines three key environmental and social trends that impact the company and its stakeholders.
The ever-increasing importance of climate change, resource scarcity and loss of biodiversity, and risks related to insurance coverage gaps.
In the Netherlands, the declining population growth rate and ageing population are putting pressure on the labour market and have led to reforms of pension and self-employment legislation, such as the Employment Relationships Deregulation Act (Wet Deregulering Beoordeling Arbeidsrelaties - DBA).
Impact on a.s.r. and its stakeholders
Environmental risks affect insurability and investment strategies. Physical risks (e.g. extreme weather) and transition risks (e.g. regulation changes and technological developments) challenge traditional insurance models, raising critical questions about insurability and risk-sharing mechanisms. This can lead to higher claims and increased insurance costs, and as a result policyholders might face higher premiums. Additionally, environmental risks potentially affect the value of a.s.r.'s investment portfolio.
The labour market remains tight due to an ageing workforce, alongside a growing demand for new skills, resulting from the technological developments described in section 2.5.2. Although partly offset due to the new DBA, the rise in self-employment and freelancing is affecting labour market dynamics, employment ratio and the demand for pension and disability products. The DBA is also raising uncertainties on income security and is having an impact on how self-employed workers look at pension and disability products.
a.s.r.'s response
a.s.r. aims to minimise its climate impact and contribute to climate change mitigation and adaptation. a.s.r. integrates considerations of climate change, resource scarcity and biodiversity loss into its investments, products and services. To manage transition risks, a.s.r. collaborates with knowledge partners to learn about and apply technological insights in risk management, client acceptance and pricing. For details, see section 7.8.1.2.
Intensifying climate events challenge insurability and risk-sharing. a.s.r. responds by innovating product design and pricing, and investing in data-driven risk modelling. Scenario analysis and stress testing are used to assess portfolio resilience under various climate pathways. On the other hand, a.s.r. engages in public discussions about the insurance protection gap that arises as a result of the increased environmental and social risks.
a.s.r. seeks the best solution for every capacity requirement through total workforce management. Solutions vary between hiring new and permanent employees or flex workers, or internal staff movements resulting from the Aegon NL integration or talent planning.

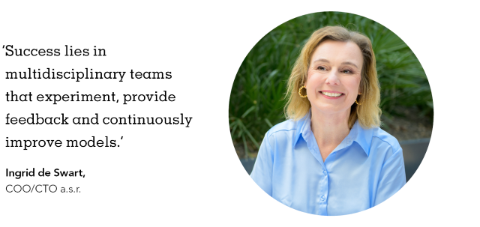
Interview: Ingrid de Swart on Artificial Intelligence
Interview: Ingrid de Swart on Artificial Intelligence
Artificial Intelligence: from
exploration to acceleration
COO/CTO Ingrid de Swart describes 2025 as 'a pivotal year' when asked about Artificial Intelligence (AI). In January, the Management Board (MB) and Board of Directors attended an intensive AI programme at INSEAD. ‘For three days, we immersed ourselves in this technological development. Inspired by its opportunities, we concluded that this is something worth pursuing.’
In the months that followed, large groups of employees received training, INSEAD professors gave lectures, and colleagues developed practical AI use cases. These range from customer service and employee self-service to applications at the core of the organisation, such as the Smart Claims Assistant (SCA). ‘This in-house developed tool enables personal injury claims handlers to locate information faster in complex files through a smart summary with references. Integrating technology into the claims process affects one of the insurer's key activities. The SCA is fast and delivers high-quality output. Because personal injury claims handlers are scarce, the solution helps maintain quality and timeliness. Employees using it are very enthusiastic.’ To stimulate further development, the MB asked itself in Q3 2025: how can the use of AI be accelerated?
And what was the answer?
‘Technology alone is not enough. The existing organisation must adapt. This requires changes in working practices, new skills and close collaboration between business and technology.’
That sounds like considerable changes lie ahead for employees.
‘That is correct, which is why employee involvement is essential. Through an extensive AI development programme, employees learn how AI can help them in their work. I strongly believe that our work will change for the better. With the SCA, for example, time spent on repeatedly familiarising themselves with files is reduced, creating more time for substantive tasks. This makes work more engaging. At the same time, it is important that AI does not make work monotonous, which is why tasks are combined thoughtfully. Strategic workforce planning shows that, through natural attrition and talent development, there is sufficient capacity to absorb change. This approach ensures employees grow alongside these developments.’
What opportunities do you see for applying AI in services to customers and advisers?
‘The SCA shortens processing times for customers. A similar solution exists in Health, where a knowledge management system functions as an intelligent Q&A. Employees can ask questions about specific types of cover, and the system provides accurate information quickly. This ensures consistent, high-quality responses to customers. Our measurements show that customer satisfaction in Health is increasing faster than elsewhere in the organisation. Such systems can also support advisers by enabling quick responses to their questions, allowing them to focus on customer contact. Ultimately, this contributes to higher customer satisfaction and stronger cooperation with intermediaries.’
How does a.s.r. guarantee personal attention for customers in a digital world?
‘Tasks such as address changes, what we call low-impact contact, should be fast and simple. However, customers dealing with high-impact situations, such as damage after an accident or a mortgage application, need a human approach. Automating straightforward processes with AI frees up time for employees to support customers who need expertise and empathy. AI also help us add value for customers by enabling more personalised engagement, for example by approaching customers based on specific characteristics, such as age.’

In what way can AI improve a.s.r.’s sales channels?
‘Since our training at INSEAD, efforts have accelerated. With the establishment of a new Online Unit, direct and digital sales have become a strong focus. Customers, particularly younger ones, expect convenience and speed. We are therefore investing in a fully online experience, improving the customer journey through enhanced online propositions, streamlined sales funnels and strengthened digital customer service. Work is carried out in multidisciplinary teams, with collaboration across product lines central to accelerating the strategy with AI.’
Can you elaborate?
‘Initially, each business unit had its own approach to AI. Understandable, but it limited opportunities to learn from each other and to benefit from economies of scale. Returning to the SCA: if it works for P&C, why not explore similar solutions for Disability or Mortgages? The same applies to pricing. Dynamic pricing is used in Pensions, and now AI enables customised pricing in Disability. Sharing knowledge and working together accelerates progress and avoids duplication. AI also strengthens collaboration between business units and IT. Success lies in multidisciplinary teams that experiment, provide feedback and continuously improve models. This enables the organisation to maximise the potential of technology - controlled, yet with courage to innovate.’
Innovation costs money. Is AI already delivering a return on investment?
‘At use-case level, the benefits are already visible. Faster and more efficient processes reduce costs and increase employee and customer satisfaction. The SCA also helps reduce claims costs. I am convinced that AI can accelerate a.s.r.’s strategy, facilitate growth and further strengthen competitiveness. Investments in cloud solutions and data infrastructure make AI deployable across the organisation. This requires time and resources, but the potential impact is substantial.
At the same time, AI brings challenges, including energy use and broader implications for people and processes. That is why a.s.r. makes conscious choices guided by ethical principles, human oversight and sustainability ambitions. By optimising processes and increasing scalability, AI helps reduce operational costs and contributes directly to long-term value creation for our stakeholders. I expect 2026 to be an important year in which this impact becomes truly visible. AI will also be addressed during a.s.r.’s Capital Markets Day in 2026, where the organisation will share its developments on this topic.’
This page is intentionally left blank.

3 How a.s.r.
operates
3.1
Becoming the best financial service provider 
Complaints management(score between 0-10)8.1 2024: 8.4 | Complaints fully handled(in %)70 2024: 74 | Engagement by topic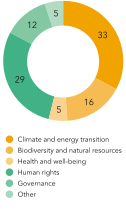 |
Impact investments(in % of total AuM)10.1 2024: 8.7 | NPS-i(-100 to 100)25.0 2024: 18.41 | |
Green lease contracts(as % of total new contracts)100 2024: 99 | Increase of average energy label(in energy label steps)1.8 2024: 1.6 | |
| 1 Please note that the 2024 figure represents the Q4 baseline value. |
a.s.r. aims to create long‑term value for its key stakeholders: customers, employees, shareholders and society. a.s.r. strives to be the best financial service provider for its customers and intermediaries. It offers simple and transparent products and services that meet customers’ needs, including sustainable solutions. To become the best in the industry, a.s.r. embraces technological developments and applies them where they add value. a.s.r. is data‑driven and incorporates customer feedback into its decision‑making. By leveraging technological innovations, including Artificial Intelligence (AI), a.s.r. continuously improves its services. Society can expect a.s.r. to integrate social and environmental objectives into its strategy.
3.1.1 Business conduct
3.1.1.1 Customer focus
Customer research
Beyond price and product quality, consumers are increasingly aware of social and environmental challenges such as climate change and inequality. These concerns influence their purchasing behaviour, including their choice of financial service providers. To remain aligned with customer expectations, a.s.r. conducts ongoing research into consumer attitudes, focusing on topics such as sustainability, inclusivity and responsible business practices. This provides valuable insights that help guide product development.
NPS-i
To measure customer loyalty and improve service quality, and to gain insight into customer interactions across all channels, a.s.r. measures the interaction Net Promoter Score (NPS‑i). This unified metric combines offline interactions (NPS‑c) and digital interactions (NPS‑d) into a single consolidated score, enabling real‑time insights at key moments in the customer journey. This approach supports the continuous improvement of both digital and employee‑assisted interactions with customers.
The growth ambition for NPS‑i over the next two years is an increase of 4 points, from a baseline of 18.41 to 22.4 by the end of 2026.
NPS-i2

Key developments in 2025
In 2025, a.s.r. made further progress in strengthening customer centricity and improving the customer experience across online and offline channels. The NPS‑i increased from 18.4 in 2024 to 25.0 in 2025, with and NPS-d score of 6.4 and the NPS-c score of 53.6.
The NPS‑c remained consistently high during 2025. The completion of major migrations, including those for Individual life & Funeral, Pensions and Mortgages, resulted in enhanced data consistency and improved support for customer processes. These developments are a prerequisite for reliable and personalised customer service.
The NPS-d continued to improve in 2025, supported by targeted optimisations in customer journeys and the implementation of several content-related quick wins. Digital self-service usage was further strengthened by AI-enabled applications. These developments contributed to improved navigation, higher levels of self-service and greater consistency across digital touchpoints.
For the results specified by business line, see section 9.2.4.
Strengthening the digital customer experience
The target for the NPS‑i has been achieved. As more processes become digital, the NPS‑d will have an increasing significant influence on the overall NPS‑i score. Therefore, a.s.r. focuses on further improving the digital experience, completing the remaining migrations and safeguarding data quality remains essential in 2026 to realise the stated ambitions.
In 2026, the emphasis will be on improving the NPS‑d. a.s.r. aims to expand the use of AI as an accelerator to enhance the customer experience, making processes smarter, more efficient and more scalable by increasing self‑service options and enabling straight‑through processing.
Raad van Doen: Involving customers and advisors
The Raad van Doen is an online panel where customers, advisers and entrepreneurs actively contribute to shaping a.s.r.’s products, services and communications. The panel includes approximately 8,000 participants who regularly take part in short surveys, tests and co-creation sessions. Their feedback provides valuable insights that directly supports improvements in customer journeys, product development and sustainability initiatives, ensuring that decisions truly reflect customer needs.
In 2025, a.s.r. expanded the Raad van Doen with an Entrepreneurs Panel to better align with the needs of self‑employed professionals, SMEs and employers. Their contributions help ensure that a.s.r. delivers relevant, user‑friendly and future‑proof solutions for all customer groups.
The Digital Programme
As customer engagement methods and business processes become increasingly digitalised, a.s.r. aims to deliver effective customer interactions and operational efficiency. This approach seeks to reduce costs through AI-driven process efficiency, improve customer experience (NPS-i), and drive growth through direct and intermediary channels.
This ambition is built on three main pillars:
Standardising customer communication channels: Unified service touchpoints create a consistent customer experience across business lines.
Reducing low-impact interactions: Smart self-service and proactive communication help to avoid unnecessary contact.
Providing optimal high-impact interactions: Personal, empathetic service for complex customer situations where human interaction is valued by the customer.
Key developments in 2025
In 2025, a.s.r. implemented and expanded several core digital enablers to support data-driven and customer-centric operations. Key initiatives included the development of Master Data Management to ensure consistent data quality across systems, and the enhancement of Customer Relationship Management (CRM) through a cloud-based omni-channel contact centre and CRM platform. Additionally, a Top Task Dashboard was developed to optimise key customer journeys. To enable innovation and support the AI roadmap, a.s.r. increasingly leverages the public cloud. In 2025, a.s.r. embarked on an ambitious multi-year journey to migrate all workloads to the public cloud. This transition will facilitate innovation, improve efficiency and enhance IT security.
During the integration of Aegon NL, special attention is given to digital customers through the ‘Warm Welcome’ programme, designed to retain them as users of a.s.r.'s services. In recognition of these efforts, a.s.r.’s customer website was rated most popular in the Insurers category of the Website of the Year (Website van het Jaar) 2025 awards. This external acknowledgement reflects the ease of use and the trust customers place in a.s.r.’s digital channels, underscoring the success of a.s.r.’s digitalisation strategy and its ambition to provide exceptionally intuitive and personal services.
Finally, to enhance readability, a.s.r. has aligned its consumer website with Dutch B1 language level.
- Please note the 2024 figure represents the Q4 baseline value.
- Please note the 2024 figure represents the Q4 baseline value.
3.1.1.2 Prevention of payment problems
a.s.r. makes considerable efforts to ensure that its customers are financially self-reliant and aims to minimise the number of policy cancellations caused by payment arrears and related issues. The organisation takes proactive measures to prevent situations where customers incur additional costs and it strives to avoid payment defaults.
a.s.r.'s memberships and coalitions enable cross-sector knowledge sharing, helping to improve customer processes and services related to payment problems.
For several years, a.s.r. has been part of the Creditors' Coalition (Schuldeiserscoalitie) and a member of the Dutch Debt Assistance Route (Nederlandse Schuldhulproute - NSR). The Creditors' Coalition works proactively to find solutions for customers with payment arrears. NSR provides debt assistance through various activities, including Geldfit, a national initiative focused on effective referral to financial support organisations at the local level. Customers gain insight into their financial situation through a simple online test. This anonymous test offers targeted support to help customers getting their financial affairs in order.
a.s.r. is committed to contributing to a financially healthy society through collaborations with initiatives such as SchuldenlabNL and the National Coalition for Financial Health (Nationale Coalitie voor Financiële Gezondheid - NCFG). In 2025, these foundations merged into the new Financially Healthy Netherlands Foundation (Stichting Financiële Gezondheid Nederland - SFGN) to jointly enhance their impact in reducing financial stress and debt.
In March 2025, a.s.r. signed the Socially Responsible Debt Collection Framework (Afsprakenkader Sociaal Incasseren), an agreement between organisations on how to treat private individuals in debt situations. The framework, established by SFGN, aims to improve the financial health of Dutch society by promoting a socially responsible, preventive and humane approach to debt collection.
The principles defined in the framework form the basis of a.s.r.’s Policy on Socially Responsible Debt Collection (Beleid Sociaal Incasseren). Established in 2025, the policy sets out guidelines for the social conduct of the debt collection process within a.s.r. and complements the operational processes of the product lines. The policy provides a solid foundation for socially responsible debt collection for private customers and contributes to the pillar Financial self-reliance and inclusion.
The policy applies to ASR Nederland N.V. and its subsidiaries. This includes the following product lines: P&C, Disability, Health, Individual life & Funeral, Mortgages and Real Estate. The policy does not apply to D&S Holding or its subsidiaries.
To support customers in preventing or resolving repayment problems, employees are trained to recognise financial difficulties and refer customers for appropriate advice.
3.1.1.3 Complaints management
a.s.r. aims to be the best financial service provider, with the highest percentage satisfied customers and advisors. Complaints management is a strategic instrument that helps strengthen customer relationships, improve processes and achieve sustainable customer satisfaction. a.s.r. sees complaints not as a burden, but as a valuable source of insight.
The core principles and objectives of a.s.r.’s complaints management:
a.s.r. is open to complaints and makes it easy for customers to submit a complaint.
a.s.r. communicates its view and proposed solution in a comprehensible manner.
a.s.r. actively learns from complaints.
The Complaints Management team monitors the implementation of a.s.r.’s Complaints Policy and manages the complaints procedure. The handling of complaints is decentralised within the organisation, at the relevant business line or staff department.
As complaints handling requires specific knowledge and skills, complaints handlers regularly attend training courses in customer service. In 2025, customers gave a.s.r.’s complaints handlers an average score of 8.1 on a scale of 1-10 (2024: 8.4).
Assigned and rejected complaints
The figure 'Complaints settled' shows the number of ‘assigned/rejected’ complaints. a.s.r. categorises received complaints as follows:
Assigned complaints are either partially or fully justified complaints.
Rejected complaints are either unjustified complaints (complaints classified by a.s.r. as unjustified) or unfounded complaints (complaints that are not intended for a.s.r.).
Complaints settled

Complaints handled, from customer's perspective1

Learning from complaints
To further improve customer satisfaction, it is essential for a.s.r. to continuously monitor the customer experience. Complaints from customers and advisors are an important source of information in this regard. Within Individual life & Funeral, a new approach has been developed to systematically register and address learning points from complaints. This approach strengthens the customer perspective by providing insight into what customers experience and expect, highlighting where processes can be improved.
By structuring learning points according to the fixed elements of complaint description, customer perception, root cause and concrete improvement point, a.s.r. generates actionable information and ensures not only that complaints are resolved carefully, empathetically and personally, but also that they lead to structural improvements in processes and customer experience. This approach inspires other business units to adopt similar practices.
Collective complaints related to Israel and Gaza
Approximately 1,500 automated, collective complaints were received in 2025 in response to public debates concerning Israel and Gaza. These complaints raised concerns about a.s.r.’s investments in companies operating in territories occupied by Israel and about the preferred medication policy involving a pharmaceutical manufacturer of Israeli origin. a.s.r. responded carefully to each complaint by providing explanations of the applicable policies and regulatory obligations.
Complaints related to human rights
a.s.r. applies a transparent complaints process, including for human rights matters, in which all complaints are registered, assessed and followed up in accordance with applicable policies and relevant laws and regulations.
In 2025 a.s.r. received 29 individual complaints concerning potential human rights violations related to its business activities. These complaints addressed issues such as limited accessibility of services for individuals who are unable to communicate by telephone, unequal treatment resulting from age-based restrictions, incorrect registration of personal names, and technical or procedural matters perceived as unfair or exclusionary. Each complaint was assessed and addressed on an individual basis. In nine cases, the customer's position was upheld and follow-up actions were taken to resolve these. None of the complaints resulted in identified human rights violations or incidents.
- Displays the percentage of complaints that were fully, partially or not fully resolved, and the clarity of the follow-up for the complainant.
3.1.1.4 IT and the digital strategy
Focus on IT security
Safeguarding information is essential to a.s.r.’s long-term value creation for customers, employees, society and shareholders. As digital threats continue to evolve, ranging from ransomware and data breaches to sophisticated social engineering, IT security plays a vital role in ensuring the continuity and reliability of a.s.r.’s services.
Security awareness and governance
To maintain a high level of cyber resilience, a.s.r. actively monitors technological developments, including the rise of artificial intelligence and relevant developments related to Quantum Computing, and assesses associated risks. a.s.r. invests in detection, protection and response capabilities. Employee awareness programs highlight individual information security responsibilities, and employees receive regular training to recognise and respond to threats such as social engineering.
This strategic approach ensures that a.s.r. remains well-prepared for emerging risks, while continuing to protect personal data, meet regulatory requirements and uphold stakeholder trust.
In 2025, no significant cybersecurity incidents involving a.s.r. systems took place.
a.s.r. has obtained an ISAE 3000 Type II assurance report for the central IT department's service provision to the various business segments for 2025. The external auditor concluded that the internal controls relating to the control objectives, outlined in the description of the IT service system, were suitably designed. Additional external cyber security assessments are conducted on a regular basis.
IT security is embedded in a.s.r.’s governance structure. The Information Security Policy is approved by the Non-Financial Risk Committee and the Risk Committee. The Chief Information Security Officer (CISO) reports to the CEO via Group Risk Management and serves as secretary to the NFRC. Cyber security is regularly on the agenda for the Management Board and Supervisory Board.
DORA
As of 17 January 2025, a.s.r. has implemented the legal requirements of the Digital Operational Resilience Act (DORA). In line with the DORA pillar on third-party risk management, a.s.r. has reinforced its information security requirements for suppliers and external parties. Throughout 2025, the last remaining DORA-related actions were addressed as part of business-as-usual operations. This includes ensuring that a.s.r. is able to demonstrate its ongoing compliance with DORA requirements through the effective operation of the related controls.
Innovation and AI
AI is rapidly transforming the financial services sector. For a.s.r., AI is not just a technological trend; it is a strategic enabler that supports scalable, cost-effective growth and helps deliver long-term value to customers, employees, shareholders and society. a.s.r. embraces innovation with discipline and purpose, ensuring that AI is applied where it creates real value and aligns with the organisation's priorities.
Strategic use of AI
In 2025, all senior staff at a.s.r. participated in training programs delivered by INSEAD, focused on how AI can transform business operations. This marked the start of a structured approach to AI adoption, including the development of a portfolio of initiatives aligned with a.s.r.’s overall business strategy. These initiatives aim to reduce costs, improve customer and employee satisfaction, and support the achievement of commercial objectives.
The strategic AI portfolio is applied in the online insurance market by multidisciplinary teams, through piloting and scaling digital-first insurance solutions. With a high priority for change management, enabling seamless customer journeys, from policy onboarding to claims settlement, with a strong focus on minimising customer effort and enhancing user satisfaction. By continuously innovating in the online domain, a.s.r. ensures it remains at the forefront of the evolving digital insurance market.
In 2025 a.s.r. has implemented several solutions with AI, such as call registration and analysis, support for claims handling and pricing optimisation, as well as solutions aimed at improving efficiency in the organisation without directly impacting customers. AI and process improvement initiatives free up customer services employees’ valuable time, which they can dedicate to customer contacts too add more value.
AI as a digital team member
a.s.r. believes that successful AI adoption requires organisational change and workforce engagement. AI will become a digital team member that requires training, guidance and integration. The expertise of a.s.r.’s employees remains a key driver of the organisation's performance. By combining skilled professionals with effective AI solutions, a.s.r. enhances productivity and decision-making across the organisation.
Responsible and ethical AI
a.s.r. has developed policies for the ethical and responsible use of data and AI, and adheres to the ethical framework of the Dutch Association of Insurers (Verbond van Verzekeraars). This framework guides how insights are applied to products and services, ensuring that customer interests are paramount. In applying these principles, a.s.r. places strong emphasis on preventing discrimination and exclusion, safeguarding the accessibility of applications for vulnerable groups, and upholding customers’ autonomy, self‑determination and privacy.
Responsible data collection and use are essential to maintaining customer trust, including careful consideration of the context in which data is gathered and ensuring that insights are applied in a way that is appropriately tailored to products and services.
AI applications are implemented only when appropriate governance, monitoring and compliance measures are in place. Data integrity is supported by a dedicated quality programme and lineage tooling. Bias is mitigated through rigorous testing and transparent methodologies, and users are enabled to recognise AI‑generated content. In 2025, a session for data stewards strengthened practical application of the framework and awareness of data ethics.
While AI offers significant opportunities, a.s.r. actively manages associated risks, including environmental impact. This is addressed through sustainable vendor selection and robust oversight.
3.1.1.5 Personal Data Protection
As a financial service provider, a.s.r. regards the protection of personal data as a core responsibility. Safeguarding the personal data of customers, employees and other stakeholders is critical to upholding trust and complying with ethical and legal requirements.
a.s.r. is committed to protecting personal data. At the same time, the organisation recognises that such data constitutes a valuable asset for enhancing customer service, optimising business processes and supporting data-driven decision-making.
Operational responsibility for privacy compliance lies with the first line, supported by the central Privacy Office (PO). This office was established in 2024 to coordinate the Privacy Policy, provide guidance and facilitate implementation across business units. The Data Protection Officer (DPO) operates independently of the first line and the Compliance Department. For more details regarding the Compliance Department, see section 5.5.
In 2025, the PO initiated the development and deployment of the new Privacy Control Framework (PCF), which establishes minimum standards for privacy risk management and control activities.
- Section 3.1.1.5 is in scope of CSRD and limited assurance (ESRS S1, S4).
Standards for processing personal data
a.s.r. enforces robust internal privacy standards for handling personal data across all operations and business units. For data processing, a.s.r. complies with the General Data Protection Regulation (GDPR) and takes other legal requirements into account, such as the AI Act and DORA. Suppliers and partners are contractually required to meet these standards, and this is regularly reviewed.
In specific cases, such as fraud detection, a.s.r. follows sector protocols, including the Insurers and Crime Protocol (Protocol Verzekeraars en Criminaliteit) and the Financial Institutions Incident Warning System Protocol (Protocol Incidenten-waarschuwingssysteem Financiele Instellingen).
a.s.r.’s Privacy Statement includes the purposes of processing, the legal grounds, the recipients of the data, the retention period, the rights of data subjects and information about a.s.r.’s contact details. Through this comprehensive and transparent privacy statement, a.s.r. ensures that individuals are well informed about the processing of their personal data.
a.s.r. deletes data after a predefined period and does not sell personal data to third parties. Furthermore, a.s.r. only collects third-party data where appropriate and necessary to serve its customers, always ensuring that such collection is conducted in accordance with applicable regulations, including the GDPR.
a.s.r.'s Privacy Policy includes defined standards and processes to ensure lawful, transparent data processing, with embedded procedures and tools supporting ongoing compliance and improvement. Privacy impact analyses and risk assessments are mandatory for new or amended data processing activities, enabling the early and proactive identification and mitigation of privacy risks.
Another integral part of the Privacy Policy is the formal process for data breach notification and handling. Data breaches are managed by a dedicated team following established procedures, ensuring prompt assessment and notification to the Dutch Data Protection Authority (Autoriteit Persoonsgegevens - AP) and affected individuals when required. This process is reviewed regularly for effectiveness.
Regular internal audits and reviews ensure the effectiveness of privacy processes and controls. Outcomes and risks are reported to management and governing bodies to maintain oversight and drive improvements. By maintaining standards, processes and tools, including privacy assessments, a.s.r. proactively and reactively manages privacy risks and ensures ongoing compliance with changing legal and regulatory requirements.
Key developments in 2025
The Privacy Policy was further operationalised in 2025 through practical manuals and guidance documents to support consistent application across business units and suppliers. Additionally, a.s.r. introduced a new online tool in 2025 to simplify the way individuals can exercise their privacy rights. In addition, a dedicated ethical framework session was held for data-stewards, to further foster awareness and responsible data use.
Data breaches and complaints in 2025
Measuring and reporting data breaches and complaints is an important reactive measure to strengthen data protection, minimise the impact on affected individuals, ensure ongoing compliance with privacy requirements and reduce the risk of further breaches.
In 2025, internal processes for breach handling were optimised to improve timeliness and consistency. The number and nature of breaches are reported quarterly to senior governance bodies, including the Management Board (MB), Risk Committees and the Supervisory Board (SB).
Raising awareness of these procedures, and of the importance of taking due care when processing personal data to avoid breaches, falls under the awareness programme. Most breaches result from human errors, outdated postal addresses and lost mail items. a.s.r. takes targeted measures to address these root causes, such as process reviews and system improvements.
In 2025, 158 data breaches related to Personal Identifiable Information (PII) were reported to the AP (2024: 134). According to privacy regulations, the Dutch data protection authority must be notified of data breaches that present a probable risk to the affected individuals. a.s.r. took measures to mitigate any risks for the individuals concerned and has no reason to expect any of the reported breaches to have a serious impact for those involved.
Complaints about privacy issues enable a.s.r. to refine processes and boost privacy compliance. a.s.r. has noted a growing awareness of privacy among customers, resulting in an increase in questions and complaints. In 2025, a.s.r. received 203 complaints from customers and third parties, including two from a regulatory body (2024: 190 including three complaints from a regulatory body). Most complaints related to data breaches, and many of these were individuals exercising their privacy rights, such as the right of access and the right to be forgotten.
Complaints relating to customer privacy received from customers and third parties123

- These figures exclude Corins, TKP and D&S entities, which have their own data breaches processes.
- These figures are not in scope of CSRD and limited assurance (in numbers), as we do not consider these figures directly related to our IRO related to data breaches. Fore more information, see section 6.3.4.
- Complaints received from regulatory bodies are also included in the figure reported for complaints from third parties.
3.1.2 Reliable insurer
a.s.r. strives to be the best financial service provider for its customers and intermediaries. It offers simple and transparent products and services that meet customers’ needs, including sustainable solutions.
3.1.2.1 Simple and transparent products
The Product Approval & Review Process (PARP) assesses the quality, customer relevance and communication of products, and ensures that any newly developed or modified product is reviewed and deemed appropriate before being offered. It encourages continual improvement based on feedback from customers and advisors, social developments and current circumstances, such as the impact of economic conditions and changes in legislation and regulations. The specific criteria established to safeguard the interests of customers and society in the PARP assessment are outlined in the PARP Policy and the Sustainable Insurance Policy.
The PARP regulation prescribes that both active and inactive products should be reviewed periodically. At a.s.r., this occurs at least every three years for active products, and inactive products are reviewed at least every five years. In 2025, the PARP Board assessed two new products (2024: 0) and 41 existing products (2024: 22). If there is reason to do so, a product can be reviewed earlier. This was not the case in 2025. In addition, the PARP Board closely monitored the decisions surrounding the migrations of the Aegon NL portfolios in 2025.
a.s.r. set up PARP tests in accordance with the assessment framework of the AFM, and in line with legislation and regulations. In 2025, a.s.r. received feedback from the AFM on one file that resulted in informal supervisory measures being taken. Where necessary, internal actions have been taken.
In March 2026, the NZa imposed a fine of € 25,000 on a.s.r. health because the NZa was of the opinion that a.s.r. had been insufficiently transparent towards healthcare providers during the 2025 contracting process for medical devices. a.s.r. health does not agree with the NZa’s decision and will appeal against it. a.s.r. has not received any legal fines, settlements or enforcement actions.
Pricing
Within the framework of its regular pricing policy, a.s.r. focuses on making and keeping sustainability risks insurable and affordable. Sustainability risks, such as those relating to climate change, are explicitly integrated in the pricing process. For instance, the risk analysis for the pricing of non-life products considers the impact of extreme weather on the cost of claims. For more information see section 7.8.1.3.
Knowledge sessions
To offer the best financial services, knowledge sessions were held for employees in the product management departments within the business units to maintain and, where necessary, deepen their knowledge. a.s.r. maintains a professional development calendar for this purpose.
Additionally, a.s.r. organises knowledge sessions for intermediaries. These sessions are designed to transfer knowledge relating to a.s.r. products. Topics included sustainability, artificial intelligence, damage prevention and road safety.
Responsible marketing
a.s.r. adheres to the Dutch Advertising Code (Nederlandse Reclame Code), where responsible marketing practices such as fairness and transparency are key. In 2025, a.s.r. has not received any reports of violations for non-compliance with statutory labelling and/or marketing codes.
In 2025, the Dutch Advertising Code Committee declared a complaint lodged by a customer regarding an advertisement unfounded. See section 6.3.4.2 for more information about Responsible marketing practices.
3.1.2.2 Client acceptance
a.s.r. applies a client acceptance process for its products to identify potential risks and determine whether a client is suitable for the product. As part of this process, a Customer Due Diligence (CDD) check is performed to assess integrity risks.
Since 2021, a.s.r. has applied its Policy on Sustainable Insurance, which sets out how Environmental, Social and Governance (ESG) aspects are integrated into core insurance processes, including client acceptance, pricing, operational workflows and product development. This policy applies to all a.s.r. business units offering insurance products and services and is reviewed annually and updated as necessary.
The Policy on Sustainable Insurance offers comprehensive guidance on conducting an ESG risk inventory when onboarding new business clients and drafting new contracts. This process aims to ensure informed decisions regarding customer acceptance. The ESG risk inventory complements a.s.r.’s CDD Policy. ESG risks are identified when potential clients appear on a.s.r. asset management's exclusion list or operate in sensitive sectors.
When one or more conditions for conducting an ESG risk assessment are met, it is first determined whether the (potential) corporate client intends to insure a person or an object. Since these two categories follow different ESG risk‑assessment procedures, the applicable process is selected accordingly.
Personal insurance refers to income and pension insurance. a.s.r. considers it important that individuals can have income insurance and pension regardless of where they work. These clients are accepted unless there is a high ESG risk identified.
Object insurance enables corporate clients’ economic activities, which can entail sustainability risks. If an ESG risk is detected, the sales representative or underwriter can escalate the matter to the Underwriting Committee. This committee will then determine whether to reject the customer based on ESG risks or accept them under specific conditions. In 2025, this was done twice, resulting in one contract not being extended or accepted (2024: 2).
Throughout the contract period, especially during renewals and significant risk adjustments, a.s.r. periodically verifies that the customer continues to meet the risk profile and that transaction patterns align with expectations. In addition to these checks, a.s.r. engages in regular discussions with its customers about sustainability and strategies to mitigate risks.
3.1.3 Responsible investing
a.s.r. believes that businesses that take into account the interests of people, the environment, society and future generations will deliver more long-term value for all stakeholders, in both economic and social terms.
3.1.3.1 Asset Management
In 2024, a.s.r. asset management published its new sustainability strategy and revised Policy on Responsible Investments for its asset management activities. The approach is centred on three key policy goals that underline a.s.r. asset management's commitment to contribute to a better world:
Creating positive impact;
Driving change;
Reducing harm.
In order to achieve these goals, a.s.r. asset management applies a responsible investment approach by integrating environmental, social and governance considerations throughout the investment process. This approach also includes impact investing, active ownership – through engagement and voting – and exclusions.
In 2025, a.s.r. asset management updated its Policy on Responsible Investments and expanded the country screening by adding the Global Peace Index. Bonds from countries that score 'very low' are now excluded from investments.
a.s.r. asset management safeguards full compliance of its Policy on Responsible Investments using a two-step process: internal teams implementation (investment departments) and a compliance process.
a.s.r. asset management's four focus themes are:
Climate change and the energy transition;
Biodiversity and natural resources;
Health and well-being;
Human rights.
In 2025, to delve deeper into these four focus themes, a.s.r. asset management published a position paper on each of them. More details on the sustainability strategy and the Policy on Responsible Investments can be found on the a.s.r. asset management website.
Create positive impact
One of the policy goals of a.s.r. asset management is creating positive impact. This is primarily done by allocating assets under management to impact investments. For more information on impact investing, see section 3.1.3.4.
Furthermore, a.s.r. asset management believes that collaborating with other financial institutions, civil society organisations and government bodies is essential to achieving its goals.
Collaborations
In 2025, a.s.r. asset management continued its collaboration with the Plastic Soup Foundation and Earth Action to further develop a methodology for identifying the plastic footprint of companies. During the second phase of the project, the focus was on increasing granularity and scalability, enabling application across larger portfolios and investment funds. Going forward, the methodology will support a.s.r. asset management's portfolio management processes and guide its engagement efforts on plastic pollution.
a.s.r. asset management and the University of Amsterdam (UvA) jointly established the Research Centre for Sustainable Investments & Insurance (RCSII), an ESG-focused research centre. In 2025, RSCII hosted the first Amsterdam Sustainable Finance Conference. Over 100 researchers, industry experts, and policymakers came together to exchange insights and discuss new research on the challenges and opportunities in sustainable finance, highlighting the pivotal role capital markets can play for a more equitable and resilient future. Through its work, the RCSII aims to actively contribute to responsible investing and insurance, benefiting a.s.r., the broader financial sector, and society at large. More information can be found on the RCSII website.
Drive change
a.s.r. asset management believes that active ownership is key for a responsible investor. By engaging companies and exercising its voting rights, a.s.r. asset management leverages its influence to drive change within the companies in which it invests.
Engagement
In 2025, 1,059 engagements on numerous ESG topics were carried out on behalf of a.s.r. asset management, including engagements with companies that have demonstrated controversial behaviour (i.e. UNGC violations), or that are facing ESG-related risks. a.s.r. asset management drives change through bilateral (2%) and collaborative (13%) engagements. 85% of all engagements were conducted by its third-party engagement provider EOS at Federated Hermes Limited (Hermes EOS), with whom a.s.r. asset management maintains close cooperation to reinforce and amplify its engagement efforts. In addition, Hermes EOS held 1,654 dialogues on emerging ESG-related topics, particularly on governance and human rights issues. In total, the engagements and dialogues involved 575 companies.
Engagement by topic (in numbers)

A full list of companies that a.s.r. asset management has engaged with is available in the engagement reports on the a.s.r. asset management website.
Collaborative engagement initiatives
a.s.r. asset management engaged with investee companies through various collaborative engagement initiatives. These included engagements through the Platform Living Wage Financials to enable living wages and incomes in supply chains, with the Dutch Engagement Coalition to demand climate action and via ChemSec to address the use of harmful substances, such as PFAS, that have a negative impact on natural resources.
Voting
a.s.r. asset management's Voting Policy is developed in accordance with the Dutch Corporate Governance Code and a.s.r. asset management's Policy on Responsible Investments. The Voting Policy is applicable to all internally managed investments in listed equity.
In 2025, a.s.r. asset management voted at 98% of the Annual General Meetings (AGMs) of the companies in its equity portfolio. ISS Proxy Voting votes on behalf of a.s.r. asset management at AGMs, using the ISS Socially Responsible Investment module, with customised guidelines regarding (gender) diversity. Voting activities included:
Over 25% of ESG proposals addressed climate change and the energy transition, in which most shareholder proposals focused on disclosing GHG emissions and setting GHG emission reduction targets. a.s.r. asset management voted in favour of these proposals.
a.s.r. asset management supported eight ESG proposals related to biodiversity and natural resources, including shareholder proposals on plastic reduction.
Of the more than 9,000 management proposals on director elections, a.s.r. asset management voted against management on 396 proposals due to insufficient (gender) diversity on boards.
Detailed information on how a.s.r. asset management voted in 2025 can be found in the voting report and dashboard via the a.s.r. asset management website.
Other initiatives
In 2025, a.s.r. asset management signed the Call for Responsible Corporate Policy and Practices on Human Rights in Conflict-Affected and High-Risk Areas (CAHRA) statement, together with 27 other signatories, representing € 1 trillion in assets under management.
Access to Nutrition initiative
In 2025, a.s.r. asset management joined the Access to Nutrition initiative (ATNi), recognising the global nutrition crisis. Poor diets lead to inadequate nutrition and drive high levels of preventable non-communicable diseases, while increasing vulnerability to communicable diseases. Today, poor diets cause more illness worldwide than physical inactivity, alcohol consumption and smoking combined. The significant individual, societal and economic costs of poor nutrition affect a.s.r.’s holdings, portfolios and asset values across the short, medium and long term, both within and beyond the food and beverage sector. Together with other ATNi members, a.s.r. asset management actively engages companies in the sector to address nutrition-related risks and opportunities.
Reduce harm
a.s.r. asset management has a strict exclusion policy for controversial activities and behaviour that applies to all internally managed portfolios. Following its bi-annual screening of the investment universe on the exclusion rules, a.s.r. asset management excluded 4,267 (2024: 795) companies. The increase in excluded companies resulted primarily from the expansion of the screened investment universe, following the transition from Moody's to ISS as one of a.s.r. asset management's ESG data providers.
With regard to investments in sovereign debt, in 2025, a.s.r. asset management excluded 82 (2024: 81) countries. These exclusions were based on poor performance in Freedom's House's annual Freedom in the World report, countries with a low ranking on the Corruption Perceptions Index, low scores on the environmental Sustainable Development Goals (SDGs), and, as of 2025, a very low score on the Global Peace Index.
All exclusion criteria and the most recent exclusion lists can be found in the Policy on Responsible Investments (PRI) and on the a.s.r. asset management website.
3.1.3.2 Real Estate
a.s.r. real estate manages non-listed sector specific real estate funds in the Netherlands. These funds invest in retail and residential properties, office buildings, real estate located on science parks, agricultural land and renewable energy assets. They are open to institutional investors and a.s.r. is the anchor investor in these funds. As a real estate investor, a.s.r. acknowledges its role in fostering liveable and sustainable buildings, towns, cities and communities. a.s.r. real estate is committed to contributing to a sustainable and climate-resilient living environment for all – now and for future generations. The ESG vision encompasses four strategic pillars that form the core of the actions:
Reducing energy intensity and greenhouse gas emissions;
Adapting to climate change and associated risks;
Regenerating biodiversity and ecosystems;
Enhancing well-being and promoting social equity.
Reduce energy intensity and GHG emissions
Urban environments and rural areas are responsible for a significant share of global CO₂ emissions. a.s.r. real estate cannot prevent the current effects of these emissions, but it aims to limit its impact in the future. For this reason, a.s.r. real estate ensures that its buildings and agricultural land meet the Paris Agreement climate targets by 2045 at the latest, but preferably sooner.
In addition to executing asset-level reduction plans, a.s.r. real estate installed photovoltaic panels on the roof of several buildings in its portfolio to further reduce greenhouse gas (GHG) emissions. The panels vary in power output per panel, but together they achieve a total capacity of 9,883 kWp.
In the coming years, a.s.r. real estate will continue to execute asset-level reduction plans and refine its Paris Proof roadmaps using annual energy consumption data, incorporating lessons learned and evolving insights.
Embodied carbon
a.s.r. real estate is dedicated to creating a future-proof living environment, guided by the climate goals of the Paris Agreement. The construction and real estate sector is responsible for approximately 37% of global CO₂ emissions, 24% of which come from operational emissions and 13% from embodied carbon emissions1 (GHG emissions arising from the extraction, production, transportation and assembly of (building) materials.
At the initiative of a.s.r. real estate, a sector-wide working group comprising institutional investors and advisors has developed a shared methodology to gradually reduce embodied carbon emissions. The methodology uses the Global Warming Potential indicator and defines both target and maximum values for embodied emissions per asset type. This methodology will be used by the funds to encourage partners to adopt an integrated strategy that addresses both operational and embodied carbon emissions.
Investing in renewable energy
ASR Dutch Green Energy Fund I owns four wind farms and one solar park. Together, these assets comprise 48 wind turbines and 60,406 PV panels, delivering a combined capacity of 205 megawatts.Together, in 2025 they produced 545 GWh an amount of power comparable to the annual consumption of 218,000 households.
- Source: UN Environment Programme and the Global Alliance for Buildings and Construction (2025) The Global Status Report for Buildings and Construction 2024/2025.
Adapt to climate change and related risks
In recent years, a rise in the frequency and severity of extreme weather events, including heatwaves, torrential rain, floods and droughts have affected society and the natural environment. As the effects of climate change becomes more evident, the importance of a resilient real estate portfolio grows ever more critical. By identifying and anticipating the long-term risks associated with climate change, a.s.r. real estate aims to build a real estate portfolio that is progressively adaptable, ensuring long-term sustainability, resilience and profitability.
a.s.r. real estate conducted comprehensive climate risk assessments for all properties in its portfolio for the first time in 2023. Based on the Framework for Climate Adaptive Buildings (FCAB), this assessment identifies vulnerabilities to climate-related impacts, including four major climate risks: heat, drought, flooding and extreme weather. The portfolio is monitored continuously and changes lead to a renewed climate risk assessment.
The climate risk score is based on:
The environmental score, which is an estimate of the climate effects for the immediate vicinity of a building;
The building score, which is an estimate of the vulnerability of a building to the various climate effects, based on building-specific characteristics.
The combined environmental and building score results in the climate risk score, which is used to identify the assets that are exposed to high physical climate risks. The outcome of the climate risk assessment is used to determine the extent to which climate risks are acceptable, and what actions and adaptation solutions are appropriate to mitigate climate risks. Climate adaptation plans are in place for properties with a high or very high risk profile. These plans include physical and non-physical adaptation solutions that can reduce the identified physical risks and will be implemented within a period of five years after identification of a high-climate risk, in line with EU Taxonomy requirements for sustainable investments in real estate assets. In 2025, the real estate funds of a.s.r. real estate executed several adaptation solutions for the properties with a high and very high risk profile.
Partnership for transparent CO₂ storage
a.s.r. real estate has partnered with the Climate Cleanup Foundation to certify construction stored carbon. The CubeHouse project, a hybrid timber office currently being built, is the first in the portfolio of a.s.r. real estate to be awarded carbon credits via the Open Natural Carbon Removal Accounting (Oncra) initiative.
CubeHouse, designed by New York architects SO–IL, covers 16,600 m². About three-quarters of the structure is made from cross-laminated timber (CLT), storing 2,662 tonnes of CO₂. The Oncra certification ensures that this CO₂ storage is transparent and scientifically verified.
CubeHouse includes solar panels, an aquifer thermal energy storage system and rainwater collection to reduce its environmental impact. It offers green indoor spaces and is entirely car-free, with generous bicycle parking. In addition to Oncra, CubeHouse holds BREEAM Excellent and WELL Gold certifications. Once finished, it will house BNP Paribas and Arcadis as its main tenants.
Regenerate biodiversity and ecosystems
Biodiversity is a fundamental pillar of ecological balance and sustainability. A loss of biodiversity leads to adverse impacts on well-being and quality of life, as well as on food security, resilience to natural disasters and the availability of water and resources. The built environment disrupts important habitats for animal and plant species. Recognising this impact, a.s.r. real estate is committed to conserving and enhancing biodiversity on and around properties.
Biodiversity Framework
To further improve the biodiversity of its urban real estate portfolio, a.s.r. real estate has established a Biodiversity Framework in collaboration with an external ecologist. This framework is embedded into the daily operations of asset and property management, ensuring that biodiversity considerations are integrated into relevant decision-making processes. The framework provides guidelines to increase the share of vegetated area and capitalise on nature-related opportunities.
In addition, a.s.r. real estate conducted a baseline analysis to better understand the share of non-vegetated surface area compared to the total surface area of all urban real estate assets. The insights gained from this analysis are being used to shape a strategic plan and to identify high-potential assets to enhance the potential ecological value in the portfolio.
Rewarding sustainable farming
The ASR Dutch Farmland Fund has a reward system for its farmers who operate sustainably, to help safeguard the continuation of farming and challenge climate change and the loss of biodiversity. Under certain conditions, new and current lessees who comply with sustainability requirements in the fields of soil, biodiversity, and business qualify for discounts between 5% and 10% on the ground rent for leased land. In 2025, 79 contracts covered with a green lease were concluded, representing 100% (1,339 hectares) of the new contracts. The total number of green lease contracts is 670 (11,679 of 38,390 hectares), which also includes already existing contracts that have transitioned to a green lease.
Improve well-being and social equality
To help create a future-proof living environment for all, it is essential to promote both a healthy living environment and equal opportunities. Unfortunately, equal treatment and access to opportunities are not a given. Through its investments, a.s.r. real estate aims to make a positive contribution to the social dimension of the built environment.
a.s.r. real estate believes that tenants who are more engaged with their home, building, surroundings and landlord tend to be more satisfied and more involved. a.s.r. real estate therefore focuses on improving tenant satisfaction, health and well-being, and awareness of sustainable living. To support this, a.s.r. real estate runs an ongoing participation programme that encourages various forms of tenant participation. Activities range from participation in sustainability projects and tenants’ associations to ESG newsletters and events for tenants.
GRESB
The property real estate funds of a.s.r. real estate achieved the highest possible rating of five stars in the international Global Real Estate Sustainability Benchmark (GRESB) for sustainability performance. This places them among the top 20% most sustainable funds worldwide. The ASR Dutch Green Energy Fund participated in the infrastructure benchmark for the first time and outperformed both the benchmark and the peer group, scoring 92 points for solar (2-star rating), and 96 points for wind (4-star rating).
3.1.3.3 Mortgages
a.s.r. envisions a world where homeownership not only provides financial security, but also actively contributes to a sustainable future. a.s.r. believes that by empowering homeowners to make sustainable choices, it can create lasting value for individuals, society and the environment.
a.s.r. focuses on three strategic themes that shape its approach to mortgages:
Energy-efficient housing;
Climate-resilient housing;
Financial self-reliance.
Energy-efficient housing
a.s.r. supports homeowners in making their homes more energy-efficient, with a particular focus on homes with lower energy labels. By facilitating and encouraging sustainable renovations, a.s.r. aims to reduce the carbon footprint of its mortgage portfolio and contribute to (inter)national climate goals.
To make sustainable home ownership more accessible, a.s.r. offers a sustainability mortgage at an attractive interest rate. This product is proactively offered with every mortgage application, even if sustainable measures were not included in the original application, and it enables homeowners to invest in energy-saving measures such as heat pumps, solar panels or insulation.
The available amount for additional mortgage depends on the home's energy label:
Label E, F and G: € 20,000;
Label C and D: € 15,000;
Label A and B: € 10,000.
a.s.r. also helps existing customers benefit from a simplified application process via their personal online environment, where they can take out a sustainability mortgage of up to € 10,000 without advice ('execution-only'). By reducing costs and simplifying the process, a.s.r. aims to lower the threshold for making homes more sustainable.
To further support customers, a.s.r. collaborates with HomeQgo, an online platform that provides free sustainability advice to new and existing customers. This includes a home savings check, tailored recommendations, quotes for solutions and help with installation.
According to research conducted by a.s.r. in collaboration with Calcasa, homes that were made more sustainable increased an average of 1.81 energy label points due to the measures financed.
Climate-resilient housing
Climate change is a growing reality, and its impact on residential properties is becoming increasingly evident. a.s.r. believes that building climate resilience is essential for preserving both the value and liveability of homes, and invests in platforms that promote sustainable living.
Reliable, property-specific climate risk data remains limited, making it challenging to provide tailored advice to homeowners. To address this, a.s.r. actively initiates and participates in sector-wide collaborations with industry peers, research institutions and market platforms. These initiatives aim to enhance data quality and strengthen insights into climate risks.
Using this information, a.s.r. can gradually offer more accurate guidance and practical solutions to help clients prepare for extreme weather and environmental changes. Clients are also informed via the sustainable living platform, which provides blogs and resources on climate resilience.
Financial self-reliance
a.s.r. believes that sustainable homeownership starts with financial resilience. Homeowners require peace of mind to make responsible decisions - not only regarding their homes, but also for their overall financial well-being.
a.s.r. recognises that every situation is unique. That is why a.s.r. offers inclusive products and services for a diverse range of groups, including first-time buyers, seniors and those facing financial challenges.
The WelThuis Levensrente hypotheek (lifetime interest mortgage) enables retirees to unlock the value of their homes - essentially turning bricks into cash. By offering a lifetime fixed interest rate and requiring no monthly repayments as long as the borrower lives in the property, the mortgage provides financial flexibility without the need to sell or relocate. This product is particularly valuable for older homeowners with limited income but substantial home equity, allowing them to support their lifestyle, care needs or family goals in a safely and transparent manner.
By collaborating with social partners such as Dutch Debt Assistance Route (Nederlandse Schuldhulproute - NSR) and Geldfit, a.s.r. helps to prevent financial stress and support clients in maintaining control over their finances throughout the duration of their mortgage. Through these efforts, a.s.r. contributes to a more inclusive housing market.
3.1.3.4 Impact investments
a.s.r. aims to contribute positively with its impact investments while also aiming to generate an attractive return. The definition for impact investments is based on the definition given by the Global Impact Investment Network (GIIN):
'Investing with the intention of generating a positive, measurable social and/or environmental impact in addition to a financial return'.
a.s.r. introduced an impact investment target in order to support - among others - the energy transition and climate change mitigation objectives, such as renewable energy. The target also contributes to climate change adaptation, as well as social and biodiversity-related goals.
The target is 10% of the assets under management in scope allocated to impact investments to be achieved by the end of 2027, with no more than 50% of this allocation in labelled bond and at least 2 billion euros allocated to social impact investments.
As at 31 December 2025, impact investments represented 10.1% of the assets under management within scope (2024: 8.7%), thereby reaching the level of the target set for 2027. For social impact, an absolute subtarget of € 2 billion was established for 2027, while labelled bonds are restricted to a maximum of 50% of the impact investment portfolio. In the current reporting year, both subtargets were met. In 2026, a.s.r. will continue its efforts on impact investing.
Methodology and scope
This target includes a.s.r. own account investments and internally managed affiliated assets. It does not include externally managed affiliated assets and investments on behalf of third-party clients.
The impact investment target is not based on conclusive scientific evidence, but inspired by the NAB2 impact investing 10% target programme.
a.s.r. calculates the total euro amount related to impact investments as a percentage of the total euro amount related to assets under management at year-end. Amounts are based on the valuation methods applied for the financial statements.
The strategy and objectives for the real estate portfolio are in accordance with the European Association for Investors in Non-Listed Real Estate Vehicles (INREV).
a.s.r. aims to contribute to sustainable development through impact investments via the asset management, real estate and mortgage portfolios.
Impact investment target
| 2025 Total AuM impact investments (in € million) | 2025 Total AuM investments (in € million) | 2025 impact investments (in %)1 | 2024 impact investments (in %) | Target 2027 impact investments (in %)1 | |
|---|---|---|---|---|---|
| Impact investment | 10,272 | 101,900 | 10.1% | 8.7% | 10.0% |
- Percentage of impact investments compared to total AuM investments.
| Sub-targets within impact investment | 2025 AuM Impact investments (in € million) | 2025 Labelled bonds (in %)1 | 2024 impact investments (in %/ in € million) | Sub-Target impact investments (in %/ in € million)2 |
|---|---|---|---|---|
| Labelled bonds (maximum) | 5,180 | 50% | 53% | 50% |
| Social impact (minimum) | 2,717 | - | 2,000 |
- Percentage of labelled bonds compared to total AuM impact investments.
- The labelled bonds target is a 50% maximum. The social impact target is a minimum. The target year for these impact investment sub-targets is also 2027.
Asset management
a.s.r. asset management purposefully allocates capital to generate measurable positive change in the areas of climate, nature, health and human rights, alongside financial returns. a.s.r. asset management focuses on directing capital to areas where it can create the most significant impact, such as sectors where funding is scarce, technologies critical to building a sustainable future, and underserved groups that require additional support.
In 2025, a.s.r. asset management published its Impact Investing Framework. This framework focuses specifically on how a.s.r. aims to create positive impact in the asset classes of labelled bonds, listed equity, private equity and private debt.
a.s.r. asset management's impact investing approach is built around five principles, which provide the foundation for all investment decisions.
Intentionality: All investments must have a credible Theory of Change to ensure intentionality, clearly articulating how the investment will create positive social or environmental outcomes.
Measurability: Outputs and outcomes must be tracked through clear key performance indicators to ensure transparency and accountability.
Do no significant harm: All investments must avoid causing significant harm to environmental or social objectives.
Positive contribution: All investments must make a meaningful and positive contribution to one or more of a.s.r.’s impact goals, as defined for each of the focus themes.
Market rate financial returns: While impact is the defining feature of a.s.r.'s approach, a.s.r. also aims to deliver competitive financial returns to meet its fiduciary responsibility to its clients.
The impact investing selection criteria are detailed in the Impact Investing Framework.
Real Estate
The real estate funds managed by a.s.r. real estate critically assess their ability to make an environmental and societal impact as part of their yearly strategy cycles. The result of this is that the funds’ strategies are in part clearly defined and accredited as impact investing strategies. Detailed disclosures regarding the funds’ impact investment strategies are outlined in their respective ESG policies.
a.s.r. real estate focuses on the following real estate impact themes:
Affordable housing;
Dutch Science parks;
Renewable energy;
International non-listed real estate;
Sustainable mobility.
Affordable housing
ASR Dutch Core Residential Fund developed an impact investment strategy focused on expanding the availability of affordable housing within its portfolio. Affordable housing refers to residential properties with rent levels considered accessible to households with a median income. In 2025, the Fund defines affordable rents as those up to € 1,425 per month. The Fund contributes to affordability by keeping a considerable part of the portfolio in the affordable segment. The Fund extends its portfolio with dwellings in the affordable segment and takes affordability into account in its Rental Policy.
Dutch Science parks
ASR Dutch Science Park Fund aims to generate a positive societal impact by supporting the development of science parks in the Netherlands. It does this by investing in real estate for the broad range of functions that are needed for science park ecosystems to thrive. Through these investments, the Fund provides space for companies who develop a wide range of innovative and sustainable products and solutions that contribute to a better world.
Renewable energy
ASR Dutch Green Energy Fund is an impact investment vehicle investing in renewable energy, such as wind and solar farms and energy storage in the Netherlands. By investing in renewable energy projects, the Fund reduces carbon emissions, promotes clean energy and supports the transition towards a low-carbon economy.
International non-listed real estate
a.s.r.'s strategic asset allocation in real estate includes European non-listed real estate. These investments offer opportunities to generate positive impact across key themes such as affordable housing, green buildings and health. Over the coming years, a.s.r. intends to expand the share of assets that meet the criteria associated with these themes.
Sustainable mobility
ASR Dutch Mobility Office Fund contributes to a positive environmental impact by enabling reductions in CO2 emissions related to employee commuting to the Fund's office buildings. The Fund achieves this by investing exclusively in offices located near public transport hubs, adding office stock at these locations, and through specific measures aimed at stimulating sustainable mobility for each of the Fund's office buildings.
Impact investing in practice
The following investments are examples of investments made in 2025 with a positive contribution to the impact goals within a.s.r.'s Impact Investing Framework.
Climate change and the energy transition
In 2025, a.s.r. asset management invested in Copenhagen Infrastructure Partners’ Fund V, which focuses on offshore and onshore wind, solar energy, energy transmission and hydrogen storage. Projects include the Morecambe offshore wind development in the Irish Sea and an onshore wind farm in Karnataka, India.
Biodiversity and natural resources
Ball Corporation, an equity impact investment within the ASR Wereldwijd Impact Aandelen Fonds, produces sustainable aluminium beverage packaging. In 2024, 74% of its aluminium use came from recycled sources, significantly reducing CO₂ emissions. Ball aims for a global recycling rate above 90% by 2030.
Health and well-being
Therapeutic Care manages residential homes in North West England for children and young people experiencing trauma, behavioural disorders, and complex mental health challenges. In 2025, a.s.r. financed the organisation's expansion from 26 to 40 homes by 2026, helping to address a severe shortage of specialised care. This investment enhances access to high-quality treatment for vulnerable youth and strengthens the resilience of local communities.
Human rights
In 2025, a.s.r. asset management added over € 55 million in listed social bonds to its general account. For an institutional investor, finding impactful and scalable investments that positively advance human rights remains a challenge. a.s.r. asset management welcomes the positive steps being taken in the market on the topic of human rights and encourages this progress. Additionally, there are significant impact opportunities in the social domain through a.s.r.’s real estate and mortgage activities.
Mortgages
a.s.r. defines impact investing as an investment that seeks to generate intentional and measurable social and environmental impact alongside financial returns. Through impact investing via mortgages, a.s.r. aims to contribute positively to society and the environment.
a.s.r. defines mortgage loans that make a positive contribution to reducing greenhouse gas (GHG) emissions, as environmental impact investments. The primary objective is to generate a measurable, positive impact towards a sustainable future for both people and the planet. These investments are reflected in specific products and services.
Sustainable improvements
Customers can use two forms of energy saving budgets (Energiebespaar Budget and Energiebesparende Voorzieningen) to finance sustainable measures. For this purpose, they may also opt for a dedicated product: the sustainability mortgage (Verduurzamingshypotheek). The funds allocated through this product can only be used for home improvements aimed at sustainability, and they are included in a.s.r.'s impact investment target. Examples of sustainable housing improvements financed through this product include insulation solutions, solar panels and heat pumps.
First-time buyers
From 2025 onwards, a.s.r. classifies its mortgage loan for first-time buyers (Startershypotheek) as social impact investments. This resulted in € 336 million of social impact investments at year-end 2025, of which € 240 million was originated prior to 2025. The Startershypotheek concerns a tailor-made mortgage loan for first-time buyers with an extended loan term. The primary goal is to expand financial opportunities for this group, who face significant challenges in accessing affordable housing in the Netherlands.
The situation for first-time buyers in the Netherlands is increasingly difficult: in 2025, a home priced at € 500,000 requires a gross household income of € 100,000 if fully financed, while the average Dutch income is only € 46,500, and even lower for buyers between the age of 25 and 35. Without substantial savings or parental support, homeownership is often out of reach, despite its proven role in building long-term wealth and financial resilience. To support first-time buyers in this challenge, a.s.r has developed the Startershypotheek.
The core proposition of the Startershypotheek, within the broader theme of affordable housing, is to offer immediate affordability. By reducing monthly payments, this product enables first-time buyers to enter the housing market, despite current market pressures. These lower costs also allow them to allocate funds toward other essential needs, build a financial buffer, or accelerate the repayment of debts such as student loans. In doing so, the mortgage loans for first-time buyers provides a tangible solution to liquidity constraints, empowering first-time buyers to achieve long-term financial independence.
- Section 3.1.3.4 is in scope of CSRD and limited assurance (ESRS E1, ESRS E4 & ESRS S4).
- The Netherlands Advisory Board on impact investing.

Interview: Patrick de Baat on internal carbon pricing
Interview: Patrick de Baat on internal carbon pricing
Making sustainability
count in euros
a.s.r. real estate is working towards a CO₂-neutral property portfolio by 2045 at the latest. To highlight the ‘hidden costs’ of CO₂ emissions, a.s.r. real estate launched a pilot in spring 2025: for each investment, the building's CO₂ emissions are calculated and expressed in euros. Patrick de Baat, Sustainability Manager at a.s.r. real estate, shares insights into the value of internal carbon pricing.
Patrick, what does your role as sustainability manager involve?
'I am part of the Sustainability team of a.s.r. real estate, which is responsible for developing and implementing the ESG strategy (Environmental, Social and Governance). The team ensures that the funds – covering property, agricultural land and solar and wind farms – continue to advance in sustainability.'
What is the sustainability policy of a.s.r. real estate?
‘Our ESG strategy consists of four strategic pillars: (1) reducing CO₂ emissions, (2) identifying and mitigating climate risks, (3) making a positive contribution to biodiversity and ecosystems, and (4) improving health and equality in the physical living environment.
The first pillar focuses on achieving a CO₂-neutral property portfolio by 2045 at the latest, thereby contributing to international climate objectives of climate neutrality by 2050. This is accomplished by renovating existing buildings and acquiring only properties that meet the 2045 standard, ensuring a future-proof real estate portfolio.’
To support this strategy, you recently launched a pilot on internal carbon pricing. What does this involve in practice?
‘Internal carbon pricing is a way of assigning a monetary value to the CO₂ emissions generated by business activities such as procurement or outsourcing – including the acquisition, renovation and operation of buildings. CO₂ emissions can be difficult to interpret, but everyone understands euros. By attaching a financial value to CO₂ emissions, giving every tonne of CO₂ a price, the impact becomes clear and investment decisions can be assessed more consciously. This provides colleagues with an additional tool to determine whether an investment is the right one.’
Can you give a concrete example of such a consideration?
‘For each new purchase, the internal CO₂ price is calculated. This is a so-called shadow price, used solely for decision-making and is not actually charged. A market price of € 106.80 per tonne of CO₂ applies to emissions within the CO₂ budget, while a societal price of € 994.50 per tonne applies to emissions outside the budget. The calculation includes total CO₂ emissions from both energy and material use – covering operational and material-related emissions – during the first fifteen years of use.’
‘This value is assessed against the purchase or renovation costs, offering insight into the ‘hidden costs’ of CO₂ emissions and supporting the case for more sustainable investments. For instance, a timber building may be slightly more expensive than a concrete one, yet its CO₂ emissions are considerably lower. Applying the internal CO₂ price demonstrates that a modest additional investment in a sustainable option today delivers greater long-term value – while contributing positively to the planet.’
What are the concrete business objectives of internal carbon pricing?
‘The ultimate goal is to achieve the climate policy targets and the corresponding international climate commitments. Internal carbon pricing supports this by integrating CO₂ emissions into risk assessments and decision-making processes. This approach enables the identification of more sustainable buildings and promotes investments that contribute to a carbon-neutral real estate portfolio.’
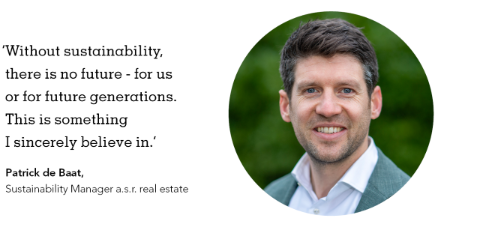
Why is internal carbon pricing important for your clients?
‘Sustainability is a key priority for a.s.r. and other investors share that conviction. However, for investors, it can be challenging to determine whether a more sustainable investment is the right choice, as financial considerations play a major role. By calculating the hidden costs of CO₂ emissions, sustainability can be expressed in monetary terms. This provides a complete picture and allows investors to make decisions based on clear and transparent information.’
What does sustainability mean to you personally?
'Without sustainability, there is no future - for us or for future generations. This is something I sincerely believe in. That is why I find it interesting to explore how we can collectively create a resilient living environment: working within our economic system to build a greener future by making choices that contribute to it and can be fully justified, including financially.'
3.2
Creating a vital and future-proof workforce 
Employees(in headcount)9,718 2024: 7,998 | Employee engagement(in percentile)771 2024: 73 | eMood®(score between 1 and 10)7.7 2024: 7.6 |
Employee Net Promoter Score(score between -100 and 100)17 2024: 11 | Vacancies filled internally(in %)45 2024: 51 | Employee turnover(in %)11.8 2024: 12.4 |
Female | Male | ||
Nil absenteeism | 1 Based on the most recent pulse check assessment from January 2026. The annual extensive culture scan, conducted in February 2025 had 71 as a result. | |
Talented, skilled, intrinsically motivated and vital employees are the key to success for a.s.r. In order to attract and retain the employees it needs, a.s.r. offers an attractive, competitive, and flexible employment package and focuses considerable attention on employee development, engagement, sustainable employability, and vitality. It is also committed to improving diversity, equity and inclusion.
In 2025, the total workforce increased by 17.8% to 8,689 FTEs (2024: 7,373), mainly driven by the acquisition of HTC. All employees work in the Netherlands.
In 2025, a.s.r.'s overall employee turnover rate decreased to 11.8% (2024: 12.4%). This employee turnover is within the norm and reached the target for 2025 (10%-16%). As in previous years, voluntary turnover accounted for the largest share: 33% of all exits consisted of employees who decided to leave a.s.r. Additionally, 29% of exits took place through the Social Plan, including the ‘90-minute increase in travel time' policy due to a change of office location as a result of the Aegon NL integration. Participation in the early retirement scheme (Regeling voor vervroegde uittreding - RVU) also continued to increase during 2025.
3.2.1 HR Policy and strategy
The HR strategy is based on three pillars:
Ensuring skills and competencies are in the right place at the right time;
Increasing the agility of the organisation;
Strengthening employee engagement.
CLA and social plan
On 13 October 2025, a.s.r. has agreed a new Collective Labour Agreement (CLA) with the unions CNV, FNV Finance and De Unie. The CLA is effective retroactively from 1 April 2025 and has a term of 21 months, lasting until 1 January 2027. a.s.r.'s final offer includes a comprehensive package of employment conditions, focusing on the 3 core themes central to a.s.r.'s approach to good employment practices:
Pay: structural salary increases of 3% from 1 November 2025 and 3% from 1 April 2026. Additionally, a one-off fixed payment of € 1,500 gross (pro rata for part-time staff) in January 2026. Temporary agency workers will also receive this one-off fixed payment.
Healthy work-life balance: from 2026, employees can use five extra days per year (pro rata for part-time staff) to undertake (additional) activities that matter to them, with full salary continuation.
Pension: a new pension scheme compliant with the Dutch Future Pensions Act (Wet toekomst pensioenen - Wtp) in which current employees will not be disadvantaged, with built-in flexibility.
Remuneration
a.s.r.’s Remuneration Policy is based on the principle that the average level of total remuneration is at most around the median of the reference group. Every three years (two years for the MB), an independent consultant performs a market-based comparison of the remuneration benchmark. The remuneration benchmark was last performed in 2024. For the MB it was last performed in 2025. In line with the Remuneration Policy, the remuneration of a.s.r. employees consists solely of a fixed salary. a.s.r. does not have a variable remuneration scheme. For more information on remuneration, see section 5.3.
3.2.2 Skills and competencies
The right deployment of talent is crucial to achieving a.s.r.'s objectives. Therefore, a.s.r. uses strategic workforce planning to build a future-proof, efficiently organised and flexible workforce. Through employer branding, a.s.r. is strengthening its reputation as an attractive employer. By recruiting and identifying desired skills and competencies at the right time, and facilitating the advancement of colleagues, a.s.r. ensures optimal talent match and deployment. a.s.r. offers various types of employment relationships tailored to the needs of the various generations in the workplace.
Total workforce management
The external labour market remained tight in 2025. Through total workforce management, a.s.r. ensures the best solution for every capacity requirement, whether for a permanent employee or a flex worker.
a.s.r. aims to fill at least 40% of all vacancies internally to retain knowledge and culture within the company, while providing employees with professional development opportunities. In 2025, 406 of 908 vacancies were filled internally, equating to 45% (2024: 51%). Due to the reorganisations of various departments, internal staff movements were relatively high.
In order to retain talent, a.s.r. focused considerable attention on boosting employee loyalty and engagement throughout the year.
Employer branding
To attract new talent, a.s.r. focused strongly on employer branding and recruitment marketing. In 2025, online campaigns targeting the broad target group of the Dutch labour market around various themes. In addition, targeted online campaigns were launched to attract IT professionals, customer service staff and women to work at a.s.r. For efficiency reasons, TKP's employer brand and job portal were merged with a.s.r.'s employer brand and job site in 2025.
Employee development
In a changing environment, it is vital for a.s.r. to continuously develop the talents of every employee. All a.s.r. employees therefore have access to a wide range of development opportunities in the a.s.r. academy, a.s.r.’s learning platform. In addition to knowledge and skills training to keep professional knowledge up to date, employees can also follow courses to develop personal skills that help them to perform better and work on developing required ‘skills of the future’. Examples include training on digitalisation, communication skills, new legislation and other topics affecting employees' work. Employees can receive advice and guidance from a talent advisor.
In 2025, 70% of all employees followed training courses (2024: 60%). In total, € 8.6 million was spent on training in 2025 (2024: € 7.5 million).
Employee development programmes
There are specific development programmes for different groups of employees. Current and future top talents can take advantage of the Fast Track programme, which allows them to develop more rapidly. There is a mandatory development programme for managers that aims to help them develop and maintain their professional knowledge and skills.
Trainee programme
a.s.r. runs traineeships to attract talented graduates with various backgrounds, including IT and data. This programme enables candidates to develop as specialists or to progress to management positions. In September 2025, twelve new trainees started the traineeship. Four of them are pursuing their traineeship within the IT field. The eleven trainees that started the traineeship in September 2024 will conclude their traineeship in March 2026.
Mentoring programmes
During their traineeship, a.s.r. trainees are paired with a director or a member of the MB for (reverse) mentoring. In addition, a.s.r. participates in the external mentoring programme LEF op de arbeidsmarkt, in which a.s.r. colleagues mentor and coach individuals who face barriers to employment (and are not employed by a.s.r.) helping them find work.
Talent Committee
Since 2024, a.s.r. has had a Talent Committee that provides insight into future top talents and succession planning for higher and senior management positions. The committee monitors the development of these talents and ensures that they are known to senior management. The aim is to promote more internal talent into management positions.
AI and data literacy
To increase AI literacy and foster a data-driven culture, an AI training programme was developed and rolled out in 2025 for various employee groups. These - partly customised - development programs and training sessions cover the theoretical and practical aspects of AI and data literacy. All senior staff participated in training sessions on inspiration and vision provided by INSEAD. Additionally, a large group of 'frontrunners' (representatives from product lines and staff functions) followed a special nine-week development programme.
In addition, training sessions were organised linked to the deployment and further large-scale rollout of the AI assistant Microsoft 365 Copilot Pro among a.s.r. employees. At regular inspirational meetings colleagues share experiences, progress and successes. Furthermore, the general development offerings in the field of AI have been significantly expanded.
Diversity, equity and inclusion
A diverse, equitable and inclusive working environment is essential for a.s.r. and its employees. By fostering such an environment, a.s.r. leverages diverse qualities and perspectives for better decision-making, enhances understanding of customer needs, and ensures the equal treatment of all stakeholders. It also promotes a safe, pleasant, and inclusive workplace. a.s.r.'s goal is to create an environment where mutual understanding, attention, and empathy are central, allowing everyone to be themselves and contribute fully. For more information on diversity, equity and inclusion, see section 6.3.1.
Equal pay
a.s.r. is committed to ensuring that women and men with similar work receive equal pay. To monitor this, an annual gender pay gap analysis is conducted. In 2025, the analysis shows that the average gross hourly wage of women is 17% lower than that of men at a.s.r.
However, this difference is explained by the fact that women are often in lower scales (other work) and men in higher scales and because women are on average employed for a shorter period of time. This gender pay gap over the total population is therefore called the unadjusted gender pay gap, and is not a pure comparison.
Adjusted for the above factors, there is no pay gap on average across a.s.r. The gender pay gap at a.s.r. between women and men for equal work and comparable years of experience is 0% (2024: 0%).
See section 6.3.1.2 for more information on remuneration and equal pay.
Communities
In 2025, in addition to the existing employee network for younger employees up to 40 years old, communities for LGBTQ+ colleagues and colleagues with a bicultural background, new networks for women and internationals were introduced. The aim of these employee networks is to create connections and contribute to diversity, equity and inclusion within a.s.r.
Women in Management Positions
At the Capital Markets Day in June 2024, a.s.r. announced a new target regarding the number of women in management positions: 37% by the end of 2025 and 40% by the end of 2026. To achieve this, a number of additional measures have been agreed upon, alongside existing agreements and processes that already contribute to attracting and retaining women in leadership roles.The additional measures focus on increasing awareness among senior leadership and management teams, enhancing employer branding and recruitment efforts, boosting referral recruitment, raising internal awareness by sharing good examples, adjusting the recruitment process (ensuring a female candidate is always included), promoting part-time (4 days) management roles, mandatory unconscious bias training for managers and involving and training male managers to contribute to achieving the target.
Social Entrepreneurship Performance Ladder and Meedoendesk
In September 2025, after measurement and audit, a.s.r. was determined to retain its First Step on the TNO Social Entrepreneurship Performance Ladder (PSO). The PSO is a measurement tool that visualises a company's contribution to employment for people in a vulnerable position in the labour market. In 2018, a.s.r. achieved aspiring status on the Social Entrepreneurship Performance Ladder and in 2020, it became the first insurer to achieve the First Step.
To boost social entrepreneurship, in addition to recruiting and placing employees who fall under the Participation Act, a.s.r. decided in 2025 to more actively create employment for other target groups that fall under the definition used by the PSO, such as refugees with refugee status and people receiving WIA (Disabled Persons Act) benefits. To emphasise this new positioning, the name under which these activities take place was changed from Participatiedesk to Meedoendesk.
3.2.3 Increasing the organisation's agility
To quickly respond to changes in the market, technology and customer needs, a.s.r. invests in the agility and resilience of its employees and the organisation. With a strong focus on vitality and talent development, a.s.r. ensures a flexible and sustainably employable workforce that responds effectively to these changes. a.s.r. is also strengthening its leadership to facilitate these changes optimally.
Sustainable employability
In Motion (In Beweging), an approach developed by a.s.r., enables all a.s.r. employees to work on enhancing their employability. They can make use of a specific budget to follow courses that are not directly function-related but contribute to their sustainable employability. Employees affected by a reorganisation can activate a special development budget through a.s.r.'s social plan (Het Andere Plan) and, during the integration with Aegon NL, Aegon's social plan (Your Personal Plan), enabling them to take the next steps in the labour market.
As a result of the integration with Aegon NL, a large proportion of employees in the mortgage division in Leeuwarden have become redundant, and for another group, the work location will change to Utrecht. With the Mortgages in Motion (Hypotheken In Beweging) programme, a.s.r. offers support to the affected employees in various ways, including meetings with talent advisors, workshops and inspiration sessions. Contact has also been established with companies in the region, retraining programs have been launched and job vacancies are being shared. In this way, a.s.r. supports colleagues in their transition from one job to another.
Vitality and absenteeism
a.s.r. places significant emphasis on physical and mental health. Employees can participate in vitality scans and health checks and have access to a wide range of training and workshops to work on their physical and mental health. To maintain a good work-life balance, a.s.r. offers time- and place-independent working. Healthy home working is facilitated through a workplace check, a home working allowance and the provision of workspace equipment.
Managers have access to an interactive absenteeism dashboard that provides extensive insights into the historical and current absenteeism of a team and the associated costs, as well as predictions about absenteeism. This dashboard aims to raise awareness about absenteeism and to provide managers with tools for preventing manageable absenteeism. a.s.r.'s vitality and absenteeism specialists support managers in implementing preventive measures and managing absenteeism.
In 2025, a.s.r. performed a Risk Inventory and Evaluation (RI&E), a four-yearly assessment of occupational risks in the areas of safety, health and well-being. The RI&E was conducted by a.s.r.’s occupational health service and consisted of site inspections and qualitative group interviews. The results indicated that a.s.r. is seen as a good employer with a strong focus on vitality and well-being, and initiatives to address work-related stress and undesirable behaviour. One of the attention points is psychosocial workload stress experienced by employees due to factors in the workplace. To address the points of attention identified in the study, resources are being developed and additional communication efforts are being implemented.
The absenteeism rate at a.s.r. developed positively and fell from 4.5% in 2024 to 4.2% in 2025, a decrease of 0.3 percentage points. This means that a.s.r. has achieved its absenteeism target of 4.2% for 2025. This is a great result, in contrast to the national trend of rising absenteeism. This improvement underlines the effect of a.s.r.'s efforts in the areas of prevention and vitality, as described above.
Absenteeism rates
| Units of measure | 2025 | 2024 | |
|---|---|---|---|
| Absenteeism | in % of total employees | 4.2 | 4.5 |
| Short-term absenteeism (0-7 days) | in % of absenteeism | 18.0 | 17.3 |
| Nil absenteeism | in % of total employees | 57.0 | 56.2 |
- Vitality and absenteeism is in scope of CSRD and limited assurance (ESRS S1). The short-term absenteeism figure in the table is not in scope of CSRD and limited assurance.
3.2.4 Strengthening employee engagement
Engaged employees are key to a.s.r.'s success. Engagement leads to increased productivity, lower staff turnover, greater creativity, lower absenteeism and a positive work environment. a.s.r. increases engagement by investing in a positive employee experience, empowering employees and future-proof employment benefits. a.s.r. also actively cultivates a strong, shared company culture where everyone can be themselves. By listening to employees, a.s.r. stays informed and can make adjustments to maintain employee happiness and engagement.
Culture programme
The culture programme, initiated after the merger with Aegon NL, continued in 2025. Because the programme was rolled out per business line, the timing and approach differs per business line. The standard components of the programme are an analysis of the local culture, the appointment of a Business Culture Manager (BCM) and connectors, the formation of a local culture team, quality assessments, and a management development programme. The BCM, the local culture team and the connectors take the lead in initiatives. At the end of 2025, the last business units started with the culture programme. In addition, a strategy has been developed to ensure the responsible phase-out of the central culture approach.
Connectors network
Since 2024, connectors have been identified within the business units working with the culture programme, and this process continued in 2025. Connectors exhibit the desired behaviour in line with the core values and the five D's from the story of a.s.r. and encourage others to do the same. These are:
sharing Dilemma's;
Diversity, equity and inclusion;
space for Dialogue;
Defined frameworks;
Doing.
Connectors engage in conversation with colleagues and, together with the local culture team, devise actions to strengthen the culture. The connectors network, which includes all connectors within a.s.r., acts as a bridge between different departments and levels, facilitating change, sharing values and consolidation management behaviour. The connector's network met regularly in 2025 to share experiences, meet with members of the Management Board and follow a customised development programme.
Denison Culture Scan
In 2025, a.s.r. conducted the Denison Culture Scan for the ninth consecutive year. This scan measures twelve cultural aspects within the main themes of mission, consistency, involvement and adaptability. The scores are compared to a benchmark of more than 1,000 large companies, showing where a.s.r. stands relative to other organisations.
Employees who completed the Denison Culture Scan (in %)
(2024: 66)
71
The results show mostly above-average to good scores. Notably, there were improvements in DGI and in mission and vision. Employee engagement was at 71 (2024: 73); although this was below a.s.r.'s 2025 target of 80 or higher, the score is in the top 30% of the benchmark of participating companies. The score for customer focus is below average at 45, meaning that 55% of companies in the benchmark score higher in this area.
In January 2026, a pulse check on employee engagement was carried out, resulting in a score of 77, which reflects a significant improvement. This increase is partly attributable to the completion of key milestones in the integration of Aegon NL and the investments a.s.r. made in its employees.
Overall, there are significant differences between business units. Business units where integration has been completed score higher on strategic direction, goal orientation, vision, core values and behaviour.
Based on the outcomes of the 2025 Denison Culture Scan, key themes and actions have been determined locally, and a company-wide plan has been developed with four themes: customer focus, DGI, feedback, giving and taking space. This plan enables the local culture teams within each business unit to continue their work.
a.s.r.’s culture plays a pivotal role in delivering on its mission of sustainable value creation. Employees embrace the organisation's core values, fostering a sense of ownership and shared purpose. This is reflected in an improved score on Vision and Strategic Direction within the Denison model compared to last year, indicating that colleagues not only understand the company's long-term objectives but actively contribute to achieving them. For a.s.r., as an insurer with a clear societal role, this translates into a culture focused on creating long-term value for all stakeholders. Targeted investments in sustainable employability reinforce this. By investing in vitality, development and future‑proof skills, the organisation not only strengthens employee agility but also makes the actual culture of sustainability visible in daily practice. The high participation rate in training and development further underlines this commitment, ensuring that employees continuously enhance their skills to support sustainable growth.
In January 2026, a pulse check - a shortened interim measurement of the annual Denison Culture Scan, which from 2026 onward will take place in Q3 - was completed by 72% of colleagues. The pulse check assessed mainly where a.s.r. stands in relation to the strategic goal of employee engagement and showed clear progress. The engagement score rose from 71 in the annual Culture scan in Q1 2025 to 77 in the pulse check. This increase was driven by stronger results on vision and core values & behaviour, with colleagues increasingly recognising a.s.r.’s direction and finding that the code of conduct and core values guide their decisions. Employees also experienced greater emphasis on growth and development, reflected in higher scores on knowledge development.
Employee Mood Monitor (eMood®)
a.s.r. employees, including external staff with the exception of self-employed persons, are invited to participate in a weekly pulse survey on job satisfaction, vitality and productivity. Recurring themes in eMood® include happiness, meaning and stress. Managers receive a weekly dashboard with their teams' scores, enabling a.s.r. to stay informed about employee well-being and promote ongoing dialogue between employees and managers. The response to a.s.r.'s eMood® remained high, with between 3,100 and 3,900 (2024: 3,500) participants per week. Respondents have 2.5 days each week to complete eMood®, with an average response rate of approximately 50% of the population.
With an average score of 7.7 in 2025 (2024: 7.6), a.s.r. maintained the mood of the organisation at a good level. a.s.r.'s scores on the underlying elements are: vitality (7.5), productivity (7.7) and job satisfaction (7.8).
The most important follow-up to eMood® is ‘the good conversation’ using the dashboards that managers receive weekly. eMood® helps teams to discuss (difficult) issues, support each other and reach better working agreements. In addition to the eMood® dashboard, all managers receive weekly follow-up advice linked to that week's statement, enabling them to offer practical tools to their employees. Finally, eMood® is used as input for (HR) policy, often tailored to the specific phase of merger integrations and context of the business unit.
- These figures related to eMood® are in scope of CSRD and limited assurance (ESRS S1-2).
Employee Net Promoter Score
HR uses eMood® also to measure the employee Net Promoter Score (eNPS), the extent to which employees would actively recommend a.s.r. to others as an employer. The eNPS provides a.s.r. with an insight into loyalty and the perceived attractiveness of a.s.r. as an employer. The average eNPS in 2025 was +17 (2024: +11). The increase in the eNPS compared to 2024 can be explained by the completion of a significant part of the merger-integrations. During 2025, the eNPS continued to improve as a result of the completion of the integrations of several business units and all efforts to increase employee engagement with the ‘new’ combined a.s.r.
This page is intentionally left blank.

Case: Every step counts, walking with KWbN
incredibly healthy
Case: Every step counts, walking with KWbN
Walking: accessible
and incredibly healthy
In 2025, a.s.r. became partner of the Royal Dutch Walking Association (Koninklijke Wandelbond Nederland - KWbN) and the main sponsor of the Avond4daagse. The collaboration already delivered results in its first year, says Manager Brand & Marketing Communications Hella de Weger: ‘Around 100,000 children walked under the a.s.r. arch, and our reputation as a sustainable insurer was further strengthened.’
The Dutch population is not sufficiently active, which has societal implications such as reduced sustainable employability. For years, a.s.r. has embraced walking through a.s.r. Vitality, rewarding participants for being physically active. Since 1 January 2025, a.s.r. Vitality has been an integral part of propositions for Disability, Health and Pensions. To increase its impact, a.s.r. partnered with KWbN and became the main sponsor of the Avond4daagse.
Hella explains: ‘The KWbN is the largest walking organisation in the Netherlands. Together, we aim to get as many people as possible to get moving through walking. This aligns with our social commitment and strategic theme of vitality and sustainable employability. Walking is incredibly healthy and the most accessible form of exercise. The goal of national sponsorship is to encourage more people to start walking or to walk more often. The Avond4daagse sponsorship is an ideal match, as both children – who have their whole lives ahead of them – and young parents take part. By making the Avond4daagse a celebration and continuing to encourage the activity of walking, we hope to increase the number of steps taken.’

Positive impact
Walking has a positive impact on your health, confirms KWbN-certified walking coach and trainer Natasja Vermaas. Through her company, Get in Motion, she helps people become active: ‘Walking can make you feel better and stay fit for longer. People who spend much of their time sitting often notice improvements quickly. Their posture and balance improve – as every step requires stability. They lose weight, build fitness and gain more energy, and minor aches disappear. Sleep also improves. Spending time outdoors and getting daylight – especially morning light – helps you sleep deeper and more peacefully at night.’
100,000 children
Each year, more than 500,000 primary school pupils take part in the Avond4daagse, supported by around 1.5 million volunteers. The Avond4daagse is a Dutch community walking event during which participants of all ages follow organised routes over four consecutive evenings. The partnership with KWbN and sponsorship of the Avond4daagse proved an immediate success, Hella notes: ‘a.s.r. festively supported the event this year at 24 locations nationwide. In total, around 100,000 children walked under the a.s.r. arch. Thanks to the national marketing campaign, created with colleagues and their children, our reputation as a sustainable insurer has been further strengthened. Combined with increased brand preference, this is expected to lead to higher revenue.’
Walking activities
Walking has also gained momentum within a.s.r. Hella: ‘Many colleagues helped at Avond4daagse events. All business units organised walking activities, such as a walking conference with presentations at different locations, requiring participants to walk between sessions. Several trainees mapped walking routes around the Utrecht office to inspire colleagues to take a stroll during breaks.'
Expanding sponsorship
In 2026, the sponsorship will be developed further. Hella explains: ‘a.s.r. will be present at a minimum of 50 Avond4daagse events. We will create more content and campaigns to promote walking. The walking route finder introduced this year, featuring routes across the Netherlands, will be expanded. In addition, a.s.r. real estate manages several estates that offer walking routes. This creates additional possibilities to further promote walking across the Netherlands together with KWbN, and encourage even more children to get outdoors and start walking.’

3.3
Engaging with the investor community 
Development in share price in 2025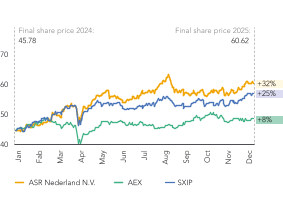 | Shareholders by geography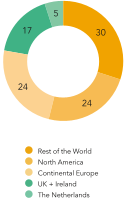 | |
Outstanding shares(in € million)204.6 2024: 208.9 | Total capital return(in € million)980 2024: 879 | Dividend per share(in €)3.41 2024: 3.12 |
Market capitalisation(in € billion)12.7 2024: 9.7 | Free float(in %)70 2024: 65 | |
a.s.r.’s focus on long‑term value creation and pursuit of profitable growth, progressive dividends and additional capital returns supports shareholder value. Shareholders can rely on a.s.r. being financially robust and manage the capital they entrusted to us responsibly. They may expect solid financial performance, a strong balance sheet, economically rational capital allocation, disciplined cost management and transparent reporting.
a.s.r. places great importance on maintaining a strong relationship with the investor community and it adheres to high standards of transparent communication and fair disclosure. It aims to provide all relevant information in timely fashion to enable investors to make well-informed investment decisions. a.s.r. makes every effort to ensure that its disclosures are accurate, complete and timely.
To provide insight into its financial, non-financial and operational performance, strategic progresses and other relevant developments, a.s.r. communicates regularly with the market through press releases, webcasts, conference calls and other channels.
For many years, a.s.r. has been widely recognised for the quality of its investor relations. In 2025, a.s.r. was named second Most Honoured Company in the Extel Developed Europe & Emerging EMEA Executive Survey, ranking second in the European insurance industry. This recognition is based on independent votes from buy-side and sell-side professionals, who assessed the performance of the Management Board and Investor Relations function using more than 20 qualitative metrics.
3.3.1 Key developments in 2025
On 2 April, a.s.r. successfully issued a € 500 million perpetual subordinated Restricted Tier 1 capital security. On 7 May, a.s.r. completed a € 125 million share buyback programme, followed by an share buyback completed on 2 September of € 105 million. On 12 September, Standard & Poor's upgraded the credit ratings of a.s.r., its life and non-life insurance entities and its outstanding debt instruments.
All transactions and disclosures were executed in line with a.s.r.’s Policy on fair disclosure and bilateral dialogue, ensuring transparency and timely communication with the investor community.
3.3.2 a.s.r. shares
a.s.r.’s shares have been listed on Euronext Amsterdam since 10 June 2016 (symbol: ASRNL, ISIN: NL0011872643). The amount of outstanding shares of a.s.r. is 209,113,565 ordinary shares. The free float as defined by Euronext Amsterdam was 70% as at 31 December 2025. Each share has one vote.
a.s.r. is included in various indices, including the AEX ESG Index and the MSCI World Index.
Shares ASR Nederland N.V.
| (in numbers) | 31 December 2025 | 31 December 2024 |
|---|---|---|
| Authorised capital | 325,000,000 | 325,000,000 |
| Issued share capital | 209,113,565 | 211,326,978 |
| Own shares held by a.s.r. | 4,554,997 | 2,424,597 |
| Outstanding shares | 204,558,568 | 208,902,381 |
Shareholders
a.s.r. shares are held by a diversified and international shareholder base. At year-end 2025, based on public filings and company information, institutional investors in Continental Europe (excluding the Netherlands), North America (including the United States and Canada and excluding shares held by Aegon Ltd.) and the United Kingdom represented approximately 24%, 24% and 17% of the outstanding shares, respectively. Shareholders in the Netherlands held around 5% of the outstanding shares, a limited portion of which was held by retail shareholders.
Major shareholders
Dutch law requires shareholders to report their holdings in Dutch-listed companies to the AFM if it exceeds 3% of total outstanding share capital (and certain higher thresholds). Following the closing of the transaction with Aegon NL on 4 July 2023, Aegon Ltd. became a major a.s.r. shareholder. As at 31 December 2025, Aegon Ltd. held circa 23.60% of outstanding shares. In addition, as at 31 December 2025, Norges Bank Investment Management and Blackrock Inc. had a shareholding in a.s.r. of more than 5%.
Shares and share price performance
As at 31 December 2025, the share price stood at € 60.62 (2024: € 45.78). Total shareholder return amounted to 40.0% in 2025, including dividend reinvestment. The Euronext AEX Index appreciated by 11.1% and the STOXX Europe 600 Insurance Index by 30.4% over the same period.
a.s.r. is actively covered by research analysts. Sixteen sell-side equity analysts have issued recommendations and price targets, with an average price target of € 63.69 as at year-end 2025. 63% of the recommendations were buy and 38% were hold.
Share price performance
| (in €) | 2025 | 2024 |
|---|---|---|
| Starting price as at 1 January | 45.78 | 42.70 |
| Highest closing price | 63.26 | 48.76 |
| Lowest closing price | 45.42 | 41.60 |
| Closing price as at 31 December | 60.62 | 45.78 |
| Market cap as at 31 December (€ million) | 12,676 | 9,675 |
| Average daily volume shares (numbers) | 424,708 | 419,134 |
Dividend
a.s.r.’s Dividend Policy offers shareholders a progressive dividend, targeting mid-to-high single digit annual growth. During the Capital Markets Day (CMD) held in June 2024, the policy was extended until 2026.
The policy includes an interim dividend, set at 40% of the total dividend for the previous year, conditional on achieving adequate financial results and solvency. Operating entities remit cash to the holding company, which maintains sufficient liquidity to cover operating holding costs and hybrid expenses for the next twelve months on a rolling basis, as well as to fund dividend payments.
Dividend per share
| (in €) | 2025 | 2024 |
|---|---|---|
| Interim dividend | 1.27 | 1.16 |
| Final dividend | 2.14 | 1.96 |
| Total dividend | 3.41 | 3.12 |
Based on its strong financial performance in 2025, a.s.r. proposes a total dividend of € 3.41 per share, representing an 9.3% increase compared to the total dividend over 2024 (€ 3.12). The dividend consists of an interim dividend of € 1.27 per share, paid in September 2025, and a final dividend of € 2.14 per share. The 9.3% increase in dividend per share reflects a 7% increase in the total dividend amount in euros compared to 2024. This is in line with the medium-term target of mid-to-high single digit annual growth. Subject to approval by the Annual General Meeting (AGM) on 20 May 2026, the final dividend for 2025 will be payable from 27 May 2026. a.s.r. shares will trade ex-dividend on 22 May 2026.
Share buyback programme
a.s.r. regularly repurchases its own shares as part of its Capital Management Policy to optimise the capital structure and enhance shareholder value. Share repurchases are executed through a structured share buyback programme, incidental buybacks, including participation in Aegon Ltd.’s sell-downs, and the employee share plan. All repurchased shares, except for the employee share plan, will be cancelled.
On 7 May 2025, a.s.r. completed a € 125 million share buyback programme, which had been announced on 19 February 2025. In total, 2,403,923 shares were repurchased. On 2 September 2025, following Aegon Ltd.’s announcement to sell down 12.5 million shares in a.s.r., representing circa 6% of the total outstanding shares. a.s.r. repurchased 1,875,000 shares, representing 15% of the offering. Upon completion of the transaction, Aegon Ltd.’s shareholding in a.s.r. decreased from 29.96% to approximately 24% of a.s.r.’s outstanding shares.
3.3.3 Bonds
At 31 December 2025, a.s.r. had six debt instruments outstanding with a total nominal value of € 3.6 billion. These include three Restricted Tier 1 (RT1) bonds totalling € 1.5 billion, two Tier 2 bonds of € 1,500 million in total and one € 600 million green senior bond.
On 2 April 2025, a.s.r. issued a € 500 million RT1 bond, which was more than twice oversubscribed. The issuance attracted participation from more than 100 international investors, reflecting broad support from institutional fixed income investors. Additionally, a € 500 million Tier 2 bond issued in 2015 was partially repurchased via a tender offer of over € 412 million in April 2025. The remaining portion was redeemed at the call date in September.
Bonds
| Nominal value | Coupon | First call date | |
|---|---|---|---|
| Perpetual Restricted Tier 1 capital securities | € 500 million | 4.625% | 19 October 2027 |
| Green senior fixed rate notes | € 600 million | 3.625% | 12 December 2028 |
| Fixed to fixed Tier 2 capital securities | € 500 million | 3.375% | 2 May 2029 |
| Perpetual Restricted Tier 1 capital securities | € 500 million | 6.625% | 27 December 2031 |
| Fixed to fixed Tier 2 capital securities | € 1,000 million | 7.000% | 7 December 2033 |
| Perpetual Restricted Tier 1 capital securities | € 500 million | 6.500% | 2 April 2035 |
3.3.4 Ratings
Credit ratings
a.s.r. is rated by Standard & Poor's (S&P). In 2025, a.s.r. held several meetings and conference calls with the rating agency to discuss relevant developments at a.s.r. and in the Dutch insurance market. These engagements led to an upgrade of the credit ratings of ASR Nederland N.V., its life and non-life insurance entities, and its outstanding debt instruments. The upgrade reflects a.s.r.'s strong financial risk profile, solid capital position and robust business risk profile. The outlook on all ratings is stable. The upgrade was supported by S&P's assessment of capital and earnings, which was revised from ‘very strong’ to ‘excellent’ based on capital adequacy under the S&P capital model.
For more information on a.s.r.’s bonds and ratings, see www.asrnl.com.
Credit ratings
| Standard & Poor's | Type1 | Rating | Outlook | Since |
|---|---|---|---|---|
| ASR Nederland N.V. | ICR | A- | Stable | 12 September 2025 |
| ASR Levensverzekering N.V. | ICR / IFSR | A+ | Stable | 12 September 2025 |
| ASR Schadeverzekering N.V. | ICR / IFSR | A+ | Stable | 12 September 2025 |
| Aegon Levensverzekering N.V. | ICR / IFSR | A+ | Stable | 12 September 2025 |
| Green Senior Bond | A- | |||
| Tier 2 Bonds | BBB | |||
| Tier 1 Bond | BBB- |
- ICR: Issuer Credit Rating; IFSR: Insurer Financial Strength Rating
ESG benchmarks and ratings
a.s.r. is assessed by various ESG benchmarks and rating agencies. These external assessments provide recognition for a.s.r.’s sustainability performance and progress towards its strategic targets, including non-financial targets. They also enable benchmarking against industry peers.
In 2025, a.s.r. again performed strongly in the S&P Global Dow Jones Sustainability Index (DJSI), achieving a score of 82 points (2024: 82). a.s.r. is included in both the DJSI World and DJSI Europe indices. Sustainalytics ranks a.s.r. seventh globally among insurers. A dedicated team at a.s.r. continuously monitors developments in ESG ratings and methodologies, as well as investor's interest in ESG benchmarks. These insights are used to further embed sustainability into a.s.r.’s operations. For more information on and updates of a.s.r.’s ESG ratings, see www.asrnl.com.
Scores international ESG benchmarks and ratings
| ESG benchmark | Score low | Score high | 2025 | 2024 |
|---|---|---|---|---|
| Dow Jones Sustainability Index | 0 | 100 | 82 / #91 | 82 / #9 |
| MSCI | CCC | AAA | AA | AA |
| Sustainalytics ESG Risk Rating | 100 | 0 | 11.5 / #7 | 11.2 / #4 |
| Carbon Disclosure Project | D- | A | B | B |
| ISS ESG | D- | A+ | B- (prime) | C+ (prime) |
| FTSE4Good | 0 | 5 | 4.3 | 5.0 |
| Fair Insurance Guide (Eerlijke Verzekeringswijzer) | N/A | N/A | #1 | #1 |
| VBDO (once every two years) | N/A | N/A | #1 | N/A |
| VBDO Tax Transparency Benchmark | 0 | 35 | 42 / #2 | 31 / #14 |
- Ranking World and Europe unknown at time of publication of this Annual Report.
3.4
Operating as a trusted company 
Instances committed - Doenkracht Donderdag(in numbers)654 2024: 518 | Instances committed - financial self-reliance(in numbers)168 2024: 236 | Instances committed - helping by doing(in numbers)2,043 2024: 1,299 |
Time invested - total(in hours)14,424 2024: 13,798 | Time invested - financial self-reliance(in hours)4,042 2024: 4,926 | Time invested - helping by doing(in hours)10,382 2024: 8,873 |
3.4.1 Political engagement
a.s.r. operates in nearly all Dutch insurance segments and aims to maintain cordial and transparent working relationships with stakeholders in the markets in which it operates, public and private.
The coordination of political engagement by a.s.r. and the related outreach to key policymakers and stakeholders is overseen and approved at Management Board level, ensuring that a.s.r.'s stated policies and ambitions are the guiding considerations for such efforts.
Civil society participation
In fulfilling its role within civil society and as contributor to the polder model - the consultative policymaking process employed in Dutch politics - a.s.r. values a balanced dialogue with national interest groups, grass-roots initiatives and legislators.
According to Article 4.1 of the statutes of incorporation, a.s.r.'s interests are aligned with those of all its stakeholders, including civil society. This alignment drives a.s.r. to pursue its stated ESG goals, whether in collaboration with trade associations and other memberships or through specific a.s.r. initiatives.
On occasion, a.s.r. will independently enter the public debate on matters that are closely linked to the fundamentals of its core markets. For example, in December 2025, the Dutch financial press quoted observations by a.s.r. CEO Jos Baeten, that a.s.r. is actively involved in broader public discussions on the rising cost of healthcare and as a pioneer in the housing market by making a.s.r. agricultural land available for temporary residences.
Another instance was in August of 2025, when Jos Baeten reminded the Dutch government that if it calls for institutional investors -like insurers- to increase their appetite for defence related investments, there should be active government facilitation of the extraordinary due diligence that is required in defence portfolios and their unique downstream risk of misuse and proliferation.
Formal exchange of views with authorities
a.s.r. engages in direct contact with formal government counterparts, such as regulatory bodies, government agencies and policymakers. a.s.r. requires that public affairs, lobbying and political network activities all comply with the highest standards and best practices. To this end, a.s.r. is a signatory of the Dutch Association for Public Affairs (Beroepsvereniging voor Public Affairs -BVPA) Code of Conduct and the Dutch Insurers Code of Conduct. a.s.r. is also registered with the EU transparency registry. More generally, a.s.r. contributes to the political dialogue on industry standards, compliance and other policy developments via its membership and participation in the various trade associations that reflect a.s.r.’s strategy and operations.
In 2025, a.s.r. was a member of the following national trade associations and as such represented in their respective EU affiliations:
Dutch Association of Insurers (Verbond van Verzekeraars);
Dutch Association of Institutional Investors in Real Estate (Vereniging van Institutionele Beleggers in Vastgoed - IVBN);
Dutch Association of Healthcare Insurers (Zorgverzekeraars Nederland - ZN);
Dutch Fund and Asset Management Association (DUFAS);
Association of Securities Issuing Companies (Vereniging Effecten Uitgevende Ondernemingen - VEUO).
a.s.r. actively participates within those organisations in working groups, ad hoc platforms and at board level. This strong participation allows a.s.r. to monitor and enhance the alignment of the positions expressed by associations with the a.s.r.'s long-term strategy. At the same time, a.s.r.’s membership of industry associations provides an opportunity to develop and share industry best practices.
Two of a.s.r.’s Executive Board members have a chair position within an industry association. Due to its membership of the Dutch Association of Insurers, a.s.r. is also represented in the Confederation of Netherlands Industry and Employers (VNO-NCW). As the preeminent platform for Dutch employers and trade associations, VNO-NCW is formally assigned eight of 36 seats in the Dutch Social and Economic Council (Sociaal Economische Raad - SER), the deliberative body that provides official advice on social economic issues to the Dutch government and parliament.
At the EU level, a.s.r. is represented by Insurance Europe via its membership of the Dutch Association of Insurers. In 2025, a.s.r. joined the industry-wide European discussion groups on accounting standards, the CFO Forum, and on risk management best practices, the CRO Forum. Both forums are discussion groups formed and attended by CFOs and CROs of major European listed insurance companies. CFO Forum aims to influence the development of financial reporting, value-based reporting and related regulatory developments for insurance enterprises on behalf of its members, who represent a significant part of the European insurance industry. CRO Forum seeks to identify and share benchmark good practice in risk management and to promote alignment between regulatory regimes and industry best practice.
Membership fees to trade associations
In 2025, the total membership fees to these trade associations amounted to €6.17 million (2024: € 5.14 million). Fees to these trade associations is based on a percentage of the premiums volume, assets under management and type of stock exchange listing.
Dutch Association of Insurers (Verbond van Verzekeraars): € 4,783,044 (2024: € 4,577,403);
Dutch Association of Healthcare Insurers (Zorgverzekeraars Nederland - ZN): € 1,111,296 (2024: € 439,490);
IVBN: € 66,065 (2024: € 80,000);
DUFAS: € 35,464 (2024: € 34,498);
VEUO: € 10,467 (2024: € 9,378);
CRO Forum: € 35,000 (2024: € 0).
CFO Forum: € 128,500 (2024: € 0).
In line with its Code of Conduct, a.s.r. is not involved in facilitation payments or financing of political parties.
- Section 3.4.1 is in scope of CSRD and limited assurance (ESRS G1-5).
3.4.2 Socially responsible taxpayer
a.s.r.’s Tax Policy supports its ambition to be a financially reliable and stable organisation, and as a member of society, a.s.r. ensures that it pays its fair share of tax. a.s.r. subscribes to the Tax Governance Code developed by the employers’ organisation VNO-NCW and aligns with its principles. a.s.r Tax Policy is also aligned with the Dutch Corporate Governance Code. Moreover, the Tax Policy is underpinned by the broader principles including sustainability, ESG alignment (CSRD/SFDR/EU taxonomy) and adherence to internal codes of conduct and external governance frameworks.
Tax strategy
a.s.r. aims to be a socially responsible taxpayer by adhering to professional tax compliance practice. a.s.r. does not engage in aggressive tax planning or structures. Business considerations always take precedence and serve as the primary trigger for structuring decisions in general.
a.s.r.’s tax strategy has been approved and endorsed by the Management Board (MB). The Audit & Risk Committee (A&RC) of the Supervisory Board (SB) supervises the tax policies pursued in line with the Dutch Corporate Governance Code. The Tax Policy and tax risks are discussed annually in the A&RC.
Tax control
Group Tax plays a central role in a.s.r.'s tax function and therefore has an important role in embedding the tax strategy in the organisation's day-to-day operations. Group Tax is responsible for the establishment, maintenance and testing of the Tax Control Framework that is part of the broader Risk Management Framework, which in turn sets out the various processes, risks and existing control measures.
Relationship with the Dutch Tax Authority
a.s.r. maintains an open, transparent, and trust-based relationship with the Dutch Tax Authority, formalised through the Individual Monitoring Plan (IMP) under horizontal monitoring. This cooperative framework ensures that a.s.r. proactively engages with the tax authorities to address complex tax issues and complies with all applicable tax laws and regulations in a timely manner.
Tax rulings
In some cases, it is desirable for a.s.r. to obtain certainty from the tax authorities in advance concerning the application of tax legislation and regulations, which are often complex. In such cases, a.s.r. will ask the tax authorities for a prior tax ruling on a tax position that a.s.r. has adopted. With operations almost exclusively within the Netherlands, no international tax rulings are applicable for a.s.r.
Pillar 2
a.s.r. has assessed the potential exposure to Pillar 2 and does not expect the impact of the Pillar 2 income taxes to be material over 2025. a.s.r. could reduce any top-up tax to zero during the first five years (starting from 2024) by applying a combination of the domestic group exemption and the Transitional Country-by-Country Reporting (CbCR) Safe Harbour rules. a.s.r. will continue to monitor the developments of Pillar 2 legislation, the applicability of the domestic group exemption and the applicability of the CbCR Safe Harbour rules on the group's financial position. For further explanation, see section 7.6.12.
Stakeholder engagement
Tax matters are a regular topic in a.s.r.’s stakeholder dialogues. a.s.r. engages internal and external stakeholders to discuss key tax-related issues, ensuring full understanding of their perspectives and concerns. The outcomes of these dialogues are used to refine a.s.r.’s tax strategy and are reported to the Executive Board. The key outcomes are also included in the Annual Report and provide input for the sustainability reporting.
3.4.3 Doenkracht
As a leading insurer, a.s.r. aims to contribute to solving societal issues. The two main themes of the Doenkracht department are financial self-reliance and helping by doing.
a.s.r.'s Doenkracht programme regarding financial self-reliance consists of:
An educational offering aimed at preventing financial problems;
Projects and programmes focused on alleviating (imminent) financial problems.
During the update of the Double Materiality Assessment, affected communities has emerged as a material topic, a.s.r.'s Doenkracht programme is an important element of its sustainability strategy to enhance financial self-reliance of Dutch households. For more information, see section 6.3.3.
a.s.r.'s helping by doing involves actively supporting social organisations and projects through volunteering and contributing financially.
Developments in 2025
Doenkracht continued to evolve as a driving force within a.s.r., championing meaningful societal engagement through hands-on initiatives and strategic partnerships. The year was marked by a deepened commitment to social team activities (maatschappelijke team activiteit – MTA), bringing attention to the Stimulansplan, a more professionalised approach to working with societal organisations, and the successful execution of Doenkracht Donderdag, a.s.r.'s annual volunteer day.
These pillars collectively reinforced Doenkracht's mission to empower employees and amplify impact across communities.
Volunteering
a.s.r. employees' volunteering activities are measured, including the number of hours and the results. Social team activities provide a.s.r. employees with the opportunity to volunteer with societal organisations, either individually or as a team. The annual programme offers a wide range of activities that could be flexibly scheduled, ensuring maximum participation. In 2025, the MTA structure was further refined: a.s.r.'s mission, employees’ interests and talents, and the needs of social organisations were more effectively aligned. This resulted in greater added value for all parties involved and created lasting impact.
The highlight of a.s.r.’s volunteering in the reporting year was Doenkracht Donderdag, a nationwide day of action where more than 650 employees dedicated themselves to social causes. This event strengthened the organisational culture and fostered pride and connection among employees.
The Stimulansplan was expanded in 2025, enabling employees to apply for up to € 500 per year to support volunteering within their personal networks. This encouraged personal social involvement and acknowledged the diverse ways employees contribute to society beyond the workplace.
Bridging the gap
In 2025, cooperation with social organisations was further professionalised. By actively listening and developing solutions together, the gap between the corporate and non-profit sectors was reduced. By listening actively and co-creating solutions, Doenkracht positioned itself not merely as a benefactor but as a strategic ally in addressing societal challenges.
Doenkracht demonstrates that social engagement not only creates external impact, but also contributes to internal cohesion, pride, and motivation among employees. With the focus on helping by doing, Doenkracht continues to strive for a positive impact on society.
This page is intentionally left blank.

4 Business review
4.1
ASR Nederland N.V. 
Premiums and DC volume(in € million)13,375 2024: 10,376 | Organic capital creation(in € million)1,315 2024: 1,193 | Solvency II ratio(standard formula, in %)2182 2024: 198 |
Operating result(in € million)1,637 2024: 1,4631 | Operating expenses(in € million)1,471 2024: 1,413 | Result before tax(in € million)696 2024: 1,4641 |
Dividend per share(in €)3.41 2024: 3.12 | Operating return on equity(in %)14.1 2024: 13.41 | 1 This figure is restated. 2 The Group Solvency II ratio is based on the Partial Internal Model (PIM), applicable to Aegon Life, Aegon Spaarkas and a.s.r. Life. The other insurance entities calculate their solvency capital requirement using the Solvency II Standard Formula. The Group Solvency II ratio includes financial institutions. |
The a.s.r. group consists of operating and holding companies. The operations of a.s.r. are divided into five operating segments. The Non-life and Life segments perform all insurance activities. Asset Management, Distribution and Services, and Holding and Other perform the other activities.
4.1.1 Financial performance
Premiums and DC volume
Total premium and Defined Contribution (DC) inflow increased by 28.9% to € 13,375 million (2024: € 10,376 million), primarily driven by the closing of three pension buy-outs in Life for an amount of € 2,810 million. Additionally, there was growth in Pension DC (8.8%), P&C and Disability (3.0%) and Health (18%). Furthermore, premiums received in Funeral increased modestly and the service books (Individual life and Pensions DB) showed an expected decline.
- ‘Premiums and DC volume’ is equal to the premiums invoiced plus the customer funds deposited by the insured DC-products and the IORP-products which, by definition, are not premiums.
Operating expenses
The operating expenses increased by € 57 million to € 1,471 million (2024: € 1,413 million) mainly due to the inclusion of HumanTotalCare as of 1 October 2025, as well as higher salary costs following a new collective labour agreement. The internal number of FTEs increased by 1,316 to 8,689 (2024: 7,373), also as a result of the acquisition of the remaining 55% stake in HumanTotalCare (1,428 internal FTEs).
The expense ratio of P&C and Disability decreased by 0.3%-points to 7.7% (2024: 8.1%) mainly due to realisation of cost synergies which were partly offset by the higher salary costs.
Expenses for non-ordinary activities, classified as adjustments and therefore not included in operating expenses, amounted to € 238 million (2024: € 245 million). These expenses mainly consist of costs for the integration of Aegon NL, amortisations of intangible assets and regulatory project expenses.
Operating result
The operating result increased by € 174 million to € 1,637 million (2024: € 1,463 million) driven by an increase in results across most business segments, mainly in Life, reflecting a higher investment margin and profitable business growth. Please see section 7.10 for the definition of operating result.
Operating result per segment
The operating result of the Non-life segment decreased by € 31 million to € 474 million. The positive impact from the absence of weather-related calamities in P&C, similar to last year, was more than offset by non-recurring reserve strengthening in group disability reflecting higher disability rates. The combined ratio of Non-life (excluding Health) amounted to 92.2% (2024: 90.9%), in line with the target range of 92-94%.
The operating result of the Life segment increased by € 183 million to € 1,259 million, mainly due to a higher investment margin.
The Asset Management segment operating result increased by € 20 million to € 120 million, supported by all business lines, mainly Mortgages.
The operating result of the Distribution and Services segment increased by € 16 million to € 66 million driven by acquisitions, organic growth and some non-recurring items.
The Holding & Other segment (including eliminations) operating result decreased by € 14 million to € -282 million. The decrease is mainly due to increased interest expenses and lower operating investment and finance result, offset by lower operating expenses and higher other income.
Result before tax and net result
The result before tax decreased by € 768 million to € 696 million (2024: € 1,464 million), reflecting an increased operating result (€ 174 million) offset by a more negative result on investment related adjustments (€ -935 million) and other adjustments and incidental items (€ -7 million).
In 2025, the adjustment of the investment and finance result is mostly driven by revaluations with a negative P&L impact due to interest rate movements (e.g. increase and steepening of the curve), partly offset by positive real estate revaluations.
Non-investment related adjustment items of € -179 million (2024: € -172 million) mainly relate to expenses for non-ordinary activities (e.g. integration costs and amortisation of intangibles), negative impact in the Non-life segment related to reserve strengthening on group disability contracts, positive impact in the Life segment related to the implementation of the PIM for ASR Levensverzekering N.V. and gains from real estate development activities in run-off in the Holding & Other segment.
The net result attributable to holders of equity instruments amounted to € 548 million (2024: € 958 million), with an effective tax rate of 18.8% (2024: 26.4%). The -7.0%-pt difference to the nominal tax rate of 25.8% is mainly related to the negative tax related to interest charges on other equity instruments that is reflected in the net result whereas the coupon itself is directly charged to equity and tax-exempt items.
Operating return on equity
The operating return on equity increased by 0.7%-points to 14.1% (2024: 13.4%), exceeding the target of >12% and reflecting stronger growth of the operating result compared to growth in average shareholder equity.
Solvency II ratio and organic capital creation (OCC)
The Solvency II ratio increased to 218% (31 December 2024: 198%) with OCC (21%-points) offsetting the deployment of capital (-21%-points), including pension buy-outs, acquisitions and capital distributions. The positive impact of the implementation of the PIM for ASR Levensverzekering N.V. is circa 12%-points on the group Solvency II ratio. Market and operational developments contributed positively (7%-points).
OCC increased by € 122 million to € 1,315 million (2024: € 1,193 million), primarily driven by higher finance capital generation, improved business performance and the realisation of cost synergies. The increased finance capital generation reflects a higher investment margin resulting from re-risking of the investment portfolio (mainly executed in second half of 2024), wider government bond spreads, positive equity and real estate revaluations and interest rate developments (e.g. a reduced UFR drag).
Dividend and capital distribution
a.s.r. proposes a final dividend for 2025 of € 2.14 per share, bringing the total dividend (including interim dividend of € 1.27 per share) to € 3.41 per share, a 9.3% increase versus 2024 (€ 3.12 per share).
The total capital distributions will amount to € 930 million and consist of dividend (€ 700 million) and share buybacks (€ 230 million). The total dividend amount increased by 7% compared to 2024, which is in line with the medium-term target of a mid-to-high single-digit increase. The share buybacks refer to the € 125 million share buyback announced with the 2024 annual results in February and € 105 million announced in September as participation in the sell-down of Aegon Ltd., both executed in 2025. The share buyback of € 175 million announced today (in line with the medium-term targets as presented at the 2024 Capital Markets Day) will be executed in the first half of 2026 and deducted from HY 2026 Solvency II ratio.
4.2
Non-life 
Premiums received(in € million)5,846 2024: 5,458 | Combined ratio(P&C and Disability, in %)92.2 2024: 90.9 | Organic growth(in %)3.0 2024: 5.1 |
Operating result(in € million)474 2024: 5051 | Operating expenses(in € million)391 2024: 394 | Result before tax(in € million)188 2024: 5041 |
| 1 This figure is restated. | ||
P&C brands | Disability brands | Health brand |
The Non-life segment consists of non-life insurance entities and their subsidiaries. These non-life insurance entities offer non-life insurance contracts such as disability insurance, property and casualty insurance and health insurance.
4.2.1 Financial performance
Premium volume
Premiums increased by € 387 million to € 5,846 million, reflecting organic growth in Property & Casualty (P&C) and Disability and an increase in Health driven by strong commercial season for 2025. The organic growth in P&C and Disability amounted to 3.0%, in line with the 3-5% target range. Growth in P&C and Disability mainly reflects price increases to mitigate claims inflation. In Health, premium volume increased by 18% due to a growth of 77,000 customers in the 2025 policy renewal season.
Operating expenses
Operating expenses decreased by € 4 million to € 391 million, primarily due to synergies from the integration of the Aegon P&C and Disability portfolios onto the target platforms, partly offset by higher salary costs as a result of a new collective labour agreement. This is also reflected in the 0.3%-points decrease in the expense ratio of the segment, excluding Health, to 7.7%.
Operating result
The operating result of the Non-life segment decreased by € 31 million to € 474 million. The positive impact from the absence of weather-related calamities in P&C, similar to last year, was more than offset by non-recurring reserve strengthening in group disability reflecting higher disability rates.
In P&C, the operating result improved as a result of volume growth and a lower cost ratio due to realisation of cost synergies. And as mentioned, both this year and the comparable period benefited from the absence of weather-related calamities and a low level of large size claims. In Disability, the operating result for 2025 decreased due to reserve strengthening. Group disability has experienced adverse claims development due to elevated incidence rates, especially related to psychological absenteeism and long COVID. In Health, premium volume growth contributed to an increase in the operating result. The operating investment and finance result within the Non-life segment increased due to growth of the portfolio and better investment returns.
Combined ratio
The combined ratio for the segment excluding Health at 92.2% is at the lower end of the target range 92-94% and deteriorated by 1.3%-point compared to last year. This movement is attributable to the developments outlined in the operating result section.
In P&C, the combined ratio improved 0.3%-points to 90.4% (2024: 90.7%) due to volume growth and cost synergies. Both years benefited from the absence of weather-related calamities and a low level of large size claims. In Disability, the combined ratio deteriorated by 3.0%-point to 94.2% (2024: 91.2%), due to reserve strengthening in group disability. The combined ratio of Health at 99.1% is stable with last year (99.1%).
Result before tax
Result before tax decreased by € 315 million to € 188 million, due to a lower operating result and a negative impact from investment and non-investment related adjustments. The investment related adjustments amounted to € -197 million in 2025 (2024: € 48 million), mostly driven by interest rate movements (e.g. increase and steepening of the curve). Non-investment related incidental items amounted to € -89 million (2024: € -49 million), primarily reflecting the impact of changes to future services on onerous contracts, inflation effects on the liability of incurred claims and amortisation of interest rate related hedge developments.
4.2.2 P&C
a.s.r. provides P&C insurance products to both retail and commercial markets under the brand name a.s.r. and the label Ik kies zelf van a.s.r. The a.s.r. brand serves these markets through intermediaries and authorised agents. The label Ik kies zelf van a.s.r. offers direct, online distribution to individual customers. Travel and recreational insurance is distributed via mandated brokers and advisors. In addition, Corins, a managing general agent, operates independently within the Dutch co-insurance market. Corins represents a panel of well-established international insurers and reinsurers, underwriting commercial and industrial risks.
a.s.r. has two strategic partnerships that contribute to more sustainable repair services: Soople and Fixxer. Soople supports customers by fully managing day-to-day property maintenance. This includes initial contact with residents, planning, execution and invoicing. As co-owner of Soople, a.s.r. is able to offer sustainable repair services and aims to expand this offering to include sustainable maintenance and other environmentally responsible services. Fixxer is a joint initiative between a.s.r. and Belfius Insurance, aimed at developing and managing a digital claims service platform. This platform contributes to efficient and customer-centric claims handling.
The combined ratio decreased to 90.4% (2024: 90.7%) primarily driven by the impact of a lower level of weather-related calamities. Premium increases were implemented in the retail portfolio and in the commercial portfolio.
Combined ratio P&C

Market
The Dutch P&C insurance market is relatively consolidated. The three largest P&C insurers together account for a market share of 61.3%1 (2024: 60.6%). a.s.r. is among the top three P&C insurers in the Netherlands, with a market share of 14.7% (2024: 14.7%), based on Gross Written Premiums (GWP).
Consolidation has also taken place among distribution partners and mandated brokers. Over the past three years, inflation has significantly impacted the P&C market. Rising claims and operating costs have led to increased premium levels.
- Market shares DNB 2024. Market shares 2025 are not available yet at the time of publication of this report
Products
a.s.r. offers a wide range of P&C products in the retail and commercial markets. This includes products in the following categories:
Motor policies provide third party liability coverage for motor vehicles and commercial fleets, property damage and physical injury as well as coverage against theft, fire and collision damage.
Fire policies provide cover against various property risks, including fire, flood, storms and burglary. Private cover is provided on both a single-risk and a multi-risk basis, with multi-risk policies providing cover against loss of, or damage to, dwellings and damage to personal goods.
Other P&C insurance products such as liability, legal aid, travel and recreation, pet insurance and transport insurance.
Product share P&C (measured by GWP)

Strategy and achievements
a.s.r. offers sustainable and competitive propositions and aims to build long-term relationships with its customers and intermediaries. Simplifying and modernising the IT landscape is a key strategic priority. This supports further digitalisation across the value chain, enhances services for customers and advisors, and contributes to cost efficiency. Through digitalisation and artificial intelligence (AI), a.s.r. has expanded the personal online environment Mijn a.s.r. and digitised several processes, including the Smart Claims assistant and straight-through processing for claims reporting.
a.s.r. has a solid track record as a profitable non-life insurer, consistently delivering strong financial results and maintaining high customer satisfaction. Long-term growth in the non-life insurance market is typically linked to the development of the gross domestic product (GDP).
a.s.r. is well represented among advisors, mandated brokers and in the co-insurance market through Corins. In the direct channel, revenue from the label Ik kies zelf van a.s.r. remains stable and profitable.
Outlook for 2026
a.s.r. anticipates continued growth of its P&C portfolio, at an annual rate of 3–5%, with the primary growth opportunities situated in the commercial market. Inflation is being closely monitored in relation to claims and product pricing.
To reinforce its position within the commercial segment, a.s.r. will enhance and streamline its business proposition. Additional measures will be introduced to further digitalise and apply AI across the value chain, with the aim of improving customer service. The digitalisation and AI integration of the claims handling process will also be expanded.
In January 2026, a.s.r. reached an agreement with BOVAG on the full acquisition of all insurance activities of Bovemij N.V. (Bovemij), representing a premium volume of circa € 400 million. Completion of the transaction is expected in the second half of 2026 and is subject to regulatory approvals. Following the closing, Bovemij is expected to contribute to the growth and strengthening of a.s.r.’s P&C activities, particularly in the mobility domain.
4.2.3 Disability
a.s.r. is the leading insurer in the disability market in the Netherlands and focusses on organic growth. a.s.r. offers an extensive range of products and services for sustainable employability and preventing and reducing absenteeism.
The combined ratio decreased by 3.0% compared to 2024, driven by the increased WIA inflow. a.s.r. is seeing a rising trend in long-term absenteeism.
Combined ratio Disability

Market
Distribution of a.s.r.’s disability (income) insurance products takes place mainly through insurance advisors. With the brands a.s.r. and Loyalis, a.s.r. is well positioned in the distribution channel serving self-employed individuals, SMEs, corporates and (semi) public sectors. a.s.r. is the market leader with a market share of 39.5%1 in 2025 (2024: 39.8%) in terms of the Gross Written Premiums (GWP). The income insurance market grew slightly in size to € 4.8 billion.
- Market shares DNB 2024. Market shares 2025 are not available yet at the time of publication of this report
Products
a.s.r.’s income protection insurance business comprises a range of products, categorised in the following product groups:
Individual disability:
Products designed for self-employed individuals to safeguard against income loss due to illness or disability, up to retirement age;
Products for employees to cover fixed expenses and protect income exceeding the statutory maximum daily wage in case of illness or disability.
Sickness leave:
Products to protect employers during the mandatory continued payment of wages for employees absent due to illness, for a period up to two years.
Group disability:
Products for employers to mitigate the financial impact of self-insurance status for continued payments of employees absent for more than two and up to twelve years;
Products for employees to safeguard against income loss in the event of (partial) disability, in accordance with the rules and guidelines of the Work and Income according to Labour Capacity Act (Wet Werk en Inkomen naar Arbeidsvermogen - WIA).
a.s.r. offers a broad range of prevention and reintegration services for customers with the aim of preventing or reducing absenteeism costs. These services respond to societal developments that contribute to high workloads and the growing need for sustainable employability and vitality among entrepreneurs and employees. Reducing and preventing absenteeism plays an important role in this approach, as it contributes to lower costs and improved continuity for employers. Through its services, training programmes, courses and a.s.r. Vitality, a.s.r. supports business owners and employers in maintaining the employability of themselves and their staff - both now and in the future.
a.s.r. continuously adapts its products and services to changes in the social security system and monitors political developments to enable employers to meet government requirements and support the employability of their workforce. By the end of 2025 the Dutch government finalised the draft text for the Mandatory Occupational Disability Insurance for self-employed (Wet Basisverzekering Arbeidsongeschiktheid Zelfstandigen - BAZ), which introduces a mandatory public disability insurance coverage for self-employed individuals. The advisory opinion of the Dutch Council of State (Raad van State) contains clear points of attention that must be addressed by the Ministry of Social Affairs and Employment. The bill is subsequently considered by the House of Representatives (Tweede Kamer) and the Senate (Eerste Kamer). Under specific criteria, entrepreneurs will retain the option to choose a private disability insurance. Although the legislation is not expected to enter into force for several years, a.s.r. has proactively responded by introducing a new product proposition called BasisAOV and launching a new direct distribution channel.
Product share Disability

Strategy and achievements
a.s.r. aims to ensure that all its disability customers remain sustainably employable and insured. It strives to provide customers with best-in-class insurance products, prevention and reintegration services, and an excellent level of service. Customers – including self-employed individuals, employees and employers - have a need to stay employable and to retain their employees. If this is temporarily not possible, they want to be assured of an income.
Through its prevention and reintegration services, a.s.r. supports customers to achieving optimal employability for themselves and their employees. This contributes to reducing absenteeism among customers and to controlling claims costs, thereby keeping risks affordable and insurable.
a.s.r. focuses on further improving its service by digitalising customer processes, reducing paper flows, and offering convenience and personalised customer service. Examples include the Services Store (Dienstenwinkel) with prevention and reintegration services, further development of Mijn a.s.r. and the integration of a.s.r.'s back-office with payroll systems to enable uniform and user-friendly participant administration and connectivity with Health & Safety Service agents. To further improve customer satisfaction and increase internal process efficiency, a.s.r. has started using AI, including the implementation of Microsoft Dynamics. Employees are supported through education and training on technological developments, and the introduction and adoption of AI is embedded in a.s.r.’s cultural development programme.
Outlook for 2026
a.s.r. continuously monitors market developments to assess their potential impact on its operations and business activities, enabling timely and appropriate responses.
In recent years, the Dutch government organisation Employee Insurance Agency (Uitvoeringsinstituut Werknemersverzekeringen - UWV) has faced considerable operational challenges. These developments may influence political perspectives on the social security system, although the extent and nature of such changes remain uncertain. Temporary measures, such as the simplified WIA assessment for individuals over 60 years old, provide short-term relief but are expected to increase long-term pressure on the system.
To help reduce the societal costs associated with (long-term) absenteeism, a.s.r. offers practical recommendations to UWV. These aim to alleviate the workload at UWV, while ensuring a fair and high-quality social security system is maintained.
Looking ahead, a.s.r. expects further revenue growth (of between 3 to 5%) in the Disability portfolio, by serving customers with best-in-class products and customer service. Uncertain factors include the impact of economic and geopolitical developments on inflation, interest rates, wage development and the economy. a.s.r. intends to maintain its leading position in the market by leveraging its expertise in the social security domain and offering prevention and reintegration services. It does so by delivering high-quality service to customers, advisors and intermediaries, and by integrating processes across the value chain.
4.2.4 Health
In 2025, a.s.r. was the sixth largest provider in the Dutch health insurance market, measured by the number of customers, with a market share of 3.9%1 (2024: 3.5%). The four largest insurers held a combined market share of 85% (2024: 85%). a.s.r. offers health insurance under the brand a.s.r. and the label Ik kies zelf van a.s.r.
The combined ratio of Health remained stable at 99.1% (2024: 99.1%).
Combined ratio Health

- Source: Vektis Zorgthermometer (2025)
Market
Two types of products are available on the Dutch health insurance market: basic cover and supplementary health insurance. In this highly regulated healthcare market, all Dutch citizens are required to obtain basic health insurance under an annual contract. The government determines the content of the basic cover, although insurers may introduce certain variations to differentiate their offerings. These variations may relate to claims processing and the number of contracted medical providers whose treatments are eligible for reimbursement.
Insurers are obliged to accept all individuals who are legally required to obtain basic health insurance as policyholder. A state-managed risk equalisation system protects insurers whose customer base typically shows behaviour that adversely affects health outcomes, resulting in higher costs. This system balances risks across the industry. Compensation paid to insurers is based on the anticipated costs, which are determined by the characteristics of their customer base. This risk equalisation system is subject to ongoing adjustments.
In 2025, 7.0%1 of policyholders switched to a different health insurer, a slight decrease compared to 2024 (7.4%). With an average 6.8% of policyholders who switch to a different health insurer over the last ten years, the percentage of policyholders switched in 2025 is slightly higher than the average number.
Unlike basic health insurance, supplementary health cover is not compulsory. The number of insured people who choose supplementary insurance continues to decline. In 2025, 80.6% of policyholders on the Dutch market opted for supplementary health insurance (2024: 81.5%). Within a.s.r., the number of policyholders opting for supplementary health cover remained stable 97.9% in 2025 (2024: 96.2%).
- Source: Vektis Zorgthermometer (2025)
Products
In 2025, a.s.r. offered two types of health cover under the a.s.r. brand and the label ’Ik kies zelf’ van a.s.r.:
Basic health insurance, which provides broad coverage of medical costs as prescribed annually by the government. a.s.r. offered two types of basic health cover:
Contracted care policy: the insurer pays medical costs directly to contracted healthcare providers.
Combination care policy: in which the insurer partly remunerates costs directly to contracted care
Supplementary health insurance, which covers specific risks not included under basic health insurance, such as dental care, physiotherapy, orthodontic treatment and medical support abroad.
Contracted care policy remains the most chosen form of basic health insurance in the Dutch market. At year-end 2025, 78.5% of policyholders opted for this type of coverage. Among a.s.r. customers, the share was lower, with 68.8% holding a contracted care policy.
Non-contracted care policy as a type of basic health cover, in which the insurer is reimbursed for medical payments, has been phased out as of 2025 from the Dutch market due to issues of affordability and feasibility.
Strategy and achievements
In 2025, a.s.r. health continued the strategic direction of 2024. a.s.r. health remains committed to promoting future proof healthcare by offering cover that is efficient, affordable and accessible, now and in the future. A key principle in providing future-proof healthcare is the proper fulfilment of the duty of care, the core task of a health insurer. In addition, a.s.r. aims to maintain a stable customer base under its current strategic direction. In 2025, this strategy was successfully executed and even slightly exceeded expectations, resulting in modest growth of the customer base.
Sustainability is a key strategic priority for a.s.r. In 2025, a.s.r. health updated its sustainability strategy, and defined the focus areas for 2026 and beyond. a.s.r. health is committed to reducing the environmental impact of the healthcare sector and supporting healthcare professionals in remaining vital and sustainably employable. a.s.r. aims to accelerate innovation in sustainable healthcare by starting small and scaling up to achieve large-scale impact.
a.s.r. health has developed various initiatives to promote future-proof health care, partly by encouraging policyholders to maintain a healthy lifestyle. The Vitality app motivates policyholders to achieve health-related goals. Once these goals are reached, policyholders can choose from a range of rewards, such as discounts offered by a.s.r.’s partners. In 2024, the Take care of yourself app (Zorg voor jezelf app) was developed and launched on 1 January 2025. Through this app, a.s.r. provides access to an online doctor, a dietician, a mental coach, online physiotherapy and healthcare programmes that can contribute to a healthy lifestyle, appropriate for each individual. By combining the strengths of both platforms, a.s.r. health increasingly connects the Vitality ecosystem with the services offered through the Zorg voor jezelf app. Together, these services form a reinforcing proposition that supports customers in improving their well‑being and maintaining their health sustainably.
A new initiative in the area of vitality and the prevention of healthcare costs is that a.s.r. health customers with supplementary insurance can receive a discount on their membership of the Royal Dutch Walking Association (Koninklijke Wandelbond Nederland - KWbN), thanks to the new partnership with the association.
Customer focus remains a cornerstone of a.s.r.’s strategy and is subject to continuous improvement. In recent years, a.s.r. has invested substantially in AI and automation to further enhance operational efficiency and improve the overall customer experience.
Illustrations of AI developments
An initiative to extract relevant information from foreign expense claims and pre-fill data. As a result, the average processing time per claim has been reduced from eight minutes to four minutes, significantly increasing productivity.
An AI tool that analyses large amounts of unstructured data, such as transcripts, chats, and customer feedback. It identifies trends, clusters topics, and generates actionable insights to improve services and products. This tool is designed for broad applicability across all business lines of a.s.r., enabling organisation-wide improvements in customer service and operational.
A generative AI solution that creates, updates and structures knowledge base articles from multiple sources. These articles are optimised for integration with chatbots, enabling faster and more accurate responses to customer queries.
Additional innovations include the AI web application Lingo, which supports employees in creating content aligned with a.s.r.’s corporate style, including tone and formatting. Furthermore, the quality measurement tool Coach and an in-app chat function were implemented.
Outlook for 2026
The change in premiums for 2026 vary considerably, ranging from significant decreases to significant substantial increases. On average, the adjustments are in line with the projections presented on Budget Day (Prinsjesdag), which indicated only a modest rise in premiums. In 2026 only 6.4% of policyholders switched to another health insurer, one of the lowest switching rates since 2018. This may be partly attributable to the relatively small differences in premium adjustments. The results of the health insurance transfer season show a slight increase in the number of policyholders who opted for a.s.r. in 2026 compared with 2025. Due to a strong market position in terms of pricing, a.s.r. succeeded in achieving its objective of maintaining stable policyholder numbers.
a.s.r. will continue to take steps to ensure health care remains future-proof by focusing on accessibility, partnership and sustainability. a.s.r. supports the agreements laid down in the ‘Aanvullend Zorg- en WelzijnsAkkoord’ and contributes to their implementation and reinforcement. One of these agreements is that health insurers will be given the opportunity to proactively mediate waiting lists. In 2026 a.s.r. will implement the necessary organisational adjustments to put this into practice.
The parliamentary elections held in October 2025 may have a significant impact on the Dutch healthcare system and its market dynamics. Several political parties included proposals in their election manifestos that could place pressure on the current healthcare model.
Following the election results, a minority cabinet has been formed. At this stage, it remains unclear what this will mean for the healthcare sector. Policymaking is likely to proceed more slowly and may depend more heavily on support from opposition parties. This could result in increased uncertainty or delays in healthcare reforms.

Case: Pension regret
pension plan
Case: Pension regret
From pension regret to pension plan
Wim de Vink, an independent entrepreneur, started building his pension too late and now has to continue working beyond his retirement age. Experiencing ‘pension regret’, Wim aims to prevent others from making the same mistake by raising awareness of building up a pension through the Trade Association of Handymen (Vereniging Landelijk Overleg Klussenbedrijven - VLOK). Nick Leben, Sales Manager at a.s.r. pensions, connects with the association, leading to a valuable collaboration.
After various jobs with hardly any pension accumulation, Wim began renovating kitchens in 2004 at the age of 45. Building a pension was not his priority as a starting entrepreneur: ‘The money I earned, I mainly invested in my business.’
When he turned 60 years old and saw his peers retiring, Wim realised he had started saving for his retirement too late: ‘I realised that I did not have an adequate pension scheme in place, which means I have to continue to work until I am 70 years old.’
A distant concern
As former chair of VLOK, Wim felt responsible for increasing pension awareness among fellow entrepreneurs. ‘I wanted to prevent others from making the same mistake and experiencing pension regret.’ He is urging the current chair, Dennis Kosten, for the association to take action for the financial security of its members.
Dennis contacted a.s.r. via the Pensions website. Nick recalls: ‘When Dennis called, it quickly became clear that we could offer something meaningful for VLOK members. The association represents a large pool of self-employed professionals in the construction industry. Many are not focused on their pension. Building a financial buffer for later often feels like a distant concern and pensions are perceived as a complex subject.’
Together with Dennis and other board members, Nick mapped members’ needs and explained what a.s.r. could offer. This establishes a partnership in which VLOK motivates its members to take action, while a.s.r. vooruit provides support in arranging their individual pension plans.

Strong interest
During VLOK’s general meeting, Nick introduced the pension plan: ‘All these self-employed professionals, who usually talk to suppliers about discounts on toilet bowls, were sitting on the edge of their seats asking questions. Some were critical and sceptical, but interest was strong.’

Members are informed too about the importance of building up a pension through webinars, newsletters, and a dedicated landing page. With a free telephone consultation and a discount – no administration fees are due in the first year – members are encouraged to start building their pension. ‘Many accounts have already been opened and funds deposited,’ Nick says proudly.
The collaboration soon extended beyond pensions. Nick and colleague Vincent Blaauboer then involved the Income department: ‘VLOK has a bread fund for self-employed professionals who become incapacitated. Income could potentially link to this with an additional disability insurance product,’ Nick explains. ‘Discussions are ongoing and promising.’
Too late
Wim remains pragmatic about not being able to benefit himself from the pension accrual possibilities he helped to initiate: ‘I am simply too late, so I have to keep working. Fortunately, I love my craft and my mortgage is nearly paid off.’
Nick stresses that Wim is far from alone in this: ‘According to CBS, around 13% of workers were self-employed in 2023, and this number continues to grow. Many postpone building up a pension, which can lead to financial problems. As a financial service provider, we see it as our responsibility to prevent this and make building up a pension as easy as possible. That way, entrepreneurs can focus on what they do best: running their business.’
4.3
Life 
Pension DC inflow(in € million)3,011 2024: 2,768 | Pension buy-out(in € million)2,810 2024: 69 | Annuity inflow(in € million)646 2024: 581 |
Operating result(in € million)1,259 2024: 1,076 | Operating expenses(in € million)483 2024: 467 | Result before tax(in € million)1,042 2024: 1,151 |
Premiums received and DC inflow(in € million)7,643 2024: 4,937 | ||
Pension brands | Funeral brand | Individual life brands |
The Life segment comprises the life insurance entities and their subsidiaries. The life insurance entities offer financial products such as life insurance contracts and life insurance contracts on behalf of policyholders. The Life segment also includes ASR Premiepensioeninstelling N.V. (a.s.r. IORP) which offers investment contracts to policyholders that bear no insurance risk and for which the actual return on investments allocated to the contract is passed on to the policyholder. Furthermore, ASR Vooruit B.V., the investment firm that performs activities related to private investing for customers, is included.
4.3.1 Financial performance
Premium and DC volume
Premium and DC inflow in the Life segment increased by 54.8% to € 7.6 billion (2024: € 4.9 billion), primarily driven by three pension buy-outs totalling € 2.8 billion.
Pension DC inflow rose by 8.8% to € 3.0 billion (2024: € 2.8 billion) driven by organic growth. The annuity inflow increased 11.2% to € 646 million (2024: € 581 million), reflecting higher DC accumulation and increased maturity of DC AuM.
Furthermore, premiums received in Funeral increased modestly and the service books (Individual life and Pensions DB) showed an expected decline.
Assets under Management (AuM) of DC pensions increased € 3.3 billion to € 30.0 billion (2024: € 26.7 billion) driven by net inflows and positive revaluations.
- ‘Premiums and DC volume’ is equal to the premiums invoiced plus the customer funds deposited by the insured DC-products and the IORP-products which, by definition, are not premiums.
Operating expenses
Operating expenses increased by € 16 million to € 483 million (FY 2024: € 467 million) driven by increased investment related operating expense activities which are only partly offset due to lower expenses as a result of the realisation of cost synergies.
Operating result
The operating result increased by € 183 million to € 1,259 million (2024: € 1,076 million), reflecting an increase in both the operating insurance service result (OISR, including other result) and the operating investment and finance result (OIFR).
The OISR (including other result) increased by € 36 million to € 478 million, mainly due to an increased CSM release, positive experience variance and higher contribution from associates, partly offset by a higher loss on new DC business.
The OIFR increased by € 147 million to € 781 million, primarily driven by a higher investment margin, supported by favourable government spread developments, increased equity and real estate exposure, and a lower UFR drag consistent with higher interest rates.
Result before tax
The result before tax decreased by € 109 million to € 1,042 million (2024: € 1,151 million). The increased operating result is offset by non-operating adjustment items. The investment related adjustment items amounted to € -255 million, impacted by market developments, reflecting increased interest rates partly offset by positive real estate revaluations. Non-investment related adjustment items amounted to € 38 million, mainly reflecting positive adjustments from changes in future services of the loss component and a.s.r.’s own pension scheme, partly offset by amortisation of intangibles
Update business combination with Aegon NL
As part of the integration plans announced in 2022 and 2023, a.s.r. is in the process of preparation for the legal merger of ASR Levensverzekering N.V. with AEGON Levensverzekering N.V. in 2026. This marks the final step in the Aegon NL integration. With the legal merger, all assets and liabilities, including all rights and obligations of Aegon life will be transferred to a.s.r. Life as the acquiring entity. After this, Aegon life will cease to exist and all Aegon life's insurance contracts will be rebranded to the a.s.r. brand. The remaining insurance entity, ASR Levensverzekering N.V., will continue to sell life insurance products under the a.s.r. label.
In preparation of the legal merger, a.s.r. filed an application with DNB in December 2025 to apply a single PIM for the combined life insurance activities of the Group. The application for the legal merger is filed with DNB in the first quarter of 2026. The merger is expected to take place in the second half of 2026. Both the application of the single PIM and the execution of the legal merger are subject to approval by DNB.
With the legal merger, almost all of a.s.r.’s Individual life & Funeral and Pension insurance activities will be combined into one single life insurer, creating the second largest life insurance entity in the Netherlands. The merger is an important milestone in the integration of Aegon NL within a.s.r., reducing the number of IT systems and models applied by the Group.
4.3.2 Pensions
a.s.r. is an important player in the changing Dutch pension market, well-positioned to capture the opportunities from the market on the back of new pension legislation. The portfolio consists of Defined Benefit (DB) as well as Defined Contribution (DC) schemes, with an overall market share of 34%. The total customer base consists of some 66,500 schemes with 2.5 million participants.
a.s.r. offers a full range of pension products, including various DC options for employers and both fixed and variable pension annuities products for employees at retirement. For employers with DB schemes, a.s.r. provides the option to purchase indexations of these rights. Additionally, a.s.r. offers a pension buy-out product for pension funds that prefer not to transfer their accrued rights to the new system under the Future Pensions Act (Wet toekomst pensioenen - Wtp) but wish to transfer them to an insurer.
Distribution of pensions mostly takes place via independent advisors. a.s.r. maintains an important relationship with the advisory channel. A large number of customers are served by ASR Premiepensioeninstelling N.V., an Institution for Occupational Retirement Provision (IORP).
Market
Since the Wtp came into effect on 1 July 2023, the pensions market has been in full swing. The main purpose of this act is to enable all pensions to become contribution-based with individual pension capitals. Communications and advice on customer options and choices form important parts of the Wtp.
All existing contracts must be adapted to this act before 1 January 2028. New contracts will be subject to the new regulations immediately. Consequently, all DB schemes will be converted into DC schemes in the coming years, but existing DB claims will remain in place.
In order to prepare for these changes, a.s.r. has developed a new administration system for all its DC products, with the aim of further digitalisation of communications and guidance on choices, while enabling customers to arrange their financial affairs themselves online. By integrating all DC products in one system in the coming years, a.s.r. can manage its DC business in a way that is cost efficient and future-proof. The DB schemes of Aegon NL administered on a TKP platform, together with a.s.r.’s DB schemes, will be integrated into one DB administration platform in the coming years. This integration will lead to a more efficient and future-proof platform for managing DB schemes.
Products
Strong capabilities and a full range of products are enabling growth in Pension DC and annuities, as well as taking a fair market share in the buy-out market. a.s.r.’s Pension business products fully support customer needs in both the asset accumulation and payout phases.
DC - accumulation phase: a.s.r. provides DC pension solutions, including WerknemersPensioen, DoenPensioen and Cappital Pensioen, enabling participants to build retirement capital through lifecycle-based investment strategies. These propositions are characterised by a clear product structure, prudent investment principles and a strong digital service model, aligned with applicable regulatory requirements.
Annuities - payout phase: in the payout phase, a.s.r. offers fixed and variable annuities under the annuities proposition. These products provide lifelong retirement income through a balanced approach to investment risk, supported by transparent product features and disciplined risk management. The offering is focused on long-term financial security for participants.
Buy-out market: a.s.r. participates in the buy-out market by taking over pension liabilities from pension funds. Through these transactions, a.s.r. assumes investment and longevity risks, contributing to stability for stakeholders and supporting orderly balance sheet de-risking. This activity is managed within a disciplined capital and risk framework.
Strategy and achievements
With a strong market position and a wide range of pension solutions, a.s.r. benefits from significant scale advantages, thanks to its size and the extensive experience and expertise it has built up in customer service.
Such as its extensive experience in participant activation and option guidance, which are crucial factors in the transition to the Wtp. Furthermore, a.s.r. is well positioned and ready to capture the opportunities that arise from the market for buy-outs of pension funds.
The current pensions strategy consists of five focus points:
Customer: a.s.r.'s customers, employers and their employees receive uniform customer service and support. Whilst implementing new legislation, transformations and integration work, a.s.r.'s primary focus remains on the customer.
Transformation: a.s.r. is creating a scalable pension company and building a joint culture that puts the participant at the centre. Additionally, a.s.r. is taking the first steps in the use of (generative) AI.
Sustainable value creation: a.s.r. creates value for customers, shareholders, employees and society. a.s.r. aims for sustainable returns.
Partners: a.s.r. collaborates with its partners with a long-term focus, developing, training and innovating to transform pensions together.
In Control: a.s.r. complies with all current legislation and regulations at all times and is in control of performance and processes.
In 2025, a.s.r. successfully converted 6,611 schemes to Wtp-proof schemes, resulting in a total of 28,9% Wtp-proof schemes, including new business. Following the migration of the Employees’ Pension product to the upgraded landscape in 2024, a.s.r. continued to optimise both the system landscape and the underlying customer processes throughout 2025.
The remaining migrations within the DC proposition are scheduled to transition to Plexus, the policy administration system, in the coming years. Furthermore, the benefit payments were migrated as part of the integration of Aegon.
In 2025, three successful pension buy-outs were completed1, bringing the total buy-outs since 2024 to four. The transfer of these buy-outs will increase the assets and liabilities of a.s.r. by approximately € 2.9 billion. With the completion of these buy-outs, a.s.r. further strengthened its position in the buy-out market and remains well positioned for future opportunities.
- One of these buy‑outs concerns the Pension Fund for Dentists and Dental Specialists (Pensioenfonds Tandartsen en Tandarts‑specialisten), which was in the approval process with the DNB at the end of 2024.
Outlook for 2026
In 2026, a.s.r. will continue to focus on growing the business and retention of existing customers while working on the integration of legal entities of the a.s.r. and Aegon NL pension businesses. In 2026, a.s.r. will also work on preparing the remaining migrations within the DC proposition to Plexus and the integration of the DB portfolios of a.s.r. and Aegon DB schemes.
Furthermore, a.s.r. will support its customers with the transition to the new legislation and work on the conversion of existing pension schemes towards a Wtp-proof scheme.
4.3.3 Individual life & Funeral
The Individual life & Funeral product line combines the management of a.s.r.'s Individual life & Funeral insurance portfolios.
Market and products – Individual life
Since 2024, a lot of media attention has been paid to the importance of a financial safety net in the event of death, for homeowners, tenants and self-employed persons. The Dutch Association of Insurers stimulates this awareness.
Individual term life insurance is the only active individual life insurance product that a.s.r. actively sells. a.s.r.'s market share in the individual life insurance market was 3.1%1 (Q3 2024: 1.1%). Premium levels have been increased as of 1 October, and as a result, new production is expected to decrease in 2026.
- Most recent available figures are as of end of Q3 2025.
Market and products – Funeral
a.s.r. sells funeral insurance, which allows customers to plan their own funeral with the amount paid out to their heirs.
a.s.r. realised a growth in market share to 19.2%1 in 2025 (Q3 2024: 14.3%). This increase was primarily driven by substantial growth in the online channel, which expanded by approximately 70% compared to 2024. Brand campaigns on television and online have made an important contribution to increase brand awareness.
- Most recent available figures are as of end of Q3 2025.
Strategy and achievements
Individual life & Funeral focuses on making life easier for customers, providing support when it matters and delivering on commitments. The purpose is to serve existing customers in the best possible way while continuing to welcome new customers. Sustainable solutions are pursued to create long‑term value for customers, employees, society and shareholders. Smart technology enables efficient processes and helps maintain a low cost base.
Together, the product lines are developing an agile organisation that responds effectively to change and benefits from synergy. This is achieved through strong digital accessibility supported by personal contact at the moments that matter most. The long‑term ambition is to contribute to a future in which financial security, social relevance and an inclusive culture take centre stage.
In financial terms, Individual life & Funeral made a stable contribution to a.s.r.'s results in 2025. The scalability of the organisation ensures that costs move in line with the movements of the portfolio.
The migration of the Aegon Individual life & tontines portfolio, comprising approximately 550,000 policies, was fully completed in 2025, with the exception of a small sub‑portfolio that was transferred as of 1 January 2026.
The implementation of the settlement agreement between a.s.r. and the representatives of unit-linked insurance policyholders was also an important activity (see section 5.4.3.4). In addition, the financial objectives and the employee and customer satisfaction targets were also achieved in 2025.
In July 2025, a.s.r. took over the funeral portfolio of De Onderlinge van 1719. The funeral policies were successfully migrated to the a.s.r. systems at the beginning of October 2025. As a result, a.s.r. has officially become the oldest insurer in the Netherlands.
Outlook for 2026
The year 2026 will be dedicated to further optimising and digitalising the operational processes of Individual life & Funeral. In addition, a pilot will start, offering a.s.r. Vitality for newly issued funeral policies. a.s.r. remains vigilant in identifying opportunities to expand or at least retain the portfolios for Individual life & Funeral.
4.4
Asset Management 
Total fee-based income(in € million)343 2024: 325 | Total operating expenses(in € million)243 2024: 242 | Total operating result(in € million)120 2024: 100 |
AuM - Asset Management(in € billion)102.9 2024: 103.6 | AuM - Real Estate(in € billion)13.19 2024: 8.2 | AuA - Mortgages(in € billion)87.7 2024: 86.6 |
AuM for third parties(in € billion)37.3 2024: 34.8 | ||
Asset Management brand | Real Estate brand | Mortgages brands |
The Asset Management segment involves all activities relating to asset management including investment property management. These activities include among others ASR Vermogensbeheer N.V., ASR Real Estate B.V. and AEGON Hypotheken B.V.
4.4.1 Financial performance
Operating result
The operating result increased by € 20 million to € 120 million (2024: € 100 million), supported by all business lines, mainly Mortgages. In Mortgages, fee income improved in addition to lower operating expenses driven by the successful portfolio migration of Aegon mortgages to a.s.r.’s targeted platform.
Assets under Management
Assets under management for third parties increased by € 2.5 billion to € 37.3 billion, mainly due to positive revaluations across nearly all of a.s.r. asset managements investment and real estate funds and pension DC inflows, partly offset by an outflow related to a pension buyout deal that transferred the assets to the general account.
Reconciliation Assets under Management with Financial statements
| 31 December 2025 | 31 December 2024 | ||||||||||
|---|---|---|---|---|---|---|---|---|---|---|---|
| (in € million) | Note | Asset Management | Real Estate | Mortgages1 | Eliminations | Total AuM | Asset Management | Real Estate | Mortgages1 | Eliminations | Total AuM |
| PPE Plant and Buildings for own use | 7.5.2 | - | 496 | - | - | 496 | - | 550 | - | - | 550 |
| Investment property | 7.5.3 | - | 3,220 | - | - | 3,220 | - | 3,364 | - | - | 3,364 |
| Investments | 7.5.5 | 45,689 | 6,102 | 27,350 | - | 79,141 | 47,143 | 5,428 | 28,022 | - | 80,593 |
| Total | 45,689 | 9,818 | 27,350 | - | 82,857 | 47,143 | 9,342 | 28,022 | - | 84,506 | |
| Assets under Management for third parties | n/a | 34,184 | 3,164 | - | - | 37,348 | 31,857 | 2,950 | - | - | 34,807 |
| Reconciling items2 | n/a | 22,995 | 204 | 60,316 | -3,787 | 79,728 | 24,598 | -4,108 | 58,563 | -3,857 | 75,197 |
| Alternative Performance Measure | 102,868 | 13,186 | 87,666 | -3,787 | 199,933 | 103,5983 | 8,184 | 86,585 | -3,857 | 194,510 | |
- For Mortgages, the Assets under Administration is reported.
- Reconciling items contains, among others, mortgages administrated for third parties and investments related to direct participating insurance contracts of Aegon life.
- Following the finalisation in 2025 of the integration of the asset management activities, the Assets under Management as at 31 December 2024 have been adjusted by € 28.9 billion.
Mortgages
Mortgage origination in 2025 amounted to € 9.0 billion (2024: € 9.2 billion), reflecting robust commercial performance during a period of major portfolio migrations.
The mortgages under administration amounted to € 87.7 billion (2024: € 86.6 billion). The quality of the mortgage portfolio remains very strong. Payment arrears of more than three months continue to be less than 0.1% for the overall mortgage portfolio and credit losses are negligible.
Operating expenses
Operating expenses remained fairly stable at € 243 million (2024: € 242 million), reflecting higher expenses at asset management and real estate, almost fully offset by lower operating expenses in Mortgages driven by realisation of cost synergies.
Result before tax
The result before tax increased by € 6 million to € 78 million (2024: € 72 million) reflecting an increase of the operating result, partly offset by a higher negative impact from adjustment items compared to 2024. The increase in non-investment related adjustment items mainly relates to the amortisation of intangible assets. Investment related adjustment items reflect fair value changes in the derivatives portfolio held by the Mortgage business to hedge interest rate risk.
4.4.2 Asset Management
ASR Vermogensbeheer N.V. (Asset Management) conducts all of a.s.r.’s asset management activities, with the exception of direct real estate. Real Estate assets are managed by a.s.r. real estate; for details see section 4.4.3.
Market
The asset management market is consolidating rapidly as a result of increased legislation, stricter supervision, international competition and the realisation of economies of scale. The number of independent Dutch asset managers has been shrinking for years, while there remains a need for specific knowledge of the Dutch market. This provides opportunities for a.s.r., as a focused Dutch asset manager that is close to the market, personal and solution-oriented. Furthermore, the Dutch pension landscape is changing due to the implementation of the Dutch Future Pensions Act (Wet toekomst pensioenen - Wtp). As a provider of insurance, pension administration and asset management services, this offers possibilities for a.s.r. to offer integrated solutions for the pensions market, for example via buy-outs, defined contribution propositions or tailored asset management solutions.
Products
a.s.r. asset management manages separate accounts and mutual funds for customers outside of a.s.r. The product range includes corporate bonds, government bonds, equities and balanced mandates. a.s.r. asset management provides bespoke solutions with a sound return on investment. It primarily invests in assets and markets that it really understands, in countries and companies that comply with a.s.r.'s social and sustainability criteria, demonstrating that sustainability and financial returns can go together. For example, a.s.r. introduced a global impact equity fund in 2023 and a Paris-aligned benchmark credit fund in 2025. a.s.r. asset management also offers funds and other solutions in various asset classes that may be implemented in different lifecycle products, which can be used for defined contribution and other pensions solutions.
Strategy and achievements
a.s.r. asset management manages assets for its own account and provides asset management services to affiliated entities and third parties. a.s.r. aims to create sustainable value for its stakeholders, both now and in the future. To achieve this, a.s.r. asset management pursues not only financial returns, but also positive social impact, by investing in assets that are assessed against environmental and human rights criteria, and by selecting long-term impact investments.
Furthermore, a.s.r. asset management complies with Solvency II requirements, operates cost-efficiently, and generates fee income through the management of mutual funds. These funds are also used within defined contribution pensions products such as 'Werknemerspensioen' and 'Doenpensioen'.
a.s.r. asset management applies an investment approach for its third-party customers that is aligned with the approach for its own account. The current investment climate, characterised by rising geopolitical uncertainties and modest economic growth, presents significant challenges. One of the ways that a.s.r. asset management protects its investment returns is through effective diversification, investing in a combination of liquid assets like bonds and equities and ‘real assets’, such as real estate. a.s.r. asset management focuses on managing the general account portfolios of the insurance entities of a.s.r., as well as the affiliated and third-party portfolios, with particular emphasis on the pensions business.
Outlook for 2026
In 2026, a.s.r. asset management will continue to serve its clients through a combination of integrated asset management solutions and individual asset classes, such as fixed income and equities. As part of its sustainability strategy, a.s.r. has set an impact target, focusing on investments that generate a measurable and social or environmental impact alongside financial returns. a.s.r. asset management will also continue to increase the managed assets of affiliated portfolios and external customers, particularly in the pensions market, where the Future Pensions Act will be pivotal.
4.4.3 Real Estate
a.s.r. real estate invests in real assets (real estate, infrastructure, forestry and agricultural land) for institutional investors. a.s.r. has been investing in real assets for over 130 years.
As an investor in real assets, a.s.r. recognises its responsibility in contributing towards liveable and sustainable buildings, towns, cities and communities. a.s.r. strives to contribute to a sustainable and climate-adaptive living environment for all – now and for future generations.
The real estate portfolio at year end totalled € 13.2 billion (2024: € 12.4 billion), divided into € 10.0 billion (2024: € 9.4 billion) on behalf of a.s.r., and € 3.2 billion (2024: € 3.0 billion) on behalf of institutional investors. The total inflow of new capital from institutional investors amounted to € 0.1 billion (2024: € 0.3 billion). The asset advice by a.s.r. real assets investment partners totalled € 7.0 billion (2024: € 5.5 billion), all on behalf of institutional investors.
Market
Despite ongoing geopolitical headwinds, the Dutch economy maintained positive momentum in 2025. GDP growth has been revised to 1.7% for the full year, outperforming the eurozone average. While inflation remained elevated, it is projected to fall below 3%, primarily due to slower wage growth. Solid fundamentals, including low unemployment, real income growth, and limited real estate supply, continued to drive rental growth across the office, retail, science park, and residential sectors. However, selectivity remained crucial, as the gap between high-performing and underperforming locations and assets widened further. The renewable energy sector benefited from an accelerated transition to a low-carbon system, yet grid congestion and volatile energy prices continue to challenge investor confidence. Meanwhile, the Dutch farmland market remained fundamentally robust.
The ECB's interest rate cuts and a stabilizing Dutch 10-year government bond yield increased liquidity in the investment market. Dutch real estate investment volume reached € 134.5 billion in 2025, marking a 15% year-on-year increase. This led to softened yield impacts and stabilised real estate values. The residential investment market emerged as the most dynamic real estate sector, driven by rising owner-occupier prices. Overall, Dutch investor sentiment shifted from broad caution to targeted allocation, with a focus on sectors offering stable income streams, clear demand outlooks and proven resilience against potential headwinds.
Products
a.s.r. manages non-listed sector funds, which invest in retail and residential properties, offices, real estate on science parks, agricultural land and renewable energy in the Netherlands. These funds are open to institutional investors. a.s.r. is the anchor investor in these funds.
a.s.r. real assets investment partners is part of a.s.r. real estate but operates independently. For institutional clients, including a.s.r., it develops investment strategies, implements these through manager selection processes and ensures the monitoring, reporting and engagement of globally diversified real assets investments.
Strategy and achievements
On behalf of institutional investors, a.s.r. real estate invests responsibly in high-quality real assets that fit within a clearly defined strategy. This provides the optimal balance between long-term return on investment and value creation, benefiting not only a.s.r.’s clients but also society as a whole. For more information about the real estate ESG vision and its four strategic themes, see section 3.1.2.
Following the merger of a.s.r. and Aegon NL in 2023, a.s.r. became a 50% shareholder in Amvest. On 8 July 2025, a.s.r. and PFZW (Pensioenfonds Zorg en Welzijn) agreed to divide Amvest's real estate activities. This transaction is approved by the AFM and ACM, and was closed in the beginning of 2026.
As part of the deal, PFZW acquired a.s.r.’s shares in Amvest. The management of a.s.r.’s separate account, comprising approximately 7,500 residential units, are transferred to a.s.r. real estate. As a result, the assets under management and advice of a.s.r. real estate increased to more than € 20 billion. This scale contributes to further efficiency, and a.s.r. real estate strengthens its position in the Dutch real estate market through this transaction.
The development portfolio of the Amvest Development Fund was split between a.s.r. and PFZW. PFZW and a.s.r. remain jointly involved in a number of Amvest development projects. a.s.r. transferred its share of the development projects to its development organisation ASR Real Estate Development B.V., and intends to realise approximately 13,000 residential units.
During 2025, ASR Dutch Science Park Fund acquired one office and laboratory building at Leiden Bio Science Park and two in Biotech Campus Delft. a.s.r. real estate successfully raised capital for the ASR Dutch Science Park Fund. Pension fund KPN increased its commitment to € 45 million and insurance company De Goudse invested another € 10 million in 2025.
Pension fund for the agricultural and green sector, BPL Pensioen, invested an additional € 90 million in the ASR Dutch Farmland Fund in 2025, in addition to the € 210 million committed in 2022.
In 2025, a.s.r. real assets investment partners was selected by a German industry pension fund as partner for their real estate portfolio. This partnership covers the optimisation, further expansion and management of a globally diversified real estate portfolio, which is expected to reach at least € 800 million.
More information can be found on the a.s.r. real estate website and the a.s.r. real assets investment partners website.
Outlook for 2026
Despite geopolitical uncertainty, the global economy is expected to grow modestly in the coming years, with Dutch gross domestic product projected to increase by 1.2% in 2026. Household spending is anticipated to be supported by rising house prices, relatively low but gradually increasing unemployment, real wage growth and improving consumer confidence.
While central bank interest rates continue to trend downward, the yield on the Dutch 10-year government bond is expected to remain relatively stable around 3.0%.
Stable market conditions are expected to support a return to positive value growth, underpinned by solid occupier markets. The shortage of rental housing continues to intensify, while demand for agricultural land remains resilient, further driven by the expansion of renewable energy initiatives.
Commercial real estate markets are becoming increasingly polarised. Assets outside prime categories remain vulnerable as occupier interest is concentrated in select segments, partly driven by rising sustainability requirements. Rental and value growth are anticipated in the following areas:
Primary high streets in major cities;
Dominant convenience centres;
High-quality G5 office spaces near Intercity train stations;
Modern research and development (R&D) facilities in leading science parks.
4.4.4 Mortgages
a.s.r. operates in the residential mortgage market and provides mortgage loans to retail customers for its own account and external investors. The mortgage loans for the a.s.r. brand are issued by ASR Levensverzekering N.V. and for the Aegon brand by Aegon Hypotheken B.V. and Aegon Levensverzekering N.V.
Market
The Dutch mortgage market continued to grow in 2025 with a record number of almost 239,000 transactions, which is largely related to the strong increase in sales of former investment properties. According to the Dutch real estate association NVM, the required acceleration in supply remains absent with 27,000 new homes being sold in 2025, similar to the level in 2024. Demand is being supported by real wage growth and a slightly lower mortgage interest rate. These developments have resulted in an increasing housing price of 8.6% for the full year.
Products
a.s.r. offers its mortgage products via intermediaries to its customers through two different mortgage brands: Aegon and a.s.r.
Under the Aegon brand, standard products (including annuity, linear and interest-only mortgages) are offered to a broad customer base. In addition to standard products, the a.s.r. brand offers specialised products for distinct customer types. This includes products for first-time buyers, sustainable home modifications and senior citizens. With these products, a.s.r. aims to make the housing market more affordable to young and elderly people and offer more customers the option to make their homes more sustainable.
Strategy and achievements
a.s.r. is focused on reinforcing its position as one of the leading sustainable mortgage companies in the Netherlands. In 2025, a.s.r. was able to further grow its fee business from € 157 million to € 165 million through higher assets under administration while simultaneously enabling asset strategies in which mortgages are used as an attractive investment for a.s.r.'s own account as well as for external investors.
In 2025 the entire Aegon-branded mortgage portfolio has been successfully migrated to the Stater platform, which marks an important milestone in the integration of the Aegon NL and a.s.r.-branded mortgage portfolios.
a.s.r.’s mortgage business showed strong financial and commercial results in 2025 despite the operational challenges related to the integration of Aegon NL. Appetite for mortgages from external investors remained at lower levels than previously, further impacted by imposed limits on new mortgage production because of the sale of Knab to BAWAG Group AG in 2024. This was largely compensated by additional internal funding resulting from pension buy-out deals.
This year, a.s.r. further improved its sustainability mortgage proposition by differentiating in the amount that is pro-actively offered in the interest rate offer for sustainable measures. The amount is now based on the energy label of the property, making this offer more tailor-made to the customers situation. In addition, a.s.r. joined forces with HomeQgo to provide customers insight into sustainable measures that could be made in their home.
Outlook for 2026
In 2026, a.s.r. expects a stabilising mortgage market due to a limited number of permits granted for new-build housing and a slowdown in the sale of former investment properties. However, large interest rate shocks can have a significant impact on the Dutch housing market. In a stabilising mortgage market, a.s.r. aims to expand its market share, due to stronger commercial momentum. Additionally, a.s.r.’s mortgage businesses will be fully integrated by relabelling the Aegon-branded mortgage portfolio to the a.s.r.-brand.
The Assets under Administration of the mortgage portfolio is expected to decline due to the sale of the Knab mortgage portfolio to BAWAG Group AG. Nonetheless, it is expected that the declining operating result due to the sale of the Knab mortgage portfolio is offset by increasing cost efficiency.
This page is intentionally left blank.

Case: Life interest mortgage
Case: Life interest mortgage
Enjoying life with financial peace of mind
For retirees whose property value exceeds their remaining mortgage balance, a.s.r.’s life interest mortgage offers an attractive solution. This product enables customers to unlock part of their home equity to purchase another property, improve the sustainability of their current home or make it future-proof. Neriman Polat, Manager Business Development Mortgages, explains: ‘This mortgage is ideal for customers seeking financial security.’
Dieneke, a 72-year-old former nurse, is one such customer. After her wife Leny passed away, Dieneke contacted her financial adviser, Sjaak, to review her situation. ‘Leny worked her entire life at the same bank and had everything well arranged: our insurance policies, the mortgage and some investments. But I realised that if I want to do something different with my life, now is the time, while I am still in good health.’

A holiday home
Dieneke wishes to remain in her current home in Rosmalen but also loves the seaside. A holiday home on the Zeeland coast seems perfect. She sells the shares still registered in Leny’s name: ‘I have no desire for stress and uncertainty about investments.
During discussions with Sjaak, Dieneke emphasises the importance of financial peace of mind: ‘It gives me a sense of security to know exactly what my outgoings will be, without future changes. I hope to have some good years ahead, and the last thing I want is to worry about money.’ Sjaak suggests having her property valued and taking out a Life Interest Mortgage with a.s.r. This allows her to finance the holiday home in Zeeland and secure fixed housing costs for the rest of her life.
Certainty
Neriman Polat, Manager Business Development Mortgages, explains: ‘The life interest mortgage from a.s.r. is interest-only. You pay only interest, which is fixed for life. This makes it ideal for customers seeking financial certainty.’ The mortgage is designed exclusively for retirees with home equity who wish to use it for another purpose, such as making their home sustainable or future proof, or purchasing a second property.
A point of consideration is that the life interest mortgage cannot be transferred to a new property. Neriman adds: ‘And because the interest rate, which is paid monthly, is fixed, you do not benefit from any future rate reductions. On the other hand, you are protected against increases.’ With a verzilverhypotheek or opeethypotheek, no monthly interest is paid; instead, interest is added to the loan balance, and the rate is not fixed for life. If property values fall, this can result in a higher residual debt because the sale proceeds may not cover the mortgage.
Neriman summarises: ‘With the life interest mortgage, you pay fixed monthly interest and avoid uncertainty about future interest rates or residual debt.’ That is exactly what Dieneke was looking for.
Award-winning mortgage
In 2021, the life interest mortgage from a.s.r. won the Gouden Lotus Award for the most innovative mortgage product. The award winners are selected by advisers. Neriman notes: ‘We still see strong appreciation from advisers for our life interest mortgage. Mortgages are complex and involve significant amounts. In practice, customers often base their choice of lender on the adviser’s recommendation, which is usually decisive.’
Dieneke also relied on her adviser's guidance: ‘When Sjaak suggested closing Leny’s bank account, I felt a little guilty. But it wasn't long before I thought: if I can get better conditions, why not? I need to move forward, in my own way. And I have a very positive impression of a.s.r. The adverts appeal to me because they speak to society as a whole. Everyone understands the message. We were customers of Leny’s bank for 44 years long, so when I see a.s.r. in the media now, I am proud to be a customer of a.s.r.!’
Dieneke has been enjoying her holiday home on the Zeeland coast for almost a year. It is just a 90-minute drive from her home in Rosmalen, and her two dogs always join her on the back seat. ‘Sjaak was a great help to me in making financial choices. Thanks to the life interest mortgage, I can enjoy the years ahead.’

4.5
Distribution and Services 
Fee Income(in € million)468 2024: 377 | Operating expenses(in € million)381 2024: 319 | Operating result(in € million)66 2024: 50 |
Distribution and Services brands | ||
The Distribution and Services segment includes activities relating to the distribution of insurance contracts and includes among others the financial intermediary business of Van Kampen Groep, Dutch ID, SuperGarant, Poliservice, Corins, HumanTotalCare, Nedasco, Robidus and TKP.
4.5.1 Financial performance
On 1 October 2025, a.s.r. completed the acquisition of the remaining 55% interest in HumanTouch Holding B.V. (HTH), the parent company of HumanTotalCare B.V., for a total consideration of € 108 million. Following the transaction, HTH has been fully consolidated within the Distribution and Services segment. From the acquisition date, HumanTotalCare contributed € 60 million to a.s.r.’s revenue and € 4 million to the net result after tax for Q4 2025. As part of the initial purchase price allocation, intangible assets of € 224 million were recognised in connection with this acquisition.
Fee income
Fee income increased by € 91 million to € 468 million (2024: € 377 million). This increase was driven by the acquisition of HumanTotalCare, supported by additional smaller acquisitions and continued organic business growth.
Operating expenses
Operating expenses increased by € 62 million to € 381 million (2024: € 319 million), mainly as a result of the acquisition of HumanTotalCare, in addition to several smaller acquisitions and organic business growth.
Operating result
The operating result of the Distribution and Services segment increased by € 16 million to € 66 million for FY 2025 driven by acquisitions, organic growth and some non-recurring items. The acquisitions relate to a number of smaller acquisitions and the acquisition of the remaining 55% stake in HumanTotalCare.
Result before tax
The result before tax increased by € 42 million to € 59 million (2024: € 16 million), reflecting a higher operating result as well as less negative impact from non-investment related adjustments. The adjustments and incidental items amounted to € -8 million (2024: € -33 million), reflecting investments by TKP in response to regulatory pension reform and the amortisation of intangible assets, partly offset by positive adjustments from divestments.
4.5.2 Market
Developments in the distribution sector in 2025 show that the distribution landscape remains fluid. Ongoing consolidation and growth of larger distribution companies remain the key developments in this market. The general trend of further growth in the market share of distribution companies continued in 2025; the top 50 distribution companies further increased their market share through organic growth and acquisitions. Hybrid distribution models of insurance products, such as intermediaries and online, also remain. a.s.r. stays on top of these developments in order to facilitate and support the independent intermediary channel.
Strategy and achievements
The D&S business, combined with organic growth of the distribution businesses acquired in previous years, strengthened a.s.r.’s market share in the distribution landscape. The business activities of these distribution companies grew compared to 2024.
Since 2022, the top holding company Distribution and Services Holding B.V. has been responsible for the distribution businesses, directing and coordinating the businesses and their management. All companies under this top holding are working to realise a.s.r.’s strategy and ambition to be a major player in the Dutch distribution market.
Van Kampen Groep
Van Kampen Groep (VKG) is one of the major full-service providers in the Dutch market. It provides financial advisors with access to a wide range of financial services for retail and business customers, combined with quick and efficient handling. In 2025, VKG focused on optimising the operational processes, the cost basis and on building a future-proof IT environment and system.
Nedasco
Nedasco is one of the large full-service providers in the Dutch market. It offers a wide range of products and financial services from different insurers. Nedasco is active in both the commercial and the private segments and combines service with fast and efficient handling, often using automated processes. The company has achieved organic growth in recent years, primarily in the P&C and income segments.
Dutch ID
Dutch ID’s activities (Boval and Felison brands) are based on its mission: to let businesses conduct business (laat de ondernemer ondernemen). This is reflected in the sectoral service strategy, in which knowledge of industry, trade and customers is used to provide the best possible service to SMEs. This is implemented in conjunction with (sectoral) organisations such as the Netherlands Agricultural and Horticultural Association (Land- en Tuinbouw Organisatie Nederland - LTO), evofenedex and the Dutch Transport Operators’ Association (Transport en Logistiek Nederland). SuperGarant has become part of Dutch ID and operates with a sector-specific service strategy for the retail sector, focusing on food stores and supermarkets.. In line with this strategy, Dutch ID plays an active role in the changing field of service provision, technological development and views on the insurance value chain. Owing to its versatility and flexibility, Dutch ID has built a strong position as a service provider in this playing field and further strengthened its market share in 2025, primarily through the growth of its income portfolio at its subsidiary Felison.
Poliservice
Poliservice B.V. is a financial services provider with retail and business customers throughout the Netherlands. These services consist mainly of advising and mediating in insurance, savings, income and pensions, and mortgages. This aligns with the positioning of Poliservice as an independent intermediary.
D&S Participaties
D&S Participaties focuses on taking over portfolios and financial services organisations in the Netherlands, in order to further expand the share of a.s.r. in the distribution landscape.
Outlook for 2026
In 2026, D&S expects to increase market share through two key points. Firstly, by taking over portfolios through acquisitions, and secondly, by expanding existing portfolios at the present entities through commercial activities.
Synergy between the entities will also be strengthened further, enhancing overall service. This will be achieved through joint activities, knowledge sharing and the creation of a single IT landscape.
Robidus
Robidus is an independent subsidiary of a.s.r. It is not a part of D&S Holding and therefore has its own strategy and its own Supervisory Board.
Robidus helps large and corporate employers with improving the employability of their employees. Robidus gives organisations risk advice about the financing and execution of social security regulations. As a service organisation, it offers claim and case management services for absence, disability and occupational health. Robidus has a growth plan based on managing the entire chain of employability. In this context, Robidus completed the acquisition of the Dutch Institute for Personal Health and E-health Development (Nederlands Instituut voor Persoonlijke Gezondheid en E-health Development - Niped) in order to strengthen their positions in the absence prevention market.
Due to its position and services in between the Employee Insurance Agency (Uitvoeringsinstituut Werknemersverzekeringen - UWV), insurers, employers and employees, Robidus plays a vital role in improving legislation due to current problems with UWV. These problems put pressure on the system of social security. Robidus is participating in several pilots initiated by the Dutch Ministry of Social Affairs and Employment to improve the execution of the system.
The results of Robidus are consolidated in the D&S figures, but it is a separate entity with its own strategy, and it is not governed through the D&S holding company.
TKP
TKP administers pension rights for fourteen large corporate and industry-wide pension funds. Additionally, TKP takes care of the communication for these clients, from mandatory pension statements to customer contact and digital customer service. All 2.8 million participants affiliated with these pension funds rely on TKP for correct and timely pension payments and clear and accessible pension information and communication.
In 2025, TKP successfully transitioned the first pension circle to the new pension system. The focus in the coming years is on a controlled and reliable transition of all clients. In 2026, TKP expects to transition seven pension funds and two pension circles to a new pension scheme. The other clients are expected to switch on 1 January 2027, 1 July 2027 and 1 January 2028.
The results of TKP are consolidated in the D&S segment. As a pension administrator, TKP operates as a separated business line under the Life segment.
HumanTotalCare
On 1 October 2025, a.s.r. acquired the remaining 55% shares in Human Touch Holding B.V., owner of HumanTotalCare. As a result, a.s.r. is the sole shareholder of HumanTotalCare.
HumanTotalCare is a service provider in the field of absenteeism and sustainable employability. With over 2,000 professionals, the organisation supports more than 65,000 employers and 1.4 million employees every day. HumanTotalCare aims to make a meaningful impact on working life in the Netherlands by making work more purposeful, healthier, and future-proof.
Through its brands such as ArboNed, HumanCapitalCare, Mensely, Focus and IT&Care, HumanTotalCare offers expert guidance, innovative software and advice on creating healthy and safe working environments. Its strategy focuses on strengthening positive health by combining expertise, genuine attention and data.
The results of HumanTotalCare are consolidated in the D&S segment. Within a.s.r., HumanTotalCare operates as an independent entity.
This page is intentionally left blank.
4.6
Holding and Other 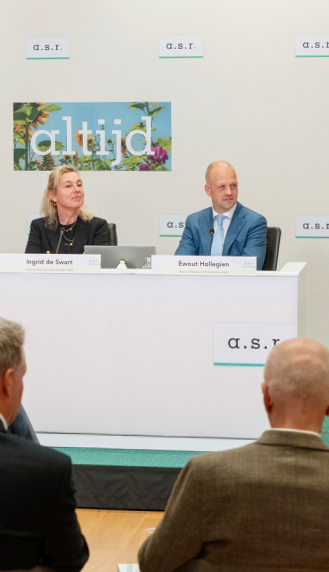
Operating result(in € million)-282 2024: -268 | Operating expenses(in € million)-28 2024: -9 | Result before tax(in € million)-671 2024: -280 |
The Holding and Other segment consists primarily of the holding activities of a.s.r. (including the group related activities), other holding and intermediate holding companies, the real estate development business (ASR Vastgoed Projecten B.V.), ASR Vitaliteit & Preventieve Diensten B.V (Vitality) and the smaller participations of ASR Deelnemingen N.V.
4.6.1 Financial performance
Operating result
Holding & Other segment (including eliminations) operating result decreased by € 14 million to € -282 million. The decrease is mainly as a result of increased interest expenses and lower operating investment and finance result, reflecting harmonisation impacts, offset by lower operating expenses and higher other income.
Interest expenses increased by € 6 million, following the issuance of a € 500 million Perpetual Restricted Tier 1 security in April 2025, carrying a fixed-rate coupon of 6.5% and the redemption (€ 500 million) of a Tier 2 security, with a fixed-rate coupon of 5.125%.
Operating expenses
Operating expenses decreased by € 19 million to € -28 million (2024: € -9 million) due to eliminations related to intercompany investment operating expenses, partly offset by higher IT infrastructure charges. These charges will be phased out following integration activities.
Expenses for non-ordinary activities, classified as incidental items and therefore not included in operating expenses, decreased by € 30 million to € 120 million. This decline primarily reflects a correction related to divestment of Knab in 2024 and lower regulatory project expenses, partially offset by increased costs related to the integration of Aegon NL.
Result before tax
The result before tax decreased by € 391 million to € -671 million (2024: € -280 million), reflecting a reduction in investment related incidentals. This reduction is mainly attributable to interest rate movements (e.g. increase and steepening of the curve), impacting a.s.r.’s own pension scheme. This negative revaluation impact is partly offset by actuarial gains on the employee benefits (IAS19) through OCI. Additional impacts are the lower operating result (€ 14 million), the positive effects of the step-up acquisition of HumanTotalCare (€ 27 million) and gains from property development (€ 42 million).
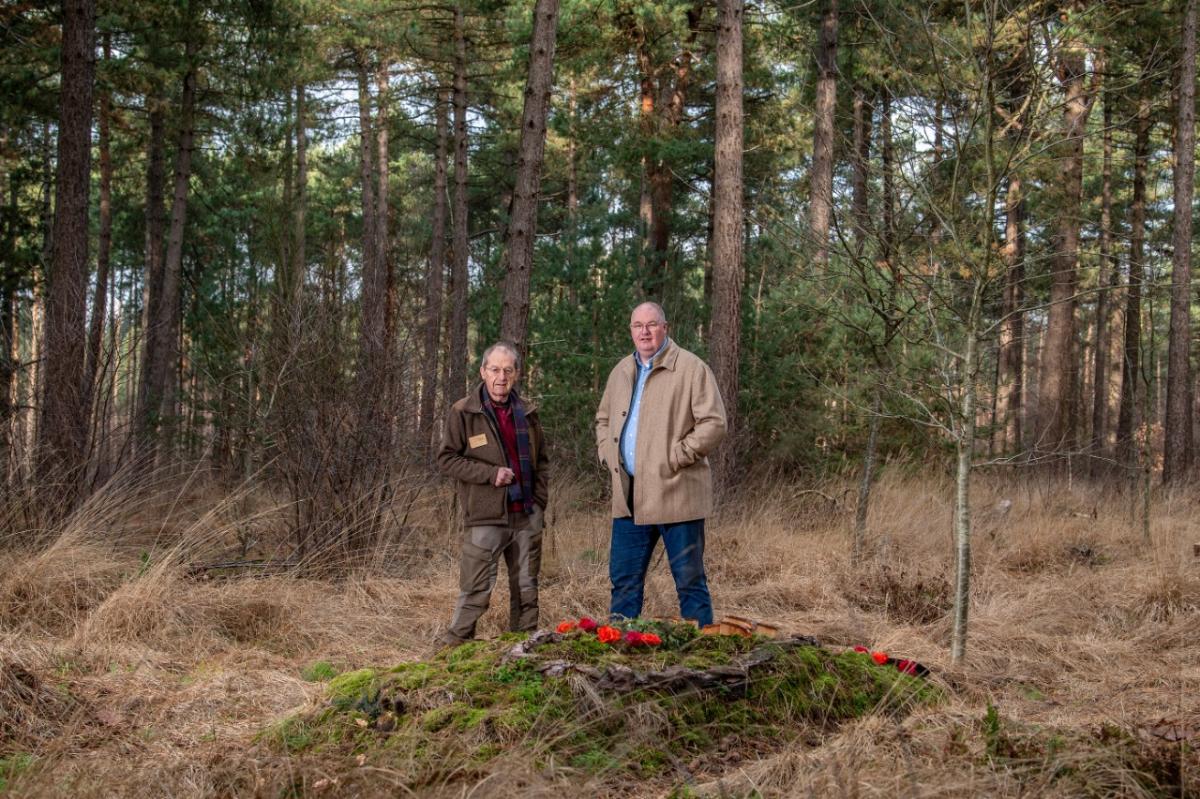
Case: A natural burial ground
enjoy eternal peace
Case: A natural burial ground
At De Utrecht, you can enjoy eternal peace
Established in 2016, the De Utrecht natural burial site contributes both to the biodiversity of the surrounding landscape and to the hospitable character of the estate of the same name. Estate manager Raymond Gennissen and volunteer Harrie van Eekert explain the value of the natural burial site.
Around fifteen years ago, Harry Breviers - estate manager at De Utrecht at the time - was introduced to entrepreneur Joyce Sengers, who was searching for a suitable location to establish a natural burial site. After visiting several natural burial sites in England - where the concept was already more common - they designated part of the forest on the De Utrecht estate for natural burials.

Biodiversity
During the development of the natural burial site, a substantial section of the conifer production forest was transformed into a mixed forest containing newly planted indigenous deciduous trees. ‘This way, a natural burial site helps enrich the surrounding ecosystem,’ Harrie explains. ‘Step by step, the forest is evolving into a diverse woodland ecosystem with high biodiversity. Even the human body, which becomes part of the cycle of nature, contributes to that process.’ Since its establishment, the team has continuously explored ways to further enhance biodiversity.
Creating a natural burial site involves more than preparing the natural environment alone. ‘It includes maintaining a register of those already buried or those with reserved plots, and closely monitoring groundwater levels,’ Raymond notes. ‘Establishing a natural burial site requires far more effort than one might expect.’
Growing interest
De Utrecht appears to have set a precedent in the Netherlands. The concept has gained strong momentum, with a growing number of people expressing an interest in natural burials. Harrie confirms this development: ‘In retrospect, a.s.r. demonstrated real foresight. The decision proved to be the right one - nature cemeteries have since emerged rapidly across the country.’
Raymond also considers the establishment of the natural burial site a sound decision. In addition to preserving income for a.s.r., accessibility plays a key role: ‘We feel it is important to make personal funeral preferences an open topic of discussion. The natural burial site accommodates burials in graves, urn interments and burials with a pet.’
Nature and people at the centre
In addition to generating financial returns for a.s.r., the natural burial site creates social value and broader societal impact. Both nature and people are central to its purpose. ‘A natural burial site gives individuals the freedom to create something meaningful from their passing,’ Harrie says. ‘A personalised farewell, rather than standardised arrangement from an organisation..’ The team supports families in shaping the farewell according to their wishes. Harrie: ‘We offer guidance and provide an environment that makes concluding life and returning to nature a meaningful experience.’ Families and relatives are supported as well. Many of the considerations that typically apply at traditional cemeteries do not apply here. There is no contract with an expiry date, nor is there a gravestone to be maintained or repaired. ‘That is what makes the natural burial site so special,’ Raymond adds. ‘There are no memorial markers, crosses or stones, and graves are not cleared after fifteen years. Instead, you can enjoy ‘eternal’ peace – and so can your family. I think it is wonderful that a.s.r. makes this possible.’
Full circle
Harrie wholeheartedly agrees. Apart from being a volunteer at the natural burial site, he has already reserved his own burial place too. His connection to the surrounding landscape dates back to his youth: ‘The area lies just behind my parents’ farm in Reusel and was the playground for me and my sisters. We rolled down hills on an old bicycle held together with bits of rope and paddled in what we called the ‘sea’, a rain-filled sand pit created when sand was extracted for building foundations.
These memories resurfaced years later during his walks through the forest around the natural burial site. ‘That is when I realised: if I continue along this path and am buried here one day, the circle will be complete.’

5 Governance
5.1 Corporate governance
5.1.1 Corporate governance
This chapter describes a.s.r.’s corporate legal structure and governance. ASR Nederland N.V. is a public limited company, listed on Euronext Amsterdam and is subject to Dutch corporate law.
Corporate structure
A personal interconnection exists between the statutory boards of ASR Nederland N.V. on the one hand and the insurance entities ASR Levensverzekering N.V., Aegon Levensverzekering N.V., Aegon Spaarkas N.V. and ASR Schadeverzekering N.V. on the other hand, through cross-memberships of the members of the Executive Board (EB) of ASR Nederland N.V. and the Supervisory Board (SB) of the other entities. A personal interconnection also exists between the Executive Boards of Aegon Hypotheken B.V. and ASR Nederland N.V.
ASR Basis Ziektekostenverzekeringen N.V. and ASR Aanvullende Ziektekostenverzekeringen N.V. are both health insurance companies. These entities have their own EBs and the SBs consist of a combination of members of the EB and members of the SB of ASR Nederland N.V.
ASR Premiepensioeninstelling N.V. is an Institution for Occupational Retirement Provision (IORP). ASR Vermogensbeheer N.V. and ASR Real Estate B.V. are licensed Alternative Investment Fund Managers (AIFM), subject to the AIFM Directive. ASR Vooruit B.V. operates as an investment firm, pursuant to the Markets in Financial Instruments Directive (MiFID) and has a license as an insurance intermediary pursuant to the Dutch Financial Services Act (Wet op het financieel toezicht). D&S Holding B.V. operates as an intermediate holding company for most of the entities within the segment Distribution & Services.
For the full ASR Nederland N.V. structure, see section 7.4.1.
5.1.2 General Meeting of Shareholders
In line with the articles of association of ASR Nederland N.V., one Annual General Meeting (AGM) is held at least once per year, no later than 30 June. The main purpose of the AGM is to discuss and decide on matters as specified in the articles of association and under Dutch law, such as the adoption of the financial statements. The articles of association also outline the procedures for convening and holding general meetings and the decision-making process. The draft minutes of the AGM will be published on www.asrnl.com no later than three months following the AGM, and shareholders are given three months to respond to the draft minutes. The minutes of the AGM are subsequently adopted and signed by the chair of the SB and the company secretary.
In 2025, the AGM was held on 21 May. Shareholders had the option to attend the AGM in person or virtually. A total of 83.8% of the total issued share capital with voting rights was present or represented by a proxy holder with voting instructions. The agenda of the AGM included the following voting items:
2024 remuneration report (advisory vote);
To adopt the financial statements for the 2024 financial year;
To pay dividend;
To grant discharge to each (former) member of the EB and SB for the 2024 financial year;
To extend the authorisation of the EB to issue ordinary shares and/or to grant rights to subscribe for ordinary shares;
To extend the authorisation of the EB to restrict or exclude statutory pre-emptive rights;
To authorise the EB to acquire the company's own shares;
To cancel shares held by a.s.r.
All agenda items were approved by the AGM. The next AGM will be held on 20 May 2026.
Consultation with shareholders
Contact with shareholders is conducted in line with the Policy on fair disclosure and bilateral dialogue, as published on the website at www.asrnl.com. The Group's Disclosure Committee supervises compliance with laws and regulations in relation to the public disclosures.
Transactions with majority shareholders
Transactions with majority shareholders1, as referred to in best practice provision 2.7.5 of the Corporate Governance Code, took place in 2025. In connection with the Aegon NL transaction in 2023, ASR Nederland N.V. and Aegon Ltd. entered into a relationship agreement, in which the two parties agreed certain governance arrangements relating to ASR Nederland N.V. The terms of the relationship agreement were approved by the SB and are customary in the market, as required by best practice provision 2.7.5 of the Corporate Governance Code. For more information on the relationship agreement, see the convocation of the January 2023 AGM.
- Shareholders holding at least ten per cent of the shares in the company.
Anti-takeover measures
Stichting Continuïteit ASR Nederland (the Foundation) was established on 26 May 2016 under Dutch law in connection with a.s.r.’s listing on Euronext Amsterdam. The Foundation has an independent board consisting of three members. The role of the Foundation is to promote the interests of a.s.r., its business and stakeholders, and protect against possible influences that could threaten the continuity, independence, strategy and/or identity of a.s.r. or its associated business to the extent that they could conflict with the aforementioned interests.
If the interests of a.s.r., its business, stakeholders or continuity were to be undermined, the Foundation would be entitled to exercise a call option right on preference shares, provided that certain conditions under the call option agreement are met. Specifically, the number of preference shares acquired under the call option would never exceed the total number of shares forming the issued capital of a.s.r. at the time the call option was exercised, minus the number of preference shares already held by the Foundation (if any) at the time and minus one. For more information about the Foundation, see section 8.4.
5.1.3 Executive Board and Management Board
The EB is the statutory board in accordance with Dutch corporate law and as described in the articles of association. The EB is collectively responsible for the day-to-day conduct of business at a.s.r. and for its strategy, structure and performance. In carrying out its duties, the EB is guided by a.s.r.’s interests, which include the interests of the businesses connected with it, including the interests of customers, employees, investors and society. The EB is accountable to the SB and the AGM regarding the performance of its duties.
Certain resolutions made by the EB require the approval of the SB and/or the AGM. These resolutions are outlined in the articles of association and the rules of procedure of the EB and MB. Both documents are available at www.asrnl.com.
The MB was established in 2023 to support the EB in the collective responsibility for the execution of the business strategy and the day‑to‑day management of the company and enhancing the continuity. The MB meets every week. The MB conducts the day-to-day business at a.s.r. and implements and realises the business strategy.
- Section 5.1.3 is in scope of CSRD and limited assurance (ESRS 2 GOV-1).
Composition of the Executive Board
The articles of association specify that the EB must consist of a minimum of two members, including a Chief Executive Officer (CEO) and a Chief Financial Officer (CFO). Only candidates found to meet the fit and proper test under the Dutch Financial Supervision Act are eligible for appointment. In accordance with Article 2.2 of the Rules of Procedure of the EB and MB and Article 7.1 of the Rules of Procedure of the SB, the SB appoints the Members of the EB and may suspend or dismiss an EB member at any time. If a.s.r.’s current CEO does not serve his full term until the 2026 AGM, due to his earlier resignation or dismissal, the appointment of the successor will require a unanimous vote by the SB (Schedule 8, part 2, Relationship Agreement). The SB notifies the AGM of proposed (re)appointments.
During 2025, the composition of the EB remained unchanged, consisting of the following three members:
Jos Baeten, CEO;
Ewout Hollegien, CFO;
Ingrid de Swart, COO/CTO.
Executive Board
| Name | Years on Board | Date of initial appointment | Date of reappointment | Appointed until | Years of experience in insurance industry |
|---|---|---|---|---|---|
| Jos Baeten | 17 | 26 January 2009 | EGM 2023 | AGM 2026 | 45 |
| Ewout Hollegien | 4 | 1 December 2021 | AGM 2025 | AGM 2029 | 18 |
| Ingrid de Swart | 6 | 1 December 2019 | AGM 2023 | AGM 2027 | 26 |
On 6 October 2025, a.s.r. announced that the SB of a.s.r. intends to appoint Ingrid de Swart as CEO and chair of the EB of ASR Nederland N.V. Jos Baeten has indicated that he is not available for a new term. His current term will end at the conclusion of the AGM on 20 May 2026.
Composition of the Management Board
Article 2.4 of the Rules of Procedure of the EB and MB specifies that the MB consists of all EB members, the Chief Risk Officer (CRO), the Chief Human Resources Officer (CHRO), and the Chief Operations Officer (COO) Life. MB members who are not EB members are appointed, suspended and dismissed by the EB, with due observance of the Diversity, Equity and Inclusion (DEI) Policy. The SB is involved in the recruitment and selection of MB members, as prior coordination with the SB is required. During 2025, the composition of the MB remained unchanged, consisting of:
The members of the EB;
Rozan Dekker, CRO;
Jolanda Sappelli, CHRO;
Willem van den Berg, COO Life.
Permanent education
In 2025, specific permanent education sessions were attended by the SB, EB and the MB, for the purpose of further education.
A session, organised by representatives of team Sustainability, focused on a.s.r.'s strategic sustainability goals: financial self-reliance and inclusion, vitality and sustainable employability, and sustainable living and climate. Three material topics from the Double Materiality Assessment were highlighted: biodiversity, climate adaptation and financial self-reliance and inclusion.
Another session focused on AI, specifically on AI myths, opportunities and risks. This session was led by two professors from INSEAD (Fontainebleau), who delved deeper into how AI can impact the business and into developing an AI strategy, AI governance and an AI maturity roadmap. An additional session was organised by representatives from a.s.r. Health, who demonstrated scalable AI concept demos.
A series of three sessions led by Group Risk Management focused on the implementation of the Partial internal model (PIM) for a.s.r. During these sessions, the SB, EB and MB were educated on the role and use of the PIM.
The final session focused on the Strategic Asset Allocation (SAA) and investment plan 2026. This session was organised by representatives of Asset Management and focused on an analysis of the current investment policy and optimisation opportunities.
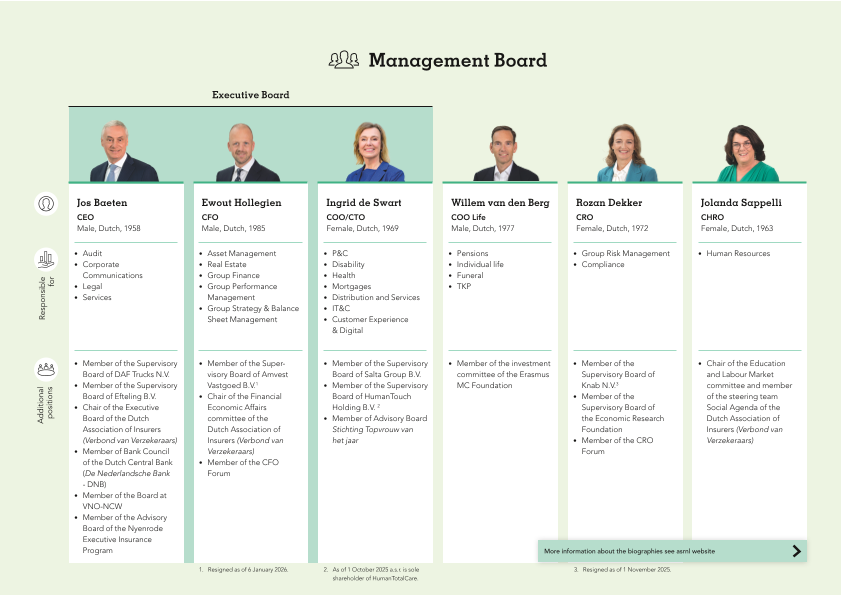
Evaluation
In 2025, the EB and MB conducted a comprehensive self-evaluation to assess its composition, role and functioning using questionnaires facilitated by the company secretary and a subsequent in-depth discussion within the MB. The evaluation confirmed that the MB functions as a cohesive and effective team, characterised by open and transparent communication and mutual trust. Members experience sufficient space to share dilemmas and to challenge each other constructively, while speaking with one voice in decision-making and external representation. The composition of the MB is considered complementary and well balanced, providing all relevant perspectives to execute a.s.r.’s strategy. Decision-making within the MB is regarded as effective, balanced and well-reasoned, with careful consideration of the interests of key stakeholders, with customers at the centre. In 2025, the MB made a further step in its development from a ‘caring’ to a more ‘daring’ leadership style, resulting in increased decisiveness and clearer role definition, including towards senior management. The collaboration with the SB is valued positively, with the SB acting as a critical and constructive sparring partner. The MB will continue to invest in high-quality information provision, effective permanent education and regular reflection moments, while strengthening its forward-looking, outside‑in perspective.
The performance of the EB was also assessed by the SB as part of the scope of the annual assessment process; for details, see section 5.3. For the assessment, interviews are held twice a year with the individual EB members (by two SB members on each occasion), incorporating the results of the self-evaluation.
The performance of MB members who are not EB members was assessed by the CEO, with prior input from the SB. The assessment takes place through interviews held twice a year with the individual MB members, incorporating the results of the self-evaluation.
Remuneration
See section 5.3 for information on the Remuneration Policy for EB members and their individual remunerations.
5.1.4 Supervisory Board
The SB has three roles: the supervisory role, the advisory role and the employer's role for the EB. The SB supervises the EB and MB and the general course of affairs at a.s.r. and its group entities. Specific powers are vested in the SB, including approving certain EB decisions.
- Section 5.1.4 is in scope of CSRD and limited assurance (ESRS 2 GOV-1).
Composition of the Supervisory Board
Article 2.1 of the Rules of Procedure of the SB specifies that the SB must consist of at least three members and no less than the number of members required to give effect to the nomination rights in respect of SB members under the Relationship Agreement. The SB currently consists of seven members: Joop Wijn (Chair), Gerard van Olphen, Sonja Barendregt, Gisella Eikelenboom, Daniëlle Jansen Heijtmajer, Lard Friese and Bob Elfring.
In line with the Dutch Corporate Governance Code, SB members are appointed by the AGM for a four-year term. They can be reappointed for a single additional four-year term and subsequently reappointed for a period of two years, which may be extended by two years at most. Reappointments following an eight-year period must be justified in the SB report.
All the SB members have passed the fit and proper test required under the Dutch Financial Supervision Act.
Supervisory Board
| Name | Years on Board | Date of initial appointment | Date of reappointment | End of current term of appointment1 | End of the term of appointment at AGM2 |
|---|---|---|---|---|---|
| Joop Wijn | 5 | 28 October 2020 | 29 May 2024 | AGM 2028 | 2032 |
| Gerard van Olphen | 6 | 30 October 2019 | 31 May 2023 | AGM 2027 | 2031 |
| Sonja Barendregt | 8 | 31 May 2018 | 25 May 2022 | AGM 2026 | 2030 |
| Gisella Eikelenboom | 6 | 30 October 2019 | 31 May 2023 | AGM 2027 | 2031 |
| Daniëlle Jansen Heijtmajer | 3 | 4 July 2023 | - | AGM 2027 | 20283 |
| Lard Friese4 | 3 | 4 July 2023 | - | AGM 20275 | 20283 |
| Bob Elfring | 2 | 29 May 2024 | - | AGM 2028 | 2036 |
- SB members are reappointed or must resign no later than the next AGM held after this date.
- Based on the possibility of an appointment for a maximum of twelve years (two times four years and two times two years in accordance with principle 2.2.2 of the Dutch Corporate Governance Code).
- Duration of appointment term in accordance with the relationship agreement between a.s.r. and Aegon Ltd.
- Lard Friese has decided to step down as a member of the Supervisory Board of ASR Nederland N.V. in order to fully focus on his responsibilities at Aegon Ltd. Aegon Ltd. will nominate a candidate to succeed him.
- On 10 December 2025, Lard Friese has announced to resign from the SB as of the AGM 2026.
Diverse representation
The SB has drawn up a projected profile for its size and composition, taking into account the nature of a.s.r.’s business, its activities and the desired expertise and background of its members.
Due to a combination of experience, expertise and independence of the individual members, the SB has the skills to assess the main aspects of the a.s.r. strategy and policies. The diversity of its members ensures that the SB has a complementary profile. a.s.r. will continue to aim for the SB to have an adequate and balanced composition in any future appointments. For details, see section 5.1.5.
Independence and conflicts of interest
In 2025, the SB was able to carry out its tasks independently pursuant to principles 2.1.7 to 2.1.9 of the Dutch Corporate Governance Code. In accordance with article 39 (1) Directive 2014/56/EU all SB members are independent as defined in the Corporate Governance Code, with the exception of Lard Friese (due to his position as CEO of Aegon Ltd.).
In order to prevent (potential) conflicts of interest, relevant members of the SB who could be subject to such conflicts have abstained from participating in discussions and decision-making whenever a potential conflict of interest has arisen. This approach was, among other things, followed in decisions concerning the repositioning of Amvest’s real estate activities and the repurchase of own shares during Aegon’s sell-down.
According to the Dutch Civil Code, a member of the SB of a listed company may not hold more than five supervisory board positions or equivalent roles within large Dutch companies and large Dutch foundations. This regulation ensures that SB Members can dedicate sufficient time and attention to their responsibilities. The members of the SB of a.s.r. comply with these requirements.
Furthermore, no transactions were entered in 2025 in which there were conflicts of interest with SB and/or EB members that are of material significance to a.s.r. and/or to the relevant board members.
Evaluation and permanent education
The SB is responsible for assessing the quality of its own performance. It therefore performs an annual self-assessment and discussion of its own performance and that of its committees and members. A self-assessment with an external facilitator is carried out every three years; this last occurred in 2023. In 2025, the evaluation session was led by the company secretary using questionnaires and a subsequent in-depth discussion within the SB. The following aspects were assessed:
Role and composition of the SB;
Effectiveness of processes (information-gathering and decision-making);
Role as an employer;
Advisory role and strategy.
The outcome of the assessment was discussed by the members of the SB and the company secretary, and at a later stage with the members of the EB and MB.
The evaluation confirmed that the SB functions as a well‑balanced and effective supervisory body, characterised by complementary expertise, constructive internal dialogue and role‑conscious behaviour. The size and composition of the SB are considered appropriate, enabling effective oversight and meaningful challenge. Meetings are well prepared and conducted, with active participation from all members. Decision‑making within the SB is regarded as balanced, well‑reasoned and supported by the committees. The functioning and role allocation of the committees are valued positively, and oversight priorities are sufficiently clear. The SB continuously reflects on the effectiveness of its processes and interactions, with the aim of maintaining focus, depth and high‑quality deliberation in support of effective supervision and governance. The collaboration with the MB is experienced as open and transparent. The SB will continue to encourage the sharing of dilemmas and underlying considerations, in support of its advisory role and effective governance.
In the context of its self‑evaluation, the SB reflected on the decision‑making process relating to the succession of the CEO. The SB followed a careful and collectively supported decision‑making process. This process was characterised by thorough deliberation and resulted in a jointly supported outcome. Building on this evaluation, the SB considers that 2026, from an employer‑role perspective, will be focused on supporting a strong start for Ingrid de Swart as CEO. For permanent educational sessions attended by the SB, please see section 5.1.3.
5.1.5 Diversity, equity and inclusion
a.s.r. aims for diverse representation within the EB, MB and SB and an inclusive culture in which differences are recognised, valued and utilised. a.s.r.’s Diversity, Equity and Inclusion Policy (DEI Policy) is available on the website. The EB, MB and SB believe that diverse representation, equity and belonging reinforce the success and relevance of a.s.r. as a socially desirable insurer and are necessary to create business models and develop (new) products that serve society as a whole. For further information on the DEI Policy and a.s.r.’s objectives in this area, see sections 3.2.2 and 6.3.1.2.
The current composition of the EB, MB and SB meets the gender targets of 2025. The EB meets the target of having at least 33% male and 33% female members. Both the MB and the SB meet the target of having at least 37% male and 37% female members. a.s.r. will aim for an adequate and balanced composition of the EB, MB and SB in its future appointments by taking into account its DEI Policy and all relevant selection criteria.
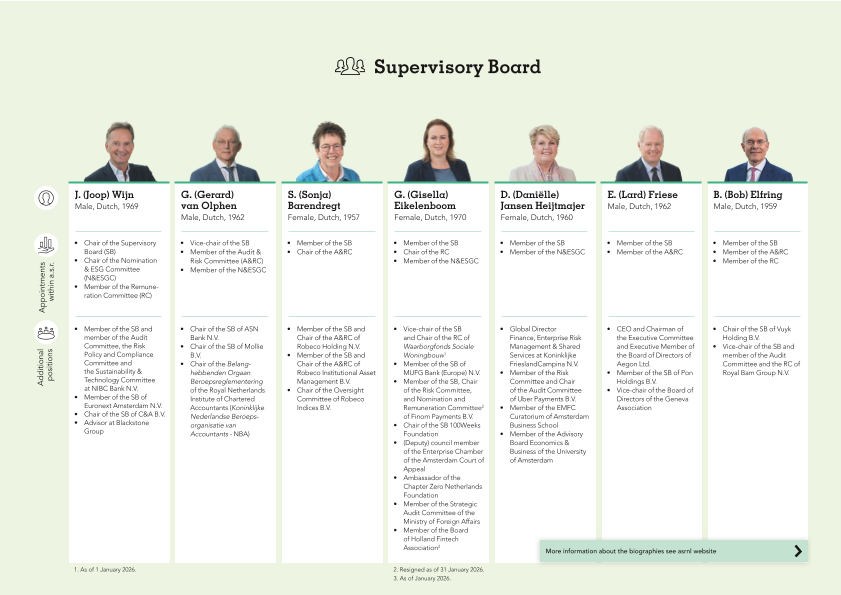
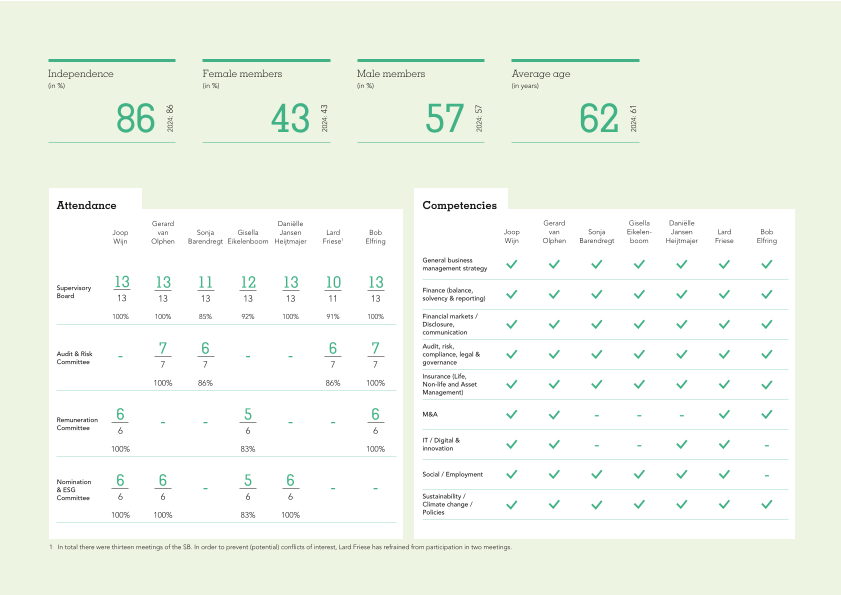
- Section 5.1.5 is in scope of CSRD and limited assurance (ESRS 2 GOV-1).
5.1.6 Sustainability governance
a.s.r. strives to embed sustainability in its core processes and activities. In order to contribute to the transition to a sustainable and inclusive society within a.s.r., this transition has been earmarked as a strategic topic. Within the EB, the CEO is ultimately responsible for a.s.r.’s sustainability strategy at group level.
The Sustainability Workforce, coordinated by the corporate sustainability team, supports the EB in its responsibility for the development and implementation of a.s.r.’s sustainability strategy and policies. This workforce includes delegates from the business as well as staff functions. The corporate sustainability team reports quarterly on a set of sustainability key performance indicators (KPIs) and targets to the MB, which evaluates the results achieved and takes action where necessary. The EB also sets strategic sustainability targets and KPIs as part of the total set of financial and non-financial (including sustainability-related) KPIs and targets.
The SB approves the strategic non-financial targets and discusses progress on the targets each year. The Nomination & ESG Committee advises the SB. a.s.r.'s corporate sustainability team coordinates the implementation together with the Sustainability Workforce. All members of the Sustainability Workforce subsequently promote these strategy, policies and targets within their own focus areas.
In addition, the Sustainability Committee is an advisory body for the MB, supporting well informed and balanced decision making on sustainability issues. In this context, the Sustainability Committee discusses dilemmas and conflicting interests (including ESG and CDD/KYC) making decision-making regarding these sustainability issues more transparent for the MB and SB. The Sustainability Committee also advises the MB on sustainability related policies at group level. These policies are evaluated periodically and updated when deemed necessary. The Sustainability Committee includes representatives from several departments including Communications, Risk, Legal, Sustainability and the business lines. Committee members provide advice from their respective areas of expertise and aim to reach a shared and consistent advice to the MB. The Committee meets at least every quarter.
- Section 5.1.6 is in scope of CSRD and limited assurance (ESRS 2 GOV-1, GOV-2).
5.1.7 Corporate Governance Codes and regulations
The current articles of association are published on the Corporate Governance section of the corporate website of a.s.r.
Dutch Corporate Governance Code
Since its listing on Euronext Amsterdam, a.s.r. has been required to comply with the Dutch Corporate Governance Code. a.s.r. therefore complies with all the Code's principles and best practices, with the exception of those that it considers not applicable. In the Corporate Governance section of the corporate website, a.s.r. has published a detailed comply or explain list indicating which principles and best practices do not apply to the organisation.
In 2025, the Dutch Corporate Governance Code was amended. The most significant change concerns the inclusion of a provision regarding the Risk Management Statement (Verklaring omtrent Risicobeheersing - VOR). Among other things, this provision requires a written statement from the EB about the design, operation and effectiveness of the internal risk management and control system. For further information, see section 5.7.
Code of Conduct
The a.s.r. Code of Conduct is the guideline for behaving with due care and integrity. As required by best practice provision 2.5.2 of the Corporate Governance Code, the EB ensures compliance with the Code of Conduct by itself and employees. The EB informs the SB of its findings and observations regarding the operation of and compliance with the a.s.r. Code of Conduct.
Professional oath
On 1 January 2013, the Dutch financial sector introduced a mandatory oath for EB and SB members of financial institutions licensed in the Netherlands. With regard to insurance companies, in addition to the EB and SB members, also required to take the oath are individuals holding a management position immediately below the EB who are responsible for employees and who could have a significant influence on the risk profile of the insurance company. This requirement was subsequently expanded to include employees whose activities can substantially affect the risk profile of the undertaking, as well as employees directly involved in the provision of financial services
Notwithstanding the requirements already mentioned, a.s.r. has decided that all employees and other individuals carrying out activities under its responsibility must also take the oath. New employees, including temporary and external employees, must take the oath within three months of joining the company.
Disclosure of sustainability information
In accordance with the requirements of the CSRD, a.s.r. provides extensive sustainability-related information in its Management Report, for the first time as per the financial year 2024. In addition, from 1 January 2022, large companies of public interest must publish information about how and to what extent their activities are associated with economic activities (eligibility) that qualify as environmentally sustainable as defined in Regulation (EU) 2020/852 (EU Taxonomy Regulation). As of 1 January 2023, the Taxonomy Regulation also requires companies to disclose the extent to which their economic activities are aligned with two of the six environmental objectives, i.e. climate mitigation and climate adaptation. For the information required regarding the disclosure of sustainability-related information, see section 6.
This page is intentionally left blank.
5.2 Supervisory Board report
5.2.1 Meetings of the Supervisory Board
In 2025, the SB convened seven regular meetings, one of which was an offsite meeting with the EB and MB, and six extra meetings related to specific topics. The SB members were available for consultation between scheduled meetings. Regular work meetings were also held in the absence of the EB and MB, at which matters such as the self-evaluation of the SB, the evaluation of the EB members and the intended appointment of Ingrid de Swart as successor to Jos Baeten were discussed.
The SB has a good working relationship with the EB and MB. The chair of the SB is in regular contact with the CEO, and several members of the SB are periodically approached outside meetings to give advice on various topics. See section 5.1.4 for information about the attendance at SB and SB committee meetings.
Highlights
The SB looks back on a successful year marked by the further progression of the integration of Aegon NL. Throughout the year, the SB was kept thoroughly and consistently informed about the progress and outcomes. All planned milestones were achieved. The SB wishes to express its appreciation for the dedication and commitment demonstrated by the MB and all employees throughout the integration process.
In 2025, a.s.r. continued to progress towards fully closing the chapter on the unit-linked dispute. Following the finalisation of the settlement reached in November 2023 with five consumer organisations, the implementation was fully completed on 2 February 2026. a.s.r. launched a leniency scheme for non-affiliated customers with a closing date of 1 June 2025. Most payments under these schemes were made during 2025, with remaining settlements expected to be finalised in the first half of 2026. With both the collective settlement and leniency scheme nearing completion, a.s.r. expects that the longstanding unit-linked dispute will be substantially resolved, enabling continued focus on customer confidence and future-proof policyholder value.
After the AGM on 21 May 2025, Ewout Hollegien (CFO) was reappointed for a period of four years. The SB is convinced that Ewout Hollegien possesses the qualities to continue leading the Finance domain and expects him to be successful in further developing and implementing the mission and strategy of a.s.r.
In May and June 2025, a.s.r. entered into agreements with Stichting Pensioenfonds British American Tobacco and Stichting Pensioenfonds Staples respectively, to insure their pension obligations through a.s.r.’s subsidiary, Aegon Levensverzekering N.V. These steps align with a.s.r.’s ambition to further strengthen its leading position in the Dutch pension market.
On 6 October 2025, the SB announced the intention to appoint Ingrid de Swart as CEO and chair of the EB of ASR Nederland N.V. Jos Baeten, the current CEO, has indicated that he is not available for a new term. His current term will end at the AGM on 20 May 2026. The SB is delighted to nominate Ingrid de Swart as chair of the EB of a.s.r. She brings a unifying presence, the experience necessary to ensure continuity in a.s.r.’s strategy, and a forward-looking vision to drive the company's sustainable growth. Jos Baeten's departure will occur later, but the SB wants to express his deep appreciation for his over 45 years of invaluable contributions to a.s.r. His leadership guided a.s.r. through the financial crisis, a successful IPO, and significant growth, making it one of the leading insurers in the Netherlands.
An important milestone was reached on 9 December 2025 when a.s.r. received approval to use its PIM for determining required capital under the Solvency II framework for a.s.r. Life. This extends the use of the PIM from the Dutch Aegon Life entities to the a.s.r. Life entity and enhances a.s.r.’s overall risk management and capital efficiency.
On 10 December 2025, Lard Friese anounced to step down as a member of the Supervisory Board of ASR Nederland N.V. in order to fully focus on his responsibilities at Aegon Ltd. Aegon Ltd. will nominate a candidate to succeed him.
Strategy based on long-term value creation
Each year, the EB presents various matters to the SB for approval, such as the (quarterly) figures, the multi-year budget, the investment plan and the risk appetite. These matters were all discussed and approved by the SB in 2025. Throughout the year, the progress of a.s.r.’s strategy, the realisation of sustainable value creation against the ambitious group and business targets for 2024-2026 were discussed in detail. For a.s.r. as a multi-line insurer, this involves the portfolio strategy (see section 2.2) and the strategy for targeted acquisitions.
In implementing the strategy, a.s.r. adheres closely to a strict financial discipline in which value over volume is a key principle. A focus on cost and upholding financial solidity is essential for the continuation of a.s.r.’s strong performance. Maintaining a strong balance sheet with financial flexibility offers scope for profitable growth. a.s.r. will continue to invest capital responsibly. Following the Aegon NL transaction, the integration of the two companies has largely been completed, building on a consistent focus on sustainable value creation throughout the integration process.
Sustainable value creation is an important part of a.s.r.'s strategy and, as such, an integrated part of the business processes. In the EB, the CEO is ultimately responsible for sustainable value creation. Targets, plans, progress and results are regularly discussed in the EB and MB and reported to the SB. Within the SB, sustainable value creation is integrated into the overall agenda. During the permanent education sessions of the MB and the SB, attention is paid to current developments. This also includes the implementation of upcoming legislation and regulations.
In 2025, SB discussions covered the following topics:
Review, oversight and involvement in the development of the overall strategy, including a.s.r.’s long-term value creation and growth in various business areas, such as P&C, Disability, Mortgages, Asset Management, Real Estate, Pension DC, developments regarding Health and key topics such as brand, reputation, sustainability and vitality;
Digitalisation of customer service (Generative AI);
Integration activities as a result of the Aegon transaction;
Following Financial and Non-Financial targets for 2024–2026;
Corporate governance (including the update of the SB rules of procedure in line with the revised Dutch Corporate Governance Code 2025);
Composition of the SB, EB and MB (with particular attention to the expiry of the CEO's term of appointment at the 2026 AGM);
EB, MB and senior management succession planning;
EB and SB remuneration, including the evaluation of the Remuneration Policy;
HR and culture: reports on employee surveys, sustainable employability, DEI and compliance with the a.s.r. Code of Conduct;
Cyber security, innovation and technological developments;
NPS-i report and developments in the field of customer service, including the focus on reducing the number of customer complaints in 2025;
Financial and Enterprise Risk Management, including cyber security, Solvency II requirements and related EIOPA and DNB guidance, the Risk Appetite Statements and the ORSA;
Annual and quarterly results, dividends, capital generation, share buy backs, an issue of € 500 million Tier 1 capital securities and the Solvency II capital position;
Investor relations;
Multi-year budget, including the medium-term financial and non-financial targets framework, and Capital & Dividend Policy;
Strategic Asset Allocation (SAA) study and the investment plan;
Legal, regulatory and supervisory topics, including the relationship with the Dutch supervisory authorities, as well as compliance issues;
Tax Policy and developments.
M&A
As of 1 October 2025, the funeral insurance policies of De Onderlinge van 1719 U.A. have been transferred to a.s.r.
As of 1 October 2025, a.s.r. has become the sole shareholder of Human Touch Holding B.V. and its subsidiary HumanTotalCare B.V. This step aligns with a.s.r.'s strategy to grow not only through organic growth but also through targeted acquisitions.
In 2025, preparations were made for the acquisition of Bovemij’s insurance activities and the strategic partnership with BOVAG. The signing took place on 8 January 2026. Completion of the acquisition is subject to regulatory approval.
The focus through the whole year 2025 was on successfully integrating a.s.r. and Aegon NL.
Financial performance
The SB discusses the financial performance each quarter, covering standing issues such as developments in the premiums received, DC inflow, fee income, COR, Operating Result, long-term cost development, OCC and Solvency II ratio. The SB is pleased with a.s.r.’s financial performance in 2025. The Solvency II ratio increased to 218% (31 December 2024: 198%), reflecting a robust contribution from the OCC and the impact of the IMAP implementation of the PIM for ASR Levensverzekering N.V., which compensated for the effects of capital distributions, the impact of the closing of the pension buy-outs and the acquisition of the remaining 55% stake of HumanTotalCare. The company has exhibited significant growth across all business segments and successfully finalised a lot of business conversions during 2025. The integration of Aegon NL is well on track to be finalised in 2026. These achievements demonstrate that a.s.r. is well-positioned to create sustainable value for customers, employees, and shareholders. The impact of various scenarios was calculated and discussed, including the development of interest rates and mortgage spread, management actions were identified and discussed in detail.
External auditor
As of 1 January 2020, KPMG is a.s.r.'s independent auditor. As part of the audit process, KPMG issued a management letter in December 2025 and a 2025 Audit report in March 2026 to the EB and SB.
KPMG has established that a.s.r. finalised key milestones in 2025 in integrating Aegon Nederland, including the completion of integration and migration workstreams, implementing the a.s.r. Life PIM and further harmonisation of internal processes and controls.
KPMG notes continuous improvements on the internal control framework, risk reporting and improved process documentation. On the financial control framework, KPMG recognises good results and focus on embedding change in the reporting process and underlying control framework. Notwithstanding these improvements and results, KPMG has noted some observations to further strengthen the control environment.
KPMG indicates prior year focus was on future-proofing the organisation by driving the cloud, AI and cyber resilience agenda, and the search for further organic and non-organic growth. KPMG notes that these developments require due consideration from a business and operating model perspective, including impact on the internal control framework.
The business line Pensions continues to manage a demanding change agenda. Although these developments will require significant management attention in the coming period, KPMG is of the opinion that the current governance structure and the level of challenge provided by countervailing powers offer an adequate basis for further improvements.
Risk management and solvency
At the end of 2025, the SB approved the risk appetite for 2026 for a.s.r. and its supervised entities. a.s.r.’s risk appetite establishes a prudent approach to risk management, which is translated into standards for solvency, liquidity, efficient processes and achievable returns. The SB was satisfied with the execution of the risk management framework. The level of solvency remains acceptable and adequate, thanks to the organisation's prompt and effective response to external developments based on the chosen risk appetite and associated risk-mitigating measures. The risk appetite is an important criterion in making tactical and strategic decisions. The SB appreciates the prudent approach taken to comply with Solvency II and other regulations and regularly engages in dialogue with the EB concerning its views on the targets and intervention level relating to Solvency II ratios.
Culture and customer interest
The SB devotes attention to the development in customer satisfaction, based on the NPS-i report and the customer complaints report, amongst others. The SB observes that significant efforts are being made within a.s.r. to continuously improve the NPS scores. At year-end 2025, a.s.r. achieved an NPS-i score of +25, exceeding the target of having a NPS-i score of 21.4 in 2026.
The SB annually discusses the results of the culture scan and the associated action plan. Customer focus is a point of attention in all business units. The SB also annually reviews compliance with the Code of Conduct.
Contacts with the Works Council
In 2025, SB members attended one or more consultative meetings of the Works Council (Ondernemingsraad - OR a.s.r.). In addition to these meetings, the OR a.s.r. maintained regular contact with the Works Council-nominated SB members, Gisella Eikelenboom and Daniëlle Jansen Heijtmajer. The SB also held bilateral meetings with the OR a.s.r., which on several occasions were also attended by one or more members of the EB.
Taking into account the interests of a.s.r. and its employees, the OR a.s.r. thoroughly prepares when addressing the wide range of issues it is presented with. It engages in constructive dialogue with the EB and SB and issues balanced, well-considered opinions and recommendations, as was exemplified throughout the consultation period concerning the proposed appointment of Ingrid de Swart as CEO at the AGM in 2026. This also applies to the requests for advice regarding the integration, which are proceeding as scheduled. The SB wishes to express its gratitude for the continued engagement with the OR a.s.r. and the dedication shown by its members.
Contacts with external regulators and auditors
The SB periodically met with the DNB and AFM in 2025. The independent external auditor, KPMG, attended the SB meetings, at which the annual and interim financial results were discussed. During these meetings, the auditor elaborated on the audit reports and answered specific questions.
5.2.2 Supervisory Board Committees
The SB operates through three specialised committees, each dedicated to addressing specific issues and preparing agenda items for the full SB's decision-making process. The chair of each committee presents a summary of key discussion points and recommendations at the subsequent SB meeting. The minutes from these committee meetings are accessible to all SB members. The three committees are:
Audit & Risk Committee;
Remuneration Committee;
Nomination & ESG Committee.
Audit & Risk Committee
The Audit & Risk Committee (A&RC) advises the SB and prepares decision-making on matters such as supervision of the integrity and quality of financial reporting and the effectiveness of internal risk management and control systems. This includes the application of information and communication technology, including cyber security risks.
The composition of the A&RC is such as to represent the specific business know-how, financial, accounting and actuarial expertise relating to the activities of a.s.r.
The A&RC held seven regular meetings in 2025. In accordance with the A&RC Rules of Procedure, meetings are also attended by the CFO, the CRO, the Director of Group Risk Management, the Director of Group Finance & Risk Reporting, the Manager of Compliance, the Director of Audit and the independent external auditor.
After each financial quarter, the committee discussed the financial results based on detailed financial, risk, compliance and internal and external audit reports and analyses. Progress on the recommendations of the internal and external auditor as well as of the Audit Function was monitored. The full 2025 reporting year was discussed in the first quarter of 2026, based on the quarterly internal finance report, the press release, the actuarial reporting and the Annual Report, including the financial statements and the Board report.
The A&RC discussed the Dutch Corporate Governance Code 2025 and, more specifically, reflected in detail on the responsibilities regarding and the content of the Risk Management Statement (Verklaring Omtrent Risicobeheersing - VOR).
The A&RC issued positive opinions on the Annual Report, including the financial statements to the SB. The A&RC also reviewed the Sustainability reporting over 2025. It discussed and adopted the external auditor's letter of engagement and the audit plan for 2025. The external auditors’ independence and additional fees were reviewed each quarter. The A&RC also discussed the proposed update of the Auditor Independence Policy and advised the SB positively on its approval. The external auditor's management letter, highlighting key internal control observations, was discussed. The external auditor's audit results report was also discussed and special attention was given to the reported key audit matters. The A&RC discussed the succession of the Compliance Key Function Holder and issued a positive recommendation to the SB regarding the proposed appointment. The A&RC approved the updated charters and annual plans for 2026 of the Actuarial and Risk Management Function and the Compliance Function. It advised the SB to approve the updated charter and the audit plan 2025 of the internal Audit Function; this advice was followed.
Specific topics discussed by the A&RC included:
Progress on the integration activities as a result of the Aegon NL transaction, specifically the impact on financial reporting;
Progress on implementing the PIM for a.s.r. Life;
Use and limitations of the current PIM;
Progress on the project related to disclosing the VOR in the Annual Report including the preparations by the A&RC for its discussions and reporting on the VOR;
Cyber risks and IT security;
Compliance with rules and regulations.
a.s.r.’s solvency position was reviewed and discussed each quarter. Specific attention was paid to the impact of inflation and interest rates, the buy-outs and the development of operating costs. The A&RC discussed the risk scenarios and the outcomes of the Own Risk and Solvency Assessment (ORSA). In all the ORSA risk scenarios, the solvency ratio remains within the boundaries set by a.s.r., demonstrating the robustness of a.s.r.’s solvency and the effectiveness of certain management actions.
a.s.r.’s risk appetite is based on a prudent approach to risk management, which is translated into qualitative business guidelines for non-financial risks (NFR) matters and requirements for solvency, liquidity and returns for the financial risk (FR) matters. The A&RC also discussed a.s.r.’s updated Capital and Dividend Policy, after which the SB approved the updated Policy.
The A&RC regularly monitored the status of the risk appetite during the year through a.s.r.’s Integrated Risk Dashboard and the status report on the management of risk priorities.
Remuneration Committee
The Remuneration Committee (RC) advises the SB on matters including the Remuneration Policy for the EB and SB and the terms and conditions of employment of the EB, and the RC reviews the remuneration of senior management.
The RC held six regular meetings in 2025. Its meetings were also attended by the CEO (except when issues relating to the EB were discussed), the CHRO and the company secretary. The RC solicits support and advice from departments, including Group Risk Management, Investor Relations, Communications, Compliance, Audit and Human Resources. Where needed, it consults independent legal and pay & benefit experts.
In line with the policy, the RC advised the SB on target setting and performance appraisals, and the RC also prepared the annual Remuneration Disclosure.
The 2024 Remuneration Report was submitted to the AGM for an advisory vote; 95.86% of the votes cast were for the report and 4.14% were against. The results demonstrate the shareholders’ continued broad support for a.s.r.’s Remuneration Policy.
For more information on the 2025 remuneration, please refer to section 5.3.
Nomination & ESG Committee
The Nomination & Environmental, Social and Governance Committee (N&ESGC) advises the SB on its duties and prepares the SB’s decision-making in this respect. The N&ESGC advises the SB on ESG topics, selection and appointment procedures and the composition of the EB and SB; it also prepares the (re)appointment of its members. The N&ESGC held six regular meetings in 2025. Its meetings were also attended by the CEO (except when issues relating to the EB were discussed), the CHRO and the company secretary.
The N&ESGC discussed various (re)appointment topics in 2025. For instance, the retirement schedule of the SB was reviewed. In the run-up to the 2025 AGM, the reappointment of Ewout Hollegien (CFO) was considered. Similarly, leading up to the 2026 AGM, the proposed reappointment of Sonja Barendregt was reviewed. Furthermore, the succession of Jos Baeten which led to the proposed appointment of Ingrid de Swart was discussed in detail, as previously explained (see section 5.2.1).
Other topics discussed by the N&ESGC included the amendment of the Dutch Corporate Governance Code 2025. The most significant change concerns the inclusion of a provision on the VOR. The N&ESGC also discussed the action plan for the evaluation of the system of governance and the progress on non-financial objectives and DGI reporting, including the ratio of women to men at the top and sub-top. The N&ESGC also discussed the annual appraisals of senior management. Furthermore, the N&ESGC was informed on the results of the Denison Culture scan. For more information, please see section 3.2.
The N&ESGC discussed the various developments and related legislation regarding ESG and what this means for a.s.r., such as progress on the targets of the various themes, with a focus on the strategic pillars from the strategic framework for sustainability and internal and external developments in this area. The N&ESGC also discussed about the progress on the non-financial targets and there was a deepening of the Responsible Investment Policy of a.s.r. and the sustainability strategy of Asset Management.
Financial statements and dividend
The EB prepared the Annual Report 2025 and discussed it with the SB in the presence of the external auditor. The 2025 financial statements will be submitted for adoption by the AGM on 20 May 2026. a.s.r. will propose a dividend of € 3.41 per ordinary share (including the interim dividend paid).
Appreciation
The SB extends its sincere appreciation to the EB, MB and senior management for their leadership and the strong results achieved. The SB also extends its heartfelt thanks to all employees for their dedication and commitment throughout 2025. Together, we are creating a leading, sustainable insurer in the Netherlands, supporting customers with risk‑sharing and capital growth. The professionalism and engagement shown throughout the organisation have been key to the solid progress achieved during the year.
Utrecht, The Netherlands, 24 March 2026
Joop Wijn (Chair)
Gerard van Olphen
Sonja Barendregt
Gisella Eikelenboom
Daniëlle Jansen Heijtmajer
Lard Friese
Bob Elfring
5.3 Remuneration report
5.3.1 Introduction
The Supervisory Board (SB) continuously reviews and evaluates the Remuneration Policy of a.s.r. In accordance with the obligations imposed by law and the Dutch Corporate Governance Code for the implementation of the Remuneration Policy, the Remuneration Policy is submitted to the General Meeting (at least) once every four years. The current Remuneration Policy was adopted at the AGM of 2023.
The Remuneration Policy of a.s.r. is clear, comprehensible and focused on sustainable long-term value creation for the company. In addition, the policy reflects the interests of a.s.r.'s stakeholders. Four perspectives underpin the Remuneration Policy. Please see section 5.3.2 for more information.
a.s.r. believes that its current Remuneration Policy continues to meet the requirements of the Shareholder Rights Directive II, as incorporated into Dutch law. The Remuneration Policy explains how it contributes to a.s.r.’s strategy, sustainability and the interests of stakeholders. The identity and positioning of a.s.r. as well as the remuneration ratios within a.s.r. were considered by providing a framework based on four perspectives: the organisational perspective, the internal perspective, the external perspective and the stakeholder perspective.
During the 2025 AGM, shareholders cast their advisory vote on the 2024 remuneration report. The remuneration report received the support of almost 96% of the shareholders. This is consistent with the approval rate of the Remuneration Policy from the previous year, which exceeded 98%.
5.3.2 Remuneration Policy
The remuneration of the Executive Board (EB) members is fixed. No variable remuneration scheme applies. The (fixed) remuneration of the members of the EB is paid in part in a.s.r. shares.
The following four perspectives are used as a basis for the Remuneration Policy:
The organisational perspective: how a.s.r. presents itself as a company;
The internal perspective: consistency in the internal salary structure;
The external perspective: competitive with the external market;
The stakeholders’ perspective: taking into account the views of different stakeholder groups on remuneration: customers, shareholders, employees, and society.
The Remuneration Policy pertains to the remuneration of the EB and the SB.
- Section 5.3.2 is in scope of CSRD and limited assurance (ESRS 2 GOV-3).
The organisational perspective
It is a.s.r.’s view that society may expect it to be a valuable insurer which handles the funds entrusted to it and the environment in which it operates in a responsible way. With respect to the remuneration of the EB, society may expect this to be in line with a.s.r.’s profile, and that both the Remuneration Policy and the level of executive remuneration are reasonable from that perspective.
In line with this perspective, a.s.r. has a fixed salary only and no group wide variable remuneration scheme. a.s.r. is of the opinion that such a scheme is not in line with the company's culture. The opinion of society towards variable remuneration in the financial sector is also relevant in this respect.
The internal perspective
All a.s.r. employees have job-weighted salaries within defined salary scales that they progress through over time. The remuneration of EB members is determined by the various roles within the EB and fall within certain salary scales. The link between roles and salary scales is consistent throughout the organisation. For all employees including the EB, the maximum of the remuneration is at most around the median of the reference group.
In principle, EB members progress through the salary scales in the same way as employees. For employees, an annual growth of 3% of the maximum of the scale is applied (provided there is upward room in the scale). For EB members, the SB has the mandate to adjust this growth path upwards or downwards (growth between 0% to 6%), taking into account a.s.r.’s performance and the principles of the Remuneration Policy. The SB accounts for this in the annual remuneration report.
The a.s.r. Collective Labour Agreement (CLA) applies to the EB with regard to salary indexation.
The external perspective
a.s.r. pays its employees a salary in line with the market. Market conformity is tested against a reference group. The reference group for the EB consists of Dutch financial institutions and Dutch listed companies, many of which have a social profile and of which at least half must be financial institutions including insurers. To be included in the reference group, the non-financial institutions must meet at least two of three criteria for comparable size with a.s.r. These criteria are: turnover, market capitalisation and number of employees. All remuneration data of companies in the reference group must be published individually. a.s.r.’s position is approximately in the middle of this reference group.
The SB also periodically tests the median against a Europe Control group, consisting of at least ten European financial institutions. The Europe Control group serves as an additional check of the median that follows from the reference group, so that European developments in this area can also be monitored. The Europe Control group has no direct effect on the median or the remuneration set.
The 2023 reference group for other employees is the financial services industry. For some positions within Group Asset Management and Real Estate, the reference group is the asset management market.
The a.s.r. group uses remuneration benchmarks to determine the ratio of remuneration based on the perspectives and role of the a.s.r. group within society and other stakeholders. A remuneration benchmark is periodically carried out for all employees by an external consulting firm. The remuneration benchmark of the EB is conducted once every two years. According to the benchmark performed in 2025 for the EB, the maximum remuneration for the CEO position is around the median. For the maximum remuneration of the CFO and COO/CTO roles, both are above the median. The remuneration policy is based on a maximum remuneration around the median of the reference group. This analysis will serve as input for the regular remuneration evaluation, which will be presented to the AGM in May 2027.
The stakeholders’ perspective
The structure of the Remuneration Policy was reviewed against the views of shareholders, customers, employees and society. The views and interests of these different stakeholder groups are taken into account as much as possible.
Customers must be able to rely on a solid insurance company that offers understandable products and services at a reasonable price. Customers must be able to rely on the company to handle the funds entrusted to it with care; this includes a reasonable Remuneration Policy. Society expects a financial institution that contributes to society as a whole. Employees expect a reliable employer that ensures the long-term continuity of the company. Employees expect adequate remuneration for their efforts. With regard to board remuneration, they expect their remuneration and any changes to fit the character of the company and to be explainable. Shareholders benefit from a solid company that offers attractive returns. Shareholders expect alignment of the board with their interests, with executive remuneration keeping pace with the company's performance. The Remuneration Policy should be such that high-quality board members can be retained and attracted.
Periodical review
The Remuneration Committee reviews the principles of the Remuneration Policy against the four perspectives (at least) once every four years.
The performance of each EB member is reviewed annually, based on a set of financial and non-financial targets approved by the SB. The targets for 2025 can be summarised as follows:
Customer: implementation of the online distribution strategy and the digital customer contact strategy including the transition from low-impact customer contacts to digital self-service environments. Also a.s.r. aims for an increase of the NPS-i by 2 points compared to the baseline measurement in Q4 2024;
Employee: an engagement score of 80 (Denison scan) and focus on an increase in the number of women in management positions to 37% in 2025. Also, an overall absence rate maximum of 4.2%. Keep diversity and inclusion on the agenda demonstrating exemplary behaviour;
Shareholder: realisation of the financial targets and the financial KPIs in the multi-year budget and realisation of the Aegon NL integration on time and on budget;
Society: further expansion of the positioning of a.s.r. as a sustainable long-term value-creating insurer and socially conscious financial institution. This is measured by different ratings and benchmarks.
These targets are complemented by specific strategic priorities for each EB member, such as the further integration of a.s.r. and Aegon NL, the integration of PIM for a.s.r. Life into the reporting process and the further developing of a vision on AI and establishing a clear AI ambition and roadmap for each business unit. Targets are discussed periodically during various evaluation meetings between the SB and (members of) the EB.
Contractual aspects
EB members work on the basis of a services contract under Dutch law for an indefinite period of time. Each contract ends by operation of law as soon as a party ceases to be an EB member. A contract can also be terminated with a notice period of six months for a.s.r. and three months for an EB member. The contracts also contain a provision for dismissal due to a change of control.
The following conditions apply to severance pay for policymakers (which includes EB members):
The maximum severance pay is 100% of the (fixed) annual remuneration.
Severance pay is not awarded in the event it rewards failure.
No severance pay is awarded that can be classified as variable.
Severance pay may not be awarded to any employee (including EB members) in the following cases:
If an employment relationship is terminated at the employee's own initiative, except where this is due to serious culpable conduct or neglect by the employer.
In the event of serious culpable conduct or neglect by the employee and/or an urgent reason for instant dismissal applies.
Pay ratio
a.s.r. is transparent concerning the remuneration of the EB, not only in terms of actual amounts, but also in accordance with Dutch law and the Dutch Corporate Governance Code as compared with the average remuneration of all employees of a.s.r. As laid down in the Remuneration Policy, the ratio between the remuneration of the CEO and the average remuneration of the employees at a.s.r. should at all times be less than 20. The current pay ratio is 1:17.6.
The SB considers that the pay ratio is reasonable. Compared to the remuneration of other executive directors of comparable companies, this pay ratio is among the lowest.
Pay ratio1
| (units specified below) | 2025 | 2024 |
|---|---|---|
| Annual total compensation for the highest-paid individual (in €) | 2,111,000 | 1,971,000 |
| Average annual total compensation for all employees (in €) | 120,000 | 117,000 |
| Average pay ratio (in %) | 17.6 | 16.9 |
| Average pay ratio difference compared to previous year (in %) | 4.1 | 28.0 |
- The average pay ratio is not in scope of CSRD and limited assurance. For the median pay ratio, in scope of CSRD and limited assurance, please refer to section 6.3.1.3.
5.3.3 Executive Board
Neither a.s.r. nor any Group company provides any loans, advances or guarantees on behalf of an EB member. The comparative chart below shows the remuneration and company performance over the last five reported financial years. Company performance is expressed in terms of operating result per share. The average remuneration of employees (who are not EB members) is also shown, and this is also used to calculate the pay ratio. Finally, the average EB remuneration (CEO and CFO) is presented.
Comparative chart remuneration and company performance
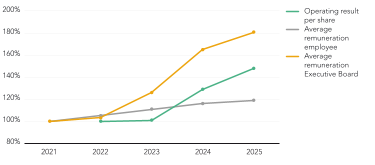
The Remuneration Policy can be found at the corporate website.
Pensions
The calculation of annual pension expenses is based on the total pension rights granted during a term of service at a.s.r. Pension expenses include:
Pensions based on a maximum pensionable salary cap (€ 137,800, fiscal maximum);
Compensation for the maximum pensionable salary cap (to be used for pensions at the employee's discretion);
Pension benefits related to historically awarded pension rights;
VPL (early retirement and life cycle, Prepensioen en Levensloop - VUT).
All components of EB remuneration are included in the basis used for calculating pension benefits. EB members have the same pension scheme as a.s.r. employees.
The indexation of the defined benefit plan granted to EB members in 2025 is as following: Jos Baeten € 309,686 and over 2024 € 286,256, Ewout Hollegien € 7,166 and over 2024 € 6,273 and Ingrid de Swart € 988 and over 2024 € 894.
Remuneration members of the Executive Board
Based on the benchmark and in line with the Remuneration Policy, the CEO’s salary scale per November 2025 is between € 1,054,555 and € 1,506,507. For the CFO and the COO/CTO, a salary scale of € 817,685 to € 1,168,122 applies. The benchmark is set every two years. The positioning, scale maximum and resulting bandwidth of the scales are then assessed and may be adjusted in relation to the resulting median.
The reference group 2025, which consists of 16 companies and the Europe Control group currently consists of 16 financial companies.
Reference group
| Organisation | Index |
|---|---|
| Aalberts N.V. | AMX |
| ABN AMRO Bank N.V. | AEX |
| Achmea B.V. | Not listed |
| Aegon Ltd. | AEX |
| ASM International N.V. | AEX |
| Coöperatieve Rabobank U.A. | Not listed |
| ASN Bank N.V. | Not listed |
| IMCD N.V. | AEX |
| ING Groep N.V. | AEX |
| JDE Peet's N.V. | AEX |
| Koninklijke KPN N.V. | AEX |
| Koninklijke Vopak N.V. | AMX |
| NN Group N.V. | AEX |
| OCI N.V. | AMX |
| Signify N.V. | AMX |
| Van Lanschot Kempen N.V. | AMX |
Europe Control group
| Organisation |
|---|
| Ageas SA/NV |
| Bâloise Holding AG |
| Beazley plc |
| Direct Line Insurance Group plc |
| Gjensidige Forsikring ASA |
| Grupo Catalana Occidente, S.A. |
| Hannover Rück SE |
| Helvetia Holding AG |
| Hiscox Ltd |
| Phoenix Group Holdings plc |
| SCOR SE |
| Storebrand ASA |
| Tryg A/S |
| Unipol Gruppo S.p.A. |
| UnipolSai Assicurazioni S.p.A. |
| Wüstenrot & Württembergische AG |
2025 was an outstanding year for a.s.r. The results remained robust, and several milestones were achieved. Significant steps were taken in the integration process, such as the migration of Life and Mortgages, which was completed entirely according to plan, ensuring continuity of service and a warm welcome for customers. In accordance with the recommendation of the Remuneration Committee, the SB has decided to grant a salary increase of 6% to all members of the EB as of 1 January 2026.
Furthermore, under the CLA (applicable from 1 April 2025 until 1 January 2027), a.s.r. employees were given an indexation of their salary of 3% from 1 November 2025. This increase also applies to EB members.
Remuneration in a.s.r. shares
As from 1 July 2023, part of the (fixed) remuneration of the EB members is paid in a.s.r. shares, being 20% of the fixed cash remuneration. For the current CEO, an exception applies until the end of his term of appointment (2026 AGM): 30% of his fixed cash remuneration is paid in a.s.r. shares. All shares must be held for at least five years. Furthermore, EB members (as long as they are employed) must hold at least 100% of their fixed gross annual salary in shares before they are allowed to sell any shares. Any sale of shares is subject to the a.s.r. regulations on the handling of private transactions in financial instruments and applicable law. The following table shows how much remuneration for each EB member was paid in a.s.r. shares in 2025.
Participation in a.s.r. shares
Until the amendment of the Remuneration Policy as per 1 July 2023, EB members were committed to purchasing a certain percentage of their remuneration in a.s.r. shares (75% for the CEO and 50% for other EB members) and holding these shares for at least five years. The shares are not variable remuneration, nor a remuneration in shares.
The number of shares that are allocated (granted) to EB members are calculated as a function of (1) the defined percentage of the fixed salary at allocation date and (2) the applicable stock price at Euronext. The applicable stock price is defined as the opening stock price on the 1st trading day after the salary-payment date in each month. The salary payment dates are pre-defined in the salary payment schedule and set by the Human Resources department. The shares are purchased by the EB at a discount of 18.5%. The average grant price of the shares was € 44,99, which is equal to the opening stock price on the Euronext Amsterdam stock exchange on the 1st trading day after the salary-payment date in each month. The shares are in a lock-up period of five years.
The participation of shares of the EB can be found in the table below.
a.s.r. shares Executive Board
| (in numbers/%) | As at 1 January 2025 | Participation in a.s.r. shares in 2025 | Granted and vested in 2025 | As at 31 December 2025 | In % of gross annual salary1 |
|---|---|---|---|---|---|
| Jos Baeten | 17,484 | - | 4,160 | 21,644 | 57.6 |
| Ewout Hollegien | 5,330 | - | 2,260 | 7,590 | 29.0 |
| Ingrid de Swart | 8,502 | - | 2,260 | 10,762 | 38.6 |
| Total | 31,316 | - | 8,680 | 39,996 |
- Base salary in cash and shares
2025 remuneration for members of the Executive Board
| (in € thousands) | Fixed remuneration | Variable remuneration | ||||||||
|---|---|---|---|---|---|---|---|---|---|---|
| Executive Board member | Base salary in cash | Base salary in shares | Fees | Fringe benefits11 | One-year variable | Multi-year variable | Extraordinary items | Pension expense | Total remuneration | Fixed portion of the total remuneration |
| Jos Baeten, CEO | 1,235 | 371 | - | 16 | - | - | - | 488 | 2,111 | 100% |
| Ewout Hollegien, CFO | 1,007 | 201 | - | 32 | - | - | - | 140 | 1,381 | 100% |
| Ingrid de Swart, COO / CTO | 1,007 | 201 | - | 36 | - | - | - | 272 | 1,516 | 100% |
| Total | 3,249 | 773 | - | 84 | - | - | - | 900 | 5,007 | 100% |
- Variations arise as a result of the fiscal treatment of lease vehicles depending on the price and private use of the car, personal allowance and social security.
2024 remuneration for members of the Executive Board
| (in € thousands) | Fixed remuneration | Variable remuneration | ||||||||
|---|---|---|---|---|---|---|---|---|---|---|
| Executive Board member | Base salary in cash | Base salary in shares | Fees | Fringe benefits1 | One-year variable | Multi-year variable | Extraordinary items | Pension expense2 | Total remuneration | Fixed portion of the total remuneration |
| Jos Baeten, CEO | 1,159 | 348 | - | 16 | - | - | - | 449 | 1,971 | 100% |
| Ewout Hollegien, CFO | 882 | 176 | - | 31 | - | - | - | 122 | 1,212 | 100% |
| Ingrid de Swart, COO / CTO | 946 | 189 | - | 35 | - | - | - | 214 | 1,384 | 100% |
| Total | 2,987 | 713 | - | 82 | - | - | - | 785 | 4,567 | 100% |
- Variations arise as a result of the fiscal treatment of lease vehicles depending on the price and private use of the car, personal allowance and social security.
- The post-employment defined benefit plan of a.s.r. ended 31 December 2020. A new defined contribution plan started from 1 January 2021. The defined benefit obligation will continue to exist, but no further regular annual premium contributions will be paid to the plan. All members of the Executive Board participate in the defined contribution plan. The annual pension expenditure is based on a premium table. Further changes in the cost of pension benefits are mainly due to the impact of age. The pension costs include defined contribution pensions based on maximum pensionable salary cap, compensation for the maximum pensionable salary cap (to be used for pensions at the employees’ discretion in total), and VPL. The amount presented is excluding amounts related to the indexation of the defined benefit plan, as they are not expenses in the current year.
5.3.4 Supervisory Board
Remuneration paid to SB members is not linked to the financial performance of a.s.r. and none of the SB members own a.s.r. shares. SB members are entitled to the following remuneration, as adopted by the 2023 AGM:
A base fee for each SB member and the chair;
A committee fee for each member and chair of a committee of the SB.
Supervisory Board fees
| (in €) | 2025 | 20241 |
|---|---|---|
| Supervisory Board | ||
| Chair | 90,000 | 90,000 |
| Member | 60,000 | 60,000 |
| Audit & Risk Committee | ||
| Chair | 15,000 | 15,000 |
| Member | 10,000 | 10,000 |
| Remuneration Committee | ||
| Chair | 10,000 | 10,000 |
| Member | 5,000 | 5,000 |
| Nomination & ESG Committee | ||
| Chair | 10,000 | 10,000 |
| Member | 5,000 | 5,000 |
- Change in SB fees applicable per 1 July 2024.
An overview of the remuneration for the SB is shown in the table.
SB members who also serve on the SB of ASR Basis / Aanvullende Ziektekostenverzekeringen N.V., IORP and/or Robidus receive an additional € 6,000 per annum.
Remuneration members of the Supervisory Board
The remuneration of current and former members of the SB is in accordance with the Remuneration Policy established during the 2023 AGM.
Neither a.s.r. nor any Group company provides loans, advances or guarantees on behalf of an SB member. A basic principle of a.s.r.’s current Remuneration Policy (both for the EB and the SB) is that remuneration should be at most around the median for the reference group. The reference group for the SB is the same as the reference group for the EB. The current remuneration of the SB is in accordance with the policy requirements.
2025 remuneration for members of the Supervisory Board
| (in € thousands) | Base fee | Commission fees | Total remuneration | Fixed portion of the total remuneration |
|---|---|---|---|---|
| Joop Wijn1 | 90 | 15 | 105 | 100% |
| Sonja Barendregt2 | 60 | 21 | 81 | 100% |
| Gisella Eikelenboom3 | 60 | 27 | 87 | 100% |
| Gerard van Olphen4 | 60 | 21 | 81 | 100% |
| Daniëlle Jansen Heijtmajer5 | 60 | 5 | 65 | 100% |
| Lard Friese6 | 60 | 10 | 70 | 100% |
| Bob Elfring7 | 60 | 15 | 75 | 100% |
| Total | 450 | 114 | 564 | 100% |
- Fees in 2025 are amounts received as chair of the N&ESGC (€ 10,000) and member of the RC (€ 5,000). Fees in 2024 are amounts received as chair of the N&ESGC (€ 10,000) and as member of the RC (€ 5,000).
- Fees in 2025 are amounts received as chair of the A&RC (€ 15,000) and as member of the Supervisory Board of ASR Basis/Aanvullende Ziektekostenverzekeringen N.V. (€ 6,000). Fees in 2024 are amounts received as chair of the A&RC (€ 15,000) and as member of the SB of ASR Basis/Aanvullende Ziektekostenverzekeringen N.V. (€ 6,000).
- Fees in 2025 are amounts received as chair of the RC (€ 10,000), and as member of the N&ESGC (€ 5,000), as member of the SB of ASR Basis/Aanvullende Ziektekostenverzekeringen N.V. (€ 6,000), and as member of the SB of PPI (€ 6,000). Fees in 2024 are amounts received as chair of the RC (€ 10,000), and as member of the N&ESGC (€ 5,000), as member of the SB of ASR Basis/Aanvullende Ziektekostenverzekeringen N.V. (€ 6,000), as member of the SB of PPI (€ 5,000), and as member of the SB of Aegon Cappital (€ 5,000).
- Fees in 2025 are amounts received as member of the A&RC (€ 10,000), as member of the N&ESGC (€ 5,000), and as member of the SB of Robidus (€ 6,000). Fees in 2024 are amounts received as member of the A&RC (€ 10,000), as member of the N&ESGC (€ 5,000). Gerard van Olphen was appointed to the SB of Robidus on 1 July 2024. Fees in 2024 include amounts received as member of the SB of Robidus (€ 2,500, reflecting a partial year).
- Fees in 2025 are amounts received as member of the N&ESGC (€ 5,000). Fees in 2024 include amounts received as member of the N&ESGC (€ 5,000).
- Fees in 2025 are amounts received as member of the A&RC (€ 10,000). Fees in 2024 include amounts received as member of the A&RC (€ 10,000).
- Fees in 2025 are amounts received as member of the A&RC (€ 10,000) and as member of the RC (€ 5,000). Bob Elfring was appointed to the SB on 29 May 2024. Fees in 2024 include amounts received as member of the A&RC (€ 5,833, reflecting a partial year) and as member of the RC (€ 2,917, reflecting a partial year).
2024 remuneration for members of the Supervisory Board
| (in € thousands) | Base fee | Commission fees | Total remuneration | Fixed portion of the total remuneration |
|---|---|---|---|---|
| Joop Wijn1 | 83 | 15 | 98 | 100% |
| Sonja Barendregt2 | 55 | 21 | 76 | 100% |
| Gisella Eikelenboom3 | 55 | 31 | 86 | 100% |
| Gerard van Olphen4 | 55 | 18 | 73 | 100% |
| Daniëlle Jansen Heijtmajer5 | 55 | 5 | 60 | 100% |
| Lard Friese6 | 55 | 10 | 65 | 100% |
| Bob Elfring7 | 34 | 9 | 43 | 100% |
| Herman Hintzen8 | 21 | 6 | 27 | 100% |
| Total | 413 | 115 | 527 | 100% |
- Fees in 2025 are amounts received as chair of the N&ESGC (€ 10,000) and member of the RC (€ 5,000). Fees in 2024 are amounts received as chair of the N&ESGC (€ 10,000) and as member of the RC (€ 5,000).
- Fees in 2025 are amounts received as chair of the A&RC (€ 15,000) and as member of the Supervisory Board of ASR Basis/Aanvullende Ziektekostenverzekeringen N.V. (€ 6,000). Fees in 2024 are amounts received as chair of the A&RC (€ 15,000) and as member of the SB of ASR Basis/Aanvullende Ziektekostenverzekeringen N.V. (€ 6,000).
- Fees in 2025 are amounts received as chair of the RC (€ 10,000), and as member of the N&ESGC (€ 5,000), as member of the SB of ASR Basis/Aanvullende Ziektekostenverzekeringen N.V. (€ 6,000), and as member of the SB of PPI (€ 6,000). Fees in 2024 are amounts received as chair of the RC (€ 10,000), and as member of the N&ESGC (€ 5,000), as member of the SB of ASR Basis/Aanvullende Ziektekostenverzekeringen N.V. (€ 6,000), as member of the SB of PPI (€ 5,000), and as member of the SB of Aegon Cappital (€ 5,000).
- Fees in 2025 are amounts received as member of the A&RC (€ 10,000), as member of the N&ESGC (€ 5,000), and as member of the SB of Robidus (€ 6,000). Fees in 2024 are amounts received as member of the A&RC (€ 10,000), as member of the N&ESGC (€ 5,000). Gerard van Olphen was appointed to the SB of Robidus on 1 July 2024. Fees in 2024 include amounts received as member of the SB of Robidus (€ 2,500, reflecting a partial year).
- Fees in 2025 are amounts received as member of the N&ESGC (€ 5,000). Fees in 2024 include amounts received as member of the N&ESGC (€ 5,000).
- Fees in 2025 are amounts received as member of the A&RC (€ 10,000). Fees in 2024 include amounts received as member of the A&RC (€ 10,000).
- Fees in 2025 are amounts received as member of the A&RC (€ 10,000) and as member of the RC (€ 5,000). Bob Elfring was appointed to the SB on 29 May 2024. Fees in 2024 include amounts received as member of the A&RC (€ 5,833, reflecting a partial year) and as member of the RC (€ 2,917, reflecting a partial year).
- Herman Hintzen resigned during the 2024 AGM. Therefore, he received fees until 29 May 2024. Fees in 2024 include amounts received as Member of the A&RC (€ 4,168, reflecting a partial year) and the RC (€ 2,083, reflecting a partial year).
5.4 Managing risks
Risk management is an integral part of a.s.r.’s day-to-day business operations, supported by an integrated approach ensuring that risks are managed effectively, while supporting the achievement of strategic and operational objective. Value is created by striking the right balance between risk, return and capital, whilst ensuring that obligations to stakeholders are met.
5.4.1 Risk appetite
Risk appetite is defined as the level and type of risk a.s.r. is willing to bear in order to meet its targets, whilst maintaining the right balance between risk, return and capital. a.s.r.’s risk appetite contains a number of qualitative and quantitative Risk Appetite Statements (RAS) and gives direction to the management of both financial risks (FR) and non-financial risks (NFR). The statements highlight the organisation's risk preferences and limits and are viewed as key elements for the realisation of a.s.r.’s strategy.
To ensure alignment with a.s.r.’s overall strategy and risk strategy, the RAS and RAS limits were evaluated and determined in the a.s.r. RC and approved by the SB in 2025, as part of the annual risk management cycle. For a.s.r.’s RAS, see section 7.8.1.1.1.
5.4.2 Risk governance
5.4.2.1 Management of strategic risks and emerging risks
a.s.r.’s risk priorities and emerging risks represent the most significant strategic risks for a.s.r. Risk priorities are existing risks with impact on the achievement of the strategic objectives. Emerging risks are new or existing risks with a potentially major impact on the achievement of the strategic objectives. Risk priorities and emerging risks are defined annually by the MB, based on strategic risk analyses. Risk priorities and emerging risks are embedded in the risk management governance. Risks and actions are assigned to executive-level owners, ensuring accountability within the business, with monitoring by both first-line and second-line risk functions. Group Risk Management (GRM) monitors developments in risks and actions of the risk priorities and emerging risks centrally. Relevant developments are reported to the a.s.r. Risk Committee (a.s.r. RC) and the Audit & Risk Committee (A&RC) on a half-yearly basis. For a.s.r.’s risk priorities and emerging risks, see section 5.4.3.
To assess the level of individual strategic risks and to determine which risks are included in a.s.r.'s risk priorities, a.s.r. uses a risk scale based on probability and impact. The degree of risk is expressed as the Level of Concern (LoC). For each strategic risk, the LoC is determined for the gross and net risk. Gross risk is the degree of risk when no (control) measures are in place. Net risk is the degree of risk with mitigating (control) measures in place. If the degree of a net risk is not within a.s.r.'s risk appetite, then additional actions are taken in order to bring the risk priority within the risk appetite.
a.s.r. risk scale
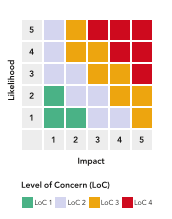
5.4.2.2 Management of financial risks
a.s.r. aims for an optimal trade-off between risk, return and capital. Steering on risk, return and capital takes place via decision-making through the entire product cycle, from the Product Approval & Review Process (PARP) to the payment of benefits and claims. At a more strategic level, decision-making takes place through balance sheet and performance management. A robust solvency position takes precedence over profit, premium income and direct investment income.
Financial RAS are in place to manage a.s.r.’s financial risk profile and includes risk tolerance levels and limits. See section 7.8.1.1.1. The financial RAS are monitored by the Financial Risk Committee (FRC). The FRC evaluates FR positions against the RAS on a monthly basis. Where necessary, a.s.r. applies additional mitigating measures. The Actuarial Function (AF) performs its regulatory tasks by assessing the adequacy of the Solvency II technical provisions, giving an opinion on reinsurance and underwriting, contributing to the Risk Management Framework and supporting the Risk Management Function (RMF). The annual report of the AF is discussed by the FRC, a.s.r. RC and A&RC. For further information, see section 7.8.
5.4.2.3 Management of non-financial risks
Non-financial RAS are in place to manage a.s.r.’s non-financial risk profile within the limits, see section 7.8.1.1.1. For non-financial risk, a.s.r. has prepared statements relating to strategy, processes, information and technology, projects, integrity, reporting and model risk. Employees should use these statements as a framework for risk management decisions. For more detail regarding non-financial risks, see section 5.4.3.4.
Risk tolerance levels and limits are disclosed in the non-financial RAS and are monitored by the NFRC. The non-financial risk profile and internal control performance of each business line is discussed with senior management in the business risk committees each quarter. The NFRC monitors and discusses on a quarterly basis whether NFR are adequately managed. Where appropriate, a.s.r. applies additional mitigating measures.
5.4.3 Identified risks
The risks identified are clustered into:
Strategic risks;
Emerging risks;
Financial risks;
Non-financial risks.
5.4.3.1 Strategic risks
In 2025, a.s.r.’s risk priorities were:
(Geo)political instability and economic uncertainty;
Climate change and biodiversity loss;
Risks related to cyber/information security;
Risks related to Artificial Intelligence;
Risks related to the integration of Aegon NL;
Consequences of legislation and regulations, supervision and legalisation of society.
(Geo)political instability and economic uncertainty
Geopolitical tensions continue to give rise to conflicts between countries, ranging from sanctions and protectionist measures to wars, terrorism and cyber threats. Ongoing instability in regions such as the Middle East and the war in Ukraine illustrate a shifting global order in which major powers define spheres of influence and increasingly assert national interests. This creates heightened uncertainty, particularly as Europe is required to reconsider its strategic positioning to safeguard autonomy.
These developments coincide with significant dependencies on digital infrastructure and external cloud services, which can create vulnerabilities in the event of disruptions to essential services or failures across international supply chains. Risks also arise from cyberattacks, digital espionage and the spread of misinformation and disinformation. The changing geopolitical context underscores the importance of societal and organisational resilience.
The aforementioned factors can impact general economic development, particularly interest rates, inflation, and investment returns. The monetary policy of central banks also influences this.
a.s.r. monitors developments and mitigates related risks:
Strategic Asset Allocation (SAA) scenario analyses, interim adjustments and automatic portfolio rebalancing via market risk budgets;
Recovery measures embedded in the Preparatory Crisis Plan;
Adjustments to interest‑rate and inflation hedges where appropriate;
Premium increases where feasible to mitigate inflation effects;
Measures to strengthen societal and organisational resilience.
Climate change and biodiversity loss
Climate change refers to shifts in global or regional climate patterns and affects both insurable risks and investments. Climate related risks are generally classified as physical and transition risks. Physical risks arise from the direct impact of climate change or human activity. These may be acute, such as extreme weather events or deforestation, or chronic when driven by gradual developments including water scarcity, rising temperatures, or sea level rise. Transition risks relate to the adjustments required to move towards a low carbon economy. These involve changes in legislation, supervisory expectations, technological developments, and evolving customer needs or market dynamics.
a.s.r. monitors developments and mitigates related risks:
Assessing climate‑scenario impacts in the annual SAA study;
Using reinsurance to cover physical risks in the P&C portfolio, including catastrophe reinsurance;
Adjusting premiums and conditions for short‑term contracts based on evolving risk insights; supported by cooperation with research institutes, reinsurers and experts;
Developing products that support sustainability, including green mortgage propositions;
Raising climate‑risk awareness and providing guidance to customers and advisors to support sustainable choices.
Risks related to cyber and information security
Technological change creates both opportunities and threats. Continued digitalisation and automation keep cyber and information security risks structurally high for a.s.r. and its IT suppliers. Over the past year, geopolitical tensions have further raised the threat level. Although insurers in the Netherlands have not yet been specifically targeted, indirect damage from attacks on critical infrastructure cannot be excluded, including sabotage of network assets and the spread of misinformation and disinformation via social platforms.
Cyber risks evolve quickly with the wider use of new technologies. While quantum computing remains experimental, experts consider it a small but real possibility that by around 2030 current cryptographic standards could be broken. a.s.r. follows the General Intelligence and Security Service of the Netherlands (Algemene Inlichtingen- en Veiligheidsdienst - AIVD) guidance and, together with key SaaS partners, is phasing in updated cryptographic standards.
Beyond technical threats, there is a residual risk that the speed and complexity of information security developments outpace the organisation's ability to respond quickly and adequately. In addition, supply chain dependencies and ongoing business continuity enhancements imply that the potential impact of a severe incident remains high.
a.s.r. monitors developments and mitigates related risks:
Maintaining robust technical and procedural controls based on international standards; active threat monitoring and regular security testing to strengthen cyber resilience;
Applying a BCM policy to protect continuity of critical operations, including outsourced activities, with measures such as 'Doomsday' backup and emergency procedures;
Implementing an information security awareness programme with targeted training, gamification, mandatory assessments and phishing campaigns;
Participating in sector and public partnerships to share intelligence and enhance sector‑wide cyber resilience.
Risks related to artificial intelligence
Artificial Intelligence (AI) enables a.s.r. to process large volumes of data to improve risk assessment, fraud detection, personalised customer communication and faster, more objective decision‑making. This enhances productivity, service quality and competitive position across the entire value chain. It is essential for a.s.r. to closely monitor developments and integrate AI into its strategy while managing associated risks. Effective AI use requires strong governance, skilled employees and reliable data. a.s.r. must continuously align with evolving AI legislation and regulatory expectations. This demands ongoing monitoring, system updates and workforce readiness, supported by a learning organisation capable of responsible AI adoption.
AI is expected to drive significant future change, although long-term impacts remain uncertain. Shifting customer expectations may lead to new AI-driven solutions and business models, influenced by technological advances such as big‑tech innovation and quantum computing. To ensure long‑term resilience, a.s.r. must optimise data use, rely on robust digital and cloud infrastructure, adopt emerging technologies and foster a culture of continuous learning.
a.s.r. monitors developments and mitigates related risks:
Market and competitive position: applying proven AI technologies, setting ambitious AI adoption goals, developing reusable use cases and stimulating innovation to improve cost efficiency and customer satisfaction;
Strategic partnerships: collaborating with external partners and experts to exchange knowledge and apply AI effectively;
Governance and risk management: guiding AI investments through AI policy, AI portfolio management and a central AI register, with Risk and Compliance embedded. Employees, management and directors receive AI training and have access to AI driven digital assistants;
Transparency, privacy and security: using explainable AI, documenting decision processes and ensuring transparent reporting, while protecting privacy, security and ethical principles;
Data, insurability and emerging risks: strengthening data governance and quality, safeguarding solidarity in product development and adapting insurance products to evolving AI‑driven risks.
Risks related to the integration of Aegon NL
All major integration milestones have been achieved, the partial internal model is implemented for a.s.r. Life and a.s.r. is fully on track to achieve run-rate cost synergies target. As a result, internal risks have been significantly reduced and a.s.r. has strengthened its market position as the second largest insurer in the Netherlands.
Consequences of legislation and regulation, supervisory climate and juridification of society
a.s.r. operates in an environment of expanding and increasingly laws and regulations. These include prudential frameworks such as Solvency II (SII) and International Financial Reporting Standards, sustainability requirements such as CSRD, auditing standards, the Future Pensions Act, privacy legislation and anti-money laundering regulations. The DORA introduces harmonised requirements for ICT resilience, while the European Artificial Intelligence Act sets rules for the use of AI systems. Regulation on digital data sharing continues to expand through initiatives such as the Financial Data Access Regulation and the European Digital Identity framework.
From 30 January 2027, both the SII Review and the Insurance Recovery and Resolution Directive (IRRD) will take effect. The IRRD introduces obligations for recovery and resolution planning, while the SII Review amends the capital and risk management requirements. Regulatory requirements are not always final and may require rapid interpretation and implementation. This creates uncertainty, operational pressure and higher costs. Political and international developments may further influence regulation and a.s.r.’s strategic direction. At the same time, supervision in the financial sector is becoming increasingly data-driven, with higher expectations for data protection demonstrable compliance across financial and non-financial risks.
a.s.r. monitors developments and mitigates related risks:
Establishing programmes and projects on key themes to ensure sound and timely implementation of new requirements;
Considering premium adjustments or coverage exclusions, depending on the financial impact of new regulation and supervisory expectations, to offset increased costs;
Investing in data environments such as data warehouses, dedicated data teams and data‑quality control processes to meet growing data‑reporting obligations. As well as focusing on responsible data use through its updated AI Policy and the Ethical Data‑Use Framework;
Engaging and advocating through sector bodies such as the Dutch Association of Insurers, the CRO Forum and the CFO Forum to help determine the regulatory agenda.
5.4.3.2 Emerging risks
In 2025, the emerging risks identified for a.s.r. were:
Changes in society;
New pandemics and infectious diseases.
Changes in society
A lack of social cohesion presents a risk in the Netherlands. Society shows increasing fragmentation (rising tensions), polarisation (social division) and individualisation (declining solidarity). These developments are influenced by the broader transformation of the welfare state, in which not all groups are equally able to adapt. Social change is accelerating, and the long‑term consequences are inherently uncertain and potentially significant.
Several structural trends contribute to this development:
Financial developments: increasing disparities between income groups, which fuel political uncertainty and, in some cases, populist movements.
Social developments: widening gaps between theoretically and practically educated individuals, and declining income security due to changing forms of work and employment; a rise in conspiracy thinking, with more people believing that societal events result from hidden actions by powerful actors.
Demographic developments: continued urbanisation, ageing, a rise in single‑person and single‑parent households and migration; inequality can also be reinforced by government interventions, for example through measures aimed at managing healthcare expenditure.
These societal shifts affect the role insurers play. Developments influence how insurers invest, market their products and deliver services. They also place increasing demands on supporting processes, systems and data‑driven capabilities required by customers and supervisors in a changing society.
a.s.r. monitors developments and mitigates related risks:
Periodically assessing claims trends and evaluating how its investments, products and services affect the changing society; business units have defined governance responsibilities and participate in sector collaborations, such as the Dutch Association of Insurers.
Maintaining active dialogue with government bodies, both directly and through the Dutch Association of Insurers,to represent relevant interests.
Continuously improving processes, systems, products and services - including insurability and insurance participation - and ensuring data quality for data‑driven applications.
Applying the PARP to ensure products comply with legal requirements and meet customer needs in a changing society, supporting alignment with evolving customer expectations.
New pandemics and infectious diseases
The impact of the COVID‑19 pandemic on a.s.r.’s strategic objectives, operational processes and financial performance has proven to be relatively limited. However, there is a risk that society will face new impactful infectious diseases or changing patterns of infection in the future.
An additional uncertainty stems from zoonoses, diseases that can transfer from animals to humans, which may lead to new diseases or variants of known pathogens that could be highly harmful to public health. Increasing resistance to antibiotics and other antimicrobial agents further raises the likelihood of infections that are difficult to treat. Potential drivers of these developments include climate change, population growth and global mobility. Individuals may also experience long‑term health effects after infection. Future pandemics and emerging infectious diseases are considered inevitable, and their long‑term consequences are inherently uncertain and potentially significant.
a.s.r. monitors developments and mitigates related risks:
a.s.r. has developed policies, procedures, measures and management information to manage the impact of pandemics. These instruments, together with the lessons learned from the COVID‑19 pandemic, contribute to control the impact of any potential future pandemic.
Contributing to the government's approach by following basic measures to prevent disease transmission; and strengthening organisational and societal resilience. Strategic initiatives include promoting physical and mental wellbeing for employees and encouraging healthy lifestyles among customers and staff through a.s.r. Vitality.
In exceptional situations, the government may activate Article 33 of the Health Insurance Act, which reduces or removes risk exposure for health insurers, as applied during the COVID‑19 pandemic.
5.4.3.3 Financial risks
Financial risks are inherent to insurance and investment activities. For the most significant risk categories, capital is held in accordance with the Solvency II framework. In addition to the Solvency II framework and the strategic and non-financial risks, a.s.r. has recognised several financial risks. In 2025, the most relevant of these were:
Economic uncertainty;
Financial sustainability risks.
Economic uncertainty
At present, financial risks arise from various sources, including US economic policies (most notably tariff policies) and the military conflicts in Ukraine and the Middle East (for a description of the risk '(geo)political instability', see section 5.4.3.1). Many countries announced higher investments in defence, potentially leading to higher budget deficits and government debt. High(er) inflation may persist longer than initially expected and lower consumer and investor confidence could hurt the economy. a.s.r. monitors these financial risks continuously and considers adjustments in the investment portfolio when necessary.
Financial sustainability risks
Within the Double Materiality Assessment see section 6.1.4.2 climate change has been identified as the most significant financial risk, both in terms of mitigation and adaptation. These risks primarily relate to the medium and long term. In addition, financial risks have been identified in relation to dependencies on ecosystems, as well as risks arising from potential reputational damage and financial penalties resulting from, among other things, data breaches and violations of data protection laws. These risks are managed through various measures, including asset allocation, scenario analysis and IT management.
5.4.3.4 Non-financial risks
In 2025, a.s.r. encountered a range of operational risks arising from complex integrations, evolving regulatory requirements and technological transformation. The key developments and corresponding risk management measures are outlined below.
For more information about the process of identifying, measuring, managing, monitoring, reporting and evaluating those risks, see section 7.8.1.1.6.
Data governance and model implementation
Insufficient data quality and control maturity during the implementation of complex models, including the PIM, pose risks to accurate reporting and regulatory compliance. Delays or deficiencies could result in remediation efforts and reputational impact. a.s.r. addresses these risks through enhanced monitoring, audits and quality assessments, alongside initiatives such as data quality dashboards, data lineage and embedding control frameworks within the organisation.
Technology and digital transformation
Slow adoption of AI and delays in IT improvement actions, combined with the absence of a comprehensive and uniform IT governance framework, increase the risk of inefficiencies, security incidents and missed strategic opportunities. Mitigation includes implementing AI governance and training programs, accelerating key IT projects such as Role-Based Access Control (RBAC) and standardising IT controls to ensure consistency and resilience.
Sustainability regulations and reputational risks
a.s.r. is subject to a comprehensive and evolving set of public sustainability disclosure requirements, including the CSRD, EU Taxonomy, Sustainable Finance Disclosure Regulation (SFDR) and, as of 2027, the CSDDD.
Given the complexity and dynamic nature of these regulatory frameworks, there is an inherent risk that a.s.r. may not achieve full or timely compliance with all applicable requirements. Additionally, the scope and detail of sustainability disclosures may elevate both reputational and liability risks, particularly if disclosures are perceived as incomplete, inaccurate or inconsistent with stakeholder expectations. a.s.r. mitigates these risks through implementation of robust CSRD control frameworks, dry runs and roadmap activities focused on data integrity and 'in control' processes.
On December 8, 2025, a political agreement was reached between the European co-legislators on measures to simplify and reduce EU sustainability regulations, including the CSRD, CSDDD and the delegated acts under the EU Taxonomy Regulation. This reduction of reporting requirements and requirements with respect to the transition plan under the CSDDD may result in additional challenges for companies such as a.s.r. in obtaining relevant information from business partners in its chain of activities, if those companies are no longer subject to the CSRD, CSDDD and/or the EU Taxonomy Regulation.
Dutch unit-linked products
Compensation schemes
Since the end of 2006, individual unit-linked life insurance products (beleggingsverzekeringen) have been subject to negative attention from the Dutch media, the House of Representatives, the AFM, consumers and consumer organisations. In 2008, a.s.r. concluded an agreement with five consumer organisations to compensate customers in cases where cost charges or risk premiums exceeded a predetermined threshold. The scheme was fully implemented in 2012. Aegon reached a similar agreement in 2009. Both the a.s.r. and Aegon schemes have been fully executed.
Settlement of 29 November 2023
On 29 November 2023, a.s.r. reached a final settlement with five consumer organisations to resolve long-standing disputes regarding unit-linked products. As of 2 February 2026, the settlement has been fully executed and all collective proceedings have been terminated. The settlement, amounting to € 250 million, applies to all customers affiliated with these organisations. It was also agreed that no new claims will be filed against a.s.r. The settlement does not constitute an acknowledgement of excessive costs, risk premiums or charges, nor does it represent a reliable estimate of previously disclosed contingent liabilities.
In 2023, a.s.r. also recognised an additional provision of € 50 million for non-affiliated customers who had not previously received compensation. A substantial portion of this obligation has already been paid in 2025, with the remainder scheduled for settlement in the first half of 2026.
With these settlements, a.s.r. has taken important steps in concluding the unit-linked dispute and mitigating the associated risks. As a result of the finalisation of these settlements, the risks related to the unit-linked dispute have been significantly reduced.
5.5 Ensuring compliance
The Compliance department is centralised within a.s.r. and headed by the compliance key function holder. The compliance key function holder reports hierarchically to the CRO, a member of the MB, and in its capacity as compliance function holder of the supervised entities in the group, to the CRO, in its capacity as board member of the supervised entity. The CRO ensures that the Compliance annual plan proposed by the compliance key function holder is adopted by the MB.
The compliance key function holder also has an escalation line to the (chair of the) EB, to the (chair of the) A&RC and/or the (chair of the) SB to safeguard the independent position of the compliance function and to allow it to operate autonomously.
To enhance and ensure sound and controlled business operations, Compliance is responsible for:
Encouraging compliance with relevant legislation and regulation, self-regulation, ethical standards and the internal standards derived from them (the rules) by providing advice and drafting policies;
Creating awareness of the need to comply with the rules and desired ethical behaviour, including monitoring compliance with the rules;
Monitoring management of compliance risks by further developing adequate compliance risk management, including advising on business measures and actions where necessary;
Interaction with regulators to maintain effective and transparent relationships.
Monitoring and reporting
The compliance key function holder reports quarterly on compliance matters and on the progress made regarding recommended business measures and actions at a.s.r. Group level and supervised entity (Onder toezicht staande ondernemingen - OTSO) level. The subsidiaries D&S, Robidus and HumanTotalCare have their own compliance officers who report to the Compliance department. The quarterly report at group and OTSO levels is presented to and discussed with members of the MB, the RC, the NFRC and the A&RC. The report is shared and discussed with the Dutch Central Bank (De Nederlandsche Bank - DNB), the Dutch Authority for the Financial Markets (Autoriteit Financiële Markten - AFM), and the internal and external auditors.
Compliance is involved in safeguarding controlled and ethical business operations, with customer interests at the forefront. a.s.r. keeps track of changes in laws and regulations, assesses their impact and takes appropriate measures.
Developments in 2025
Based on internal and external developments, Compliance has identified five priorities in its annual plan: customer value, social importance, awareness, governance, and data. In doing so, a.s.r. oversees business operations and reputational risks in accordance with internal rules and the Code of Conduct. By implementing these priorities, Compliance is committed to contributing to long-term value creation for all stakeholders.
In 2025, a.s.r. focused on several key areas:
The further development and safeguarding of the PARP, in collaboration with the PARP Board and the relevant business units;
Customer Due Diligence (CDD), including anti-money laundering and anti-terrorist financing, and working on an improvement plan for CDD-related risks by supervision of the Money Laundering and Reporting Officer (MLRO);
Privacy laws and regulations, including the General Data Protection Regulation (GDPR). a.s.r. considers it important for personal data to be handled with care;
EU sustainability regulations, such as the SFDR, the EU Taxonomy Regulation and the CSRD;
Promoting awareness of a.s.r.'s Code of Conduct and the various policy documents regarding integrity.
5.5.1 Compliance of Personal Data Protection
Governance of personal data protection at a.s.r. is embedded in the broader compliance and risk management structure. The EB, specifically the Chief Technology Officer (CTO) holds ultimate accountability. Senior management members are responsible for ensuring compliance with data protection regulations within their departments. Oversight is supported by the A&RC and the SB.
Operational responsibility for privacy compliance lies with the first line, which is supported by the central Privacy Office (PO). The Data Protection Officer (DPO) operates independently from the first line and the Compliance department. The DPO advises on privacy risks, monitors compliance, and promotes awareness throughout the organisation. The DPO reports periodically to the MB and has the authority to escalate critical issues to the (chair of the) EB, to the (chair of the) A&RC and/or the (chair of the) SB.
For more information about the standards for the processing of personal data and data breaches in 2025, see section 3.1.1.5.
5.5.2 Integrity and ethical conduct
a.s.r.'s Code of Conduct is a guideline for actions and decisions and helps the company to fulfil its duties properly, with care and integrity. It also provides clear guidelines for how employees interact with each other, how a.s.r. serves its customers and how a.s.r. takes responsibility for the environment in which it operates. The a.s.r. Code of Conduct applies to anyone who works for a.s.r., whether on a regular basis or not. a.s.r. expects everyone to observe the Code of Conduct and to hold each other to account for compliance with its stipulations. The Code of Conduct is reviewed periodically and initiatives are employed each year to promote awareness of its guidelines and stipulations.
When they start their employment at a.s.r., every employee, including temporary and external employees, must take an oath or make a solemn affirmation. This demonstrates that they vow to put a.s.r.'s customers’ interests first, accept and comply with the rules of conduct, and observe ethical principles in their actions.
- Section 5.5.2 is in scope of CSRD and limited assurance (ESRS G1-1 & G1-3).
Unethical behaviour
In order to guarantee sound and controlled business operations, a.s.r. has taken a number of control measures. With these measures, a.s.r. seeks to prevent the risk of physical, financial or reputational damage to the company, its customers and/or business partners and other stakeholders.
Examples of preventive control measures include integrity screening carried out by the investigations department prior to hiring new employees and in-employment screening. This integrity screening also extends to contracting parties. To complement this, a.s.r. monitors and stimulates awareness throughout the business with respect to potential conflicts of interest.
Moreover the risk of corruption is addressed in various policies, such as a.s.r.’s Incentive Policy and its Anti-corruption Policy. The latter also prohibits political contributions and charitable donations that may serve as means of bribery and corruption. Both policies are approved by the MB. a.s.r. uses the definition formulated by the DNB: ‘The risk of corruption is the risk of financial companies in the Netherlands being involved in bribery and/or conflicts of interest which impair the integrity of, and trust in, that company or in the financial markets’. By performing SIRAs, a.s.r. maps integrity risks and determines which additional control measures must be taken if any risks fall outside the risk appetite. The SIRA contributes to the detection and prevention of involvement with violations of legislation and regulations or other socially or ethically undesirable acts. Fraud and corruption risks are part of the SIRA.
Reporting mechanism
a.s.r. believes it is important that incidents are reported and that this can be done safely and with due care. a.s.r has implemented various mechanisms for identifying, reporting and investigating concerns about unethical behaviour or behaviour in contradiction of its Code of Conduct or similar internal rules.
All a.s.r. employees must report concerns about unethical behaviour or behaviour in contradiction of its Code of Conduct or similar rules to their manager and/or the Compliance Officer. a.s.r. has an internal reporting route for integrity incidents (included in the Code of Conduct). Internal and external stakeholders may report any signals of incidents or potential risks of human rights violations caused by or through a.s.r.'s business activities using the Human Rights Reporting Point, see section 6.3.2.2.
Protection of whistleblowers
a.s.r. believes it is important for employees to report (suspected) misconduct within a.s.r. carefully, confidentially and safely. There may be cases when an employee cannot reasonably bring a wrongdoing to attention through the regular route. In such cases, the employee may make use of a.s.r.'s Whistleblower Scheme, which also extends to third parties. Employees who make a report in good faith of what they believe to be a violation of this policy will be protected from retaliation in accordance with the Whistleblower Scheme.
Every report, whether anonymous or not, is investigated. a.s.r. will not take or allow any action against anyone who reports suspicions of abuse or irregularities. a.s.r's Whistleblower Scheme is publicly available on the a.s.r. website.
Reports under this scheme are seen as a contribution to improving the functioning of a.s.r. and the company therefore encourages employees to make reports, so that possible abuse or irregularities can be resolved. a.s.r. will not disadvantage a person reporting who has reasonable grounds to believe that the reported information is correct at the time of reporting a suspicion of an abuse (internal or external) or irregularity during and after the handling of the report. If the person reporting nevertheless has the impression that adverse effects are involved, they can always discuss this with the Compliance Officer. The person reporting a suspected abuse is protected from legal proceedings under the Dutch Whistleblower Protection Act.
Zero tolerance
a.s.r. has a zero-tolerance policy with regard to unethical behaviour. Should integrity be compromised, for example through corruption and/or fraud, a.s.r. will take appropriate measures, with due regard for the applicable legislation and regulations, and sector-based protocols. a.s.r. has a policy on controlling unethical behaviour at Group and business levels. a.s.r. investigates signs of unethical behaviour, including corruption and fraud, among employees, intermediaries, mandated brokers and suppliers.
Incidents
The Investigations Department (Veiligheidszaken) is responsible for investigating reports of unethical behaviour by employees, intermediaries and contract parties. Incidents may involve fraud, theft, corruption and bribery, conflicts of interest, discrimination and inappropriate behaviour. Where necessary, a.s.r. will take appropriate measures, as described in the Code of Conduct. The Investigations Department operates independently of the management chain. Each quarter, it reports on the investigations conducted regarding unethical behaviour by employees, intermediaries and contract parties. This report is discussed with the MB. The MB, relevant risk committees, the A&RC and regulators are informed of any serious violation and the measures taken.
In 2025:
139 cases of alleged lack of integrity, including violation of the privacy policy, were investigated by the investigations department (2024: 65).
33 disciplinary measures (2024: 27) were taken in cases of proven unethical behaviour in the conduct of an employee, intermediary or supplier.
With regard to employee conduct, 27 employees were found to have violated the a.s.r. Code of Conduct (2024: 16).
The increase in the number of reports is partly explained by a higher inflow of notifications relating to theft, loss or the unattended leaving of company property compared with 2024.
If, following investigation of the cases a lack of integrity was proven, these employees or intermediaries were disciplined for the infringement of the company's principles resulting in addressing the undesirable behaviour, a written warning or dismissal.
5.5.3 Awareness, training and dialogue
Integrity and ethical conduct are prerequisites to being a trustworthy company. Ethical awareness is strengthened within a.s.r. by the promotion of core values and ethical leadership, providing ethical training and promoting awareness, embedding sound integrity policies, implementing ethical frameworks for specific business processes and advising on ethical sustainability issues submitted to the Sustainability Committee.
Awareness and training
To ensure that the Code of Conduct and related behavioural rules are well-known and understood, a.s.r. conducts various awareness initiatives annually. These include training sessions, presentations and the voluntary use of the Gamification training tool to enhance knowledge on topics such as the Code of Conduct, Customer Due Diligence (CDD) and information security. The effectiveness of these programmes is evaluated annually within a.s.r.'s central awareness programme.
The central awareness initiatives are intended for all employees, without specifically defining high-risk functions. All employees, including the MB, may encounter risks surrounding corruption and bribery and other risks regarding conflicts of interest in the broad sense (including outside business activities and incentives). Therefore, all staff of a.s.r. receive a training on this topic. For some functions or groups of employees, mandatory training programmes are instantiated. For example, a select group of employees that perform CDD-related activities follow a mandatory training programme and education programme concerning CDD-related legislation and regulations (including the Anti-Money Laundering and Anti-Terrorist Financing Act).
Dialogue
Employees are encouraged to engage in dialogue about integrity issues to collectively find good solutions. Additionally, training and presentations are conducted within the various product lines and staff functions.
Employees are encouraged to speak up regarding integrity issues and engage in dialogue with each other about ethical dilemmas within the company. a.s.r. facilitates open dialogue on ethical dilemmas and challenges by organising ethics workshops and dilemma sessions, as well as by providing ethical guidance on relevant topics. This encourages and strengthens ethical awareness among employees.
Complex daily dilemmas are a natural part of operations for a large insurance company. Several risk committees within a.s.r. discuss critical issues through critical dialogue regarding non-financial risks and possible instances of immoral behaviour. This dialogue aims to balance stakeholder interests and make well-informed business decisions.
a.s.r.’s Sustainability Committee advises the MB on complex dilemmas by discussing issues regarding the transition to more sustainable business practices and by providing tools and support for business units to make ethically self-aware choices that are in line with a.s.r.’s vision and strategy. The Sustainability Committee advised on several sustainability-related matters in 2025, including:
A number of cases on the ESG risk assessment for new insurance clients;
Exemption Policy on Responsible Investing for investing in defence industry under strict conditions;
Advice to the MB on sustainability related policies such as Policy on Responsible Investing, Sustainable Insurance Policy, Stakeholder Policy and the new Policy on Socially Responsible Debt Collection;
Submission of SBTi.
- Section 5.5.3 is in scope of CSRD and limited assurance (ESRS G1-1 & G1-3).
2025 themes
Topics that were highlighted in 2025 include anti-corruption and bribery, ancillary business activities, incentives, privacy, CDD, information security, sustainability, inclusivity and diversity, and insider trading. In addition, all a.s.r. employees are periodically presented with three mandatory questions regarding a.s.r.’s Code of Conduct, information security and cybercrime. New awareness tools were developed and implemented in 2025, including e-learnings and micro-learnings. More tailored awareness will be developed in the upcoming years to address function-specific needs for awareness when deemed necessary.
In 2025, the multidisciplinary central awareness programme was further developed to structurally promote awareness in areas such as the Code of Conduct, privacy, IT security and CDD.
In 2025, twelve ethics trainings and dilemma sessions were organised focusing on topics such as corporate culture and the story of a.s.r., philosophical skills for critical decision-making, data ethics and insurance dilemmas in healthcare.
Furthermore, several sessions were organised during the Week of Integrity, an internationally renowned week for promoting awareness on integrity topics within business.
5.6 Employee participation
5.6.1 Composition of the Work Councils
At the beginning of 2025, the new structure for the a.s.r. employee participation started with elections. The new structure, that will remain in place till the end of 2027, is as follows:
The a.s.r. Works Council (Ondernemingsraad a.s.r. - OR a.s.r.), consisting of thirteen members, with one member specifically representing TKP;
Ten subcommittees (Onderdeelcommissies - OCs) of the OR a.s.r., related to the following business units: Mortgages, Disability, Individual life & Funeral, Pensions, Non-life, Health, TKP, Digital & IT (D&IT ), Finance and Other Business Units. The OCs dealt with issues relating to their specific business units. Each OC consists of five members;
The Employee Council, comprising three members of the OR a.s.r. and representatives of each of the OCs.
5.6.2 Main themes during 2025
Integration of Aegon NL
Throughout the year, the integration of Aegon NL received considerable attention, both within the OR and in the relevant OCs. The progress of the integration was regularly discussed with management at various organisational levels, including discussions with members of the Management Board (MB), the Executive Board (EB), and the Supervisory Board (SB). Of particular importance for employee participation was the proposed new division of activities between Pensions and TKP, which was addressed by a working group consisting of representatives of the OR, the OC Pensions and the OC TKP. At OC level, the impact of the foreseen closure of the office in Leeuwarden and the integration of Mortgages were receiving considerable attention. In addition, topics such as the development of sick leave, employee turnover and the development of the organisational culture were regularly discussed.
Throughout the year, eight requests for advice and four information memorandums relating to the integration of Aegon NL were submitted to the employee participation bodies.
Other topics
The Works Council OR was involved in several other topics during 2025. The Works Council: it advised on the proposed appointment of Ingrid de Swart as the new CEO of a.s.r. , the acquisition of HumanTotalCare, the repositioning of real estate activities through Amvest, and the proposed merger between ASR Levensverzekering N.V. and Aegon Levensverzekering N.V. Advice was also given regarding the renewal of a credit facility.
Furthermore, the compulsory risk inventory and evaluation (Risico Inventarisatie en Evaluatie ) was performed in 2025, and results and corresponding actions were discussed with the OR. Lastly, the personnel regulations and lease policy were reviewed in 2025.
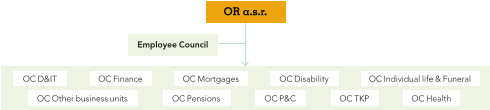
Meetings of the Central Works Council
| Meeting | Participants | Number of meetings |
|---|---|---|
| Regular Central Works Council meetings with a Member of the EB | Chair of EB, secretary of EB, HR Director and Works Council | 4 |
| Ad hoc meetings Works Council with a Member of the EB | Chair of EB, secretary of EB, HR Director and two Members of the Works Council | 20 |
| Regular Works Council meetings with a Member of the EB and Members of the SB | Chair of the EB, Member(s) of the SB, secretary of EB, HR Director, and Works Council | 3 |
| Works Council meetings without a Member of the EB | Works Council | 70 |
5.7 Statement of the Executive Board
ASR Nederland N.V.'s (a.s.r.) consolidated and company financial and sustainability statements for 2025, as well as chapters 1-5 and 8 of the Annual Report, have been prepared in accordance with the financial and sustainability reporting standards (IFRS and ESRS) pursuant to Directive 2013/34/EU, the latter as implemented in Dutch law, as well as the provisions of article 8 of the Taxonomy Regulation (2020/852/EU), including the relevant delegated acts based on this provision.
As required by Section 5:25c paragraph 2(c) of the Dutch Financial Supervision Act, the Executive Board (EB) declares that, to the best of its knowledge:
The financial statements provide a true and fair view of the assets, liabilities, financial positions and earnings of a.s.r. and the enterprises included in the consolidation taken as a whole;
The management report provides a fair view of the position at the balance sheet date and developments during the year under review and the enterprises included in the consolidation taken as a whole, together with a description of the principal risks confronting a.s.r.
The EB is responsible for establishing and maintaining adequate internal risk management and control systems. During the financial year, the EB has assessed the design and effectiveness of these systems. The results have been discussed with the Audit & Risk Committee, the Supervisory Board and the external auditor.
The principal risks the company faces, the company's risk management framework and the company's risk appetite are described in section 5.4 of this management report.
Based on its assessment and with reference to best practice 1.4.3 of the Dutch Corporate Governance Code of March 2025, the EB declares, to the best of its knowledge, that at balance sheet date:
The management report provides sufficient insights into deficiencies in the effectiveness of the internal risk management and control systems with regard to the risks (see section 5.4);
The aforementioned systems provide reasonable assurance that the financial reporting does not contain any material inaccuracies (see sections 5.4, 5.5 and 7.8);
The aforementioned systems provide limited assurance that the sustainability reporting does not contain any material inaccuracies (see section 6);
The aforementioned systems provide sufficient comfort1 that the by the company identified operational and compliance risks are effectively managed considering the set risk appetite.
Based on the current state of affairs, it is justified that the financial reporting is prepared on a going concern basis (see sections 2, 3 and 7); and
The management report includes material risks, as referred to in best practice provision 1.2.1, as well as uncertainties, to the extent that they are relevant for the company's continuity for a period of twelve months after the preparation of the report (see sections 2.1, 2.5 and 7).
Given the inherent limitations of internal risk management and control systems, the assessment of the effectiveness of the design and operation of these systems cannot provide absolute comfort against misstatements, inaccuracies, fraud, operational issues and non-compliance with laws and regulations and any other loss (see sections 5.4 and 5.5).
Utrecht, The Netherlands, 24 March 2026
Jos Baeten, CEO
Ewout Hollegien, CFO
Ingrid de Swart, COO/CTO
- 'Sufficient comfort' is to be read as comfort considering a.s.r.'s risk appetite, inherent limitations to the internal risk management and control systems and other disclosures on these systems in this management report.

6 Sustainability statements
6.1 General
6.1.1 Introduction
The Corporate Sustainability Reporting Directive (CSRD) came into effect on 1 January 2024, including the reporting requirements of the European Sustainability Reporting Standards (ESRS) on all material sustainability matters regarding impacts, risks and opportunities related to Environmental, Social and Governance (ESG) matters.
The ESRS, as set out in Commission Delegated Regulation 2023/2772/EU, is the first set of ESRS. They are sector-agnostic and contain twelve distinct standards. The standards are divided into two cross-cutting standards and ten topical standards. The cross-cutting standards define the general disclosures and requirements that apply to all the topics subject to the CSRD. The topical standards provide the disclosure requirements for specifically ESG sustainability matters.
a.s.r.’s sustainability statements apply the disclosure requirements under Article 8 of Regulation (EU) 2020/852 (the Taxonomy Regulation), as amended by and in accordance with Commission Delegated Regulation (EU) 2026/73, which is effective for financial years beginning on or after 1 January 2025, see section 6.2.4.
6.1.2 General basis for preparation
General basis for preparation of the sustainability statements
Under the CSRD, a.s.r. is required to report on the impact of its activities on the environment and society, as well as the risks and opportunities that arise from sustainability-related developments and events. The reporting requirements under the CSRD are also applicable to a.s.r.'s subsidiaries listed below. These subsidiaries are exempted from individual sustainability reporting, provided they are included in a.s.r.'s consolidated sustainability statements:
ASR Levensverzekering N.V.;
ASR Schadeverzekering N.V.;
ASR Basis Ziektekostenverzekeringen N.V.;
ASR Aanvullende Ziektekostenverzekeringen N.V.;
AEGON Levensverzekering N.V.;
AEGON Spaarkas N.V.
The sustainability statements have been prepared on a consolidated basis. The scope of consolidation is the same as for the financial statements. For details, see sections 7.3.5 and 7.4.
a.s.r.’s group value chain is based on the following three underlying value chains: Insurance and Intermediary, Asset Management and Business Support. For the consolidated value chain, see section 2.2.2. Material impacts, risks and opportunities have been mapped in both the upstream and downstream value chains, as well as for a.s.r.’s own operations. For the inclusion of material upstream and downstream value chain information, see sections 2.2 and 6.1.4.1.
a.s.r. has not used the option to omit a specific piece of information corresponding to intellectual property, know-how or the results of innovation, nor has a.s.r. used the exemption from disclosure of impending developments or matters in the course of negotiation.
Acquisition HumanTouch Holding
On 3 July 2025, a.s.r. reached an agreement to acquire the remaining 55% interest in HumanTouch Holding B.V., the parent company of HumanTotalCare B.V. (HumanTotalCare), finalising the transaction on 1 October 2025. For more information see section 7.4.5 of the financial statements. The Double Materiality Assessment (DMA) update for a.s.r. was revised to reflect this event; no additional material impacts, risks or opportunities were identified as a result of the acquisition.
HumanTotalCare provides occupational health and reintegration services and employs approximately 2,000 individuals. HumanTotalCare is, where relevant, included in the metrics reported by a.s.r. from 1 October 2025 onwards. No policies, actions or targets relating to HumanTotalCare are disclosed in the Annual Report for 2025. Existing targets and baseline values remain unchanged following the acquisition.
Given the timing of the acquisition late in the reporting period, comprehensive data for all metrics was not available at year-end. Accordingly, the focus was on the relevant metrics relating to the own workforce which have primarily been based on data provided by HumanTotalCare, while metrics for other standards have been estimated using extrapolations derived from a.s.r. data. These estimates are considered reasonable and appropriate in the context of the information available as of 31 December 2025.
Time horizons
a.s.r. has adopted the same time horizons as those outlined in ESRS, which are:
Short term: one year or less;
Medium term: from one year up to five years;
Long term: more than five years.
Estimates and uncertainties
Certain monetary amounts and other quantitative metrics are subject to a high level of measurement uncertainty, especially for some of a.s.r.'s upstream and downstream value chain quantitative metrics (e.g. emissions related to purchased goods and services). In such instances, a.s.r. discloses information about the sources of measurement uncertainty and provides details on the assumptions, approximations and judgements made. For more details, see section 6.6.
Changes in preparation or presentation of sustainability information
Materiality thresholds have been set for restating quantitative information when reporting methods change or deviations occur. Procedures are also in place describing how such restatements should be performed, including those related to adjustments in previous reporting periods. Any restated data will be clearly disclosed under the specific disclosure point.
Disclosures stemming from other legislations or generally accepted sustainability reporting pronouncements
Disclosure requirements arising from other legislations or other sustainability reporting standards, as adhered to by a.s.r., are addressed in section 9.1.1.
6.1.3 Governance
6.1.3.1 Corporate governance
The governance structure of a.s.r. consists of the Supervisory Board (SB), Executive Board (EB) and the Management Board (MB).
The SB has three roles: the supervisory role, the advisory role and the employer's role for the EB.
The EB is collectively responsible for the day-to-day conduct of business at a.s.r. and for its strategy, structure and performance. The EB is accountable to the SB and the Annual General Meeting (AGM) regarding the performance of its duties.
The MB conducts a.s.r.'s day-to-day business with the EB and implements and realises the business strategy, strengthens a.s.r.’s innovation power and improves customer focus.
For further details on the roles and responsibilities of the administrative, management and supervisory bodies (AMSB) and how they are informed about sustainability matters and how these were addressed, see sections 5.1.3, 5.1.4, 5.1.5 and 5.1.6.
6.1.3.2 Integration of sustainability-related performance in incentive schemes
For disclosure requirements related to the integration of sustainability-related performance in incentive schemes, see section 5.3.
6.1.3.3 Statements on due diligence
The core elements of due diligence are embedded in various disclosure requirements outlined in the ESRS. The table below contains an overview of these disclosure requirements with references to the relevant sections.
Statements on due diligence
| Embedding due diligence in governance, strategy and business model | Sections |
|---|---|
| Information provided to and sustainability matters addressed by the AMSB (GOV-2) | 5.1.3, 5.1.4 and 5.1.6 |
| Integration of sustainability-related performance in incentive schemes (GOV-3) | 5.3 |
| Material impacts, risks and opportunities (SBM-3) | 6.1.4.3 |
| Engaging with affected stakeholders | |
| Information provided to and sustainability matters addressed by the AMSB (GOV-2) | 5.1.3, 5.1.4 and 5.1.6 |
| Interests and views of stakeholders (SBM-2) | 6.1.4.1 |
| Double Materiality Assessment (IRO-1) | 6.1.4.2 |
| Policies regarding material sustainability matters (Topical ESRS) | 6.2.1.4, 6.2.2.4, 6.2.3.2, 6.3.1.2, 6.3.2.2, 6.3.3.2, 6.3.4.2 and 6.4.1.3 |
| Environmental, Social and Governance (Topical ESRS) | 6.2, 6.3 and 6.4 |
| Identifying and assessing negative impacts on people and the environment | |
| Double Materiality Assessment (IRO-1) | 6.1.4.2 |
| Material impacts, risks and opportunities (SBM-3) | 6.1.4.3 |
| Taking action to address negative impacts on people and the environment | |
| Actions and resources regarding material sustainability matters | 6.2.1.5, 6.2.2.5, 6.2.3.3, 6.3.1.3, 6.3.2.3, 6.3.3.3, 6.3.4.3 and 6.4.1.3 |
| Environmental, Social and Governance (Topical ESRS) | 6.2, 6.3 and 6.4 |
| Tracking the effectiveness of these efforts | |
| Metrics regarding material sustainability matters (Topical ESRS) | 6.2.1.7, 6.2.2.7, 6.2.3.5, 6.3.1.4, 6.3.3.5 and 6.4.1.4 |
| Targets regarding material sustainability matters (Topical ESRS) | 6.2.1.6, 6.2.3.6, 6.2.3.4, 6.3.1.4, 6.3.2.4, 6.3.3.4 and 6.3.4.4 |
| Environmental, Social and Governance (Topical ESRS) | 6.2, 6.3 and 6.4 |
6.1.3.4 Risk management and internal controls related to sustainability reporting
a.s.r.'s integrated risk management framework and governance include risk management activities related to sustainability reporting. For more information on this framework and governance, see sections 5.1 and 7.8.1.
The nature of sustainability reporting risks differs across business lines. At the individual business line level, a.s.r. has identified the reporting risks and implemented controls to ensure accurate, complete and timely reporting. Overall key risks include data availability and reliability, regulatory uncertainty and resource capacity.
6.1.4 Strategy and impacts, risks and opportunities
This section provides a description of the process and outcomes of the DMA to identify significant impacts, risks and opportunities (IROs). Additionally, it provides insight into how stakeholder interests and perspectives are considered in shaping strategic decisions and how the company value chain relates to material sustainability matters. The relation between sustainability disclosure requirements and a.s.r.'s strategy, business model and group value chain is disclosed in sections 2.2.2 and 2.4.2. An illustration of the underlying value chain can be found in sections 2.2.2 and 6.1.4.4.
6.1.4.1 Stakeholder engagement
Strategic, constructive and proactive consultations with all key stakeholders are of great importance to a.s.r. and stakeholder input is leveraged to shape a.s.r.’s strategy and business decisions.
Stakeholder Policy
a.s.r. has formalised its engagement practices in its Stakeholder Policy, with the purpose of including the interests of relevant stakeholders when defining and further developing the sustainability strategy. The Stakeholder Policy provides guidelines and principles to maintain and strengthen relationships, including an overview of the frequency and method of engagement for different stakeholder groups. The way a.s.r. communicates with stakeholders depends on the type of stakeholder, the topic and the purpose of the communication. a.s.r.'s means of communication range from personal contact to organising roadshows, customer and employee surveys, round-tables and dialogue sessions. A detailed overview of what a.s.r. considers to be its most important stakeholders and interactions can be found in the Stakeholder Policy.
Engagement with key stakeholders
a.s.r. maintains frequent dialogue with stakeholders who influence its organisation directly and indirectly and who are most likely to be affected by its activities. The main stakeholders for whom a.s.r. aims to realise long-term value creation are: customers, employees, shareholders and society. Their interests and stakeholder engagement activities are outlined here.
Customers
a.s.r. aims to be an insurer that customers and intermediaries can rely on. For this purpose, a.s.r. has established the Raad van Doen, which is an online customer and advisor panel for all a.s.r. brands. Through this panel, customers and intermediaries are involved in improving a.s.r.'s services. Furthermore, as part of the Product Approval & Review Process (PARP), a newly developed product or product revision is tested before it is introduced to the market. Existing products must also go through the PARP periodically to review customer and social interest. For more information on the PARP, see section 3.1.2.1.
Employees
a.s.r. aims to be a people-oriented employer. As such, it values the opinion of its employees and engages with them regularly through various interactions such as performance appraisals, staff meetings, employee panels and stakeholder dialogue. An important form of employee engagement is organised via the Works Councils (Ondernemingsraad – OR). These democratically chosen employee participation bodies regularly discuss employee concerns with management at various organisational levels. For more details on employee participation, see section 5.6.
Shareholders
For shareholders, a.s.r. aims to be an attractive company by creating value in both the short and long term. a.s.r. attaches great importance to maintaining a strong relationship with the investor community and to providing transparent communication and fair disclosure. The aim is to provide high-quality information to help shareholders make well-informed investment decisions. Significant efforts are made to ensure the information provided is accurate, complete and timely. a.s.r.'s investor relations team of a.s.r. communicates on financial and non-financial matters through various channels, such as press releases, webcasts, conference calls. For more information, see section 3.3.
Society
a.s.r. also considers the interests of wider society, which includes civil society organisations, the Dutch government, tax and regulatory authorities, trade unions, the media, suppliers, academics, peers and business partners, among others. Overall, these stakeholders expect a.s.r. to create sustainable and responsible societal value for current and future generations. To engage with societal organisations, a.s.r. organised with the Dutch Association of Insurers and three other insurance companies a stakeholder dialogue in April 2025. The purpose of this event was to discuss environmental and social impact caused by business activities. The outcomes of the dialogue were shared with participants and used to inform a.s.r.'s DMA.
An extensive stakeholder dialogue is conducted at least once every three years, with representatives from internal and external parties that have an interest in a.s.r. The outcomes of this stakeholder engagement are shared with the MB and senior management. The most recent stakeholder dialogue was held in 2023.
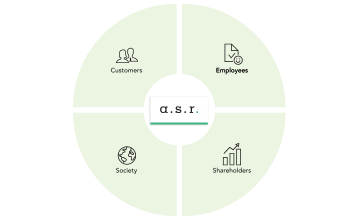
6.1.4.2 Double Materiality Assessment
a.s.r. conducts a full DMA every three years, only updating it in the intervening years, unless significant changes necessitate a DMA to be conducted in the years in between. As such, a comprehensive DMA was completed in 2024, following from the acquisition of Aegon and based on a.s.r.’s first full DMA conducted in 2023. For details on this DMA, see section 6.7.2.
In 2025, an update of the DMA of 2024 took place. As no significant organisational changes had taken place, a.s.r. assumed that the material impacts, risks and opportunities identified in 2024 would only need an update in 2025 on the basis of changed circumstances, updates and advancing insights. Methodologies used are described below.
Impacts
The 2025 update of impacts had the same focus as the 2024 DMA on risk of heightened adverse impacts activities, both in a.s.r.’s own operations and value chain. Input was collected from external stakeholders through peer analysis, trend reports analysis, a review of the Draft GRI Insurance Sector Standard, examination of the results of the external stakeholder dialogue of the Dutch Association of Insurers as well as of the results of the external DMA analysis of the Dutch Health Insurers association (ZN). Additionally, input was collected from internal stakeholders through an internal stakeholder survey.
Based on these inputs, several positive and negative impacts were updated. Occasionally, impacts were added or removed. In such cases a.o. severity (scale) and likelihood of the negative impact and scale, scope and likelihood of the positive impact were scored (again). Also, business lines have been added to or removed from positive and negative impacts.
Risks and opportunities
Equal to the DMA 2024, the 2025 update considered a.s.r.’s connections of impacts and dependencies with its risks and opportunities. Input was collected from external stakeholders and internal stakeholders in the same way as for the impacts.
Several risks and opportunities were updated based on these inputs. Occasionally, a risk or opportunity was added or removed. In such cases, likelihood, magnitude and nature of effects were scored (again). Also, product lines have been added to or removed from a risk or opportunity. Information on the prioritisation of sustainability risks relative to other types of risks including the use of risk assessment tools can be found in section 7.8.1.3.
In accordance with the DMA requirements, a.s.r. has identified four sustainability‑related financial risks and three sustainability‑related opportunities. None of the material risks or opportunities have resulted in financial effects during 2025 or in the early months of 2026, nor are any financial effects expected to materialise over the remainder of 2026.
Other information
As part of the DMA update, the value chain was updated to reflect changes in business activities, relationships and legal structures, and the updated impacts, risks and opportunities were plotted on the updated value chain.
The whole update process was carried out in coordination with the relevant business lines. The results of the DMA update 2025 were then explained in and submitted for approval to the SFR steering group (preceded by a review by the Quality Board) and to the MB. Potential risks in the results of the DMA update process have been identified and several controls have been set up to manage these risks.
A complete overview of all the changes in the DMA update 2025 compared to the DMA 2024 can be found in the table ‘Changes in material topics compared to previous reporting period’ of section 6.1.4.3.
The process to identify, measure, manage and monitor material risks is integrated in the overall risk management process, see section 7.8.1. a.s.r.'s risk appetite statement contains a separate risk appetite for sustainability risks. Risk appetite statements are monitored and managed in the Non-Financial Risk Committee (NFRC). Identification and assessment of material sustainability impacts and risks takes place through the DMA and the Strategic Risk Analysis (SRA). The Strategic Asset Allocation (SAA) and the Own Risk and Solvency Assessment (ORSA) are used to manage (assess and monitor) identified impacts and risks. More information on the evaluation of a.s.r.’s overall risk profile and risk management processes can be found in the risk chapter of the Annual Report. How the process to identify opportunities is integrated in the overall management process differs per business line.
A new DMA will be carried out in 2026, rather than a revision of the current DMA.
Events after DMA process was finalised, but before year-end
In line with the ESRS, a.s.r. considered potential triggers to revise the update of the DMA. As such, a revision of the DMA update has occurred following the acquisition of HumanTotalCare. See section 6.1.2 for more information on this acquisition.
6.1.4.3 Impacts, risks and opportunities
The following table provides an overview of the material impacts, risks and opportunities a.s.r. has identified, including the areas within a.s.r.'s business model where they are concentrated. A differentiation is made between own operations and value chain. The description of the impact materiality illustrates how a.s.r.’s material positive and negative impacts affect people or the environment. The financial materiality column indicates whether a material sustainability topic represents a (potential) risk or an opportunity that could financially impact a.s.r.’s business. The time horizons are also included, with a distinction made between short term, medium term and long term.
Each impact, risk and opportunity has been labelled with a number in the table below. This number is used throughout the sustainability statement to link a.s.r.’s policies, actions and targets with the identified material impacts, risks and opportunities. The colours used for the impacts, risks and opportunities reflect the corresponding ESG theme: environmental is shown in green, social in orange, and governance in grey.
SBM-3 table
| Material topic | (Sub-) sub-topic | IRO | Type of impact | Impact materiality | Financial materiality | Value chain | Time horizon | Scope | |||||||
|---|---|---|---|---|---|---|---|---|---|---|---|---|---|---|---|
| Climate change | Adaptation | 1.1 |  |  |  |  |  |  |  | Asset Management, Real Estate, Mortgages and P&C activities | |||||
| 1.2 | | |  | | | | Asset Management, Real Estate, Mortgages, P&C and Health activities | ||||||||
| Mitigation | 2.1 | | | | | | | Asset Management, Real Estate, Mortgages and P&C activities | |||||||
| 2.2 | |  |  |  | | | | | Facilities, Asset Management, Real Estate, Mortgages, P&C, Health activities | ||||||
| 2.3 | | | | | | | | | Asset Management, Real Estate, Mortgages and P&C activities | ||||||
| 2.4 | | |  | | | | | Asset Management, Real Estate, Mortgages and P&C activities | |||||||
| Biodiversity | Direct impact drivers of biodiversity loss | 3.1 | | | | | | | | Asset Management and Real Estate activities | |||||
| 3.2 | | | | | | | | | Asset Management, Real Estate, Mortgages, P&C and Health activities | ||||||
| 3.3 | | | | | Real Estate activities | ||||||||||
| Ecosystem services | 4.1 | | | | | | | Asset Management, Real Estate and P&C activities | |||||||
| 4.2 | | | | | | | Asset Management, Real Estate, P&C and Health activities | ||||||||
| Circularity | Resource inflows | 5.1 | | | | | | | | P&C activities | |||||
| 5.2 | | | | | | | Real Estate, P&C and Health activities | ||||||||
| Circularity | Resource outflows/products and materials | 6.1 | | | | | | | P&C activities | ||||||
| Resource outflows/waste | 6.2 | | | | | | | | | Facilities, P&C and Health activities | |||||
| Material topic | (Sub-) sub-topic | IRO | Type of impact | Impact materiality | Financial materiality | Value chain | Time horizon | Scope | |||||||
|---|---|---|---|---|---|---|---|---|---|---|---|---|---|---|---|
| Own workforce working conditions | Working conditions | 7.1 | | | | | | | a.s.r. own workforce | ||||||
| Own workforce privacy | Other work-related rights | 8.1 | | | | | | | a.s.r. own workforce | ||||||
| Own workforcediversity, equality and inclusion | Equal treatment own workforce | 9.1 | | | | | | | | a.s.r. own workforce | |||||
| 9.2 | | | | | | | | a.s.r. own workforce | |||||||
| 9.3 | | | | | | | a.s.r. own workforce | ||||||||
| Workers in the value chain | Other work related rights and working conditions | 10.1 | | | | | | | | | Asset Management, Real Estate and Health activities | ||||
| Affected communities | Affected communities | 11.1 | | | | | | | Community | ||||||
| Consumers/end-users | Information related impacts | 12.1 | | | | | | | | Consumers and end-users | |||||
| 12.2 | | | | | | | | | Consumers and end-users | ||||||
| 12.3 | | | | | | | | Consumers and end-users | |||||||
| Information related impacts and social inclusion | 12.4 | | | | | | | | Consumers and end-users | ||||||
| Social inclusion and personal safety | 13.1 | | | | | | | | | Consumers and end-users | |||||
| Social inclusion | 13.2 | | | | | | | | Consumers and end-users | ||||||
| Business conduct | Corporate culture | 14.1 | | | | | | | | a.s.r. | |||||
| Management relationship with suppliers | 15.1 | | | | | | | | a.s.r. | ||||||
| Corruption and bribery | 16.1 | | | | | | | a.s.r. | |||||||
In 2025, a.s.r. updated the 2024 DMA. The main changes include the removal of impacts, risk and opportunities, the addition of one new positive impact on affected communities, and the introduction of one new financial risk related to consumers and end users—both assessed as material in 2025. The material changes are presented in the table below. The nature of each change compared to 2024 is described in the column ‘Type of change’. If the column ‘Material (Sub-)topic 2025’ is left blank, this indicates that the topic was not assessed as material in the 2025 DMA update. For the remaining non-material changes, see section 6.7.3.
Changes in material topics compared to previous reporting period
| Material (Sub-)topic 2024 | Material (Sub-)topic 2025 | Material impact | Type of change |
|---|---|---|---|
| Climate change - Climate change adaptation | - | | Opportunity removed as there currently is no prospect of material additional returns at group level in relation to climate adaptation. |
| Resource use and circular economy - Resource inflows | - | | Opportunity removed as there currently is no prospect of material additional returns at group level in relation to resource inflows, including resource use. |
| Resource use and circular economy - Resource outflows | - | | Impact removed as this is currently more a remediation of a predominantly negative impact on resource use. |
| Resource use and circular economy - Waste | - | | Opportunity removed as there currently is no prospect of material additional returns at group level in relation to resource outflows, including waste. |
| Own workforce | - | | Impact removed as Aegon merger has been finalised, no new job insecurities have arisen in 2025. |
| - | Affected communities: economic, social and cultural rights of communities | | Topic was introduced to reflect material positive impact of Doenkracht programme. |
| - | Information-related impacts for consumers and/or end-users | | Risk was introduced to reflect the risks a.s.r. may run following data breaches, extortion and misuse of consumer data. Newly acquired HumanTotalCare added to scope. |
| Consumers and end-users | - | | Opportunity removed as there currently is no prospect of material additional returns at group level in relation to personal safety of consumers and/or end-users. |
| Consumers and end-users | - | | This risk was changed to a negative impact and moved to the previous impact, as irresponsible marketing practices are predominantly a negative impact rather than a risk in relation to social inclusion of consumers and/or end-users. |
| Business conduct | - | | No longer material for Asset Management, in line with outcomes of own re-assessment and peer benchmark. |
| Business conduct | - | | No longer material for Asset Management, in line with outcomes of own re-assessment and peer benchmark. |
6.1.4.4 Underlying value chains
a.s.r. is an organisation that has multiple product lines, each with different internal and external stakeholders. The DMA-update began with the review of the mapped relationships in the value chains of all product lines, followed by identifying material impact, risks and opportunities. After the review of the mapped relationships in the value chain of each product line, the value chains were in turn consolidated into three overarching value chain segments based on the nature of their activities:
Insurance & Intermediary: covering Non-life, Life and Distribution & Services;
Asset Management: including all asset management activities across Mortgages, Real Estate and Asset Management product lines;
Business Support: encompassing staff and support functions across a.s.r.’s operations.
For more information on a.s.r.'s product lines and the five segments in line with the consolidated group value chain, see sections 2.2.1 and 2.2.2.
The arrows shown in the value chains indicate the applicability and linkage with the five segments and the underlying product lines (green squares) and the actors (white squares). Certain actors have both direct and indirect relationships with a.s.r.’s operations, highlighted with an extended white frame, such as Commercial and Private Customers. For instance, P&C has a direct relationship with private customers through insurance policies, as well as an indirect relationship via intermediaries.
Material impact, risks and opportunities were mapped on the actors in the value chains where they occur. For example, the Health product line has a negative environmental impact due to its business relationship with pharmaceutical companies, which emit CO₂e emissions (see impact 2.2). For more details on direct plotting of impact, risks and opportunities at product line level, see section 6.1.4.3. Impact, risks and opportunities can also be mapped at segment level, as seen with Life, meaning the impact, risks and opportunities apply to all product lines within that segment. Furthermore, impact, risks and opportunities plotted under own operations apply to the entire a.s.r. organisation.
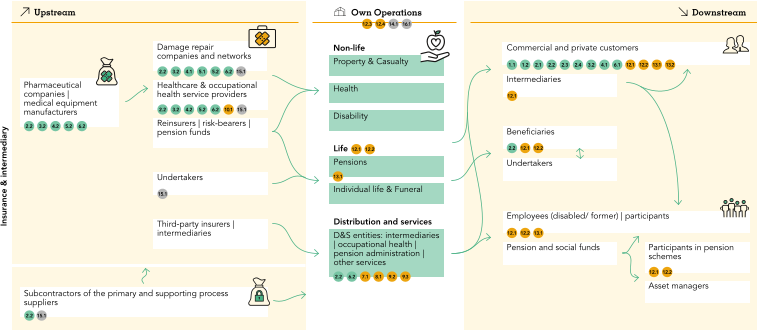
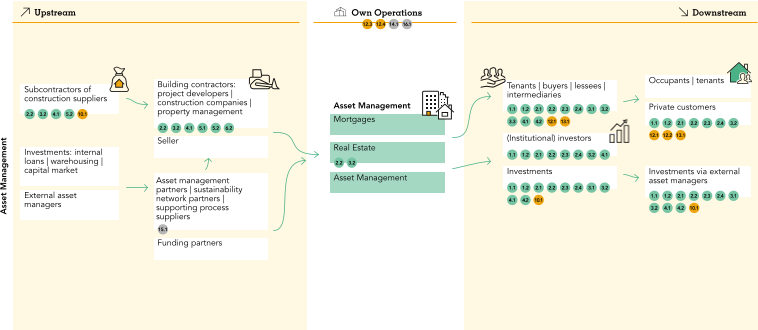
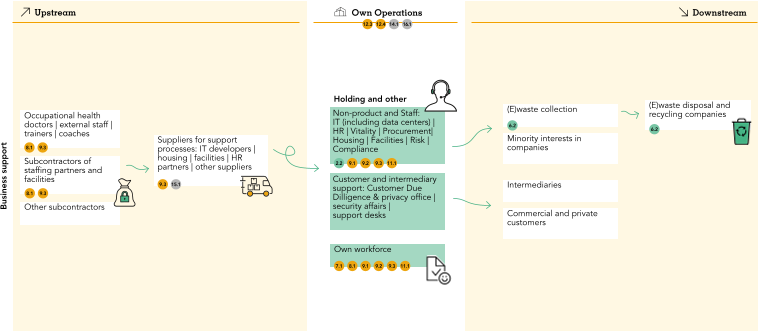
6.1.4.5 Disclosure requirements in ESRS covered by a.s.r.’s sustainability statements
The CSRD reference table is included in section 6.7.1.
This page is intentionally left blank.
6.2 Environmental
6.2.1 Climate change
Climate change is one of today's greatest challenges. The transition to a net-zero economy and a society that is resilient to the effects of climate change is crucial for the liveability of the planet. a.s.r. acknowledges the importance of this transition and, as an insurer and investor, wants to contribute to it.
The following two tables present an overview of the material climate-related impacts, risks and opportunities identified for climate change, along with the corresponding policies, actions and targets. The purpose of this table is to highlight the linkages and dependencies among these elements. See the SBM-3 table in section 6.1.4.3 for additional information on the impact, risks and opportunities identified.
1 - Climate change adaptation
| Materiality | IRO description | Scope | Policies | Actions | Targets |
|---|---|---|---|---|---|
| 1.1 a.s.r. has a positive impact on climate change adaptation as it offers products and services including impact investing, aimed at supporting and incentivising investees and customers to become more resilient to climate-related physical risks. | Activities related to:
|
|
| Impact investment target |
| 1.2 a.s.r. may run financial risks of value degradation and of a rise in claims burden in the insurance portfolio due to climate-related physical risks affecting the parties in its value chain. | Activities related to:
|
|
| None |
2 - Climate change mitigation
| Materiality | IRO description | Scope | Policies | Actions | Targets |
|---|---|---|---|---|---|
| 2.1 a.s.r. has a positive impact on climate change mitigation by (impact) investing, financing and insuring the energy transition. | Activities related to:
|
|
| Impact investment target |
| 2.2 a.s.r. has a negative impact on climate change mitigation through its own facilities as well as by financing, investing and insuring parties and assets, working with repair agencies, medical care providers and contracting suppliers, which have GHG emissions. | Activities related to:
|
|
| Carbon footprint reduction targets |
| 2.3 a.s.r. runs financial risks such as value depreciation, loss of premium and a rise in claims burden due to climate-related transition risks in connection to climate change mitigation. | Activities related to:
|
|
| None |
| 2.4 a.s.r. has an opportunity related to climate change mitigation by financing and investing in the growing renewable energy market and by developing and offering new mortgage and insurance products and services that address the evolving needs of consumers and businesses to make the energy transition. | Activities related to:
|
|
| Impact investment target |
6.2.1.1 Impacts, risks and opportunities
a.s.r. has identified and assessed several climate-related impacts, risks and opportunities. The risks are categorised as either climate-related physical risks (arising from climate hazards) or climate-related transition risks (stemming from the transition to a net-zero economy and climate resilient society).
For more information about the process to identify and assess material impacts and risks and about the consolidation process, see sections 6.1.4.3 and 6.7.2. The climate-related scenario analysis was applied to identify and assess climate-related risks. The climate-related scenario analysis includes a range of climate scenarios as described in section 6.2.1.2. No critical climate-related assumptions used in the climate scenario analysis have been incorporated into the financial statements.
Impacts
Impacts on climate change can be both positive and negative. a.s.r. identified its impacts on climate change, in particular its GHG emissions, through expert sessions and by applying various standards and guidance documents. This process led to the identification of actual and potential positive and negative impacts on the short, medium and long term for multiple business lines. These impacts were reviewed and actualised in 2025 during the DMA update as explained in section 6.1.4.3.
a.s.r. assessed the activities in the own operations by making use of the GHG Corporate Accounting and Reporting Standard to identify their actual and potential impacts on climate change. Scope 1, 2 and 3 GHG emissions resulting from these own operations were identified in this process.
In addition, a.s.r. screened the activities in its value chain by using the Corporate Value Chain (Scope 3) Standard to identify their actual and potential climate-related impacts. This assessment led to the identification of several scope 3 GHG emissions associated with a.s.r.'s value chain.
To quantify GHG emissions, a.s.r. applied the GHG protocol to calculate the total GHG emissions of the own operations, used PCAF standard Part A 2nd edition (2022) to calculate the total financed emissions and applied PCAF standard Part C 1st edition (2022) to determine the total insurance-associated emissions of P&C's personal motor and commercial lines portfolios. For the health portfolio, a.s.r. used the calculation methodology agreed on by the Dutch health insurance industry to calculate GHG emissions related to the healthcare usage of a.s.r.'s health insurance policyholders and the products purchased by healthcare providers on their behalf.
Physical risks and transition risks and opportunities
Physical risks are caused by the physical impacts of climate change. These include acute events such as floods, wildfire, and storms, as well as chronic changes like rising temperatures and sea levels. These risks may lead to damage to infrastructure, disrupted business operations, reduced asset values and increased operational costs.
a.s.r. identified its physical risks related to the sub-topic climate change adaptation through expert sessions and by making use of the various tools. This resulted in the identification of short-, medium- and long-term actual and potential risks for various business lines. These risks were reviewed and actualised as part of the DMA update in 2025.
The definition of short-, medium- and long-term time horizons for climate-related risks are based on the SAA and these horizons align with a.s.r.'s strategic planning frameworks.
Transition risks that are associated with the societal shift towards a low-carbon economy include regulatory changes (such as carbon pricing or GHG emissions caps), technological developments and shifts in consumer preferences. Transition risks may lead to increased costs for businesses or reduced demand for carbon-intensive products, potentially resulting in stranded assets or declining asset valuations.
a.s.r. identified its transition risks and opportunities related to the sub-topic climate change mitigation through expert sessions and the application of several tools. This process led to the identification of actual and potential transition risks and opportunities in the short, medium and long term for various activities of a.s.r. These risks and opportunities were reviewed and actualised during the DMA update of 2025.
Asset Management
For investors, physical and transition risks can reduce company profitability, stress public finances and result in lower portfolio returns over time. a.s.r. considers physical and transitional climate risks in the investment portfolio to be financially material, especially over the medium and long term, as the effects of climate change intensify.
a.s.r. undertakes the following steps to assess and manage physical and transition risks across the investment portfolio by:
Using the latest climate science to identify potential climate-related hazards over the short, medium and long term.
Using the latest climate science to identify potential transition events over the short, medium and long term.
Assessing the sensitivity of a.s.r.'s investments to physical and transition risks by making use of climate scenario analysis that considers various climate scenarios, ranging from high-emissions scenarios to at least one scenario aligned with the Paris Agreement.
Combined strategic analysis of physical and transitional risk on the investment strategy
There are many overlaps between physical and transitional risks that impact the medium- and long-term analysis of the investment strategy. To capture these crossover effects, a.s.r. conducts a combined analysis that shows the possible impact of climate change based on current scientifically substantiated scenarios, see section 6.2.1.2.
Real Estate and Mortgages
For the real estate and mortgage portfolio, a.s.r. made use of its Climate Risk Monitor to identify climate-related hazards in its value chain over the short, medium and long term. This is an in-house-developed tool, with which a.s.r. has implemented the Framework for Climate Adaptive Buildings (FCAB) for its portfolio. FCAB was drawn up by the Dutch Green Building Council (DGBC) together with a variety of financial institutions (including a.s.r.), knowledge institutes, advisors and solutions to achieve a smooth and sector-wide methodology for assessing physical climate risks at the property level1.
To screen whether real estate or mortgaged assets may be exposed and are sensitive to the identified climate-related hazards, creating gross physical risks, a.s.r. identified the expected climate impacts on the environment of the buildings in the real estate and mortgage portfolio and combined this with the vulnerability of the buildings themselves.
a.s.r. made use of the FCAB to calculate the climate risk score, a combination of the environmental score and the building score, to identify climate-related hazards. This methodology made it possible to identify and prioritise climate risks through 'red flagging'. For the properties within the real estate portfolio for which a material risk was identified, an in-depth analysis (‘deep dive’) was carried out to identify the adaptation solutions that can reduce the identified physical risks.
Identification and assessment were informed by at least high-emissions climate scenarios, as the FCAB works with Royal Netherlands Meteorological Institute (Koninklijk Nederlands Meteorologisch Instituut - KNMI) projections for 2050 which contain high-emissions climate scenarios.
a.s.r. identified potential transition events for its real estate and mortgage portfolio over the short, medium and long term in its value chain by using various documents, research papers and sectoral guidelines, including European legislation, publications by the Dutch Central Bank (De Nederlandsche Bank – DNB) and the Authority for the Financial Markets (Autoriteit Financiële Markten – AFM), the ESG risk framework of the European Association for Investors in Non-Listed Real Estate Vehicles (INREV) and the Dutch government's National Energy and Climate Plan, including the National Climate Agreement.
a.s.r. screened whether its real estate may be exposed to the identified transition events by making use of the Carbon Risk Real Estate Monitor (CRREM) and applicable legislation, such as the Energy Performance of Buildings Directive (EPBD IV) and the EU Taxonomy Regulation. For farmland and rural estates, transition risks were monitored using the Open Soil Index (Open Bodemindex) to measure and report on soil quality. a.s.r. screened whether its mortgages may be exposed to the identified transition events, by conducting an analysis of the portfolio to determine which mortgaged assets have a potential transition risk.
a.s.r. identified the real estate assets with exposure to transition risk based on the actual (energy intensity) and theoretical (energy label) energy performance that is available for those assets. a.s.r. identified the mortgages with exposure to transitional risk based on the energy labels that are available for the related buildings of the mortgage portfolio.
For the identification of transition events and the assessment of exposure, a.s.r. used climate-related scenario analysis. This considered a scenario at least consistent with the Paris Agreement, as a.s.r. uses the 1.5°C CRREM Pathway consistent with the Paris Agreement to identify stranded assets based on the actual energy performance.
a.s.r. has not identified any real estate that is incompatible with the transition to a climate-neutral economy. However, a.s.r. holds mortgages on properties with a registered energy label G. These mortgages are considered incompatible with, or likely to require substantial effort to become compatible with, the transition to a climate-neutral economy.
P&C
For its P&C portfolio, a.s.r. utilised the report Accelerating Climate Adaptation, published by the Working Group on Climate Adaptation Finance Sector under the Sustainable Finance Platform. This report supported the identification of climate-related hazards across the value chain over short-, medium-, and long-term horizons. It also provided insights for screening underwriting activities for exposure and sensitivity to these hazards, thereby identifying potential risks.
To assess the impact of extreme weather on insured residential properties, a.s.r. referred to the Dutch Association of Insurers’ Climate Damage Monitor. This tool highlights how extreme weather events affect the claims burden for property insurers.
a.s.r. defined short-, medium- and long-term time horizons for climate-related risks based on its SRA. These horizons align with its strategic planning frameworks. The Accelerating Climate Adaptation report employs the KNMI’23 climate scenarios, which include high-emissions pathways and their implications for adaptation measures.
a.s.r. identified potential transition events for its P&C portfolio over short-, medium-, and long-term horizons by leveraging the Dutch government's National Energy and Climate Plan. This plan includes the National Climate Agreement and forecasts from Dutch banks, outlining transition pathways to climate neutrality for various sectors in the Netherlands.
a.s.r. assessed whether its underwriting activities were exposed to these transition events. This evaluation used data from the Dutch Association of Insurers and expert insights. To determine the level of exposure and sensitivity to these transition events, a.s.r. calculated the proportion of insurance contract revenue (ICR) linked to NACE codes associated with the fossil fuel industry. This analysis was guided by climate-related scenarios, including at least one aligned with the Paris Agreement. The National Climate Agreement, which is based on the principles of the Paris Agreement, served as a key reference point.
By examining ICR connected to fossil fuel-related NACE codes, a.s.r. identified underwriting activities that may conflict with, or require significant adjustments to align with, a transition towards a climate-neutral economy.
Health
Physical risks can have an effect on the financial results of the health insurance portfolio, as they may cause a rise in claims burden due to an increase in the costs of healthcare resulting from climate-related illnesses such as allergies, infectious diseases and heat stress.
In expert sessions, a.s.r. identified climate-related hazards across the health portfolio considering at least high-emissions climate scenarios. a.s.r. assessed how and the extent to which its business activities may be exposed and are sensitive to these climate-related hazards, creating physical risks in the short, medium and long term.
a.s.r. has not yet identified climate-related transition events that create transition risk in its health portfolio.
- Source: DGBC (2024).
6.2.1.2 Climate change in strategy and business model
Material impacts, risks and opportunities and their interaction with strategy and business model
For each of the material climate-related risks that a.s.r. has identified, an explanation of whether a.s.r. considers it to be a climate-related physical risk or a climate-related transition risk can be found in section 6.1.4.3.
The analysis of the resilience of its strategy and business model in relation to climate change is part of the resilience analysis, which in its turn is part of the SAA study. The entire a.s.r. Group was included in the SAA study, and specifically the supervised entities (OTSOs). For the non-supervised entities, a static cash flow was assumed and the sensitivity to climate change of the cash flows generated for a.s.r. was not taken into account. All material climate-related physical risks and transition risks are part of the analysis on an aggregated level.
One of the constraints of the model is that all climate-related risks, both physical and transitional, are evaluated in a combined manner. In addition, the scenarios do not contain the climate-related tipping point effects or biodiversity-related impacts.
All company-level scenarios are based on national data from the relevant countries or regions in which a.s.r. invests or operates. For the underlying risk assessment for the product lines (e.g. Mortgages and Real Estate), the data are linked to geospatial coordinates specific to investment locations.
The resilience analysis was carried out in 2025 as part of the Strategic Asset Allocation study, which takes place annually. The study uses five climate scenario analyses:
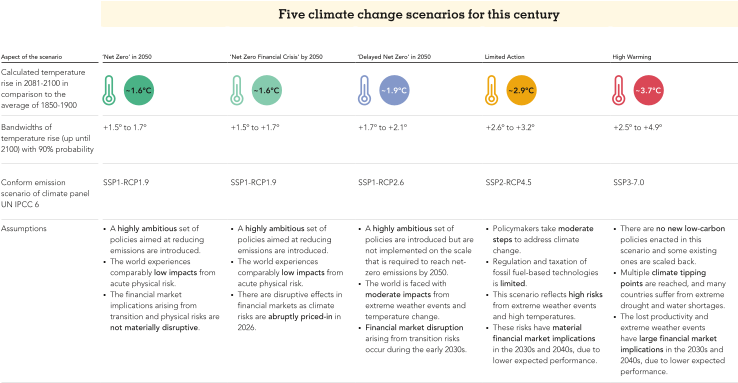
The 'Net Zero' in 2050 scenario assumes a temperature rise of 1.6°C. The assumptions were made that a highly ambitious set of policies aimed at reducing emissions are introduced, the world experiences comparably low impacts from acute physical risk and that the financial market implications arising from transition and physical risks are not materially disruptive.
The 'Net Zero Financial Crisis' by 2050 scenario assumes a temperature rise of 1.6°C. The assumptions were made that a highly ambitious set of policies aimed at reducing emissions are introduced, the world experiences comparably low impacts from acute physical risk and that there are disruptive effects in financial markets as climate risks are abruptly priced-in in 2026.
The 'Delayed Net Zero' in 2050 scenario assumes a temperature rise of 1.9°C. The assumptions were made that a highly ambitious set of policies aimed at reducing emissions are introduced but are not implemented on the scale that is required to reach net zero emissions by 2050. Also, the world is faced with moderate impacts from extreme weather events and temperature change and financial market disruption arising from transition risks occur during the early 2030s.
The Limited Action scenario assumes a temperature rise of 2.9°C. The assumptions were made that policymakers take moderate steps to address climate change, thus regulation and taxation of fossil fuel-based technologies is limited. This scenario reflects high risks from extreme weather events and high temperatures and these risks have material financial market implications in the 2030s and 2040s, due to lower expected performance.
The High Warming scenario assumes a temperature rise of 3.7°C. The assumptions were made that there are no new low-carbon policies enacted and some existing ones are scaled back. Also, multiple climate tipping points are reached and many countries suffer from extreme drought and water shortage. The lost productivity and extreme weather events have large financial market implications in the 2030s and 2040s, due to lower expected performance.
The key forces and drivers, taken into consideration in each scenario, are macroeconomic trends and assumptions relevant to a.s.r.
A time horizon of 25 years is applied, which is considered long-term in the context of the SAA. This endpoint was chosen in line with the Paris Agreement's aim for net zero by 2050 and should therefore cover plausible risks and uncertainties. The time horizon for GHG emissions reduction targets, on the other hand, focuses on the nearer term, with a time horizon of five years. This deviation is a result of immediate emissions reduction action being required now, whereas climate risk is expected to have a significant impact on the business in the longer term.
The resilience analysis has led to the following results:
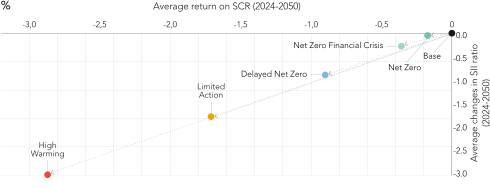
Created in collaboration with ORTEC Finance, the model is aligned with state-of-the-art science by translating biophysical impacts to economic impacts of climate change. a.s.r. uses the UN IPCC six climate scenarios as a basis for the biophysical impacts, which are then interpreted using a sophisticated non-equilibrium econometric model. In comparison to an equilibrium model, it has the advantages of:
Not assuming optimising behaviour;
Not deriving historical relationships;
Having a bounded rationality with uncertainty;
Including path dependence and learning effects;
Assuming endogenous money.
a.s.r. continuously assesses the resilience of its strategy and business model to climate change. a.s.r.’s integrated risk management framework, in which climate‑related risks are embedded, ensures that capital resources are managed proactively (see section 7.8) and is in line with the Solvency II management ladder as set out in section 2.4.1.1. Supported by a robust Solvency II ratio, a.s.r. maintains substantial buffers to absorb potential financial impacts from climate-related risks and continue to operate safely above the required solvency levels.
6.2.1.3 Climate transition plan
a.s.r. has set several carbon footprint reduction targets. More information on these targets and how they are compatible with limiting global warming to 1.5°C in line with the Paris Agreement is disclosed in section 6.2.1.6.
a.s.r. has determined various year on year decarbonisation levers, some quantitative and some qualitative, and has planned key actions, differing per product line, to achieve its GHG emissions reduction targets. Levers include product development (e.g. insurance products which encourage the use of more sustainable alternatives), engagement (e.g. engagement actions which aim to stimulate customers and investees to contribute to the transition to more sustainable sources of energy) and impact investing (e.g. investments in renewable energy solutions). For more information about a.s.r.'s key climate mitigation actions and decarbonisation levers, see section 6.2.1.5 and the Climate and Nature Transition Plan.
Investments and funding may be needed to support the implementation of a.s.r.'s transition plan for climate change mitigation, including action plans of the various product lines. For an explanation and quantification of the investments and funding to support the action plans of the various product lines, where significant, see section 6.2.1.5.
a.s.r. has not identified any material locked-in GHG emissions in its products or services, so it does not currently expect any such emissions to jeopardise the achievement of its carbon footprint reduction targets or drive transition risk.
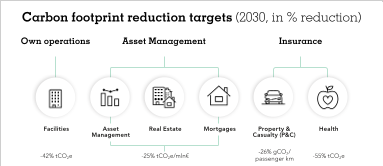
a.s.r. is not excluded from EU Paris-aligned benchmarks.
a.s.r. has embedded its transition plan for climate change mitigation in the Climate and Nature Transition Plan, referred to below, and aligned it with its broader business and financial planning:
Key elements of integrating climate considerations into its business strategy include the setting of a non-financial target for carbon footprint reduction of financed emissions, the development of central sustainability policies, setting up a central sustainability risk framework and introducing sustainable central value chain and contract management. These cascade through to the decentralised targets, policies, operational processes, risk management frameworks, and value chain and contract management of the various product lines.
Climate-related considerations are integrated into the organisation's SAA, which includes various climate scenarios and safeguards a.s.r.’s financial performance. For further information, see section 6.2.1.1. The SAA cascades through to a.s.r.’s reinsurance schemes and investment and pricing policies of the various product lines.
The a.s.r. Climate and Nature Transition Plan has been published on a.s.r.’s corporate website following approval by the EB.
a.s.r. has made further progress on implementing its transition plan for climate change mitigation across the organisation. For further information on the carbon footprint reductions already achieved, how a.s.r.’s progress on its carbon footprint reduction targets is monitored and reviewed, and whether progress is in line with the initial planning, see section 6.2.1.6.
6.2.1.4 Policies
a.s.r. has several policies in place to manage its material impacts, risks and opportunities related to climate change mitigation and adaptation:
Sustainability Policy Statement Services;
The Policy on Responsible Investments;
The ESG Policy of a.s.r. real estate;
The Mortgages Transition Plan;
The Policy on Sustainable Insurance;
The Health Procurement Policy.
Facilities 2.2
The Sustainability Policy Statement Services aims to minimise the environmental impact of a.s.r.’s own operations. The policy applies to activities related to a.s.r.’s office locations in Utrecht, Rotterdam (closed on 31 December 2024), Enschede, Heerlen, Den Haag (closed on 30 June 2025) and Leeuwarden. The facility managers of the office locations Groningen, Amsterdam, Zaandam and Breukelen have given a commitment to align with this policy statement. The office locations of D&S Holding and HumanTotalCare do not yet have a formal policy; these locations represent 12% of total scope 1 and 2 GHG emissions.
The policy focuses on reducing the impact on climate change and fulfilling legal obligations. It addresses direct emissions (scope 1), indirect emissions from purchased electricity (scope 2), and other indirect emissions such as business travel, commuting and waste (scope 3). A reduction target for Scope 1 and 2 emissions has been set in line with the Science Based Targets initiative (SBTi).
Reducing the negative impact on climate change mitigation is central to this policy. This is supported by energy-efficiency improvements at office locations and efforts to reduce energy consumption per employee at the head office in Utrecht. The goal is to reduce the energy consumption for heating, cooling and ventilation to a maximum of 50 kWh per gross square metre in 2030, in line with and even exceeding the Paris Proof standard. For the office location Groningen, the goal is to reduce the energy consumption for heating, cooling and ventilation to a maximum of 70 kWh per gross square metre in 2050.
The implementation of the Sustainability Policy Statement is embedded in the daily operations through hybrid working, green procurement and efficient use of office space. Monitoring is conducted through annual audits, data reporting under CSRD, Energy Efficiency Directive (EED) and regular evaluations. The Sustainability Policy Statement Services is published on the a.s.r. website. The management team of facilities is responsible for implementation and continuous improvement of the policy.
a.s.r. does not have a dedicated environmental procurement policy but it has included ESG criteria in its 'Further agreement', its Code of Conduct for Suppliers and its Outsourcing Policy.
Asset Management 1.11.22.12.22.32.4
The Policy on Responsible Investments sets out a.s.r.’s framework for integrating ESG factors into all investment decisions. It is guided by the policy goals of creating positive impact, driving change and reducing harm.
Climate change and the energy transition is one of the policy's focus areas. a.s.r. aims to mitigate climate-related risks and reduce the negative impact a.s.r. may have on climate change, while supporting the transition to a low-carbon and climate-resilient economy. The policy provides an overview of the main initiatives and standards that a.s.r. has signed up to or endorsed that have an impact on the investment approach or shape the policy's requirements. Amongst them are the UN Principles on Responsible Investing (UN PRI), Dutch Engagement Coalition (DEC) and the Net Zero Asset Managers initiative (NZAM).
One of the policy's focus themes is climate change and the energy transition. In order to address climate change mitigation, the policy:
Outlines clear criteria for excluding investments in companies and activities that are incompatible to the goals of the Paris Agreement, such as coal-fired electricity generation and oil and gas production.
Includes requirements for active ownership, whereby a.s.r. engages with investee companies to encourage the adoption of credible climate transition plans, supported by science-based GHG emissions reduction targets.
Promotes impact investing, with a.s.r. investing in companies and projects that contribute to climate change mitigation and adaptation.
The position paper Climate Change & the Energy Transition and the Impact Investing Framework complement the policy by setting out a.s.r.'s approach in more detail, including a.s.r.’s expectations of companies and the types of investments it considers to be impactful.
The Policy on Responsible Investments applies to all assets managed by a.s.r. asset management. The Policy on Responsible Investments is published on the a.s.r. asset management website to provide stakeholders with clear insights into the investment approach. Both external investment managers and internal stakeholders, such as portfolio managers, are actively informed about the policy. The MB of a.s.r. asset management is ultimately responsible for the development and implementation of the policy.
Real Estate 1.11.22.12.22.3
The ESG Policy addresses the negative impact that a.s.r. real estate's assets may have on climate change mitigation, as it sets out a framework to acquire and manage low-carbon assets. The policy also addresses the positive impact a.s.r. can have on climate change adaptation and energy efficiency by setting out rules for renovating standing investments using the CRREM pathways. Additionally, it addresses renewable energy by setting out a framework to acquire renewable energy projects such as windmill parks.
The scope of the ESG Policy includes all non-listed sector funds managed by a.s.r. real estate (Funds) and the separate accounts managed by a.s.r. real estate on behalf of a.s.r. (Separate Accounts). The ESG policy establishes and integrates the key aspects of a.s.r. real estate's vision, strategy and policies regarding the integration of ESG in investments and operations. The applicability of specific policies, actions, targets and metrics is adjusted as appropriate to the specific Funds and separate accounts due to the different investment strategies and real asset markets in which they operate. Each Fund also developed its own annual ESG Policy, which sets out its specific ESG objectives.
The management team of a.s.r. real estate is accountable for the implementation of its ESG Policy. The fund management teams of the Funds are accountable for the implementation of the ESG policy at the Fund level. Investors, tenants and suppliers are engaged in the policy development through surveys and/or consultations. The ESG policy of a.s.r. real estate is published on the a.s.r. real estate website.
Mortgages 1.11.22.12.22.32.4
For the mortgage portfolio, the Mortgages Transition Plan is in place. This policy aims to reduce negative environmental impact and climate-related financial risks, while enabling positive environmental impact and financial opportunities in its mortgage portfolio. The plan focuses on improving the energy performance of financed properties and reducing scope 3 financed emissions (limited to scope 1 and 2 of the underlying assets).
The Mortgages Transition Plan addresses climate change mitigation and energy efficiency by setting up a framework for more accessible and less costly mortgage lending, to make homes more sustainable and energy efficient. Additionally, the Mortgages Transition Plan supports climate change adaptation by facilitating participation in partnerships to increase awareness and knowledge surrounding this theme.
The Mortgage Transition Plan is not available on the a.s.r. website. The management team of Mortgages is accountable for the development and implementation of the Mortgages Transition Plan.
P&C 1.11.22.12.22.32.4
a.s.r. applies its Policy on Sustainable Insurance to address climate change, manage risks, and seize opportunities in its P&C portfolio. The policy aims to reduce climate impact, support the energy transition, and promote sustainable practices across underwriting, product development and claims handling for relevant insurance products and services. It thereby contributes to the UN Principles for Sustainable Insurance and the Forum for Insurance Transition.
The Policy on Sustainable Insurance contains exclusion criteria. These criteria exclude P&C coverage for companies that significantly contribute to climate change, such as producers of thermal coal and unconventional oil and gas. Conventional energy producers are required to align with the Paris Agreement target and present a transition plan. Companies with substantial operations in the fossil fuel industry or other sensitive sectors are subject to an ESG risk assessment.
The policy also addresses climate-related physical and transition risks and identifies climate-related opportunities by providing a framework for sustainable product development. To support the transition to renewable energy, the policy outlines a.s.r.'s approach to insuring businesses in the renewable energy sector via the a.s.r. sustainability desk.
Sustainable claims handling is an integral part of the policy, prioritising repair over replacement of damaged items through certified sustainable repair network partners. Certification requirements include restrictions on GHG emissions during the repair process and requirements on the use of secondary materials. Climate adaptation is also embedded in the policy, with guidelines for sustainable product development.
The Policy on Sustainable Insurance is published on the a.s.r. website. The management team of P&C is responsible for its implementation.
Health 1.11.22.2
a.s.r. has implemented the Health Procurement Policy to reduce environmental impact and mitigate climate-related financial risks. The scope of this policy concerns all health insurance activities of a.s.r. and aligns with the sustainability policy of Zorgverzekeraars Nederland (ZN) as described below. The Health Procurement Policy is published on the a.s.r. website. No policy has yet been established for climate change adaptation. Mitigation is further addressed through sector-wide collaboration in the healthcare industry, including joint initiatives, such as the sustainability policy, to tackle climate change.
ZN has developed a sectoral implementation plan under the Green Deal Sustainable Healthcare (Green Deal Duurzame Zorg – GDDZ) 3.0 (2022–2026), which is aligned with the Paris Agreement and the Climate and Energy Agreement. This plan targets the Dutch healthcare sector and is available on ZN’s website. It operationalises the GDDZ 3.0 goals for health insurers and incorporates input from multiple stakeholders.
The plan focuses on three pillars for CO₂ reduction: sustainable healthcare real estate, sustainable mobility and identification of other CO₂ hotspots. Research by Stimular highlights pharmaceuticals as major contributors to scope 3 emissions. To minimise administrative burden, consistent action by health insurers is essential. Topics from the plan are annually detailed in the sustainability policy, published by 1 April of the preceding year.
Healthcare providers and supply chain stakeholders (e.g. suppliers) play a key role in sustainable water management and pollution reduction. Sustainability is pursued through integrated measures, with the sustainability policy serving as the primary instrument. The 2025 sustainability policy is currently in effect, and the 2026 sustainability policy is ready for implementation.
Theme three of the ZN plan includes:
Healthcare real estate: Providers with more than 250 FTEs must develop CO₂ roadmaps and strategic plans. Certification systems and an action framework are under development.
Sustainable mobility: Providers with more than 100 FTEs must draft mobility plans. CO₂ emissions now influence patient transport contracts.
Other CO₂ hotspots: Annual GHG assessments guide policy adjustments. Pharmaceutical chain partners collaborate on CO₂ reduction, and sustainability criteria may be added to preference policies.
Green initiatives are mapped to promote knowledge sharing. No measures have been introduced yet to address remediation for individuals harmed by climate change. ZN oversees policy development, while a.s.r. health's management team is responsible for implementation.
6.2.1.5 Actions
a.s.r. has taken various key actions to manage its climate-related impacts, risks and opportunities and, where applicable, achieve its policy objectives.
Facilities 2.2
Office locations
a.s.r. has determined a set of key actions aimed at reducing its negative impact on climate change. The key actions presented by outcome are:
Increase energy efficiency of a.s.r.'s office locations by optimising the use of office locations and space and implementing measures to reduce the usage of gas (decarbonisation lever: consolidation of office locations and reducing the usage of gas reduce emissions. The expected overall contribution to achieving the 2030 GHG emission reduction target through office consolidation amounts to -606 tCO2e and through gas reduction to -4 tCO2e).
Increase the use of renewable energy at a.s.r.'s office locations by using renewable energy from its own solar panels and purchasing market-based green electricity.
Reduce GHG emissions by company vehicle mobility through electrification of the lease car fleet (decarbonisation lever: electrification of transportation reduces emissions. The expected overall contribution to achieving the 2030 GHG emission reduction target through the electrification of a.s.r.’s lease fleet amounts to -1,077 tCO2e).
Reduce GHG emissions of employee commuting through the promotion of eco-friendly transportation options, by offering a NS-Business Card and a tax benefit for new bicycles used for commuting as well as promoting hybrid working by optimising hybrid working systems and an envisaged 0.4 workstation per FTE at a.s.r.'s head office (decarbonisation lever: less and eco-friendly transportation reduces emissions).
The scope of these key actions is direct emissions from owned or controlled sources, indirect emissions from the generation of purchased electricity and indirect emissions that occur from business travel, employee commuting and waste generated in own operations.
a.s.r. implements its key actions on an ongoing basis. The reduction of carbon emissions of company vehicle mobility runs until the beginning of 2029, when a.s.r.'s entire lease car fleet is expected to be fully electric.
a.s.r.’s key climate mitigation actions have already led to concrete results, including a reduction in emissions of a.s.r.'s head office and vehicle fleet. Further carbon footprint reduction has been achieved through closing the office building in Rotterdam on 31 December 2024. In 2025, the office building in Den Haag was closed and at the end of 2026, the office building in Leeuwarden will be closed to continue the optimisation of office space. For progress on a.s.r.'s carbon footprint reduction target, see section 6.2.1.6.
IT
a.s.r. has adopted a set of actions to reduce its negative impact on climate change for the use of IT. The key actions presented by outcome are:
Move all workloads to a public cloud provider that has committed to zero carbon emissions in 2012, but more importantly, is committed to being carbon negative in 2030.
Until all workloads are moved to the public cloud:
Increase energy efficiency by purchasing modern data centre hardware with a lower carbon footprint.
Deploy renewable energy by using green energy for the data centres, contractually agreed upon.
Reduce carbon emissions by longer use of current employee hardware where possible, leading to less carbon emissions in connection to replacements of employee hardware (decarbonisation lever: extend lifetime instead of replace hardware reduces emissions). a.s.r. extended the lifecycle of end-users’ hardware from three to four years.
These key actions concern the data centre hardware in Utrecht and Woerden and the end-user hardware for all employees. The actions are continuously carried out by a.s.r., as there will always be changes in a.s.r.’s data centre composition and workforce composition, requiring the organisation to fulfil the need to continue business as requested.
a.s.r. has already delivered concrete results in relation to its climate mitigation actions for IT: GHG emissions of the energy consumption at the Utrecht data centre were zero in 2025 (2024: zero) following a transition to green energy consumption. The GHG emissions of the energy consumption at the Woerden data centre decreased to zero in 2025.
Asset Management 1.11.22.12.22.32.4
a.s.r. has adopted a set of actions to manage and mitigate the material impacts, risks and opportunities related to climate change mitigation and adaptation. These actions are embedded in the Policy on Responsible Investments and reflect a.s.r.'s commitment to supporting the transition to a low-carbon and climate-resilient economy. They are further detailed in the sustainability strategy and Climate Change and Energy Transition Position Paper, which outline a.s.r.’s climate strategy.
Key actions are grouped by intended outcome below. For climate mitigation, they are further linked to the relevant decarbonisation lever:
Support the transition to a low-carbon and climate-resilient economy through impact investments: a.s.r. aims to invest 10% of its assets in impact investments, with a significant share allocated to companies and projects that help mitigate climate change risks by reducing global GHG emissions and that strengthen society's resilience to its effects. These include investments in renewable energy, low-carbon technologies and climate-adaptation solutions.
Mitigate negative impacts and manage risks through active ownership: a.s.r. engages with companies in its investment portfolios to encourage the adoption of credible climate transition plans, supported by science-based GHG emissions reduction targets. a.s.r. collaborates with like-minded peers to strengthen its engagement efforts and increase its influence with investee companies (decarbonisation lever: engagement leads to investees developing and implementing transition plans). Shareholder voting rights are used to support engagement activities and may be used as a form of escalation where engagement is unsuccessful.
Support the transition to a low-carbon economy through industry participation and collaboration: a.s.r. aims to drive positive change in the financial sector by actively participating in industry bodies and climate-focused collaborations. For example, a.s.r. is a member of initiatives such as the DEC and the NZAM, where it works alongside other investors to promote policies and practices that support the transition to a low-carbon and climate-resilient economy. In 2025, a.s.r. joined ShareAction Chemical Decarbonisation to support its engagement activities with a selection of chemical companies.
Mitigate negative impacts and manage risks through exclusions: a.s.r. excludes investments in companies and activities that are incompatible with achieving the goals of the Paris Agreement, such as coal mining and coal-fired electricity generation. The exclusion rules and criteria are annually reviewed and may be updated where necessary. At the end of 2024, a.s.r. updated its policy to exclude companies producing oil and gas as engagement efforts highlighted insufficient progress from the sector to align with the Paris Agreement.
To understand the potential impact of physical and transition risks, a.s.r. integrates climate considerations into its risk management and investment decision-making processes. This includes making use of scenario analysis and integrating the potential impacts of climate change into the assumptions for the strategic asset allocation process.
The scope of the exclusion and impact investing actions includes all investments under management by a.s.r. asset management. Active ownership activities are primarily undertaken in connection with the listed investments managed by a.s.r. asset management. a.s.r. implements its climate-related actions on an ongoing basis.
In 2025, as part of a.s.r.'s fossil fuel exit strategy, fifteen investee companies which are significant users of fossil fuels were formally requested to detail their transition plan to align their strategy with the Paris Agreement and to commit to setting science-based targets through SBTi. When SBTi guidance on setting such targets was not yet available, companies were asked to actively support the development of standards in their industry.
a.s.r.'s financed emissions arise from the real-world activities of the companies and countries in which it invests. Reductions in financed emissions (i.e. GHG emissions reductions) depend primarily on external factors, such as government policy, technological advancements and shifts in consumer behaviour. The aforementioned actions aim to stimulate real-world decarbonisation and support alignment with net zero. However, the reduction of emissions in the real economy remains the primary driver of expected GHG emissions reductions and achievement of the carbon reduction target.
The progress of these key actions is monitored through the carbon footprint reduction target and the impact investing target, amongst others. For details, see section 6.2.1.6.
Real Estate 1.11.22.12.22.32.4
a.s.r. has established climate policies and defined actions to manage its climate-related impact, risks and opportunities within its real estate portfolio. The climate change mitigation efforts focus on reducing GHG emissions through asset-level reduction plans and sustainable practices. As part of the carbon reduction strategy, a.s.r. has developed a Paris Proof roadmap for the real estate portfolio. The policy and actions on climate change are tailored to the different activities and sectors in which a.s.r. operates.
Real estate property
Support climate change mitigation in existing and new real estate assets: a.s.r. aims to reduce the energy consumption of individual assets by executing asset-level reduction plans. A Paris Proof roadmap using the CRREM pathways is in place for each a.s.r. real estate fund and the own account assets. The Paris Proof roadmap is based on the current energy intensity and reduction measures at the level of individual assets to reach net zero in 2045. In addition, a.s.r. focuses on acquiring or developing new properties with lower carbon footprints (decarbonisation lever: less energy usage of property reduces emissions) and office buildings located near public transport hubs (decarbonisation lever: impact investing in locations near public transport hubs reduces car trips and promotes sustainable travel). In 2025, five asset-level reduction plans were executed within the real estate portfolio.
Advance climate change adaptation in existing and new real estate assets: a.s.r. strives to build a portfolio that is progressively adaptable to long-term climate-related hazards by both understanding and anticipating the long-term effects of climate change. For the assets that are exposed to high long-term physical climate risks, an assessment of adaptation solutions that could reduce the impact of the identified physical climate risks is carried out and the results are used to draw up a high-level adaptation plan, with the goal to have the adaptation plan in place by 2027.
Increase energy efficiency: a.s.r. engages with tenants to agree on making the leased asset more sustainable. Green leases are added to new and existing contracts, whereby tenant and landlord enter into a partnership for joint energy-reducing efforts, with the aim of bringing and keeping the energy intensity in line with the CRREM pathway and to reach net zero in 2045. In 2025, 84% of all new rental contracts (excluding residential and temporary contracts) within the commercial real estate portfolio were green lease contracts.
Support renewable energy deployment: a.s.r. aims to implement renewable energy solutions within its real estate portfolio. Photovoltaic panels are the most suitable solution for buildings and are installed when feasible. a.s.r. also procures 100% renewable energy from the Netherlands for the areas controlled by the landlord and encourages tenants to do so as well. The renewable energy deployment increased with 1912 kWp in 2025 to a total of 9,883 kWp within the real estate portfolio.
The scope of these key actions relates to a.s.r.'s real estate property portfolio.
a.s.r.'s route to Paris: Paris Proof sustainability upgrades in Houten
To meet Paris Proof sustainability standards, upgrades are being carried out on 69 dwellings in Houten owned by the ASR Dutch Core Residential Fund. Residents will be able to enjoy lower energy bills and greater living comfort. This is the first time an institutional investor has made rental housing from the 1980s Paris Proof. The Fund set the objective of achieving an entirely Paris Proof residential portfolio by 2045.
Paris Proof pilot home
The first Paris Proof pilot home in Houten was delivered in September 2024. This property served as a testing ground for Paris Proof sustainability measures, giving tenants a first-hand look at what sustainable living means. Early results indicate that, following the sustainability measures, the average CO2 emissions of the dwellings in this district are lower than the Paris Proof targets. The pilot home served as a standard for the other dwellings.
The built environment needs to prioritise sustainability improvements if it is to align with Paris Proof goals by 2050. The ASR Dutch Core Residential Fund is taking its responsibility for this by exploring and investing in ways to enhance the sustainability of its current portfolio. The project in Houten shows that there is a sound business case to upgrade existing dwellings to Paris Proof standards.
ASR Dutch Core Residential Fund Paris Proof Roadmap
In 2020, a.s.r. real estate signed the Paris Proof Commitment of the Dutch Green Building Council. The ASR Dutch Core Residential Fund aims to have a Paris Proof portfolio by 2045. To achieve this, the Fund has drawn up a Paris Proof roadmap with the aid of the CRREM tool.
Farmland and Rural estates
Support climate change mitigation through green leases and reduction measures by farmers: a.s.r. promotes sustainable agricultural practices through green leases. The green lease products are available to all clients, with new and existing contracts, and offer farmers an incentive on their annual lease, spanning the full contract term, if they commit to a set of sustainable farming criteria. The incentive amounts to a 10% discount during the first three years and 5% for the remainder of the contract term. In 2025, all new lease agreements and 30% of the existing ground lease agreements were green leases.
Support climate change mitigation through engagement with farmers: a.s.r. also supports farmers with emissions reduction and collaborates with farmers to develop tailor-made solutions that reduce GHG emissions and improve soil health. ASR DFLF covers the cost of creating these plans and works together with farmers to obtain funding for implementing the necessary measures. In 2024 and during 2025, a.s.r. began projects with farmers, guided by advisors, stewards and science experts, to create customised emissions reduction plans. a.s.r. facilitated eleven farmers with emissions reduction plans during 2025.
Advance climate change adaptation in existing and new farmland assets: a.s.r. conducted a comprehensive climate risk assessment for all plots in its portfolio. This assessment helped a.s.r. gain insight into the climate effects relevant to various landscape types and identify opportunities to enhance climate resilience. Based on the assessment, a.s.r. identified vulnerabilities to climate-related impacts, including thirteen climate risks divided into three main categories: water, drought and salinisation. a.s.r. then identified adaptation solutions to mitigate the identified climate risks and aims to assess and integrate these climate adaptation solutions into its acquisition, investment and disposition strategies with the goal to have an adaptation plan in place by 2027. In addition, a.s.r. aimed for at least 2% of the farmland portfolio's hectares to be dedicated to climate-positive crops, which include leguminous and biobased building varieties. This target was met at the end of 2025. The cultivation of these crops is considered an adaptation solution and offers a sustainable alternative to traditional agricultural practices.
The scope of these key actions is a.s.r. real estate's farmland property and rural estate portfolio.
Renewable energy
Support the energy transition: a.s.r. makes (impact) investments in renewable energy deployments such as wind and solar farms.
This key action relates to a.s.r. real estate's renewable energy property.
The time horizon to complete all these actions for the real estate portfolio is 2045, unless described otherwise.
These key climate mitigation actions have already delivered concrete results. The investments in wind and solar farms currently include four wind farms and one solar farm. Together, they produced 545 GWh in 2025, an amount of power comparable to the annual consumption of 218,000 households. The actions in the real estate property, farmland and rural estate portfolio resulted in a decrease of 13.8% compared to the base year 2023 in tCO2e per million euro invested. In the coming years, the funds and separate accounts managed by a.s.r. real estate will continue to execute asset-level reduction strategies and further refine the Paris Proof roadmap with annual consumption data, lessons learned and evolving insights on an annual basis, which are expected to lead to alignment with the Paris Agreement targets in 2045 at the latest.
Mortgages 1.11.22.12.22.32.4
a.s.r. has adopted a set of key actions in relation to its mortgage portfolio towards customers and intermediaries to stimulate them to make the transition to a net-zero home. The key actions are presented by outcome, and if they are climate mitigation actions, the decarbonisation levers are presented in parentheses:
Reduce GHG emissions and manage risks by offering specific products for making homes more sustainable, such as the Verduurzamingshypotheek, which provides the opportunity to borrow up to € 65,000 for the sole purpose of financing sustainable home improvements at a reduced tariff compared to the standard mortgage product (decarbonisation lever: financial (impact) incentive leads to making homes more sustainable and reducing emissions).
Reduce GHG emissions and manage risks by making it more accessible for customers to borrow up to € 20,000 (depending on the energy label) additionally for making their houses more sustainable through an opt-in on the mortgage offer. Customers with an energy label E, F or G get an offer of € 20,000, energy label C and D get an offer of € 15,000 and the other or unknown get an offer of € 10,000 (decarbonisation lever: additional (impact) finance incentivises to make homes more sustainable and reducing emissions).
Support the energy transition by offering information on sustainable living platform: on this platform, a.s.r. helps consumers by sharing other people's experiences and practical advice about sustainable living, such as insulating homes, saving on energy use and how to make a house more climate-resistant. (decarbonisation lever: accessibility of information on how to make homes more sustainable leads to more sustainable homes and reduces emissions).
Support the energy transition by offering a new partner network for helping customers to realise sustainable home improvements. (decarbonisation lever: accessibility of information on how to make homes more sustainable leads to more sustainable homes and reduces emissions).
Advance climate change adaptive thinking by increasing knowledge and awareness on climate adaptiveness of residential homes through engagement in partnerships.
The expected overall contribution from 2026 onwards to achieving the 2030 GHG emission reduction target through product offers amounts to -0.6 tCO2e per € million invested and through engagement via the sustainable living platform and collaboration with external partners -0.3 tCO2e per € million invested.
The scope of these key actions is scope 1 and 2 GHG emissions related to home heating and cooling of properties for which households have obtained a mortgage loan with a.s.r. These actions are ongoing until a.s.r. ultimately reaches net zero in 2050.
The progress of these actions is monitored through the impact investment target and carbon footprint reduction target; for the progress made in 2025, see section 6.2.1.6.
In the coming years, a.s.r. will continue to stimulate and help homeowners to make their homes more sustainable. a.s.r. has made a reduction pathway but is still dependent on the actions of homeowners, advisors, funders, the government and other parties in the mortgage value chain to achieve its goals. a.s.r. will continue to stimulate and encourage them.
P&C 1.11.22.12.22.32.4
a.s.r. has taken steps to address climate impacts, risks and opportunities in its P&C portfolio. Key actions, including specific outcomes and, for climate mitigation actions, decarbonisation levers, can be summarised into four main categories:
Sustainable insurance practices
Reducing carbon emissions and managing risks: In the underwriting process, a.s.r. excludes thermal coal and unconventional oil and gas producers. Other fossil fuel producers are required to commit to the Paris Agreement and present transition plans. ESG risk assessments are conducted for companies with significant involvement in the fossil fuel industry or in other sensitive sectors (decarbonisation lever: underwriting criteria encourage companies to develop and implement energy transition plans).
Supporting the transition to a more sustainable society: a.s.r. insures new sustainable businesses and technologies via the Sustainability Desk, with a focus on the energy transition. In 2025, sustainability expertise was added to the commercial lines team to assess technical aspects of sustainable innovations and translate them into underwriting acceptance criteria. Newly accepted risks in 2025 include, among others, timber construction assembly and the electrification of conventional vehicles.
Promoting climate adaptation and energy transition through product development: Through sustainable product development, a.s.r. incentivises prevention measures and renewable energy alternatives. Hence, in 2025 a.s.r. expanded the role of sustainability in product management processes and practices. As part of this initiative a.s.r. developed a sustainability framework to assess a sustainability score of its key products, enabling improvement and the integration of more sustainable elements in insurance products.
Engagement
Supporting the energy transition and promoting energy efficiency: a.s.r. provides a sustainable living platform, offering practical advice and consumer experiences on sustainable living, including home insulation, energy-saving techniques, and climate adaptation for houses. The platform includes the following web pages, among others:
Sustainable mobility: a.s.r. offers guidance on environmentally friendly transportation options with lower GHG emissions.
Sustainable business: a.s.r. supports entrepreneurs by sharing insights from other business owners and providing practical advice on sustainable entrepreneurship, including strategies for reducing energy consumption in the workplace.
Reducing GHG emissions through customer communication: In welcome messages to new customers, a.s.r. provides details on the importance of reducing GHG emissions (decarbonisation lever: engagement educates customers on ways to reduce emissions).
Partnerships and collaborations
Reducing GHG emissions through collaboration with Klimaatroute: a.s.r. partners with Klimaatroute to offer energy scans to business customers at discounted rates, including reports on potential emissions reduction actions within the company. Upon request, Klimaatroute assists with obtaining quotes, subsidies and permits (decarbonisation lever: informing and supporting business customers to reduce barriers to emissions reduction).
Participation in sector-wide initiatives:
Forum for Insurance Transition (FIT) to Net Zero: a.s.r. is an active member of this UN-led forum, which produced a series of transition plan guidances tailored for insurance and reinsurance underwriting portfolios.
a.s.r. participates in the following sector initiatives facilitated by the Dutch Association of Insurers:
Standardisation of ESG data: the aim of this initiative is to work towards a standardised way of calculating and reporting the GHG emissions of insured by Dutch insurance companies. This initiative currently focuses on the emissions calculations of the personal motor and commercial lines portfolios.
Standardisation of ESG data of car repair companies in collaboration with BOVAG (the Dutch association for mobility businesses):
Issue Committee on Sustainable Insurance: Within this committee, topics such as carbon reduction, biodiversity, and sustainable repair are discussed, with the possibility to intensify attention on particular issues when required.
Climate Platform: a.s.r. and other Dutch insurers seek preconditions and solution directions for preventing risks and to preserve or restore the insurability of risks as they are evolving through climate change.
Sustainable repair
Reduce GHG emissions through certified repair networks: a.s.r. refers customers to repairers certified by GroenGedaan! and Erkend Duurzaam (decarbonisation lever: extending the lifetime of items instead of replacing them reduces GHG emissions, supported by accessible financing for sustainable home improvements). In most cases, repair can be considered as a more sustainable option, and customers are encouraged to choose this route.
The scope of actions related to underwriting criteria and the sustainability desk involves commercial customers seeking object-related insurance. The key actions of a.s.r. concerning the sustainable living platform are directed at the general public. Sustainable product development and the welcome letter action apply to all a.s.r. customers, while the collaboration with Klimaatroute specifically targets commercial customers. The sector initiatives focus on developing ESG definitions and setting data standards in the insurance sector. The scope of actions referring to repairers pertains to the claims handling of damaged items insured under car and property insurance.
The implementation of sustainable underwriting criteria and the sustainability desk is expected to continue until 2050. Content on the Sustainable Living Platform and welcome messages will be updated regularly, with a long-term focus on 2050. The collaboration with Klimaatroute is established until 2030. Sector initiatives, sustainable product development and referrals to certified repairers are ongoing.
The progress of these actions is monitored through the insurance-associated carbon footprint reduction target; for the progress made in 2025, see section 6.2.1.6.
Emissions reductions in the real economy
a.s.r. anticipates that its product development, engagement and actions, such as sustainable repair, contribute to the energy transition, energy efficiency, and carbon reduction among consumers and entrepreneurs. However, the specific reduction in real economy emissions resulting from these actions remains unclear. a.s.r. will continue these efforts and expects they will encourage consumers and entrepreneurs to reduce their GHG emissions.
Health 2.2
a.s.r.’s climate actions within the health portfolio:
Sustainable pharmacy module: included in contracts with pharmacies and healthcare providers, this module promotes environmentally friendly practices like bicycle courier delivery, medication reuse via lockers and digital package leaflets. This module aims to reduce GHG emissions and applies to participating providers.
Sustainable maternity package: offers environmentally friendly maternity products to pregnant women, contributing to lower GHG emissions.
Active involvement in sectoral collaboration initiatives.
While these ongoing actions support carbon reduction, the exact real-economy impact remains unclear.
Sectoral Collaboration
The study into scope 3 emissions of health insurers identified material impacts in:
Real estate and employee travel by healthcare providers (scope 1 & 2);
Pharmacy emissions by healthcare providers (scope 3).
The implementation strategy entails the following key actions:
To develop CO₂ roadmaps and mobility plans for real estate and employee travel;
Promoting sustainability via healthcare purchasing and contracting, in accordance with the GDDZ 3.0;
Training healthcare purchasers to prioritise sustainability in procurement discussions.
The Implementation Strategy will help to achieve the GDDZ 3.0 goals for real estate and employee travel, which are in line with the objectives of the Paris Agreement and entail:
30% CO₂ reduction by 2026 (vs. 2018);
55% reduction by 2030 (vs. 2018);
Climate neutrality by 2050.
Effective measures for reducing emissions from the production and transportation for pharmaceuticals are being developed; chain-oriented collaboration with manufacturers and suppliers is hereby essential.
Residual emissions span fourteen care types within the health insurance act (Zorgverzekeringswet – Zvw), including aids, equipment and patient travel. This will not be prioritised in the short term. ZN monitors developments.
Challenges
Health insurers’ products and services lack direct emissions, but their scope 3 elements (e.g., historic real estate, global medicine production) pose challenges that need joint solutions.
Monitoring
The Sustainability and Health monitor, published in June 2025 by the National Institute for Public Health and the Environment (Rijksinstituut voor Volksgezondheid en Milieu - RIVM), provides baseline data and measurements that are needed to develop portfolio roadmaps.
Cure sector:
89% of hospitals have roadmaps;
67% administratively established;
Covering 99% of real estate within the cure sector.
Care sector:
72% of organisations (>250 FTEs) are working on roadmaps;
42% (95 of 224) are current and administratively established;
Covers 22% of real estate within the care sector.
Currently, there is no national and sectoral overview available of the number and percentage of healthcare institutions that have signed the GDDZ 3.0 and developed an action plan for sustainable mobility.
Resources in relation to climate change policies
In some cases, the implementation of an action plan may depend on the availability and allocation of resources, which require significant operational expenditures (OpEx) and/or capital expenditures (CapEx). Both are stated in the table and are primarily related to the implementation of the various key actions of a.s.r.'s supporting processes and investment activities.
E1-1 Financial resources allocated to action plans
| (in € millions) | 2025 | 2024 |
|---|---|---|
| Current operational expenditures allocated to action plan | 6 | 5 |
| Future operational expenditures allocated to action plan | 16 | 18 |
| Total operational expenditures | 22 | 23 |
| Current capital expenditures allocated to action plan | 3 | 2 |
| Future capital expenditures allocated to action plan | - | - |
| Total capital expenditures | 3 | 2 |
Operational expenditures
The implementation of the key actions has led to significant additional operational expenditures this year and in the coming years, as set out in the table above.
The operational expenditures mainly concern promoting eco-friendly transportation options for employees and hybrid working. Furthermore, they relate to several ESG projects aimed at mortgage customers and mortgage advisors to encourage them to transition to a net-zero home, including energy-efficient mortgages. The table also includes the operational expenses related to the implementation of the action plans to manage and mitigate the material impacts, risks and opportunities related to climate change for a.s.r.'s investment portfolio.
The slight increase in current operational expenditures from 2024 to 2025 is mainly driven by decommissioning activities. The closure of the Rotterdam and The Hague offices contributes to the reduction of scope 1 and 2 emissions and is part of the actions taken to achieve the emission reduction targets. The future operational expenditures have decreased compared to the previous year due to a reduced number of expected actions.
Capital expenditures
The capital expenditures in 2025 mainly relate to investments by TKP, which started replacing its climate control system. This project supports TKP's action plan to improve energy efficiency.
Not all entities and product lines have been able to determine their exact operational costs and capital expenses in relation to their action plans yet. Also, action planning is a continuous process, so additional CapEx and OpEx may be necessary to carry out further action plans.
Methodology
Financial resources allocated to action plans
Methodology and scope
a.s.r. uses CapEx and Opex as Key Performance Indicators (KPIs) to monitor investments and funding that support the implementation and maintenance of action plans for climate change mitigation, adaptation and transition. Investment amounts in euros are divided between actions taken during this reporting period and planned future allocations. To be included, expenditures must be allocated to an existing action plan. In addition, expenditures on business line level must exceed the one million euro materiality threshold to be included.
Not in scope of the operational expenditures are the operational expenditures made by the real estate equity funds, as these expenditures are not made by a.s.r. as an investor or by a.s.r. real estate as a fund manager. The funds do focus on reducing energy consumption through asset-level execution plans and increasing on-site renewable energy. As a fund manager, a.s.r. real estate encourages, advises and supports the funds in achieving the Paris Agreement Goals.
6.2.1.6 Targets
a.s.r. has set the following targets related to climate change mitigation and adaptation to track the effectiveness of its actions to address its climate-related impacts, risks and opportunities and to meet its policy objectives:
Impact investing target;
Carbon footprint reduction targets.
a.s.r. also supports the joint emissions reduction target within the healthcare sector resulting from the GDDZ 3.0.
Impact investment target 2.12.4
Asset Management, Real Estate and Mortgage activities
See section 3.1.3.4.
Carbon footprint reduction targets 2.2
To support a.s.r.'s policy goals and track the effectiveness of its actions to address its climate-related impacts, risks were identified at a consolidated group level in the categories own operations scope 1 and 2 and scope 3 financed emissions and insurance-associated emissions.
Due to differences in scope between E1-4 targets and E1-6 metrics, the 2025 emissions as disclosed for the E1-4 targets below differ from the emissions as disclosed in E1-6. The E1-4 targets cover 71% of total scope 1 and 2 market-based emissions from own operations, 78% of total financed emissions (scope 1 and 2) and 71% of the relating AuM in scope of E1-6, and 36% of total insurance-associated emissions.
E1-4 Carbon footprint reduction targets
| Base year | Baseline value | 2024 | 2025 | 2025 change compared to base year (in %) | Target 2030 (in %) | |
|---|---|---|---|---|---|---|
| Own operations (scope 1 + 2, in tCO2e)1 | 2023 | 2,246 | 1,424 | 807 | -64% | -42% |
| Financed emissions (scope 3, in tCO2e per € million invested) | 2023 | 42 | 40 | 38 | -9% | -25% |
| Government bonds | 2023 | 196 | 187 | 187 | -4% | |
| Corporate bonds | 2023 | 40 | 36 | 29 | -29% | |
| Equity | 2023 | 38 | 33 | 34 | -11% | |
| Mortgages | 2023 | 10 | 10 | 8 | -16% | |
| Real estate | 2023 | 108 | 108 | 93 | -14% | |
| Insurance-associated emissions (scope 3) | ||||||
| Personal lines - personal motor (in gCO₂ per passenger km) | 2023 | 135 | 131 | 127 | -6% | -26% |
- Market-based approach included in scope 2.
On 21 August 2024, a.s.r. announced it had joined the SBTi and therefore committed to setting science-based emission reduction targets in line with the Paris Agreement. At the end of 2025, a.s.r. submitted near-term science-based targets to SBTi for scope 1 and 2 emissions from own operations and scope 3 financed emissions. For the asset management activities, a.s.r. submitted a portfolio coverage target.
Carbon footprint reduction target – own operations scope 1 and 2 2.2
Facilities
The general objective of the Sustainability Policy Statement Services is for a.s.r. to maintain its own environmental performance at a socially responsible level. Setting a carbon footprint reduction target for own operations helps to track the effectiveness and progress of the climate mitigation actions taken to achieve this policy objective. a.s.r. compares the own operations scope 1 and 2 GHG market-based emissions in the reporting year (measured in tCO2e) to those in the base year, expressed as a percentage difference, at year-end.
The target level to be achieved is a 42% reduction compared to the own operations scope 1 and 2 GHG market-based emissions in base year 2023. a.s.r. is planning to reach this target by 2030.
At year-end 2025, a.s.r. achieved a reduction of 64% (2024: 37%) in GHG emissions compared to base year 2023. At the end of 2024, the archive in Rotterdam was closed, and during 2025, the office location in Den Haag was closed as part of the integration programme resulting in lower GHG emissions. In addition, the electrification of the lease car fleet and the purchase of market-based green electricity resulted in lower GHG emissions.
Carbon footprint reduction target – financed emissions 2.2
Asset Management, Real Estate, Mortgages
A key focus of the policies in place is mitigating climate-related risks and supporting the transition to a low-carbon and climate-resilient economy. Setting a carbon footprint reduction target for financed GHG emissions helps to track the effectiveness and progress of the climate mitigation actions taken to achieve these policy objectives.
a.s.r. compares the financed emissions in the reporting year (measured in tCO2e / € 1 million) to those in the base year, expressed as a percentage difference, at year-end.
The target level to be achieved in 2030 is a 25% financed GHG emissions reduction compared to base year 2023.
At year-end 2025, a.s.r. achieved a reduction of 9% (2024: 5%) compared to the base year 2023, which is in line with the initial planning. The decrease realised in 2025 was mainly the result of the decrease in GHG emissions from the corporate bonds, mortgages and real estate portfolio. This effect was partly offset by a higher share of government bonds in relation to the total portfolio. Government bonds have relatively high GHG emissions in comparison to other asset classes. For government bonds, it is crucial that governments actually realise their climate ambitions in order to achieve the reduction target.
Restatement
To align with the applicable reporting scope and methodology, the baseline value and 2024 figures for real estate assets were restated from 123 to 108 tCO₂e per € million invested. The reporting scope was extended from own investments to include third‑party assets as well, providing a more complete view of total emissions. As a result, the weighted total financed emissions, measured in tCO₂e per € million invested, were restated upward by plus one for both the baseline value (from 41 to 42) and 2024 figures (from 39 to 40).
Carbon footprint reduction target – insurance-associated emissions 2.2
P&C
a.s.r.’s policy on Sustainable Insurance aims to reduce negative impact on climate change, manage climate-related physical and transition risks and seize climate-related opportunities, among other objectives. Setting a carbon footprint reduction target for insurance-associated emissions enables the measurement of the effectiveness and progress of climate mitigation actions taken to meet these policy objectives.
In 2025, P&C introduced a new intensity-based target for its personal motor portfolio, to improve insight into the progress of emissions reduction efforts. This target measures relative GHG emissions, specifically Well to Wheel CO2 emissions, per passenger kilometre, and aligns with the ambition to achieve net-zero emissions by 2050 or earlier. The base year for this metric is 2023, and the target percentage for 2030 is derived from the SBTi tool based on the emissions recorded in the base year.
The new target level to be achieved is a relative reduction of 26% in gCO2 per passenger kilometre for personal motor by 2030 compared to base year 2023.
At year-end 2025, a.s.r. achieved a relative reduction of 6% compared to the base year for the personal motor portfolio. The decrease is the result of a higher number of electric vehicles insured within the P&C portfolio and fewer fossil‑fuel cars.
The commercial lines intensity-based reduction target is currently under development. a.s.r. expects to introduce this target in 2026. These two new targets replace the previous absolute target for personal lines and commercial lines of 26% tCO2 reduction in 2030 compared to 2022. a.s.r.'s rationale for adjusting its P&C carbon footprint target is to improve the quality of the target, focusing on sector-specific guidance, SBTi climate target-setting principles and by using intensity metrics, improving accuracy. For the new intensity-based targets it was deemed necessary to separate the personal lines and commercial lines portfolio, as they will have a different unit of measure. The actions, as described in section 6.2.1.5, are unaffected by the fact that one of the emission targets is currently under development.
Healthcare sector
The procurement policy of Health has incorporated the joint ambitions of the GDDZ 3.0, which aims to limit the negative impact of the healthcare sector on climate change. Supporting the joint emission reduction target for the healthcare sector helps to track the effectiveness and progress of the climate mitigation actions taken to achieve this policy objective.
The target level to be achieved by the healthcare sector is -55% tCO2e in 2030 compared to the base year.
The metric includes scope 1 and 2 emissions, as well as the scope 3 emissions of healthcare providers. Due to this difference in scope and the absence of a single mutual base year and baseline value, it is not possible to use the metric to monitor and review progress towards the target. Therefore, the performance against the target cannot be disclosed.
In the long term, the intention is to measure performance against the ZN CO₂ emissions reduction target. ZN has started discussions about a possible initiative to standardise all base years used by healthcare providers, ensuring that target year values and baseline values can be compared consistently. This would require harmonising the base year applied by providers, which is a complex process and expected to take considerable time. Consequently, performance against the target cannot yet be disclosed, and no specific timeline can be confirmed at this stage.
Methodology
The disclosures on the GHGs are related to the seven gases: carbon dioxide (CO2), methane (CH4), nitrous oxide (N2O), hydrofluorocarbons (HFCs), perfluorocarbons (PFCs), sulphur hexafluoride (SF6) and nitrogen trifluoride (NF3). The general unit of measure for the GHGs is in tonnes of CO2 equivalent, tCO2e. This universal unit of measurement is used to indicate the global warming potential of each greenhouse gas, expressed in terms of the global warming potential of one unit of CO2.
Targets are based on currently available information, estimates and assumptions, as described in section 6.2.1.7. Economic, political or regulatory developments may have an impact on the feasibility of the targets. a.s.r. may adopt new technologies if relevant and feasible.
a.s.r. strives for consistency in target-setting by establishing the carbon footprint reduction targets for own operations, financed and insurance associated emissions within the GHG inventory boundaries of the PCAF standards. The carbon footprint reduction targets are all gross targets that do not include GHG removals, carbon credits or avoided emissions.
The estimated contribution of the decarbonisation levers and their overall contribution to achieving the carbon footprint reduction targets is described in section 6.2.1.5.
Carbon footprint reduction target – own operations scope 1 and 2
Scope
This target includes the scope 1 and 2 GHG market-based emissions of the office location in Utrecht, Rotterdam (closed on 31 December 2024), Enschede, Heerlen, Den Haag (closed on 30 June 2025), Leeuwarden.
This target does not include offices in use for D&S Holding, Robidus, Corins, TKP and HumanTotalCare, representing 29% of total scope 1 and 2 emissions in 2025.
Methodology
The carbon footprint reduction target for own operations is disclosed as a percentage of the own operations GHG emissions of the base year. This target relates to scope 1 and 2 own operations GHG emissions, whereby it has not been determined which share of the target is related to scope 1 and which to scope 2 own operations GHG emissions.
The scope 1 and 2 carbon footprint reduction target include the direct emissions of refrigerant usage and leakage, fossil fuels used for heating, the fuel usage of emergency generators, purchased electricity used for office buildings and the vehicle fleet. The scope 2 GHG emissions are calculated using a market-based approach.
The SBTi methodology was followed to set the carbon footprint reduction target for a.s.r.'s own operations. Because of this, the carbon footprint reduction target is considered to be science-based and compatible with limiting global warming to 1.5˚C, but this has not yet been validated by SBTi. Representatives of all the office locations were involved when setting the targets.
The base year was chosen in line with SBTi's best practice to choose the most recent reporting year for which data are available as a base year. The baseline value in 2023 is considered representative because it covers a.s.r.'s most relevant own operations GHG emissions and minimises external factors such as COVID-19. The deadline of this target is set at 2030.
Methodology
Carbon footprint reduction target – financed emission
Scope
This target includes the following financed emissions:
Scope 1 and 2 emissions of internally managed a.s.r. own account investments in government bonds, corporate bonds and equity;
Scope 1, 2 and 3 GHG emissions for home heating and cooling relating to properties 100% owned by a.s.r., rural estates and the properties in funds managed by a.s.r. real estate;
Scope 1 and 2 GHG emissions for heating and cooling of properties for which households have obtained a mortgage loan with a.s.r. and are serviced by a.s.r. either for own account, policyholders or third parties.
This target does not include externally managed a.s.r. own account investments in government bonds, corporate bonds and equity. Other asset classes within the asset management portfolio, affiliated assets and assets managed on behalf of third-party clients are excluded from this target. Bridging loans and saving deposits invested at other parties are not included, as these mortgages are subordinated to other mortgage claims made on the property by other companies.
Methodology
Financed emissions are scope 3 emissions within category 15 investments.
The current carbon footprint reduction target for financed emissions is disclosed as a percentage of the base year GHG emissions per million euros invested.
The financed emissions reduction target is set to cover the period 2023–2030.
To define the carbon footprint reduction target for the asset management portfolio, a.s.r. made use of information from previous results, benchmark requirements and national and international climate objectives and plans. For a.s.r.'s real estate and mortgage portfolio, a.s.r. made use of the CRREM to define its targets. No stakeholders were involved in the target setting.
This carbon footprint reduction target for financed emissions is not entirely science-based nor compatible with limiting global warming to 1.5˚C.
The base year was set in line with SBTI's best practice to choose the most recent reporting year for which data is available as a base year. The base year 2023 is considered representative because it covers the most relevant financed emissions and minimises one-off external factors, such as Covid-19, and includes all relevant activities of Aegon NL for which the acquisitions was completed in 2023.
Targets are based on currently available information, estimates and assumptions, as described in section 6.2.1.7.
Methodology
Carbon footprint reduction target – insurance-associated emissions (P&C)
Scope
This target includes P&C's scope 3 category 15 insurance-associated emissions. In scope are the personal motor lines (specifically the personal car insurance portfolio).
This target does not include any other P&C insurance as no sound methodologies have yet been developed for other insurance products.
Methodology
Regarding progress monitoring and review, as well as metrics utilised, a.s.r. compares the insurance-associated emissions of the reporting year, measured in gCO2 per passenger kilometre, to those of the base year, expressed as a percentage difference at year-end.
a.s.r. developed the intensity-based target for its personal motor portfolio in accordance with the SBTi FINZ standard and the Land Transport Guidance using the SBTi Transport Tool. The target is grounded in a science-based approach to climate change mitigation and supports a reduction pathway compatible with net-zero ambitions by 2050 or earlier. Although the target has not been externally validated, as a.s.r. has currently only committed to set science-based targets under the SBTi FINT standard, it is based on robust data sources and established sectoral standards. The base year was selected in accordance with the SBTi target setting guidance. No external stakeholders were involved in the target-setting process.
Targets are based on currently available information, estimates and assumptions, as described in section 6.2.1.7.
Methodology
Carbon footprint reduction target – insurance-associated emissions (Healthcare sector)
Scope
This carbon footprint reduction is not a.s.r.'s target, but of the healthcare sector, supported by a.s.r. via its Procurement Policy. This target does not include care related to the Long-Term Care Act (Wet Langdurige Zorg – Wlz) as a.s.r. only has an administrative role in long-term care and does not procure long-term care.
Methodology and scope
The joint carbon footprint reduction target includes scope 1 and 2 emissions by healthcare providers and is disclosed as a percentage of the emissions of the base year.
The joint carbon footprint reduction target in the GDDZ 3.0 is in line with the Dutch Climate Action Plan which follows and is aligned with the EU Green Deal on sustainability, aiming at a 55% emissions reduction in 2030 to reach the Paris Agreement to limit global warming to 1.5˚C. The joint target is therefore considered to be science-based and compatible with limiting global warming to 1.5˚C but this has not yet been externally validated. The GDDZ 3.0 was jointly developed and signed by all stakeholders, the branch organisations in healthcare, and the individual health insurers.
Hospitals have been allowed to set their own base year, resulting in no single mutual base year being defined across the sector. A baseline value has been calculated based on these different base years, but it does not fully align with the scope of the target and is therefore also not usable.
As the base year and baseline value cannot yet be determined, a.s.r. cannot yet claim whether they are considered representative.
The deadline to achieve this target is set at 2030.
6.2.1.7 Metrics
The initial step towards achieving the climate objectives is to establish a thorough understanding of the current environmental position. To this end, a.s.r. provides comprehensive reporting on a set of environmental metrics that reflect its performance in managing material climate-related impacts, risks and opportunities. These disclosures strengthen transparency and comparability, thereby enabling stakeholders to assess climate-related risks and evaluate the effectiveness of a.s.r.’s decarbonisation strategy.
Gross scopes 1, 2, 3 and total GHG emissions
The main table provides a breakdown of a.s.r.'s GHG scope 1, 2 and 3 emissions.
E1-6 Gross scopes 1, 2, 3 and total GHG emissions (main table)
| (in tCO2e) | 2025 | 2024 |
|---|---|---|
| Scope 1 GHG emissions | ||
| Gross Scope 1 GHG emissions | 1,128 | 1,888 |
| Scope 2 GHG emissions | ||
| Gross location-based Scope 2 GHG emissions | 3,366 | 4,749 |
| Gross market-based Scope 2 GHG emissions | 8 | 4 |
| Scope 3 GHG emissions | ||
| 1: Purchased goods and services | 60,368 | 73,891 |
| 5: Waste generated in operations | 392 | 827 |
| 6: Business travel | 485 | 542 |
| 7: Employee commuting | 4,069 | 3,688 |
| 15: Investments - financed emissions | 5,960,069 | 6,113,888 |
| 15: Investments - insurance-associated emissions | 245,509 | 300,701 |
| Total gross indirect (Scope 3) GHG emissions | 6,270,892 | 6,493,538 |
| Total GHG emissions (location-based) | 6,275,385 | 6,500,175 |
| Total GHG emissions (market-based) | 6,272,028 | 6,495,430 |
Total GHG emissions (market‑based) across scopes 1, 2 and 3 decreased overall by 3.4% to 6,272,028 tCO₂e (2024: 6,495,430 tCO₂e). All three scopes contributed to this improvement and underlying scope developments are explained below.
Scope 1 emissions decreased further to 1,128 tCO₂e (2024: 1,888 tCO₂e), mainly driven by the closure of office buildings in The Hague, as part of the integration programme, and Rotterdam. In addition, GHG emissions declined due to the phase‑out of the remaining fossil‑fuel lease vehicles. Emissions predominantly originate from gas consumption at office locations outside Utrecht, as the Utrecht headquarters has been gas‑free since 2019.
Scope 2 location‑based emissions declined to 3,366 tCO₂e, reflecting increased procurement of green electricity and ongoing energy‑efficiency measures in office buildings. Market‑based scope 2 emissions remain close to zero (8 tCO₂e), supported by renewable electricity contracts and Guarantees of Origin (Garanties van Oorsprong – GvO) related to energy sales and purchases.
Scope 3 emissions, representing the largest share of a.s.r.’s footprint, totalled 6,270,892 tCO₂e. The decrease compared with 2024 is primarily driven by lower financed emissions and a reduction in insurance‑associated emissions. Emissions from purchased goods and services also declined. Other scope 3 sources remain relatively minor and include emissions from waste generated in operations, business travel and employee commuting. Financed emissions (category 15) remain the dominant component of scope 3.
HumanTotalCare has been included in the metrics as of 1 October 2025, accounting for a total GHG emissions of 1,333 tCO₂e. These emissions mainly relate to purchased goods and services and, to a lesser extent, employee commuting.
a.s.r. used 82% (2024: 81%) primary data in calculating its scope 3 GHG emissions, reflecting slightly more accurate and reliable emissions reporting.
None of the scope 1 GHG emissions were covered by a regulated emission trading scheme.
The following overview provides a breakdown of a.s.r.'s scope 1 and 2 GHG emissions and scope 3 financed and insurance-associated GHG emissions, highlighting which of a.s.r.'s entities and product lines they relate to.
Breakdown GHG emissions per product line
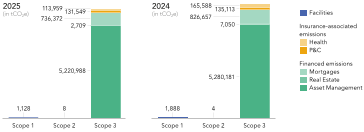
Restatement 2024
Comparative 2024 GHG emissions have been restated from 7,044,180 tCO₂e to 6,500,175 tCO₂e (location-based) and from 7,039,435 tCO₂e to 6,495,430 tCO₂e (market-based). These restatements relate to scope 3 GHG emissions and are further explained under the relevant metrics in this chapter. All financed emissions from downstream leased assets (category 13) amounting to 41,028 tCO₂e in the annual 2024 report have been reclassified to investments - financed emissions (category 15). This change better reflects the characteristics and intended purpose for which a.s.r. holds these properties.
Methodology
Scope 1 and 2
Scope
All scope 1 and 2 GHG emissions from a.s.r.
Methodology
Scope 1 GHG emissions are direct GHG emissions from sources that are owned or controlled by a.s.r., which includes the direct emissions of fossil fuel-based lease cars, refrigerant usage and leakage, fossil fuels used for heating and the fuel usage of emergency generators.
Scope 2 GHG emissions are indirect emissions from the generation of purchased electricity used for office buildings, leased electrical vehicles and IT. Scope 2 GHG emissions are divided in market-based and location-based emissions.
a.s.r. calculates emissions from scope 2 electricity consumption by following the location-based and market-based approaches of the Greenhouse Gas (GHG) Protocol. The market-based emissions take purchased renewable energy into account and assume that regular power is delivered as residual power. The location-based approach uses emission factors specific to the Netherlands, where all of a.s.r.'s locations are situated.
The emission factor for the calculation of the location-based emissions is retrieved from co2emissiefactoren.nl.
a.s.r.’s market-based emission factor is calculated by using the location-based emission factor minus the amount covered by contractual instruments. These contractual instruments consist of bundled instruments such as energy contracts and unbundled instruments like the GvO certificates. These energy contracts or certificates are issued by independent organisations and validate the origin of the renewable energy.
HumanTotalCare is included in the metrics from 1 October 2025 onwards.
Assumptions and limitations
Due to limitations in the data availability for lease cars, a.s.r. does not make a distinction between private and business kilometres and the fuel type. The inclusion of both private and business kilometres in the calculation leads to higher calculated scope 1 and 2 emissions as only business kilometres are required. To cover the emissions associated with refrigerants, a standard leakage of 5% is incorporated in the calculation. The emissions associated with small refrigerators are considered negligible and have therefore been placed out of scope. For the calculation of a.s.r.'s scope 1 and 2 emissions of Robidus, D&S Holding and HumanTotalCare, estimations are made via an extrapolation factor based on m2 surface or number of employees. Corins also used the estimation model to estimate the scope 3 emissions categorie 1 Purchased goods and services.
The percentages of contractual instruments are calculated using a weighted average, with the scope 2 location-based emissions as weighting factor.
Scope 3
Scope
Scope 3 GHG emissions concern the indirect emissions that occur in a.s.r.’s value chain, both upstream and downstream.
Methodology
a.s.r.’s scope 3 emissions are reported in line with the GHG Protocol, which splits the scope 3 GHG emissions into 15 categories. a.s.r. will only report on the significant scope 3 categories in tCO2e. The following scope 3 categories were found not to be material:
Category 2 – Capital goods
Category 3 – Fuel- and energy-related activities
Category 4 – Upstream transportation and distribution
Category 8 – Upstream leased assets
Category 9 – Downstream transportation and distribution
Category 10 – Processing of sold products
Category 11 – Use of sold products
Category 12 – End-of-life treatment of sold products
Category 13 – Downstream leased assets
Category 14 – Franchises
The following scope 3 categories listed below were found to be material:
Category 1 – Purchased goods and services
Category 5 – Waste generated in operations
Category 6 – Business travel
Category 7 – Employee commuting
Category 15 – Investments – financed emissions
Category 15 – Investments – insurance-assocated emissions – downstream
Category 15 – Investments – insurance-associated emissions – upstream
The GHG emissions of its investment properties are reported under scope 3, using the GHG operational control approach. This method reflects the relationship between the asset user and the associated emissions, as a.s.r. does not exercise direct control over these emissions.
Within category 15 – Investments, a distinction is made between financed emissions and insurance-associated emissions, reflecting the different PCAF standards. While category 15 focuses on downstream activities, there is ongoing debate about how to classify upstream emissions from damage repair activities related to insurance policies, hence a separate category is introduced for the upstream emissions within category 15 – Investments.
The percentage of primary data is calculated using a weighted average, with the tCO2e amount as the weighting factor.
The a.s.r. disclosure of emissions related to investments (GHG Protocol scope 3 category 15) is aligned with the reporting requirements of the PCAF Global GHG Accounting and Reporting Standard Part A: Financed Emissions Second Edition (2022).
The following tables provide a split per asset class of a.s.r.'s financed emissions and includes information on data coverage (in %) and data quality. The coverage (in %) indicator shows the proportion of in-scope assets for which the GHG emissions were measured. The data quality score is based on the PCAF data quality scoring approach and gives an indication of the reliability and accuracy of the reported GHG emissions data.
E1-6 Financed emissions (Scope 1 and 2) current year
| 2025 (in tCO₂e) | Total AuM (in € millions) | AuM data coverage (in € millions) | Coverage (in %) | Emission intensity (in tCO₂e per € million invested) | Data quality score1 | |
|---|---|---|---|---|---|---|
| Government bonds | 3,019,949 | 16,535 | 16,101 | 97% | 188 | 1.6 |
| Corporate bonds | 316,606 | 10,463 | 9,914 | 95% | 32 | 1.5 |
| Equity | 122,858 | 4,279 | 3,774 | 88% | 33 | 1.5 |
| Mortgages | 229,736 | 27,454 | 27,454 | 100% | 8 | 3.4 |
| Real estate - constructed | 2,182 | 6,208 | 6,022 | 97% | - | 2.1 |
| Real estate - rural | - | 2,072 | 2,072 | 100% | - | 4.0 |
| Other investments | - | 9,973 | - | 0% | - | - |
| Total own investments | 3,691,332 | 76,984 | 65,338 | 85% | 56 | 2.5 |
| Government bonds | 1,186,857 | 6,633 | 6,572 | 99% | 181 | 1.4 |
| Corporate bonds | 134,541 | 3,697 | 3,457 | 94% | 39 | 1.6 |
| Equity | 440,177 | 17,085 | 16,931 | 99% | 26 | 1.4 |
| Other investments | - | 3,763 | - | 0% | - | - |
| Total investments related to direct participating contracts | 1,761,575 | 31,178 | 26,960 | 86% | 65 | 1.4 |
| Mortgages | 506,636 | 59,670 | 59,670 | 100% | 8 | 3.3 |
| Real estate - constructed | 527 | 2,055 | 2,008 | 98% | - | 2.1 |
| Real estate - rural | - | 526 | 526 | 100% | - | 4.0 |
| Total investments on behalf of third parties | 507,163 | 62,251 | 62,204 | 100% | 8 | 3.3 |
| Total financed emissions (scope 1 and 2) | 5,960,069 | 170,413 | 154,503 | 91% | 39 | 2.6 |
- PCAF data quality score ranging from one to five, with one being the highest quality and five being the lowest.
In 2025, total scope 1 and 2 financed emissions slightly decreased to 5,960,069 tCO₂e, (2024: 6,113,888 tCO₂e). Government bonds remains the largest contributor to absolute emissions.
GHG emission intensity slightly improved from 40 to 39 tCO₂e per million euros invested, driven by the relatively low emissions within the mortgage portfolio and improved emissions from underlying companies and countries.
Total AuM data coverage increased to 91% (2024: 86%), further improving the reliability of the calculations.
The PCAF data quality score improved to 2.6 (2024: 2.8), indicating that data is more reliable compared to the previous year.
E1-6 Financed emissions (Scope 1 and 2) prior year
| 2024 (in tCO₂e) | Total AuM (in € millions) | AuM data coverage (in € millions) | Coverage (in %) | Emission intensity (in tCO₂e per € million invested) | Data quality score1 | |
|---|---|---|---|---|---|---|
| Government bonds | 3,017,269 | 16,421 | 16,032 | 98% | 189 | 1.5 |
| Corporate bonds | 422,523 | 11,099 | 10,473 | 94% | 40 | 2.1 |
| Equity | 108,576 | 3,620 | 3,382 | 93% | 32 | 2.0 |
| Mortgages | 254,515 | 26,438 | 26,438 | 100% | 10 | 3.5 |
| Real estate - constructed | 4,505 | 5,925 | 5,781 | 98% | 1 | 2.1 |
| Real estate - rural | - | 1,505 | 1,505 | 100% | - | 4.0 |
| Other investments | - | 15,784 | - | 0% | - | - |
| Total own investments | 3,807,388 | 80,791 | 63,610 | 79% | 60 | 2.6 |
| Government bonds | 1,141,477 | 6,291 | 6,149 | 98% | 186 | 1.1 |
| Corporate bonds | 150,554 | 3,506 | 3,206 | 91% | 47 | 2.1 |
| Equity | 439,782 | 16,518 | 16,427 | 99% | 27 | 2.1 |
| Other investments | - | 6,493 | - | 0% | - | - |
| Total investments related to direct participating contracts | 1,731,813 | 32,808 | 25,782 | 79% | 67 | 1.9 |
| Mortgages | 572,142 | 59,709 | 59,709 | 100% | 10 | 3.3 |
| Real estate - constructed | 2,545 | 1,838 | 1,707 | 93% | 1 | 2.0 |
| Real estate - rural | - | 460 | 460 | 100% | - | 4.0 |
| Total investments on behalf of third parties | 574,687 | 62,007 | 61,876 | 100% | 9 | 3.3 |
| Total financed emissions (scope 1 and 2) | 6,113,888 | 175,606 | 151,268 | 86% | 40 | 2.8 |
- PCAF data quality score ranging from one to five, with one being the highest quality and five being the lowest.
Restatement 2024
Total scope 1 and 2 financed emissions have been restated from 6,626,024 tCO₂e to 6,113,888 tCO₂e, reflecting a decrease of 512,135 tCO₂e. This change is primarily attributable to real estate assets, where tenant-related emissions, amounting to 514,681 tCO₂e, are no longer reported under financed emissions scope 1 and 2 but have been reclassified to financed emissions scope 3.
While PCAF requires scope 1 and 2 emissions of financed real estate to include occupant energy use, technical guidance from GRESB, PCAF and CRREM1 allows financial institutions to distinguish between scope 1, 2 and 3 emissions of real estate operations. As this approach aligns with market practice and provides clearer insights into the key drivers of real estate emissions, a.s.r. has decided to apply this approach as of reporting year 2025.
In addition, real estate emissions related to third parties (external investors in the real estate funds) have been included for comparability purposes, as these emissions fall within the reporting boundary from 2025 onwards. These third-party real estate emissions are disclosed separately and amount to 2,545 tCO₂e for scope 1 and 2. A reclassification has been applied whereby real estate emissions are now categorised into own investments, direct participating contracts and investments on behalf of third-parties.
Methodology
Data quality score
The data quality score is calculated using a weighted average, with the AuM amount as the weighting factor. The methodology is based on the PCAF standard. A step-by-step manual has been developed and shared with the business lines to guide them in calculating the data quality score. The data quality score ranges from one to five, with one being the highest quality and five being the lowest.
Financed emissions: Category 15 – Investments
Scope
For category 15, a.s.r. reports on financed emissions for its asset management, mortgages and real estate portfolio.
Methodology
The financed emissions from the asset management portfolio include the own account investments and investments on behalf of policyholders, consisting of government bonds, corporate bonds and equities. Investments via funds are allocated to these asset classes via look-through. Other assets such as derivatives, cash and SME loans are not included in the emissions calculation, as there is no emissions data or PCAF methodology available.
The real estate portfolio consists of the investment property portfolio and the real estate equity funds held at fair value through profit or loss.
With respect to the real estate portfolio, the GRESB framework is used for external non-listed real estate investments. For all other financed emissions, the PCAF methodologies are used; Part A 2nd edition (2022).
For the real estate portfolio, a.s.r. uses internal and external data. For all other investments a.s.r. relies on external data from ESG data vendors.
With respect to ASR Dutch Farmland Fund, data is also provided by the Nutrient Management Institute (Nutriënten Management Instituut – NMI). The NMI uses the initiator model to calculate the emissions based on a.s.r.’s investment properties. Developed by scientists from Wageningen University and Research, the initiator model is a publicly available model that gives insight into how carbon behaves and interacts in rural areas. Data coverage for the funds managed by a.s.r. real estate is 99.4% of 2024 data. Missing values are estimated based on postal code area.
Within financed emissions, scope 3 emissions are reported for the asset management and real estate portfolio. For the asset management portfolio, all sectors are included in the disclosure of scope 3 emissions. For the real estate portfolio, landlord-related emissions are reported under financed emissions scopes 1 and 2 and tenant-related emissions are reported under financed emissions scope 31. For the mortgage portfolio, no financed emissions scope 3 emissions are reported in line with PCAF.
Efforts to obtain value chain information
Given the complexity and scale of the investment portfolio, obtaining precise data from all investments is currently not feasible. a.s.r. leverages various standards and methodologies to make estimates for emissions, which are further described in assumptions and limitations. Efforts to improve data include potentially expanding the scope of data collection and improving the granularity of reported data as a.s.r.'s technical capabilities and value chain relationships mature.
Assumptions and limitations
The accuracy and completeness of reported figures depend on the availability and quality of data from a.s.r.’s ESG data suppliers. a.s.r. uses data from MSCI for its GHG emissions calculations of equity and corporate bonds. a.s.r. reports on the carbon footprint associated with government bonds based on the emission reported by states through UNFCC and made available in the PCAF database. a.s.r. currently engages with PCAF about options to gain acces to more up to date emissions data.
The calculation of the real estate portfolio's emissions is based on a combination of actual measurements and model estimations provided by the NMI.
Data coverage of GHG emissions for government bonds, corporate bonds and equity is between 90% and 100%. The GHG emissions of externally managed investments can only be included if look-through data is available.
a.s.r. takes the PCAF methodology into account for estimates based on m2 of a real estate asset, if no direct meter reading was available and no ESG templates were filled in. The external data used from ESG data vendors includes emissions data reported by companies as well as estimations. For the real estate equity funds, the 2025 data is not available in time to be included in the Annual Report 2025 of a.s.r. Therefore the 2024 data is used to calculate the emissions for indirect funds. For the real estate equity funds managed by Amvest, the 2024 data is not available in time. Therefore, Amvest provides a.s.r. with 2023 data to calculate its emissions for indirect funds. Once the 2025 and 2024 data becomes available, it is used to compare to the 2024 and 2023 data and adjust the values in case this is required.
With respect to mortgages, the attribution factor on gas and electricity usage is based on the latest CBS dataset that is used and published in the PCAF database conform PCAF methodology. Assumptions are made when the external data is unavailable, based on object characteristics.
The following table provides government bond emissions data, presented both with and without the inclusion of land use, land-use change and forestry (LULUCF), in recognition of the inherent uncertainties associated with LULUCF reporting.
In the E1-6 Financed emissions (scope 1 and 2) table, figures are presented excluding LULUCF, due to the uncertainties mentioned.
E1-6 Government bond emissions (Scope 1 and 2) including and excluding land use, land use change and forestry (LULUCF)
| 2025 | 2024 | |||
|---|---|---|---|---|
| (in tCO2e) | Excluding LULUCF | Including LULUCF | Excluding LULUCF | Including LULUCF |
| Own investments | 3,019,949 | 3,008,291 | 3,017,269 | 2,954,008 |
| Investments related to direct participating contracts | 1,186,857 | 1,190,049 | 1,141,477 | 1,123,477 |
The table below provides a reconciliation between the AuM used for impact investments (see section 3.1.3.4), financed emissions reporting and the AuM reported in the financial statements (see reference in the note column).
The main differences between the AuM in scope for impact investments and the AuM in the financial statements relates to the externally managed AuM, which is excluded from impact investment reporting.
The difference between the AuM used for financed emissions reporting and the AuM reported in the financial statements primarily results from scope differences: investments on behalf of third parties are included in financed emissions but are not recognised in a.s.r.’s financial statements. The property, plant and equipment category is out of scope for financed emissions, as these assets are largely part of a.s.r.'s own operations (scope 1 and 2). The remaining differences are mainly due to classification differences and specific inclusions or exclusions applied for sustainability reporting purposes.
Reconciliation of AuM with financial reporting information current year
| 2025 (in € millions) | Total AuM in scope for impact investments | Scope differences | Total AuM Financial statements | Scope differences | Classification differences | Other differences | Total AuM in scope for financed emissions | Note Financial statements |
|---|---|---|---|---|---|---|---|---|
| Property, plant and equipment | 353 | 325 | 678 | -678 | - | - | - | 7.5.2 |
| Investment property | 3,220 | - | 3,220 | - | - | - | 3,2201 | 7.5.3 |
| Investments | 76,583 | 2,558 | 79,141 | -3,100 | -2,034 | -244 | 73,764 | 7.5.5 |
| Investments related to direct participating insurance contracts | 14,749 | 18,553 | 33,302 | - | -1,753 | -371 | 31,178 | 7.5.6 |
| Cash and cash equivalents | 2,709 | - | 2,709 | -2,709 | - | - | - | 7.5.10 |
| Investments on behalf of third parties | 4,286 | -4,286 | - | 58,464 | 3,787 | - | 62,251 | |
| Total | 101,900 | 17,150 | 119,050 | 51,977 | - | -615 | 170,413 |
- Included in the E1-6 Financed emissions tables under real estate - constructed and real estate - rural.
Methodology
Reconciliation of AuM with Financial statements
For calculating its emissions in accordance with PCAF, a.s.r. applies a different definition of AuM compared to the definition that is applied for financial statements (International Reporting Standards - IFRS). These differences include scope and valuation. To explain these differences, a.s.r. discloses a reconciliation table.
For instance, in the sustainability statements, the mortgage portfolio is valued at residual debt, whereas in the financial statements, it is primarily valued at fair value. Additionally, mortgages serviced on behalf of third parties are off-balance in the financial statements but included in the emissions calculation. For investment property, the emissions calculation includes AuM allocated in real estate funds, which are categorised as own investments in the financial statements.
The following table provides an overview of a.s.r.'s financed emissions scope 3, comprising all indirect emissions in the value chain in which a.s.r. invests, excluding those covered under scope 1 and scope 2.
E1-6 Financed emissions (Scope 3) current year
| 2025 (in tCO₂e) | Total AuM (in € millions) | AuM data coverage (in € millions) | Coverage (in %) | Emission intensity (in tCO₂e per € million invested) | Data quality score1 | |
|---|---|---|---|---|---|---|
| Government bonds | 2,211,820 | 16,535 | 16,101 | 97% | 137 | 4.0 |
| Corporate bonds | 3,165,392 | 10,463 | 9,914 | 95% | 319 | 2.3 |
| Equity | 1,931,741 | 4,279 | 3,775 | 88% | 512 | 2.3 |
| Other investments | - | 9,973 | - | 0% | - | - |
| Real estate - constructed | 32,693 | 6,208 | 6,022 | 97% | 5 | 2.1 |
| Real estate - rural | 451,450 | 2,072 | 2,072 | 100% | 218 | 4.0 |
| Total own investments | 7,793,096 | 49,530 | 37,885 | 76% | 206 | 3.1 |
| Government bonds | 859,542 | 6,633 | 6,572 | 99% | 131 | 4.0 |
| Corporate bonds | 1,779,552 | 3,697 | 3,461 | 94% | 514 | 2.3 |
| Equity | 6,477,474 | 17,085 | 16,936 | 99% | 382 | 2.3 |
| Other investments | - | 3,763 | - | 0% | - | - |
| Total investments related to direct participating contracts | 9,116,568 | 31,178 | 26,970 | 87% | 338 | 2.7 |
| Real estate - constructed | 10,020 | 2,055 | 2,008 | 98% | 5 | 2.1 |
| Real estate - rural | 124,550 | 526 | 526 | 100% | 237 | 4.0 |
| Total investments on behalf of third parties | 134,570 | 2,580 | 2,534 | 98% | 53 | 2.5 |
| Total financed emissions (scope 3) | 17,044,235 | 83,288 | 67,389 | 81% | 253 | 2.9 |
- PCAF data quality score ranging from one to five, with one being the highest quality and five being the lowest.
Financed emissions from own investments increased due to a variety of factors, including a higher equity exposure within the asset mix and more complete reporting by companies on their respective scope 3 GHG emissions. The increase in data coverage to 81% (2024: 73%) together with improved data quality reflected in higher PCAF scores of 2.9 (2024: 3.6), has resulted in more complete and reliable reporting on financed scope 3 emissions.
There is a risk of double counting the scope 3 financed emissions, as the same indirect emissions can be reported by multiple entities in the value chain. For this reason, these financed emissions are not included in the E1-6 main table.
E1-6 Financed emissions (Scope 3) prior year
| 2024 (in tCO₂e) | Total AuM (in € millions) | AuM data coverage (in € millions) | Coverage (in %) | Emission intensity (in tCO₂e per € million invested) | Data quality score1 | |
|---|---|---|---|---|---|---|
| Government bonds | 2,163,578 | 16,421 | 15,971 | 97% | 135 | 4.0 |
| Corporate bonds | 3,118,442 | 11,099 | 10,355 | 93% | 301 | 3.5 |
| Equity | 1,561,103 | 3,620 | 3,382 | 93% | 462 | 3.5 |
| Other investments | - | 15,784 | - | 0% | - | - |
| Real estate - constructed | 34,722 | 5,925 | 5,781 | 98% | 6 | 2.1 |
| Real estate - rural | 479,959 | 1,505 | 1,505 | 100% | 319 | 4.0 |
| Total own investments | 7,357,804 | 54,353 | 36,994 | 68% | 199 | 3.5 |
| Government bonds | 846,372 | 6,291 | 6,170 | 98% | 137 | 3.9 |
| Corporate bonds | 1,607,624 | 3,506 | 3,197 | 91% | 503 | 3.5 |
| Equity | 6,188,778 | 16,518 | 16,428 | 99% | 377 | 3.6 |
| Other investments | - | 6,493 | - | 0% | - | - |
| Total investments related to direct participating contracts | 8,642,774 | 32,808 | 25,795 | 79% | 335 | 3.7 |
| Real estate - constructed | 9,683 | 1,838 | 1,707 | 93% | 6 | 2.0 |
| Real estate - rural | 121,141 | 460 | 460 | 100% | 263 | 4.0 |
| Total investments on behalf of third parties | 130,824 | 2,298 | 2,167 | 94% | 60 | 2.5 |
| Total financed emissions (scope 3) | 16,131,402 | 89,459 | 64,956 | 73% | 248 | 3.6 |
- PCAF data quality score ranging from one to five, with one being the highest quality and five being the lowest.
Restatement 2024
Total scope 3 financed emissions have been restated from 15,485,897 tCO₂e to 16,131,402 tCO₂e, representing an increase of 645,505 tCO₂e. This increase relates entirely to real estate activities. For comparability purposes, real estate emissions related to third parties have been included, as these emissions will fall within the reporting scope from 2025 onwards. These emissions are disclosed separately and amount to 130,824 tCO₂e within scope 3. In addition, tenant-related emissions, amounting to 514,681 tCO₂e, are now reported separately under scope 3 financed emissions. Previously, these emissions were included under scope 1 and 2. Furthermore, a reclassification has been applied whereby real estate emissions are now specified into the categories own investments, direct participating contracts and investments on behalf of third parties.
The emissions in the table below are direct GHG and indirect GHG emissions of insured clients in the a.s.r. health basic and the a.s.r. health supplementary insurance portfolio and of the commercial lines (excluding construction all-risk (CAR) and the personal motor lines (specifically the personal car insurance portfolio) within the P&C portfolio.
E1-6 Insurance-associated emissions (scope 1, 2 and 3) current year
| 2025 | Total premiums (in € millions)1 | Premiums data coverage (in € millions) | Coverage (in %) | Data quality score2 | |
|---|---|---|---|---|---|
| P&C | |||||
| Personal lines - personal motor (in tCO₂) | 89,057 | 515 | 434 | 84% | 2.0 |
| Commercial lines (excluding construction all-risk, in tCO₂e) | 42,492 | 596 | 554 | 93% | 5.0 |
| Health | |||||
| Health basic and health supplementary (in tCO₂e) | 113,959 | 1,758 | 1,758 | 100% | 5.0 |
| Total insurance-associated emissions (in tCO₂e)3 | 245,509 | 2,869 | 2,745 | 96% | 4.5 |
- Premium amounts ‘personal lines’, ‘commercial lines’ and ‘health’ do reconcile with the consolidated income statement item ‘insurance contract revenue’ in the financial statements.
- PCAF category.
- Emissions from the personal lines – personal motor relate solely to CO₂ emissions, and only this GHG has been included in the total insurance‑associated emissions expressed in tCO₂e.
The absolute reduction in emissions within Personal lines is primarily driven by changes in the portfolio composition, with the shares of both diesel- and petrol-powered vehicles decreasing in favour of electric vehicles. In Commercial lines, emissions have increased mainly due to premium growth of the portfolio. For both scope categories within P&C, the data quality score remained stable.
Health‑related emissions vary in line with the size of the health insurance portfolio, mainly driven by healthcare usage by a.s.r. policyholders and the products purchased by healthcare providers. In 2025, total emissions decreased to 113,959 tCO₂e (2024: 165,588 tCO2e), consisting of 29,730 tCO₂e (2024: 43,614 tCO2e) in scope 1 and 2 and 84,229 tCO₂e (2024: 121,974 tCO2e) in scope 3. This decrease is also due to more accurate, and generally lower, emission factors across key care categories. For both scope categories within Health, the data quality score is 5.0.
E1-6 Insurance-associated emissions (scope 1, 2 and 3) prior year
| 2024 | Total premiums (in € millions) | Premiums data coverage (in € millions) | Coverage (in %) | Data quality score | |
|---|---|---|---|---|---|
| P&C | |||||
| Personal lines - personal motor (in tCO₂) | 96,074 | 541 | 508 | 94% | 2.0 |
| Commercial lines (excluding construction all-risk, in tCO₂e) | 39,039 | 583 | 557 | 96% | 5.0 |
| Health | |||||
| Health basic and health supplementary (in tCO₂e) | 165,588 | 1,489 | 1,489 | 100% | 5.0 |
| Total insurance-associated emissions (in tCO₂e)1 | 300,701 | 2,613 | 2,554 | 98% | 4.4 |
- Emissions from the personal lines – personal motor relate solely to CO₂ emissions, and only this GHG has been included in the total insurance‑associated emissions expressed in tCO₂e.
Restatement 2024
The inputs used for the calculation of scope 3 CO₂e emissions from healthcare procurement across the different types of care for 2024 have been adjusted at national level. As a result, total emissions have been restated from 197,457 tCO₂e to 165,588 tCO₂e.
Methodology
Insurance-associated emissions: Category 15 –Investments
Scope
Insurance-associated emissions for the P&C and health portfolios.
The Disability, Individual life & Funeral portfolios are not recognised as material to the group. Pensions has no insurance-related GHG emissions other than those arising from their investment portfolio.
Methodology
For the emissions calculations, a.s.r. differentiates between its personal motor, commercial and health insurance lines.
The a.s.r. disclosure on insurance-associated emissions for the P&C portfolio is aligned with the reporting requirements of the PCAF Global GHG accounting and reporting standard for the financial industry – part C – insurance-associated emissions 1st edition (2022). Within the P&C insurance-associated emissions, clients’ Scope 1 and Scope 2 emissions are in scope.
For the health portfolio, a.s.r. used the calculation methodology agreed on by the Dutch Health insurance industry to calculate GHG emissions related to the healthcare usage of a.s.r.'s health insurance policyholders and the products purchased by healthcare providers on their behalf. As a consequence, scope 1, 2 and 3 emissions are included. This deviates from the PCAF requirement to disclose client scope 3 emissions separately from client scope 1 and 2 emissions. To also ensure alignment with PCAF requirements, these emissions are disclosed separately in the narrative.
Emissions from healthcare providers are included within category 15 – investments – insurance-associated emissions –upstream. Emissions associated with repair companies are excluded, based on the transitional provision regarding value chain information and the absence of an established methodology.
For personal motor insurance, specifically personal car insurance, two complementary approaches are used to calculate insurance-associated emissions: absolute and intensity-based emissions.
Absolute emissions are calculated by multiplying the average kilometres driven in the Netherlands during the reporting year by the average emissions per kilometre. The result is then multiplied by the international PCAF industry attribution factor. The total insurance-associated emissions for the personal car insurance portfolio are then determined by aggregating these insured emissions in tCO₂.
Intensity-based emissions, introduced in 2025, express total Well to Wheel (WtW) gCO₂ emissions per passenger kilometre. This metric builds on the absolute approach, which calculates total insurance-associated emissions in tCO₂. The Tank to Wheel (TtW) emissions from the absolute metric serve as the foundation, to which Well to Tank (WtT) emissions are added to arrive at the full WtW value. Passenger kilometres are calculated by multiplying the average total kilometres driven per fuel type by corresponding average occupancy factors. The final intensity-based metric is obtained by dividing the total WtW emissions by the total passenger kilometres.
For commercial lines, emissions are calculated by multiplying the average sector emissions in tCO2e per euro by the premium in the reporting year. The total insurance-associated emissions for commercial lines are determined by aggregating these insured emissions.
For the health portfolio, a.s.r. calculates its insurance- associated emissions by multiplying the emission factor per healthcare type with the euros spend on the healthcare type. The emission factors per healthcare type are retrieved from a report by Stichting Stimular, a Dutch sustainability advisory organisation.
Efforts to obtain value chain information
Estimating emissions associated with insurance activities presents challenges due to the diverse nature of insured assets and the limited availability of methodologies for estimating emissions. a.s.r. has used sector-average data and industry benchmarks to provide initial estimates, reflecting a reasonable effort given current data limitations. Efforts to improve data accuracy include collaborating with distribution and services entities to develop standardised reporting frameworks to enhance data collection from insured entities. a.s.r. is committed to progressively refining these estimates as more precise data becomes available.
Assumptions and limitations
Due to data unavailability, P&C's calculation of insurance-associated emissions for commercial and personal motor lines involve several assumptions. For personal motor, a.s.r. cannot take mutations into account and due to the publication timeline of the CBS, there is a delay of one year. For the calculations, a.s.r. assumes that all insured cars have an average emission factor based on fuel type and drive the Dutch average amount of kilometres per year. This emission factor is only available in CO2, not in CO2e. a.s.r. assumes the corresponding occupancy factor to be 1.31. This assumption is based on research published by CO2emissiefactoren.nl. Moreover, the ownership costs in relation to the cost of insurance are unknown to a.s.r. For commercial lines, emissions are estimated using industry averages and related standard business classification (SBI) codes, as detailed client activities and sector-specific premiums are unavailable to a.s.r. As a result, some parts of the emissions calculation are approximated.
The methodology used for the health portfolio is considered the most appropriate methodology. However, due to the diversity in the sector and limited availability of data, the reported scope 3 emissions related to the health portfolio should be considered as a guiding value.
The following tables present a.s.r.'s GHG emission intensity, measured per net revenue, which indicates how efficiently revenue is generated in relation to GHG emissions.
E1-6 GHG Intensity based on net revenue
| 2025 | 2024 | |
|---|---|---|
| Total GHG emissions (location-based) per net revenue (in tCO2e per € million net revenue) | 500 | 560 |
| Total GHG emissions (market-based) per net revenue (in tCO2e per € million net revenue) | 500 | 560 |
| Total GHG emissions (location-based) (in tCO2e) | 6,275,385 | 6,500,175 |
| Total GHG emissions (market-based) (in tCO2e) | 6,272,028 | 6,495,430 |
| Net revenue used to calculate GHG intensity (in € millions) | 12,554 | 11,606 |
The improvement in intensity to 500 tCO2e per € 1 million net revenue reflects the ongoing efforts to reduce GHG emissions in line with a.s.r.'s sustainability targets.
To enhance comparability and better reflect the carbon intensity of investments over which a.s.r. has more direct influence, GHG emissions (market-based) related to government bonds held in own investments are excluded. On this basis, the GHG intensity based on net revenue amounts to 268 tCO₂e per € 1 million invested (2024: 311).
Restatement 2024
Following the GHG emissions restatements in this chapter, the GHG intensity based on net revenue for 2024 has been restated from 607 to 560 tCO2e per € million net revenue.
Methodology
GHG emission intensity
For the calculation of the emission intensity, a.s.r. defines net revenue as the total of insurance contract revenue, direct investment income, fee income and other income related to renewables. a.s.r. complies with the ESRS by dividing the market-based, location-based and total GHG emissions by the net revenue in scope of the GHG emissions calculations.
The emission intensity is determined by dividing the total emissions of the asset class by the assets under management (AuM) data coverage value.
E1-6 Connectivity of GHG intensity based on revenue with financial reporting information
| (in € millions) | 2025 | 2024 |
|---|---|---|
| Net revenue used to calculate GHG intensity | 12,554 | 11,606 |
| Net revenue (other) | 7,242 | 4,907 |
| Total net revenue (in financial statements) | 19,797 | 16,513 |
Methodology
Connectivity of GHG intensity based on net revenue
Scope
The net revenue used to calculate GHG intensity only includes product lines and investment portfolios for which reliable emissions data is available.
This includes the product lines Pensions, Health, and Disability. Within the P&C product line, only the personal car insurance portfolio and commercial lines – excluding Construction All Risk insurances – are in scope. For the Funeral product line, only in-kind funeral insurance policies are considered in scope. For investments, the GHG intensity calculation includes asset classes where emissions can be measured. This primarily covers government- and corporate bonds, equities, mortgages and real estate.
Product lines and portfolios lacking emissions data are excluded from the GHG intensity calculation. This primarily includes derivatives, cash and cash equivalents, and collateral within Asset Management. For Funeral, all products other than in-kind funeral insurance are out of scope. In P&C, portfolios outside of personal car insurance and eligible commercial lines, such as construction all risk insurance, are excluded. The net revenue associated with these out-of-scope items is presented in the table above under the line item 'Net revenue (other)'.
Methodology
GHG intensity based on net revenue is a measure that indicates how efficiently a.s.r. generates revenue in relation to GHG emissions. A lower intensity reflects an improvement.
Total net revenue, based on the consolidated financial statements (see section 7.2.2), consists of the sum of the insurance contract revenue, direct investment income, fee income and other income related to the revenue from wind farms and solar parks.
The methodologies of the other scope 3 categories are explained below.
Methodology
Category 1 – Products and services
Scope
This category includes upstream emissions associated with purchased goods and services by a.s.r. in the reporting year.
Methodology
For the calculation of scope 3 emissions associated with purchased goods and services, a.s.r. selected the spend-based method in line with the GHG Protocol, which estimates emissions for goods and services by collecting data on the economic value of goods and services purchased and multiplying it by relevant secondary industry average emission factors per monetary value of goods. The total spend per supplier is classified according to industry codes, the North American Industry Classification System (NAICS), which is the standard used by federal statistical agencies in classifying business establishments for the purpose of collecting, analysing, and publishing statistical data related to the U.S. business economy. In order to calculate the total CO2 footprint of central procurement, the NAICS model was paired with the US Environmentally-Extended Input-Output, which is a family of models designed to bridge the gap between traditional economic calculations, sustainability and environmental decision-making. To adjust for inflation and differences in currency, a.s.r. converted from USD to euros using the 2022 exchange rate, as well as adjusting the 2022 consumer price index (CPI) to 2025.
Efforts to obtain value chain information
The spend-based method was employed due to the current unavailability of precise value chain information. Efforts to improve value chain information include working more closely with value chain partners to improve data accuracy and reduce reliance on estimates.
Assumptions and limitations
The spend-based method is limited to 80% of total spend within central procurement, which includes the most significant suppliers in terms of total spend. Calculations will be performed per supplier for this 80% of total spend using the mentioned spend-based model. The remaining 20% of total spend relates to smaller suppliers and is extrapolated based on the analysis of the 80% total spend that was covered.
The supplier emissions from D&S entities Corins, D&S Holding and HumanTotalCare are estimated using an estimation model. This model extrapolates the emissions of purchased goods and services per euro spent of central procurement.
Category 5 – Waste generated
Scope
This category covers the emissions associated with the disposal and treatment of waste generated by a.s.r. This includes general waste generated, waste from renovation activities and waste from disposed hardware.
Methodology and scope
In addition to the GHG protocol scope 3 guidance, a.s.r. receives reports stating the kilogrammes per waste type. The data on waste type and kilogrammes are multiplied by the relevant emission factors using the Carbon Manager tool. Corins assign a proportion of the waste generated by the whole building based on m2. D&S Holding, Robidus and HumanTotalCare calculate their emissions from generated waste with the estimation model.
Category 6 – Business travel
Scope
Category 6 of scope 3 emissions includes the emissions related to transportation of employees for business-related activities, not including daily commuting.
Methodology
In accordance with the GHG Protocol, a.s.r. applies the distance-based method to calculate the scope 3 category 6 GHG emissions. a.s.r. includes business travel by car, aeroplane and public transport, as per the claim and reimbursement processes. Travel with NS-Business Cards, hotel stays and taxi rides are out of scope.
Efforts to obtain value chain information
Given current data availability and the complexity of data collection, the distance-based method provides a fair estimation of emissions. a.s.r. aims to improve data quality and availability in the future.
Assumptions and limitations
The calculated emissions are based on travel claims for public transport and transport by car. Even though the emissions per car differ, the average emissions per kilometre from CO2emissiefactoren.nl is used to calculate the emissions of transport by car.
The estimation model was used for D&S Holding and HumanTotalCare.
Category 7 – Employee commuting
Scope
Category 7 covers the emissions associated with employee commuting. The scope is limited in terms of travel modes to car, public transport and motorcycles for a.s.r.'s internal employees.
Methodology
a.s.r. reports on this category in accordance with the distance-based method, as described in the GHG Protocol for scope 3 emissions. a.s.r. used information from the access control system in the office, along with employee declarations of their commuting distances.
Efforts to obtain value chain information
Given current data availability and complexity of data collection, the distance-based method provides a fair estimation of emissions. a.s.r. aims to improve data quality and availability in the future.
Assumptions and limitations
For the calculation of commuting distance, a.s.r. assumes that the distribution of travel modes is in line with insights provided in the National Traveler Survey 2024 (Landelijk Reizigersonderzoek 2024). Other assumptions include that all motor vehicles are calculated as cars and all scooters are included as bicycles. Bicycles with a commuting distance more than 20 km are assumed to have travelled with public transport.
The estimation model was used for D&S Holding and HumanTotalCare.
GHG removals and storage projects
a.s.r. has not developed any projects that result in GHG removals or storage in its own operations, or contributed to any in its upstream and downstream value chain. However, a.s.r. is committed to reaching net zero for its scope 1 and 2 emissions (market based) in its own operations in 2045 in accordance with the DGBC Paris Proof commitment. a.s.r. has also disclosed a net zero ambition by 2045 for its asset management portfolio; a goal that surpasses its commitments as a member of the NZA Initiative, with further scope clarification pending. a.s.r. is also committed to facilitate the transition to a net zero economy by 2050 with its P&C portfolio in line with its participation in the Forum for Insurance Transition to Net Zero (FIT), and to reach net zero by 2045 in its internally managed own account real estate property portfolio in accordance with the DGBC Paris Proof commitment. These net zero ambitions are disclosed in addition to a.s.r.’s emission reduction targets as explained in section 6.2.1.6. a.s.r. has not decided yet on methodologies and how the residual GHG emissions will be neutralised.
Carbon credits
a.s.r. has financed climate change mitigation projects outside its value chain through the purchase of carbon credits.
E1-7 Total amount of carbon credits outside value chain that are verified against recognised quality standards and cancelled or planned to be cancelled in the future
| (in tCO2e unless stated otherwise) | 2025 | 2024 |
|---|---|---|
| Total amount of carbon credits cancelled in reporting year (in tCO2e) | 1,500 | 3,300 |
| Reduction project (in %) | 0% | 0% |
| Removal project (in %) | 100% | 100% |
| Plan Vivo Carbon Standard (in %) | 100% | 100% |
| Share of projects within EU (in %) | 0% | 0% |
| Share of carbon credits that qualify as corresponding adjustments (in %) | 0% | 0% |
| Total amount of carbon credits planned to be cancelled in the future (in tCO2e) | 1,500 | 2,000 |
| Existing contractual agreements | - | - |
| Non-existing contractual agreements | 1,500 | 2,000 |
a.s.r. has cancelled carbon credits to offset scope 1 and 2 GHG market-based emissions from all offices in own operations. Each one of these credits represents the removal of one tCO2e by trees. This climate neutrality claim is accompanied by the carbon footprint reduction target as stated in section 6.2.1.6 and does not impede or diminish a.s.r.'s efforts to achieve its carbon footprint reduction targets.
The carbon credits are provided by Trees for All, which only sells carbon credits from projects certified by Plan Vivo against the Plan Vivo Carbon Standard. The Plan Vivo Carbon Standard makes sure these projects meet strict environmental guidelines. Plan Vivo is also recognised by Milieu Centraal, a Dutch organisation supported by the government.
Internal carbon pricing
a.s.r. does not yet apply an organisation-wide internal carbon pricing scheme. However, a pilot programme has started for new real estate investments to integrate carbon emissions into risk assessments and the investment decision-making process. This pilot will be evaluated in 2026.
- 'Accounting and Reporting of GHG Emissions from Real Estate Operations' Technical Guidance for the Financial Industry provided by GRESB, PCAF and CRREM of March 2023.
6.2.2 Biodiversity and ecosystems
a.s.r. recognises the critical importance of biodiversity and ecosystems to the overall well-being of humankind and a.s.r.'s long-term success. a.s.r. aims to avoid and reduce loss of biodiversity and ecosystems and where feasible, to restore and regenerate biodiversity and ecosystem services by 2030. a.s.r. does this by identifying where its activities have a high impact or dependency on biodiversity and ecosystems and by setting up policies addressing these, by taking concrete actions and by formulating targets.
a.s.r. is an adopter of the Taskforce on Nature-related Financial Disclosures (TNFD) framework. See the reference table in section 9.1.2 to understand which of the disclosures below also meet the disclosure requirements of the TNFD. Additionally, a.s.r. is a member of the Finance for Biodiversity Foundation. See the reference table in section 9.1.3 to understand which of the disclosures below also meet the disclosure requirements of the Finance for Biodiversity Pledge.
The following table presents an overview of the material impacts, risks and opportunities identified, along with the corresponding policies, actions and targets. The purpose of this table is to highlight the linkages and dependencies among these elements. See the SBM-3 table in section 6.1.4.3 for additional information on the impacts, risks and opportunities identified.
3 - Direct impact drivers of biodiversity loss
| Materiality | IRO description | Scope | Policies | Actions | Targets |
|---|---|---|---|---|---|
| 3.1 a.s.r. has a positive impact on addressing direct impact drivers of biodiversity loss, such as water and land use change, by impact investments in its asset management portfolio and promoting and incentivising sustainable farming practices in its real estate portfolio. | Activities related to:
|
|
|
|
| 3.2 a.s.r. has a negative impact on direct impact drivers of biodiversity loss through its investments, financing and insurance activities, which are related to climate change, water and land-use change and (water) pollution. | Activities related to:
|
|
|
|
| 3.3 a.s.r. may have an opportunity to financially benefit from addressing direct impact drivers, such as climate change, water and land use change and pollution, resulting in a value increase of real estate and farmland developed or managed by a.s.r. | Real estate activities |
|
|
|
4 - Impacts and dependencies on ecosystem services
| Materiality | IRO description | Scope | Policies | Actions | Targets |
|---|---|---|---|---|---|
| 4.1 a.s.r. may have a negative impact on ecosystem services as it invests in, finances and insures assets and businesses which are related to the degradation of ecosystem services. | Activities related to:
|
|
|
|
| 4.2 a.s.r. may run financial risks, which result from parties in its asset management, real estate and insurance portfolios with a (very) high dependency or impact on ecosystem services being affected by physical, transition or health risks following from reduced integrity of these ecosystem services. | Activities related to:
|
|
|
|
6.2.2.1 Impacts, risks, dependencies and opportunities
a.s.r. has identified and assessed several biodiversity and ecosystem-related impacts, risks, dependencies and opportunities. During the assessment, the LEAP approach, a framework introduced by the TNFD, was applied. This approach encompasses four steps (Locate, Evaluate, Assess and Prepare). LEAP assessments were performed by Asset Management, Real Estate and P&C in 2024. In 2025, a.s.r. mortgages conducted their first LEAP assessment to determine impacts, dependencies, risks and opportunities in relation to residential living near sensitive nature, such as Natura 2000 sites. a.s.r. health conducted the first two steps of the LEAP approach in 2025.
Impacts
a.s.r. assessed actual and potential nature-related impacts in expert sessions and by using various tools. This resulted in the identification of actual and potential biodiversity and ecosystem-related impacts in the value chains of a.s.r. No material owned or controlled sites were identified throughout the process.
For more information about the process to assess material impacts and the consolidation process, see section 6.1.4.2.
Asset Management
a.s.r. used its biodiversity impact score to identify and assess actual and potential material biodiversity and ecosystem-related impacts in its investment portfolio. The impact score is an accumulation of a score based on the five main drivers of biodiversity loss in relation to economic activities and a score based on location-specific information, looking at the vicinity of a biodiversity-sensitive area to a production site or asset.
Real Estate
a.s.r. used the ENCORE database, combined with expert judgement, to identify actual and potential nature-related impacts in relation to the various real estate business activities. For the real estate funds and own account investments, a.s.r. assessed whether assets are in ecologically sensitive locations. If a property is located within one kilometre of a Natura 2000 area, it is considered a sensitive location. The outcome of the LEAP assessment shows that a.s.r. has significant interactions with nature through its real estate funds and own account investments in residential and commercial real estate, farmland and renewable energy. The evaluation identified both positive and negative impacts arising from these activities. Key negative impacts included GHG emissions, biodiversity loss due to land-use changes and pollution from agricultural practices. Conversely, these negative impacts can be mitigated or converted into a positive impact by the enhancement of biodiversity through sustainable farming practices, investments in ecological features and vegetated surface areas, and the utilisation of biobased materials in construction projects. These initiatives not only mitigate adverse effects but also offer environmental and economic benefits, such as increased property value and improved ecosystem services.
Mortgages
a.s.r. mortgages used the ENCORE database, combined with existing research and expert judgement, to identify the extent of actual and potential biodiversity and ecosystem-related impacts of the mortgage portfolio in its value chain and determine which ecosystem service they have an impact on. If the collateral of the mortgages is located within 1 km of a Natura 2000 area, the impact is measured by the sensitivity of the Natura 2000 area indicated by an impact score. The higher the impact score, the more material the potential negative impact on nature and biodiversity.
P&C
a.s.r. initiated its assessment with the identification of key actors in the downstream value chain of its P&C underwriting activities that may have actual or potential impacts on biodiversity and ecosystems. To support this analysis, a.s.r. used the ENCORE database to determine the extent of these impacts among commercial customers within the downstream value chain of P&C underwriting activities. If a key actor is located within 1 km of a Natura 2000 area, an Impact Score is assigned. This score is based on the sector-specific contribution to nature loss and the ecological sensitivities of the relevant Natura 2000 area.
Health
With regard to healthcare purchasing, in the joint double materiality analysis, the health insurers determined that the stakeholders in the value chain of a.s.r. have a negative impact on water pollution in the Netherlands because (residues of) medicines and chemical products end up in the surface water via the sewer. Health has limited impact on the traceability of raw materials, components and products.
When determining the impacts, a.s.r.'s own activities and the upstream and downstream value chain were mapped and assessed for actual and potential impacts. For the pollution theme, it is clear that the impact mainly takes place in the value chain within healthcare. To obtain these insights, a.s.r. relies on the RIVM method report on the calculation of the effect of Dutch healthcare and a.s.r. health's market share on the environment and the RIVM Sustainability and Health Monitor, among others.
Dependencies
Asset Management, Real Estate, Mortgages, P&C, Health
a.s.r. assessed nature-related dependencies in expert sessions and by using various tools. This resulted in the identification of biodiversity and ecosystem-related dependencies in the value chains.
a.s.r. used the ENCORE database to identify the extent of the actual and potential dependencies on biodiversity in its investments, activities or key actors within the value chain. In addition to assessing the dependencies for own operations of investee companies, a.s.r. also used the value chain information in the ENCORE dataset to assess upstream dependencies. The companies with highest dependencies in their upstream value chain are in the ’Packaged Food & Meats’ industry. For their own operations, 13% has a high or very high dependency on at least one ecosystem service.
If a property held by a.s.r. or the collateral of the mortgage is located within 1 km of a Natura 2000 area providing that ecosystem service or when an activity is deemed to have a material dependency on biodiversity, they are classified as such.
Furthermore, the LEAP assessment underscored the dependencies of a.s.r. real estate's operations on natural assets and ecosystem services. Critical dependencies highlighted included construction materials, soil health, water resources and climate regulation.
a.s.r. initiated its assessment with the identification of key actors in the downstream value chain of its P&C underwriting activities that may have actual or potential biodiversity and ecosystem-related dependencies. To support this analysis, a.s.r. also used the ENCORE database to determine the extent dependencies among commercial customers within the downstream value chain of P&C underwriting activities. If a key actor is located within 1 km of a Natura 2000 area, a dependency score is assigned. This score is based on the sector-specific dependency its sector has on nature loss and the sensitivities for the specific Natura 2000 area.
In addition, a.s.r. assessed the dependencies on ecosystem services for the health insurance activities. This assessment identified specific dependencies in relation to the different stakeholders, as defined in the scoping phase of the LEAP approach, which include the patients that are insured by a.s.r. health, health providers, pharmaceutical manufacturers and waste processing. In the assessment, a.s.r. spoke with experts and examined the impact each stakeholder has on the environment. a.s.r. summarised these impacts for a.s.r. healthcare under a number of impact drivers. Critical dependencies include water quality and availability.
Transition and physical risks and opportunities
Although a.s.r. does not know whether the aforementioned ecosystem services are disrupted or likely to be, a.s.r. has identified transition and physical risks and opportunities resulting from the identified material impacts and dependencies in their value chains during expert sessions. Systemic risks have not yet been considered. a.s.r. has not conducted any consultations with affected communities on sustainability assessments of shared biological resources and ecosystems.
Office locations
While a.s.r. has biodiversity-sensitive areas in its value chain, it does not have offices located in or near biodiversity-sensitive areas. Therefore, it has no direct activities negatively affecting these areas leading to the deterioration of natural habitats and the habitats of species and to the disturbance of the species for which a protected area has been designated. As such, a.s.r. has concluded that it is not necessary to implement biodiversity mitigation measures like those identified in various European directives and national provisions or international standards, with regards to its office locations.
6.2.2.2 Biodiversity and ecosystems in strategy and business model
The resilience of a.s.r.'s strategy and business model in relation to biodiversity and ecosystems is explained in this section.
Time horizons used for the resilience analyses are medium- to long-term horizons. a.s.r. has involved several internal stakeholders in its resilience analyses.
Asset Management
a.s.r. assessed the resilience of its strategy and business model by evaluating the types of (potential) financial risks in its investing portfolio following from the identified high to very high dependencies and impacts in its investment portfolio. This also gave qualitative insight into the physical and transition risks in its value chain. A quantitative assessment of the extent of related financial risks and as such, a full assessment of the resilience of the business model and strategy, has not yet been done.
The scope of the qualitative resilience analysis is the downstream value chain of the strategy and business model of a.s.r. asset management, more specifically, its corporate bonds and listed equity portfolio.
a.s.r. determined the type of (potential) financial risks in its investment portfolio and as such, the resilience of its business model and strategy, on the assumption that investees run certain types of transition and/or physical risks following their (potential) impact and/or dependencies on nature.
The annual qualitative resilience analysis of a.s.r. resulted in the identification of financial risks, such as investment risks (e.g. lower returns on and even stranded assets due to declining biodiversity and ecosystem conditions), transition risks (e.g. increased litigation costs for companies causing biodiversity loss) and reputation risks (when companies receive negative attention or loss of customers due to them causing damage to nature).
a.s.r. aims to make its strategy and business model more resilient to these financial risks through a combination of top-down and bottom-up approaches, such as excluding high-risk activities, engaging with companies in high-risk sectors, investing in impact solutions and using biodiversity criteria when screening and selecting companies to invest in. Risks are also mitigated by spreading investments across geographical areas and asset classes.
Real Estate
a.s.r. assessed the resilience of its strategy and business model by evaluating the type of (potential) financial risks in its property portfolio following from the identified high to very high dependencies and impacts in its value chain. This also gave qualitative insight into the physical and transition risks in its value chain. A quantitative assessment of the extent of related financial risks and as such, a full assessment of the resilience of the business model and strategy, has not yet been done. Therefore no key assumptions were made during the resilience analysis.
The scope of this qualitative resilience analysis is the downstream value chain of a.s.r.'s strategy and business model, in particular, its real estate property, farmland, renewable energy and rural estates.
a.s.r.'s qualitative resilience analysis resulted in the identification of financial risks, such as operational risks (e.g. an increase in material costs due to the decrease of availability of natural resources) and investment risks (e.g. lower farmland and real estate property values due to declining biodiversity and ecosystem conditions).
To mitigate its financial risks and make its business model and strategy more resilient, a.s.r. takes nature related risks into consideration when acquiring, renovating and managing real estate property. The funds management by a.s.r. real estate also invests in ecological features (bird, bat and insect boxes) and vegetated surface area (green roofs, facades and plot area) on, in and around its real estate property. Within the farmland portfolio, a.s.r. invests in landscape elements, contributing to local biodiversity and ecosystems. In the coming years, a.s.r. will further examine where there is the greatest potential for these kinds of initiatives within the property portfolio.
Mortgages
a.s.r. assessed the resilience of its strategy and business model for its mortgage activities by evaluating the type of (potential) financial risks following from the identified relevant impacts and dependencies in its value chain. A quantitative assessment of the extent of financial risks and as such, the resilience of the business model and strategy, has not yet been done.
a.s.r. has not made any key assumptions in its resilience analysis of its mortgage portfolio.
The qualitative resilience analysis of a.s.r. resulted in the identification of physical risks such as flooding or soil degradation, that can reduce collateral values, increase loan-to-value ratios, and create insurance challenges. Mispricing risks arise from insufficient nature-related data, while concentration risk and capital stress may occur if large-scale devaluations hit clustered geographies. Regarding the identified transition risks, both compliance and reputational risks are growing due to stricter regulations and societal scrutiny, and legal exposure exists if financing harms protected ecosystems.
The scope of this qualitative resilience analysis is the downstream value chain of a.s.r. mortgages.
P&C
a.s.r. assessed the resilience of its strategy and business model by evaluating the type of (potential) financial risks in its insurance portfolio following from the identified high to very high dependencies and impacts in its value chain. This also gave qualitative insight into the physical and transition risks in its value chain. In addition, a quantitative assessment was performed, focusing on clients that are located within a 1 kilometre radius of a Natura 2000 area. The geolocation data of these clients are combined with applicable sector- and Natura2000 impact and dependency scores. This resulted in a percentage of a.s.r.’s premium that is exposed to biodiversity risk in relation to total P&C premium.
The scope of these resilience analysis is the downstream value chain of the strategy and business model of P&C, in particular for its commercial customers portfolio.
a.s.r. determined the types of (potential) financial risks in its insurance portfolio, as well as the resilience of its business model and strategy, based on the assumption that insured companies are exposed to certain types of transition risks and/or physical risks. These risks are linked to the companies’ (potential) impact and/or dependencies on nature, based on the sector in which they operate. a.s.r. has not taken into account the individual circumstances or risk mitigation actions of these insured companies as this information is currently unavailable.
Through the qualitative resilience analysis, a.s.r. identified financial risks, such as underwriting risks (e.g. an increase in claims in relation to physical risks such as damage due to flooding when the flood retention ecosystem service has deteriorated), business risks (e.g. companies going out of business temporarily or permanently due to transition risks such as regulation on limiting water use to protect fresh water supply ecosystem services) and reputation risks (e.g. companies choosing not to be insured by a.s.r. if a.s.r. insures companies with significant negative impact on nature).
For the result of the quantitative resilience analysis, see section 6.2.2.7.
a.s.r. has strengthened the resilience of its strategy and business model to nature-related financial risks through various measures. These include short-term contracts only, diversifying its customer base across different sectors, reinsuring the largest risks and adjusting its underwriting policy where necessary.
Health
a.s.r. has not yet evaluated the type of (potential) financial risks in its health portfolio following the identified high to very high dependencies and impacts in its value chain. Therefore, it has not yet assessed the resilience of its strategy and business model.
6.2.2.3 Nature transition plan
a.s.r. has incorporated nature into its Climate and Nature Transition Plan, aiming to improve the alignment of its business model and strategy with the vision of the Kunming-Montreal Global Biodiversity Framework and its relevant goals and targets as well as the Nationaal Biodiversiteit Strategie Actieplan Nederland 2025-2030, which includes a Biodiversity Plan for the European Netherlands.
The scope of the Transition Plan includes a.s.r.’s activities in its upstream and downstream value chains, with due consideration of the material biodiversity-related impacts, risks and opportunities identified through nature-related LEAP assessments and how the relevant business lines respond to those risks.
The interaction between a.s.r.’s strategy and its Transition Plan is clearly described, including showing how relevant business lines contribute to tackling biodiversity and ecosystem impact drivers through planned mitigation actions, following a.s.r.'s align, collaborate, transition strategy which corresponds with the nature mitigation hierarchy's avoid, reduce and restore levels.
The Climate and Nature Transition Plan outlines and quantifies material funding allocated to support the implementation of the Plan, albeit that most of the current OpEx and the CapEx are part of the regular expenditures and have not been separately specified.
a.s.r.’s economic activities are not covered by delegated regulations on biodiversity under the EU Taxonomy Regulation and as such, a.s.r. currently has no objectives or plans to further align these activities with the criteria set forth in those regulations. The Transition Plan does not include the use of biodiversity offsets.
The Transition Plan also provides information on how its implementation and ongoing updates are managed, including the methods used to measure progress. It also acknowledges the current challenges and limitations faced during its development. The Transition Plan has been approved by a.s.r.’s administrative, management and supervisory bodies.
Although the Transition Plan does not explicitly reference the targets from the EU Biodiversity Strategy for 2030, it does relate to a.s.r.’s strategic pillar ‘Sustainable Living and Climate’, which supports Sustainable Development Goal 15, focused on protecting, restoring, and promoting the sustainable use of terrestrial ecosystems, sustainably managing forests, combating desertification, and halting and reversing land degradation and biodiversity loss.
6.2.2.4 Policies
a.s.r. identified that it contributes to direct impact drivers and that it has impacts and dependencies on ecosystem services in its investment portfolio, including its real estate and mortgage portfolios, and insurance portfolio. In order to manage impacts, risks, dependencies and opportunities that are related to biodiversity and ecosystems, the following policy documents are relevant:
The Policy on Responsible Investments;
The ESG Policy of a.s.r. real estate;
The Policy on Sustainable Insurance;
Health Procurement Policy.
a.s.r. has not adopted a policy covering operational sites owned, leased or managed in or near a protected area or a biodiversity-sensitive area outside protected areas as a.s.r. does not have any such sites.
The management teams of the involved product lines are accountable for the implementation of the policies, including monitoring their effectiveness.
Through implementing the Policy on Responsible Investments and the Real Estate Biodiversity Framework, a.s.r. commits to respecting the Finance for Biodiversity pledge, which a.s.r. has signed. The TNFD framework is also respected through the implementation of a.s.r.’s nature-related policies.
Asset Management 3.13.24.14.2
The Policy on Responsible Investments sets out a framework for integrating ESG factors into all investment decisions, as described in section 6.2.1.4.
Biodiversity and natural resources is one of the four focus themes in the Policy on Responsible Investments: a.s.r. aims to contribute to the protection and restoration of the planet's biodiversity and promote the sustainable use of its natural resources. The thematic position paper Biodiversity & Natural Resources complements the policy by setting out the approach in more detail.
These two publications provide a framework for the exclusion of companies with severe and repeated controversies related to the environment and specific business activities that have a potential negative impact, such as uncertified palm oil and timber, and for active ownership activities. This framework helps to identify the main impact drivers of biodiversity loss and the loss of ecosystem services within a.s.r.'s investment portfolio. The policy actions to address these impacts are based on the drivers for biodiversity loss and the sectors with the highest impact and dependencies on biodiversity and ecosystems.
The policy supports the traceability of products, components and raw materials with significant actual or potential impacts on biodiversity and ecosystems along the value chain and addresses deforestation, as a.s.r. excludes:
Companies producing or distributing palm oil where less than 95% is certified to the most stringent Roundtable on Sustainable Palm Oil standards. Traceability is an important element of certification.
Companies managing forests with less than 60% Forest Stewardship Council certification coverage (or an equivalent certification). Traceability is an important element of certification.
In addition, a.s.r. screens all companies in its investable universe bi-annually on multiple other criteria to reduce the potential negative impact on biodiversity and ecosystem services and to address the financial risk a.s.r. may run as a result of depreciated assets.
The policy addresses production, sourcing or consumption from ecosystems that are managed to maintain or enhance conditions for biodiversity by including screening criteria for adherence to international guidelines, such as the UN Global Compact, EU regulations, UNESCO Biosphere Reserves, the Convention on International Trade in Endangered Species and UN Convention on Biological Diversity. For addressing social consequences of biodiversity loss and ecosystem-related impacts, the screening criteria include the adherence to UN Global Compact, Equator Principles and UNGPs. a.s.r. excludes companies with severe violations of Global Compact environmental requirements. For sustainable land or agriculture practices, the screening criteria include adherence to international certification schemes, minimising the use of external inputs such as fertilisers and soil management measures. In addition, the screening includes criteria on sustainable oceans or seas, such as adherence to Marine Stewardship Council and its Chain of Custody standards, and aquaculture Stewardship Council certification. The policy also addresses deforestation.
a.s.r. makes use of various tools to help companies and customers reduce harm and drive change. a.s.r. uses its leverage through active ownership (engagement and voting), exclusions, ESG integration and impact investing.
As part of the active ownership strategy, a.s.r. engages companies via bilateral or collaborative engagements. In such engagements, time-bound engagement objectives are set at the beginning of the process. If insufficient progress is achieved during these engagements, a number of tools can be used, as defined in the Policy on Responsible Investments. Collectively, these tools form the engagement escalation framework. The engagement service provider Hermes EOS engages companies on behalf of a.s.r., making a substantial contribution to a.s.r.’s engagement activities. In these third-party engagements, Hermes EOS is responsible for the engagement strategy and monitoring progress.
Real Estate 3.13.23.34.14.2
The general objective of the ESG Policy of a.s.r. real estate is to reduce negative impacts and manage risks in relation to biodiversity and ecosystems. The ESG Policy of a.s.r. real estate aims to counter the negative impact on direct impact drivers of biodiversity loss and manage impacts and dependencies on ecosystem services.
First, the policy addresses the interconnected challenges of biodiversity loss and climate change. The carbon reduction strategy of a.s.r. real estate aims to reduce the GHG emissions of AuM in line with the Paris Agreement targets. Second, the policy aims to counter the impact of natural resource exploitation by addressing the use of sustainable, and preferably biobased, materials in construction and renovation projects. The ESG Policy of a.s.r. real estate also addresses the impact and dependencies on ecosystem services by, for example, integrating nature-based solutions for rainwater runoff and heat regulation, to mitigate the impact of extreme weather events by vegetation.
In rural areas, a.s.r. promotes healthy soil and landscape elements, making the countryside more resilient and valuable. In addition, a.s.r.'s policy, actions and targets on biodiversity and ecosystems for the real estate funds and own account investments are tailored to the different activities and sectors in which it operates. These specific policies, actions and targets are described under the corresponding paragraphs in this chapter.
The scope of the ESG policy includes all non-listed sector property funds managed by a.s.r. real estate and the separate accounts managed on behalf of a.s.r.
The ESG Policy of a.s.r. real estate supports the traceability of products, components and raw materials with significant actual or potential impacts on biodiversity and ecosystems along the value chain by actively promoting the use of sustainable and preferably biobased materials in construction and renovation projects. This thereby reduces the negative impact, or preferably enhances biodiversity, in areas where these raw materials are sourced. Only certified wood is used within construction and renovation projects to limit contribution to deforestation.
a.s.r. has not adopted a sustainable oceans or deforestation policy for its real estate assets, as a.s.r. does not have properties in those areas. The policy does not address the social consequences of biodiversity and ecosystems-related impacts.
Real estate property
Working in collaboration with an external ecologist, a.s.r. developed a framework that includes quantitative and qualitative guidelines to increase natural variation on and around assets. This policy is integrated into acquisition and renovation plans, ensuring that biodiversity is considered in the relevant aspects of asset and property management. For example, the implementation of nature-based solutions and bio-based materials in construction and renovation projects aims to strengthen local biodiversity and reduce the impact of land-use change in the built environment. By focusing on both quantity and quality, the policy provides guidelines to increase the share of vegetated area and seize nature-related opportunities.
Farmland and rural estates
The conversion of natural areas into agricultural land, along with the use of pesticides and fertilisers and the employment of intensive farming practices, can lead to a decline in biodiversity, water quality and soil quality. To counter these impacts, farmers who lease agricultural land managed by a.s.r. real estate are actively encouraged to implement sustainable farming practices, such as the use of crop rotation and nitrogen-fixing plants. To support their sustainability efforts, a.s.r. also aims to contribute financially and reward farmers for the transition they are making. Green lease products are available to all clients, with both new and existing contracts, and provide a discount (5–10% on the annual rent) if a farmer commits to a set of sustainable farming criteria. These criteria include the implementation of biodiversity measures in line with the Dutch government's Nature and Landscape Index and the cultivation of leguminous or bio-based crops in the cropping plan.
In addition, a.s.r. directly invests in landscape elements on farmland and rural estates such as trees, pond habitats, hedgerows and flower meadows. These elements play a crucial role in promoting biodiversity due to key benefits such as landscape connections, preservation of native species and attracting pollinating insects.
Renewable energy
Although a.s.r. is not involved in the planning, development or construction of solar and wind farms, an environmental impact assessment is required by the government to understand the potential impacts on local nature and define measures to manage these impacts. An example of a measure is a bat protection system that is installed at wind parks, which automatically switches off wind turbines if the risk of bat collision is high. Compliance with laws and regulations, including biodiversity regulations, is part of a.s.r.'s due diligence process when acquiring renewable energy assets.
Mortgages
a.s.r. mortgages recognises that the preservation and restoration of biodiversity is essential for the value and affordability of homes, the financial health of customers and the resilience of the mortgage portfolio.
At this stage, a.s.r. mortgages does not yet have a dedicated biodiversity policy for the mortgage portfolio. The preservation and restoration of biodiversity is recognised as an important topic, but further research and analysis are necessary to fully understand the specific risks and opportunities related to mortgages. a.s.r. will continue to monitor developments in legislation, sector standards and scientific insights, and will engage with stakeholders to gather the knowledge required for effective policy development. Once sufficient information is available, a.s.r. will incorporate biodiversity into the existing mortgages transition plan, including objectives and actions.
P&C 3.24.14.2
The general objective of the Policy on Sustainable Insurance is to reduce negative impacts and manage risks, including those in relation to biodiversity and ecosystems. The policy outlines principles for sustainable underwriting, insuring the transition and frameworks for sustainable product development and sustainable claims adjustment.
All of a.s.r.'s non-life and life insurance products and services are in scope of the Policy on Sustainable Insurance.
a.s.r. identified that its P&C value chain contributes to direct impact drivers and has both impacts and dependencies on ecosystem services. For repairable claims, the policy focuses on repair by certified sustainable repair network companies, instead of replacing damaged items. Certification criteria include restrictions on the use of toxic car paint, which is a known impact driver of biodiversity loss, among other criteria. In addition, the policy stimulates the insurability of new sustainable business operations and production processes through the sustainability desk, thus aiming to help high impact/dependency customers who run material transition/physical risks to transit to such new business operations and production processes and reduce their impact/dependency on ecosystem services.
Material biodiversity and ecosystem-related impacts leading to financial risks are mitigated by a set of exclusion rules. These exclusions aim to avoid insuring companies with a significant impact on climate change and thus on biodiversity and ecosystem loss, such as producers of thermal coal and unconventional gas and oil. Producers of conventional energy products are required to commit to the Paris Agreement target and to have a transition plan. For other companies with substantial operations in the value chain of the fossil fuel industry or in a sensitive sector, an ESG risk assessment is required. The policy on sustainable insurance also addresses material dependencies as well as transition and physical risks, by providing a framework to encourage the development of insurance products tailored to emerging nature-related risks faced by customers.
The policy on sustainable insurance does not address production, sourcing or consumption from ecosystems that are managed to maintain or enhance conditions for biodiversity. Nor does it address social consequences, as the focus is on other topics that are currently deemed more important. The policy does not address the traceability of products, components and raw material with material actual or potential impacts on biodiversity and ecosystems along the value chain. However, the certifications of repair companies in a.s.r.'s network contain criteria with regards to the use of raw materials in repair processes. a.s.r. has not adopted a sustainable oceans or deforestation policy for its P&C activities.
Health 3.24.2
To mitigate financial risks from parties in its insurance portfolios that are highly dependent on ecosystem services and exposed to physical, transition or health risks, a.s.r. has implemented a Health Procurement Policy. Additionally, a.s.r. supports the sectoral implementation plan GDDZ 3.0 and the Chain Approach to Medicine Residues from Water. This plan, available on the ZN website, aims to reduce the environmental impact of medication use in Dutch healthcare, such as water pollution, which is in line with the outcome of a.s.r.'s LEAP assessment.
Healthcare providers and supply chain stakeholders, including suppliers, are key to implementing sustainable water use and pollution reduction. Through its Healthcare Procurement Policy, a.s.r. encourages reduced medicine use, waste minimisation, and appropriate prescribing and dispensing. The Healthcare Procurement Policy does not address social consequences, as the focus on the other topics are currently deemed more important.
Where possible, monitoring is based on the RIVM Sustainability and Health Monitor. To minimise administrative burden, consistent action by health insurers is essential. Relevant topics are detailed annually in the Healthcare Procurement Policy, published by 1 April of the preceding year for each type of care.
ZN is ultimately responsible for the development of the sustainability policy, the management team of a.s.r. health is responsible for the implementation of the sustainability policy within the procurement policy and processes of a.s.r.
6.2.2.5 Actions
Actions and resources related to biodiversity and ecosystems
a.s.r. has taken several key actions that contribute to the achievement of biodiversity and ecosystems-related policy objectives and targets.
a.s.r. has not used biodiversity offsets in its action plans and has not incorporated local and indigenous knowledge into biodiversity and ecosystems-related actions. However, a.s.r. has used some nature-based solutions in its actions.
Key actions of Asset Management 3.13.24.14.2
Key actions taken include impact investments, active ownership and investment exclusions. a.s.r. invests in solutions and new technologies for improving biodiversity in line with its impact investing framework to create positive impact. Through the key action of engaging and voting, a.s.r. aims to improve investees’ policies and implementation of measures to mitigate negative biodiversity impacts. Where possible, a.s.r. collaborates within sector initiatives to drive change, such as through the Dutch Association of Insurers and the Sustainable Investing Platform of the Dutch Central Bank. In collaboration with the Plastic Soup Foundation and Earth Action, a.s.r. has developed a methodology to measure the plastic footprint of its investments. The outcome of this assessment will help in prioritising active ownership efforts.
The scope of the activities, as set out in the Policy on Responsible Investments, is all assets under management by a.s.r. asset management, though actions differ between asset classes. Active ownership activities are primarily undertaken in connection with the listed investments managed by a.s.r. asset management. Separate engagement activities have their own timelines. But the focus on active ownership is ongoing. a.s.r. discloses progress on its active ownership on its website through voting dashboards and engagement reports.
Key actions of Real Estate 3.13.23.34.14.2
Key actions include formulating strategic action plans, identifying prospective assets, using bio-based materials, investing in landscape elements, partnering with stakeholders, using green lease products and supporting biodiversity restoration projects. The scope of these key actions includes all non-listed sector funds managed by a.s.r. real estate and the separate accounts managed on behalf of a.s.r., assigned to the main sectors in which a.s.r. invests (real estate property, farmland and rural estates, renewable energy).
The key actions will be completed within the time horizon of the business plan and associated ESG policy of the funds managed by a.s.r. real estate, therefore before the end of 2028. The actions for assets directly managed on behalf of a.s.r. (separate account) will also be completed before the end of 2028.
Real estate property
In addition to integrating the Biodiversity Framework into day-to-day operations, a.s.r. identified land artificialisation as a quantitative metric to gain additional insight into the share of non-vegetated surface area compared to the total surface area of the plots of all assets. A baseline analysis was conducted in 2024 for the funds managed by a.s.r. real estate. The insights obtained from this analysis are used to formulate a strategic action plan and identify prospective assets for enhancing the potential ecological value of the portfolio. These funds have set an annual target to develop ecological plans for promising assets. Recommended ecological features, such as bird, bat and insect boxes, and vegetated surface areas, such as green roofs, facades and plot areas, will be installed where feasible, taking into consideration project-specific budget and technical constraints.
To counter the impact of natural resources exploitation, a.s.r. actively promotes the use of sustainable, and preferably bio-based, materials in construction and renovation projects, thereby reducing the negative impact, or preferably enhancing biodiversity, in areas where these raw materials are sourced. Only certified wood is used within construction and renovation projects to limit contributions to deforestation.
Farmland and rural estates
a.s.r. will continue to contribute to local biodiversity restoration through investments in landscape elements on both farmland and rural estates. It contributes by partnering with tenants through the realisation of forests, pond habitats, hedgerows and flower meadows. By promoting and preserving landscape elements, a.s.r. can help increase biodiversity, enhance agricultural productivity, and produce healthy food in a manner that respects and protects the environment.
Alongside the realisation of these landscape element projects, a.s.r. will continue to partner with different stakeholders to broaden knowledge regarding biodiversity restoration. These partnerships range from cooperation with strategic partners to gain insight into the quantification of efforts for reporting purposes, to a longitudinal collaboration with the HAS Green Academy to examine the actual effects of wooden landscape elements on soil and water systems and local biodiversity.
Green lease products will be made available to all clients on farmland and rural estates, with both new and existing contracts, and provide a discount (5–10% on the annual rent) if a farmer commits to a set of sustainable farming criteria. One of these criteria is the implementation of biodiversity measures in line with the Dutch government's Nature and Landscape Index or, if there is cultivation of leguminous or bio-based crops, in the cropping plan.
Biodiversity and ecosystem restoration projects are implemented in the rural estates managed, demonstrating a commitment to preserving and enhancing natural habitats to protect nature on these properties. The ambition is to create an integrated climate plan for forest and nature management for all relevant estates. Landgoed 'De Utrecht' plays a leading role and, together with 'De Bosgroep', has developed a climate (action) plan. The implementation of this plan will be further conducted during the upcoming period. At Landgoed 'Junne', a design plan for Natura 2000 was implemented in 2022 and further nature restoration measures will be undertaken during the upcoming period.
Renewable energy
There are no material actions for renewable energy yet.
Key actions of Mortgages
To get a better understanding of the actions a.s.r. can take, a.s.r. participates in the sector agreement ‘Natuurinclusief Wonen’ with other sector peers to see what is needed to create a nature-inclusive framework.
Currently, a.s.r. mortgages informs customers about the importance of biodiversity and its relationship to property value, climate adaptation and liveability, using its sustainable living platform. On this platform, a.s.r. helps visitors by sharing other people's experiences and practical tips for sustainable living, for example how to install a green roof. The sustainable living platform aims to engage the general public, including a.s.r. customers. New content is added to the platform regularly throughout the year.
Currently, a.s.r. monitors the portfolio's exposure to physical risks, such as flooding, soil erosion, and heat stress, using location data and external sources (including Natura 2000 and ENCORE). In the coming years, concrete objectives and measurable KPIs will be formulated for biodiversity within the mortgage portfolio.
Key actions of P&C 3.24.14.2
To drive positive change, a.s.r. collaborates with industry peers and civil society in sector initiatives, including actively participating in the PSI Working Group for Nature. This multi-stakeholder platform aims to advance risk management and insurance strategies, approaches, practices, products, services and solutions that address nature-related dependencies, impacts, risks and opportunities. The objective is to value, conserve, restore and responsibly use biodiversity and ecosystem services. The Working Group also aims to contribute to the mission of the Kunming-Montreal Global Biodiversity Framework to halt and reverse nature loss by 2030, and its vision of a world living in harmony with nature by 2050. The Working Group published its first report, Rooted in risks, in June 2025 as part of the nature uncovered series, followed by its second report, Breaking Ground, in October 2025.
a.s.r. engages with stakeholders to encourage the prevention of further nature loss and to mitigate risks related to the degradation of ecosystem services. This is done through the sustainable living platform, where a.s.r. shares practical tips and customers experiences on sustainable living, such as installing green roofs. The platform is designed to engage the general public, including a.s.r. customers. New content is published regularly throughout the year.
a.s.r. is currently developing a programme to engage its commercial clients on the topic of biodiversity. For more information, see section 6.2.2.6.
Key actions of Health 3.24.2
To support a nature-positive healthcare sector, a.s.r. applies integrated measures to reduce the nature-related impact of medication use. The Health Procurement Policy is a key instrument for achieving less nature use.
a.s.r.’s Health Procurement Policy is aligned with GDDZ 3.0 and has been communicated to relevant stakeholders. This includes the implemented 2025 policy and the draft version for 2026.
Focus points for a.s.r. related to nature in 2025–2026:
CareCycle HUBs a.s.r. is scaling up the reissue of incontinence products, thereby preventing the destruction of products that are still usable and conserving resources. By avoiding the disposal or destruction of unused materials, the initiative reduces GHG emissions that would otherwise be generated.
Green Mental Health Care a.s.r. is starting a pilot on greening mental healthcare facilities and providing therapy in nature to promote mental health and sustainable healthcare environments.
Urine collection bags a.s.r. is exploring the possibilities of deploying environmentally friendly contrast fluid disposal via special bags to prevent sewage and groundwater contamination.
In addition, a.s.r. actively contributes within the ZN context by drafting the sustainability-policy and coordinating it with various stakeholders. The sustainability policy is incorporated into the purchasing policies of individual health insurers, such as the Health Procurement Policy, applicable to healthcare providers and supply chain stakeholders, including suppliers. In 2025, the sustainability policy was further improved. Hence, the Health Procurement Policy was also updated in alignment with the updated ZN sustainability policy.
Measures include:
Stimulation through healthcare purchasing:
Specialist medical care: Hospitals must implement action plans to reduce medicine waste and excess use, based on proven interventions selected by the Dutch Hospitals Association and NFU.
Mental healthcare: Targeting a 20% reduction in medication waste and use by 2026 compared to 2023.
Pharmacies: Promoting appropriate use and reuse of home medications, patient education on returning unused medicines, and guidance for prescribers and patients.
General practitioners: The 2025 policy emphasises appropriate prescribing, phasing out medication, selecting medicines with lower environmental impact, and using non-pharmacological interventions. A pilot is being explored to assess financial incentives for general practitioners to evaluate prescribing practices.
Sustainability part of preference policy:
Sustainability is a criterion in selecting preferred medicines and products, where data is available.
As per ZN implementation plan (Article 6.2e), drafted in response to the GDDZ 3.0, health insurers will, in collaboration with the Dutch Hospitals Association and NFU, define purchasing criteria in order to value manufacturers and medicines with lower climate and environmental impact (Article 6.2g).
In the coming years, information on environmental impact, water use and packaging will be collected in a central database accessible to all health insurers. This data will enable more sustainable choices in the future.
6.2.2.6 Targets
Targets related to biodiversity and ecosystems
a.s.r. has adopted several targets to support its biodiversity and ecosystem policies and address its material related impacts, dependencies, risks and opportunities.
E4-4 Biodiversity and ecosystems
| Base year | Baseline value | 2024 | 2025 | Target year | Target value | External frameworks | |
|---|---|---|---|---|---|---|---|
| Asset Management | |||||||
| Identification of companies with highest plastic footprint (in %) | 2024 | 0% | 0% | 100% | 2026 | 100% | FfB1 |
| Engagement with portfolio companies in high-impact sectors (in %) | 2024 | 0% | 0% | 71% | 2026 | 100% | FfB |
| Real Estate | |||||||
| Fund target to set quantitative portfolio targets (in %) | 2024 | 0% | 0% | 67% | 2027 | 100% | FfB |
| P&C | |||||||
| Formulate reach of commercial client information and inspiration programme (in steps)2 | 2025 | - | - | - | 2027 | 5 | FfB |
| Set up commercial client Natura-2000 active engagement programme (in steps)3 | 2025 | - | - | - | 2027 | 5 | FfB |
- Finance for Biodiversity Pledge. The pledge has been signed for asset management and real estate activities.
- Stewardship action to decide on the amount of commercial clients and their advisors near biodiversity sensitive areas to be reached by engagement actions to inform and inspire about reducing biodiversity loss and nature restoration.
- Stewardship action to set-up, test and decide on the reach of the Natura-2000 engagement programme, based on the results of the biodiversity assessment, to actively engage with commercial clients and their advisors.
As climate change and biodiversity are strongly connected, Asset Management, Real Estate, Mortgages and P&C also put great effort into reaching their climate targets as this will have a positive effect on halting biodiversity loss as well. For a full description of the carbon footprint reduction target, see section 6.2.1.6.
Asset Management 3.13.24.14.2
a.s.r. aims to reduce harm, drive change and create positive impact in order to halt further nature loss and, if possible, improve the state of nature. To establish this, a.s.r. set targets related to engagement with portfolio companies in high-impact sectors on biodiversity action plans and the identification of companies with the highest plastic footprint. The targets support the key actions by either focusing on those investments that are at risk of having a high negative biodiversity impact or increasing insight into this impact. The impact investment target and the carbon footprint reduction target also contribute to this goal. For a full description of the impact investment target and the the carbon footprint reduction target, see section 6.2.1.6.
The target on the identification of companies with the highest plastic footprint is to develop a plastic footprint methodology that will provide insight into environmental impact of plastic pollution and the health impact of micro-plastics.
In 2025, this target was achieved as a.s.r. developed a methodology in collaboration with Earth Action and the Plastic Soup Foundation and has applied it to its investment portfolio.
The target on engagement is to engage with all relevant high-impact companies by the end of 2026 on having a biodiversity action plan.
In 2025, a.s.r. engaged with 71% (2024: 0%) of relevant companies in high-impact sectors, in line with the initial plan.
Methodology
Targets related to biodiversity and ecosystems
Scope
Listed equity and corporate bonds are in scope of both targets. The geographical scope is global, in line with a.s.r. asset management's investments.
Methodology
No biodiversity offsets were used when setting these targets.
At this point, there is no scientific agreement on target setting frameworks for nature for investment portfolios. a.s.r. took into account scientific evidence on the status and issues related to biodiversity loss in analysing impacts and setting the targets.
a.s.r. involved both internal and external stakeholders in its target setting, to determine materiality of the targets and the alignment with standards such as the Finance for Biodiversity Pledge.
The targets can be allocated to the 'avoidance' layer of the mitigation hierarchy.
Identification of companies with highest plastic footprint
The identification target is measured by the extent to which a plastic footprint methodology is developed that will provide insight into both the environmental impact of plastic pollution and the health impact of micro-plastics.
Engagement with portfolio companies in high-impact sectors
The target on engagement with portfolio companies in high-impact sectors is measured as a percentage of total identified relevant companies.
To support the EU Biodiversity Strategy for 2030, the Kunming-Montreal Global Biodiversity Framework was used in developing the target.
High-impact sectors are those with the highest potential negative biodiversity impact. To identify companies in high impact sectors, a.s.r. asset management used data from ENCORE and MSCI.
Ecological thresholds (biodiversity sensitive areas) and allocation of impacts (proximity of more than three assets within 1.5 km of a biodiversity sensitive area) were applied to the target on engaging with high-impact companies. Biodiversity sensitive areas are identified as healthy forests (based on the Forest Landscape Integrity Index), intact biodiversity areas (based on Mean Species Abundance value), prime areas for conservation (based on the Global Safety Net) and deforestation fronts (based on WWF Terra-i). No entity-specific thresholds were determined, and there has been no specific allocation of the responsibility for respecting the identified ecological thresholds.
Real Estate 3.13.24.14.2
a.s.r. real estate has set a target related to managed funds setting their own biodiversity-related portfolio targets, such as the number of ecological plans, green leases and landscape elements projects and the promotion of climate-positive crops. By setting these targets, the funds are stimulated and supported to set portfolio targets that aim to reduce the fund's impact and dependencies on ecosystem services, mitigate financial risks where feasible and to seize nature-related opportunities. In addition, the carbon footprint reduction target for the real estate portfolio also supports the aim to halt further biodiversity loss. For a full description of the carbon footprint reduction target in the real estate portfolio, see section 6.2.1.6.
The 2027 target is for all funds in scope to have set quantitative portfolio targets.
In 2025, 67% (2024: 0%) of funds managed by a.s.r. real estate had set quantitative biodiversity portfolio targets.
Methodology
Fund target to set quantitative portfolio targets
Scope
All non-listed sector funds managed by a.s.r. real estate are in scope of the target: ASR Dutch Prime Retail Fund (DPRF), ASR Dutch Core Residential Fund (DCRF), ASR Dutch Mobility Office Fund (DMOF), ASR Dutch Science Park Fund (DSPF), ASR Dutch Green Energy Fund (DGEF) and ASR Dutch Farmland Fund (DFLF). The geographical scope is all funds located in the Netherlands.
Methodology
The fund target to set quantitative portfolio targets measures the number of internally managed real estate funds that have set quantitative targets related to biodiversity and ecosystems.
To support the EU Biodiversity Strategy for 2030, the Kunming-Montreal Global Biodiversity Framework was used in setting the biodiversity target. The fund target is not based on conclusive scientific evidence.
a.s.r. involved stakeholders in setting its targets by partnering with various stakeholders to broaden knowledge of biodiversity restoration.
a.s.r. did not take ecological thresholds into account when setting its fund target.
The fund target to set quantitative portfolio targets can be allocated to the 'restoration' layer of the mitigation hierarchy.
Mortgages
a.s.r. is currently in the process of developing a biodiversity target and corresponding metrics for its mortgage portfolio. Moreover, for 2026 the ambition is to further investigate the relationship of the mortgage portfolio with biodiversity loss and ecosystem services and improve the corresponding data.
P&C 3.24.14.2
P&C continues to enhance its understanding of biodiversity effects in relation to its underwriting activities and will therefore keep refining the LEAP assessment on a yearly basis. In 2025, P&C developed two targets to prepare for future portfolio targets. These targets are inspired by the Finance for Biodiversity Foundation Nature Target Setting Framework and entails the following:
Formulate reach of commercial client information and inspiration engagement programme.
Deploy stewardship action: decide on the number of commercial clients and their advisors near biodiversity sensitive areas to be reached by engagement actions to inform and inspire them to take action to reduce biodiversity loss and to contribute to nature restoration. Target year ready: 2027.Set up commercial client Natura-2000 active engagement programme:
Deploy stewardship action: set up, test and decide on the scope of a Natura-2000 engagement programme, based on the results of the biodiversity assessment, to actively engage with commercial clients and their advisors to inform and inspire them to take action to reduce biodiversity loss and to contribute to nature restoration. Target year ready: 2027.
To monitor progress towards these targets, a five-step roadmap has been developed. To reach both targets, all steps need to be completed by 2027.
As both targets were set at the end of 2025, implementation of the five-step roadmap will start in 2026. Therefore, in the Annual Report of 2026 the progress on these targets will be shared for the first time.
Methodology
Engagement targets
Scope
P&C underwriting activities.
Methodology
Progress is tracked quarterly through a structured five-step plan, documented internally in a self created template and integrated into the ESG reporting process.
Assumptions and limitations
The methodology assumes that progress toward targets can be measured through completion of predefined steps rather than quantitative calculations. Quarterly assessments are qualitative and subject to interpretation, introducing a degree of measurement uncertainty.
Health
Due to the limited availability of data, health insurers have not yet formulated specific goals for this theme. It appears not to be feasible to measure a generic decrease in medicine residues in Dutch water, due to external factors including weather influences, increasing medicine use, and other factors such as uncommon diseases due to invasive species and climate change. For most measures, it therefore makes more sense to focus on reduced use and waste. In 2025, health insurers made an inventory of available monitoring within the broader sector and the possibility of direct monitoring by health insurers. Special attention was paid to limiting the administrative burden for healthcare providers. This inventory will be used when setting measurable goals for the theme.
In June 2025, the RIVM published the baseline measurement of the Sustainability and Health Monitor. This monitor forms the basis for measuring progress and drawing up further actions and improvements, showing that various indicators have been developed for this theme. These indicators mainly focus on the dispensing, failure and return process of medicines, as well as on the replacement or reduction of medication. The goals for these indicators are aimed at reducing the dispensing and waste of medicines and ensuring that unused medicines can be returned in all community pharmacies. However, due to a lack of available current and reliable data, it is currently not possible to provide a complete national and/or sectoral overview of these indicators.
6.2.2.7 Metrics
The initial step towards achieving biodiversity and ecosystems objectives is to identify the premium exposed to biodiversity risk.
The quantitative resilience analysis conducted in 2025 showed that 5.6% of the total premium of the commercial customers portfolio within P&C is exposed to biodiversity risk. The premium exposed to biodiversity risk mainly relates to the commercial customers located near the two nature areas, the Veluwe and the Rijntakken.
Methodology
Premium exposed to biodiversity risk
Scope
The scope of this metric is the commercial customer portfolio with usable location and industry data, representing 16.0% of total P&C premium.
Methodology
This metric is a percentage of a.s.r.’s premium that is exposed to biodiversity risk in relation to total premium in scope of this metric.
Data is sourced from internal systems and validated external datasets, then processed through secure platforms, and used in calculations that determine the premiums exposed to biodiversity risk. This is done by combining geolocation data with sector- and Natura 2000 impact and dependency scores, focusing on clients that are located within a 1 kilometre radius of a Natura 2000 area.
The measurement of this metrics has not been validated by an external body other than the assurance provider.
Assumptions and limitations
The approach relies on proxies and sector-level data where granular details are not fully available. a.s.r. is continuously improving the approach and underlying data, which will improve the data quality of the indicator.
6.2.3 Resource use and circular economy
As the demand for resources in the rapidly changing world is increasing, the efficient use of resources and adoption of circular economy principles is becoming more critical than ever. a.s.r. recognises the importance of sustainable resource management and supports the transition from a linear economy to a circular economy, by aiming to extend product life cycles and limit resource outflows, such as waste. This commitment positively interacts with a.s.r.’s ambition to reduce the carbon footprint, halt and reverse nature loss, and support sustainable entrepreneurship.
The following tables present a comprehensive overview of the material impacts identified, along with the corresponding policies, actions and targets. The purpose of this table is to highlight the linkages and dependencies among these elements. See the SBM-3 table in section 6.1.4.3 for additional information on the impact, risks and opportunities identified.
5 - Resource inflows
| Materiality | IRO description | Scope | Policies | Actions | Targets |
|---|---|---|---|---|---|
| 5.1 a.s.r. has a positive impact on resource inflows through its repair over replace claims handling approach for damaged items insured by a.s.r. | P&C activities | Policy of Sustainable Insurance | Promote the use of recycled parts among car repair shops. | Sustainable repair target for vehicles |
| 5.2 a.s.r. has a negative impact on resource inflows through its real estate and insurance activities. | Activities related to:
|
|
| Sustainable damage repair targets for vehicles and properties |
6 - Waste
| Materiality | IRO description | Scope | Policies | Actions | Targets |
|---|---|---|---|---|---|
| 6.1 a.s.r. has a positive impact on resource outflows/products and materials through its specialised insurance proposition for recycling companies. | P&C activities | Policy of Sustainable Insurance |
| None |
| 6.2 a.s.r.'s own facilities as well as its insurance activities have a negative impact on resource outflows/waste. | Activities related to:
|
|
| Sustainable damage repair targets for vehicles and properties |
6.2.3.1 Impacts, risks and opportunities
Description of the processes to identify and assess material resource use and circular economy-related impacts, risks and opportunities
As part of the DMA conducted in 2024, material resource use and circular economy-related impacts and opportunities were identified by a.s.r. For details, see section 6.7.2. These impacts and opportunities were reviewed and actualised in the DMA update of 2025 and led to several changes, such as the removal of the previously identified opportunities and several changes in the scope of the identified impacts.
During the early stage of the DMA, a wide range of stakeholders were consulted. However, no affected communities were consulted, as these were not identified. No other methodologies, assumptions or tools were used in the screening process.
6.2.3.2 Policies
Policies related to resource use and circular economy
In order to manage impacts, risks and opportunities in relation to resource use and circular economy, the following policy documents are relevant:
Sustainability Policy Statement Services;
The ESG Policy of a.s.r. real estate;
The Policy on Sustainable Insurance;
Health Procurement Policy.
Facilities 6.2
Own offices
a.s.r. identified a material negative impact as a result of waste in the own operations, primarily in office premises. This negative impact is addressed by the Sustainability Policy Statement Services, which is publicly accessible via the a.s.r. website. The policy is signed by the head of facility management, who is responsible for its implementation and effectiveness. a.s.r. aims to reduce waste impact through specific measures and office closures and the policy contains actions that are and will be taken to reduce the negative impact. Monitoring is done via waste-related metrics. The policy covers the own business operations for the locations Utrecht, Enschede, Den Haag, Leeuwarden and Heerlen. The office locations Groningen, Amsterdam, Zaandam and Breukelen are committed to aligning to this policy as much as possible. The office locations of D&S Holding and HumanTotalCare have no formal policy yet.
Real Estate 5.2
The use of primary raw materials within properties has a potential negative impact. The ESG Policy of a.s.r. real estate sets out a framework for promoting circular building principles. Circular building principles, such as reuse of materials and reduction of waste, are challenged during the design of new building projects acquired by a.s.r. and incorporated in the programme of requirements.
The scope of the ESG Policy of a.s.r. real estate includes all non-listed sector funds managed by a.s.r. real estate and the separate accounts managed on behalf of a.s.r.
Given the potential negative impact of use of primary raw materials in the upstream value chain, a.s.r. aims to promote the incorporation of circular building principles. The use of circular economy principles is promoted during the design of new buildings that are acquired and incorporated into the programme of requirements. a.s.r. is also partnering with external institutions, such as the DGBC, to create a standard application format for sustainable renovations. Part of this format includes circular building principles, such as material sourcing, design for detachability and reuse potential, as well as the effective handling of residual materials and construction and demolition waste. This standard format will facilitate the sector-wide implementation of more circular business models. As such, it addresses transitioning away from use of virgin resources, including relative increases in use of secondary (recycled) resources. Additionally, it addresses sustainable sourcing and the use of renewable resources.
Interests of key stakeholders, such as project developers, construction companies and future tenants, are given consideration indirectly through the development of market standards with the DGBC and directly during the design and engineering phase of construction and renovation projects.
The ESG Policy was made available to stakeholders who are potentially affected or who need to help implement it through the programme of requirements that is in place for acquisitions of new buildings. The management team of a.s.r. real estate is accountable for the implementation of the ESG Policy of a.s.r. real estate.
P&C 5.15.26.16.2
a.s.r.’s Policy on Sustainable Insurance addresses circular economy principles through underwriting and the execution of products and services.
During the underwriting process, a.s.r. may encounter new initiatives that contribute significantly to the transition towards a more circular economy. These initiatives often involve companies engaged in practices such as recycling materials and reducing waste. The P&C Sustainability Desk serves as a resource for advisors to assess the insurability of such initiatives. The desk evaluates these cases thoroughly and, where feasible, enables their insurability. By leveraging its expertise, a.s.r. can offer tailored insurance solutions that meet evolving customer needs.
Prior to the launch of any new or updated insurance solution, a.s.r. applies the PARP. This process ensures that insurance solutions incorporate sustainable repair practices, thereby contributing to circular economy objectives.
The Policy on Sustainable Insurance also promotes the transition away from the use of virgin resources and towards renewable alternatives. Through sourcing and contracting, a.s.r. prioritises repair over replacement wherever possible. a.s.r. encourages customers to repair damages themselves or have them repaired by certified companies selected by a.s.r. These repair companies form part of P&C’s sustainable repair network and are chosen for their cooperation and adherence to sustainability standards. Repairs may be carried out for instance by construction firms, car repair shops or cleaning services. During the contracting process, a.s.r. actively seeks out companies with expertise in sustainable damage repair, such as restoring stone counter tops or repairing water damage to wooden floors. This strategy reduces reliance on virgin resources by increasing the use of second-hand or recycled materials.
All affiliated repairers are certified by Erkend Duurzaam and Groen Gedaan!, recognised ESG quality standards in the repair sector, and certification is mandatory for collaboration with a.s.r. The standards set out minimum requirements for repairers to meet, including environmental impact assessments and policies for the use and disposal of chemicals, hazardous substances, waste water and gas emissions. Repairs by the selected companies are conducted in a socially responsible and environmentally conscious manner, including the use of second-hand materials and waste reduction practices. Periodic audits ensure compliance with these sustainability standards. Furthermore, environmental expectations are embedded in a.s.r.'s Supplier Code of Conduct. Sustainable sourcing of materials and reduction of carbon emissions are integral parts of this approach.
The scope of the Policy on Sustainable Insurance for this material topic covers non-life insurance products and services.
P&C commits to respecting the requirements of the sustainable repair network Groen Gedaan! through the implementation of the policy.
Health 5.26.2
a.s.r. has a sustainability module in its Health Procurement Policy for pharmacies. a.s.r. was the first health insurer to include this sustainability module in its contracts, allowing pharmacies to earn money by delivering sustainably (delivery without using fossil fuels to reduce GHG emissions), working paperless by using digital applications (Kijksluiter) and being a member of a platform that enables them to share surplus stock with pharmacies that have patients in need of it (Pharmaswap), which helps in transitioning away from the use of virgin materials. a.s.r. also focuses on stimulating sustainable innovation. With this Health Procurement Policy, a.s.r. aims to reduce the negative impact it has on resources and waste.
In addition, a.s.r. is committed to the sectoral implementation plan of ZN, GDDZ 3.0 (duration 2022-2026), which sets out ZN's sustainability policy. The plan focuses on the healthcare sector in the Netherlands and includes working circularly and sparingly with raw materials as one of the themes. The GDDZ 3.0 is accessible via the ZN website.
Within the Health Procurement Policy, a.s.r. aims to encourage healthcare providers and suppliers to reduce waste and promote reuse. Healthcare providers within Medical Specialist Care (Medisch-specialistische zorg - MSZ) and the Wlz are encouraged through the Health Procurement Policy to map waste flows and reduce the amount of unsorted residual waste. Sustainability criteria are included in contracts with suppliers of aids, including reducing packaging, preventing waste and promoting reuse.
To keep the administrative burden as low as possible, it is essential that health insurers act in a consistent manner. Relevant topics from the implementation plan are elaborated annually in the Health Procurement Policy, which is made public no later than 1 April of the previous year. Healthcare providers play a crucial role as stakeholders in the implementation of the policy, but stakeholders in the supply chain, such as suppliers, also play a role in making water pollution more sustainable and combating water pollution in the healthcare sector in the Netherlands.
The Health Procurement Policy was published on 1 April 2025.
ZN is ultimately responsible for the development of the sustainability policy, the management team of a.s.r. health is responsible for the implementation of the sustainability policy within the Health Procurement Policy and processes of a.s.r.
6.2.3.3 Actions
To achieve the objectives of the various policies on sustainable resource use and circular economy, several actions are taken.
Facilities 6.2
To improve waste management, a.s.r. has implemented the following measures:
Purchased and used washable coffee cups to reduce carton waste;
Digitalised archives to reduce paper use;
Facilitated proper waste separation at office locations to promote recycling;
Limited plastic packaging in catering services to reduce plastic waste;
Temporarily implemented a system to register daily food waste by the caterer, enabling more targeted purchasing, to reduce food waste;
Held annual discussions with hygiene partners to evaluate developments and identify improvement opportunities;
Ensured sustainable disposal of IT waste through a certified company;
Regularly evaluated waste flows to implement further improvements.
These measures, which have been implemented and continuously monitored, contribute to reduced waste generation and improved waste separation per employee. The digitalisation of archives, which is nearly complete, has resulted in a one-off increase in paper waste in 2024, but this is expected to decline in the coming years. Several other actions have already been completed (e.g., the purchase of washable coffee cups), while others will continue indefinitely and therefore cannot be assigned a specific end date (e.g. limited plastic packaging in catering services).
The actions mainly focus on waste at a.s.r.'s head office, because this location has the largest share. Where possible, a.s.r. will also implement similar measures at other office locations to further promote residual waste reduction. The waste originating from IT is included in scope of the actions and focusses on all IT waste from all office locations.
Real Estate 5.2
Through the use of primary raw materials in the supply chain, a.s.r. has a potential negative impact and therefore aims to promote circular building principles. Circular economy principles are promoted during the design of new buildings that a.s.r. acquires and are incorporated in the programme of requirements. a.s.r. is also partnering with external institutions, such as the DGBC, to create a standard application format for sustainable renovations. Included in this format are circular building principles, such as material sourcing, detachability and reuse potential, handling residual material and handling construction and demolition waste. This standard format will help sector-wide implementation of more circular business models.
In the coming years, a.s.r. will introduce additional requirements related to circular building principles in its ESG strategy and ESG Policy, which is expected to lead to less virgin material use and promote the reuse of materials. Additionally, the programme of requirements will be revised to ensure the targets are accomplished in acquisitions and large renovations.
The scope of these actions is new construction and renovation projects.
a.s.r. has the ambition to reduce the impact of using virgin materials, through the further integration of circular building principles and related targets in the programme of requirements for new buildings and large scale renovations by 2026 at the latest.
New standard: CO₂ reduction pathway for building materials
Globally, building materials account for approximately 13% of CO₂ emissions, and the construction sector consumes nearly 50% of all raw materials. For the first time in the Netherlands, real estate parties have agreed to implement both target values and strict maximum limits for CO₂ emissions associated with building materials in an initiative that accelerates the transition to smarter, circular and bio-based construction, setting a new standard for the sector.
In September 2025, thirteen institutional real estate asset managers and social housing associations collectively managing over € 60 billion in assets and planning tens of thousands of new homes in the coming years signed a joint commitment to structurally reduce CO₂ emissions in the construction sector. These emissions come from the production, transport, processing and use of building materials.
The signatories have set a reduction pathway through 2050, which will be reviewed annually and adjusted if needed. This gives the market clear guidance: projects exceeding the maximum value will, in principle, not be accepted.
Three routes to sustainability
The commitment outlines three ways to reduce material-related emissions:
Smarter construction, through more efficient material use and the greening of concrete and steel;
Circular construction, by reusing materials and designing for disassembly;
Bio-based construction, using renewable materials like wood, flax, hemp and straw.
This integrated approach contributes to the Paris Agreement: a 55% reduction in emissions by 2030 and a fully climate-neutral sector by 2050. It also supports the reduction of primary resource depletion and encourages innovation in the construction chain.
Putting it into Practice
With this agreement, a collective standard has been established. The first evaluation is scheduled for spring 2026, at which point the thresholds may be tightened and the scope potentially expanded to include renovation projects. Through this joint initiative, institutional investors and housing corporations are setting a new benchmark for a climate-neutral, circular and future-proof built environment.
P&C 5.15.26.16.2
In order to contribute to the objectives of the Policy on Sustainable Insurance - reducing climate impact, supporting the energy transition, and promoting sustainable practices across underwriting, product development and claims handling for relevant insurance products and services - a.s.r. has implemented the following actions:
a.s.r. supports the transition to a circular economy by offering sustainable and/or circular repair through certified repair partners. Certification entails circular economy requirements such as limitations on waste and minimum requirements on the use of second hand materials. The repair partners apply innovative and alternative repair methods, for example when restoring mobile electronics affected by water damage. a.s.r.'s underwriters actively encourage customers to opt for sustainable repair solutions throughout the claims process. As part of this journey to repair damages as sustainably as possible, a.s.r. started a pilot in 2025 to repair cooking stoves (non-gas) and televisions screens instead of replacing them, sometimes with refurbished parts.
To promote the use of recycled parts in vehicle repairs, a.s.r. conducted a pilot project on circular claims handling with a group of car repair companies. The pilot, which ran from 2024-2025, explored opportunities to increase the use of second-hand or recycled parts in car repairs, such as installing a second-hand bumper.
In the co-insurance market, P&C enables recycling activities to be insurable by offering tailored solutions for industrial risks of recycling companies that contribute to the circular economy.
The scope of the actions concerns personal and commercial non-life insurance activities.
P&C strives to continuously explore new opportunities to enhance the positive impact of sustainable repair practices. This remains a key area of focus and is an ongoing process.
Health 5.26.2
a.s.r. supported three innovations:
Care Cycle and Care Cycle Hubs. In 2024, a.s.r., and Care Cycle, together developed a concept to make unused incontinence products reusable, thereby preventing waste and the destruction of capital. Following a successful pilot in 2024, a.s.r. And Care Cycle initiated preparations in 2025 to scale up this initiative across the Netherlands through distribution hub in 2026.
Washable incontinence products. To combat waste in healthcare, a.s.r. launched a pilot in 2025 that enables the use of reusable and washable incontinence products. Together with Slingeland Hospital and Radboud University Medical Center, a.s.r. is conducting a pilot programme using UnderWunder washable incontinence underwear in 2025 and 2026. In this pilot programme, a.s.r. is investigating whether this is a convenient and more sustainable alternative to disposables, considering costs, the environment and the wearing experience.
Green Mental Healthcare (Groene GGZ) is an initiative in which a.s.r. aims to stimulate nature-inclusive care and waiting list initiatives on nature, in collaboration with mental healthcare institutions. Nature has a positive impact on both physical and mental health. By integrating nature into mental healthcare treatment, it can contribute to a faster recovery for clients and more vital, committed and productive healthcare professionals. This is a first step to improve circularity within the mental healthcare institutions in 2026. To emphasise the importance of nature-inclusive care, as of 2026, a.s.r. will become a strategic partner of the Green Mental Healthcare initiative.
In addition, a.s.r. actively contributes within the ZN context by drafting a sustainability policy and coordinating it with various stakeholders. The sustainability policy is incorporated into the purchasing policies of individual health insurers, such as the Health Procurement Policy, applicable to healthcare providers and supply chain stakeholders, including suppliers. In 2025, the sustainability policy was further improved. Hence, the Health Procurement Policy was also updated in alignment with the updated ZN sustainability policy.
The goal of making the healthcare sector more sustainable is being implemented through an integrated series of measures, aimed at working circularly and sparingly with raw materials. The purchasing policy of health insurers, such as the Health Procurement Policy, is the most important instrument for realising these measures. This concerns the implemented procurement policy for 2025 and the drawn up procurement policy for 2026.
The following measures were implemented in 2025:
Incontinence material. Health insurers are working with value chain partners and trade associations to develop a pilot project aimed at reducing waste from incontinence materials.
Tools. Health insurers are mapping out the composition of the aids they purchase and to what extent these aids are already reused. This inventory serves as a basis for further actions and improvements, where an initial baseline measurement is essential to determine realistic goals.
Overarching:
Health insurers are committed to mapping green initiatives of healthcare providers, with the aim of stimulating knowledge sharing about sustainable initiatives.
No actions are included that specifically provide recovery measures for those who suffer damage from the negative material impact on circularity and material use.
The scope of the actions is Dutch contracted healthcare providers.
Monitoring
RIVM's Sustainability and Health Monitor forms the basis for measuring progress and drawing up further actions and improvements. This report shows that various indicators have been developed with for the theme. For example, one of the sub-indicators concerns sustainable and circular purchasing from healthcare providers, insurers and wholesalers, with specific attention to recording in policy and encouraging sustainable alternatives through joint purchasing. There is currently no national or sectoral overview. However, insight can be gained from Milieuthermometer Zorg of Milieu Platform Zorg.
The Milieuthermometer Zorg includes criteria for sustainable purchasing for certification and the theme of Sustainable Purchasing is included in the silver and gold levels. In 2023, 539 healthcare locations had a certificate, 213 of which were silver and 16 gold. In 2024, 658 locations had a certificate, 398 of which were bronze, 243 silver and 17 gold. Current data from the Milieuthermometer Zorg cannot give a sectoral picture, so the locations' healthcare sub-sectors are not known.
At the end of 2025, various healthcare management committees approved funding for obtaining an environmental quality mark. Starting in 2027, health insurers will reimburse a large portion of the costs of obtaining environmental certification. This will apply to the top 400 healthcare institutions, which collectively account for 80% of CO2 emissions. With this certification, health insurers aim to improve the discussion on sustainability from the procurement side and encourage healthcare providers to achieve ever-higher sustainability performance.
6.2.3.4 Targets
Targets related to resource use and circular economy
Facilities 6.25.2
a.s.r. has mapped activities related to circular economy throughout the organisation. Since a.s.r.'s own operations generate relatively limited waste compared to the broader value chain and given that numerous actions have already been implemented in recent years, no specific target has been set at this time. Waste is monitored continuously, and if the outcomes indicate an increase or need for further reduction, appropriate actions will be taken.
Real estate
Establishing accurate and actionable targets necessitates comprehensive data on a.s.r.’s current resource use in its real estate portfolio. Over the past years, the organisation has focused on enhancing data collection and analysis to ensure that future targets are based on reliable information.
P&C 5.15.26.2
In the past year, a.s.r. has mapped activities related to resource use and circular economy within the P&C portfolio. These include offering customers the option to have damage repaired sustainably through a network of certified repair companies. This approach aims to reduce the negative impact on resource inflows and waste by minimising the use of primary raw material and promoting sustainable sourcing and use of renewable resources.
The targets for 2025 were set at 85% for sustainable personal motor damage repair and 50% for sustainable private home damage repair.
In 2025, the percentage of sustainable personal motor damage repair was 77% and the percentage of sustainable private home damage repair was 55%.
For sustainable vehicle repairs, a.s.r. is behind its target. In the second half of 2025, a.s.r. took several actions to improve this percentage and an increase was visible in the final quarter. By encouraging customers to choose sustainable repair solutions throughout the claims process, a.s.r. was able to meet its target for private home insurance.
E5-3 Sustainable damage repair - personal lines
| (in %) | Base year | Baseline value | 20251 | Target year 2025 |
|---|---|---|---|---|
| Personal motor | 2023 | 75% | 77% | 85% |
| Private home insurance | 2023 | 38% | 55% | 50% |
- % sustainably repaired damages compared to all repairs.
Methodology
Sustainable damage repair - personal lines
Methodology and scope
The target reflects the percentage of sustainable repairs for vehicles and properties relative to the total number of all vehicle and property repairs.
For a.s.r., sustainable repair is damage repair with minimal impact on the environment and maximum efficiency, and a strong incentive to reduce CO2 emissions throughout the handling process.
Data is sourced from internal systems and processed through a data platform, with controls to ensure accuracy and completeness. Calculations are based on closed, repairable claims within defined product groups. The definitions used are:
Definition of sustainable vehicle repair: A repair is considered sustainable when it is performed by a certified partner within the a.s.r. sustainable repair network.
Definition of sustainable property damage repair: A repair is considered sustainable when it is carried out by the customer, by an independent repair company, or by a certified partner within the a.s.r. sustainable repair network.
The target for 2025 includes all vehicle and property repair in the personal lines portfolio, excluding the direct online distribution channel Ik kies zelf van a.s.r. The base year is 2023.
Currently, these targets are not based on conclusive scientific evidence. However, as a member of the Dutch Association of Insurers, a.s.r. Is collaborating with other Dutch insurers on the manifest for sustainable repair, which aims to establish sustainable repair as the norm by 2027. Internal stakeholders were involved in the target setting, but external stakeholders were not consulted.
This voluntary target primarily focuses on the preparation for reuse and recycling within the waste hierarchy. Ecological thresholds were not deemed relevant in this context and were therefore excluded from the target-setting process.
Assumptions and limitations
Measurement uncertainty primarily arises from manual data entry and classification risks, which are mitigated through quarterly quality monitoring and documented controls.
For the classification of sustainably repaired, we assume that any claim associated with a repairer is considered repaired, even when the engagement may have been limited to an assessment. We also assume that payments made for minor third-party repairs and settlements to counterparties are used for actual repair work. In cases where a customer has both property and contents claims and at least one is repaired through our sustainable network, the entire claim is treated as sustainably repaired.
New target in development
a.s.r. is now able to include the direct online distribution channel Ik kies zelf van a.s.r. in its scope. The current definitions and methodologies of sustainable repair are being re-evaluated to enable comprehensive monitoring across different dimensions of repair. As part of this process, new elements are being explored, such as more sustainable replacement options through circular or refurbished alternatives. These elements are intended to be included in future targets, with the target-setting process expected to commence in 2026.
Health
Through the GDDZ 3.0, healthcare strives for economical and circular use of resources and materials. The targets for circularity are as follows:
By 2030, primary raw material consumption must be 50% lower and unsorted residual waste 75% lower than in 2016.
Maximum circular care must be provided by 2050.
These targets have been established in collaboration with various industry organisations and are based on scientifically established information about the theme. The goals have been drawn up jointly by industry parties and are not legally required, with the exception of legislation and regulations on specific topics related to circularity.
Monitoring
RIVM's Sustainability and Health Monitor forms the basis for measuring progress and drawing up further actions and improvements, showing that various indicators have been developed for the theme. There is currently no national method to measure primary raw material use, but two main indicators have been formulated to provide an idea of how sustainably and efficiently healthcare institutions deal with waste and raw materials.
The first indicator measures the total mass of waste (in kg) produced by the healthcare sector, corrected for company characteristics such as the number of FTEs, usable surface area, number of beds/client spaces, and healthcare-related turnover. This indicator helps individual healthcare institutions understand how much waste they produce relative to their size and activities and it serves as a benchmark for reducing resource use. The goal is that by 2030, a maximum of 25% of all waste in and from healthcare will be 'unsorted residual waste'. The goal is also to have a 25% reduction in unsorted residual waste across the healthcare sector by 2026 compared to 2018.
The second indicator focuses on the percentage of unsorted industrial waste within healthcare institutions, which provides insight into the degree of waste separation and the reuse of raw materials. The goal is to retain a maximum of 25% of waste as unsorted industrial waste by 2030.
There is also a sub-indicator that focuses on sustainable and circular purchasing as a standard criterion for purchasing projects. The target value is that this standard criterion is used in 90% of purchasing projects.
In the ZN sectoral implementation plan GDDZ 3.0, various specific targets have been established to support the main goals in the GDDZ 3.0. The objectives are:
20% of the volume of aids that health insurers purchase directly from suppliers must be reused.
Health insurers must purchase 5% less incontinence material in 2026 than in 2022, ceteris paribus.
The primary raw material consumption of purchased care must be 20% lower in 2026 than in 2016.
25% less unsorted residual waste compared to 2018.
It remains a challenge to monitor developments in sustainability performance, both at a national level and among health insurers. The RIVM Sustainability and Health Monitor does not yet include national measurement methods for material inflows, and there is also limited availability of monitoring for waste. In 2026, health insurers will continue to inventory which monitoring is available within the broader sector as well as the possibility of direct monitoring by health insurers, including limiting the administrative burden for healthcare providers.
6.2.3.5 Metrics
The initial step towards reducing resource inflows and resource outflows (waste) is to establish a thorough understanding of the current position. These disclosures strengthen transparency and comparability, thereby enabling stakeholders to assess a.s.r.'s impact on resource inflows and resource outflows (waste) and evaluate the effectiveness of a.s.r.’s reduction strategy.
Resource inflows
Material impact on the topic resource inflows was identified and is outlined here:
a.s.r.'s most material resource inflows within the real estate portfolio are construction materials, such as wood, concrete, steel and glass, for new construction and renovation projects.
a.s.r.’s car repair companies use packaging materials (e.g. cardboard) and materials for repair (e.g. metals). Property repair and maintenance rely on materials for interiors (e.g. glass, flooring, construction materials, paints and electronics). Both also rely on the use of property and equipment.
a.s.r.'s resource inflows within the health insurance portfolio are mainly metals and minerals, which are used for pharmaceuticals and other chemical products, medical and electronic products and food and catering, among other things.
Data is not yet available to quantify these resource inflows.
Resource outflows (waste)
The table below contains the specification of the total amount of waste generated in a.s.r.'s own operations.
E5-5 Resource outflows (Waste)
| 2025 | 2024 | |||||
|---|---|---|---|---|---|---|
| (in tonnes) | Hazardous | Non-hazardous | Total | Hazardous | Non-hazardous | Total |
| Total amount of waste generated | 4.4 | 487.7 | 492.1 | 7.2 | 981.3 | 988.5 |
| Preparation for reuse | - | 19.0 | 19.0 | - | 3.3 | 3.3 |
| Recycling | - | 262.7 | 262.7 | 0.2 | 765.0 | 765.2 |
| Other recovery operations | - | - | - | - | - | - |
| Total amount diverted from disposal | - | 281.7 | 281.7 | 0.2 | 768.3 | 768.5 |
| Incineration | - | 173.4 | 173.4 | - | 198.1 | 198.1 |
| Landfill | - | 0.4 | 0.4 | - | 0.3 | 0.3 |
| Other disposal operations | 4.4 | 32.2 | 36.6 | 7.0 | 14.5 | 21.5 |
| Total amount directed to disposal | 4.4 | 206.0 | 210.4 | 7.0 | 213.0 | 220.0 |
| Total amount of non-recycled waste | 210.4 | 220.0 | ||||
| Total percentage of non-recycled waste (in %) | 42.8% | 22.3% | ||||
In 2025, the amount diverted from disposal decreased, which translated into a lower total waste volume year‑on‑year. This was primarily driven by the closing of office locations (e.g. Rotterdam and Den Haag), eliminating one‑off construction and clean‑up streams from 2024. As these exceptional activities did not recur, waste generation largely consisted of regular operational streams. Additionally, the organisation‑wide digitisation of a.s.r.’s archives resulted in significantly less paper waste.
Methodology
Resource outflows (waste)
Scope
Waste from a.s.r.’s own operations.
Methodology
a.s.r. categorises waste from its own operations into several categories or waste types, such as plastic and drink cartons, paper and organic waste. These categories are all related to waste generated by a.s.r.'s own operations.
Hazardous waste is any waste with properties that make it dangerous or harmful to human health or the environment. It can be toxic, reactive, flammable, corrosive or radioactive, and it requires special handling and disposal procedures. Hazardous waste of a.s.r. mainly concerns oil and fuel waste.
To classify its waste streams, a.s.r. uses the European Waste Catalogue. The Waste Framework Directive is applied to define all disposal methods used within its own operations. Radioactive waste is not included, as it is not applicable for a.s.r.'s own operations.
Assumptions and limitations
Waste from a.s.r.’s own operations is mainly reported using the average weight of waste containers. If only invoices are available, the number of emptied containers is used instead. Whenever this is applicable, a.s.r. calculates weights using key figures from the waste recipient.
This excludes waste generated and handled by suppliers and organic waste. Due to limited data, a.s.r. applies several assumptions. For roll containers, weight is estimated using container size and average weight per waste type. For locations not services by Prezero, Prezero’s key figures are used to estimate total waste. For the Heerlen location, estimates are based on the number of employees multiplied by Prezero's average waste weight per person.
Only residual waste is directly weighed; the other waste types - 69% of a.s.r.'s total waste - are calculated using averages and ratios. This introduces measurement uncertainty in the data presented.
For the Heerlen location, waste amounts are estimated using ratios. This assumes equal waste generation per person, which adds further estimation uncertainty.
For D&S Holding and HumanTotalCare, estimates were based on actual total waste in kilos. Robidus estimated its resource outflows using total office floor area in m2, as waste cannot be weighed due to its location in a multi-tenant office building.
Waste from a.s.r.'s IT department falls into two categories: data centre hardware and end-user hardware. Datacentre hardware includes hardware from a.s.r.'s own data centre in Utrecht and the rented facility at Switch in Woerden. End-user hardware covers laptops, mobile phones and other hardware used by employees. All such hardware is owned by a.s.r. and is disposed, re-used or recycled by a.s.r. The mass of the disposed products (as per the waste manifests) are researched through publicly available sources (e.g. product pages on online shops) in order to calculate the mass (in kg) of waste divided into metals, plastics and refractory oxides (metallic minerals).
6.2.4 Taxonomy regulation
Summary
For 2025, a.s.r. prepared the EU Taxonomy disclosures in line with the amended Commission Delegated Regulation as published in January 20261. The comparative figures have been prepared based on the European Commission Delegated Acts, applicable prior to the amended Delegated Regulation. Where relevant the revised comparative figures have been disclosed in the explanatory notes.
The table below shows the aligned economic activities of a.s.r. as a group, being the sum of the KPIs of the underlying activities based on the weighted average of revenue of each activity.
Aligned economic activities of a.s.r.
| 31 December 2025 | 31 December 2024 | |||
|---|---|---|---|---|
| Turnover based | CapEx based | Turnover based | CapEx based | |
| Aligned activities | 11% | 11% | 6% | 6% |
The main drivers of the aligned activities are direct and indirect investments in real estate and mortgages by the insurance undertakings. The aligned activity is acquisition and ownership of buildings.
If the 2024 KPIs were calculated based on the amended Commission Delegated Regulation, alignment would have been 9% turnover based and 9% CapEx based.
General information
The EU Taxonomy Regulation establishes an EU classification system or taxonomy that provides investors, including financial sector entities and corporates, with uniform criteria specifying which economic activities qualify as environmentally sustainable.
a.s.r. wants to play a leading role in the financial sector when it comes to sustainable business. a.s.r. strives to make a positive contribution to making society more sustainable, and it systematically takes into account the ESG impacts of its activities, in accordance with its strategy on sustainable business. It does this by setting ambitious targets, developing effective instruments and reporting clearly on progress and the results of its efforts. In the targets set by a.s.r., no taxonomy criteria were used.
a.s.r.'s product design strategy takes into account climate-related risks, which become even more predominant in the medium and long term. Climate risks are monitored regularly, including their impact on a.s.r.’s pricing policy, acceptance policy (where possible), product development, claims handling and means of communication.
The EU Taxonomy Regulation currently distinguishes six environmental objectives:
Climate change mitigation;
Climate change adaptation;
The sustainable use and protection of water and marine resources;
The transition to a circular economy;
Pollution prevention and control;
The protection and restoration of biodiversity and ecosystems.
For 2025, a.s.r. is required to report on the eligibility and the alignment of its activities with all six environmental objectives.
Eligibility does not mean that the activities are, in fact, environmentally sustainable, but rather that they have the potential to be considered, or become, sustainable, so-called ‘taxonomy aligned’. In order for economic activities to be taxonomy aligned, they must make a substantial contribution to at least one environmental objective, while doing no significant harm to any of the other environmental objectives and at the same time respecting minimum safeguards.
Methodology
Minimum safeguards
Minimum safeguards are due diligence and remedy procedures implemented by a company to ensure alignment with the OECD Guidelines for Multinational Enterprises and the UN Guiding Principles on Business and Human Rights, which set out minimum standards for companies with respect to human and social rights. Thus, the minimum safeguards serve as criteria. They are also criteria for responsible business conduct within own operations and within the value chain. They focus on the following topics:
Human rights, including workers’ rights;
Anti-bribery and corruption;
Taxation;
Fair competition.
The scope of the due diligence and remedy procedures with respect to adherence to human rights, and with respect to anti-bribery and corruption, includes a.s.r.'s value chain. The scope relating to taxation and fair competition is limited to a.s.r.’s own operations. For a.s.r.'s underwriting activities, its real estate and mortgage activities, a.s.r. relies on its own due diligence and remedy procedures. For AuM, such as investments in equity and debt instruments, a.s.r. relies on the reported data by those third parties on taxonomy alignment, which implies meeting the minimum safeguards.
In order to meet expectations and to comply with the minimum safeguards, a.s.r. has further enhanced its due diligence and remedy procedures and will continue to do so.
Changes in methodologies and presentation
Amendments to the EU Taxonomy delegated acts
In January 2026, the Commission Delegated Regulation (EU) 2026/73 was published, as part of the first ‘Simplification Omnibus package’. The Commission Delegated Regulation (EU) 2026/73 amends the previous delegated acts in place, being Commission Delegated Acts (EU) 2021/2139 and (EU) 2023/2486.
The amended Commission Delegated Regulation applies from 1 January 2026 reporting over the financial year 2025.
The impact on the 2024 group KPI would have been an increase of 3%, turnover based as well as capital expenditure based, if they were adjusted for the amended regulation. The increase is due to the increase of the alignment percentage of the investment activities by 6%, both turnover based and capital expenditure based, mainly as a result of the new definition of covered assets, the denominator of the KPI. Derivatives and undertakings not in scope of the CSRD are no longer included in the denominator of the KPI, as these assets are non-eligible by nature. There was no impact on the alignment percentage for the non-life insurance underwriting activities.
In addition, the reporting templates were simplified as a result of the amendments.
EU Taxonomy Regulation KPIs
The group KPI for a.s.r. is determined as the sum of the KPIs of the underlying activities based on the weighted average of revenue of each activity.
Aligned economic activities of a.s.r. current year (2025)
| KPI per business segment | ||||||
|---|---|---|---|---|---|---|
| Revenue | Proportion of total group revenue (A) | KPI turnover based (B) | KPI CapEx based (C) | KPI turnover based weighted (A*B) | KPI CapEx based weighted (A*C) | |
| A. Financial activities | 19,147 | 97% | ||||
| Insurance undertakings | 18,920 | 96% | 11% | 12% | 11% | 11% |
| Asset management | 228 | 1% | - | - | - | - |
| Turnover KPI (B) | CapEx KPI (C) | Turnover KPI weighted (A*B) | CapEx KPI weighted (A*C) | |||
| B. Non-financial activities | 649 | 3% | - | - | - | - |
| Total revenue of a.s.r. | 19,797 | 100% | ||||
| Average KPI turnover based | Average KPI CapEx based | |||||
| Average KPI of a.s.r. | 11% | 11% | ||||
Aligned economic activities of a.s.r. prior year (2024)1
| KPI per business segment | ||||||
|---|---|---|---|---|---|---|
| Revenue2 | Proportion of total group revenue (A) | KPI turnover based (B) | KPI CapEx based (C) | KPI turnover based weighted (A*B) | KPI CapEx based weighted (A*C) | |
| A. Financial activities | 15,996 | 97% | ||||
| Insurance undertakings | 15,775 | 96% | 6% | 6% | 6% | 6% |
| Asset management | 221 | 1% | - | - | - | - |
| Turnover KPI (B) | CapEx KPI (C) | Turnover KPI weighted (A*B) | CapEx KPI weighted (A*C) | |||
| B. Non-financial activities | 518 | 3% | - | - | - | - |
| Total revenue of a.s.r. | 16,513 | 100% | ||||
| Average KPI turnover based | Average KPI CapEx based | |||||
| Average KPI of a.s.r. | 6% | 6% | ||||
- Based on the Commission Delegated Regulation prior to the amendment (EU) 2026/73.
- Knab is excluded from total revenue, for a better comparison with current year, as Knab was sold during 2024.
The KPIs for asset managers and non-financial undertakings only contribute for a total of 4% (2024: 4%2) to the group KPI. As a result, a.s.r. decided to report 0% alignment for the activities related to these categories and not to disclose the related templates.
Methodology
Methodology and scope
Group KPI
Based on the relevant FAQs in the third Commission Notice (C/2024/6691), published on 8 November 2024, a.s.r. reports the group KPI based on the weighted average of the relevant activities within the group.
In scope are all the activities of a.s.r.
Included within revenue are the income statement line items insurance contract revenue, direct investment income, fee income and other income related to the revenue from wind farms and solar parks.
KPI of insurance undertakings
The insurance KPI, as disclosed in the group KPI, consists of the KPI for non-life underwriting activities and for investment activities. The insurance KPI is determined based on the weighted average revenue of both KPIs for each of the turnover based KPI and the CapEx KPI as shown in the following table.
Aligned economic activities from insurance undertakings current year (2025)
| KPI per activity | ||||||
|---|---|---|---|---|---|---|
| Revenue | Proportion of total group revenue (A) | KPI turnover based (B) | KPI CapEx based (C) | KPI turnover based weighted (A*B) | KPI CapEx based weighted (A*C) | |
| Insurance, excluding life insurance underwriting activities1 | 13,296 | 100% | ||||
| Non-life insurance underwriting activities in scope of taxonomy | 4,700 | 35% | 0% | 0% | 0% | 0% |
| Investment activities | 8,596 | 65% | 17% | 18% | 11% | 12% |
| Aligned activities from insurance undertakings | 11% | 12% | ||||
- The life insurance underwriting activities are excluded from this table as these are not in scope of the KPI for insurance and reinsurance undertakings. The revenue relating to life insurance underwriting activities is, however, part of the total revenue for insurance undertakings and is therefore included within the table above ‘Aligned economic activities of a.s.r.’
Aligned economic activities from insurance undertakings prior year (2024)1
| KPI per activity | ||||||
|---|---|---|---|---|---|---|
| Revenue | Proportion of total group revenue (A) | KPI turnover based (B) | KPI CapEx based (C) | KPI turnover based weighted (A*B) | KPI CapEx based weighted (A*C) | |
| Insurance, excluding life insurance underwriting activities2 | 10,549 | 100% | ||||
| Non-life insurance underwriting activities in scope of taxonomy | 4,375 | 41% | 0% | 0% | 0% | 0% |
| Investment activities | 6,173 | 59% | 10% | 10% | 6% | 6% |
| Aligned activities from insurance undertakings | 6% | 6% | ||||
- Based on the Commission Delegated Regulation prior to the amendment (EU) 2026/73.
- The life insurance underwriting activities are excluded from this table as these are not in scope of the KPI for insurance and reinsurance undertakings. The revenue relating to life insurance underwriting activities is, however, part of the total revenue for insurance undertakings and is therefore included within the table above ‘Aligned economic activities of a.s.r.’
KPI of insurance undertakings related to non-life underwriting activities
The KPI related to underwriting activities is limited to the non-life insurance business. The following table shows the reconciliation of total insurance contract revenue, as reported in the consolidated income statement to total non-life insurance contract revenue in scope of the EU Taxonomy Regulation.
Reconciliation total insurance contract revenue to total non-life insurance contract revenue in scope of the taxonomy
| 2025 | |||
|---|---|---|---|
| in € millions | Total insurance contract revenue | Not in scope of taxonomy | Total non-life insurance contract revenue in scope of taxonomy |
| P&C | 2,160 | - | 2,160 |
| Disability | 2,019 | 1,237 | 782 |
| Health | 1,758 | - | 1,758 |
| Life | 4,387 | 4,387 | - |
| Total | 10,324 | 5,624 | 4,700 |
The underwriting KPI for non-life insurance and reinsurance undertakings
| Substantial contribution to climate change adaptation | ||||
|---|---|---|---|---|
| Economic activities: Non-life insurance and reinsurance underwriting activities | Insurance contract revenue, 2025 | Proportion of insurance contract revenue, 2025 | Insurance contract revenue, 2024 | Proportion of insurance contract revenue, 2024 |
| € millions | % | € millions | % | |
| Taxonomy-aligned activities | 2 | 0% | 2 | 0% |
| Nuclear activities | n.a. | n.a. | ||
| Fossil gas activities | n.a. | n.a. | ||
| Taxonomy-eligible activities | 18 | 0% | 17 | 0% |
| Nuclear activities | n.a. | n.a. | ||
| Fossil gas activities | n.a. | n.a. | ||
| Non-assessed activities considered non-material | - | 0% | - | 0% |
| Total | 4,700 | 100% | 4,375 | 100% |
The aligned premium includes the caravan and camper van insurance products. For the purpose of computing taxonomy alignment, a.s.r. only uses insurance premiums that pertain to the coverage of climate-related perils. For several products, a.s.r. is unable to obtain data on written premiums related to climate-related perils, as these risks were not separately embedded within the pricing models. Therefore, a.s.r. reported those premiums as non-eligible, while also investigating how climate-related risks might be included in future pricing models.
a.s.r. identifies opportunities to enhance alignment by incorporating incentives or rewards for insurers to implement preventive measures that mitigate climate-related risks. These types of sustainable product enhancements are considered within the product improvement process, alongside financial return and operational feasibility.
Methodology
Methodology and scope
The alignment of non-life insurance underwriting activities is determined as follows:
The insurance contract revenue in scope of the EU Taxonomy Regulation is based on the following lines of business as defined under Solvency II: medical expense insurance, income protection insurance, workers’ compensation insurance, motor vehicle liability insurance, other motor insurance, transport insurance, fire and other damage to property insurance and assistance. As such, the life insurance business and the health insurance business under disability are not in the scope of the EU Taxonomy Regulation.
The underwriting activities are only covered by the environmental objective climate change adaptation.
The related underwriting activities cover at least one of the climate-related calamities as described in the Climate Delegated Act. Within non-life, these mainly concern heat waves and wildfires, wind-related calamities such as storms, water-related calamities such as flooding, heavy precipitation and hail.
The climate-related calamity is explicitly mentioned in the policy terms and conditions. Health and disability do not have these explicit terms and conditions and are therefore non-eligible.
The eligible insurance contract revenue of underwriting activities is measured as the amount that covers climate related perils.
This eligible underwriting activity is considered aligned with the EU Taxonomy Regulation if it complies with the technical screening criteria set out in the EU Taxonomy Regulation, does not significantly harm any of the other environmental objectives and complies with the minimum safeguards.
For nuclear and fossil gas related activities a.s.r. reported not applicable (n.a.), as these activities are only relevant for the investment KPI.
Assumptions and limitations
a.s.r. offers its underwriting activities both directly and through the intermediary channel via independent advisors and mandated brokers. Own source information was used to determine eligibility and alignment for the insurance contract revenue of P&C for insurance policies sold through direct distribution channels and through advisors. For policies sold by mandated brokers as well as co-insurance underwriting activities, no detailed information was available, and the same portfolio composition was therefore assumed as for the portfolio held by advisors.
KPI of insurance undertakings related to investment activities
Investments directed at funding or associated with economic activities as described in the delegated acts are considered Taxonomy eligible. Eligible investments are aligned when they substantially contribute to one or more of the EU Taxonomy environmental objectives and cause no significant harm to the other environmental objectives, while at the same time respecting minimum safeguards.
The table below shows the reconciliation of total assets held by the insurance undertakings as reported in the financial statements to the total assets covered by the KPI of insurance undertakings.
Reconciliation total assets to total assets covered by the KPI
| 31 December 2025 | |||||
|---|---|---|---|---|---|
| in € millions | Total assets Financial statements | Total assets held by insurance undertakings | Assets not qualifying as investments | Investments not covered by the KPI of insurance undertakings1 | Total assets covered by the KPI of insurance undertakings |
| Investments2 | 112,444 | 109,628 | 3,297 | 48,841 | 57,490 |
| Derivatives | 15,905 | 15,446 | - | 15,446 | - |
| Investment property, plant and land and buildings for own use | 3,716 | 3,702 | - | - | 3,702 |
| Other3 | 10,087 | 7,766 | 7,349 | 417 | - |
| Assets held for sale | - | - | - | - | - |
| Total | 142,151 | 136,543 | 10,646 | 64,705 | 61,193 |
- Investments not covered by the KPI of insurance undertakings consists of derivatives, exposures to central governments, central banks, supranational issuers and undertakings not in scope of the CSRD.
- Investments includes investments related to direct participating insurance contracts.
- Other represents intangible assets, deferred tax assets, reinsurance contracts, cash and cash equivalents, equipment, associates and joint ventures, receivables and other assets.
Below are the Taxonomy alignment disclosures of a.s.r.’s investment activities.
The investment KPI for insurance undertakings
| 31 December 2025 | |||
|---|---|---|---|
| Exposure | % | € millions | |
| 1 | Balance sheet total | 100% | 136,543 |
| 2 | Assets covered by the KPI | 45% | 61,193 |
| % of covered assets | % Turnover based | % CapEx based | |
|---|---|---|---|
| 3 | Taxonomy eligible | 71% | 72% |
| 4 | Nuclear activities | 0% | 0% |
| 5 | Fossil gas activities | 0% | 0% |
| 6 | Taxonomy aligned | 17% | 18% |
| 7 | Undertakings subject to Article 19a and 29a of Directive 2013/34/EU | 3% | 4% |
| 8 | of which non-financial undertakings | 2% | 2% |
| 9 | of which financial undertakings | 1% | 1% |
| 10 | Other covered counterparties and real estate assets | 15% | 15% |
| 11 | Investments other than investments held in respect of life insurance contracts where the investment risk is borne by the policy holders | 16% | 17% |
| 12 | Exposures included on a voluntary basis | 0% | 0% |
| 13 | Transitional activities | 0% | 0% |
| 14 | Enabling activities | 1% | 2% |
| 15 | Nuclear activities | 0% | 0% |
| 16 | Fossil gas activities | 0% | 0% |
| Taxonomy aligned per objective | % Turnover based | % CapEx based | |
|---|---|---|---|
| 17 | Climate Change Mitigation (CCM) | 17% | 18% |
| 18 | Climate Change Adaptation (CCA) | 0% | 0% |
| 19 | Water and marine resources (WTR) | 0% | 0% |
| 20 | Circular economy (CE) | 0% | 0% |
| 21 | Pollution (PPC) | 0% | 0% |
| 22 | Biodiversity and Ecosystems (BIO) | 0% | 0% |
| Non-assessed exposures | % | € millions | |
|---|---|---|---|
| 23 | Non-assessed exposures | 0% | - |
| 24 | Exposures financing non-assessed non-material activities of counterparties | 0% | - |
| 25 | Exposures financing counterparties reporting in accordance with Article 7(9) to this Regulation | 0% | - |
| 26 | Non-assessed exposures considered non-material by the reporting entity | 0% | - |
| Breakdown of covered assets | % | € millions | |
|---|---|---|---|
| 27 | Undertakings subject to Article 19a and 29a of Directive 2013/34/EU | 13% | 17,550 |
| 28 | of which Non-financial undertakings | 7% | 9,199 |
| 29 | of which Financial undertakings | 6% | 8,351 |
| 30 | Other covered counterparties and real estate assets | 32% | 43,643 |
| 31 | Investments other than investments held in respect of life insurance contracts where the investment risk is borne by the policy holders | 38% | 52,211 |
| 32 | Exposure included on a voluntary basis | 0% | - |
The main drivers of the aligned assets are real estate, real estate equity funds, mortgages and mortgage equity funds. If the 2024 KPIs were calculated based on the amended Commission Delegated Regulation, alignment would have been 16% turnover based and 17% CapEx based, in line with current year.
The main activities covered by taxonomy aligned investments relate to:
Acquisition and ownership of buildings;
Electricity generation using solar photovoltaic technology, concentrated solar power (CSP) technology, wind power, ocean energy technologies, hydropower, geothermal energy, renewable non-fossil gaseous and liquid fuels or bio-energy. Co-generation of heat/cool and power from solar energy, geothermal energy, renewable non-fossil gaseous and liquid fuels or bio-energy;
Transmission and distribution of electricity;
Manufacture of low carbon technologies for transport.
Methodology
Methodology and scope
Investment activities are accounted for using the same valuation principles that are used in the IFRS consolidated financial statements. The alignment is based on the assets held at 31 December 2025 and the coverage of the insurance policies per 31 December 2025.
Assets covered by the KPI are the assets qualifying as investments, excluding derivatives, exposures to central governments, central banks, supranational issuers and undertakings not in scope of the CSRD.
Assets qualifying as investments are investments held for own account, including mortgages and other loans (see section 7.5.5), investments relating to direct participating contracts (see section 7.5.6), investment property (see section 7.5.3), associates and joint ventures (see section 7.5.4), derivatives (see section 7.5.7), owner occupied property and investments in wind farms and solar parks reported under plant (see section 7.5.2).
The coverage ratio was calculated by dividing the covered assets by the total assets held by insurance undertakings.
The Taxonomy alignment percentage covers all six environmental objectives. Due to the phased entry into force of CSRD requirements, gradually more companies will report on the Taxonomy alignment of their economic activities. As a result, data availability on Taxonomy alignment will increase and should allow a.s.r. to enhance the quality of its Taxonomy disclosure over time.
Assumptions and limitations
Asset Management
To assess the eligibility and alignment of the investments, a.s.r. makes use of Taxonomy data from ESG data vendors. Data vendors are dependent on the Taxonomy information provided by the investee companies. a.s.r. only uses reported data from investees in scope of CSRD.
The classification of investees into financial and non-financial undertakings was done with data from data-vendors. If no data was available, the classification was determined using NACE codes. Most codes starting with K and M74.9 were considered financial undertakings. If no data was available, for certain investment funds and illiquid investments, the investment was categorised under other counterparties and real estate assets, and no eligibility and alignment data was disclosed in the numerator.
Real Estate
For assets not generating revenue, such as investment property, the CapEx based KPI is determined. The Turnover based KPI is set at an equal level to the CapEx based KPI.
Own source information was used to establish the eligibility and alignment of the real estate portfolio, such as knowledge of the underlying assets and operation.
The eligibility and alignment of real estate funds is assessed using the economic activities of the underlying assets in that fund. The information used to establish the eligibility and alignment of the real estate portfolio is provided by the fund manager based upon knowledge of the underlying assets and their operation.
To identify whether the real estate activity does no significant harm to the environmental objective climate change adaptation a.s.r. used the Climate Risk Monitor. This is an in-house-developed tool, in which the FCAB drawn up by the DGBC was implemented. For more information, see section 6.2.1.1.
Mortgages
Own source information, based on, amongst other, EPC labels (energieprestatiecertificaat) and the Climate Risk Monitor, was used to establish the eligibility and alignment of the mortgage loans (e.g. mortgage agreements).
Where an EPC label A was not available, an alternative assessment was applied to determine whether the underlying building qualifies within the national top 15% of energy‑efficient buildings, based on its operational Primary Energy Demand, using the methodology developed by Corporate Facility Partners (CFP). This methodology benchmarks the building's energy performance against the Dutch building stock constructed before 31 December 2020. This approach is recognised as a valid and robust alternative within the DEEMF framework and remains relevant under the most recent DEEMF‑SCC 2024 guidance.
The information for mortgage funds managed by third parties was provided by the fund managers.
To identify whether the mortgage activity does no significant harm to the environmental objective climate change adaptation, a.s.r. also used the Climate Risk Monitor.
- Commission Delegated Regulation (EU) 2026/73.
- Knab is excluded from total revenue, for a better comparison with current year, as Knab was sold during 2024.
6.3 Social
6.3.1 Own workforce
The workforce of a.s.r. constitutes the foundation upon which a.s.r.’s operations and achievements are built. To attract and retain the right people, a.s.r. is dedicated to offering an attractive employment package. The organisation places significant emphasis on employee development, engagement and vitality. a.s.r. has great confidence in its employees and encourages everyone to take control of their own careers, development and the way they do their work. Subsequently, a.s.r. seeks to improve diversity, equal treatment and inclusion in order to create the best workplace possible.
The following table presents a comprehensive overview of the material impacts and opportunities identified, along with the corresponding policies, actions and targets. The purpose of this table is to highlight the linkages and dependencies among these elements. See the SBM-3 table in section 6.1.4.3 for additional information on the impact, risks and opportunities identified.
7 - Working conditions - own workforce
| Materiality | IRO description | Scope | Policies | Actions | Targets |
|---|---|---|---|---|---|
| 7.1 a.s.r. has a positive impact on the working conditions of its employees, as it fosters a positive and equitable work environment. | a.s.r. own workforce |
| See section 6.3.1.3 for the actions |
|
8 - Other work-related rights - own workforce
| Materiality | IRO Description | Scope | Policies | Actions | Targets |
|---|---|---|---|---|---|
| 8.1 a.s.r. may have a negative impact on other work-related rights in case of privacy protocol breaches leading to compromised data. | a.s.r. own workforce |
| See section 6.3.4.3 for the actions | None |
9 - Equal treatment and opportunities for all
| Materiality | IRO description | Scope | Policies | Actions | Targets |
|---|---|---|---|---|---|
| 9.1 a.s.r. has a positive impact on equal treatment and opportunities for its employees as it provides a workplace that fosters equality, inclusion and training and skills development. | a.s.r. own workforce |
| See section 6.3.1.3 for the actions |
|
| 9.2 a.s.r. may have a negative effect on equal treatment and opportunities for its employees through its organisational practices. | a.s.r. own workforce |
| See section 6.3.1.3 for the actions |
|
| 9.3 a.s.r. may attract talented, motivated and engaged employees and achieve a positive reputation as a result of its commitment to providing equal treatment and opportunities for all employees. | a.s.r. own workforce |
| None | None |
6.3.1.1 Impacts, risks and opportunities
Interests and views of stakeholders
a.s.r.’s approach to determining its material impacts, risks and opportunities related to its own workforce for reporting year 2025 is described in section 6.1.4.
a.s.r. is committed to including all employees likely to be materially impacted by its operations, products, services and business relationships in the scope of its disclosures, whereby a.s.r. places a strong emphasis on the sustainable employability and well-being of its workforce. This is an integral part of its strategy to promote a healthy and productive work environment. Examples include offering flexible working hours, vitality programmes and a wide range of development opportunities through the a.s.r. academy. These initiatives help a.s.r. remain an attractive employer, which is essential for attracting and retaining talent.
a.s.r. ensures that all persons in its own workforce, who may be materially affected by a.s.r.’s operations, are included in its considerations and decision-making processes. This includes:
Employees:
Permanent employees: individuals with an ongoing employment contract;
Temporary employees: individuals with a fixed-term employment contract;
Both part-time and full-time staff.
Non-employees:
Self-employed individuals: contractors who supply labour directly to a.s.r.;
Agency workers: individuals provided by third-party companies primarily engaged in employment activities.
a.s.r. has developed an understanding of how people with certain characteristics, working in specific contexts or performing certain activities may be at greater risk of harm. This understanding is used to develop policies and initiatives to mitigate these risks.
By ensuring freedom of association, collective bargaining rights and social dialogue and by providing fair wages, reasonable work arrangements, work-life balance and health and safety standards, including vitality initiatives, a.s.r. cultivates a supportive and fair work environment that positively impacts employees' working conditions. Additionally, a.s.r. provides a workplace environment that fosters equity and inclusion. Initiatives such as the establishment of a Meedoendesk and having a 2026 target of 40% women and 40% men in management, the MB and the SB encourage diversity and enable individuals with disabilities to work at a.s.r. These inclusive practices have a positive impact on fostering equal treatment and opportunities for all employees.
Although a.s.r. has identified potentially negative impacts on its workforce, it has not reported widespread or systemic negative impacts and individual incidents are addressed through a robust internal process. Additionally, a.s.r. has not identified any material risks arising from impacts and dependencies on its own workforce. Neither has a.s.r. identified any material impacts on its own workforce that may arise from transition plans for reducing negative impacts on the environment and achieving greener and climate- neutral operations. Lastly, no operations at significant risk of incidents of forced labour or compulsory labour of child labour have been identified.
The sections presented hereafter outline the policies, actions and targets a.s.r. has adopted that address the identified material topics as well as the processes a.s.r. has implemented for engaging with people in its workforce and to remediate negative impacts including channels for employees to raise concerns.
6.3.1.2 Policies
a.s.r. has adopted various policies to manage its material impacts and opportunities related to its own workforce:
Code of Conduct 7.19.19.29.3
The a.s.r. Code of Conduct is a foundational policy that outlines the ethical standards, behaviour and values expected of all employees. It supports a.s.r.’s mission to be a responsible insurer, a people-oriented employer and a sustainable contributor to society. The MB is accountable for adherence to the Code of Conduct, with the support of Compliance, Human Resources (HR) and the management teams of the product lines.
The Code states that a.s.r. respects and subscribes to the United Nations Global Compact (UNGC), the United Nations Guiding Principles on Business and Human Rights (UNGPs) and the OECD Guidelines for Multinational Enterprises.
It serves as a guiding framework for actions and decisions, ensuring that responsibilities are fulfilled with care and integrity. The Code applies to all employees (permanent, temporary and external) and sets clear expectations for professional conduct, customer service and environmental responsibility. The policy is publicly available on the a.s.r. website.
Part of the Code of Conduct is the Code of Conduct for Undesirable Behaviour. In the Code of Conduct for Undesirable Behaviour, a.s.r. describes what constitutes undesirable behaviour, what the policy is, and which procedure is followed in the event of undesirable behaviour. Upon joining the organisation, all employees are required to affirm their commitment to ethical principles and compliance with the Code of Conduct by taking the oath or making a solemn affirmation.
Collective Labour Agreement 7.19.19.29.3
Since 2018, a.s.r. has its own Collective Labour Agreement (CLA), known as The Other CLA (De Andere Cao), which reflects ‘The story of a.s.r.’ and forms the foundation of its HR Policy. The Other CLA is a future-proof framework that supports autonomy, development and well-being for all employees. The CLA is publicly available on the a.s.r. website.
Structured around five key clusters - culture, development, time, vitality and mobility - the CLA promotes a mature working relationship based on trust, freedom of choice and shared responsibility. It encourages employees to take ownership of their careers through continuous dialogue, personal development plans and access to training and coaching. It also includes arrangements on vitality, mobility and work-life balance, such as the Working Independently of Time and Location (WITL) model, sabbaticals and various forms of leave. The agreement applies to all employees with a fixed-term or permanent contract who have not yet reached the state pension age.
The Other CLA was developed in collaboration with trade unions FNV Finance, De Unie and CNV, with active input from employees. Employee feedback was incorporated into the decision-making process, resulting in a widely supported and future-proof agreement.
By embedding these principles into daily operations, The Other CLA helps a.s.r. cultivate a resilient, engaged and inclusive workforce. The current CLA has a term of 21 months, running from 1 April 2025 to 1 January 2027, and is subject to a periodic review and approval by the Management Board.
Human Rights Policy 7.19.19.29.3
a.s.r. is committed to upholding human rights and aligning its operations with international conventions and guidelines, including the United Nations Guiding Principles on Business and Human Rights (UNGPs) and the OECD Guidelines for Multinational Enterprises. The Human Rights Policy, updated in 2024, is fully embedded across the organisation and publicly available on the a.s.r. website. The MB is accountable for the adherence of the Human Rights Policy, with the support of Compliance, HR and the management teams of the product lines.
The policy supports a.s.r.’s ambition to foster a sustainable and inclusive society by integrating respect for human rights into all business activities. It prohibits human trafficking, forced labour and child labour, and ensures that both a.s.r. and its business partners operate free from such practices. These commitments are reinforced through the a.s.r. Code of Conduct, which includes a complaints procedure for customers, a human rights reporting desk and a Whistleblower Scheme for reporting potential abuses or irregularities.
Through regular risk assessments, stakeholder engagement and transparent reporting, the Human Rights Policy ensures that a.s.r. actively prevents and mitigates potential human rights risks. This contributes to long-term value creation and a resilient, future-proof organisation. The Human Rights Policy is publicly available on the a.s.r. website.
Remuneration Policy 7.19.19.29.3
a.s.r.’s Remuneration Policy is a key instrument in supporting long-term value creation, managing risks responsibly and seizing opportunities for sustainable growth. It reflects a.s.r.’s role in society and its commitment to fair, transparent and responsible business practices.
a.s.r. offers a remuneration framework that is aligned with its values and stakeholder expectations. The Remuneration Policy is designed to:
Promote sustainable value creation by focusing on fixed remuneration;
Support sound risk management by ensuring alignment with capital and solvency requirements;
Foster integrity and trust by embedding non-financial performance criteria, such as customer interest, compliance and sustainability, into performance assessments;
Ensure fairness and inclusion through gender-neutral pay practices and internal consistency across roles and functions;
Reflect societal expectations by maintaining transparency in how remuneration is determined and disclosed.
The policy applies to all employees within the a.s.r. group and is tailored to meet the specific regulatory requirements of its various business entities. It is governed by a robust framework involving HR, the Remuneration Committee, the SB and the General Meeting of Shareholders. The Remuneration Policy is publicly available on the a.s.r. website.
For more information on the Remuneration Policy, see section 5.3.2.
Diversity, Equity and Inclusion Policy 7.19.19.29.3
At a.s.r., embracing diversity, equity and inclusion (DEI) is essential to building a resilient and thriving workforce. The DEI Policy, which applies to all employees and is overseen by HR, is founded on the belief that embracing differences strengthens and enhances a.s.r. Furthermore, a.s.r. fosters an inclusive culture in which all employees, regardless of gender, age, cultural background, sexual orientation, physical or mental ability, feel welcome, valued and empowered to contribute.
a.s.r. has set clear objectives to ensure progress, including gender diversity targets across all management layers, annual gender pay gap analyses and participation goals for individuals distanced from the labour market. Recruitment and promotion processes are designed to be objective and inclusive, with measures such as diverse interview panels and assessments focused on agility and potential.
To support sustainable employability and personal development, a.s.r. offers inclusive training programmes, on-boarding experiences and development budgets. The WITL model, along with flexible leave options such as rainbow and transition leave, empower employees to maintain a healthy work-life balance while respecting individual customs and beliefs.
Inclusive leadership is actively cultivated through the Leadership Education programme, which addresses unconscious bias, psychological safety and inclusive communication. Employee-led communities for younger employees, LGBTQ+ colleagues, women and individuals with a bicultural background play a vital role in fostering connection and awareness.
Externally, a.s.r. collaborates with organisations such as Talent naar de Top, the Diversity Charter of the SER, Agora Network and Workplace Pride to promote diversity and inclusion beyond its own workplace. Through initiatives such as the MeedoenDesk and social coaching programmes, a.s.r. creates pathways for vulnerable groups to enter and grow within the labour market.
DEI is embedded in a.s.r.’s strategy, operations and culture. a.s.r. continuously evaluates its efforts, encourages open dialogue and takes action to ensure a safe, respectful and equitable working environment for all. The policy is publicly available on the a.s.r. website.
Health and Safety Policy Plan 7.1
a.s.r. is committed to creating a safe, healthy and inclusive working environment in which employees can thrive. The Health and Safety Policy applies to all employees and outlines a comprehensive and preventive approach to occupational well-being, grounded in legal frameworks, CLAs and sector-specific standards.
The policy is designed to support employees in maintaining their vitality and sustainable employability, both at the office and when working independently of time and location. The Health and Safety Policy was developed in consultation with the OR’s Social Policy Committee and is accessible to all employees via the a.s.r. intranet.
Key elements of the policy include periodic Risk Inventories and Evaluations (RI&E) and Preventive Medical Examinations (Preventief Medisch Onderzoek – PMO), which help identify and address physical, psychosocial and organisational risks. These assessments inform targeted action plans tailored to each business unit. Topics such as workload, WITL, sedentary behaviour and stress management are addressed through workshops, vitality software and awareness campaigns.
a.s.r. also facilitates ergonomic workplace set-ups, both at home and in the office, through the 'Vitally Fitted Home' programme and offers access to company fitness, confidential advisors and a social fund for employees in financial distress. Preventive measures are further supported by clear protocols for emergency response, workplace accidents and undesirable behaviour, all embedded in a culture of mutual respect and open dialogue.
The implementation of this policy is a shared responsibility across the EB, management, HR, prevention officers, the Dutch Occupational Health and Safety Service and employee representation. Together, a.s.r. fosters a working environment that promotes well-being, resilience and sustainable performance.
Privacy and Data Retention Policy 8.1
As a responsible employer, a.s.r. processes a substantial volume of employee data, ranging from personal details to employment records and other sensitive information, which is essential for effective workforce management. To mitigate privacy risks, a.s.r. has implemented a robust Data Retention Policy that ensures secure, lawful and transparent data processing. For more information, see section 6.3.4.2. Furthermore, for people who are or have been employed by a.s.r., the Privacy Statement Employees is applicable.
Engaging with own workforce and workers’ representatives about impacts
a.s.r. values employee involvement to inform its decisions or activities aimed at managing the actual and potential impacts on its own workforce and in achieving its strategic objectives.
To support this, the organisation facilitates dialogue and information sessions to inform employees about key developments and to gather feedback. Workshops and training sessions are also offered to strengthen employee knowledge and skills.
The OR plays an essential role in employee representation. In accordance with the Dutch Works Councils Act, the OR provides advice on and consent to major decisions that affect employees, such as reorganisations and terms of employment. OR members are exempt from regular duties for 40% of their working hours. Subcommittees per business unit ensure local representation.
a.s.r. maintains regular dialogue with trade unions De Unie, CNV and FNV Finance. Quarterly and ad hoc meetings are held to discuss the CLA and social plans. For the outcome of the most recent CLA agreement and related actions, see section 3.2.4.
Sustainability is embedded in employee engagement. The quarterly Sustainable Business Report, shared with the EB and the OR sustainability committee, monitors progress on non-financial targets such as emissions reduction. The Sustainability department meets quarterly with the committee. The a.s.r. academy offers training on topics such as vitality and inclusion.
To monitor employee sentiment, a.s.r. uses the weekly eMood® pulse check, focusing on job satisfaction, productivity and vitality. Insights from this survey help HR provide targeted support, such as assertiveness training and stress management. Feedback is used to evaluate and improve HR policies, fostering a culture of continuous improvement and engagement. For further information regarding the eMood® pulse check and outcome, see section 3.2.4.
Each year, a.s.r. conducts the Culture scan from Denison. This scan provides insights into the cultural dynamics within the organization and their impact on performance. It measures aspects such as engagement, compares the results against international benchmarks and delivers feedback down to the team level. Based on the outcomes, concrete action points are formulated.
Processes to remediate negative impacts and channels to raise concerns
a.s.r. is committed to providing a safe, respectful and transparent working environment. To support this, structured procedures are in place to enable employees to raise concerns and to ensure appropriate remediation of negative impacts.
Channels for raising concerns
Employees can report concerns through various internal channels, including their manager, HR advisor, vitality specialist, confidential advisor, the Complaints Committee for Undesirable Behaviour, the Human Rights or Integrity Reporting Points, the OR or via the Whistleblower Scheme. If senior management is involved, reports can be made directly to HR or Compliance. External reporting is also possible through independent bodies such as the House for Whistleblowers, the DNB, the AFM, the Dutch Data Protection Authority (Autoriteit Persoonsgegevens - AP) or the Dutch Authority for Consumers and Markets (Autoriteit Consument & Markt - ACM).
Remediation procedures
a.s.r. has implemented three key procedures:
The General Complaint Procedure addresses concerns about unfair treatment. Complaints are reviewed by the General Complaints Committee, which ensures compliance with the CLA and internal guidelines.
The Undesirable Behaviour Complaint Procedure is available when informal resolution attempts fail regarding undesirable behaviour, including discrimination. A multidisciplinary committee investigates the complaint, ensures confidentiality and concludes with an aftercare conversation.
The Whistleblower Scheme allows employees to report (suspected) misconduct confidentially and safely. Reports may be made anonymously and are investigated thoroughly. Whistleblowers are protected from retaliation under the Dutch Whistleblower Protection Act. For more information on the Whistleblower Scheme, see section 5.5.2.
These procedures are actively communicated through internal channels and training. a.s.r. encourages employees to speak up without fear of retaliation or adverse consequences. Confidentiality is guaranteed and support is available throughout the process.
All reports are documented and monitored. HR and Compliance are responsible for evaluating the effectiveness of these mechanisms. Investigations are conducted within defined timelines and outcomes are shared with involved parties. Feedback obtained through reporting mechanisms is systematically reviewed and utilised to enhance policies and promote a culture of trust, transparency and accountability. Regular reviews and training ensure alignment with legal and regulatory requirements.
6.3.1.3 Actions
7.19.19.2
a.s.r. actively addresses material impacts, risks and opportunities related to its workforce through targeted actions. These actions are continuously evaluated to ensure effectiveness and alignment with employee well-being.
Working conditions
New CLA and pension agreement
a.s.r. actively manages working conditions through a comprehensive approach to employee well-being, engagement and sustainable employability. In 2025, negotiations for a renewed CLA focused on three pillars:
Attractive employment conditions, including competitive salaries and a recently renewed salary structure;
Healthy work-life balance, through annual hours system, autonomy, flexible working, vitality and other initiatives;
Pension and other employment conditions, including ample development opportunities.
This has resulted in a new collective labour agreement valid from 1 April 2025 to 1 January 2027.
In 2025, a.s.r. continued to expand its sustainable mobility programme, aiming to develop an integrated and future-proof Mobility Policy that supports both climate objectives and employee's needs. The programme is structured in three phases, each contributing to a more holistic and inclusive approach to mobility:
In the first phase, the lease policy was reviewed and updated in consultation with the OR. The revised policy came into effect on 1 July.
The second phase involved a comprehensive mobility analysis, conducted with support from an external provider, to assess commuting patterns and mobility needs across a.s.r. locations.
In the final phase, a.s.r. is evaluating the feasibility of a digital mobility platform to support employees in managing travel options.
These efforts are guided by the principles of the mobility policy, which emphasise sustainability and flexibility. By investing in a modern and responsive mobility framework, a.s.r. aims to contribute to climate goals, enhance employee satisfaction, and remain an attractive employer in a competitive labour market.
Pay transparency
In preparation for the EU Pay Transparency Directive, a.s.r. began aligning its HR and remuneration policies in 2025. Anticipating national legislation by 2027, key actions include updating internal policies, engaging stakeholders, and developing tools for reporting and communication. These efforts aim to ensure compliance, promote equal pay and strengthen transparency across the organisation.
Equal opportunities
a.s.r. is committed to fostering a diverse, equitable and inclusive working environment. In 2025, next to the existing interventions, new targeted interventions were introduced to promote equal treatment and accelerate progress towards gender diversity in leadership. These measures form part of a.s.r.’s broader DEI strategy:
Gender-balanced shortlists: a.s.r. implemented a mandatory requirement for gender-balanced shortlists in recruitment processes. This replaces the previous minimum of one female candidate and ensures equal representation of men and women. If there are insufficient number of female candidates, vacancies are automatically opened externally, including via search agencies, until balance is achieved.
Part-time flexibility in leadership roles: recognising that part-time work is often overlooked for management positions, a.s.r. explicitly enabled (team) managers to perform their roles in four days per week. This measure aims to remove barriers for female candidates seeking improved work-life balance and to retain valuable talent.
These initiatives support a.s.r.’s strategic target to achieve at least 40% female representation in the SB, MB and management by 2026.
Inclusion
To further strengthen social inclusion, a.s.r. renamed the Participatiedesk to Meedoendesk and expanded its scope in line with the definition of the Prestatieladder Sociaal Ondernemen (PSO). This enables a.s.r. to support a broader group, including Work and Income according to Labour Capacity Act (Wet Werk en Inkomen naar Arbeidsvermogen – WIA) beneficiaries and refugees. The registration of target groups in the HR system has been enhanced to facilitate more effective monitoring of progress towards DEI objectives.
Other work-related rights
In 2025, a.s.r. strengthened its commitment to employee well-being and a safe, inclusive work environment through a broad set of initiatives.
Initiatives related to absenteeism
A company-wide Vitality Scan provided employees with insights into their energy levels and stressors, with targeted follow-up support offered to those at risk. The results served as input for the HR annual Vitality plan.
In 2025, a.s.r. conducted the RI&E, including a qualitative study on psychosocial workload. The results are being translated into a thematic action plan and incorporated into a.s.r.'s Occupational Health and Safety Policy.
The renewed contract with the occupational health service provider introduced enhanced preventive services, including on-site health checks, and improved access to lifestyle coaches and psychologists.
To foster open dialogue, a.s.r. addressed sensitive topics such as sleep, women's health and serious illness, encouraging conversations around well-being.
Movement during the workday was promoted through the campaign 'Movement starts with less sitting', developed in collaboration with Vitality, Services, and the Wandelbond working group.
A study on mental health among younger employees was conducted, with follow-up actions developed in partnership with HR Development.
Creating a safe and respectful workplace remained a priority. a.s.r. tackled unwanted behaviour through visual tools, team discussions via eMood®, internal communications, and the interactive game Wat doe ik?, making support routes more visible and accessible.
Employee turnover
To prevent unwanted employee turnover, a.s.r. adopted an integrated approach focused on engagement, leadership and culture. Managers play a key role in fostering a positive work environment through coaching leadership. Flexible employment conditions support work-life balance and sustainable employability. Structured exit interviews and data analysis help identify improvement areas, while targeted talent development initiatives aim to retain valuable employees and strengthen internal mobility.
6.3.1.4 Targets
a.s.r. is committed to creating an inclusive, positive and equitable workplace where all employees feel valued and respected. The effectiveness of the measures a.s.r. takes to achieve this are monitored through the current management reports. a.s.r. has set the following targets related to its workforce.
For the targets, 64% of a.s.r.’s own workforce is in scope. This scope covers a.s.r.’s own employees, excluding those employed by D&S Holding, HumanTotalCare, Robidus and Corins. Redundant employees, employees employed through the Meedoendesk and non‑employees are excluded from the definition of a.s.r.’s own workforce.
The diversity quota is the number of female employees in senior positions in comparison to the total number of employees, measured in headcount. Through recruitment and career progression, a.s.r. aims to create a diverse workforce that reflects society.
S1-5 Diversity quota
| (in %) | Base year | Baseline value | 31 December 2024 | 31 December 2025 | Target 2026 |
|---|---|---|---|---|---|
| Supervisory Board | 2024 | 43% | 43% | 43% | 40% |
| Management Board | 2024 | 50% | 50% | 50% | 40% |
| Management1 | 2024 | 32% | 32% | 34% | 40% |
- Management includes senior, higher and team management.
a.s.r. continues to work towards realising a minimum of 40% women and 40% men in the total of all senior, higher and team management positions by the end of 2026. In 2025, a.s.r. went from 32% women in 2024 to 34% women in management positions. a.s.r. continues to implement and strengthen various actions across all layers of the organisation in order to help reach the target for 2026. Actions that have been taken thus far include, but are not limited to, adjusting the recruitment process to increase the hiring and recognition of female talent, training all management on DEI and identifying male and female role models throughout the organisation.
Methodology 9.19.29.3
Diversity quota
Scope
In scope are a.s.r.'s SB, MB and Management (which includes senior, higher and team management) employed by a.s.r. at year-end. Not in scope are employees employed by D&S Holding, HumanTotalCare, Robidus and Corins.
Methodology
The total headcount of female employees in the SB, the MB and Management is divided by the total employees in the SB, the MB and Management positions, respectively. For details, see section 6.6.2.3.
No stakeholders were involved in the target setting. This strategic non-financial target was communicated during the CMD in June 2024. For details, see section 2.4.1.2.
Employee engagement is measured through the annually performed Culture scan from Denison.
S1-5 Employee engagement
| (in percentile) | Base year | Baseline value | 2024 | 2025 | Target 2026 |
|---|---|---|---|---|---|
| Denison Culture Scan | 2024 | 73 | 73 | 71 | 85 |
The target for 2026 is to achieve an engagement score of at least 85. This target is one of the strategic non-financial targets as communicated during the CMD in June 2024.
In 2024 and 2025 a.s.r. expected an effect on the engagement score due to the business combination with Aegon NL. In 2025 the engagement score, which was measured in Q1 2025, showed a slight decrease from 73 to 71. Higher engagement scores were observed in business lines where integration was in a further stadium. Therefore, we believe that the continued focus on integration throughout 2025 is expected to further increase the engagement score in the coming year. An additional action plan was also made. The target for end of 2026 remains unchanged.
Methodology 7.19.19.29.3
Employee engagement
Scope
The Culture scan from Denison is distributed to all employees, including external staff, Meedoendesk employees and interns, except for employees employed by D&S Holding, HumanTotalCare, Robidus and Corins.
Methodology
The engagement score is measured on the basis of four drivers of engagement: vision, core values, empowerment and capability development. Each participant rates a set of statements on a five-point scale, ranging from 'strongly disagree' to 'strongly agree'. The average results are subsequently compared with a global benchmark of more than 1,200 large organisations that use the Culture scan from Denison. As a result, the outcomes are expressed in percentiles, indicating the proportion of organisations that score lower than, equal to or higher than a.s.r. on each engagement dimension. For details, see section 6.6.2.3.
No stakeholders were involved in the target setting. This strategic non-financial target was communicated during the CMD in June 2024. For details, see section 2.4.1.2 and section 3.2.4.
To support individuals with a vulnerable position in the labour market, a.s.r. has established the Meedoendesk.
S1-5 Employees at a distance to the labour market
| (in headcount) | Base year | Baseline value | 31 December 2024 | 31 December 2025 | Target 2026 |
|---|---|---|---|---|---|
| Meedoendesk | 2024 | 71 | 71 | 88 | 70 |
By 2026, a.s.r. aims to employ at least 70 people with a distance to the labour market. This target is set as a minimum threshold and was successfully met in 2025, with 88 employees.
To further strengthen social inclusion, the Participatiedesk was renamed to the Meedoendesk and its scope was expanded in line with the PSO. This allows a.s.r. to support a broader group, see section 6.3.1.2.
Methodology 9.19.2
Employees at a distance to the labour market
Scope
In scope are employees within a.s.r.’s own workforce who are employed at year-end, including employees employed through the Meedoendesk. Not in scope are employees employed by D&S Holding, HumanTotalCare, Robidus and Corins.
Methodology
Total headcount of employees employed through the Meedoendesk. For details, see section 6.6.2.3.
No stakeholders were involved in the target setting.
S1-5 Internally filled vacancies
| (in %) | Base year | Baseline value | 2024 | 2025 | Target 2025 |
|---|---|---|---|---|---|
| Internally filled vacancies | 2024 | 51% | 51% | 45% | 40% |
a.s.r. aims to fill at least 40% of all vacancies internally to retain knowledge and culture within the company. This target serves as a minimum threshold.
In 2025 the target was achieved with 406 of 908 vacancies filled internally, equating to 45% (2024: 51%). Due to reorganisations across various departments related to integrations, internal staff movements were relatively high in 2024. In 2025, these dynamics have started to normalise.
Methodology 9.19.29.3
Internally filled vacancies
Scope
In scope are employees within a.s.r.’s own workforce who are employed during the reporting year. Not in scope are employees employed by D&S Holding, HumanTotalCare, Robidus and Corins.
Methodology
The number of vacancies filled by internal a.s.r. employees divided by the total number of filled vacancies in the reporting year. For details, see section 6.6.2.3.
No stakeholders were involved in the target setting.
S1-5 Employee turnover
| (in %) | Base year | Baseline value | 2024 | 2025 | Target 2026 |
|---|---|---|---|---|---|
| Employee turnover | 2024 | 12% | 12% | 12% | 10% - 16% |
In 2025, a.s.r.'s overall employee turnover rate decreased to 11.8% (2024: 12.4%). This employee turnover is within the norm and reached the target for 2025 (10%-16%). Voluntary turnover accounted for the largest share: 33% of all exits consisted of employees who decided to leave a.s.r. Additionally, 29% of the exits took place through the Social Plan.
Methodology 7.1
Employee turnover
Scope
In scope are employees within a.s.r.’s own workforce who are employed during the reporting year, including redundant employees and employees employed through the Meedoendesk. Not in scope are employees employed by D&S Holding, HumanTotalCare, Robidus and Corins.
Methodology
The turnover percentage is the headcount of employees who left a.s.r. in the reporting year as a percentage of the total average employee headcount in the reporting year. For details, see section 6.6.2.3.
No stakeholders were involved in the target setting.
S1-5 Absenteeism
| (in %) | Base year | Baseline value | 2024 | 2025 | Target 2025 |
|---|---|---|---|---|---|
| Absenteeism rate | 2024 | 4.5% | 4.5% | 4.2% | 4.2% |
| Nil absenteeism | 2024 | 56.2% | 56.2% | 57.0% | 58.0% |
The absenteeism rate at a.s.r. developed positively and fell from 4.5% in 2024 to 4.2% in 2025, a decrease of 0.3 percentage points. This means that a.s.r. has achieved its absenteeism target of 4.2% for 2025. Contrary to the national trend of rising absenteeism, this improvement underlines the effect of a.s.r. efforts in the areas of prevention and vitality.
Methodology 7.1
Absenteeism
Scope
In scope are employees within a.s.r.’s own workforce who are employed during the reporting year, including redundant employees and employees employed through the Meedoendesk. Not in scope are employees employed by D&S Holding, HumanTotalCare, Robidus and Corins.
Methodology
The absenteeism rate is the percentage of calendar days that employees called in sick compared to the total calendar days in the reporting period. Maternity leave and pregnancy-related sickness are excluded. Nil absenteeism is the proportion (in %) of employees who have not reported sick during the reporting period. For details, see section 6.6.2.3.
No stakeholders were involved in the target setting.
6.3.1.5 Metrics
Characteristics of a.s.r.'s employees
S1-6 Characteristics of a.s.r.'s employees (headcount)
| (in headcount) | 31 December 2025 | 31 December 2024 | ||||||||
|---|---|---|---|---|---|---|---|---|---|---|
| Female | Male | Other | Not reported | Total | Female | Male | Other | Not reported | Total | |
| Total number of employees | 4,904 | 4,813 | 1 | - | 9,718 | 3,714 | 4,284 | - | - | 7,998 |
| Permanent employees | 4,454 | 4,336 | - | - | 8,790 | 3,281 | 3,900 | - | - | 7,181 |
| Temporary employees | 449 | 476 | 1 | - | 926 | 433 | 384 | - | - | 817 |
| Non-guaranteed hours employees | 1 | 1 | - | - | 2 | - | - | - | - | - |
| Full-time employees | 1,386 | 3,385 | - | - | 4,771 | 1,174 | 3,120 | - | - | 4,294 |
| Part-time employees | 3,518 | 1,428 | 1 | - | 4,947 | 2,540 | 1,164 | - | - | 3,704 |
The increase in the number of employees is a result of the acquisition of HumanTotalCare, see section 6.1.2.
S1-6 Characteristics of a.s.r.'s employees (turnover)
| 31 December 2025 | 31 December 2024 | |
|---|---|---|
| Number of employees who have left the company (in headcount) | 1,053 | 1,076 |
| Employee turnover (in %) | 11% | 12% |
Methodology
Employees
Scope
The scope of this disclosure covers all employees within a.s.r.’s own workforce who are employed at year‑end. The number of employees refer to headcount. Not included in the definition of employees within the own workforce are redundant employees, employees employed through the Meedoendesk and non-employees. However, for the employee turnover redundant employees and employees employed through the Meedoendesk were included.
Methodology
The turnover percentage is the headcount of employees who left a.s.r. in the reporting year as a percentage of the total average employee headcount in the reporting year. The scope of the S1-6 turnover metrics deviates from the scope of the S1-5 turnover target. Employees employed by Corins, D&S Holding, Robidus and HumanTotalCare are included in the S1-6 turnover metric.
Definition of permanent and temporary employees.
Permanent employees: individuals with an ongoing employment contract;
Temporary employees: individuals with a fixed-term employment contract.
A full-time employee works a minimum of 38 hours per week. A part-time employee is any person working less than 38 hours per week.
Assumptions and limitations
The estimation model (see section 6.6.2.1) was used for D&S Holding, representing 12% of total employees in scope.
S1-7 Number of non-employees (numbers)
| (in headcount) | 31 December 2025 |
|---|---|
| Self-employed | 657 |
| People provided by undertakings primarily engaged in employment activities | 885 |
| Total of non-employees | 1,542 |
Methodology
Non-employees
Scope
The scope of this disclosure covers all employees within a.s.r.’s own workforce who are employed at year‑end. Non-employees include individuals who contribute to the operations but are not directly employed under standard employment contracts.
Two categories of non‑employees are included in this disclosure:
Self‑employed individuals: contractors who supply labour directly to a.s.r.;
Agency workers: individuals provided by third‑party companies primarily engaged in employment activities.
S1-8 Collective bargaining coverage and social dialogue (percentages)
| (in %) | 31 December 2025 | 31 December 2024 |
|---|---|---|
| Collective bargaining agreements | 83% | 79% |
| Social dialogue | 100% | 100% |
In 2025, 83% of a.s.r.'s workforce is covered by CLAs. Compared with 2024, this has increased as a result of the acquisition of HumanTotalCare.
Methodology
Collective bargaining agreements
Scope
The scope of this disclosure covers all employees within a.s.r.’s own workforce who are employed at year‑end.
Methodology
All data used to report on the CLA coverage and social dialogue were obtained through direct measurement.
Diversity metrics
S1-9 Diversity metrics (gender)
| 31 December 2025 | 31 December 2024 | |||
|---|---|---|---|---|
| in headcount | in % | in headcount | in % | |
| Supervisory Board | ||||
| Female | 3 | 43% | 3 | 43% |
| Male | 4 | 57% | 4 | 57% |
| Other | - | 0% | - | 0% |
| Not reported | - | 0% | - | 0% |
| Total | 7 | 100% | 7 | 100% |
| Management Board | ||||
| Female | 3 | 50% | 3 | 50% |
| Male | 3 | 50% | 3 | 50% |
| Other | - | 0% | - | 0% |
| Not reported | - | 0% | - | 0% |
| Total | 6 | 100% | 6 | 100% |
| Management | ||||
| Female | 145 | 33% | 137 | 31% |
| Male | 290 | 67% | 298 | 69% |
| Other | - | 0% | - | 0% |
| Not reported | - | 0% | - | 0% |
| Total | 435 | 100% | 435 | 100% |
S1-9 Diversity metrics (age group)
| (in headcount) | 31 December 2025 | 31 December 2024 |
|---|---|---|
| Under 30 years old | 1,069 | 875 |
| 30-50 years old | 5,211 | 4,313 |
| Over 50 years old | 3,438 | 2,810 |
| Total employees | 9,718 | 7,998 |
Methodology
Gender distribution at top management level and age distribution of employees
Scope
The scope of this disclosure covers all employees within a.s.r.’s own workforce who are employed at year‑end.
The percentage of females reported under Management differs from the 34% reported in the press release and S1‑5. This difference is attributable to the broader scope applied under S1-9, which also includes D&S Holding, HumanTotalCare, Robidus and Corins.
Methodology
Gender distribution is reported per management type and is based on the split between female, male and other. This metric distinguishes between the SB, the MB and management, which includes senior, higher and team management.
For gender diversity, a.s.r. considers MB positions within D&S Holding, Robidus, Corins and HumanTotalCare - such as CEO, CFO, COO and other executives with decision-making authority - a part of a.s.r. management.
Age distribution is grouped into three categories: younger than 30 years, between 30 and 50 years, and older than 51 years.
Assumptions and limitations
The estimation model was used for the allocation across age groups for D&S Holding, representing 12% of total employees in scope. For details, see section 6.6.2.1.
Adequate wages
At a.s.r., all employees are paid an adequate wage. This is ensured through a.s.r.'s Remuneration Policy, which aligns with the median level of the reference group.
Methodology
Adequate wages
Methodology
In order to determine whether all employees are paid an adequate wage, a.s.r. has used the Dutch financial sector as a benchmark. Therefore, all employees within a.s.r. and contractors with a.s.r. are paid an adequate wage.
Social protection
a.s.r. is committed to ensuring the well-being and social protection of its workforce. a.s.r.'s policies are designed to provide comprehensive support, fostering a healthy work-life balance and promoting sustainable employability. a.s.r. is committed to social insurance, which is mandatory and covers all employees.
At a.s.r., all employees are covered by social protection against loss of income due to major life events such as sickness, unemployment, employment injury and acquired disability, parental leave and retirement. This is mandatory for all employees that work and live in the Netherlands and is, therefore, incorporated into local policies.
S1-12 Persons with disabilities (percentage)
| (in %) | 31 December 2025 | 31 December 2024 |
|---|---|---|
| Female | 2.3% | 2.7% |
| Male | 1.5% | 1.5% |
| Other | - | - |
| Not reported | - | - |
| Total | 1.9% | 2.0% |
To further strengthen social inclusion, a.s.r. renamed the Participatiedesk to Meedoendesk and expanded its scope in line with the definition of the PSO. This enables a.s.r. to support a broader group. In comparison to 2024, the overall percentage has slightly decreased (0.1%), due to the acquisition of HumanTotalCare.
Methodology
Persons with disabilities
Scope
The scope of this disclosure covers all employees within a.s.r.’s own workforce who are employed at year‑end and the employees employed through the Meedoendesk.
Methodology
a.s.r. defines persons with disabilities as employees with long-term physical, mental, intellectual or sensory impairments which, in interaction with various barriers, may hinder their full and effective participation in society on an equal basis with others. All data used to report on this metric, except for D&S Holding, were obtained through direct measurement.
Assumptions and limitations
The estimation model (see section 6.6.2.1) was used for D&S Holding, representing 12% of total employees in scope.
S1-13 Participation in annual performance and career development reviews (coverage)
| (in %) | 31 December 2025 | 31 December 2024 |
|---|---|---|
| Female | 65% | 89% |
| Male | 80% | 90% |
| Other | 100% | - |
| Not reported | - | - |
| Total | 73% | 90% |
In 2025, coverage declined following the acquisition of HumanTotalCare, as no data was available at the time of reporting.
S1-13 Training and skills development metrics (average hours)
| (in hours) | 2025 | 2024 |
|---|---|---|
| Female | 6.9 | 5.9 |
| Male | 9.0 | 5.0 |
| Other | 9.7 | - |
| Not reported | - | - |
| Total | 8.0 | 5.4 |
In 2025, a.s.r. placed significant emphasis on AI, which together with the roll-out of extensive AI-training programmes, led to an increase in average training hours.
Methodology
Average training hours and coverage annual performance and career development reviews
Scope
The scope of this disclosure covers all employees within a.s.r.’s own workforce who are employed at year‑end.
Methodology
The duration of each training programme, attendance and year of training is determined and used for the calculation. To derive the average training hours, the number of training hours (per gender category) is divided by the total average headcount.
a.s.r. keeps track of all employees participating in training programmes via its own academy.
To derive the coverage of the annual performance and career development reviews, the number of employees that participated in regular performance and career development reviews (per gender category) is divided by the total average headcount.
HumanTotalCare is included in the metrics from 1 October 2025 onwards.
Assumptions and limitations
Following the acquisition of HumanTotalCare in 2025, no data was available regarding training hours at the time of reporting.
The estimation model was used for Corins, Robidus and D&S Holding, representing 17% of total employees in scope. For details, see section 6.6.2.1.
S1-14 Health and safety metrics (coverage)
| (in %) | 31 December 2025 | 31 December 2024 |
|---|---|---|
| Own workforce covered by health and safety management systems | 100.0% | 100.0% |
S1-14 Health and safety metrics (number of accidents)
| 2025 | 2024 | |
|---|---|---|
| Recordable work-related accidents (in number) | 1 | - |
| Recordable work-related accidents (rate)1 | 0.1 | - |
- Rate: number of cases per one million hours worked
S1-14 Health and safety metrics (number of fatalities)
| (in numbers) | 2025 | 2024 |
|---|---|---|
| Fatalities in own workforce as result of work-related injuries and work-related ill health | - | - |
| Fatalities of other workers working on undertaking's sites as result of work-related injuries and work-related ill health | - | - |
Methodology
Accidents at work and coverage health & safety management system
Scope
The scope of this disclosure covers all employees within a.s.r.’s own workforce who are employed at year-end (coverage) and during the reporting year (number of accidents and fatalities).
Methodology
Accidents reported under S1-14 are those that occur on the premises of a.s.r. offices. These may involve any type of employee who is injured or experiences physical complaints.
a.s.r. defines the number of fatalities as the number of employees who lost their lives due to work-related incidents.
HumanTotalCare is included in the metrics from 1 October 2025 onwards.
Assumptions and limitations
The estimation model was used for D&S Holding, representing 12% of total employees in scope. For details, see section 6.6.2.1.
S1-15 Work-life balance metrics (percentage)
| (in %) | 2025 | 2024 |
|---|---|---|
| Employees entitled to take family-related leave | 100.0% | 100.0% |
| Entitled employees that took family-related leave | ||
| Female | 9.0% | 7.5% |
| Male | 6.5% | 4.2% |
| Other | 0.0% | 0.0% |
| Not reported | 0.0% | 0.0% |
| Total | 7.8% | 5.8% |
a.s.r. understands the importance of a healthy work-life balance. Therefore, all employees are entitled to take family-related leave. In 2024, the scope for a.s.r. employees (excluding HumanTotalCare and Corins) included only new requests for family related leave. In 2025, the scope was expanded to include not only new leave requests submitted in the reporting year, but also ongoing requests that were originally submitted in previous years.
This led to an increase in the number of employees that took family-related leave. Furthermore, the increase in the share of employees taking family‑related leave is driven by HumanTotalCare, where the proportion of people taking leave is higher for both genders, but particularly for men.
Methodology
Family-related leave
Scope
The scope of this disclosure covers all employees within a.s.r.’s own workforce who are employed at year-end (employees entitled to take family-related leave) and during the reporting year (number of entitled employees that took family-related leave).
Methodology
The definition of family-related leave for a.s.r. includes short- and long care leave, parental leave, maternity leave, foster care and adoption leave and birth leave for partners. The disclosed amounts relate mostly to parental leave. While a.s.r. maintains records of other types of family-related leave, a formal reporting process for these types is not yet in place. As a result, figures for these other types of family-related leave are currently excluded.
For the entitled employees who took family-related leave as disclosed under S1-15, the number of employees who took family-related leave is divided by the average headcount of 2025.
HumanTotalCare is included in the metrics from 1 October 2025 onwards.
Assumptions and limitations
D&S Holding and Robidus applied the estimation model for this metric, amounting to 17% of total employees in scope. For further details, see section 6.6.2.1.
Remuneration metrics
S1-16 Remuneration metrics (gender pay gap and total remuneration)
| 2025 | 2024 | |
|---|---|---|
| Unadjusted gender pay gap (in %) | 16.7% | 19.0% |
| Median pay ratio | 18.9 | 18.2 |
The gender pay gap shows the difference in compensation between genders. The decrease in the unadjusted gender pay gap is partly the result of the active promotion of diversity in employment policies and a focus on equal pay for equal work. The diversity efforts are further reflected in the increased representation of women in management positions.
The unadjusted pay gap disclosed above is not adjusted for compensation-related factors, such as seniority and type of work. The unadjusted gender pay gap of a.s.r. excluding HumanTotalCare, D&S Holding, Robidus and Corins is 17.0% (2024: 18.0%).
The CEO remuneration increased in line with the (updated) collective labour agreement. a.s.r. broadened the scope for calculating the median pay by including HumanTotalCare, Robidus and Corins. In addition, a.s.r. experienced higher turnover among higher-paid employee groups, and the average age of employees leaving the company was higher than that of new joiners. As a result, the increase of the median salary was lower than the increase in CEO remuneration, resulting in an increase of the median pay ratio. Excluding HumanTotalCare, Robidus and Corins the median pay ratio would be 18.5.
For more information on the remuneration policy, see section 5.3.2.
For more information on gender equality, equal pay and the unadjusted gender pay gap, see section 6.3.1.2.
Methodology
Gender pay gap
Scope
The unadjusted gender pay gap covers the weighted average salaries of all employees within a.s.r.'s own workforce who are employed at year-end.
Methodology
The gender pay gap is shown as a percentage difference between the average gross hourly pay level of female employees and the average gross hourly pay level of male employees, calculated based on end of year FTEs.
Assumptions and limitations
a.s.r. used direct measurements for all employees within the own workforce, except for D&S Holding for which the estimation model was used, amounting to 12% of the employees that are included in this metric. For further details, see section 6.6.2.1.
Total remuneration ratio
Scope
The scope for this disclosure includes the employees within the own workforce of a.s.r. The total annual remuneration of the CEO includes all remuneration components (such as fixed remuneration, the share-based part of the remuneration, social contributions, pension and expense allowance), as included in the consolidated financial statements. Several short-term benefits are not considered.
The remuneration ratio did not take into account employees within the own workforce who were not employed for the whole reporting year and part-time employees. These employees were excluded from the calculation of the ratio because accurate extrapolation to full-time employees was not considered possible due to certain loan components.
Methodology
The total remuneration ratio of the highest-paid individual, a.s.r.’s CEO, was calculated as a ratio of the total annual remuneration of the CEO to the median salary of an FTE (excluding compensation of the CEO).
The median salary is used when deriving the median pay ratio. This differs from the pay ratio reported under the Dutch Corporate Governance Code where the average salary is used and external staff is included.
Assumptions and limitations
For the remuneration ratio, the median salary of a.s.r. employees including HumanTotalCare, Robidus and Corins is considered to be representative for the median salary of D&S Holding. D&S Holding amounts to 12% of total employees in scope. For further details, see section 6.6.2.1.
Incidents, complaints and severe human rights impacts
S1-17 Incidents, complaints and severe human rights impacts (incidents)
| (in numbers) | 2025 | 2024 |
|---|---|---|
| Incidents of discrimination including harassment | 5 | 2 |
| Complaints filed through channels to raise concerns | 46 | 37 |
| Total amount of fines, penalties and compensation for damages as a result of incidents and complaints | - | - |
In 2025, a total of 46 complaints were recorded. Compared to 2024, this represents an increase of nine recorded complaints. The increased awareness and visibility of the confidential counsellor and the internal communication on integrity, safety and reporting procedures, can contribute to a higher level of reporting. The complaints filed through the designated channels are handled as described in section 6.3.1.2.
The total number of complaints and incidents reported for 2024 has been restated from 5 to 39 and includes the complaints submitted via both a.s.r. communication channels and via the externally appointed confidential counsellor.
S1-17 Incidents, complaints and severe human rights impacts (human rights impacts)
| (in numbers) | 2025 | 2024 |
|---|---|---|
| Incidents of severe human rights | - | - |
| Incidents of severe human rights that are cases of non-respect of UN Guiding Principles and OECD Guidelines for Multinational Enterprises | - | - |
| Amount of material fines, penalties and compensation for severe human rights issues and incidents connected to own workforce | - | - |
Methodology
Incidents of discrimination and severe human rights incidents
Scope
The scope of this disclosure covers all employees within a.s.r.’s own workforce who were employed during the reporting year.
HumanTotalCare is included in the metrics from 1 October 2025 onwards.
Methodology
a.s.r. monitors incidents of discrimination, harassment and severe human rights violations through an integrated dataset compiled by Labour Affairs, Compliance and Investigations Department. Multiple reporting channels are available for submitting complaints or grievances within a.s.r., including those related to discrimination and severe human rights incidents.
All data used to report the number of incidents and complaints, as well as the total amounts of fines, penalties, and compensation, were obtained through direct measurement.
6.3.2 Workers in the value chain
This section outlines a.s.r.'s commitment to addressing the material impact associated with workers in its value chain, focusing on key areas such as asset management, real estate and health activities.
The following table presents a comprehensive overview of the material impact identified, along with the corresponding policies, actions and targets. The purpose of this table is to highlight the linkages and dependencies among these elements. See the SBM-3 table in section 6.1.4.3 for additional information on the impact, risks and opportunities identified.
10 - Other work-related rights - workers in the value chain
| Materiality | IRO description | Scope | Policies | Actions | Targets |
|---|---|---|---|---|---|
| 10.1 a.s.r. may have a negative impact on working conditions and other work-related rights of employees and value chain workers of investee companies with operations or value chains in high-risk countries where forced and/or child labour risks are more common. Additionally, investee companies in certain high-risk sectors might not pay a living wage or income to their employees or value chain workers. Also, a.s.r. has a negative impact on the working conditions of healthcare workers, as it grants its insureds access to health care services. | Activities related to:
|
|
| See section 6.3.2.4 for the targets. |
6.3.2.1 Impacts, risks and opportunities
Interests and views of stakeholders
a.s.r.’s approach to determining its material impacts, risks and opportunities related to value chain workers for reporting year 2025 is described in section 6.1.4.
a.s.r. is committed to including all value chain workers likely to be materially impacted by its operations, products, services and business relationships in the scope of its disclosures.
Workers in the value chain who could be materially impacted by a.s.r. include employees and value chain workers of markets and companies, that a.s.r. financed and invested in through a.s.r. asset management and a.s.r. real estate. Additionally, health care workers could be materially impacted by a.s.r. by providing insureds access to healthcare services through a.s.r. health. These workers may include workers on-site who are not part of the own workforce, those in the upstream and downstream value chains and particularly vulnerable groups.
a.s.r. has identified significant risks of forced labour and child labour in value chains of portfolio companies, particularly in specific geographic areas and sectors. These risks include both systemic issues and individual incidents.
a.s.r. developed an understanding of how workers with particular characteristics, those working in particular contexts or those undertaking particular activities may be at greater risk of harm. It achieved this through regular human rights risk assessments, engagement with investee companies in high-risk sectors particularly in the consumer discretionary and staples sector, financial sector and IT sector as well as consultations with health sector associations and unions.
The sections presented hereafter outline the policies, actions and targets a.s.r. has adopted that address the identified material topic, as well as the processes for engaging with value chain workers and remediating negative impacts including the channels which a.s.r. has implemented for raising concerns.
6.3.2.2 Policies
a.s.r. has adopted various policies to manage its material impacts related to workers in the value chain:
Human Rights Policy 10.1
a.s.r. endorses and respects the basic principles of human rights, recognising that they are universal, interdependent and indivisible. a.s.r. adheres to international standards such as the International Bill of Human Rights, the UN Guiding Principles on Business and Human Rights (UNGPs), ILO Declaration on Fundamental Principles and Rights at Work and the OECD Guidelines for Multinational Enterprises, which apply to all companies. a.s.r. is committed to respecting and protecting human rights across its roles as investor, insurer, purchaser and employer. This commitment is embedded in the Human Rights Policy of a.s.r. and in the Policy on Responsible Investments of a.s.r. asset management. These policies are integrated into a.s.r.'s strategy and core activities, aiming to make a positive contribution to the sustainability of society and to minimise negative impacts. Concerns about negative impacts on human rights caused by activities of a.s.r. or its business partners can be directed to the Human Rights Reporting Point, which is managed by a.s.r.’s Compliance department. As outlined in the Human Rights Policy, a.s.r. will take responsibility and provide adequate compensation in the event of human rights violations resulting from its activities or within its value chain.
a.s.r. respects and protects human rights in its various roles:
Investor: a.s.r. screens investee companies on human rights controversies and excludes companies that severely and repeatedly violate human rights.
Provider of insurance and financial products: a.s.r. safeguards customer privacy, promotes equal treatment, and avoids discrimination in its products and services.
Purchaser: a.s.r. expects suppliers to respect and endorse human rights and requires them to sign the Code of Conduct.
Employer: a.s.r. strives for an inclusive culture, a safe working environment and regularly trains employees on the Code of Conduct.
The Human Rights Policy outlines a.s.r.’s governance structure, with the MB responsible for approval and annual evaluation. The policy is implemented by dedicated teams, including Team Sustainability, and is supported by regular training, monitoring and reporting mechanisms. a.s.r. reports on human rights performance in its Annual Report and engagement reports. The policy is publicly available on the a.s.r. website.
Policy on Responsible Investments 10.1
The Policy on Responsible Investments of a.s.r. asset management sets out a framework for integrating ESG factors into all investment decisions. a.s.r. asset management is guided by the policy goals of creating positive impact, driving change and reducing harm. Human rights is one of the policy’s thematic focus areas. a.s.r. asset management recognises that human rights violations by companies are often a result of systemic issues that cannot be resolved immediately. a.s.r. asset management is committed to adhering to the six human rights due diligence steps in line with the OECD Guidelines for Multinational Enterprises and the UNGPs. Similar expectations apply to companies in the investment portfolio as for business partners. For more information on the Policy on Responsible Investments, see section 6.2.1.4.
a.s.r. asset management's thematic position paper human rights and the Sustainability Strategy complement the Policy on Responsible Investments by setting out the approach in more detail, including on human rights risks and impacts in the portfolio and expectations from companies. They also elaborate on an analysis of human rights risks within the investment portfolio that a.s.r. asset management frequently conducts. The methodology of this assessment is based on guidance from the UN Principles for Responsible Investment and information from ESG data providers, as well as additional sources such as the OECD Watch National Contact Points database and the Business & Human Rights Resource Centre allegations and litigations database. From these data sources, information on company performance and controversies related to human rights is extracted. To validate the results of the analysis, a.s.r. asset management frequently meets with specialists and stakeholders.
Procurement Policy of Health 10.1
In the Dutch healthcare sector, joint agreements are in place to mitigate the negative impact on healthcare workers. These agreements are aimed at promoting good employment practices and making salaried employment more attractive, also aimed at reducing the workload for salaried staff. In the Integrated Care Agreement (Integraal Zorgakkoord – IZA), parties have made agreements regarding the use of self-employed staff.
Health insurers strive to reduce administrative burden and labour-saving care through digitalisation and innovation. Additionally, through the Future-Proof Labour Market Care & Welfare (Toekomstbestendige Arbeidsmarkt Zorg & Welzijn – TAZ) programme, health insurers aim to increase job satisfaction and reduce staff turnover, enhance (sustainable) employability, reduce absenteeism and make salaried employment more attractive. The implementation of the IZA and the TAZ programmes is the shared responsibility of several system parties as well as healthcare providers, insurers and care offices. The third-party agreements for TAZ and IZA were put together in consultation with all parties in the field under the direction of the Ministry of Health, Welfare and Sport (Ministerie van Volksgezondheid, Welzijn en Sport – VWS), taking into account the interests of employees working for Dutch healthcare providers.
The IZA agreements are incorporated into the procurement policies of Health. As a result, employees of contracted healthcare providers are in scope of these policies. The Health management team is accountable for the implementation of the Health Procurement Policy.
Joint policy and sectoral agreements of Health 10.1
As part of the sectoral initiatives with a.s.r.’s involvement, joint policies and actions are concluded, aiming to strengthen the collaboration across the sector and to address shared challenges. The following explanation provides further context regarding the sectoral initiatives and has been drafted in close collaboration with the sector.
The joint policy of the Dutch Health Insurers Association (Zorgverzekeraars Nederland) regarding employees in the value chain is laid down in sectoral agreements such as the IZA and the TAZ, and the Supplementary Care and Welfare Agreement (Aanvullend Zorg- en WelzijnsAkkoord - AZWA) agreed in July 2025. These agreements aim to promote good employment practices, make salaried employment more attractive, reduce workload and administrative burdens, and increase job satisfaction and sustainable employability. In addition, it has been agreed in the AZWA that health insurers actively contribute to reducing regulatory burden and improving the work experience of healthcare professionals. This is done, among other things, through the Regulatory Pressure Management Group (Regiegroep Aanpak Regeldruk), in which healthcare professionals are structurally involved through their professional associations in identifying bottlenecks and developing breakthrough projects. The policy applies to all employees of Dutch healthcare providers, both salaried and non-salaried, and covers the entire value chain.
Alignment with national and international standards
The policy is aligned with relevant national and international standards, including the UN Guiding Principles on Business and Human Rights, the ILO Declaration and the OECD Guidelines. The Netherlands has a comprehensive legal framework and collective bargaining agreements that protect against human rights violations, including human trafficking, child labour and forced labour. Specific requirements regarding human rights and working conditions are incorporated into the procurement and contracting process where necessary, supported by a Supplier Code of Conduct.
Development and stakeholder involvement
The development of the IZA, TAZ and AZWA programs takes place in consultation with all relevant stakeholders, under the supervision of the VWS, with the interests of employees and other stakeholders explicitly taken into account. The IZA, TAZ and AZWA programs are publicly available on the Dutch government website. Individual health insurers make their own policies and any supplementary measures accessible through their corporate websites and internal communication channels.
Monitoring, structural consultation and identification of bottlenecks
Within the AZWA, health insurers and ZN have an explicit and structural role in monitoring the progress and effectiveness of the agreements made, mainly aimed at averting the labour market shortage and improving the accessibility of care. Monitoring is essential to determine whether the actions taken lead to the desired labour savings, better accessibility and efficient use of resources. Through structural consultation with professional associations, trade associations and trade unions, bottlenecks are identified and actions are initiated to resolve them. There is a periodic evaluation of the progress and effectiveness of the measures taken
In addition to this joint effort in the healthcare sector, Health launched its own initiative in 2024, which is still active in 2025: an inspiring gathering for contracted community nursing and home care (Verpleeg-en Verzorgingshuizen en Thuiszorg – VVT) providers about sustainable employability. The VVT sector faces major challenges in terms of personnel. The aim of the gathering was to inspire healthcare providers and provide practical tools to improve job satisfaction and combat absenteeism. About 30 healthcare providers attended the meeting. During the gathering, the theme of sustainable employability was illuminated from different angles by various speakers.
In the context of labour-saving care, health insurers make appropriate contractual agreements with care providers regarding the provision and use of user-friendly hybrid care.
Engaging with value chain workers 10.1
Asset Management and Real Estate
a.s.r. asset management and a.s.r. real estate do not engage directly with value chain workers. Instead, they interact with relevant stakeholders, such as investee companies, trade unions, NGOs, suppliers, and investors. a.s.r. asset management engages with investee companies based on the outcomes of its human rights risk analysis, as well as controversies identified through its bi-annual screening process. Primary responsibility for the effectiveness of the engagement rests with the management team of the respective business line.
a.s.r. real estate activities are primarily focused on the Dutch market; its exposure to and influence over real estate investments in high-risk countries is limited. Nevertheless, a.s.r. real estate addresses human rights risks through pre-screening of suppliers and by embedding ESG-related conditions in contracts.
Health
The interests and perspectives of workers in the value chain are taken into account through indirect consultation, primarily involving representatives of professional associations, trade associations and unions. These parties are involved in drafting and developing sectoral agreements such as the IZA, TAZ, CLAs and AZWA. The AZWA underlines the importance of involving healthcare workers in reducing administrative burdens. The approach is explicitly aimed at focusing on the daily work practices of healthcare professionals and guaranteeing their say and involvement in the implementation of measures aimed at reducing the regulatory burden.
Consultation takes place at the sector level, with the frequency and format depending on the policy phase and the topic. The management team is responsible for safeguarding these consultation structures and incorporating the outcomes into a policy, if required. There are no international framework agreements or specific processes for vulnerable groups; Dutch legislation and regulations are considered sufficient.
Processes to remediate negative effects and channels for raising concerns
a.s.r. is committed to maintaining an open and ethical culture where concerns about potential misconduct or irregularities can be reported safely and confidentially. The Whistleblower Scheme is designed to facilitate the reporting of such concerns, ensuring they are addressed appropriately to uphold the integrity and reputation of the organisation. Importantly, this policy is not only available to current and former employees but also extends to third parties, allowing them to report any suspected wrongdoing. For more information about the Whistleblower Scheme, see section 6.4.1.3.
a.s.r. is committed to respecting and promoting human rights across its operations and investment activities. In alignment with the OECD Guidelines for Multinational Enterprises, a.s.r. has implemented structured due diligence and screening processes to identify, prevent and mitigate adverse human rights impacts, particularly those affecting value chain workers.
As outlined in the earlier part of this section, concerns about negative impacts on human rights caused by activities of a.s.r. or its business partners can be directed to Human Rights Reporting Point; this also applies to value chain workers of investee companies and a.s.r. real estate. The likelihood of this occurring in practice very low and it has not occurred to date.
Asset Management and Real Estate
While a.s.r. has limited direct remediation options for value chain workers in investee companies, a.s.r. encourages (investee) companies to establish grievance mechanisms and remediation processes through its engagement efforts.
6.3.2.3 Actions
In accordance with the Human Rights Policy, at least every three years (or more frequently if necessary), a.s.r. identifies (potential) human rights risks through a human rights risk analysis. Vulnerable groups and other relevant stakeholders are consulted in this process. a.s.r. is committed to preventing human rights violations and excludes business relations that are involved in human rights violations where possible. In cases where human rights violations are identified, a.s.r. assesses each situation individually and, where feasible, aims to discontinue the relationship with the involved party.
Asset Management 10.1
Human rights considerations have been systematically integrated by a.s.r. asset management into the investment decision-making process. Companies that fail to meet a.s.r.'s minimum standards or are involved in significant harm, such as very severe and repeated violations of labour rights, forced labour, child labour or failure to pay living wages, are subject to exclusion. These criteria are applied through a bi-annual screening process, as detailed in the Policy on Responsible Investments and the thematic position paper human rights. Secondly, the outcome of the screening process is followed up with mitigation measures, as outlined in Policy on Responsible Investments. a.s.r. asset management may decide to engage with a company prior to deciding to exclude it from its investable universe.
As part of a.s.r.'s commitment to upholding human rights principles, a.s.r. asset management has conducted a human rights risk analysis. Through this analysis, a.s.r. has identified and prioritised the consumer discretionary and staples sector, the financial sector and the IT sector as having the highest exposure to human rights risks, particularly in relation to value chain workers.
Within these three sectors, the issues that are most occurring in the portfolio were identified by analysing controversy reports, supplemented with other qualitative data sources. In this analysis, a.s.r. took into consideration the potential likelihood and severity (based on scope, scale and irremediability). This approach enabled a more comprehensive understanding of sector-specific risks and resulted into the following human rights issues per sector:
Forced labour in the IT sector;
Failure to pay living wages or incomes in the consumer discretionary and staples sector;
Discrimination and land rights violations in the financial sector.
In line with the Policy on Responsible Investments, a.s.r. considers both its capacity to effect meaningful change and the level of leverage it holds with companies in relevant sectors when determining the course of engagement. Engagement on forced labour, particularly in the IT sector, was prioritised due to its prevalence in the value chains of electronics manufacturers, which are often located in high-risk countries for forced labour, such as China and Malaysia. The complexity of these value chains poses challenges to transparency and standard enforcement. a.s.r. asset management aims to engage all relevant investee companies in the IT sector by the end of 2027.
Engagement on living wage and income was prioritised for companies in the consumer discretionary and consumer staples sectors, due to the complexity of their supply chains, which are often linked to low- and middle-income countries where human rights risks are more prevalent. a.s.r. primarily engages with companies on this topic through the Platform Living Wage Financials (PLFW), a collaborative engagement initiative that encourages, supports and monitors investee companies to enable living wages and living incomes in global supply chains. The progress of the engagements conducted through PLFW is reported annually in the platform's annual report.
Furthermore, when a.s.r. asset management encounters insufficient progress with its engagements, a.s.r. can make use of a number of tools that collectively form the engagement escalation framework. In order of increasing strength, these tools include:
Voting in support of a.s.r.’s engagements;
Pre-disclosing a.s.r.’s voting intentions;
(Co-)filing shareholder resolutions;
Divesting a.s.r.’s holdings.
Although engagements sometimes lead to positive outcomes, it is difficult to prove the one-to-one relationship between the engagement efforts and the changes at the companies engaged. Furthermore, due to limitations and the availability of specific data points on living wages and severe forced and child labour cases, a.s.r. asset management is unable to precisely determine the number of severe incidents at investee companies. However, data quality and availability are expected to improve, and a.s.r. remains actively engaged with data providers to enhance the availability and reliability of human rights-related data.
As previously stated, due to limitations and the availability of specific datapoints regarding human rights, therefore in 2025 no severe human rights incidents and violations have been reported to a.s.r. related to value chain workers of investee companies.
Real Estate 10.1
For the business activities of a.s.r. real estate, a.s.r. conducts periodic human rights risk analyses to assess potential impacts within its value chain. Through the most recent analysis, a.s.r. real estate has identified forced labour, child labour, and failure to pay a living wage as key risk areas. To address these concerns, a.s.r. real estate has implemented several measures:
Pre-screening of business relations in collaboration with the Customer Due Diligence (CDD) Desk, excluding entities involved in human rights violations;
Incorporation of a Code of Conduct into supplier contracts, requiring adherence to human rights, labour rights, environmental standards, and anti-bribery and corruption standards;
Establishment of purchasing conditions that mandate compliance with legal requirements related to employee rights and working conditions;
Setting additional ESG-related conditions in contracts, and conducting enhanced due diligence for high-risk investments, such as solar parks.
Health 10.1
As part of the sectoral initiatives with a.s.r.’s involvement, joint actions have been concluded, aiming to strengthen the collaboration across the sector and to address shared challenges.
Within the IZA, the TAZ and the AZWA programme various actions have been formulated that are aimed at improving the position of all employees at healthcare providers and apply for a medium-term period (one year up to five years). Three actions fall under the IZA, three under the TAZ program and five under the AZWA. These actions were achieved through consultation with professional associations, trade associations and trade unions under the direction of the VWS. Below is an overview of these actions, including their objectives, scope and monitoring methods.
1. Actions under the IZA:
Reducing regulatory burden
Health insurers and care administration offices assess all new regulations against the principle of ‘sensible and radically simple’. This means that only regulations that contribute to the affordability, accessibility and quality of care are introduced, and that solutions are kept as simple as possible for professionals. The scope is all healthcare providers and their employees in the Netherlands. Evaluation takes place through consultation with industry and professional associations.Labour-saving care and hybrid care
Healthcare purchasing contracts include agreements on the provision and deployment of user-friendly hybrid care, with the aim of reducing workload and accelerating the transformation to future-proof care. The scope is all contracted healthcare providers, with an annual evaluation of progress throughout the duration of the contract cycle.Provision of transformation resources
Health insurers provide substantial financial resources to healthcare providers to realise the necessary transformation to labour-saving and appropriate care. The scope is all healthcare providers participating in the IZA, whereby the accountability for the expenditure of resources and the results achieved within the framework of the IZA are monitored.
2 Actions under the TAZ:
Improving the labour market position
Health insurers and healthcare administration offices lobby for national policies that strengthen the labour market position of healthcare workers and actively participate in national programs and consultation structures. In scope are all healthcare workers. Monitoring is conducted through participation in and reporting on national consultations and programs.Sharing good initiatives
Sharing successful initiatives among contract partners and bringing them to their attention so they can be widely implemented. In scope are all contracted healthcare providers and monitoring is conducted through inventory and dissemination of best practices.Structural consultation and identification of bottlenecks
Through structured consultation with professional associations, trade associations and unions, bottlenecks are identified and actions initiated to resolve them, with a sector-wide focus on bottlenecks that affect the labour market and job satisfaction. Monitoring is conducted through periodic evaluation of the progress and effectiveness of the measures taken.
3. Actions under AZWA:
A. Reducing administrative burdens (AZWA-A1 to A3):
Breakthrough projects aimed at administrative relief
Health insurers and ZN are committed to the national scale-up of proven effective breakthrough projects to reduce regulatory burden. Projects are coordinated with healthcare professionals and implemented within the regions via the IZA regional agendas. In scope are all domains of the healthcare sector, with an emphasis on community nursing, general practitioner care, mental health care, VVT and specialist medical care. Monitoring is conducted via the Regulatory Pressure Management Group and the results are shared in BO IZA/AZWA.Deletion and harmonisation of authorisations and additional declarations
Health insurers are gradually reconsidering the need for existing authorisation requirements and declarations in consultation with industry and professional associations. The starting point is to reduce administrative burdens without compromising legality or efficiency. In scope are contracted care providers in pharmacy, community nursing, general practitioner care, VVT and medical specialist care. Monitoring is conducted through an annual review of ten authorizations/declarations per sector. Decision-making and progress are coordinated within the Steering Group and evaluated in BO IZA/AZWA.Reducing purchasing and accountability costs
Health insurers and ZN work with industry parties to reduce administrative burdens resulting from differing purchasing conditions and accountability requirements. The aim is harmonisation, simplification or the elimination of restrictive requirements. In scope are contracted healthcare providers, with priority for specialist medical care, general practitioner care and VVT. Monitoring is conducted through an annual review of ten bottlenecks per sector until 2028, with feedback via the healthcare purchasing cycle.
B. Accelerating the use of AI for administrative and diagnostic support (AZWA-A4):
Implementation of generative and diagnostic AI applications
Health insurers and ZN support the implementation of AI applications, such as voice-controlled reporting and capacity planning, aimed at reducing administration time and optimizing work processes. These will be embedded in the Digizo.nu transformation agenda. In scope are healthcare and welfare organizations in cure and care. Monitoring is conducted through KPIs within the AI action plan, with an adoption of 50% of the relevant processes by 2028, in accordance with agreements in Digizo.nu.
C. Acceleration of Electronic Data Interchange (AZWA-A5):
Realisation of electronic data exchange as standard
Health insurers contribute to the accelerated operationalisation of the health information system and implement the European Health Data Space framework. This is to promote administrative relief and interoperability between healthcare providers. In scope are all healthcare providers and suppliers of digital systems. Monitoring is conducted through progress reports within IZA and Digizo.nu. The roll-out is monitored via national implementation agenda.
Monitoring the actions
For the monitoring of the actions under IZA, TAZ and AZWA, both quantitative and qualitative standards have been established to monitor progress. The AZWA includes various KPIs to ensure progress. Qualitative standards are monitored through existing consultation structures, periodic evaluations and reports. In these consultations with stakeholders, bottlenecks are discussed, experiences are shared and progress is jointly assessed. Progress within the contract cycle is evaluated annually or periodically, for example in the case of agreements on hybrid care and labour-saving measures. Best practices are inventoried and shared. Accountability for the use of transformation resources and achieved results takes place within the IZA framework. This involves structured, qualitative monitoring, which offers room to respond flexibly to developments and signals from the field.
6.3.2.4 Targets
Asset Management and Real estate 10.1
As it is difficult to prove the one-to-one relationship between the measures taken by a.s.r., there is currently no quantitative target related to living wage, forced labour and/or child labour and no metrics can be disclosed. The monitoring of the effectiveness of the measures takes place through management reports and will be optimised going forward.
Health 10.1
For the 2025 reporting year, no sector-specific, measurable targets or benchmarks have been established regarding the policy and actions for employees in the value chain. This means that currently, no specific targets, baseline values, measurement methods or interim milestones have been formulated to guide implementation or monitor progress. Nor are there any measurable indicators or a set ambition level against which progress can be assessed.
However, a working group has been established within ZN to explore and develop relevant benchmarks and targets for future reporting years. This working group will investigate which indicators and measurement methods are most suitable for monitoring and reporting on the progress and effectiveness of the policy regarding employees in the value chain. Once these benchmarks and targets have been established, they will be included in future reports.
Although no measurable targets have been set for 2025, the effectiveness of the policy and actions taken are being monitored through the existing monitoring structures within the IZA and AZWA. The progress of the actions and policies is being tracked qualitatively and partly quantitatively, including through:
Quarterly reports on the progress of the IZA, in which the effectiveness of policies and measures is discussed;
Thematic round tables and consultation structures in which the transformation and progress of the labour market agenda are monitored;
Periodic evaluations and reports in which bottlenecks, best practices and achieved results are shared and discussed with relevant stakeholders, such as industry associations, professional associations, and unions;
Within the AZWA, a systematic follow-up is also set up via a central monitoring section and the expected labour savings, preconditions and implementation progress are examined per appointment;
AZWA's administrative consultation structures (BO IZA/AZWA) are the platform for joint assessment and adjustment, where signals from practice are fed back;
Specific to administrative burdens and regulatory pressure, practical checks with healthcare professionals and implementation tests are included in the monitoring process.
No generally defined ambition level has been established and the base year for measuring progress differs per subject (usually between 2017 and 2019), as recorded in the IZA monitoring reports. Monitoring is therefore mainly aimed at following qualitative developments and responding flexibly to signals and trends from the field. The AZWA additionally stipulates that monitoring is aimed at achieving the labour market target of 100,000 avoided FTEs in 2028, a substantial part of which must result from measures aimed at reducing workload, administrative burdens and better use of technology.
Incidents, complaints and severe human rights impacts related to value chain workers
For the disclosure of severe human rights issues and incidents in the upstream and downstream value chain, a.s.r. acknowledges the difficulty in obtaining quantitative data for the current reporting year. Despite this, a.s.r. conducts regular risk assessments and continuously engages with key stakeholders, such as ESG data providers, to identify potential human rights risks. Moving forward, a.s.r. aims to enhance its data collection processes and collaborate with value chain partners to improve transparency and reporting accuracy in the coming years, thereby being able to publish quantitatively as opposed to qualitatively on the number of 'severe' incidents of child and forced labour in the value chain.
6.3.3 Affected communities
To help people share their risk and build-up capital for later, it is important that they are financially self-reliant and are able to make considered financial choices. It is in this context that a.s.r.’s social programme Doenkracht can help.
a.s.r. funds projects in the field of financial education as well as teaching and social programmes of organisations that help their participants with (impending) financial problems to prevent deterioration of their financial situation. As such, Doenkracht contributes to a financially aware, self-reliant, and resilient society.
The following table presents a comprehensive overview of the material impact identified, along with the corresponding policies, actions and targets. The purpose of this table is to highlight the linkages and dependencies among these elements. See the SBM-3 table in section 6.1.4.3 for additional information on the impact, risks and opportunities identified.
11 - Affected communities
| Materiality | IRO description | Scope | Policies | Action | Target |
|---|---|---|---|---|---|
| 11.1 a.s.r. has a positive impact on, among other things, the economical and social rights of affected communities, by enhancing their financial self-reliance, awareness and resilience through the prevention and mitigation of financial problems by means of its Doenkracht programme. | Community | Doenkracht: From Mission to Impact |
| None |
6.3.3.1 Impacts, risks and opportunities
For the reporting year 2025, a.s.r. has identified 'affected communities' as a new material topic. a.s.r.’s approach to determining its material impacts, risks and opportunities related to affected communities for reporting year 2025 is described in section 6.1.4.
a.s.r. recognises the importance of managing its societal footprint in a structured and transparent manner. Through the Doenkracht programme, a.s.r. actively contributes to financial resilience and inclusion in Dutch society. The programme is embedded in the strategic pillar of financial self-reliance and is designed to generate measurable impact for long-term value creation.
Doenkracht aims to strengthen individuals and communities facing (potential) financial difficulties. The programme operates through two pillars: Prevention and Mitigation. Impact is measured using a Theory of Change (ToC) model, which defines desired outcomes, necessary interventions, and underlying assumptions. Partners report annually on both output and outcome indicators, aligned with five forms of capital: economic, psychological, human, social, and societal. This approach enables a.s.r. to monitor behavioural change and improvements in financial resilience.
6.3.3.2 Policies
From mission to impact
a.s.r has established the Doenkracht policy ‘From Mission to Impact’ consisting of two pillars with different scopes:
Prevention: which targets young people between the age of 4 and 18 with a special focus on intermediate vocational education students between the age of 16-18 nationwide through financial education.
Mitigation: which supports vulnerable groups; people who are at increased risk of (impending) financial difficulties, and who benefit from targeted support, education, and empowerment to enhance their financial situation, in cities where a.s.r. has offices.
The Director of Corporate Communications, reporting to the CEO, is accountable for the implementation of the Doenkracht policy. The programme is publicly accessible via the corporate website, inviting new collaborations that align with a.s.r.’s mission.
When setting the Doenkracht policy, a.s.r. has actively considered the interests and perspectives of key stakeholders, particularly those directly impacted by financial vulnerability. This includes programme participants such as young people, families, and other vulnerable groups, as well as local implementation partners, municipalities, and a.s.r. employees involved in project execution.
In its general Human Rights policy, a.s.r. endorses and respects the basic principles of human rights including those of affected communities, recognising that they are universal, interdependent and indivisible. a.s.r. adheres to international standards such as the International Bill of Human Rights and the UNGPs, which apply to all entities of a.s.r. For more information on the Human rights policy, see section 6.3.2.2.
Engaging with affected communities about impacts
Doenkracht engages with stakeholders throughout the project life cycle. Both the prevention and the mitigation partners, who have deep contextual knowledge of the communities they serve, act as trusted intermediaries. They play a key role in representing community interests by conducting impact assessments, providing feedback on a.s.r.'s support, and helping shape the programme based on participant needs. Especially the mitigation partners support individuals in taking action and tailor their approach to what is most beneficial for each participant. More broadly, they act as intermediaries between vulnerable communities and institutions, translating personal experiences into structural issues and advocating for collective needs. All partners are involved in co-creation during the design phase of the programme and contribute to ongoing evaluation through regular feedback loops (sense making sessions). This ensures that the programme remains responsive to community needs and fosters mutual trust.
The effectiveness of stakeholder engagement is monitored via impact measurement frameworks by the management of Corporate Communications of a.s.r., including the ToC and indicators aligned with five forms of capital (economic, psychological, human, social, and societal):
Economic capital: percentage of participants who enter paid employment, formal education, or a work experience placement within 6 months after completing the intervention;
Economic capital: percentage of participants who report an increased understanding of their financial situation;
Psychological capital: percentage of participants who report increased confidence or hope regarding their financial situation or future;
Human capital: percentage of participants who report improved financial knowledge after training or coaching;
Social capital: percentage of participants who received non-financial support from (new) members of their social network (advisors, mentors, family, friends);
Societal capital: percentage of participants who report knowing where to access support for financial questions or issues.
These mechanisms provide transparency and accountability and help ensure that stakeholder perspectives are not only heard but also translated into meaningful action.
Channels for affected communities to raise concerns and needs
Concerns and signals from communities are treated confidentially and in accordance with applicable data protection legislation. For more information about privacy see section 3.1.1.5. Participants may submit concerns anonymously, for example through representation by partner organisations. a.s.r. guarantees protection against retaliation for individuals who raise issues, and ensures that all reports are followed up in collaboration with relevant stakeholders. Affected communities can voice their concerns via multiple channels: directly through a.s.r.’s contact options (e.g. email or website forms), or indirectly via the societal organisations that implement Doenkracht projects locally. These organisations act as trusted intermediaries with deep insight into the needs and experiences of the communities they serve.
To monitor the effectiveness of these channels, a.s.r. conducts regular evaluations and impact assessments. Feedback is collected systematically and reflected in the annual Doenkracht report, which includes lessons learned and improvement actions. This feedback loop strengthens the programme's responsiveness and contributes to continuous learning.
In addition to programme-specific mechanisms, participants may also use a.s.r.’s general complaints procedure and as stipulated in the Whistleblower Scheme of a.s.r., whistleblowers are protected from retaliation. For more information about Whistleblower Scheme see section 5.5.3.
6.3.3.3 Actions
a.s.r. takes action to achieve material positive impacts for affected communities by means of its Doenkracht programme and at the same time to prevent, mitigate and remediate any negative material impacts on affected communities. Sources and insights for the actions defined are for instance through structured dialogues, research collaborations (e.g. with the Amsterdam University of Applied Sciences - Van Schulden naar Kansen Weten Wat Werkt '2021' and Financial literacy education among young students in the Netherlands '2020') and impact assessments.
Actions comprise the following:
1. Train partners in Impact Management. All partners (in both prevention and mitigation projects) received training in impact management in 2025, enhancing their ability to monitor and steer social outcomes. This ensures consistent, data-informed interventions across the network and continuous improvement and an environment of reflection. In addition, each partner receives four hours of individual coaching annually, tailored to their specific needs and questions.
2. Conduct tailored micro impact measurements and tools for all partners both prevention and mitigation projects, in 2025:
Conducted small-scale, tailored impact measurements among target groups of programme partners to enable faster learning and programme adjustments aligned with the context and circumstances of the community. This contributes to more responsive and effective interventions, supporting policy goals on inclusion and local relevance.
Developed impact measurement tools for financial education providers, empowering them to monitor and improve their own effectiveness. This action strengthens partner capacity and contributes to long-term sustainability and accountability within the programme.
Delivered a full impact assessment of MoneyWays, commissioned by partner Diversion, to inform strategic decision-making. The insights support evidence-based planning and align with policy objectives on impact-driven programming.
3. Offer reflective testing of financial education programs in 2025.
A structured reflection tool was used to test whether various financial education programs of the education partners are based on proven effective elements. Findings from the reflective tool and impact measurements were shared with various financial education partners, promoting broader learning and sector alignment on effective practices. Build communities among partners of the programme in 2025.
4. Build communities.
Partners of both the prevention and mitigation leg were brought together to foster peer exchange and grow the organisation's community of practice. This supports collaboration, innovation, and long-term ecosystem development.
The Doenkracht programme is carried out by the Doenkracht department. This department ensures that the programme is conducted adequately through cooperation agreements and activity plans with the partners, including provisions relating to compliance, privacy and contractual obligations.
6.3.3.4 Targets
In 2025, a.s.r. has taken the first step in its impact reporting journey by capturing output, clearly distinguishing between results achieved through financial support and those arising from non-financial support. From 2026 onwards, a.s.r. will broaden its scope to include both output and outcome, translating its societal impact into the language of the five capitals. This marks a meaningful shift: from measuring what is done, to demonstrating what is changed. At present, a.s.r. has not established specific targets related to Doenkracht. The development and prioritization of these targets will be addressed in the future.
6.3.3.5 Metrics
S3-5 Doenkracht
| 2025 | |||
|---|---|---|---|
| (in numbers) | Individuals | Households | Classes |
| Financial support | 479 | 2,563 | 1,790 |
| Non- financial support | 192 | 54 | 135 |
In line with the Doenkracht policy the programme reports on the target groups reached along the two pillars of mitigation and prevention. The mitigation partners support individuals who face actual or imminent financial problems. Prevention partners strengthen financial skills among young people, mainly through classroom based education.
The reported metrics reflect the Doenkracht theme of financial self-reliance. The outcomes differentiate between financial support and non-financial support. Financial support includes individual participants in mitigation interventions, households that gained access to digital tools financed by a.s.r., and classes that received teaching materials through prevention partners. Non-financial support includes individuals trained by a.s.r., households supported by a.s.r. volunteers, and classes that received guest lessons from a.s.r. guest teachers. The reported figures are limited to interventions that were financed or staffed by a.s.r. and concern output (reach). Outcomes are measured separately under the Theory of Change and are expected to be reported from 2026.
Methodology
Doenkracht
Scope
This disclosure includes metrics from the Doenkracht programme, such as the number of people, households and classes reached through non-financial and financial support, volunteering and educational activities.
Methodology
Data is gathered and aggregated twice a year from both internal and external partner sources. Data quality is ensured through intensive impact management training that prepares partners for collection of data, both quantitative and qualitative.
Assumptions and limitations
Some assumptions are applied in the calculations, for example, each teaching package is counted as one class.
The same classes that received teaching materials from Doenkracht program partners may also have received guest lessons from an a.s.r. guest lecturer. Therefore, there may be double counting among the reported numbers of classes.
6.3.4 Consumers and end-users
a.s.r. wants to have a leading role in the field of sustainable entrepreneurship in the financial sector. a.s.r. aims to positively contribute to making society more sustainable by continuously working to help create solutions that meet the needs of the current consumers and end-users, without compromising those of future consumers and end users. a.s.r. does this through its products and services, but also through its investments. a.s.r. wants to facilitate the transition to an inclusive, sustainable society and limit negative impact as much as possible.
The following table presents a comprehensive overview of the material impacts and risks identified, along with the corresponding policies, actions and targets. The purpose of this table is to highlight the linkages and dependencies among these elements. See the SBM-3 table in section 6.1.4.3 for additional information on the impact, risks and opportunities identified.
12 - Information-related impacts consumers and/or end-users
| Materiality | IRO description | Scope | Policies | Actions | Targets |
|---|---|---|---|---|---|
| 12.1 a.s.r. can provide a positive experience for customers and end-users by making good and understandable information available through online portals, which they can consult for clarity on their services and policies and through Advies van a.s.r. By providing accessible and clear information, such as policy details, telephone support, user-friendly website interfaces, process guidance, and transparent complaint procedures, a.s.r. promotes awareness among their customers and end-users and empowers them to make informed decisions regarding their personal financial circumstances. | Activities related to:
|
| See the actions section |
|
| 12.2 The complexity of the services and products offered by a.s.r., along with the extensive information provided, may lead to negative information-related impacts on consumers and end-users. | Activities related to:
|
| See the actions section |
|
| 12.3 a.s.r. has access to personal information in the execution of its services. This information must be processed in accordance with General Data Protection Regulation (GDPR) guidelines. Inadequate management of data security could potentially lead to a data breach, infringing the privacy of consumers and/or end-users. | a.s.r. |
| See the actions section | None |
| 12.4 a.s.r. may run financial risks due to data breaches, extortion and misuse of customer data, resulting in financial losses, legal liability and reputational damage. | a.s.r. |
| See the actions section | None |
13 - Social inclusion and personal safety of consumers and/or end-users
| Materiality | IRO description | Scope | Policies | Actions | Targets |
|---|---|---|---|---|---|
| 13.1 a.s.r.'s broad spectrum of products and services, ranging from (impact) investments in affordable housing, development in science parks, inclusive mortgage offerings, accessible insurance policies, Zorg voor jezelf app, Vitality services (offered by Disability, Health and Pensions), and reintegration services to comprehensive pension plans collectively facilitate social inclusion and personal safety of consumers and/or end users. | Activities related to:
|
| See the actions section |
|
| 13.2 a.s.r. may have a negative impact on the social inclusion of consumers and/or end-users through non-acceptance of or charging a higher premium from certain consumers and/or end-users and through irresponsible marketing practices. | Activities related to:
|
| None | None |
6.3.4.1 Impacts, risks and opportunities
Interests and views of stakeholders
a.s.r. has identified and assessed several positive and negative impacts and a risk on consumers and/or end-users. For more information about the process to identify and assess material impacts and risks related to consumers and/or end-users and about the consolidation process, see section 6.1.4.2. a.s.r. intends to include all consumers and/or end-users who are likely to be materially impacted by a.s.r. in the scope of this disclosure. When identifying negative impacts, a.s.r. developed an understanding of how consumers and/or end-users with particular characteristics, or those using particular products or services, may be at greater risk of harm, through expert sessions.
a.s.r. offers services that require sensitive personal data and this data needs to be adequately stored and processed by a.s.r. A breach in data privacy results in the exposure of customers' personal information, which could have a negative impact on fraud, loss and a breach of customer trust. This goes for all customers making use of a service of a.s.r. Furthermore, a.s.r. does not offer products that are inherently harmful to people and/or increase risks for chronic disease.
a.s.r.’s service and product offerings are intricate and accompanied by substantial information, which can be overwhelming for customers, potentially obscuring their understanding and ability to make well-informed decisions. The lack of clear and accessible information could result in customers making uninformed or incorrect decisions due to inadequate information provision, resulting in a negative information-related impact for consumers and/or end-users. This applies to all customers making use of a.s.r.’s services and product offerings, especially those who are having difficulties understanding complex and high quantities of information.
Although a.s.r.’s service and product offerings may have a negative impact on the social inclusion of consumers and/or end-users, such as through non‑acceptance or higher premiums, a.s.r. is committed to exploring and implementing more inclusive acceptance policies that balance risk management with social responsibility.
a.s.r. acknowledges the significant risk and impact posed by irresponsible marketing practices, which can harm its (potential) customers, especially those who are vulnerable to impacts from marketing and sales strategies. This risk is driven by potential ethical issues in marketing, such as misleading advertisements or lack of transparency, leading to financial repercussions and reduced revenue. Ethical issues in marketing, such as false claims or deceptive promotions, can erode trust among consumers and stakeholders. This loss of trust can result in a decline in customer loyalty and a negative public perception, ultimately impacting a.s.r.’s financial performance. If marketing practices are not aligned with ethical standards, it can lead to the exclusion of certain consumer groups and may potentially lead to fines and legal claims. This exclusion contributes to social inequality and undermines the principles of social inclusiveness that a.s.r. strives to uphold.
None of a.s.r.’s material negative impacts are widespread or systemic, nor related to individual incidents or specific business relationships.
Positive impacts are made by a broad spectrum of products and services and by the provision of good and understandable information through online portals, which customers and/or end users can consult for clarity on their services and policies and through Advies van a.s.r. By providing clear and accessible information, such as policy details, telephone support, user-friendly website interfaces, process guidance, and transparent complaint procedures, a.s.r. promotes awareness among their customers and end-users and empowers them to make informed decisions regarding their personal financial circumstances. This goes for all of a.s.r.'s customers and/or end users, in particular those who are extra vulnerable.
With regard to material risks, a.s.r. may run financial risks following reputational damage and fines due to data breaches/violation of data protection laws and engaging in irresponsible marketing practices. This may relate to specific groups of consumers and/or end-users and not to specific groups.
6.3.4.2 Policies
Access to (quality) information 12.112.213.113.2
a.s.r. has implemented various policies, guidelines and standards, such the Human Rights Policy, PARP-guideline and its writing style guide (a.s.r. schrijfstijl), to manage material sustainability matters. The general objectives of these policies are aimed at promoting financial and social inclusivity. a.s.r. recognises the importance of providing clear and accessible information to help customers make informed decisions. Given the complexity of its products and services, it is essential to ensure that customers fully understand the necessary information to avoid uninformed or incorrect decisions. It is essential that the information that a.s.r. provides is not only complete and accurate but also understandable for a.s.r.’s customers. The financial literacy of these customers varies, and a.s.r. must ensure that everyone, regardless of their knowledge level, can understand the information needed to make informed decisions. This commitment is driven by a.s.r.’s dedication to consumer awareness and decision-making, ultimately leading to positive societal impact. To strengthen the communication with (potential) customers and to ease the understanding of the products and services offered by a.s.r., a clear communication guideline -a.s.r.’s writing style guide- has been implemented.
At a.s.r., the commitment is to provide customers with products and services that meet their specific needs and expectations. Determining the target audience for insurance products is essential to ensure that these products align with the needs, characteristics and objectives of the customers and end-users. This process stems from the Insurance Distribution Directive (Richtlijn Verzekeringsdistributie), which mandates detailed target audience definitions for insurance products. By accurately defining the target audience, a.s.r. can develop insurance products that are suitable for specific customer groups, thereby reducing the likelihood of misunderstandings and incorrect decisions. In return, this approach not only helps to improve customer satisfaction but also ensures compliance with the legal requirements and the minimisation of risks.
Privacy 12.312.4
a.s.r. has adopted a group-wide Privacy Policy and a Data Retention Policy to ensure the lawful, fair and transparent processing of personal data.
These policies apply to all employees and entities within a.s.r. and are grounded in the General Data Protection Regulation (GDPR), the Dutch Financial Supervision Act (Wet op het financieel toezicht – Wft), the Anti-Money Laundering and Anti-Terrorist Financing Act (Wet ter voorkoming van witwassen en financieren van terrorisme – Wwft) and sectoral codes of conduct, such as the Code of Conduct for the Processing of Personal Data by Insurers (Gedragscode Verwerking Persoonsgegevens Verzekeraars – GVPV).
It outlines key principles including lawfulness, purpose limitation, data minimisation, transparency, privacy by design, security and accountability. These principles are embedded in daily operations through a structured governance model. The MB holds ultimate accountability. The central Privacy Office manages the privacy policy, privacy statements, and tools such as the processing register, privacy by design/default and the Data Protection Impact Assessment (DPIA) framework. The central Data Office manages the Data Retention Policy. Each business line is responsible for implementing the Privacy Policy within its own operations, including by tailoring procedures to their specific activities, maintaining an up-to-date processing register, conducting DPIAs where necessary, and ensuring that privacy risks are identified and mitigated. Business lines must also appoint a privacy expert to coordinate local implementation and act as the primary point of contact for privacy matters.
a.s.r. is committed to engaging with customers and end-users on privacy matters through structured feedback mechanisms such as customer panels and customer arenas (klantarena’s). These are used to assess the impact of data processing practices and ensure that privacy expectations are considered in service design and digital developments. Moreover, a.s.r. provides multiple channels for individuals to raise privacy-related concerns, including a public complaints procedure, the direct accessibility of the Data Protection Officer by e-mail and a dedicated data breach reporting process. Data breaches and complaints include issues related to the exercise of data subject rights and the handling of personal data. For an outline of the number and nature in 2025, see section 3.1.1.5.
a.s.r. informs stakeholders on this topic via privacy notices and the public Privacy Statement. The policies are accessible internally via intranet and the privacy statement is accessible externally via the corporate website. Monitoring is conducted through audits, SIRA, DPIA reviews and incident reporting. For further details see section 3.1.1.5.
Responsible marketing practices 13.2
To mitigate the risk of irresponsible marketing practices, a.s.r. has implemented various guidelines, such as the PARP-guideline, Code of Conduct and the Cookie Policy. These guidelines include strict protocols and comprehensive training for marketing teams to ensure all promotional activities adhere to ethical standards and to mitigate the risk of irresponsible marketing practices. Additionally, a.s.r. conducts thorough reviews of marketing materials to ensure accuracy and transparency, thereby protecting consumers from misleading information.
The Cookie Policy applies to all relevant business lines and to the subsidiaries of a.s.r. The management teams of the relevant product lines are accountable for the adherence of the policy, including the monitoring its the effectiveness. The policy is accessible internally via intranet and the Cookie preferences can be found externally on a.s.r.'s website.
a.s.r.’s communication guideline plays a crucial role in supporting these efforts. The communication guideline emphasises the importance of clear, transparent and ethical communication, both internally and externally. It aligns with a.s.r.'s mission to be a trustworthy insurer, a financially stable institution, a people-oriented employer and a valuable societal participant.
Corporate Communication at a.s.r. is tasked with enhancing the company's reputation as a socially responsible insurer. This involves ensuring that all communication, including marketing, aligns with the a.s.r.’s core values: being helpful, forward-thinking and decisive. The communication guideline also highlights the need for transparency and interaction, fostering a dialogue with stakeholders to build trust and credibility. By adhering to these communication principles, a.s.r. ensures that its marketing practices are not only effective but also ethical and inclusive. This approach helps to mitigate the risks associated with irresponsible marketing and supports a.s.r.’s commitment to social responsibility and financial stability.
Access to products and services 13.113.2
a.s.r. has a positive impact on financial and social inclusivity through its mortgage offerings, insurance products and investment strategies. These initiatives aim to contribute to accessibility and affordability, aiming to provide broader access to essential financial services. Inclusive initiatives at a.s.r. are designed to enhance social inclusiveness by making financial products more accessible to a diverse range of consumers. This approach helps ensure that more individuals can benefit from financial protection and investment opportunities, contributing to overall societal well-being.
Health and well-being and human rights are two of the focus themes of a.s.r. asset management's Policy on Responsible Investments. One of the policy's pillars is creating positive impact; by making impact investments within these focus themes, a.s.r. aims to generate social impact. For more information on impact investing see section section 3.1.3.4 and refer to the Real Estate ESG Policy, the Policy on Responsible Investments and the Impact Investing Framework as described in section 6.2.1.4.
a.s.r. has adopted the PARP guideline. As part of the PARP process, inclusivity is addressed by having a well-defined group of customers for whom a.s.r.’s products and services of are suitable. This process involves rigorous review, testing and evaluation to confirm that products are both fraud-resistant and in the interest of the defined group of customers. The effectiveness of the PARP is regularly monitored through customer feedback, market analysis and internal audits. a.s.r. uses these insights to refine its products and strategies, ensuring they continue to meet the needs of all consumers. a.s.r. is dedicated to developing new products and services that address the evolving needs of society.
It is a.s.r.’s aim that its services to customers do not discriminate based on factors including gender, age, religion, background or sexual orientation. To support this, a.s.r. applies the Ethical Framework for Data Applications and Data-Driven Decision Making by Insurers, developed by the Dutch Association of Insurers. This helps reduce the risk of unjustified bias, exclusion and discrimination in key processes like acceptance policies, premium setting, fraud detection and claims handling. When choosing to use data-driven systems, a.s.r. considers diversity and inclusion, particularly for vulnerable groups, such as those at risk of exclusion or disadvantage due to specific needs and/or disabilities. Preventing exclusion and discrimination is also the principle in a.s.r.’s non-data-driven decision-making processes and in a.s.r.’s communication with (potential) customers. a.s.r. continuously evaluates its services and communication, striving for maximum accessibility for target groups, including vulnerable groups such as people with low literacy or visual impairments.
Human Rights Policy commitments
When developing products and services, a.s.r. considers human rights. a.s.r.’s ambition is to develop products and services that contribute to solving societal issues. Therefore, a.s.r. also takes into consideration the needs of vulnerable groups in the development of its products and services in order to enhance their financial resilience.
Additionally, a.s.r. aims to prevent or mitigate any negative impact of its products and services as much as possible. The PARP is an internal process for assessing the quality of products and services and their relevance to the intended market. Part of the PARP includes considering (potential) risks related to human rights violations. The PARP encourages improvement based on feedback and expectations and needs of stakeholders, societal developments, current circumstances, and changes in laws and regulations. The PARP applies to products that a.s.r. actively offers, as well as to inactive products. The management teams of the relevant product lines are accountable for the adherence of the PARP-guideline. The monitoring of the effectiveness of the PARP-guideline lies with the PARP board and the PARP-guideline is accessible internally via intranet. For more information on the PARP, see section 3.1.2.1.
In the acceptance process for new business customers, a.s.r. also assesses signals of human rights violations. In the Customer Due Diligence Policy, signals of human rights violations are a potential exclusion criterion. Additionally, an ESG risk assessment is conducted, if necessary, as per the Policy on Sustainable Insurance. For more information on the engagement and the response with regard to human rights, see section 6.3.2.2.
Health
For its Health activities, a.s.r. has additional policies related to consumers and end-users:
Duty of care policy (Zorgplichtbeleid): Health insurers have the obligation to make care available to insured persons within a reasonable time and distance when or for as long as they need care.
The Health Procurement Policy outlines the procedures for acquiring medical supplies, equipment and services, ensuring efficiency, cost-effectiveness, and regulatory compliance. It includes supplier selection, contract management, risk mitigation, and sustainability practices to support high-quality healthcare delivery.
The Policy for Involving and Informing Clients outlines the strategies and procedures to actively engage clients in decision-making processes and keep them informed about relevant developments. This policy promotes transparency, trust and customer satisfaction.
The management team of Health is accountable for the implementation of these policies, including the monitoring of their effectiveness.
As part of the sectoral collaboration with a.s.r.’s involvement, joint initiatives have been concluded, aiming to strengthen the collaboration across the sector and to address shared challenges in an effective manner. In addition to the laws and regulations, covenants and programs are also periodically concluded between the government, health insurers and other parties involved. These agreements (IZA and GALA, WOZO and recently AZWA) and programmes (TAZ) include additional agreements on quality, affordability and accessibility of care. The elaboration of the national policy and the agreements in laws and regulations, covenants and programs are included in the individual policies of a.s.r. Health and other health insurers.
Access to care for all insured persons
Every person who lives or works in the Netherlands with a possible care need has access to care infrastructure and facilities (access to care). a.s.r. works with healthcare providers to provide that healthcare demand for the insured. Due to the breadth of sectors and regions where problems with accessibility to care occur, all insured persons may be affected. Whether they need care themselves or whether they are involved as a representative or informal caregiver in the care that a loved one needs. In line with the AZWA, health insurers explicitly commit to promoting more equal access to appropriate care, with special attention to people who currently experience a high threshold in the healthcare system, such as people with low socio-economic status, limited health skills or migration background.
Future-proof care
Health insurers are working towards a healthier population and future-proof healthcare for everyone. Transformation is essential to keep healthcare accessible to everyone. This includes healthcare innovation, data exchange, focus on regions, regional partnerships, transformation plans, commitment to job satisfaction and appropriate care. Innovative agreements and long-term partnerships with involved parties, as well as participation in IZA, the Housing, Support and Care for the Elderly program (Wonen, Ondersteuning en Zorg voor Ouderen - WOZO), Healthy and Active Living Agreement (Gezond en Actief Leven Akkoord – GALA) and the AZWA, agreed in July 2025, play an important role in this. The AZWA adds that health insurers are responsible for realizing proactive care mediation, transparency about waiting times in mental healthcare and medical specialist care and contributing to standardizing and improving waiting time standards. In addition, within AZWA, the focus on digital access (such as Thuisarts.nl and a national digital facility) and the safeguarding of duty of care for vulnerable groups is identified as a structural part of the system.
Frameworks and guidelines
The policy of health insurers is based on national legislation and regulations, established by the VWS. The Zvw forms the basis and guarantees access to care for everyone who lives or works in the Netherlands. Important elements are the duty of care and the right to long-term care via the Wlz. In addition to these legal frameworks that monitor access to care, there are periodic agreements and programs, such as the IZA, the GALA, the WOZO and, since July 2025, the AZWA. These agreements have been reached in collaboration between government, health insurers, trade organisations and other social parties.
The AZWA additionally emphasizes the importance of equal access to appropriate care, especially for people who currently experience barriers. Within the agreement, health insurers have a role in achieving transparency about waiting times, actively mediating access to care and contributing to updating standards for acceptable waiting times. The Dutch Healthcare Authority (NZa) monitors the fulfilment of this duty of care by health insurers, taking into account the complexity of the labour market situation.
Health insurer-specific policy
Within these national frameworks, health insurers give their own interpretation of this policy, which determines how they organize care, what care is reimbursed and under what conditions. The purchasing policy of health insurers is aimed at collaboration with healthcare providers and other stakeholders to achieve future-proof care. This focuses on innovation, regional cooperation and guaranteeing quality and accessibility, in line with the agreements from IZA and AZWA.
AZWA asks health insurers to, among other things:
Actively commit to care mediation, both within mental health care and medical specialist care;
Make waiting times transparent for insured persons;
Strengthen the use of digital facilities, such as Thuisarts.nl;
Contribute to reducing differences in access to care between regions and target groups.
Health insurers act in accordance with the guidelines for health insurers from the NZa with regard to duty of care and strive for effective implementation of legislation and standards.
Human rights and protection of healthcare users
The Netherlands ratified a wide range of ratified human rights treaties and has adopted a substantial body of human rights legislation. Health insurers respect these rights and strive for effective implementation of relevant standards, as laid down in their own policy and, where applicable, in a human rights policy. The protection of healthcare users against violations of human rights is thus guaranteed. If there are reports of non-compliance with international guidelines, these are explained and remedial measures are taken.
Non-discrimination 13.113.2
a.s.r. respects and endorses fundamental human rights. a.s.r. also supports the UN Global Compact, the UN Guiding Principles on Business and Human Rights, ILO Declaration on Fundamental Principles and Rights at Work and the OECD Guidelines for Multinational Enterprises, both in letter and spirit. These principles are implemented in several policies such as the Human Rights Policy, Policy on Sustainable Insurance, Customer Due Diligence Policy, Privacy Policy and PARP. For more information on the Human Rights Policy, see section 6.3.2.2.
a.s.r. has defined vulnerable groups that include young people, high-risk individuals and those with low literacy. a.s.r. offers certain products to improve financial and social inclusivity. These initiatives are driven by a commitment to accessibility and affordability, leading to broader access to essential services and a positive societal impact. One example is an insurance product, the disability insurance (AOV) for hard-to-insure self-employed individuals: If an entrepreneur is denied an AOV and has started a business within a certain period, there is an agreement within the Dutch Association of Insurers that the first insurer to reject the application is obliged to offer a Safety Net Insurance.
a.s.r.'s other initiatives include:
Langer mee AOV: For people in physically demanding professions who cannot always insure themselves until the state pension age, the Langer mee AOV was developed. This product allows them to insure themselves until the state pension age, provided they pass the medical assessment at the start of the insurance.
As an insurer, a.s.r. acknowledges the complex challenges associated with maintaining social inclusiveness, particularly when certain consumers face exclusion of coverage or higher premiums due to high-risk classification. The high-risk identification is not based on profiling, but on risk-based (technical or medical) motivation and in accordance with acceptance policies of a.s.r. which may restrict access to insurance products for high-risk individuals while always taking the human dimension into account. Such restrictions may contribute to social inequality and could limit the financial protection available to individuals with a high-risk classification.
To manage the risk profile, a.s.r. has implemented a comprehensive risk management framework (i.e. Customer Due Diligence) that includes a thorough screening process for new customers. This process ensures fair and consistent evaluation of all potential customers, although it may still result into a classification of the terms of acceptance of the high-risk individuals. a.s.r. continuously monitors the effectiveness of its acceptance policies and risk management practices. Regular evaluations are conducted to assess the impact of these policies on social inclusiveness and to identify areas for improvement.
In addition to the aforementioned policies with regard to treatment of high-risk individuals, a.s.r. has also identified high-risk groups for its mortgage activities which are managed in line with the responsible mortgage guideline. The high-risk groups identified, include customers who:
Have recently experienced payment arrears;
Are identified through early warning signals;
Hold an interest-only mortgage that have been classified as high-risk;
Are identified as high-risk based on analyses (manual and automated).
This approach ensures that high-risk groups are recognised and supported proactively, aligning with that the principles of social inclusion by offering tailored interventions and preventing further financial strain. For more information regarding the prevention of payment arrears and debt management and the socially responsible approach of a.s.r. regarding debt collection, see section 3.1.1.2. Beside these measures a.s.r. also offers products specifically for certain groups. An example of an inclusive mortgage offering is the first-time buyer mortgage, which is designed to support first-time homebuyers by providing access to affordable mortgages, even if they have limited financial resources. This promotes financial inclusivity by enabling more people to purchase their own homes.
Looking ahead, a.s.r. is committed to exploring and implementing more inclusive acceptance policies that balance risk management with social responsibility. Future initiatives may include the development of tailored financial products that cater to high-risk individuals without compromising a.s.r.’s financial stability. In due time, these initiatives will be translated into policies and embedded within a.s.r. Regarding the current and existing activities of a.s.r., the management teams of the relevant product lines are accountable for the implementation of the various policies, including the monitoring of the effectiveness of the policy.
With regard to safeguarding financial resilience among mortgage holders, a.s.r. proactively informs and engages with individuals who may be at risk. This involves identifying risk groups and communicating potential challenges that could arise from their mortgage agreements. By raising awareness early, these individuals are better equipped to take preventive measures.
Equally important is the timely detection of possible payment issues. When early signs of financial strain are identified, a.s.r. initiates a conversation with the customer. Through open dialogue, adequate supporting tools can be introduced to help prevent payment arrears. This approach fosters trust and enables customers to maintain control over their financial situation.
Engaging with consumers and end-users 12.112.213.113.2
Strategic, constructive and proactive consultation with consumers and end-users is very important to a.s.r., in order to properly align strategy, policy and activities with the expectations and interests of its stakeholders. The way a.s.r. communicates depends on the type of stakeholder, the topic and the purpose of the communication. a.s.r.’s means of communication range from personal contact to organising roadshows, customer and employee surveys, and round table and dialogue sessions.
The following basic principles are used by a.s.r. to create and build engagement with stakeholders:
Inclusion – enabling people to express their interests and expectations on issues and decision-making that affect them;
Materiality – decision-makers should identify the impacts and issues that matter and factor these into their decision-making;
Responsiveness – a.s.r. is transparent about material impacts and issues and how it deals with them.
a.s.r. applies the following principles when organising stakeholder engagement and stakeholder consultation:
Stakeholder engagement aims to strengthen a.s.r.’s relationship with key stakeholders to create mutual insight and understanding, and opportunities for collaboration.
Stakeholder consultation contributes to sustainable development and aims to create sustainable long-term value for a.s.r.’s stakeholders by giving them the opportunity to be involved in tightening a.s.r.’s policy, strategy and activities. Through dialogue, a.s.r. continuously reviews whether, in the opinion of its stakeholders, the organisation is still focusing sufficiently on the right policies.
Stakeholders are asked to provide input and help with:
Defining, reviewing and prioritising material issues for sustainability strategy, policy and reporting;
Providing insight into the (negative and positive) impact a.s.r. has on its stakeholders;
Identifying sustainability risks and how to mitigate them;
Answering the question of how a.s.r. can further increase its social added value and positive impact in the short and longer term;
Expanding and improving its understanding of current and future themes and trends.
a.s.r. believes in the power of collaboration and can explore social themes and issues with stakeholders and jointly tackle activities aimed at improvement.
a.s.r. engages with customers daily using various methods, including phone calls, emails, surveys, webinars and social media. This multi-channel approach ensures effective communication and feedback, allowing a.s.r. to continuously address customer needs comprehensively and to improve its products, services and the expertise of its advisors. Through this approach, a.s.r. also aims continuously to mitigate the complexities associated with its products and services.
To improve overall services and customer engagement, a.s.r. established the Raad van Doen, the online customer and advisory panel for all a.s.r. brands. Through this panel, customers and advisors are involved in enhancing a.s.r.'s products and services. The panel functions as a sounding board for a.s.r.'s direction, as a forum for co-creation and product development, to advocate for customer interests and as a sparring partner. Product lines also use members of the Raad van Doen to conduct customer research on expectations regarding sustainability aspects for specific insurance products and services. This can be done through surveys or by organising dialogue sessions with panel members and this engagement is ongoing. The Raad van Doen can be used whenever there is a need.
a.s.r.'s reputation for sustainability is measured quarterly. Continuous net promoter score (NPS) measurements are conducted among customers regarding the overall relationship (NPS-r), at the process level (NPS-p), at offline contact moments (NPS-c) and at online contact moments (NPS-d) to measure and improve customer satisfaction. The NPS-c and NPS-d measurements combined make up the overall NPS-i. The management of the business lines are responsible for the closely monitoring and taking actions on the valuable feedback obtained through the NPS surveys.
Health
Involving interest groups and healthcare users
As part of the sectoral collaboration with a.s.r.’s involvement, joint initiatives have been concluded aiming to strengthen the collaboration across the sector and to address shared challenges. For instance, ZN maintains regular contact with official interest groups and representatives of healthcare users, ensuring that their voices are heard and included in decision-making. Various platforms, networks and instruments are used for this purpose, such as patient associations, insurance policy councils, customer panels, evaluations, customer satisfaction surveys and feedback rounds. In this way, health insurers gain better insight into the needs and wishes of policyholders and can tailor their supplementary health insurance policies accordingly.
In addition, Health has a system called the Raad van Verzekerden, which enables policyholders to actively engage in discussions about a.s.r.’s healthcare policies and products. Comprising up to fifteen diverse members, the council meets with the Health Board in Utrecht at least twice a year, where key topics like healthcare procurement and communication are discussed. The council can provide both solicited and unsolicited advice and works in focus groups for in-depth analysis. This ensures that policyholders have a voice in a.s.r.'s policy decisions.
In the context of AZWA, this involvement is strengthened through targeted agreements on more structural involvement of healthcare users in appropriate care, digitalisation and waiting time transparency. For example, within the theme of digital care and AI, explicit attention is drawn to involving patients, clients and vulnerable target groups (including people with limited health skills or a migration background) in the development and application of new forms of care and technology. User participation is also provided for in the development of healthcare mediation instruments and transparency about waiting times.
Regional cooperation and regional plans
Periodically, the VWS holds national administrative consultations about IZA, which ZN joins. In recent years, parties in the regions have worked together to draw up regional images, which formed the basis for the IZA regional plans that were published at the end of 2023. Each regional image was drawn up by the largest health insurer in that region, in collaboration with municipalities, healthcare providers, welfare organisations and residents. The regional plans mapped out the most important challenges and bottlenecks surrounding (future) healthcare demand, health development and healthcare supply. Based on these plans, priority action points were determined to continue to guarantee access to care.
In line with the AZWA, the regional plans are being further deepened and supplemented with measures aimed at improving equal access to care. It has been agreed that residents will be more explicitly involved in prioritizing bottlenecks and developing solutions in the region, including through conversations, networks, citizen participation or collaboration with experienced experts.
Processes to remediate negative impacts and channels to raise concerns 12.112.212.312.413.113.2
a.s.r. has established comprehensive processes to address negative impacts on consumers and end-users, offering multiple channels for reporting concerns. Respecting and protecting human rights is a central principle of a.s.r.'s sustainability ambitions, and specific mechanisms are in place for consumers to report potential negative effects.
An essential part of this approach is the Whistleblower Scheme, which allows consumers to confidentially report suspected misconduct or irregularities. Reports can be submitted in writing, verbally or anonymously, and a.s.r. provides protection against retaliation, ensuring consumers can safely express their concerns. The Compliance department handles all complaints, ensuring appropriate follow-up while safeguarding the confidentiality and protection of the reporter (Wet bescherming klokkenluiders). Protection also applies to the person who assists a person reporting (e.g. the confidential advisor of a.s.r.), a third party involved, the person to whom a report is made or who properly follows up on the report. Employees who, in good faith, report a violation are protected against retaliation in accordance with the Whistleblower Scheme.
For complaints, a.s.r. offers a user-friendly online form, directing complaints straight to a complaint handler. Consumers can also contact customer service, clearly indicating they are making a complaint. Alternatively, complaints can be mailed to the a.s.r. Complaints Service. A complaint handler will contact the consumer within three working days, and a substantive response will follow within ten working days. For more information about customer focus, see section 3.1.1.3.
a.s.r. has also set up a dedicated Human Rights Reporting Point. This channel is specifically designed for consumers who have concerns about potential negative impacts on human rights caused by the activities of a.s.r. or its business partners. Consumers can submit reports via the Human Rights Reporting Point, clearly stating the nature of the concern, such as equal treatment or the right to a safe working environment. An acknowledgement of receipt is sent within seven days, and if necessary, the report is forwarded to the appropriate channel, with notice to the reporter. In 2025, no severe human rights incidents and violations related to consumers and/or end-users have been reported to a.s.r.
a.s.r. maintains an annual complaints report, detailing both received and resolved complaints, categorised by type. If consumers disagree with the outcome of a complaint, it can be referred to an independent party. a.s.r. fully cooperates in this process to ensure the effectiveness and integrity of the complaint resolution mechanism. Additionally, once a complaint is closed, a.s.r. invites consumers to participate in a satisfaction survey. a.s.r. seeks feedback on the complaint handling process and focus on identifying the root causes of complaints. This helps a.s.r. to monitor and improve the effectiveness of its channels, reflecting on its commitment to transparency and continuous enhancement in addressing consumer concerns.
If a consumer experiences an incident with an a.s.r. business partner, such as an intermediary, they are encouraged to report it to the Competence Center Intermediary (CC IM). The CC IM is a multidisciplinary team that addresses fraudulent or other undesirable behaviour by intermediaries. Intermediaries in this context include brokers, advisors, sub-brokers and mandated brokers. While a.s.r. does not require the business partner to establish such a channel, a.s.r. offers consumers a channel to raise concerns about its business partners.
If a customer disagrees with the handling of their complaint, they have three options:
The customer can submit the complaint to the Financial Services Complaints Institute (Klachteninstituut Financiële Dienstverlening - Kifid) within three months.
If a customer disagrees with the decision they can go to court, after first contacting Kifid. Kifid cannot handle complaints that have already been addressed by the court.
Customers can also file their complaint at the Disciplinary Board for Insurers, via the Financial Services Complaints Institute. The Disciplinary Board supervises the behaviour of insurers.
In addition, a healthcare policyholder can file a complaint with their health insurer, the Health Insurance Complaints and Disputes Foundation (Stichting Klachten en Geschillen Zorgverzekeringen - SKGZ) or the NZa. If the complaint concerns the care provided by a healthcare provider, it can be filed with the healthcare provider itself, the provider's complaints officer, or with a dispute resolution body.
6.3.4.3 Actions
To manage the material impacts and risks, a.s.r. has implemented and continues to maintain a range of measures at both product and group level to address its material impacts and risks.
Access to (quality) information 12.112.2
To address the challenges posed by the complex nature of a.s.r.’s offerings, a.s.r. has implemented several measures:
User-friendly online portals: a.s.r. has developed intuitive and accessible online portals, in accordance with the European Accessibility Act (EEA) and the Web Content Accessibility Guidelines (WCAG), that provide comprehensive information about its products and services to (potential) customers. These portals are designed to be user-friendly, ensuring that customers can easily navigate and find the information they need. The WCAG standards and the EAA ensure that all users, including those with disabilities, can access and understand online information.
Clear communication: a.s.r. prioritises clear and straightforward communication in all its customer interactions. This includes simplifying complex terms and conditions, providing detailed FAQs and offering step-by-step guides to help customers understand its offerings better.
Customers can trust that the products offered to them are demonstrably the result of PARPs that have carefully balanced their interests. Only products that are in the customer's best interest should be developed and offered to a defined group of customers for whom the product is suitable, and whose information and distribution are tailored to the target audience.
Educational resources: a.s.r. offers a range of educational resources, including webinars, tutorials and informational articles, to enhance consumer understanding of its products and services. These resources are tailored to address common questions and concerns, making it easier for customers to make informed decisions.
Customer support: a.s.r.’s dedicated customer support teams is available to assist customers with any queries they may have. This team is trained to provide clear and concise explanations, ensuring that customers receive the support they need to understand a.s.r.’s products and services fully.
Feedback mechanisms: a.s.r. actively seeks feedback from customers to continuously improve the clarity and accessibility of its information. This feedback is used to refine its communication strategies and enhance the user experience on the a.s.r. online portals. The NPS also provides insight into how customers experience a.s.r. For details, see section 2.4.1.2.
By implementing these measures, a.s.r. aims to safeguard against the complexities associated with its products and services. a.s.r. is committed to ensuring that all customers have the information they need to make informed decisions, thereby supporting financial and social inclusivity. Looking ahead, a.s.r. will continue to explore innovative ways to enhance the accessibility and clarity of its information. This includes, for instance, collecting feedback from customers via targeted engagement initiatives and through surveys such as the tenant satisfaction survey. Future initiatives may include the development of more interactive and personalised online tools, as well as ongoing collaboration with stakeholders to ensure that its communication strategies meet the evolving needs of its customers. a.s.r. makes its policies available to potentially affected stakeholders and those who need to help implement them. This is done through various channels, including the company website, customer portals and direct communication with stakeholders.
Specifically, to ensure perceivable, operable, understandable and robust digital environments, actions a.s.r. (continuously) takes include:
Employee knowledge: a.s.r. employees regularly undergo training to maintain and stay updated with the latest developments in digital accessibility.
Accessibility ‘by Design’: accessibility is integrated from the start into all steps of the design, development, and editorial processes of a.s.r.'s digital environments.
Testing: a.s.r. regularly tests its digital environments for accessibility using various online testing tools.
Research: independent experts regularly assess a.s.r.'s digital environments for accessibility, covering both functional-technical and editorial aspects. a.s.r. sustainably resolves any identified issues.
User feedback: a.s.r. involves users in the development process of its digital environments. a.s.r. uses feedback and reports from users to improve its website.
Privacy 12.312.4
With regard to the evolving digital landscape and the aforementioned robust digital environments, a.s.r. has taken the following actions to strengthen its data protection processes:
A central Privacy Office was established to coordinate privacy governance.
A multi-year Privacy Improvement Plan (2024–2026) was launched to address gaps in DPIA quality, processing registers and role clarity between central and decentralised units.
A new privacy management system is being developed.
For more information about the actions a.s.r. takes to secure the privacy of its customers and end-users and data breaches related to personal identifiable information, see section 3.1.1.5.
Impact investments 13.1
By making impact investments in the areas of health and well-being and human rights, a.s.r. asset management aims to generate positive, measurable, social impact without causing harm. This includes investments to improve affordable housing, efficient healthcare and access to basic needs, for example by investing in loans to Waarborgfonds Sociale Woningbouw or innovative healthcare technologies.
a.s.r. recognises that affordable housing is a basic human need and remains a pressing issue in the Dutch residential market. The shortage of affordable dwellings affects not only major cities but also suburban and peripheral areas. Through its investment in ASR Dutch Core Residential Fund, a.s.r. contributes to addressing this challenge by maintaining a significant portion of the portfolio in the affordable segment and expanding it with new dwellings. Furthermore, a.s.r. contributes to social impact with the first-time buyer mortgage (Startershypotheek), which improves access to affordable housing for first-time buyers by lowering monthly payments and supporting financial independence.
For more information and specific examples of social impact investments made by a.s.r., see section 3.1.3.4.
Real Estate 12.113.1
In the context of stakeholder engagement, for a.s.r.'s real estate activities, the relationship the organisation maintains with its tenants is very important. As such, a.s.r. real estate wants tenants to be involved, aware and satisfied and aims to increase creating a positive experience. The real estate funds measure this positive experience by focusing on improving tenant satisfaction, health and well-being, and awareness of sustainable living. The real estate funds periodically send out a tenant satisfaction survey to find out how tenants rate the services, properties, and their living and working environments. The results of these surveys are used to improve the performance of Real Estate and its contractors with regard to quality of living. To ensure a positive living experience, a.s.r. encourages targeted actions based on tenant feedback. These include accelerating the handling of repair requests, optimising communication channels - favouring phone calls over apps for faster scheduling - and addressing underperforming complexes with tailored follow-ups. In addition, a.s.r. supports initiatives that promote reliability, friendliness in service delivery, and enhanced liveability through measures such as increased greenery and community engagement activities.
Health 12.112.213.1
The core task of a.s.r. Health is to guarantee access to care for insured persons and to monitor costs. Policy objectives are formulated annually for this purpose, which are central to the Health Purchasing Policy. During the healthcare purchasing process, the duty of care is monitored and adjusted where necessary, for example by monitoring waiting lists and possibly contracting additional healthcare providers.
Sustainability matters are also addressed by the industry through a joint effort involving a.s.r. In addition to this joint effort, a.s.r. undertakes a number of initiatives, which are listed below and followed by the initiatives undertaken with the industry:
In the start-up phase of a new form of general practitioner (GP) care: Gezond.nl. The GPs of Gezond.nl handle most healthcare questions digitally. In this way, a.s.r. contributes to a solution for the pressure on GP practices and for patients who cannot find a GP.
Via the Zorg voor jezelf app, users with any a.s.r. basic insurance policy have unlimited access to the GP, Symptom Checker and 'Your Inspiration' (weekly tips, articles and podcasts). This is yet another way in which a.s.r. contributes to addressing shortages in GP care, ensuring that a.s.r. customers have access to online GP care. With supplementary insurance, users are entitled to three consultations (45 minutes each) to be divided freely between the dietitian and mental coach. The healthcare professionals are available every weekday from 08:00–21:00. Users also get access to Your Lifestyle Program.
Simulate a healthy lifestyle among a.s.r.'s policyholders to reduce the burden on healthcare, via a.s.r.'s Vitality programme.
With regard to the joint effort of the industry, in recent years the regions have been working on regional reputation, in which the most important data and bottlenecks surrounding care demand, health and care supply are identified. On this basis, regional plans and transformation plans are drawn up to strengthen access to care. The actions are linked to the themes of the IZA, such as appropriate care, regional cooperation, strengthening primary care, cooperation with the social domain, prevention, labour market, digitalisation and contracting.
This has been expanded by the AZWA, with additional focus on:
More equal access to care for target groups that experience barriers;
Transparency about waiting times and active care mediation in mental health care and medical specialist care;
Anchoring digital facilities such as Thuisarts.nl and a national digital help desk;
Standards regarding acceptable waiting times (revision of Treek normen);
Promoting regional cooperation between health insurers, municipalities and other parties to comprehensively address bottlenecks surrounding access.
Healthcare purchasing and future-proof healthcare
Healthcare purchasing covers all sectors within healthcare and is aimed at future-proof care. The implementation of the IZA actions and transformation plans is done jointly with other parties and is monitored nationally. Every year, a.s.r. Health goes through a policy cycle in which objectives are determined, monitored and adjusted where necessary. The IZA has a lead time until 2026.
The AZWA serves as a supplementary agenda to the IZA and runs parallel until 2028. The monitoring of the AZWA agreements is linked to the IZA/AZWA administrative consultation. Parties, including health insurers, have committed to contributing to the joint transition goal of guaranteeing access to care and structurally reducing labour market pressure.
Monitoring the actions
The IZA parties make every effort to realise the goals and plans from the IZA and they discuss progress every quarter in the IZA administrative consultation. They report by means of a progress report.
The AZWA also states that monitoring focuses on:
Achieving more equal access to appropriate care;
The commitment to waiting time transparency and healthcare mediation;
The reduction of the labour market shortage, partly through measures on access and efficiency.
Health insurers contribute to this monitoring by sharing their own policy goals and results in the national cycle. In the context of access to care, this may involve waiting list data, healthcare mediation, purchasing criteria and feedback from insured persons.
Human rights and law
No reports have been received by a.s.r. Health from insured persons about serious human rights problems and incidents. By way of background: the Netherlands has well-developed legislation and regulations in the field of human rights (wide range of ratified human rights treaties). This existing Dutch legislation provides broad protection for healthcare users in the Netherlands against human rights violations.
6.3.4.4 Targets
a.s.r. has set various targets for reducing negative impacts, advancing positive impacts and managing the material risk in relation to consumers and end-users.
Real Estate 12.113.1
The real estate funds' tenants are very important partners, and as such, the funds want them to be involved, aware and satisfied. Periodically, the real estate funds conduct recurring satisfaction surveys among their tenants. The results of these surveys are used to improve tenant engagement, and to find out how tenants rate the services, properties and their living and working environments. The findings are processed by asset managers and, where applicable, discussed with the internal or external property managers.
S4-5 Tenant satisfaction score per fund
| Last survey (year) | Realisation 2024 (score between 0 and 10) | Realisation 2025 (score between 0 and 10) | Target 2025 (score between 0 and 10) | |
|---|---|---|---|---|
| ASR DPRF | 2024 | 7.3 | 7.5 | 7.0 |
| ASR DCRF | 2025 | 6.7 | 7.1 | 7.0 |
| ASR DMOF | 2024 | 7.0 | 7.0 | 7.0 |
| ASR DSPF | 2024 | 6.7 | 6.8 | 7.0 |
| ASR DFLF | 2025 | 7.3 | 7.4 | 7.5 |
The target for tenant satisfaction is a score of at least 7.0 out of 10.0 for retail, residential, office and science park tenants and 7.5 out of 10.0 for farmland tenants. As the surveys are recurring, a.s.r. aims to consistently meet the target.
In 2025, the annual tenant satisfaction survey was postponed for both the ASR Dutch Prime Retail Fund (ASR DPRF) and the ASR Dutch Mobility Office Fund (ASR DMOF). No tenant survey was conducted for the ASR Dutch Science Park Fund (ASR DSPF) either, as this survey is carried out on a bi‑annual basis. Three out of the five funds achieved their respective tenant satisfaction targets.
Methodology
Scope
In scope are all (leasehold) tenants of a.s.r. Dutch Prime Retail Fund (ASR DPRF), ASR Dutch Core Residential Fund (ASR DCRF), ASR Dutch Mobility Office Fund (ASR DMOF), ASR Dutch Science Park Fund (ASR DSPF) and ASR Dutch Farmland Fund (ASR DFLF). Those excluded may be specific tenants such as those living in properties completed less than a year ago (for which separate research can be done), tenants in mixed-use properties and temporary tenants with a lease term of less than two years.
Methodology
Periodically, an online benchmark tenant survey is conducted, resulting in a tenant satisfaction score. This survey usually takes place in the fourth quarter.
No stakeholders were involved in the target setting.
Assumptions and limitations
The questionnaire is subject to improvements based on evaluation and knowledge-sharing sessions. Reliability depends on the response rate, so the percentage score may not be representative of all tenants.
Impact investment target 13.1
Asset Management, Real Estate and Mortgage activities
For more information about the impact investment target, see section 3.1.3.4
Access to products and services 12.112.2
a.s.r. aims to be the best financial service provider, with the highest percentage satisfied customers and advisors. Customers are at the heart of a.s.r.'s purpose, and its strategy is designed to meet their needs. 2025 is the first year that a.s.r. reports on the NPS-i, a customer satisfaction metric based on both online and offline channels. NPS-i is the weighted average score of NPS-c (contact moments between customer and a.s.r.) and NPS-d (digital client interaction, e.g. website or online portal).
S4-5 Net Promoter Score for customer interaction
| (score between -100 and 100) | 2025 | Target 2026 |
|---|---|---|
| NPS-i | 25.0 | 22.4 |
The target is to increase the score from 18.4 at the beginning of 2025 to 22.4 by the end of 2026.
In 2025, a.s.r. made further progress in strengthening customer centricity and improving the customer experience across both online and offline channels. As a result, the NPS‑i increased from 18.4 in the beginning of 2024 to 25.0 in 2025, meeting the target. While this target has been achieved, a.s.r. will continue its efforts to improve customer satisfaction. As more processes become digital, the NPS‑d is expected to have an increasingly significant influence on the overall NPS‑i score.
Methodology
The NPS-i combines the NPS-c with the NPS-d. The NPS-c measures customer satisfaction during offline interactions and the NPS-d measures customer satisfaction during digital interactions.
Scope
All a.s.r. product lines are in scope and are aggregated on a.s.r. group level.
Methodology
NPS‑c and NPS‑d are measured among customers via designated feedback platforms.
The survey for NPS-c, is conducted as a continuous measurement among customers who have had an interaction with a.s.r. Such interactions may take place via telephone and chat. Following these interactions, customers receive an NPS‑c questionnaire.
For interactions occurring within a.s.r.’s online environments, customers are presented immediately with the NPS‑d question within the respective platform.
Through this approach, each customer contact and interaction with a.s.r. is weighted equally in the calculation and formation of the overall NPS‑i of a.s.r. For details, see section 6.6.2.3.
No stakeholders were involved in the target setting.
This page is intentionally left blank.
6.4 Governance
6.4.1 Business conduct and corporate culture
The objective of a.s.r.'s business conduct policies and its corporate culture is to ensure that all employees act with due care and integrity, fostering a positive work environment and maintaining the trust of customers, shareholders and society. The a.s.r. Code of Conduct forms a guideline for the actions and decisions of its employees and it helps employees to perform their duties properly. It also forms the guideline for how colleagues interact with each other, how a.s.r. serves its customers and how a.s.r. takes responsibility for the environment. By embedding these principles in the corporate culture, a.s.r. aims to create a responsible organisation that contributes positively to society.
The following table presents a comprehensive overview of the material impacts identified, along with the corresponding policies, actions and targets. The purpose of this table is to highlight the linkages and dependencies among these elements. See the SBM-3 table in section 6.1.4.3 for additional information on the impact, risks and opportunities identified.
14 - Corporate Culture
| Materiality | IRO description | Scope | Policies | Actions | Targets |
|---|---|---|---|---|---|
| 14.1 The dedication to a positive and inclusive business conduct, guided by clearly defined behavioural standards and diversity in leadership, leads to a positive impact on corporate culture. | a.s.r. | Code of Conduct | Continuously review of the current activities through the central awareness programme and, where necessary, develop new topical awareness initiatives | None |
15 - Management of relationships with suppliers
| Materiality | IRO description | Scope | Policies | Actions | Targets |
|---|---|---|---|---|---|
| 15.1 a.s.r. has a positive impact on fair and sustainable business conduct by actively managing supplier relationships to promote fairness and sustainability. | a.s.r. |
| Drafting a central Procurement policy. | None |
16 - Corruption and bribery
| Materiality | IRO description | Scope | Policies | Actions | Targets |
|---|---|---|---|---|---|
| 16.1 a.s.r. enforces a rigorous Anti-corruption Policy, encapsulated in comprehensive procedures for prevention, detection, and response, including specialised training to ensure a transparent and integrity-driven business environment. If a.s.r. were to get involved in a corruption and bribery case this could lead to a negative impact on stakeholders’ trust. | a.s.r. |
| Risk profiles will be developed to better specify functions that have a higher risk of encountering corruption and bribery. | None |
6.4.1.1 Governance
The role of the administrative, management and supervisory bodies
For the role of the administrative, management and supervisory bodies, see sections 5.1.3 and 5.1.4.
6.4.1.2 Impacts, risks and opportunities
Description of the processes to identify and assess material impacts, risks and opportunities
a.s.r.’s approach to determining its material impacts, risks and opportunities is described in section 6.1.4.
6.4.1.3 Policies, actions and targets
Business conduct policies and corporate culture 14.116.1
Code of Conduct and 'The story of a.s.r.':
The a.s.r. Code of Conduct is a cornerstone of its corporate culture, guiding the actions and decisions of employees. It emphasises compliance with laws and sector agreements, respect for each other, fair treatment of customers, and responsible handling of company property and data. The Code of Conduct also addresses the importance of avoiding conflicts of interest and acting ethically and responsibly. It is part of every employee's employment contract and applies to anyone working for a.s.r. For more information on the Code of Conduct, see sections 5.5.2 and 6.3.1.
All employees take an oath or make a solemn affirmation when they start working for a.s.r. This involves, for example, declaring that they will act with integrity and due care.
The foundation of a.s.r.'s corporate culture is encapsulated in 'The story of a.s.r.', which provides a shared perspective, fosters connection and serves as a compass for actions. a.s.r. expects everyone at a.s.r. to operate based on three core values:
We are helpful. We consider the needs of our clients and advisors at every step, understanding their requirements. We coordinate meticulously and honour our commitments.
We think ahead. We prepare thoroughly. We listen attentively, offering appropriate solutions based on our expertise, experience, and dedication.
We achieve results. We are precise in both content and process, take responsibility, and complete what we start. Together, we achieve the desired outcomes.
The story of a.s.r. is promoted to all employees through various communication channels, such as the intranet. Additionally, a.s.r. expects all employees to demonstrate courage and personal leadership. a.s.r.'s interactions reflect this approach:
We share dilemmas and make them open to discussion.
Diversity, equity, and inclusion are key to mutual understanding and respect.
We give each other space for dialogue and reflection and dare to challenge each other, even when something isn't going well.
Our frameworks are defined and clear. We place responsibility as low in the organisation as possible.
We say what we do and do what we say.
Unethical behaviour and reporting mechanism
Mechanisms for identifying, reporting and investigating concerns about unlawful behaviour
a.s.r has implemented various mechanisms for identifying, reporting and investigating concerns about unlawful behaviour or behaviour in contradiction of its Code of Conduct or similar internal rules, and its communication channels accommodate reports from internal and/or external stakeholders.
All a.s.r. employees must report concerns about unlawful behaviour or behaviour in contradiction of its Code of Conduct or similar rules to their manager and/or the Compliance Officer. This can be done through several channels such as sending an email to the integrity desk or using a standardised form. It may happen that an employee cannot reasonably bring a wrongdoing to attention through the regular route. In that case, the employee may make use of the Whistleblower Scheme. Employees who make a report in good faith of what they believe to be a violation of this policy will be protected from retaliation in accordance with the Whistleblower Scheme.
a.s.r. believes it is important for employees to report (suspected) misconduct within a.s.r. in a careful, confidential and safe manner. Therefore, a.s.r. has established a Whistleblower Scheme, which is accessible by employees via the a.s.r. intranet and publicly available on the a.s.r. website for external (third) parties. See section 5.5.2 for more information.
Business conduct incidents
Beyond the procedures to follow-up on reports by whistleblowers, a.s.r. has procedures in place to investigate business conduct incidents. See section 5.5.2 for more information on incidents.
Awareness and training
To ensure that the Code of Conduct and related behavioural rules are well-known and understood, various awareness initiatives are carried out annually. Moreover, different tools for awareness are being created to better promote important topics among all employees within a.s.r. Alongside these efforts, employees are encouraged to engage in dialogue about integrity issues to collectively find good solutions. Additionally, training and presentations are conducted within the various product lines and staff functions. See section 5.5.3 for more information.
Suppliers in the upstream value chain 15.1
a.s.r. monitors and considers improvements in its relationships with current suppliers in the upstream value chain with regard to risks to its supply chain and of impacts on sustainability matters. In addition, a.s.r. regularly enhances the selection process with regard to social and environmental criteria when selecting new suppliers in the upstream value chain.
a.s.r. has a supplier Code of Conduct and general procurement terms and conditions for the procurement of new suppliers, which includes expectations regarding compliance with working conditions and human rights principles, and other relevant standards. a.s.r. requires suppliers to be diligent in their own business activities as well as in their value chains. Furthermore a.s.r. also has an outsourcing policy in place for managing its outsourced operations and activities to third parties and suppliers.
Compliance with environmental, human rights and labour rights standards by suppliers in the upstream value chain is also regularly reviewed during the monitoring of current suppliers. This information is used as input for annual (strategic) discussions with current suppliers.
The total procurement of a.s.r. is sourced from various channels, both through the central procurement stream via the Procurement department, which handles non-specific products and services expenditures, and through the decentralised procurement streams, which are related to specific products and services expenditures. In general, the Supplier Code of Conduct and the general procurement terms and conditions apply to all procurement streams of a.s.r., unless stated otherwise. Decentralised procurement streams, such as Health, use their own policies to push social and environmental criteria for the selection and renewal of its suppliers.
For the decentralised procurement stream of Health, a.s.r. procures healthcare services from providers in line with its duty of care, which requires insurers to ensure that care is sufficient, accessible and of high quality within a reasonable distance. Due to the limited availability of healthcare services, a high contracting rate is pursued. Within the industry association, insurers collectively determine ESG requirements, which are also indicated in the general procurement terms and conditions of Health.
For the decentralised procurement stream of P&C, only repairers which have been certified by Erkend Duurzaam and Groen Gedaan! can collaborate with a.s.r. and provide repair services as a supplier to a.s.r. The aforementioned certifications are mandatory, as they outline the minimum ESG requirements for repairers to meet.
Ensuring timely payments
a.s.r. is aware that late payments can have a significant impact on its suppliers and outsourcing partners, especially for small and medium enterprises (SMEs). Considering this, a.s.r. upholds a strong commitment to ensure timely and efficient payment practices.
Prevention and detection of corruption and bribery 14.116.1
a.s.r. has taken a number of control measures to prevent, identify and combat unethical behaviour, including corruption and bribery. Examples of control measures include integrity screening carried out by the Investigations Department prior to hiring new employees, as well as in-employment screening. This integrity screening also extends to contracting parties. It is conducted to minimise the risk of a.s.r. working with individuals or entities that could harm its integrity. The following policies and procedures have been implemented in the prevention and detection of corruption and bribery.
Policy for Unethical Behaviour
a.s.r. has a policy to prevent, recognise, report, investigate and adequately deal with unethical behaviour (including fraud, conflicts of interest and bribery and corruption). With regard to unethical conduct, a.s.r. applies a zero-tolerance policy. The scope of the policy is all employees, and the policy is accessible to all employees via the a.s.r. intranet. a.s.r. has established robust mechanisms for reporting non-compliance and incidents.
Anti-corruption Policy
a.s.r. has implemented a policy to prevent, detect, report, investigate and adequately handle unethical behaviour, including fraud, conflicts of interest corruption and bribery. a.s.r. maintains a zero-tolerance policy towards unethical behaviour. This policy is outlined in the Code of Conduct and the Anti-corruption Policy and is in line with the UNGPs.This Anti-corruption Policy complements a.s.r.'s rules of conduct of a.s.r. and should be read in conjunction with related a.s.r. policies, particularly with the Incentives Policy, the Outside business activities Policy, the Sponsorship and Donation Policy and the Group Policy on Conflicts of Interest. The Anti-corruption Policy applies to all employees who perform work for a.s.r. under a contract of employment, or those who perform work for or on behalf of a.s.r. other than as an employee. The policy is accessible to all employees via the a.s.r. intranet.
Incentives Policy
Receiving or providing incentives may compromise the integrity of a.s.r. and its employees. For this reason, employees are encouraged to exercise restraint when accepting or offering gifts and invitations (incentives). An incentive is not permitted if it might have an impact on conduct. All incentives must always be reported to Compliance. Employees are not allowed to receive cash. An incentive must comply with the principles set out in the Incentives Policy. These principles include that the incentive must fit within the statutory framework, be in line with public opinion, social views, not be excessive, be explainable, be proper in light of the business conducted and must be in the best interest of the customer. Similarly, if an employee offers a gift or invites a business contact to an event, for instance, this could influence the judgement of the recipient and may therefore harm the reputation of a.s.r. When offering a gift, the employee must report this in advance. The scope of the policy is all employees and the policy is accessible to all employees via the a.s.r. intranet.
Responsibility, outcomes, accessibility and training
The Investigations Department is responsible for investigating allegations or incidents of corruption or bribery, operating independently of the management chain. Regular reports on investigations are discussed with the CEO and serious violations are communicated to the MB, specific committees and regulators. Furthermore, the management of the business lines are responsible for the implementation of the aforementioned policies. For further information regarding the investigations undertaken and the conclusions reached, see section 5.5.2
The Anti-corruption Policy applies to all employees and is published internally via the intranet and publicly on a.s.r.'s website.
Anti-corruption and anti-bribery awareness activities are covered through training sessions, presentations and the voluntary use of the Gamification training tool to enhance knowledge. These are intended for all employees, with no distinction between risk profiles. All employees, including the MB of a.s.r., may encounter risks surrounding corruption and bribery and other risks regarding conflicts of interest in the broad sense (including outside business activities and incentives). Therefore all employees receive a training on this topic. For more information, see section 5.5.3 .
Actions and targets 14.115.116.1
a.s.r. continuously reviews its current activities through the central awareness programme and, where necessary, develops topical awareness initiatives in a risk-based manner to promote and foster ethical conduct. At present, a.s.r. has not established specific targets related to business conduct. However, the measures in place regarding business conduct are continuously monitored through key risk indicators. This enables a.s.r. to respond promptly and appropriately when needed.
Furthermore, risk profiles are currently being developed to better specify functions that have a higher risk of encountering corruption and bribery and/or other forms of unethical behaviour, where deemed necessary. Additionally, a.s.r. will expand the current awareness activities based on these profiles. a.s.r. will assess and – if needed – design targeted training programmes to ensure appropriate coverage for high-risk functions, such as certain commercial roles, procurement and teams involved in investment and/or transactional activities.
With regard to managing relationships with suppliers, a.s.r.'s Procurement department is currently in the process of drafting a central Procurement Policy to ensure consistency, transparency and efficiency of the central procurement process.
6.4.1.4 Metrics
G1-3 Prevention of corruption and bribery
| (in %) | 2025 | 2024 |
|---|---|---|
| Functions-at-risk covered by training programmes | 77% | 93% |
In 2025, coverage declined following the acquisition of HumanTotalCare, as no data was available at the time of reporting.
Methodology
Scope
The metric applies to employees with an employment contract with a.s.r., as well as non-employees working for ASR Nederland N.V. HumanTotalCare is included in the metrics from 1 October 2025 onwards.
Please see section 5.1.7 of the ASR Code of Conduct awareness programme for further details on the awareness activities in place.
Methodology
Currently, no high-risk profiles are designated within a.s.r., and all these individuals receive the same awareness activities on corruption and bribery. The metric reflects the percentage of these employees who complete a test through an IT application containing questions on the theme of corruption and bribery. This tool is actively deployed for two months each year and is technically enforced to ensure completion.
The participation rate is measured using IT Security reports. These reports track how many laptops were online during the period in which the mandatory awareness training was available and how many of those devices completed the training module. For 20.5% of a.s.r. employees, the training programmes were estimated.
Assumptions and limitations
The estimation model was used for TKP and D&S Holding. For details, see section 6.6.2.1.
G1-4 Incidents of corruption or bribery
| 2025 | 2024 | |
|---|---|---|
| Number of convictions for violation of anti-corruption laws | - | - |
| Amount of fines for violation of anti-corruption laws (in € millions) | - | - |
| Number of convictions for violation of anti-bribery laws | - | - |
| Amount of fines for violation of anti-bribery laws (in € millions) | - | - |
In the reporting period, there were no recorded incidents of violations related to anti-corruption and anti-bribery laws, nor were any convictions or fines imposed during the reporting period.
Methodology
Scope
At a.s.r., the Investigations Department records all cases of corruption and bribery within its own operations. Incidents of corruption and bribery are defined as actions that have been found to be substantiated. The total amount of fines from corruption and bribery is the total sum of fines of a.s.r. its own operations. For this requirement, the scope covers a.s.r.'s own operations.
Methodology
All data gathered to report the number of incidents and convictions related to corruption and bribery, as well as the total amount of fines, are based on direct measurements.
This page is intentionally left blank.
6.5 Voluntary disclosures
Although the ESRS are the basis of these sustainability statements, additional sustainability disclosures that do not relate to a topic following the DMA are included, based on sustainability rating agencies’ requirements, requests by specific societal stakeholders or commitments a.s.r. has made. This information is disclosed in this section.
Sustainable reputation
Sustainable reputation reflects the brand reputation of a.s.r. in the Netherlands in the areas of sustainability, transparency and reliability.
Sustainable reputation
| (in %) | Base year | Baseline value | 2024 | 2025 | Target 2026 |
|---|---|---|---|---|---|
| Sustainable reputation | 2023 | 38% | 39% | 41% | 38% - 43% |
In 2025, a.s.r.’s sustainability reputation score improved by 2%-points to 41% (2024: 39%). This increase was primarily driven by the launch of new marketing campaigns, PR and activations related to the main sponsorship of the Avond4Daagse, the Netherlands’ largest walking event, as well as the partnership with the Royal Dutch Walking Association (Koninklijke Wandelbond Nederland - KWbN).
Methodology
Sustainable reputation
Methodology and scope
The score is calculated by determining the percentage of respondents that give a top-two score on five-point scale (e.g. in 2025 a score of 41% means 41% of the respondents give a top-two score.
This KPI shows a.s.r.'s score based on surveys of Dutch people aged of 18 till 65 years. The survey measures the score on the following attributes: honesty, sustainability, reliability and socially responsible. The survey is conducted by DVJ Insights. People score from 0%-100% and the target is to attain a percentage between 38-43% per annum in the period 2024-2026. The attributes included in the survey are important elements for the positioning of a.s.r.
Energy consumption and mix
a.s.r. continuously works to reduce its own (indirect) negative impact on the environment due to GHG emissions through its operations and therefore monitors its own energy consumption and mix.
Energy consumption and mix
| (in MWh) | 2025 |
|---|---|
| Non-renewable energy consumption | 3,451 |
| Renewable energy consumption | 16,992 |
| Total energy consumption | 20,444 |
Renewable sources represents 83% of the total energy consumed.
Methodology
Energy consumption and mix
Methodology and scope
The energy consumption metrics relate to the energy consumption from sources that are owned or controlled by a.s.r., which includes the energy consumption of fossil fuel-based lease cars, refrigerant usage and leakage, fossil fuels used for heating and the fuel usage of emergency generators.
This measurement is based on invoices for direct energy consumption. Conversion factors were used if raw data of energy related information is only available in energy units other than MWh. It then calculates the energy consumption using a database with emission factors from co2emissiefactoren.nl
Assumptions and limitations
For the calculation of a.s.r.'s energy consumption and mix at some offices, estimations are made via an extrapolation factor based on surface area in m2 or number of employees.
Water consumption
Water consumption
| (in m³) | 2025 |
|---|---|
| Water consumption | 30,553 |
Fluctuations in employee numbers, the extent of hybrid working and changes in the number of a.s.r.'s office buildings influenced the level of water consumption.
Methodology
Water consumption
Methodology and scope
Water consumption is related to office activities, such as sanitary facilities, pantry facilities and cleaning services.
a.s.r. does not have water‑intensive business activities and does not operate any water intensive production processes. For this reason, water is considered non‑material within a.s.r.'s operations. Nevertheless, a.s.r. continues to report voluntarily and transparently on water use as part of responsible and sustainable business practices.
Given the limited scale and impact, no specific water reduction targets have been set.
Assumptions and limitations
Water consumption represents the total water use within a.s.r.’s own operations and relates to its larger office buildings.
Water consumption data are primarily collected on the basis of water meter readings and utility invoice data. For some office buildings estimates were applied.
6.6 CSRD reporting policies
6.6.1 Introduction
The target and metrics sections of the sustainability statements disclose detailed descriptions of the specific reporting policies, methodologies, assumptions, estimations, limitations, and practices applied by a.s.r. in preparing and presenting the sustainability statements. a.s.r.’s reporting policies ensure consistency and comparability of the sustainability statements across different periods and a.s.r. entities, providing a better understanding of the sustainability statements.
This section provides a description of the general reporting policies, including an explanation of the method for using the estimation model (see section 6.6.2.1) and the carbon Manager (see section 6.6.2.2).
6.6.1.1 Changes in standards and adoption of CSRD effective in 2025
No changes were made in the reporting standards effective in 2025.
6.6.2 CSRD general reporting policies
6.6.2.1 Estimation model
Certain quantitative metrics and monetary amounts are subject to a high level of measurement uncertainty due to data availability constraints. The estimation model was used for Corins, D&S Holding, Robidus, TKP and HumanTotalCare. The data points estimated per entity are specified below. The estimation model extrapolates missing data by using related parameters from these entities and from a.s.r., basing its calculations on actual reported figures. In some cases, externally sourced predictive measures are also used to support the estimation. Therefore, a.s.r. deems the a.s.r. data used in the calculations to be representative for the entities previously mentioned. a.s.r. has implemented control measures within the estimation model. These include plausibility checks on the generated estimates, aimed at mitigating estimation uncertainty to the greatest extent possible.
The number of estimated data points varies by entity. For Corins, the estimation model was applied solely to Scope 3 Category 1 GHG emissions and to metrics concerning training and skills development. Due to the complex organisational structure of D&S Holding, except for S1-8 and S1-17, all data points from this entity were derived using the estimation model. Robidus applied the estimation model to derive its scope 1,2 and 3 GHG emissions, resource outflow and waste data, training and skills development metrics and work-life balance metrics. TKP only applied the estimation model to determine its functions at risk. For HumanTotalCare, the estimation model was applied for all data points regarding scope 1, 2 and 3 GHG emissions. It was also used to derive HumanTotalCare's resource outflow and waste data.
a.s.r. has the ambition to improve its data quality for its own operations on the ESG metrics by replacing estimations with actuals and re-evaluating its methodologies.
6.6.2.2 Carbon Manager
Carbon Manager is an application that a.s.r. uses to collect information about consumption. It calculates the related GHG emissions using a database of emission factors from co2emissiefactoren.nl. Carbon Manager also helps a.s.r. to organise and monitor its carbon footprint.
6.6.2.3 General disclaimer on non-financial targets
Targets are based on the assumption of normal (financial) markets, environmental and economic conditions (per end of 2025) and no material regulatory changes. Targets could be affected materially by changes in these topics, including changes in the transition to net zero.
a.s.r. has made efforts to gather the required data for taxonomy eligibility and alignment. Due to uncertainties in legislation and limitations in the availability of data at the time the Annual Report was being prepared a.s.r. has to some extent used interpretations, estimates and assumptions to arrive at the required disclosures. The disclosures made therefore represent a snapshot of the time at which they were prepared and are only an indication of the eligibility or alignment of the economic activities undertaken by a.s.r. The assumptions and interpretations used are further disclosed in section 6.2.4.
This page is intentionally left blank.
6.7 Annex Sustainability statements
6.7.1 CSRD reference table
ESRS 2 - General
| DR | Description | Section | Explanatory notes |
|---|---|---|---|
| BP-1 | General basis for preparation of the sustainability statement | 6.1.2 | |
| BP-2 | Disclosures in relation to specific circumstances | 6.1.2 | |
| GOV-1 | The role of the administrative, management and supervisory bodies | 5.1.3 5.1.4 5.1.5 5.1.6 | Incorporation by reference |
| GOV-2 | Information provided to and sustainability matters addressed by the undertaking’s administrative, management and supervisory bodies | 5.1.6 | Incorporation by reference |
| GOV-3 | Integration of sustainability-related performance in incentive schemes | 5.3.2 | Incorporation by reference |
| GOV-4 | Statement on sustainability due diligence | 6.1.3.3 | |
| GOV-5 | Risk management and internal controls over sustainability reporting | 6.1.3.4 7.8 | Incorporation by reference |
| SBM-1 | Strategy, business model and value chain | 2.2.2 2.4.1 6.1.4.1 | Incorporation by reference |
| SBM-2 | Interests and views of stakeholders | 6.1.4.2 | |
| SBM-3 | Material impacts, risks and opportunities and their interaction with strategy and business model | 6.1.4.4 | |
| IRO-1 | Description of the process to identify and assess material impacts, risks and opportunities | 6.1.4.3 | |
| IRO-2 | Disclosure requirements in ESRS covered by the undertaking’s sustainability statement | 6.1.4.3 6.1.4.5 |
ESRS E1 - Climate change
| Disclosure | Sub-topic | Description | Section | Explanatory notes |
|---|---|---|---|---|
| ESRS 2, GOV-3 | Climate change adaptation Climate change mitigation | Integration of sustainability-related performance in incentive schemes | 5.3.2 | Incorporation by reference |
| E1-1 | Climate change mitigation | Transition plan for climate change mitigation | 6.2.1.3 | |
| ESRS 2, SBM-3 | Material impacts, risks and opportunities | Material impacts, risks and opportunities, and their interaction with strategy and business model | 6.2.1.1 6.1.4.4 | |
| ESRS 2, IRO-1 | Process to identify and assess material impacts, risks and opportunities | Description of the processes to identify and assess material climate related impacts, risks and opportunities | 6.2.1.1 6.1.4.3 | |
| E1-2 | Climate change adaptation Climate change mitigation | Policies related to climate change mitigation and adaptation | 6.2.1.4 | |
| E1-3 | Climate change adaptation Climate change mitigation | Actions and resources in relation to climate change policies | 6.2.1.5 | |
| E1-4 | Climate change adaptation Climate change mitigation | Targets related to climate change mitigation and adaptation | 3.1.3.4 6.2.1.6 | Incorporation by reference |
| E1-5 | Climate change mitigation | Energy consumption and mix | n/a | |
| E1-6 | Climate change mitigation | Gross Scopes 1, 2, 3 and total GHG emissions | 6.2.1.7 | |
| E1-7 | Climate change mitigation | GHG removals and GHG mitigation projects financed through carbon credits | 6.2.1.7 | |
| E1-8 | Climate change mitigation | Internal carbon pricing | n/a | |
| E1-9 | Climate change adaptation Climate change mitigation | Anticipated financial effects from material physical and transition risks and potential climate-related opportunities | phased-in | |
| SBM-3 | Material impacts, risks and opportunities | Material impacts, risks and opportunities and their interaction with strategy and business model | 6.1.4.4 | |
| IRO-1 | Process to identify and assess material impacts, risks and opportunities | Description of the process to identify and assess material impacts, risks and opportunities | 6.1.4.3 | |
| IRO-2 | Climate change adaptation Climate change mitigation | Disclosure requirements in ESRS covered by the undertaking’s sustainability statement | 6.1.4.5 |
ESRS E4 - Biodiversity and ecosystems
| Disclosure | Sub-topic | Description | Section | Explanatory notes |
|---|---|---|---|---|
| E4-1 | Direct impact drivers of biodiversity loss Impact and dependencies on ecosystems | Transition plan and consideration of biodiversity and ecosystems in strategy and business model | 6.2.2.3 | |
| ESRS 2, SBM-3 | Material impacts, risks and opportunities | Material impacts, risks and opportunities and their interaction with strategy and business model | 6.1.4.4 6.2.2.1 | |
| ESRS 2, IRO-1 | Process to identify and assess material impacts, risks and opportunities | Description of processes to identify and assess material biodiversity and ecosystem-related impacts, risks, dependencies and opportunities | 6.1.4.3 6.2.2.1 | |
| E4-2 | Direct impact drivers of biodiversity loss Impact and dependencies on ecosystems | Policies related to biodiversity and ecosystem | 6.2.2.4 | |
| E4-3 | Direct impact drivers of biodiversity loss Impact and dependencies on ecosystems | Actions and resources related to biodiversity and ecosystems | 6.2.2.5 | |
| E4-4 | Direct impact drivers of biodiversity loss Impact and dependencies on ecosystems | Targets related to biodiversity and ecosystems | 6.2.2.6 | |
| ESRS 2, E4-5 | Direct impact drivers of biodiversity loss Impact and dependencies on ecosystems | Impact metrics related to biodiversity and ecosystems change | 6.2.2.7 | Entity-specific disclosure |
| E4-6 | Direct impact drivers of biodiversity loss Impact and dependencies on ecosystems | Anticipated financial effects from biodiversity and ecosystems-related risks and opportunities | phased-in |
ESRS E5 - Resource use and circular economy
| Disclosure | Sub-topic | Description | Section | Explanatory notes |
|---|---|---|---|---|
| ESRS 2, IRO-1 | Process to identify and assess material impacts, risks and opportunities | Description of the processes to identify and assess material resource use and circular economy-related impacts, risks and opportunities | 6.1.4.3 6.2.3.1 | |
| E5-1 | Resources inflows, including resource use Resource outflows related to products and services Waste | Policies related to resource use and circular economy | 6.2.3.2 | |
| E5-2 | Resources inflows, including resource use Resource outflows related to products and services Waste | Actions and resources related to resource use and circular economy | 6.2.3.3 | |
| E5-3 | Resources inflows, including resource use Resource outflows related to products and services Waste | Targets related to resource use and circular economy | 6.2.3.4 | |
| E5-4 | Resources inflows, including resource use | Resource inflows | 6.2.3.5 | |
| E5-5 | Resource outflows related to products and services Waste | Resource outflows | 6.2.3.5 | |
| E5-6 | Resources inflows, including resource use Resource outflows related to products and services Waste | Anticipated financial effects from material resource use and circular economy-related risks and opportunities | phased-in |
ESRS S1 - Own workforce
| Disclosure | Sub-topic | Description | Section | Explanatory notes |
|---|---|---|---|---|
| ESRS 2, SBM-2 | Interests and views of stakeholders | Interests and views of stakeholders | 6.1.4.2 | |
| ESRS 2, SBM-3 | Material impacts, risks and opportunities | Material impacts, risks and opportunities and their interaction with strategy and business model | 6.1.4.4 6.3.1.1 | |
| S1-1 | Working conditions Equal treatment and opportunities Other work-related rights | Policies related to own workforce | 3.1.1.5 6.3.1.2 | Incorporation by reference |
| S1-2 | Working conditions Equal treatment and opportunities Other work-related rights | Processes for engaging with own workers and workers’ representatives | 3.2.4 6.3.1.2 | Incorporation by reference |
| S1-3 | Working conditions Equal treatment and opportunities Other work-related rights | Processes to remediate negative impacts and channels for own workers to raise concerns | 6.3.1.2 | |
| S1-4 | Working conditions Equal treatment and opportunities Other work-related rights | Taking action on material impacts on own workforce, and approaches to mitigating material risks and pursuing material opportunities related to own workforce, and effectiveness of those actions | 6.3.1.3 | |
| S1-5 | Working conditions Equal treatment and opportunities Other work-related rights | Targets related to managing material negative impacts, advancing positive impacts, and managing material risks and opportunities | 6.3.1.4 | |
| S1-6 | Working conditions Equal treatment and opportunities Other work-related rights | Characteristics of the undertaking’s employees | 6.3.1.5 | |
| S1-7 | Working conditions Equal treatment and opportunities Other work-related rights | Characteristics of non-employee workers in the undertaking’s own workforce | 6.3.1.5 | |
| S1-8 | Working conditions | Collective bargaining coverage and social dialogue | 6.3.1.5 | |
| S1-9 | Equal treatment and opportunities for all | Diversity metrics | 6.3.1.5 | |
| S1-10 | Working conditions | Adequate wages | 6.3.1.2 | |
| S1-11 | Working conditions | Social protection | 6.3.1.5 | |
| S1-12 | Equal treatment and opportunities for all | Persons with disabilities | 6.3.1.5 | |
| S1-13 | Equal treatment and opportunities for all | Training and skills development metrics | 6.3.1.5 | |
| S1-14 | Working conditions | Health and safety metrics | 6.3.1.5 | |
| S1-15 | Working conditions | Work-life balance metrics | 6.3.1.5 | |
| S1-16 | Equal treatment and opportunities for all | Compensation metrics (pay gap and total compensation) | 5.3.2 6.3.1.5 | Incorporation by reference |
| S1-17 | Working conditions Equal treatment and opportunities Other work-related rights | Incidents, complaints and severe human rights impacts | 6.3.1.5 |
ESRS S2 - Workers in the value chain
| Disclosure | Sub-topic | Description | Section | Explanatory notes |
|---|---|---|---|---|
| ESRS 2, SBM-2 | Interests and views of stakeholders | Interests and views of stakeholders | 6.1.4.2 | |
| ESRS 2, SBM-3 | Material impacts, risks and opportunities | Material impacts, risks and opportunities and their interaction with strategy and business model | 6.1.4.4 6.3.2.1 | |
| S2-1 | Working conditions and opportunities Equal treatment and opportunities Other work-related rights | Policies related to value chain workers | 6.3.2.2 | |
| S2-2 | Working conditions and opportunities Equal treatment and opportunities Other work-related rights | Processes for engaging with value chain workers about impacts | 6.3.2.2 | |
| S2-3 | Working conditions and opportunities Equal treatment and opportunities Other work-related rights | Processes to remediate negative impacts and channels for value chain workers to raise concerns | 6.3.2.2 | |
| S2-4 | Working conditions and opportunities Equal treatment and opportunities Other work-related rights | Taking action on material impacts on value chain workers, and approaches to managing material risks and pursuing material opportunities related to value chain workers, and effectiveness of those actions | 6.3.2.3 | |
| S2-5 | Working conditions and opportunities Equal treatment and opportunities Other work-related rights | Targets related to managing material negative impacts, advancing positive impacts, and managing material risks and opportunities | 6.3.2.4 |
ESRS S3 - Affected communities
| Disclosure | Sub-topic | Description | Section | Explanatory notes |
|---|---|---|---|---|
| ESRS 2, SBM-2 | Interests and views of stakeholders | Interests and views of stakeholders | 6.1.4.2 | |
| ESRS 2, SBM-3 | Material impacts, risks and opportunities | Material impacts, risks and opportunities and their interaction with strategy and business model | 6.1.4.4 6.3.3.1 | |
| S3-1 | Economic, social and cultural rights | Policies related to affected communities | 6.3.3.2 | |
| S3-2 | Economic, social and cultural rights | Processes for engaging with affected communities about impacts | 6.3.3.2 | |
| S3-3 | Economic, social and cultural rights | Processes to remediate negative impacts and channels for affected communities to raise concerns | 6.3.3.2 | |
| S3-4 | Economic, social and cultural rights | Taking action on material impacts on affected communities, and approaches to managing material risks and pursuing material opportunities related to affected communities, and effectiveness of those actions | 6.3.3.3 | |
| ESRS 2, S3-5 | Economic, social and cultural rights | Targets related to managing material negative impacts, advancing positive impacts, and managing material risks and opportunities | 6.3.3.4 6.3.3.5 | Entity-specific disclosure |
ESRS S4 - Consumers and end-users
| Disclosure | Sub-topic | Description | Section | Explanatory notes |
|---|---|---|---|---|
| ESRS 2, SBM-2 | Interests and views of stakeholders | Interests and views of stakeholders | 6.1.4.2 | |
| ESRS 2, SBM-3 | Material impacts, risks and opportunities | Material impacts, risks and opportunities and their interaction with strategy and business model | 6.1.4.4 6.3.4.1 | |
| S4-1 | Information related impacts Personal safety Social inclusion | Policies related to consumers and end-users | 3.1.1.5 6.3.4.2 | Incorporation by reference |
| S4-2 | Information related impacts Personal safety Social inclusion | Processes for engaging with consumers and end-users about impacts | 6.3.4.2 | |
| S4-3 | Information related impacts Personal safety Social inclusion | Processes to remediate negative impacts and channels for affected communities to raise concerns | 6.3.4.2 | |
| S4-4 | Information related impacts Personal safety Social inclusion | Taking action on material impacts on consumers and end-users, and approaches to managing material risks and pursuing material opportunities related to consumers and end-users, and effectiveness of those actions | 6.3.4.3 | |
| S4-5 | Information related impacts Personal safety Social inclusion | Targets related to managing material negative impacts, advancing positive impacts, and managing material risks and opportunities | 3.1.3.4 6.3.4.4 | Incorporation by reference |
ESRS G1 - Business conduct
| Disclosure | Sub-topic | Description | Section | Explanatory notes |
|---|---|---|---|---|
| ESRS 2, GOV-1 | The role of AMSB | The role of the administrative, management and supervisory bodies | 5.1.3 5.1.4 5.1.6 | Incorporation by reference |
| ESRS 2, IRO-1 | Process to identify and assess material impacts, risks and opportunities | Description of the processes to identify and assess material impacts, risks and opportunities | 6.1.4.3 6.4.1.2 | |
| G1-1 | Corporate culture Business conduct Protection of whistle-blowers Political engagement Management of relationships with suppliers including payment practices Corruption and bribery | Business conduct policies and corporate culture | 5.5.2 5.5.3 6.4.1.3 | Incorporation by reference |
| G1-2 | Management of relationships with suppliers including payment practices | Management of relationships with suppliers | 6.4.1.3 | |
| G1-3 | Corruption and bribery | Prevention and detection of corruption and bribery | 5.5.2 5.5.3 6.4.1.3 | Incorporation by reference |
| G1-4 | Corruption and bribery | Incidents of corruption or bribery | 6.4.1.4 | |
| G1-5 | Political engagement | Political influence and lobbying activities | n/a | |
| G1-6 | Management of relationships with suppliers including payment practices | Payment practices | n/a |
6.7.2 Basis of Double Materiality Assessment
The following steps have been performed to determine material sustainability matters from an impact and financial perspective:
Engage stakeholders.
Identify impacts, risks and opportunities.
Assess impact, risks and opportunities.
Determine material sustainability matters.
1. Engage stakeholders
As part of the materiality assessment, a.s.r. has actively engaged with its stakeholders (both internal and external) to gather input on environmental, social and governance topics that may potentially be material for a.s.r. In addition to the continuous stakeholder interaction, a stakeholder dialogue was held. For a comprehensive explanation of stakeholder engagement, including which stakeholders were approached, how they were engaged and the outcomes, see section 6.1.4.1.
2. Identify impacts, risks and opportunities
The first step of a.s.r.’s materiality assessment was creating a long list of sustainability matters covering environmental, social and governance topics that could potentially be material for a.s.r. This list was based on the sustainability matters as defined by the ESRS and complemented with a.s.r.-specific sustainability matters drawn from previous materiality analyses, stakeholder input and peer analysis.
To understand a.s.r.’s business activities and business relationships, a.s.r.’s aggregated value chain was used as a starting point. Expert judgment was applied at each step of the individual value chains to identify which sustainability matters are most relevant, ensuring the materiality assessment focuses on the matters with the highest impact or financial materiality.
Impacts were defined by describing the effect that a.s.r. has or could have on the environment and people, including effects on their human rights, connected with its own operations and upstream and downstream value chain, including through its products and services, as well as through its business relationships. The impacts can be actual or potential, negative or positive, intended or unintended, and reversible or irreversible. They can arise over the short, medium or long term. Impact indicates the undertaking's positive or negative contribution to sustainability.
Risks and opportunities were defined by describing the activities, products or business relationships and stakeholders concerned, and by specifying whether they result from a certain event or development, like laws and regulations, sanctions and lawsuits, shift in supply and demand, and physical or transition risks related to environmental change. Additionally, the identified impacts were considered when defining risks and opportunities. For each risk and opportunity, the potential effect on financial position, financial performance, cash flows, access to finance or cost of capital in the short, medium or long term was determined.
3. Assess impacts, risks and opportunities
Impacts
As part of the bottom-up approach, the product lines have assessed impacts based on a set of predefined assessment criteria. Working together with the sustainability manager of each product line and with the support of subject matter experts, they assessed the impacts and applied a five-point scale to determine a score based on different attributes.
Data such as emissions data or externally sourced ESG data for investments was used in the assessment, when available. In cases where data was not available, external research, industry proxies and expert judgement were applied. The assessment does not consider whether policies are in place to prevent, mitigate or remediate negative impacts, like an exclusion policy for the investment universe and client acceptance policies for certain products.
Negative impacts were assessed by determining and adding up a score for their scale (how grave the impact is), scope (how widespread the impact is) and irremediable character (whether and to what extent the negative impacts could be remediated). Positive impacts were assessed by determining and adding up a score for their scale (how beneficial the impact is) and scope (how widespread the impact is). For potential impacts, likelihood of occurrence was considered by multiplying the materiality score by its likelihood score.
Likelihood was assessed considering the time horizon and circumstances in which the impact might occur, and whether the impacts have occurred before at a.s.r. or in the insurance sector. For adverse impacts on human rights, as stipulated in the Universal Declaration of Human Rights and other UN human rights treaties, the severity of the impact takes precedence over its likelihood, so the materiality score of these impacts is high even if their likelihood of occurrence is small.
Risks and opportunities
The product lines have also assessed the anticipated financial effect of each risk and opportunity based on a set of predefined assessment criteria for the magnitude and likelihood of the financial effect. Working together with the Risk team of each product line, they applied a five-point scale to score the attributes.
This assessment was based on data, if available: for example, they considered the percentage of houses in the mortgage portfolio exposed to flooding risk or investment exposure in high-risk countries for human rights violations. If data was not available, expert judgement was applied, considering industry proxies. The assessment does not consider whether policies are in place to pursue opportunities or manage risks, like the Policy on Responsible Investments.
The magnitude of the financial effect was assessed by considering effects on the ability to use resources and the ability to rely on relationships needed in the business processes of a.s.r. and its business partners across its value chain. For resource use, a score was determined reflecting availability of, access to, and prices of resources in the short, medium and long term. For relationships, a score was determined reflecting reputational effects and potential actions by stakeholders in the short, medium and long term. For likelihood, a score was determined similarly to the assessment of impacts.
4. Determine material sustainability matters
For each product line, through a bottom-up approach and after assessing impacts, risks and opportunities, a ranked list of negative impacts, positive impacts, risks and opportunities was created for the identified sustainability matters.To distinguish material sustainability matters from non-material sustainability matters, a threshold was applied. From a scoring perspective, a.s.r.’s approach entails establishing a threshold for the maximum score that can be allocated to impacts, risks and opportunities. In summary, a score below 33% is categorised as low, a score between 33% and 66% as medium, and a score above 66% is considered high.
Sustainability matters related to impacts, risks and opportunities with a medium or high score were concluded to be material from either the impact and/or the financial materiality perspective.
For sustainability matters related to impacts, risks and opportunities with a low materiality score, additional judgement was applied. Representatives from Sustainability, Procurement, ESG Reporting and Group Risk Management assessed these sustainability matters on a case-by-case basis to draw conclusions on their materiality, taking into account consistency across product lines and the ranking of the matters by stakeholders. In case where the outcome was uncertain, the matter was presented to the Remediation Board to draw a final conclusion.
The process and outcomes of the materiality assessment were reviewed and aligned with the management teams of the product lines. Subsequently, the outcome of the materiality assessment was reviewed by various governing bodies involved in sustainability reporting, such as the Quality Board and the Steering Committee, prior to having the materiality assessment approved by the MB. For more information, see section section 5.1.6.
Consolidation of IROs
Impacts, risks and opportunities were identified bottom-up at the product line level. Each product line identified and assessed its impacts, risks and opportunities. To present a cohesive and integrated view, a comprehensive consolidation process was carried out, involving a detailed evaluation to determine which impacts, risks and opportunities could be merged at the sub-sub-topic level. During this consolidation process, each product line, alongside their respective management teams, played a critical role in validating and refining the merged impacts, risks and opportunities. This collaborative approach improved accuracy.
6.7.3 Changes in existing material topics
In addition to the material changes disclosed in section 6.1.4.3, the table below provides an overview of the non‑material changes.
Changes in material topics compared to previous reporting period
| Material (Sub-)topic 2024 | Material (Sub-)topic 2025 | Material impact | Type of change |
|---|---|---|---|
| Climate change - Climate change adaptation | Climate change - Climate change adaptation | | Asset Management added to scope and potential added to type because of material impact investments in relation to climate adaptation. |
| Climate change - Climate change adaptation | Climate change - Climate change adaptation | | Asset Management and Health added to scope as they are also materially affected by climate-related physical risks. Actual added to type because this is also a short term risk. |
| Climate change - Climate change mitigation | Climate change - Climate change mitigation | | TPM removed from scope as there currently is no proven material positive impact on climate change mitigation by TPM activities. |
| Climate change - Climate change mitigation | Climate change - Climate change mitigation | | Individual life & Funeral removed from scope as negative impact is too small to be material. Newly acquired HumanTotalCare added to scope. |
| Climate change - Climate change mitigation | Climate change - Climate change mitigation | | Asset Management added to scope as they also are materially affected by climate-related transition risks. Short term added to term because this is also an actual risk. |
| Climate change - Climate change mitigation | Climate change - Climate change mitigation | | Real Estate added to scope as they also have material opportunities in relation to energy transition. |
| Pollution of water | - | | Health's impact on water pollution moved to topic Biodiversity and ecosystem services as water pollution is a known impact driver of biodiversity loss. |
| Biodiversity - Direct impact drivers on biodiversity loss | Biodiversity - Direct impact drivers on biodiversity loss | | Asset Management added to scope because of material impact investments in relation to biodiversity. |
| Biodiversity - Direct impact drivers on biodiversity loss | Biodiversity - Direct impact drivers on biodiversity loss | | Mortgages and Health added to scope because they also have material negative impacts on biodiversity loss. |
| Biodiversity - Impacts and dependencies on ecosystem services | Biodiversity - Ecosystem services | | Real Estate added to scope as they also have a material negative impact on ecosystem services. |
| Biodiversity - Impacts and dependencies on ecosystem services | Biodiversity - Ecosystem services | | Asset Management and Health added to scope as they are also materially affected by loss of ecosystem services. Following the addition of Health, upstream has been added to scope. |
| Biodiversity - Impacts and dependencies on ecosystem services | - | | Real Estate's risk in relation to loss of ecosystem services is sufficiently covered by previous risk description. |
| Resource use and circular economy - Resource inflows | Resource inflows, including resource use | | P&C added to scope as they have material impact on resource inflows through repair instead of replace claims handling approach. Real Estate removed from scope as their positive impact is currently more a remediation of a predominantly negative impact on resource use. |
| Resource use and circular economy - Resource inflows | Resource inflows, including resource use | | Real Estate added to scope as their impact on resource inflows is currently predominately negative. |
| Resource use and circular economy - Waste | Resource outflows related to products and services | | The type of impact has been adjusted to potential, as impact is currently on a rather limited scale but is expected to have more of an effect in the future. |
| Resource use and circular economy - Waste | Waste | | Newly acquired HumanTotalCare added to scope. |
| Own workforce | Working conditions | | Newly acquired HumanTotalCare added to scope. |
| Own workforce | Other work related rights | | Newly acquired HumanTotalCare added to scope. |
| Own workforce | Equal treatment and equal opportunities | | Newly acquired HumanTotalCare added to scope. |
| Own workforce | Equal treatment and equal opportunities for all | | Newly acquired HumanTotalCare added to scope. |
| Own workforce | Equal treatment and equal opportunities for all | | Newly acquired HumanTotalCare added to scope. |
| Workers in the value chain | Working conditions and other work-related rights | | Sub-topic was expanded with sub topic working conditions because Asset Management and Real Estate also have a material impact on adequate wage. Scope was expanded with Health as they have a negative impact on working conditions as well. |
| Workers in the value chain | - | | Health's impact on working conditions was moved to scope of previous impact. |
| Consumers and end-users | Information-related impacts for consumers and/or end-users | | As activities take place in own operations, value chain was replaced by own operations. |
| Consumers and end-users | Information-related impacts for consumers and/or end-users | | As activities take place in own operations, value chain was replaced by own operations. Newly acquired HumanTotalCare was added to scope. |
| Consumers and end-users | - | | As impact is quite indirect and cannot be quantified as a material stand-alone sub-topic, we have integrated this impact in sub-topic social inclusion and personal safety. |
| Consumers and end-users | Social inclusion of consumers and/or end-users and personal safety of consumers and/or end-users | | Sub-topic was expanded with sub-topic personal safety to reflect the positive impact a.s.r. has on personal safety of consumers and/or end-users. Newly acquired HumanTotalCare added to scope. Asset Management added to scope because of impact investments in relation to social inclusion and/or personal safety of end-users. |
| Consumers and end-users | Social inclusion of consumers and/or end-users | | Impact of irresponsible marketing practices was added to this impact. Newly acquired HumanTotalCare added to scope. |
| Business conduct | Corporate culture | | Newly acquired HumanTotalCare added to scope. |
| Business conduct | Management of relationship with suppliers | | Scope of the value chain adjusted to upstream, because activities take place in the upstream value chain. |
| Business conduct | Corruption and bribery | | Changed to a negative impact as a.s.r. does not have a demonstrable material positive impact on this subject, but it does have a negative impact if things go wrong. Newly acquired HumanTotalCare added to scope. |

7 Financial statements
7.1 Introduction
7.1.1 General information
a.s.r. is listed on Euronext Amsterdam and is included in the AEX index. a.s.r. has a total of 8,689 internal FTE’s (2024: 7,373).
a.s.r. is a
a.s.r. is registered under number 30070695 in the register of the Chamber of Commerce.
The consolidated financial statements are presented in millions of euros (€), being the functional currency of a.s.r. and all its group entities. All amounts quoted in these financial statements are in euros and rounded to the nearest million, unless otherwise indicated. Calculations are made using unrounded figures. As a result rounding differences can occur.
These statements have been prepared on a going concern basis.
The financial statements for 2025 were authorised for issue by the Executive Board (EB) and approved by the Supervisory Board (SB) on 24 March 2026. The financial statements 2025 will be presented to the Annual General Meeting (AGM) of Shareholders for adoption on 20 May 2026.
7.1.2 Statement of compliance
The consolidated financial statements of a.s.r. have been prepared in accordance with International Financial Reporting Standards Accounting Standards (IFRS) – including the International Accounting Standards (IAS) and Interpretations – as adopted by the EU (EU-IFRS), and with the financial reporting requirements included in Title 9, Book 2 of the Dutch Civil Code, where applicable. a.s.r.'s interpretation of EU-IFRS is included in the a.s.r. accounting manual. The accounting policies included in section 7.3 are a summary of the relevant accounting policies of the a.s.r. accounting manual.
EU-IFRS differs from International Financial Reporting Standards Accounting Standards as issued by the International Accounting Standards Board (IFRS). Under EU-IFRS, a.s.r. applies fair value hedge accounting for portfolio hedges of interest rate risk (macro hedging) under the EU ‘carve out’ of IFRS. This is the only difference between EU-IFRS as applied by a.s.r. and IFRS.
Pursuant to the options offered by Section 362, Book 2 of the Dutch Civil Code, a.s.r. has prepared its company financial statements in accordance with the same principles as those used for the consolidated financial statements.
7.2 Consolidated financial statements
7.2.1 Consolidated balance sheet
Consolidated balance sheet
| (in € and before profit appropriation) | Note | 31 December 2025 | 31 December 2024 (restated) |
|---|---|---|---|
| Intangible assets | 7.5.1 | ||
| Property, plant and equipment | 7.5.2 | ||
| Investment property | 7.5.3 | ||
| Associates and joint ventures at equity method | 7.5.4 | ||
| Investments | 7.5.5 | ||
| Investments related to direct participating insurance contracts | 7.5.6 | ||
| Derivatives | 7.5.7 | ||
| Deferred tax assets | 7.5.8 | ||
| Reinsurance contract assets | 7.5.13 | ||
| Other assets | 7.5.9 | ||
| Cash and cash equivalents | 7.5.10 | ||
| Total assets | |||
| Share capital | 7.5.11.1 | ||
| Share premium reserve | 7.5.11.2 | ||
| Unrealised gains and losses | 7.5.11.3 | ||
| Actuarial gains and losses | 7.5.11.4 | - | - |
| Retained earnings | |||
| Treasury shares | 7.5.11.5 | - | - |
| Equity attributable to shareholders | |||
| Other equity instruments | 7.5.11.6 | ||
| Equity attributable to holders of equity instruments | |||
| Non-controlling interests | |||
| Total equity | |||
| Subordinated liabilities | 7.5.12 | ||
| Insurance contract liabilities | 7.5.13 | ||
| Liabilities arising from direct participating insurance contracts | 7.5.14 | ||
| Employee benefits | 7.5.15 | ||
| Provisions | 7.5.16 | ||
| Borrowings | 7.5.17 | ||
| Derivatives | 7.5.7 | ||
| Due to banks | 7.5.18 | ||
| Other liabilities | 7.5.19 | ||
| Total liabilities | |||
| Total equity and liabilities |
The numbers following the line items refer to the relevant sections in the notes.
The 31 December 2024 figures have been restated, see section 7.3.2.
7.2.2 Consolidated income statement
Consolidated income statement for the year ended 31 December
| (in € millions) | Note | 2025 | 2024 (restated) |
|---|---|---|---|
| Continuing operations | |||
| Insurance contract revenue | 7.6.1 | ||
| Incurred claims and benefits | - | - | |
| Insurance service operating expenses | 7.6.11 | - | - |
| Insurance service expenses | 7.6.2 | - | - |
| Insurance service result before reinsurance | |||
| Net result from reinsurance contracts | 7.6.3 | - | - |
| Insurance service result | |||
| Direct investment income | 7.6.4 | ||
| Net fair value gains (and losses) | 7.6.5 | - | |
| Impairments on financial assets | 7.6.6 | ||
| Net finance result from insurance and reinsurance contracts | 7.6.7 | - | |
| Other finance expenses | 7.6.8 | - | - |
| Investment operating expenses | 7.6.11 | - | - |
| Investment and finance result | |||
| Share of result of associates and joint ventures | |||
| Fee income | 7.6.9 | ||
| Other income | 7.6.10 | ||
| Total other income | |||
| Other expenses | 7.6.11 | - | - |
| Total other income and expenses | - | - | |
| Result before tax | |||
| Income tax (expense) / gain | 7.6.12 | - | - |
| Result after tax | |||
| Discontinued operations | |||
| Result after tax from discontinued operations | 7.4.6 | - | |
| Net result | |||
| Attributable to: | |||
| Non-controlling interests | - | ||
| - Shareholders of the parent | |||
| - Holders of other equity instruments | |||
| Result attributable to holders of equity instruments |
The numbers following the line items refer to the relevant sections in the notes. The comparative figures for 2024 have been restated (see section 7.3.2).
Basic earnings per share
| (in €) | 2025 | 2024 (restated) |
|---|---|---|
| Basic earnings per share | ||
| Basic earnings per ordinary share from continuing operations | ||
| Basic earnings per ordinary share from discontinued operations | - | |
| Basic earnings per share |
Diluted earnings per share
| (in €) | 2025 | 2024 (restated) |
|---|---|---|
| Diluted earnings per share | ||
| Diluted earnings per ordinary share from continuing operations | ||
| Diluted earnings per ordinary share from discontinued operations | - | |
| Diluted earnings per share |
For more information on the earnings per share, see section 7.5.11.7. The comparative figures for 2024 have been restated (see section 7.3.2).
7.2.3 Consolidated statement of comprehensive income
Consolidated statement of comprehensive income for the year ended 31 December
| (in € millions) | Note | 2025 | 2024 (restated) |
|---|---|---|---|
| Net result | |||
| Continuing operations | |||
| Remeasurements of post-employment benefit obligation | 7.5.15.1 | ||
| Unrealised change in value of property for own use and plant | |||
| Equity instruments designated as FVOCI | 7.5.5.2 | ||
| - Unrealised change in value of equity instruments designated as FVOCI | |||
| - Realised gains/(losses) on equity instruments designated as FVOCI | |||
| Income tax on items that will not be reclassified to profit or loss | 7.5.8 | - | - |
| Total items that will not be reclassified to profit or loss | |||
| Discontinued operations | |||
| Other comprehensive income after tax from discontinued operations that may be reclassified to profit and loss | 7.4.6 | - | |
| Total other comprehensive income after tax | |||
| Total comprehensive income | |||
| Attributable to: | |||
| Non-controlling interests | - | ||
| - Shareholders of the parent | |||
| - Holders of other equity instruments | |||
| Total comprehensive income attributable to holders of equity instruments |
The numbers following the line items refer to the relevant sections in the notes. The comparative figures for 2024 have been restated (see section 7.3.2).
7.2.4 Consolidated statement of changes in equity
Consolidated statement of changes in equity
| (in € millions) | Share capital | Share premium reserve | Unrealised gains and losses | Unrealised actuarial gains and losses | Retained earnings | Treasury shares (-) | Equity attributable to shareholders | Other equity instruments | Non-controlling interest | Total equity |
|---|---|---|---|---|---|---|---|---|---|---|
| At 1 January 2025 | - | - | ||||||||
| Net result | ||||||||||
| Total other comprehensive income | ||||||||||
| Total comprehensive income | ||||||||||
| Dividend paid | - | - | - | - | ||||||
| Discretionary interest on other equity instruments | - | - | - | |||||||
| Issue of other equity instruments | ||||||||||
| Cost of issue of other equity instruments | - | - | - | |||||||
| Treasury shares acquired (-)/sold | - | - | - | |||||||
| Increase / (decrease) in capital | - | - | ||||||||
| Changes in the composition of the group | - | - | ||||||||
| Other movements | - | - | - | |||||||
| At 31 December 2025 | - | - | ||||||||
| At 1 January 2024 restated | - | - | ||||||||
| Net result restated | - | |||||||||
| Total other comprehensive income | ||||||||||
| Total comprehensive income restated | - | |||||||||
| Dividend paid | - | - | - | - | ||||||
| Discretionary interest on other equity instruments | - | - | - | |||||||
| Issue of other equity instruments | ||||||||||
| Redemptions of other equity instruments | - | - | ||||||||
| Cost of issue of other equity instruments | - | - | - | |||||||
| Treasury shares acquired (-)/sold | - | - | - | - | ||||||
| Increase / (decrease) in capital | ||||||||||
| Other movements | ||||||||||
| At 31 December 2024 restated | - | - |
The comparative figures for 2024 have been restated (see section 7.3.2).
For more information on the share premium reserve, see section 7.5.11.2.
For more information on the actuarial gains and losses related to the pension obligation, see section 7.5.11.4.
For more information on treasury shares acquired and sold, see section 7.5.11.5.
For more information on the issue and redemption of other equity instruments in 2025, see section 7.5.11.6.
In 2025, changes in composition of the group of Non-controlling interests relate to the deconsolidation of ASR Dutch Science Park Fund (ASR DSPF). As per April 2025 a.s.r. lost control of ASR DSPF, see sections 7.5.3 and 7.5.4.
7.2.5 Consolidated statement of cash flows
Consolidated statement of cash flows
| (in € millions) | 2025 | 2024 (restated) |
|---|---|---|
| Cash and cash equivalents as at 1 January | ||
| Result before tax1 | ||
| Adjustments on non-cash items included in result | ||
| Changes in operating assets and liabilities | - | - |
| Income tax received (paid) | - | - |
| Cash flows from operating activities | - | - |
| Cash flows from investing activities: | ||
| Investments in associates and joint ventures | - | - |
| Proceeds from sales of associates and joint ventures | ||
| Purchases of property, plant and equipment | - | - |
| Purchases of group companies (less acquired cash positions) | - | |
| Proceeds from sales of property, plant and equipment | ||
| Sales of group companies (less sold cash positions) | - | |
| Purchase of intangible assets | - | - |
| Cash flows from investing activities | - | - |
| Cash flows from financing activities: | ||
| Repayment of subordinated debts | - | |
| Proceeds from issues of loans | ||
| Repayment of loans | - | - |
| Repayment of lease liabilities | - | - |
| Dividend paid | - | - |
| Discretionary interest to holders of equity instruments | - | - |
| Non-controlling interests | ||
| Issue of other equity instruments | ||
| Repayment of other equity instruments | - | |
| (Purchase)/ sale of treasury shares | - | - |
| Cash flows from financing activities | - | - |
| Effect of movements in exchange rates on cash held | ||
| Cash and cash equivalents as at 31 December |
- Result before tax from continuing and discontinued operations consists of Result before tax from continued operations amounting to € 696 mln. (2024: €
The comparative figures for 2024 have been restated (see section 7.3.2).
For more information on cash and cash equivalents, see section 7.5.10.
For more information on the cash flows from operating activities, including the cash flows from interest received, interest paid and dividend received, see section 7.7.2.
7.3 Accounting policies
7.3.1 Changes in EU endorsed published IFRS Standards and Interpretations effective in 2025
In 2025, no changes in EU endorsed published IFRS Standards and Interpretations are relevant to a.s.r.
7.3.2 Changes in accounting policies and presentations
7.3.2.1 Changes in accounting policies
Change in accounting policy for the measurement of the liability for remaining coverage and incurred claims for Individual disability contracts
In 2025, a.s.r. implemented a voluntary change in accounting policy regarding the treatment of incurred claims within the Individual Disability portfolio. Under IFRS 17, entities may exercise judgment in determining whether a claim incurred, while the contract remains subject to future insurance risk, should be recognised as a Liability for Incurred Claims or included in the Liability for Remaining Coverage.
At the implementation of IFRS 17, a.s.r. opted for the Liability for Incurred Claims accounting policy choice for the entire Income portfolio, including individual income products with incurred claims subject to future insurance risk.
After three years of practical experience and a more detailed analysis, a.s.r. reassessed this accounting policy choice. The review concluded that the Individual Disability portfolio differs significantly from the Group Disability and Sickness Leave portfolios in several respects, such as coverage structure, risk profile, claim timing and predictability, and the nature of services provided to policyholders. This reassessment was driven by the inherent complexity and volatility in measuring the Individual Disability portfolio.
Based on the work performed, a.s.r. changed the accounting policy choice for incurred claims that remain subject to future insurance risk, and these are now accounted for under the Liability for Remaining Coverage. Consequently, related experience adjustments (linked to current and past services) are recognised in the CSM rather than in the insurance service result. The revised accounting policy change aims to reduce complexity and improve the relevance of financial information, it better reflects the services provided to policyholders and aligns with the recently emerged market practice, enhancing comparability and consistency across the industry.
As part of the Individual Disability portfolio is reinsured, this change also impacts the accounting for related reinsurance contracts, as the best estimate cash flows of the underlying policies form the basis for measuring those contracts.
Because of the time needed for this thorough review and the accounting policy change decision in the second half-year of 2025, the first half-year 2025 reporting was still prepared on the previous accounting policy choice.
Impact of the change
The change in accounting policy is applied retrospectively. The difference between the actually reported and the revised performance based on the new accounting policy choice is reflected in the table below on the next page.
Reconciliation change in accounting policies
| Previously reported | Impact of Accounting Policy Change | Restated Amount | |
|---|---|---|---|
| Balance sheet 1 January 2024 | |||
| Reinsurance contract assets | 501 | 17 | 518 |
| Other assets | 3,598 | -15 | 3,583 |
| Total assets | 150,768 | 2 | 150,771 |
| Retained earnings | 4,147 | 42 | 4,190 |
| Insurance contract liabilities | 63,302 | -40 | 63,262 |
| Total equity and liabilities | 150,768 | 2 | 150,771 |
| Balance sheet 31 December 2024 | |||
| Reinsurance contract assets | 485 | 6 | 491 |
| Other assets | 3,342 | -19 | 3,323 |
| Total assets | 138,595 | -13 | 138,582 |
| Retained earnings | 4,528 | 54 | 4,582 |
| Insurance contract liabilities | 64,267 | -68 | 64,200 |
| Total equity and liabilities | 138,595 | -13 | 138,582 |
| Income statement 2024 | |||
| Insurance contract revenue | 9,601 | -1 | 9,601 |
| Incurred claims and benefits | -7,389 | 30 | -7,359 |
| Insurance service expenses | -8,739 | 30 | -8,710 |
| Insurance service result before reinsurance | 862 | 29 | 891 |
| Net result from reinsurance contracts | -90 | -11 | -101 |
| Insurance service result | 772 | 18 | 790 |
| Net finance result from insurance and reinsurance contracts | -5,731 | -1 | -5,733 |
| Investment and finance result | 843 | -1 | 842 |
| Result before tax | 1,447 | 17 | 1,464 |
| Income tax (expense) / gain | -383 | -4 | -387 |
| Net result | 944 | 12 | 956 |
| Income statement HY2025 | |||
| Insurance contract revenue | 4,944 | -1 | 4,943 |
| Incurred claims and benefits | -3,836 | 4 | -3,832 |
| Insurance service expenses | -4,542 | 4 | -4,539 |
| Insurance service result before reinsurance | 402 | 2 | 404 |
| Net result from reinsurance contracts | -45 | -10 | -56 |
| Insurance service result | 356 | -8 | 349 |
| Net finance result from insurance and reinsurance contracts | 1,551 | 3 | 1,554 |
| Investment and finance result | -143 | 3 | -140 |
| Result before tax | 168 | -5 | 163 |
| Income tax (expense) / gain | -35 | 1 | -34 |
| Net result | 133 | -4 | 130 |
The total after‑tax impact of the accounting policy change is an increase in total equity as at 31 December 2024 of € 54 million (1 January 2024: € 42 million).
The impact of the accounting policy change on the CSM as at 31 December 2024 is a decrease of € 73 million (1 January 2024: decrease of € 57 million). See section 7.5.13.1 for further details.
7.3.2.2 Changes in presentation
In 2025, no changes in presentation are made by a.s.r.
7.3.3 Upcoming changes in published IFRS standards and interpretations, not yet effective in 2025
The following new standards, amendments to existing standards and interpretations, relevant to a.s.r. and published prior to 1 January 2026 and effective for accounting periods beginning on or after 1 January 2026, were not early adopted by a.s.r.:
IFRS 18: Presentation and Disclosure in Financial Statements (2027);
IFRS 18 Presentation and Disclosure in Financial Statements
IFRS 18 replaces IAS 1, carrying forward many of the requirements in IAS 1 unchanged and introduces the following key changes:
present specified categories (operating, investing, financing) and defined subtotals in the income statement;
provide disclosures on management-defined performance measures (MPMs) in the notes to the financial statements;
enhance criteria for aggregating and disaggregating financial statement line items;
the operating profit subtotal is the starting point for the statement of cash flows when presenting the operating cash flows under the indirect method.
In 2025, a high-level impact assessment has been performed and a.s.r. has set up a project to implement IFRS 18. IFRS 18 will be applied retrospectively from 1 January 2027. Based on current analysis, the impact on a.s.r.'s financial statements is expected to be limited to presentation and disclosure changes, with no change expected to result for the year. At this stage, other quantitative effects cannot yet be reliably estimated.
7.3.4 Key accounting policies
A. Estimates and assumptions
The preparation of the financial statements requires a.s.r. to make estimates, assumptions and judgements in applying accounting policies that have an effect on the reported amounts in the financial statements. These relate primarily to the following:
The estimated useful life, residual value and fair value of property, plant and equipment, investment property, and intangible assets (see accounting policy C, D and P);
The fair value and impairments of unlisted financial instruments (see accounting policy B and E);
The recoverable amount of impaired assets (see accounting policy B and E );
The fair value used to determine the net asset value in acquisitions (see section 7.4.5);
The fair value used in measuring the assets held for sale and liabilities related to the assets held for sale (see section 7.4.6);
The measurement of insurance contract liabilities and liabilities arising from direct participating insurance contracts (see section 7.5.13.4);
Actuarial assumptions used for measuring employee benefit obligations (see section 7.5.15);
When forming provisions, the required estimate of existing obligations arising from past events (see section 7.5.16).
The estimates and assumptions are based on management's best knowledge of current facts, actions and events. The actual outcomes may ultimately differ from the results reported earlier on the basis of estimates and assumptions. A detailed explanation of the estimates and assumptions are given in the relevant notes to the consolidated financial statements.
a.s.r. takes into account in the expense assumptions the estimated synergy effects from the Aegon NL business combination for the part that can be assessed within the budget period.
B. Fair value of assets and liabilities
The fair value is the price that a.s.r. would receive to sell an asset or pay to transfer a liability in an orderly transaction between market participants on the transaction date or reporting date in the principal market for the asset or liability, or in the most advantageous market for the asset or liability and assuming the highest and best use for non-financial assets.
Where possible, a.s.r. determines the fair value of assets and liabilities on the basis of quoted prices in an active market. In the absence of an active market for a financial instrument, the fair value is determined using valuation techniques. Although valuation techniques are based on observable market data where possible, results are affected by the assumptions used, such as discount rates and estimates of future cash flows. In the unlikely event that the fair value of a financial instrument cannot be measured, it is carried at cost.
Fair value hierarchy
The following three hierarchical levels are used to determine the fair value of financial instruments and non-financial instruments when accounting for assets and liabilities at fair value and disclosing the comparative fair value of assets and liabilities:
Level 1. Fair value based on quoted prices in an active market
Level 1 includes assets and liabilities whose value is determined by quoted (unadjusted) prices in the primary active market for identical assets or liabilities.
A financial instrument is quoted in an active market if:
Quoted prices are readily and regularly available (from an exchange, dealer, broker, sector organisation, third-party pricing service, or a regulatory body); and
These prices represent actual and regularly occurring transactions on an at arm's length basis.
Financial instruments in this category primarily consist of bonds and equities listed in active markets. Cash and cash equivalents (excluding money market instruments), reverse repurchase agreements and cash collateral received are also included as level 1.
Level 2. Fair value based on observable market data
Determining fair value on the basis of Level 2 involves the use of valuation techniques that use inputs other than quoted prices included within Level 1 that are observable for the asset or liability, either directly (that is, as prices) or indirectly (that is derived from prices of identical or similar assets and liabilities). These observable inputs are obtained from a broker or third-party pricing service and include:
Quoted prices in active markets for similar (not identical) assets or liabilities;
Quoted prices for identical or similar assets or liabilities in inactive markets;
Input variables other than quoted prices observable for the asset or liability. These include interest rates and yield curves observable at commonly quoted intervals, volatility, loss ratio, credit risks and default percentages.
This category primarily includes:
Financial instruments: unlisted fixed-interest preference shares and interest rate contracts;
Financial instruments: loans (excluding mortgage loans and reverse repurchase agreements);
Other financial assets and liabilities.1
I. Financial instruments: unlisted fixed-interest preference shares and interest rate contracts
This category includes unlisted fixed-interest preference shares and interest rate contracts. The valuation techniques for financial instruments use present value calculations and in the case of derivatives, include forward pricing and swap models. The observable market data contains yield curves based on company ratings and characteristics of the unlisted fixed-interest preference shares.
II. Financial instruments: Loans (excluding mortgage loans and reverse repurchase agreements)
The fair value of the loans is based on the discounted cash flow method. It is obtained by calculating the present value based on expected future cash flows and assuming an interest rate curve used in the market that includes an additional spread based on the risk profile of the counterparty.
III. Other financial assets and liabilities
For other financial assets and liabilities where the fair value is disclosed these fair values are based on observable market inputs, primarily being the price paid to acquire the asset or received to assume the liability on initial recognition, assuming that the transactions have taken place on an at arm's length basis. Valuation techniques using present value calculations are applied using current interest rates where the payment terms are longer than one year.
Level 3. Fair value not based on observable market data
The fair value of the level 3 assets and liabilities are determined in whole or in part using a valuation technique based on assumptions that are not supported by prices from observable current market transactions in the same instrument and for which any significant inputs are not based on available observable market data. The financial assets and liabilities in this category are assessed individually.
Valuation techniques are used to the extent that observable inputs are not available. The basic principle of fair value measurement is still to determine a fair, at arm's length price. Unobservable inputs therefore reflect management's own assumptions about the assumptions that market participants would use in pricing the asset or liability (including assumptions about risk). These inputs are generally based on the available observable data (adjusted for factors that contribute towards the value of the asset) and own source information.
This category primarily includes:
Financial instruments: private equity investments (or private equity partners) and equity funds third parties directly investing in real estate;
Financial instruments: mortgage loans and mortgage equity funds;
Investment property, real estate equity funds associates, rural property contracts, buildings for own use and plant (e.g. wind farms);
Financial instruments: asset-backed securities.
I. Financial instruments: private equity investments and real estate equity funds third parties
The main non-observable market input for private equity investments and equity funds third parties directly investing in real estate is the net asset value of the investment as published by the private equity company (or partner) and real estate equity funds respectively.
II. Financial instruments: mortgage loans and mortgage equity funds
The fair value of the mortgage loan portfolio is based on the discounted cash flow method. It is obtained by calculating the present value based on expected future cash flows and assuming an interest rate curve used in the market that includes an additional spread based on the risk profile of the counterparty.
The valuation method used to determine the fair value of the mortgage loan portfolio derives the spread from consumer rates, adapted for a delayed response to interest rate movements, and includes assumptions for originating cost and risks. The method of determining the fair value of the mortgage equity funds is similar to that of mortgage loans.
III. Investment property, real estate equity funds associates, rural property contracts, buildings for own use and plant
The following categories of investment properties, buildings for own use and plant are recognised and methods of calculating fair value are distinguished:
Residential – based on reference transaction and discounted cash flow method;
Retail – based on reference transaction and income capitalisation method;
Rural – based on reference transaction and discounted cash flow method;
Offices – based on reference transaction and discounted cash flow method (including buildings for own use);
Other investment property – based on reference transaction and discounted cash flow method;
Property under development – based on both discounted cash flow and income capitalisation method;
Plant - based on reference transaction and discounted cash flow method.
The following valuation methods are available for the calculation of fair value by the external professional appraisers for investment property, including real estate equity funds associates, rural property contracts, buildings for own use and plant:
Reference transactions
Independent professional appraisers use transactions in comparable properties and plant as a reference for determining the fair value of the property and plant. The reference transactions of comparable objects are generally based on observable data consisting of the land register ‘Kadaster’ and the rural land price monitor as published by the Dutch government ‘grondprijsmonitor’ in an active property market and in some instances accompanied by own use information.
The external professional appraisers valuate the property or plant using the reference transaction in combination with the following valuation methods to ensure the appropriate valuation of the property:
Discounted cash flow method;
Income capitalisation method (property only).
Discounted cash flow method
Under the discounted cash flow method, fair value is estimated using assumptions regarding the benefits and liabilities of ownership over the asset's life including an exit or terminal value. This method involves the projection of a series of cash flows on the investment property or plant dependent on the duration of the lease contracts.
A market-derived discount rate is applied to these projected cash flow series in order to establish the present value of the cash flows associated with the asset. The exit yield is normally determined separately, and differs from the discount rate.
The duration of the cash flows and the specific timing of inflows and outflows are determined by events such as rent reviews, lease renewal and related re-letting, redevelopment, or refurbishment. The appropriate duration is typically driven by market behaviour, which depends on the class of investment property. Periodic cash flow is typically estimated as gross rental income less vacancy (apart from the rural category), non-recoverable expenses, collection losses, lease incentives, maintenance costs, agent and commission costs and other operating and management expenses. The series of periodic net operating income, along with an estimate of the terminal value anticipated at the end of the projection period, is then discounted.
For the categories residential, offices and other in applying the discounted cash flow method, the significant inputs are the discount rate and market rental value. These inputs are verified with the following market observable data (that are adjusted to reflect the state and condition, location, development potential etc. of the specific property):
Market rent per square meter for renewals and their respective re-letting rates;
Reviewed rent per square meter;
Investment transactions of comparable objects;
10 Year Dutch Government Bond Yield (%) as published by the DNB.
When applying the discounted cash flow method for rural valuations, the significant inputs are the discount rate and market lease values. These inputs are verified with the following market observable data (that are adjusted to reflect the state and condition, location, development potential etc. of the specific property):
Market value per acre per region in accordance with the ‘rural land price monitor’;
10 Year Dutch Government Bond Yield (%) as published by the DNB.
Income capitalisation method
Under the income capitalisation method, a property's fair value is estimated based on the normalised net operating income generated by the property, which is divided by the capitalisation rate (the investor's rate of return). The difference between gross and net rental income includes the same expense categories as those for the discounted cash flow method with the exception that certain expenses are not measured over time, but included on the basis of a time weighted average, such as the average lease-up costs. Under the income capitalisation method, rents above or below the market rent are capitalised separately.
The significant inputs for retail valuations are the reversionary yield and the market or reviewed rental value. These inputs are generally verified with the following observable data (that are adjusted to reflect the state and condition, location, development potential etc. of the specific property):
Market rent per square meter for renewals;
Reviewed rent per square meter (based on the rent reviews performed in accordance with Section 303, Book 7 of the Dutch Civil Code).
The fair value of investment properties and buildings for own use, are appraised annually. Valuations are conducted by independent professional appraisers who hold recognised and relevant professional qualifications and have recent experience in the location and category of the property being valued. Market value property valuations were prepared in accordance with the Royal Institution of Chartered Surveyors (RICS) Valuation Standards, 7th Edition (the ‘Red Book’). a.s.r. provides adequate information to the professional appraisers, in order to conduct a comprehensive valuation. The professional appraisers are changed or rotated at least once every three years.
IV. Financial instruments: asset-backed securities
The fair value of the asset-backed securities is based on quotes published by an independent data vendor.
Transfers between levels
The hierarchical level per individual instrument, or group of instruments, is reassessed at every reporting period. If the instrument, or group of instruments, no longer complies with the criteria of the level in question, it is transferred to the hierarchical level that does meet the criteria. A transfer can for instance be when the market becomes less liquid or when quoted market prices for the instrument are no longer available.
- Not measured at fair value on the balance sheet and for which the fair value is disclosed.
C. Intangible assets
Intangible assets are carried at cost, less any accumulated amortisation and impairment losses. The residual value and the estimated useful life of intangible assets are assessed on each balance sheet date and adjusted where applicable.
Goodwill
Acquisitions by a.s.r. are accounted for using the acquisition method. Goodwill represents the excess of the cost of an acquisition over the fair value of a.s.r.’s share of the net identifiable assets and liabilities and contingent liabilities of the acquired company at acquisition date. If there is no excess (purchase gain), the carrying amount is directly recognised through the income statement. At the acquisition date, goodwill is allocated to the cash-generating units (CGUs) that are expected to benefit from the business combination.
Goodwill has an indefinite useful life and is not amortised. a.s.r. performs an impairment test annually, or more frequently if events or circumstances warrant so, to ascertain whether goodwill has been subject to impairment. As part of this, the carrying amount of the cash-generating unit to which the goodwill has been allocated is compared with its recoverable amount. The recoverable amount is the higher of a CGU’s fair value less costs to sell and value in use. The carrying value is determined as the net asset value including goodwill. The methodologies applied to arrive at the best estimate of the recoverable amount involves two steps.
In the first step of the impairment test, the best estimate of the recoverable amount of the CGU to which goodwill is allocated is determined separately based on Price to Earnings or Price to Book ratios (fair value less cost to sell model). The ratio(s) used per CGU depends on the characteristics of the entity in question. The main assumptions in this valuation are the multiples for the aforementioned ratios. These are developed internally but are either derived from or corroborated against market information that is related to observable transactions in the market for comparable businesses.
If the outcome of the first step indicates that the difference between the recoverable amount and the carrying value may not be sufficient to support the amount of goodwill allocated to the CGU, step two is performed. In step two an additional analysis is performed in order to determine a recoverable amount in a manner that better addresses the specific characteristics of the relevant CGU.
The additional analysis is based on internal value-in-use models, wherein managements assumptions in relation to cash flow projections for budget periods up to and including five years are used and, if deemed justified, expanded to a longer period given the nature of the insurance activities. Other assumptions, such as the (pre-tax) discount rate and the steady state growth rate, are determined on the advice of an independent external party and are based on a Capital Asset Pricing Model (CAPM). This methodology is based on a risk-free rate plus a risk premium. Operating assumptions are best estimate assumptions and based on historical data where available. Economic assumptions are based on observable market data and projections of future trends.
If the recoverable amount is lower than its carrying amount, the difference is directly charged to the income statement as an impairment loss.
In the event of impairment, a.s.r. first reduces the carrying amount of the goodwill allocated to the CGU. After that, the carrying amount of the other assets included in the unit is reduced pro rata to the carrying amount of all the assets in the unit.
D. Investment property
Investment property is property held to earn rent and for capital appreciation. Property interests held under operating leases are classified and accounted for as investment property. In some cases, a.s.r. is the owner-occupier of investment properties. If owner-occupied properties cannot be sold separately, they are treated as investment property only if a.s.r. holds an insignificant portion for use in the supply of services or for administrative purposes. Property held for own uses (owner-occupied) is recognised within property, plant and equipment.
Investment property is primarily recognised using the fair value model. After initial recognition, a.s.r. remeasures all of its investment property (see accounting policy B) whereby any gain or loss arising from a change in the fair value of the specific investment property is recognised in the income statement under fair value gains and losses.
Residential property is generally let for an indefinite period. Other investment property is let for defined periods under leases that cannot be terminated early. Some contracts contain renewal options. Rentals are accounted for as investment income in the period to which they relate.
If there is a change in the designation of property, it can lead to:
Reclassification from property, plant and equipment to investment property: at the end of the period of owner-occupation or at inception of an operating lease with a third party; or
Reclassification from investment property to property, plant and equipment: at the commencement of owner-occupation or at the start of developments initiated with a view to selling the property to a third party.
The following categories of investment property are recognised by a.s.r. based primarily on the techniques used in determining the fair value of the investment property:
Retail;
Residential;
Rural;
Offices;
Other (consisting primarily of parking);
Investment property under development.
Property under development for future use as investment property is recognised as investment property. The valuation of investment property takes (expected) vacancies into account.
Borrowing costs directly attributable to the acquisition or development of an asset are capitalised and are part of the cost of that asset. Borrowing costs are capitalised when the following conditions are met:
Expenditures for the asset and borrowing costs are incurred; and
Activities are undertaken that are necessary to prepare an asset for its intended use.
Borrowing costs are no longer capitalised when the asset is ready for use or sale. If the development of assets is interrupted for a longer period, capitalisation of borrowing costs is suspended. If the construction is completed in stages and each part of an asset can be used separately, the borrowing costs for each part that reaches completion are no longer capitalised.
E. Financial assets and financial liabilities
Recognition and initial measurement
a.s.r. recognises deposits and loans and borrowings on the date on which they originate. All other financial instruments are recognised at the transaction date, which is the date on which a.s.r. becomes party to the contractual stipulations of the instrument.
Financial assets or financial liabilities are initially measured at fair value plus, for a financial asset or financial liability not measured at FVTPL, transaction costs that are directly attributable to its acquisition or issue.
Classification and subsequent measurement
When a.s.r. becomes party to a financial asset contract, the related assets are classified into one of the following categories:
Amortised cost;
Financial assets at fair value through other comprehensive income (FVOCI); or
Financial assets at fair value through profit or loss (FVTPL).
The classification of the financial assets is determined at initial recognition. The classification and measurement of certain financial assets (debt instruments) is based on a.s.r.’s business models in which a financial asset is managed, and its contractual cash flow characteristics. For detailed information on the fair value of the financial assets see accounting policy B.
Financial assets at amortised cost
A financial asset (debt instrument) can be measured at amortised cost if it meets both of the following conditions and is not designated as FVTPL:
It is held within a business model whose objective is to hold assets to collect contractual cash flows; and
Its contractual terms give rise on specified dates to cash flows that are solely payments of principal and interest on the principal amount outstanding. This is known as the SPPI test.
Debt instruments at amortised cost include mortgage loans and private loans held by Aegon Hypotheken B.V. (Aegon hypotheken).
Financial assets that are designated as hedged items are measured in accordance with the requirements for hedge accounting.
Financial assets at FVOCI
Equity instruments can be measured at FVOCI if they are not held for trading. There is no subsequent recycling of fair value gains and losses to profit or loss following the derecognition of the investment if elected to measure the equity investments as FVOCI.
a.s.r. classifies most equity instruments at FVOCI to reduce volatility in the income statement.
Financial assets at FVTPL
All financial assets not classified as measured at amortised cost or FVOCI, as described above, are measured at FVTPL.
Financial assets at FVTPL include:
Derivatives that do not qualify for hedge accounting;
Financial assets that are managed and whose performance is evaluated on a fair value basis, such as:
Debt instruments for which a.s.r. has identified the business model Other;
Investments related to direct participating contracts;
Financial assets held for trading;
Associates for which a.s.r. elects to measure at FVTPL under IFRS 9.
Hedge accounting
To qualify for hedge accounting, the hedge relationship is designated and formally documented at inception, detailing the particular risk management objective and strategy for the hedge (which includes the item and risk that is being hedged), the derivative that is being used and how hedge effectiveness is being assessed. A derivative has to be effective in accomplishing the objective of offsetting either changes in fair value or cash flows for the risk being hedged. The effectiveness of the hedging relationship is evaluated on a prospective and retrospective basis using qualitative and quantitative measures of correlation. A hedging relationship is considered effective if the results of the hedging instrument are within a ratio of 80% to 125% of the results of the hedged item. a.s.r. has elected to continue to apply the hedge accounting requirements of IAS 39 for macro fair value hedges (EU ‘carve out’) on adoption of IFRS 9.
As part of its asset liability management, a.s.r. enters into economic hedges to limit its risk exposure at Aegon hypotheken. These transactions are assessed to determine whether hedge accounting can and should be applied. a.s.r. currently applies hedge accounting for fair value hedges.
Fair value hedges
a.s.r. applies fair value hedge accounting to portfolio hedges of interest rate risk (fair value macro hedging) under the EU ‘carve out’ of EU-IFRS. The EU ‘carve out’ macro hedging enables a group of derivatives (or proportions thereof) to be viewed in combination and jointly designated as the hedging instrument and removes some of the limitations in fair value hedge accounting. Under the EU ‘carve out’, ineffectiveness in fair value hedge accounting only arises when the revised projection of the amount of cash flows in scheduled time buckets falls below the designated amount of that bucket. a.s.r. applies fair value hedge accounting for portfolio hedges of interest rate risk (macro hedging) under the EU ‘carve out’ to mortgage loans. Changes in the fair value of the derivatives are recognised in the income statement, together with the fair value adjustment on the mortgage loans (hedged items) insofar as attributable to interest rate risk (the hedged risk). If the hedge relationship no longer meets the criteria for hedge accounting, the cumulative adjustment of the hedged item is, in the case of interest bearing instruments, amortised through the income statement over the remaining term of the original hedge or recognised directly when the hedged item is derecognised.
Aegon hypotheken holds portfolios of long-term fixed rate mortgages and therefore is exposed to changes in fair value due to movements in market interest rates. Aegon hypotheken manages this risk exposure by entering into pay fixed/receive floating interest rate swaps.
Only the interest rate risk element is hedged and therefore other risks, such as credit risk, are managed but not hedged by Aegon hypotheken. This hedging strategy is applied to the portion of exposure that is not naturally offset against matching positions held by Aegon hypotheken. Changes in fair value of the long-term fixed rate mortgages arising from changes in interest rate are usually the largest component of the overall change in fair value. This strategy is designated as a fair value hedge and its effectiveness is assessed by comparing changes in the fair value of the loans attributable to changes in the benchmark rate of interest with changes in the fair value of the interest rate swaps.
Aegon hypotheken establishes the hedging ratio by matching the notional of the derivatives with the principal of the portfolio being hedged. Possible sources of ineffectiveness are as follows:
Differences between the expected and actual volume of prepayments, as Aegon hypotheken hedges to the expected repayment date taking into account expected prepayments based on past experience;
Difference in the discounting between the hedged item and the hedging instrument, as cash collateralised interest rate swaps are discounted using Overnight Indexed Swaps (OIS) discount curves, which are not applied to the fixed rate mortgages;
Hedging derivatives with a non-zero fair value at the date of initial designation as a hedging instrument; and
Counterparty credit risk which impacts the fair value of uncollateralised interest rate swaps but not the hedged items.
Aegon hypotheken manages the interest rate risk arising from fixed rate mortgages by entering into interest rate swaps on a monthly basis. The exposure from these portfolios frequently changes due to new loans originated, contractual repayments and early prepayments made by customers in each period. As a result, Aegon hypotheken adopts a dynamic hedging strategy (sometime referred to as a ‘macro’ or ‘portfolio’ hedge) to hedge the exposure profile by closing and entering into new swap agreements at each month-end. Aegon hypotheken uses the portfolio fair value hedge of interest rate risk to recognise fair value changes related to changes in interest rate risk in the mortgage portfolio, and therefore reduce the profit or loss volatility that would otherwise arise from changes in fair value of the interest rate swaps alone.
Accrued interest
In line with Solvency II reporting a.s.r. accounts for debt instruments at their 'dirty' fair value, thus including any related accrued interest.
Business model assessment
The business model is determined at a level that reflects how groups of financial assets are managed together to achieve a particular business objective. a.s.r.’s business models refer to how a.s.r. manages its financial assets in order to generate cash flows.
a.s.r. applies the business model Hold to Collect for the mortgage loans and private loans held by Aegon hypotheken and the business model Other for all other debt instruments. Based on these business models the mortgage loans and private loans of Aegon hypotheken that meet the SPPI test are measured at amortised cost. All other debt instruments are measured at FVTPL.
Assessment whether contractual cash flows are solely payments of principal and interest (SPPI)
For the purpose of this assessment, principal is defined as the fair value of the financial asset on initial recognition. However, the principal may change over time – e.g. if there are repayments of principal.
Interest is defined as consideration for the time value of money, for the credit risk associated with the principal amount outstanding during a particular period of time and for other basic lending risks (e.g. liquidity risk) and costs (e.g. administrative costs), as well as a profit margin that is consistent with a basic lending arrangement. Financial assets with embedded derivatives are considered in their entirety when determining whether their cash flows are SPPI.
a.s.r. assesses the SPPI for the loans portfolio held by Aegon hypotheken and for its other financial assets. All other debt instruments are mandatorily designated as at FVTPL (business model Other).
Subsequent measurement and gains and losses
Financial assets at amortised cost
Financial assets at amortised cost are measured at amortised cost using the effective interest method. Interest income, foreign exchange gains and losses and impairment are recognised in profit or loss. Any gain or loss on derecognition is also recognised in profit or loss.
Financial assets at FVOCI
Equity investments at FVOCI are measured at fair value. All fair value gains and losses are recorded in OCI, without recycling to profit or loss. Dividends from such investments continue to be recognised in profit or loss as Investment income when a.s.r.’s right to receive payments is established. Impairment requirements are not applicable to equity investments measured as FVOCI.
Financial assets at FVTPL
Financial assets at FVTPL are measured at fair value. Net gains and losses, including any interest or dividend income and foreign exchange gains and losses, are recognised in profit or loss. Impairment requirements are not applicable to financial assets measured at FVTPL.
See accounting policy W3.
Financial liabilities
Classification
a.s.r. classifies its liabilities into one of the following categories:
financial liabilities at FVTPL (derivatives); or
financial liabilities at amortised cost (all other financial liabilities).
Subsequent measurement and gains and losses
Financial liabilities at FVTPL
Financial liabilities at FVTPL are measured at fair value. Net gains and losses, including any interest expenses and foreign exchange gains and losses, are recognised in profit or loss.
Financial liabilities at amortised cost
Financial liabilities at amortised cost are measured at amortised cost using the effective interest method. Interest expenses, foreign exchange gains and losses are recognised in profit or loss. Any gain or loss on derecognition is also recognised in profit or loss.
Accrued interest
In line with Solvency II reporting a.s.r. accounts for financial liabilities at their 'dirty' fair value, thus including any related accrued interest.
Interest on financial liabilities
Interest expenses are calculated by applying the effective interest rate to the amortised cost of the liability. When calculating the effective interest rate, a.s.r. estimates future cash flows considering all contractual terms of the liability.
Derivatives including embedded derivatives
Derivatives within the insurance entities are primarily used by a.s.r. for hedging interest rate and exchange rate risks, for hedging future transactions and the exposure to market risks.
These derivatives are classified as held-for-trading. Derivatives are measured at fair value with changes in fair value recognised in profit or loss. Derivatives may be embedded in another contractual arrangement (a host contract).
For contracts where the host contract is a financial asset in the scope of IFRS 9, the hybrid financial instrument as a whole is assessed for classification and the embedded derivative is not separated from the host contract.
A derivative embedded in a host insurance or reinsurance contract is not accounted for separately from the host contract if the embedded derivate itself meets the definition of an insurance or reinsurance contract.
For other contracts, a.s.r. accounts for an embedded derivative separately from the host contract when:
the hybrid contract is not measured at FVTPL;
the terms of the embedded derivative would have met the definition of a derivative if they were contained in a separate contract; and
the economic characteristics and risks of the embedded derivative are not closely related to those of the host contract.
Impairments in the P&L
a.s.r. recognises loss allowances for ECL on debt instruments measured at amortised cost. a.s.r. uses the low credit risk simplification for investment grade debt instruments and recognises a lifetime ECL for other financial assets using the simplified approach. Lifetime ECL are the ECL that result from all possible default events over the expected life of a financial instrument.
ECLs are a probability-weighted estimate of credit losses. Credit losses are measured as the present value of all cash shortfalls (i.e. the difference between the cash flows due to a.s.r. in accordance with the contract and the cash flows that a.s.r. expects to receive). The maximum period considered when estimating ECLs is the maximum contractual period over which a.s.r. is exposed to credit risk.
Write-off
The gross carrying amount of a financial asset is written off (either partially or in full) to the extent that there is no realistic prospect of recovery. This is generally the case when a.s.r. determines that the borrower does not have assets or resources of income that could generate sufficient cash flows to repay the amounts subject to the write-off. However, financial assets that are written off could still be subject to enforcement activities in order to comply with a.s.r.’s procedures for recovery of amounts due. Should amounts be recovered these are then recognised when the payment has been received.
Derecognition and contract modification
Financial assets
a.s.r. derecognises a financial asset when the contractual rights to the cash flows from the financial asset expire, or it transfers the rights to receive the contractual cash flows in a transaction in which substantially all of the risks and rewards of ownership of the financial asset are transferred or in which a.s.r. neither transfers nor retains substantially all of the risks and rewards of ownership and it does not retain control of the financial asset.
On derecognition of a financial asset, the difference between the carrying amount at the date of derecognition and the consideration received (including any new asset obtained less any new liability assumed) is recognised in the income statement, unless the financial asset is an equity instrument and is measured at fair value through other comprehensive income. For these instruments any revaluation amount is transferred within equity from unrealised gains and losses to retained earnings.
a.s.r. enters into transactions whereby it transfers assets recognised in its balance sheet, but retains either all or substantially all of the risks and rewards of the transferred assets. In these cases, the transferred assets are not derecognised. Examples of such transactions are repurchase agreements and securities lending. The asset recognised for cash paid on reverse repurchase agreements is presented under investments. The liability recognised for cash collateral received on repurchase agreements is presented under the line item due to banks.
In transactions in which a.s.r. neither retains nor transfers substantially all of the risks and rewards of ownership of a financial asset and it retains control over the asset, a.s.r. continues to recognise the asset to the extent of its continuing involvement, determined by the extent to which it is exposed to changes in the value of the transferred asset.
If the terms of a financial asset are modified, then a.s.r. evaluates whether the cash flows of the modified asset are substantially different. If the cash flows are substantially different, then the contractual rights to cash flows from the original financial asset are deemed to have expired. In this case, the original financial asset is derecognised and a new financial asset is recognised at fair value.
If a financial asset measured at amortised cost is modified but not substantially, then the financial asset is not derecognised. If the asset has not been derecognised, then a.s.r. recalculates the gross carrying amount of the financial asset by discounting the modified contractual cash flows at the original effective interest rate and recognises the resulting adjustment to the gross carrying amount as a modification gain or loss in profit or loss. If such a modification is carried out because of financial difficulties of the borrower, then the gain or loss is presented together with impairment losses; in other cases, it is presented as interest revenue.
Financial liabilities
a.s.r. generally derecognises a financial liability when its contractual obligations expire or are discharged or cancelled. a.s.r. also derecognises a financial liability when its terms are modified and the cash flows of the modified liability are substantially different (i.e. the net present value of the of the cash flows under the new terms discounted at the original effective interest rate is at least 10% different from the discounted present value of the remaining cash flows of the original debt instrument), in which case a new financial liability based on the modified terms is recognised at fair value.
On derecognition of a financial liability, the difference between the carrying amount extinguished and the consideration paid (including any non-cash assets transferred or liabilities assumed) is recognised in profit or loss.
If a financial liability measured at amortised cost is not substantially modified, then it is not derecognised. For such financial liabilities, a.s.r. recalculates the amortised cost of the financial liability by discounting the modified contractual cash flows at the original effective interest rate and recognises any resulting adjustment to the amortised cost as a modification gain or loss in ‘other finance expenses’ in profit or loss. Any costs and fees incurred adjust the carrying amount of the liability and are amortised over the remaining term of the modified liability.
F1. Insurance contracts
Classification
Insurance contracts issued by a.s.r. are contracts that transfer significant insurance risks, and in some cases also financial risk, from the policyholder to a.s.r. Contracts measured using the General Measurement Model ( GMM) or Premium Allocation Approach (PAA) are classified on the balance sheet as insurance contract liabilities and contracts measured using the Variable Fee Approach (VFA) are classified as liabilities arising from direct participating insurance contracts.
a.s.r. offers non-life insurance contracts and life insurance contracts as shown in the table below.
Measurement model applied
| Segment | Product | Measurement model applied |
|---|---|---|
| Non-life | P&C | PAA |
| Disability | GMM | |
| Health | PAA | |
| Life | Individual life | GMM or VFA |
| Pension | GMM or VFA | |
| Funeral | GMM |
Insurance contract liabilities
Non-life insurance contracts
Non-life insurance contracts are contracts that provide cover that is not related to the life or death of insured persons. These insurance contracts are primarily classified into the following categories: Disability, Health, P&C (motor, fire and liability).
Life insurance contracts
The segment Life includes: annuities, term insurance policies, savings contracts and funeral insurance contracts. In addition to non-participating life insurance contracts, the insurance portfolio also includes:
Individual and group participating contracts;
Individual contracts with discretionary participation features;
Group contracts with segregated pools with returns based on investment guarantees.
Life insurance contracts with (discretionary) participation features are included within the Life segment. Under these contracts, policyholders are assigned, in addition to their entitlement to a guaranteed element, an entitlement to potentially significant additional benefits whose amount or timing is contractually at the discretion of a.s.r. These additional benefits are based on the performance of a specified pool of investments held by a.s.r. or on the issuer's operational result.
Liabilities arising from direct participating insurance contracts.
a.s.r. classifies an insurance contract as a direct participating contract for which at inception the following criteria are met:
the contractual terms specify that the policyholder participates in a share of a clearly identified pool of underlying items;
a.s.r. expects to pay the policyholder an amount equal to a substantial share of the fair value returns on the underlying items; and
a.s.r. expects a substantial proportion of any change in the amounts to be paid to the policy holder to vary with the change in the fair value of the underlying items.
Life insurance contracts with direct participating features are included within the Life segment and mainly concern unit-linked contracts and group pension contracts, with policyholders bearing the investment risk. An investment unit is a share in an investment fund that a.s.r. acquires on behalf of the policyholders using net premiums paid by the policyholders. The cash flow upon maturity of the contract is equal to the value of the investment units of the fund in question.
Contracts that meet the requirements of a direct participating contract are measured using the variable fee approach (VFA).
Separating components
Currently a.s.r. does not separate any components from its insurance contracts.
Non-distinct investment components
Non-distinct investment components are identified for products where under all circumstances a payment will be made to the policyholder. These are generally recognised for GMM as the surrender value of the funeral insurance and as the savings account related to the mortgage savings insurance. For VFA policies the non-distinct investment component is the minimum payment that will be made under all circumstances (i.e. the minimum of surrender, lapse and maturity).
Level of aggregation
Insurance contracts are aggregated into groups for measurement purposes. a.s.r. identifies portfolios of insurance contracts comprising contracts subject to similar risks and managed together. Each portfolio is then divided into cohorts of contracts issued within a maximum of one year and divided into two groups based on the profitability buckets for:
any contracts that are onerous on initial recognition; and
any remaining contracts in the portfolio.
The profitability bucket for contracts that have no significant possibility of becoming onerous subsequently is currently not used by a.s.r.
Similar risks managed together are generally based on the homogeneous risk groups similar to those used in Solvency II at inception, more or less granularity is applied where applicable. Contracts within a portfolio that would fall into different groups only because law or regulation specifically constraints a.s.r.’s practical ability to set a different price or level of benefits for policyholders with different characteristics are included in the same group. This applies to contracts issued in Europe that are required by EU regulation to be priced on a gender-neutral basis.
The resulting groups represent the level at which the recognition and measurement accounting policies are applied. The groups are established on initial recognition and their composition is not subsequently reassessed.
Whether a contract is onerous or not is a policy (test) which is set per business. Part of this policy will be pricing and thresholds and forward-looking metrics available within a.s.r. The test is performed based on the contracts which are issued in any specific calendar year and are grouped according to the similar risks managed together criteria as described above. The test is generally performed on a set of contracts using reasonable and supportable information, considering that the outcome would be the same had the individual policy assessment been performed.
Recognition
a.s.r. recognises a group of insurance contracts issued from the earliest of:
the beginning of the coverage period of the group of contracts. The coverage period is the period during which a.s.r. provides services (insurance services, investment-return services or investment-related services) in respect of all premiums within the boundary of the insurance contract;
the date when the first payment from a policyholder in the group becomes due. If there is no contractual due date, then it is considered to be the date when the first payment is received from the policyholder; or
the group of onerous contracts, the date when the group becomes onerous.
Insurance contracts acquired in a (portfolio) transfer or a business combination are recognised on the date of acquisition.
When the contract is recognised, it is added to an existing group of contracts or, if the contract does not qualify for inclusion in an existing group, it forms a new group to which future contracts can be added. Groups of contracts are established on initial recognition and their composition is not revised once all contracts have been added to the group.
Contract boundaries
The measurement of a group of contracts includes all of the future cash flows within the boundary of each contract in the group. Cash flows are within the boundary of a contract if they arise from substantive rights and obligations that exist during the reporting period under which a.s.r. can compel the policyholder to pay premiums or has a substantive obligation to provide services.
A substantive obligation to provide services ends when:
a.s.r. has the practical ability to reassess the risks of the particular policyholder and can set a price or level of benefits that fully reflects those reassessed risks; or
a.s.r. has the practical ability to reassess the risks of the portfolio that contains the contract and can set a price or level of benefits that fully reflects the risks of that portfolio; and the pricing of the premiums for coverage up to the reassessment date does not consider risks that relate to periods after the reassessment date.
For individual contracts with discretionary features the contract boundary is defined so that cash flows are within the contract boundary if they result from a substantive obligation of a.s.r. to deliver cash at a present or future date.
The contract boundary is reassessed at each reporting period and more frequently if and when product characteristics and/or conditions fundamentally change and, therefore, may change over time.
Measurement
a.s.r. uses the following measurement models:
the general measurement model (GMM);
the variable fee approach (VFA) for contracts with a direct participating feature; and
the premium allocation approach (PAA) which is a simplified version of the GMM and is used mainly for short-duration contracts.
Measurement – contracts measured under the GMM
Initial measurement
On initial recognition, a.s.r. measures a group of insurance contracts as the total of:
the fulfilment cash flows, which comprise estimates of future cash flows, adjusted to reflect the time value of money and the associated financial risk and the risk adjustment for non-financial risk (RA); and
the CSM.
The measurement of the fulfilment cash flows of a group of insurance contracts does not reflect non-performance risk of a.s.r. It is the net present value of the projected cash flows of benefits and expenses, less the net present value of premiums, adjusted for the risk adjustment. These cash flows are estimated using realistic, 'best estimate', assumptions in relation to mortality, longevity, disability, lapse rate, expense and inflation. The best estimate assumptions include mortality and longevity trend assumptions for life expectancy. Mortality rate tables applied are generally developed based on a blend of company experience and industry wide studies, taking into consideration product characteristics, own risk selection criteria, the insured population, recent mortality trend assumptions for life expectancy in the Netherlands and past experience. Mortality experience is monitored through regular studies, the results of which are fed into the pricing cycle for new products and reflected in the liability calculation when appropriate. The best estimate includes the intrinsic value and the time value of options and guarantees (TVOG: Time Value of Financial Options and Guarantees) and is calculated using stochastic techniques.
Where applicable, the direct or discretionary participating features of the insurance contracts, such as profit sharing, and any guaranteed benefits at maturity are considered in the future cash flows. The cash flows are discounted using an interest curve whose construction is related to the Solvency II curve construction published by EIOPA. The construction differs in that a different CRA is determined and used, there is no VA but there is a Liability Illiquidity Premium (LIP), a different UFR is used (2025: 3.20%, 2024: 3.25%; whereas Solvency II used 2025: 3.30%, 2024: 3.30%) and the convergence to the UFR follows a different methodology.
Insurance pre-recognition cash flows consist of pre-acquisition cash flows and pre-paid premium cash flows for insurance contracts not yet recognised. Insurance pre-acquisition cash flows that a.s.r. pays before the related group of contracts is recognised (i.e. for renewals of insurance contracts or insurance contracts recognised in the following period), are presented as an asset under the insurance contract liabilities. When the group of contracts is recognised, these cash flows are included by way of expected acquisition cash flows in the measurement of the group and the previously recognised asset is transferred and included as part of expected acquisition cash flows initially recognised in the insurance liability. The insurance pre-acquisition cash flow asset is reassessed for a possible impairment trigger at each reporting date.
The risk adjustment for a group of insurance contracts is the compensation required for bearing uncertainty about the amount and timing of the cash flows that arises from non-financial risk.
a.s.r. disaggregates changes in the risk adjustment for non-financial risk between the insurance service result and insurance finance income or expenses. See section 7.5.13.4.
The CSM of a group of insurance contracts represents the unearned profit that a.s.r. will recognise as it provides service under those contracts. On initial recognition of a group of insurance contracts, if the total fulfilment cash flows allocated to the contract, any previously recognised insurance acquisition cash flows, pre-paid premium cash flows and any cash flows arising from the contract at the date of initial recognition is a net inflow, then the group is not onerous. In this case, the CSM is measured as the equal and opposite amount of the net inflow, which results in no income or expenses arising on initial recognition.
For groups of contracts acquired, the consideration received for the contracts is included in the fulfilment cash flows as a proxy for the premiums received at the date of acquisition. For business combinations see accounting policy H.
If the total of the fulfilment cash flows is a net outflow, then the group is onerous. In this case, the net outflow is recognised as a loss in the income statement, or as an adjustment to goodwill or a gain on a bargain purchase if the contracts are acquired in a business combination. A loss component is created as part of the insurance liabilities to depict any losses recognised in the income statement, which determines the amounts that are subsequently presented in the income statement as reversals of losses on onerous groups.
Subsequent measurement
The carrying amount of a group of insurance contract liabilities at each reporting date is the sum of the liability for remaining coverage and the liability for incurred claims. The liability for remaining coverage comprises:
the fulfilment cash flows that relate to services that will be provided under the contracts in future periods including the risk adjustment; and
any remaining CSM at that date.
The liability for incurred claims comprises the fulfilment cash flows for incurred claims and attributable expenses that have not yet been paid, including claims that have been incurred but not yet reported, and the handling of the payments to policyholders. For the contracts in the Non-life segment this previously concerned all future payments related to the incurred claim (the LIC option). However, following a change in accounting policy, the liability for incurred claims (LIC) option no longer applies to the Individual Disability portfolio, see section 7.3.2.1. For this portfolio, the liability for remaining coverage (LRC) option now applies. Under the LRC approach, the liability reflects amounts payable for future insurance services, including those related to claims incurred but still subject to insurance risk. This is consistent with the treatment in the Life segment, where the LRC option is used to account for amounts payable for the period. The accounting policy LIC option of the Group Disability and Sickness leave portfolios remain unchanged.
The fulfilment cash flows of groups of insurance contracts are measured at the reporting date using current estimates of future cash flows, current discount rates and current estimates of the risk adjustment for non-financial risk. Changes in fulfilment cash flows are recognised as follows:
Changes relating to future services are adjusted against the CSM (or recognised in the insurance service result in profit or loss if the group is onerous);
Changes relating to current or past services are recognised in the insurance service result in the income statement;
Effects of the time value of money, financial risk and changes therein on estimated future cash flows and risk adjustment for non-financial risk are recognised as insurance finance income or expenses.
The CSM of each group of contracts is subsequently calculated at each reporting date.
The carrying amount of the CSM at the end of each reporting period is the carrying amount at the start of the reporting period, adjusted for:
The CSM of any new contracts that are added to the group in the period;
Interest accreted on the carrying amount of the CSM during the period, measured at the discount rates on nominal cash flows that do not vary based on the returns on any underlying items determined on initial recognition;
Changes in fulfilment cash flows that relate to future services, except to the extent that:
Any increases in the fulfilment cash flows exceed the carrying amount of the CSM, in which case the excess is recognised as a loss in the income statement and creates a loss component; or
Any decreases in the fulfilment cash flows are allocated to the loss component, reversing losses previously recognised in profit or loss; and
The amount recognised as insurance contract revenue due to the services provided in the period.
Changes in fulfilment cash flows that relate to future services comprise:
Experience adjustments arising from premiums received in the period that relate to future services and related cash flows, measured at the discount rates determined on initial recognition and non-distinct investment components;
Changes in estimates of the present value of future cash flows in the liability for remaining coverage, measured at the discount rates determined on initial recognition, except for those that relate to the effects of the time value of money, financial risk and changes therein; and
Changes in the risk adjustment for non-financial risk that relate to future services.
CSM is recognised as insurance contract revenue following the services provided. The amount is determined by identifying coverage units in the group. The number of coverage units in the group is the quantity of insurance contract services provided by the contracts, determined by considering for each contract the quantity of benefits provided and its expected coverage period.
Changes in discretionary cash flows are regarded as relating to future services and accordingly adjust the CSM. a.s.r. allocates the CSM to each period based on the passage of time as the service (insurance services and investment-return services) is deemed to be delivered equally over the coverage period.
To determine whether changes in cash flows are deemed to be changes in discretionary cash flows, a.s.r. exercises judgement in specifying at inception what is regarded as their commitment under the contract. How a.s.r. specifies its commitment under the contract will determine how much of the changes in expected future cash flows will be reflected immediately in profit or loss or will adjust CSM.
Measurement – contracts measured under the VFA
The VFA measurement model is used for direct participating contracts. This measurement model is identical to the GMM at initial recognition, however, subsequent measurement differs from the GMM.
Direct participating insurance contracts are contracts under which a.s.r.’s obligation to the policyholder is the net of:
The obligation to pay the policyholder an amount equal to the fair value of the underlying items; and
A variable fee in exchange for future services provided by the contracts, being a.s.r.’s share of the fair value of the underlying items less fulfilment cash flows that do not vary based on the returns on underlying items. a.s.r. provides investment-related services under these contracts by promising an investment return based on underlying items, in addition to insurance coverage.
When measuring a group of direct participating contracts, a.s.r. adjusts the fulfilment cash flows for the whole of the changes in the obligation to pay policyholders an amount equal to the fair value of the underlying items. These changes do not relate to future services and are recognised in the income statement. a.s.r. then adjusts any CSM for changes in a.s.r.’s share of the fair value of the underlying items, which relates to future services, as explained below.
Subsequent measurement
The carrying amount of the CSM at the end of each reporting period is the carrying amount at the start of the reporting period, adjusted for:
The CSM of any new contracts that are added to the group in the period;
a.s.r.’s share of the change in the fair value of the underlying items and changes in fulfilment cash flows that relate to future services, except to the extent that:
a.s.r. has chosen to exclude from the CSM changes in the effect of financial risk on its share of the underlying items;
a.s.r.’s share of a decrease in the fair value of the underlying items, or an increase in the fulfilment cash flows that relate to future services, exceeds the carrying amount of the CSM, giving rise to a loss in the income statement (included in insurance service expenses) and creating a loss component; or
a.s.r.’s share of an increase in the fair value of the underlying items, or a decrease in the fulfilment cash flows that relate to future services, is allocated to the loss component, reversing losses previously recognised in the income statement (included in insurance service expenses); and
The amount recognised as insurance contract revenue because of the services provided in the period.
Changes in fulfilment cash flows that relate to future services include the changes relating to future services specified above for contracts with direct participation features (measured at current discount rates) , the effect of the time value of money and financial risks and the risk mitigation option where applicable.
CSM is recognised as insurance contract revenue following the services provided. The amount is determined by identifying coverage units in the group. The number of coverage units in the group is the quantity of insurance contract services provided by the contracts, determined by considering for each contract the quantity of benefits provided and its expected coverage period.
a.s.r. allocates the CSM to each period based on the passage of time as the investment-related services provided in relation to the investment component and the insurance services provided in relation to the insurance component are deemed to be delivered equally over the coverage period.
Risk mitigation
a.s.r. has chosen to apply the risk mitigation option to certain VFA contracts, thereby not recognising a change in the CSM to reflect some or all of the changes in the effect of the time value of money and financial risk (that would normally adjust the CSM) on:
The amount of a.s.r.’s share of the underlying items if a.s.r. mitigates the effect of financial risk on that amount using derivatives or reinsurance contracts held; and
The fulfilment cash flows if a.s.r. mitigates the effect of financial risk on those fulfilment cash flows using derivatives, non-derivative financial instruments measured at FVTPL, or reinsurance contracts held.
If a.s.r. mitigates the effect of financial risk using derivatives or non-derivative financial instruments measured at FVTPL, it shall include insurance finance income or expenses for the period arising from the application of the risk mitigation in profit or loss.
If a.s.r. mitigates the effect of financial risk using reinsurance contracts held, it shall apply the same accounting policy for the presentation of insurance finance income or expenses arising from the application of the risk mitigation as a.s.r. applies to other reinsurance contracts held. a.s.r. does not currently use reinsurance as a hedge instrument dedicated to financial risks.
Measurement – contracts measured under the PAA
The PAA simplifies the measurement of groups of contracts when:
the coverage period of each contract in the group of contracts is one year or less; or
a.s.r. expects that the resulting measurement would not differ materially from the result of applying the GMM.
Initial measurement
On initial recognition of each group of contracts, the carrying amount of the liability for remaining coverage is measured at the premiums received on initial recognition. Insurance acquisition cash flows are recognised as expenses when they are incurred making use of the option under IFRS 17. The risk adjustment is an implicit part of the valuation of the related liability.
Subsequent measurement.
Subsequently, the carrying amount of the liability for remaining coverage is increased by any premiums received and decreased by the amount recognised as insurance contract revenue for coverage provided. This is recognised over the coverage period based on the passage of time.
If at any time during the coverage period, facts and circumstances indicate that a group of contracts is onerous, then a.s.r. recognises a loss in the income statement and increases the liability for remaining coverage to the extent that the current estimates of the fulfilment cash flows that relate to remaining coverage (including the risk adjustment for non-financial risk) exceed the carrying amount of the liability for remaining coverage.
a.s.r. recognises the liability for incurred claims of a group of insurance contracts at the amount of the fulfilment cash flows relating to incurred claims, including a risk adjustment for non-financial risk. The fulfilment cash flows are discounted at current rates.
Derecognition and contract modification
a.s.r. derecognises a contract when it is extinguished – i.e. when the specified obligations in the contract expire or are discharged or cancelled.
a.s.r. also derecognises a contract if its terms are modified in a way that would have changed the accounting for the contract significantly had the new terms always existed, in which case a new contract based on the modified terms is recognised. If a contract modification does not result in derecognition, then a.s.r. treats the changes in cash flows caused by the modifications as changes in estimates of fulfilment cash flows.
On the derecognition of a contract from within a group of contracts:
The fulfilment cash flows allocated to the group are adjusted to eliminate the present value of the future cash flows and risk adjustment for non-financial risk relating to the rights and obligations that have been derecognised from the group; and
The CSM of the group is adjusted for the change in fulfilment cash flows.
If a contract is derecognised because its terms are substantially modified, then the CSM is also adjusted for the premium that would have been charged had a.s.r. entered into a contract with the new contract's terms at the date of modification, less any additional premium charged for the modification. The new contract recognised is measured assuming that, at the date of modification, the issuer received the premium that it would have charged less any additional premium charged for the modification.
F2. Reinsurance contracts
Classification
Contracts held by a.s.r. under which it transfers significant insurance risk related to insurance contracts are classified as reinsurance contracts. a.s.r. does not issue reinsurance contracts.
Separating components and Level of aggregation
The accounting principles for the separation of components do not differ from those for insurance contracts. For the determination of the level of aggregation for reinsurance contracts the accounting principles are the same with the exception that a reinsurance contract cannot be classified as onerous.
Recognition
a.s.r. recognises a group of reinsurance contracts held that do not provide proportionate coverage at the earlier of (i) the beginning of the coverage period of the group of reinsurance contracts held; and (ii) the date a.s.r. recognises an onerous group of underlying contracts if a.s.r. entered into the related reinsurance contract held at or before that date.
Contract boundaries
The measurement of a group of reinsurance contracts held includes all of the future cash flows within the boundary of each contract in the group. Cash flows are within the boundary of a contract if they arise from substantive rights and obligations that exist during the reporting period under which a.s.r. has a right to receive services from the reinsurer and is compelled to pay premiums.
Measurement – contracts under the PAA
a.s.r. uses the PAA as the default measurement approach for reinsurance contracts with a coverage period of one year or less, but the business line has the option to choose the GMM.
To measure a group of reinsurance contracts a.s.r. applies the same accounting policies for the related insurance contracts, adapted where necessary to reflect the features of reinsurance contracts held that differ from those of the insurance contracts.
Measurement – contracts under the GMM
a.s.r. applies the same accounting policies for insurance contracts to measure a group of reinsurance contracts, with the following modifications.
The carrying amount of a group of reinsurance contracts at each reporting date is the sum of the remaining coverage component and the incurred claims component. The remaining coverage component comprises:
The fulfilment cash flows that relate to services that will be received under the contracts in future periods including the risk adjustment; and
Any remaining CSM at that date.
a.s.r. measures the estimates of the present value of future cash flows using assumptions that are consistent with those used to measure the estimates of the present value of future cash flows for the underlying insurance contracts.
Loss-recovery component
a.s.r. determines a loss-recovery component of the asset for remaining coverage of a group of reinsurance contracts held when a.s.r. recognises a recovery of a loss on initial recognition of an onerous group of underlying contracts as well as for subsequent measurement of the recovery of losses. This loss-recovery component is accounted for in a manner consistent with the loss component of the group of underlying insurance contracts issued. As such, as cedant, a.s.r. determines the resulting amount of the loss-recovery at initial recognition to be recognised in profit or loss by multiplying:
The loss recognised on the group of underlying insurance contracts; and
The percentage of claims on underlying contracts a.s.r. expects to recover from the group of reinsurance contracts held.
After a.s.r. has established a loss-recovery component, it shall adjust it to reflect changes in the loss component of the underlying contracts. Therefore, the balance of loss-recovery component needs to be tracked along the fulfilment of the reinsurance group and run off to zero at the end of the reinsurance coverage period or earlier when the loss component on the underlying group(s) has been fully reversed. The carrying amount of the loss recovery component shall not exceed the portion of the carrying amount of the loss component of the underlying insurance contracts that a.s.r. expects to recover from the group of reinsurance contracts held.
The risk adjustment for non-financial risk is the amount of the risk transferred by a.s.r. to the reinsurer.
On initial recognition, the CSM of a group of reinsurance contracts represents a net cost or net gain on purchasing reinsurance. It is measured as the equal and opposite amount of the total of the fulfilment cash flows, any derecognised assets for cash flows occurring before the recognition of the group and any cash flows arising at that date, and taking into account any recognised loss recovery component, if applicable. However, if any net cost on purchasing reinsurance coverage relates to insured events that occurred before the purchase of the group, then a.s.r. recognises the cost immediately in the income statement as an expense.
The carrying amount of the CSM at the end of each reporting period is the carrying amount at the start of the reporting period, adjusted for:
The CSM of any new contracts that are added to the group in the period;
Interest accreted on the carrying amount of the CSM during the period, measured at the discount rates on nominal cash flows that do not vary based on the returns on any underlying items determined on initial recognition;
Changes in fulfilment cash flows that relate to future services, unless the change results from a change in fulfilment cash flows allocated to a group of onerous underlying insurance contracts, in which case the change is recognised in the income statement;
The amount recognised in the income statement because of the services received in the period.
CSM is recognised in profit or loss following the services provided.
Non-performance risk
Changes in the fulfilment cash flows related to the risk of non-performance do not adjust the CSM, therefore a.s.r. recognises them in profit or loss. This requires that the fulfilment cash flows must be adjusted to include the effect of any non-performance risk, or credit risk, by the reinsurer.
Reinsurance contracts cannot be onerous.
G. Employee benefit plans
Pension obligations
Defined contribution plans
a.s.r. has defined contribution (DC) plans for all its employees, including employees that are employed by entities that operate in the Distribution and Service segment. a.s.r. pays contributions to privately administered pension insurance plans with ASR Levensverzekering N.V. (a.s.r. life) on a contractual basis. The old DC plan of Aegon employees became non-contributory, when they entered the a.s.r. DC plan.
a.s.r. life recognises these contracts as insurance contracts. They are accounted for in accordance with liabilities arising from insurance contracts (accounting policy F1).
a.s.r. has no further payment obligations to the employees once the contributions have been paid. The contributions are recognised as operating expenses in the income statement during the period the services are rendered. Prepaid contributions are recognised as an asset to the extent that a cash refund or a reduction in future payments is available.
Defined benefit plans
Defined benefit (DB) plans for own employees are non-contributory. The defined benefit obligation continues to exist. The plans are schemes under which employees are awarded pension benefits upon retirement, usually dependent on one or more factors, such as years of service and compensation.
The liability in respect of DB plans is the present value of the defined benefit obligation at the balance sheet date, less the fair value of the plan assets where the pension plans are insured by third parties.
a.s.r. life and Aegon life administer most of the post-employment benefit plans and hold the investments that are intended to cover the employee benefit obligation. These investments do not qualify as plan assets in the consolidated financial statements under IFRS.
The DB obligation is based on the terms and conditions of the plan applicable on the balance sheet date. In measuring the DB obligation a.s.r. uses the projected unit credit method and actuarial assumptions that represent the best estimate of future variables. The benefits are discounted using an interest rate based on the internal curve for high quality corporate bonds, that are denominated in the currency in which the benefits will be paid and that have terms to maturity that approximate the terms of the related pension liability. Actuarial assumptions used in the measurement of the liability include the discount rate, estimated future wage inflation, mortality rates, consumer price inflation and for the Aegon DB also salary increases and bonuses. The assumptions are updated and reviewed at each reporting date, based on available market data.
Actuarial assumptions may differ from actual results due to changes in market conditions, economic trends, mortality trends and other assumptions. Any change in these assumptions can have a significant impact on the defined benefit obligation and future pension costs. Changes in the expected actuarial assumptions and differences with the actual actuarial outcomes are recognised in the actuarial gains and losses included in other comprehensive income (component of total equity).
When employee benefit plans are modified and when no further obligations exist, a gain or loss, resulting from the changes are recognised directly in the income statement. Consistent with the calculation of a gain or loss on a plan amendment, a.s.r. will use updated actuarial assumptions to determine the current service cost and net interest for the remainder of the annual reporting period upon the time of such amendment. The effect of the asset ceiling, if applicable, is disregarded when calculating the gain or loss on any settlement of the plan.
The financing cost related to employee benefits is recognised in interest expense. The current service costs are included in operating expenses.
Other long-term employee benefits
Plans that offer benefits for long-service (leave), but do not qualify as a post-employment benefit plan, such as jubilee benefits, are measured at present value using the projected unit credit method and changes are recognised directly in the income statement.
Other post-retirements obligations
a.s.r. offers post-employment benefit plans, such as arrangement for mortgage loans at a discount (fixed amount, reference date December 2017). The entitlement to these benefits is usually conditional on the employee remaining in service up to retirement age and the completion of a minimum service period. The expected costs of these benefits are accrued over the period of employment using an accounting methodology that is similar to that for DB plans.
Vacation entitlements
A liability is formed for the vacation days which have not been taken at year-end.
H. Acquisitions (Business combinations)
Business acquisitions are accounted for according to the acquisition method, with the cost of the acquisitions being allocated to the fair value of the acquired identifiable assets, liabilities and contingent liabilities.
The goodwill is determined as the difference between the cost of the acquisition and a.s.r.’s interest in the fair value of the acquired identifiable assets, liabilities and contingent liabilities at the acquisition date. Additionally for insurance contracts acquired that are onerous at the transaction date, the difference between the fair value and the fulfilment cash flows is also part of the goodwill.
Any change, in the fair value of acquired assets and liabilities at the acquisition date, determined within one year after acquisition, is recognised as an adjustment charged to goodwill in case of a preliminary valuation. Adjustments that occur after a period of one year are recognised in the income statement. Adjustments to the purchase price that are contingent on future events, and to the extent that these are not already included in the purchase price, are included in the purchase price of the acquisition at the time the adjustment is likely and can be measured reliably.
I. Discontinued operations
Classification as held for sale occurs when the carrying amount will be recovered principally through a sale transaction rather than through continuing use.
Classification as a discontinued operation occurs at the earlier of disposal or when the operation meets the criteria to be classified as held for sale. When a group of assets classified as held for sale represents a major line of business or geographical area the disposal group classifies as discontinued operations.
The comparative consolidated income statement and consolidated statement of comprehensive income are restated to show the discontinued operations separately from the continuing operations. Where applicable in the notes to the financial statements the reclassification to assets held for sale and liabilities relating to assets held for sale are recognised in the changes in the composition of the Group. Should the impairment exceed the carrying value of the non-current assets within the scope of IFRS 5 measurement, any remaining impairment amount will be presented as a separate provision.
7.3.5 Other accounting policies
J. Basis for consolidation - subsidiaries
The consolidated financial statements include the financial statements of a.s.r. and its subsidiaries. Subsidiaries are those entities (which may include deemed separate entities, the so-called silos and investments on behalf of policyholders) over which a.s.r. has control. Control exists when a.s.r. is exposed, or has rights, to variable returns from its involvement with the subsidiary and has the ability to affect those returns through its power over the subsidiary. This is the case if more than half of the voting rights may be exercised or if a.s.r. has control in any other manner. Subsidiaries are fully consolidated from the date on which control is acquired by a.s.r. and are deconsolidated when control ceases to exist.
A subsidiary's assets, liabilities and contingent liabilities are measured at fair value on the acquisition date and are subsequently accounted for in accordance with a.s.r.’s accounting policies.
Non-controlling interests are initially stated at their proportionate share in the fair value of the net assets on the acquisition date and are subsequently adjusted for the non-controlling interest in changes in the subsidiary’s equity.
The fund assets and liabilities of a.s.r. Premiepensioeninstelling B.V. (a.s.r. IORP), which is a.s.r.'s Institution for Occupational Retirement Provision (IORP), are a silo outside of the control of a.s.r., therefore these assets and liabilities are not consolidated by a.s.r. Only the remaining assets and liabilities within a.s.r. IORP (outside of the silo) are consolidated into a.s.r.’s financial statements.
Intragroup transactions
Intragroup balances and transactions between consolidated group companies are eliminated. Gains and losses on transactions between a.s.r. and associates and joint ventures are eliminated to the extent of a.s.r.’s interest in these entities.
Structured entities
Structured entities that are consolidated include certain mortgage-backed securitisation deals, where a.s.r. was involved in the design of the structured entities and also has the ability to use its power to affect the amount of the investee's returns. Other factors that contribute to the conclusion that consolidation of these entities is required includes consideration of whether a.s.r. fully services the investees and can therefore influence the defaults of the mortgage portfolios and the fact that in these cases the majority of risks are maintained by a.s.r. Structured entities that are not consolidated include general account investments in non-affiliated structured entities that are used for investment purposes.
K. Product classification
Insurance contracts are defined as contracts under which a.s.r. accepts significant insurance risk from policyholders by agreeing to compensate policyholders if a specified uncertain future event adversely affects the policyholder. These contracts are considered insurance contracts throughout the remaining term to maturity, irrespective of when the insured event occurs. In addition, these contracts can also transfer financial risk.
a.s.r. offers non-life insurance contracts and life insurance contracts.
Non-life insurance contracts
Non-life insurance contracts are contracts that provide cover that is not related to the life or death of insured persons. These insurance contracts are classified into the following categories: Disability, Health, P&C (motor, fire and liability) and Other.
Life insurance contracts
Life insurance contracts (in cash) include savings-linked mortgages, annuities, term insurance policies, savings contracts and funeral insurance contracts. In addition to non-participating life insurance contracts, the insurance portfolio also includes:
Individual and group participating contracts;
Individual contracts with discretionary participation features;
Group contracts with segregated pools with returns based on investment guarantees.
Direct participating insurance contracts
Claims from these life insurance contracts are directly linked to the underlying investments. The investment risk and return are borne fully for policyholders. Life insurance contracts for the account and risk of policyholders generally consist of contracts where premiums, after deduction of costs and risk premium, are invested in unit-linked funds. For some individual contracts, a.s.r. guarantees returns on unit-linked investment funds. In addition, group contracts with segregated pools are classified as direct participating insurance contracts.
L. Segment information
a.s.r. divides its operations into five reportable segments, reflecting differences in risk and return profiles and aligning with the internal reporting structure reviewed by the Executive Board (the chief operating decision maker).
Insurance activities comprise:
Non-life: Non-life insurance in the Netherlands, including disability, property & casualty, and health insurance.
Life: Life insurance in the Netherlands, including defined benefit and defined contribution pensions, Individual life & Funeral insurance, as well as IORP investment contracts (policyholder risk) and private investing services.
Non-insurance activities are presented as three segments:
Asset Management: Asset management activities, including investment property management and mortgage origination .
Distribution and Services: Distribution of insurance contracts and related business services.
Holding and Other: Holding activities (including group-related functions), other holding and intermediate holding companies, real estate development, minority participations, and entities classified as discontinued operations.
Segment information is prepared in accordance with the accounting principles used for the preparation of a.s.r.’s consolidated financial statements. Goodwill and other intangibles are presented in the related cash generating unit's segment. Intersegment transactions are conducted at arm’s length conditions. In general, costs related to centralised services are allocated to the segments based on the utilisation of these services.
The Executive Board sets and monitors segment targets and budgets. Each segment aligns its strategies and policies with a.s.r.’s group strategy.
Segment performance is assessed based on their operating result (see section 7.10).
M. Transaction date and settlement date
All purchases and sales of financial instruments, which have to be settled in accordance with standard market conventions, are recognised at the transaction date, which is the date on which a.s.r. becomes party to the contractual stipulations of the instrument. Any purchases and sales other than those requiring delivery within the time frame established by regulations or market conventions are accounted for as forward transactions until the time of settlement. For details on these transactions, see accounting policy E.
N. Securities lending
a.s.r. participates in securities lending transactions, whereby collateral is received in the form of securities or cash. Cash received as collateral is recognised in the balance sheet and a corresponding liability is recognised as liabilities arising from securities lending in ‘Due to banks’. Securities lent remain on the balance sheet. Securities received as collateral are not recognised in the balance sheet.
O. Statement of cash flows
The statement of cash flows classifies cash flows by operating activities, investing activities and financing activities. Cash flows denominated in foreign currencies are converted at the exchange rates applicable on the transaction date.
Cash flows from operating activities are reported using the indirect method. Cash flows from operating activities include result before tax, adjustments for gains and losses that did not result in income and payments in the same financial year, adjustments for movements in provisions, and accrued and deferred items.
The statement of cash flows recognises interest received and paid, and dividends received within cash flows from operating activities. Cash flows from purchasing and selling investments and investment property are included in cash flows from operating activities on a net basis. Dividends paid are recognised within cash flows from financing activities.
P. Property, plant and equipment
Property held for own use and plant
Property held for own use and plants comprise of land and office buildings and plants like wind farms and are measured at fair value (revaluation model) based on annual valuations, conducted by external, independent valuators with adequate professional expertise and experience in the specific location and categories of properties or plant.
They are subsequently measured at fair value, including any unrealised fair value changes in equity, taking into account any deferred tax liabilities. For the method of determining the fair value reference is made to accounting policy B for investment property and plant.
Increase in the fair value exceeding the cost price is added to the revaluation reserve in shareholders’ equity, less deferred taxes. Decreases in the fair value that offset previous increases of the same asset, are charged against the revaluation reserve. The revaluation reserve cannot be negative. All other decreases in fair value are accounted for in the income statement. Increases that reverse a revaluation decrease on the same asset previously recognised in net result are recognised in the income statement.
Buildings and wind farms are depreciated using the straight-line method based on expected useful life, taking into account their fair value amount, the residual value from the time when it is in the location and condition necessary for it to be capable of operating in the manner intended by management. The useful life of buildings is assessed annually for every individual component (component approach).
Property and plant classified into components and their maximum life
| Components | Useful life (expressed in years) |
|---|---|
| Land | n.a. |
| Shell | 50 |
| Outer layer | 15-30 |
| Wind turbines | 25 |
| Solar panels | 25 |
| Systems | 15-20 |
| Fittings and fixtures | 15 |
Repair and maintenance costs are charged to the income statement in the period in which they are incurred. Expenses incurred after the acquisition of an asset are capitalised if it is probable that the future economic benefits will flow to a.s.r. and the cost of the asset can be measured reliably.
Upon the sale of a property or plant, the part of the revaluation reserve related to the sold property or plant, within equity, is transferred to ‘other reserves’ and is not reclassified to the income statement. Therefore annually a transfer is also made from the revaluation reserve related to ‘other reserves’ in line with the depreciation recognised in the income statement for the revalued portion.
Equipment
Equipment is recognised at cost, less accumulated depreciation and / or any accumulated impairment losses. Cost corresponds with the cash paid or the fair value of the consideration given to acquire the asset.
Equipment is depreciated over its useful life, which is determined individually (usually between three and five years). Repair and maintenance costs are charged to the income statement in the period in which they are incurred. Expenses incurred after the acquisition of an asset are capitalised if it is probable that the future economic benefits will flow to a.s.r. and the cost of the asset can be measured reliably.
Accounting for borrowing costs attributable to the construction of property, plant and equipment is the same as accounting for borrowing costs attributable to investment property. For details, see accounting policy D.
Right-of-use assets
Right-of-use assets are recognised for lease contracts for which a.s.r. is the lessee. For more information reference is made to accounting policy V.
Q. Associates and joint ventures
Associates
Associates are entities over which a.s.r. has significant influence on operating and financial contracts, without having control. Generally, associates are accounted for using the equity method from the date at which a.s.r. acquires significant influence until the date at which such influence ceases. This means that associates are initially recognised at cost, including any goodwill paid. This value is subsequently adjusted to take account of a.s.r.’s share of the associate’s comprehensive income. Comprehensive income is adjusted in accordance with the accounting principles used by a.s.r.
Losses are accounted for until the carrying amount of the investment has reached zero. Further provisions are recognised only to the extent that a.s.r. has incurred legal or constructive obligations concerning these associates.
If objective evidence of impairment exists, associates are tested for impairment and, if necessary, written down.
When the application of the equity method produces information that is not relevant to the investors, a.s.r. may use the exemption of IAS 28 to measure the investments in those associates at fair value through profit or loss in accordance with IFRS 9. a.s.r. applies fair value measurement for investments in real estate equity funds and mortgage equity funds, over which a.s.r. has significant influence.
Joint ventures
Joint ventures are contractual arrangements whereby a.s.r. and one or more parties undertake an economic activity that is subject to joint control. Joint control exists only when the strategic financial and operating decisions relating to the activity require the unanimous consent of the parties sharing control.
These interests are accounted for using the equity method as applied to associates. The interests are recognised in the financial statements from the date on which a.s.r. first obtains joint control until the date that this joint control ceases.
If objective evidence of impairment exists, joint ventures are tested for impairment and, if necessary an impairment is recognised in the income statement.
Joint operations
a.s.r. has a limited number of non-material joint operations. These are recognised in relation to a.s.r.’s interest in the joint operation's individual balance sheet and income statement items.
R. Other assets
Other assets include accrued investment income, property developments, collateral (including margin accounts), reverse repurchase agreements, tax assets and accrued assets.
Property developments consist of property under development commissioned by third parties. Development property is measured at cost including any incremental costs (if a.s.r. expects to recover those costs), directly related costs to the contract (i.e. labour, materials, allocation of directly related costs, payments to subcontractors) and construction period interest, less any invoiced instalments and impairments.
Revenue on property development is primarily accounted for at the moment the property is sold. This is a performance obligation satisfied at a point in time. The point in time is the moment a customer obtains control of the promised asset.
Property developments which are sold can have guarantees (such as rent guarantees or construction guarantees), which may give rise to a separate performance obligation.
S. Cash and cash equivalents
Cash and cash equivalents include cash in hand, deposits held at call with banks, cash collateral and other short-term highly liquid investments that are not subject to a significant risk of changes in value. Cash and cash equivalents are measured at fair value through profit or loss.
T. Equity
Share capital and share premium reserve
The share capital disclosed in the balance sheet consists of issued and fully paid-up ordinary shares. The share premium reserve comprises additional paid-in capital in excess of the par value of the shares.
Reserve for unrealised gains and losses
This reserve consists of:
Unrealised gains and losses from assets FVOCI net of tax (see accounting policy E);
The share of unrealised gains and losses of associates and joint ventures using the equity method held by a.s.r. (see accounting policy Q);
Unrealised change in value of property for own use (see accounting policy P);
Actuarial gains and losses
Actuarial gains and losses result from the post-employment benefit pension plans (see accounting policy G).
Retained earnings
Retained earnings also include other reserves and the unappropriated result.
Other equity instruments
This item represents the par value of the other equity instruments. Costs directly attributable to the equity issue and the tax impact thereof are recognised in retained earnings.
Treasury shares
Treasury shares are a.s.r.’s own ordinary shares that have been issued and subsequently reacquired by a.s.r. Treasury shares are deducted from equity, regardless of the objective of the transaction. No gain or loss is recognised in the income statement on the purchase, sale, issue or cancellation of the instruments. If sold, the difference between the carrying amount and the proceeds is reflected in retained earnings. The consideration paid or received is recognised directly in shareholders’ equity. All treasury shares are eliminated in the calculation of earnings per share and dividend per ordinary share.
Treasury shares are either required as part of the share buy-back program, or acquired and resold as part of the employee share purchase plan, see section 7.7.6.
Non-controlling interest
The non-controlling interest relates to the equity in a consolidated subsidiary not attributable, directly or indirectly, to a.s.r. (see accounting policy J).
Dividends on ordinary share capital
Dividends on ordinary shares are recognised as a liability and recognised in equity when they are approved by a.s.r.’s shareholders. Interim dividends are recognised in equity when they are paid.
Dividends for the year that are approved after the reporting date are treated as an event after the reporting date.
Discretionary interest on other equity instruments
Discretionary interest on other equity instruments is recognised in equity upon payment. The related income tax on these equity instruments is recognised in the income statement.
U. Financing
Financing includes savings deposits, borrowings, due to customers, due to banks, subordinated liabilities and other financial liabilities. On initial recognition, debt instruments and other loans are stated at fair value, net of transaction costs incurred. Subsequent valuation is at amortised cost. Any difference between the proceeds and the redemption value is recognised in the income statement over the period of the borrowings using the effective interest method. Lease liabilities are included under borrowings and measured in accordance with accounting policy V.
V. Leasing
A contract is, or contains, a lease if the contract conveys the right to control the use of an identified asset for a period of time in exchange for a consideration. For contracts that contain a lease component and one or more additional lease or non-lease components a.s.r. applies the practical expedient not to separate non-lease components from lease components.
At the commencement date of the lease, a.s.r. recognises a right-of-use asset and a lease liability. The right-of-use asset comprises the amount of the lease liability at initial measurement. The lease liability is measured at the present value of the lease payments that are not paid at the commencement date. For vehicles, the lease payments are discounted using the interest rate implicit in the lease. For other leases a.s.r.’s incremental borrowing rate is used.
Subsequently, the right-of-use asset is valued at cost less any cumulated depreciation and any accumulated impairment losses and adjusted for any remeasurement of the lease liability. The lease liability is increased with interest accrued and reduced for lease payments made. When applicable the lease liability is remeasured for changes in future payments resulting from a change in index or lease term.
The right-of-use assets are presented under property, plant and equipment. The lease liabilities are presented under borrowings.
W1. Insurance contract revenue
Insurance contract revenue excludes any investment components and is measured as follows.
Insurance contract revenue – contracts measured under the GMM or VFA
a.s.r. recognises insurance contract revenue as it satisfies its performance obligations – i.e. as it provides coverage or other services required due to groups of insurance contracts.
For contracts measured under the GMM or VFA, the insurance contract revenue relating to services provided for each period represents the total of the changes in the liability for remaining coverage that relate to services for which a.s.r. expects to receive consideration.
Insurance contract revenue consists of the sum of the changes in the liability for remaining coverage due to:
The insurance service expenses incurred in the period measured at the amounts expected at the beginning of the period, excluding:
– Amounts allocated to the loss component;
– Repayments of investment components;
– Amounts that relate to transaction-based taxes collected on behalf of third parties;
– Insurance acquisition expenses; and
– Amounts relating to risk adjustment for non-financial risk.The change in the risk adjustment for non-financial risk, excluding:
– Changes that relate to future service that adjust the CSM; and
– Amounts allocated to the loss component.The amount of CSM for the services provided in the period;
In addition, a.s.r. allocates a portion of premiums that relate to recovering insurance acquisition cash flows to each period in a systematic way based on the passage of time. a.s.r. recognises the allocated amount as insurance contracts revenue and an equal amount as insurance service expenses.
The amount of the CSM of a group of insurance contracts that is recognised as insurance contract revenue in each reporting period is generally determined by considering the quantity of benefits provided from the services per insurance contract and allocating the CSM per insurance contract remaining at the end of the reporting period (before any allocation) equally to the services provided in the reporting period and expected to be provided in future periods.
Per group of contracts, in accordance with the level of aggregation criteria, the CSM is subsequently released, considering each individual contract, to the current coverage period and to future coverage periods in which the insurance contract service is expected to be provided (considering expected contract terms and survivor, lapse and death assumptions).
Insurance contract revenue – contracts measured under the PAA
For contracts measured under the PAA, the insurance contract revenue for each period is the amount of expected premium receipts for providing coverage in the period. a.s.r. allocates the expected premium receipts to each period on the basis of the passage of time.
Allocation of reinsurance premiums paid
a.s.r. allocates reinsurers premiums paid as it receives coverage or other services under groups of reinsurance contracts. For contracts measured under the GMM the allocation of reinsurance premiums paid relating to services received for each reporting period represents the total of the changes in the remaining coverage component that relate to services for which a.s.r. expects to pay consideration.
For contracts measured under the PAA, the allocation of reinsurance premiums paid for each period is the amount of expected premium payments for receiving coverage in the period.
W2. Insurance service expenses
Insurance service expenses arising from insurance contracts are recognised in the income statement generally as they are incurred. They comprise the following items:
Claims and benefits
- Incurred claims and benefits;
- Losses and reversal of losses on onerous contracts;
- Adjustment of the liabilities for incurred claims and benefits that do not arise from the effects of the time value of money, financial risk and changes therein;Insurance service operating expenses
- Attributable insurance service operating expenses;
- Acquisition costs when incurred for insurance contracts measured under the PAA; and
- Amortisation of insurance acquisition cash flows for contracts not measured under the PAA.
Loss components
a.s.r. establishes a loss component of the liability for remaining coverage for onerous groups of insurance contracts. The loss component determines the amounts of fulfilment cash flows that are subsequently presented in the income statement as reversals of losses on onerous contracts and are excluded from insurance contract revenue when they occur. When the fulfilment cash flows occur, they are allocated between the loss component and the liability for remaining coverage excluding the loss component on a systematic basis.
The systematic basis is determined by the proportion of the loss component relative to the total estimate of the present value of the future cash outflows plus the risk adjustment for non-financial risk at the beginning of each period (or on initial recognition if a group of contracts is initially recognised in the period).
Decreases in fulfilment cash flows relating to future services or increases in a.s.r.’s share of the fair value of any underlying items are allocated solely to the loss component. If the loss component is reduced to zero, then any excess over the amount allocated to the loss component creates a new CSM for the group of contracts.
W3. Investment income
Investment income comprises the direct investment income such as interest income on financial assets, dividends received, rental income from investment property and other direct investment income. Fair value gains and losses includes the net gains on financial assets at FVTPL, net gains on derecognition of financial assets and liabilities at amortised cost and fair value gains on investment property.
Interest income
Interest income for all interest-bearing instruments includes coupons earned on fixed income instruments and is recognised on an accrual basis. Transaction costs attributable to the acquisition of debt securities at fair value through profit or loss are immediately recognised in the income statement.
When unpaid interest has accrued before the acquisition of an interest-bearing investment, the subsequent receipt of interest is allocated between pre-acquisition and post-acquisition periods; only the post-acquisition portion is recognised as revenue. The pre-acquisition interest is part of the consideration paid.
Interest rate swaps
When the two legs of an interest rate swap are settled gross, interest paid and interest received on these swap are not offset. Gross settlement means that both legs of the swap are settled separately: one party receives interest and the other party pays interest. The net amount depends on the market interest rate. Interest received is accounted for as direct investment income, interest paid is accounted for as other finance expense.
Impairments
When a receivable is impaired, a lifetime expected credit loss (ECL) is recognised and interest income is calculated on the net carrying amount (that is the gross carrying amount less credit allowance).
Dividends
Dividend income is recognised in the income statement when a right to receive payment is established.
Rental income
Rental income from investment property is allocated to the period to which they relate.
W4. Insurance finance income and expenses
Insurance finance income and expenses comprise changes in the carrying amounts of groups of insurance and reinsurance contracts, measured through GMM and PAA, arising from the effects of the time value of money, financial risk and changes therein. For direct participating insurance contracts (VFA) the change in the fair value of the underlying items is included in the insurance finance income and expenses.
X. Solvency II
a.s.r. needs to comply with prudential reporting requirements set under Solvency II, which differ from EU-IFRS in a number of areas.
In accordance with the Solvency II regulations (2009/138/EG art. 75 - 86), Solvency II figures are based on fair value. Fair value measurement is based on the same fair value hierarchy described in the IFRS accounting policies (see accounting policy B).
Most important adjustments in the balance sheet, compared to IFRS, are the valuation of the (savings-linked) mortgage loans-portfolio and the liabilities arising from insurance contracts (including the risk margin). Solvency II Basic Own Funds consists of the excess of assets over liabilities and subordinated liabilities, minus foreseeable dividend. At 31 December 2025, the Solvency Capital Requirement (SCR) of a.s.r. and the life insurance entities is based on the Partial Internal Model (PIM). The PIM is approved by DNB. In 2024, only Aegon life and Aegon spaarkas calculated the SCR based on PIM, while a.s.r. Life applied the standard formula. The calculations of the Loss Absorbing Capacity of Deferred Tax (LAC DT) for a.s.r. life, Aegon life and Aegon spaarkas are based on the PIM outcomes. The SCR for the other insurance entities are entirely based on the standard formula, including the calculation of the LAC DT of these entities. The LAC DT methodology is reviewed and properly documented.
7.4 Group structure and segment information
7.4.1 Group structure
The Group comprises a number of operating and holding companies. Except where indicated, a.s.r. is 100% shareholder of these companies.
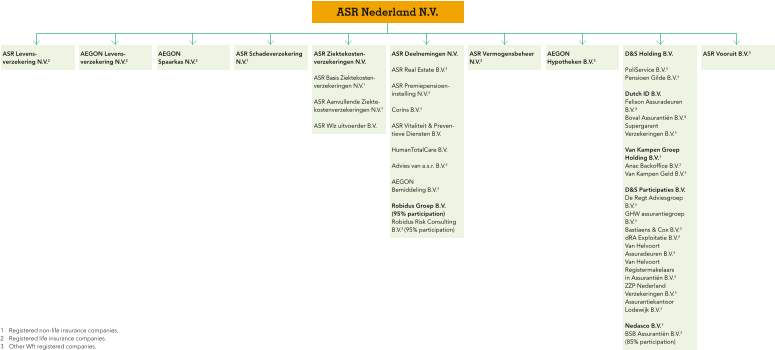
Segment information
See accounting policy L
The operations of a.s.r. have been divided into five operating segments (2024: five). The main segments are the Non-life and Life segment in which all insurance activities are presented. The other activities are presented as three separate segments being Asset Management, Distribution and Services and Holding and Other.
Intersegment transactions or transfers are concluded at arm's length conditions.
See section 7.7.9 List of principal group companies for a list of principal group companies and associates in the relevant segments.
In January 2025 Aegon Cappital B.V. legally merged with ASR Premiepensioeninstelling N.V., after which the former ceased to exist.
The a.s.r. segment reporting shows the financial performance of each segment. The purpose is to allocate all items in the balance sheet and income statement to the segments that hold full management responsibility for them.
The eliminations applied in the reconciliation of the segment information to the consolidated balance sheet and the consolidated income statement are separately presented in sections 7.4.2 and 7.4.3.
The segments are assessed on their operating result as defined in section 7.10.
7.4.2 Segmented balance sheet
Segmented balance sheet
| As at 31 December 2025 | Non-life | Life | Asset Management | Distribution and Services | Holding and Other | Eliminations | Total |
|---|---|---|---|---|---|---|---|
| Intangible assets | 17 | 64 | 104 | 621 | - | - | 805 |
| Property, plant and equipment | 1 | 529 | - | 102 | 253 | -207 | 678 |
| Investment property | 37 | 3,183 | - | - | - | - | 3,220 |
| Associates and joint ventures at equity method | - | 370 | - | 10 | 28 | - | 408 |
| Investments | 11,065 | 66,184 | 2,606 | 16 | 241 | -970 | 79,141 |
| Investments related to direct participating insurance contracts | - | 33,302 | - | - | - | - | 33,302 |
| Derivatives | 169 | 15,277 | 458 | - | - | - | 15,905 |
| Deferred tax assets | - | 612 | 9 | - | - | -585 | 36 |
| Reinsurance contract assets | 206 | 146 | - | - | - | - | 351 |
| Other assets | 465 | 4,744 | 325 | 236 | 5,818 | -5,993 | 5,596 |
| Cash and cash equivalents | 188 | 1,345 | 331 | 191 | 654 | - | 2,709 |
| Total assets | 12,148 | 125,757 | 3,832 | 1,175 | 6,995 | -7,756 | 142,151 |
| Equity attributable to holders of equity instruments | 3,115 | 7,046 | 466 | 655 | -1,158 | -12 | 10,111 |
| Non-controlling interests | - | - | - | 3 | 10 | - | 13 |
| Total equity | 3,115 | 7,046 | 466 | 658 | -1,149 | -12 | 10,124 |
| Subordinated liabilities | 9 | - | - | - | 1,503 | -9 | 1,503 |
| Insurance contract liabilities | 8,352 | 57,652 | - | - | - | -2,692 | 63,312 |
| Liabilities arising from direct participating insurance contracts | - | 40,773 | - | - | - | -2,724 | 38,049 |
| Employee benefits | - | - | - | - | 4,810 | - | 4,810 |
| Provisions | - | 60 | - | 3 | 57 | - | 121 |
| Borrowings | 1 | 1,168 | 1,913 | 294 | 1,070 | -1,145 | 3,301 |
| Derivatives | 356 | 14,698 | 399 | - | - | - | 15,453 |
| Deferred tax liabilities | 219 | - | - | 1 | 358 | -579 | - |
| Due to banks | 22 | 3,267 | 821 | - | - | - | 4,110 |
| Other liabilities | 73 | 1,092 | 234 | 218 | 346 | -594 | 1,369 |
| Total liabilities | 9,033 | 118,711 | 3,367 | 517 | 8,143 | -7,743 | 132,027 |
| Total equity and liabilities | 12,148 | 125,757 | 3,832 | 1,175 | 6,995 | -7,756 | 142,151 |
| Addition to | |||||||
| Intangible assets | - | 2 | - | 282 | - | - | 284 |
| Property, plant and equipment | 1 | -1 | 73 | 17 | -8 | 81 | |
| Total additions | 1 | 1 | - | 355 | 17 | -8 | 365 |
Segmented balance sheet
| As at 31 December 2024 | Non-life | Life | Asset Management | Distribution and Services | Holding and Other | Eliminations | Total |
|---|---|---|---|---|---|---|---|
| Intangible assets | 32 | 101 | 97 | 362 | - | - | 592 |
| Property, plant and equipment | - | 584 | - | 40 | 257 | -206 | 676 |
| Investment property | 63 | 3,301 | - | - | - | - | 3,364 |
| Associates and joint ventures at equity method | 0 | 362 | - | 9 | 86 | - | 457 |
| Investments | 10,284 | 68,295 | 2,633 | 19 | 431 | -1,068 | 80,593 |
| Investments related to direct participating insurance contracts | - | 33,025 | - | - | - | - | 33,025 |
| Derivatives | 152 | 11,369 | 247 | - | - | - | 11,767 |
| Deferred tax assets | - | 739 | 8 | - | - | -646 | 101 |
| Reinsurance contract assets | 283 | 208 | - | - | - | - | 491 |
| Other assets | 460 | 2,417 | 427 | 226 | 6,409 | -6,615 | 3,323 |
| Cash and cash equivalents | 387 | 2,589 | 329 | 114 | 774 | - | 4,194 |
| Total assets | 11,660 | 122,989 | 3,740 | 770 | 7,958 | -8,536 | 138,582 |
| Equity attributable to holders of equity instruments | 3,099 | 7,260 | 432 | 373 | -1,303 | -21 | 9,840 |
| Non-controlling interests | 7 | 43 | - | 2 | -6 | - | 47 |
| Total equity | 3,106 | 7,303 | 432 | 376 | -1,308 | -21 | 9,888 |
| Subordinated liabilities | 95 | - | - | - | 2,007 | -95 | 2,007 |
| Insurance contract liabilities | 7,755 | 59,269 | - | - | - | -2,824 | 64,200 |
| Liabilities arising from direct participating insurance contracts | - | 41,331 | - | - | - | -2,966 | 38,366 |
| Employee benefits | - | - | - | - | 5,036 | - | 5,037 |
| Provisions | 1 | 327 | - | 6 | 79 | - | 413 |
| Borrowings | 8 | 680 | 2,278 | 225 | 1,097 | -1,153 | 3,135 |
| Derivatives | 322 | 8,085 | 259 | - | - | - | 8,666 |
| Deferred tax liabilities | 197 | - | - | 4 | 441 | -642 | - |
| Due to banks | 46 | 4,829 | 674 | - | - | - | 5,550 |
| Other liabilities | 130 | 1,165 | 97 | 160 | 605 | -836 | 1,322 |
| Total liabilities | 8,554 | 115,686 | 3,308 | 395 | 9,266 | -8,515 | 128,694 |
| Total equity and liabilities | 11,660 | 122,989 | 3,740 | 770 | 7,958 | -8,536 | 138,582 |
| Additions to | |||||||
| Intangible assets | - | 1 | - | 16 | - | - | 17 |
| Property, plant and equipment | 1 | - | - | 19 | 6 | - | 26 |
| Total additions | 1 | 1 | - | 34 | 6 | - | 43 |
7.4.3 Segmented income statement and operating result
Segmented income statement and operating result
| 2025 | Non-life | Life | Asset Management | Distribution and Services | Holding and Other | Eliminations | Total |
|---|---|---|---|---|---|---|---|
| Insurance contract revenue | 5,937 | 4,641 | - | - | - | -254 | 10,324 |
| Incurred claims and benefits | -4,562 | -3,765 | - | - | - | 211 | -8,117 |
| Insurance service operating expenses | -1,071 | -288 | - | - | - | - | -1,359 |
| Insurance service expenses | -5,633 | -4,053 | - | - | - | 211 | -9,475 |
| Insurance service result before reinsurance | 304 | 588 | - | - | - | -43 | 849 |
| Net result from reinsurance contracts | -48 | -53 | - | - | - | - | -102 |
| Insurance service result | 256 | 535 | - | - | - | -43 | 747 |
| Direct investment income | 493 | 8,060 | 299 | 6 | 20 | -39 | 8,838 |
| Net fair value gains (and losses) | -166 | -3,913 | -17 | - | 6 | -4 | -4,093 |
| Impairments on financial assets | - | 1 | 1 | - | - | - | 1 |
| Net finance result from insurance and reinsurance contracts | -156 | 1,883 | - | - | - | -225 | 1,502 |
| Other finance expenses | -194 | -5,322 | -266 | -8 | -551 | 312 | -6,029 |
| Investment operating expenses | -20 | -182 | -127 | - | -3 | 118 | -215 |
| Investment and finance result | -43 | 526 | -110 | -2 | -527 | 161 | 5 |
| Share of result of associates and joint ventures | - | 26 | - | 1 | 4 | - | 30 |
| Fee income | 8 | 77 | 343 | 468 | - | -308 | 589 |
| Other income | 20 | 74 | - | 12 | 92 | -9 | 189 |
| Total other income | 28 | 177 | 343 | 481 | 96 | -317 | 808 |
| Other expenses | -52 | -196 | -155 | -421 | -257 | 217 | -864 |
| Total other income and expenses | -24 | -19 | 188 | 60 | -162 | -100 | -56 |
| Result before tax | 188 | 1,042 | 78 | 59 | -689 | 18 | 696 |
| Income tax (expense) / gain | -51 | -255 | -23 | -13 | 216 | -5 | -131 |
| Net result | 138 | 787 | 55 | 46 | -473 | 13 | 565 |
| Attributable to: | |||||||
| Non-controlling interests | - | - | - | 2 | 15 | - | 17 |
| - Shareholders of the parent | 138 | 786 | 55 | 44 | -561 | 13 | 476 |
| - Holders of other equity instruments | - | - | - | - | 73 | - | 73 |
| Result attributable to holders of equity instruments | 138 | 786 | 55 | 44 | -488 | 13 | 548 |
a.s.r. decided to use the ‘look-through’ approach on a group level when calculating the CSM, representing all income and expenses of the Group related to insurance contracts. As a result the services of a.s.r. asset management related to insurance contracts measured under the variable fee approach are reflected in the insurance service result of the segment Life, as well as the segment Asset management, and subsequently reversed in ‘other income and other expenses’ within the segment Life. a.s.r. considers this to be a true and fair view. It reflects the measure reported to the Executive Board, as chief operating decision maker, for the purpose of making decisions about allocating resources to the segment and assessing its performance.
Operating result
| 2025 | Non-life | Life | Asset Management | Distribution and Services | Holding and Other | Eliminations | Total |
|---|---|---|---|---|---|---|---|
| Result before tax from continuing operations | 188 | 1,042 | 78 | 59 | -689 | 18 | 696 |
| Minus adjustments related to the insurance service result | -71 | 81 | 0 | 0 | 0 | -43 | -34 |
| Minus adjustments related to the investment and finance result | -197 | -255 | -15 | 0 | -334 | 39 | -762 |
| Minus adjustments related to the other result | -17 | -43 | -27 | -8 | -51 | 0 | -146 |
| Operating result | 474 | 1,259 | 120 | 66 | -304 | 22 | 1,637 |
In 2025, adjustments related to the insurance service result (€ -34 million) consist mainly of the amortisation of pre-recognition interest rate hedged developments prior to the initial CSM recognition (€ -16 million) and the non-economic assumption update for inflation in the liability for incurred claims of Disability (€ -9 million), a charge related to interest accretion on provisions for undercoverage of separate accounts (€ -8 million) and expenses for regulatory pension reform (€ -6 million).These were partly offset by changes to future services on onerous contracts (€ 11 million of which € -46 million in Non-Life and € 57 million in Life), mainly due to updates of assumptions on disability, mortality and surrender).
Adjustments related to the investment and finance result (€ -762 million) were mostly driven by revaluations with a negative P&L impact due to increasing interest rates and a steepening of the curve, partly offset by positive real estate revaluations.
Adjustments related to the other result (€ -146 million) consist of costs for integration of the Aegon NL business lines (€ -88 million) charged to the Holding, project costs for the regulatory pension reform and CSRD, project costs for the implementation of the PIM of a.s.r. life, amortisations of intangible assets recognised in earlier acquisitions (€ -71 million)and a derecognition gain on the earlier 45% share in HumanTotalCare and on the sale of some participations in Distribution and Services (€ 35 million).
For more information including an explanation of the definition, see section 7.10.
For more information on impairements on segment reporting refer to the below table:
Impairments
| 2025 | Non-life | Life | Asset Management | Distribution and Services | Holding and Other | Eliminations | Total | |
|---|---|---|---|---|---|---|---|---|
| Intangible assets | Impairment | -6 | - | -10 | - | - | - | -16 |
| Intangible assets | Reversal | - | - | - | - | - | - | - |
| Property, plant and equipment | Impairment | - | - | - | - | -3 | - | -3 |
| Property, plant and equipment | Reversal | - | - | - | - | - | - | - |
| Other assets | Impairment | - | -5 | - | - | - | - | -5 |
| Other assets | Reversal | - | 6 | - | - | - | - | 6 |
| Total Impairments | Impairment | -6 | -5 | -10 | - | -3 | - | -24 |
| Reversal | - | 6 | - | - | -0 | - | 6 | |
| Total | -6 | - | -10 | - | -3 | - | -18 |
Segmented income statement and operating result
| 2024 | Non-life | Life | Asset Management | Distribution and Services | Holding and Other | Eliminations | Total |
|---|---|---|---|---|---|---|---|
| Continuing operations | |||||||
| Insurance contract revenue | 5,614 | 4,241 | - | - | - | -254 | 9,601 |
| Incurred claims and benefits | -4,168 | -3,402 | - | - | - | 211 | -7,359 |
| Insurance service operating expenses | -1,061 | -290 | - | - | - | - | -1,350 |
| Insurance service expenses | -5,229 | -3,692 | - | - | - | 211 | -8,710 |
| Insurance service result before reinsurance | 385 | 550 | - | - | - | -44 | 891 |
| Net result from reinsurance contracts | -43 | -58 | - | - | - | - | -101 |
| Insurance service result | 342 | 491 | - | - | - | -44 | 790 |
| Direct investment income | 485 | 5,643 | 219 | 8 | 220 | -224 | 6,351 |
| Net fair value gains (and losses) | 203 | 4,277 | -27 | - | 2 | 6 | 4,459 |
| Impairments on financial assets | 1 | - | - | - | - | - | 1 |
| Net finance result from insurance and reinsurance contracts | -263 | -5,751 | - | - | - | 281 | -5,733 |
| Other finance expenses | -218 | -3,380 | -166 | -8 | -236 | -23 | -4,031 |
| Investment operating expenses | -16 | -168 | -118 | - | -1 | 99 | -205 |
| Investment and finance result | 190 | 620 | -92 | - | -15 | 138 | 842 |
| Share of result of associates and joint ventures | - | 21 | - | 1 | 6 | - | 28 |
| Fee income | 7 | 73 | 325 | 377 | 3 | -267 | 518 |
| Other income | 15 | 72 | - | 12 | 18 | -10 | 107 |
| Total other income | 22 | 166 | 325 | 390 | 27 | -277 | 653 |
| Other expenses | -51 | -126 | -161 | -374 | -277 | 168 | -821 |
| Total other income and expenses | -29 | 40 | 164 | 16 | -250 | -109 | -168 |
| Result before tax | 504 | 1,151 | 72 | 16 | -265 | -15 | 1,464 |
| Income tax (expense) / gain | -127 | -305 | -19 | -11 | 72 | 3 | -387 |
| Result after tax | 377 | 846 | 54 | 5 | -193 | -11 | 1,077 |
| Discontinued operations | |||||||
| Result after tax from discontinued operations | - | - | - | - | -131 | 10 | -121 |
| Net result | 377 | 846 | 54 | 5 | -324 | -1 | 956 |
| Attributable to: | |||||||
| Non-controlling interests | - | -1 | - | 1 | -1 | - | -2 |
| - Shareholders of the parent | 377 | 848 | 54 | 4 | -386 | -1 | 895 |
| - Holders of other equity instruments | - | - | - | - | 63 | - | 63 |
| Result attributable to holders of equity instruments | 377 | 848 | 54 | 4 | -323 | -1 | 958 |
The results from discontinued operations in relation to Knab, including the loss as a result of the sale, is recognised in segment Holding and Other.
Operating result
| 2024 | Non-life | Life | Asset Management | Distribution and Services | Holding and Other | Eliminations | Total |
|---|---|---|---|---|---|---|---|
| Result before tax from continuing operations | 504 | 1,151 | 72 | 16 | -265 | -15 | 1,464 |
| Minus adjustments related to the insurance service result | -33 | 63 | 0 | 0 | 0 | -44 | -14 |
| Minus adjustments related to the investment and finance result | 48 | -15 | -15 | 0 | 145 | 9 | 173 |
| Minus adjustments related to the other result | -16 | 26 | -13 | -33 | -128 | 5 | -158 |
| Operating result | 505 | 1,076 | 100 | 50 | -283 | 15 | 1,463 |
In 2024, adjustments related to the insurance service result (€ -14 million) mainly consist of the non-economic assumption update for inflation in the liability of incurred claims of Disability (€ -25 million) and the amortisation of pre-recognition interest rate hedged developments prior to the initial CSM recognition (€ -18 million). This was partly offset by changes to future services on onerous contracts (€ 39 million, mostly reflecting synergies in expense provisioning).
Adjustments related to the investment and finance result (€ 173 million) were mainly related to revaluations due to market developments to arrive at normalised investment returns in the operating result.
Adjustments related to the other result (€ -158 million) consist of costs for integration of the Aegon NL business lines, charged to the Holding, project costs for the regulatory pension reform and CSRD implementation, project costs for the implementation of a PIM and amortisations of intangible assets defined in earlier acquisitions.
Operating result is an alternative performance measure; for more information see section 7.10.
Impairments
| 2024 | Non-life | Life | Asset Management | Distribution and Services | Holding and Other | Eliminations | Total | |
|---|---|---|---|---|---|---|---|---|
| Property, plant and equipment | Impairment | - | - | - | - | -3 | - | -3 |
| Property, plant and equipment | Reversal | - | - | - | - | - | - | - |
| Other assets | Impairment | - | - | - | - | - | - | - |
| Other assets | Reversal | 1 | - | - | - | - | - | 1 |
| Total Impairments | Impairment | - | - | - | - | -3 | - | -3 |
| Reversal | 1 | - | - | - | - | - | 1 | |
| Total | 1 | - | - | - | -3 | - | -2 |
7.4.4 Non-life ratios
The combined ratio including the claims, commission and expense ratios is an alternative performance measure and is not a measure of financial performance under IFRS. Because it is not determined in accordance with IFRS, these ratios as presented by a.s.r. may not be comparable to other similarly titled measures of performance of other companies.
Non-life combined ratio
| 2025 | 2024 | |
|---|---|---|
| Claims ratio | 75.7% | 73.9% |
| Commission ratio | 12.6% | 12.7% |
| Expense ratio | 6.0% | 6.5% |
| Combined ratio | 94.3% | 93.2% |
Non-life combined ratio per business line
| 2025 | 2024 | |
|---|---|---|
| Property & Casualty (P&C) | 90.4% | 90.7% |
| Disability | 94.2% | 91.2% |
| P&C and Disability | 92.2% | 90.9% |
| Health | 99.1% | 99.1% |
The claims, commission and expense ratios can be calculated based on the following information:
Claims, commission and expenses
| 2025 | 2024 | |
|---|---|---|
| Insurance contract revenue | 5,937 | 5,614 |
| Allocation of reinsurance premiums paid | -195 | -130 |
| Adjustment to the insurance contract revenue | 13 | 17 |
| Net insurance contract revenue | 5,755 | 5,500 |
| Insurance claims and benefits | -4,562 | -4,168 |
| Amounts recoverable from reinsurers | 147 | 87 |
| Adjustment to the insurance claims and benefits | 58 | 17 |
| Adjusted net insurance claims and benefits | -4,357 | -4,064 |
| Insurance service operating expenses | -1,071 | -1,061 |
| Of which: Incurred commission expenses | -725 | -701 |
| Insurance service operating expenses excluding incurred commission expenses | -346 | -360 |
The Non-life combined ratio indicates the insurance related profitability of a non-life insurance contract. To measure the Non-life combined ratio, the insurance service expenses are divided by the insurance contract revenue, considering the operating result definition of those items (see sections 7.4.3 and 7.10).
In 2025, the adjustment to the net insurance contract revenue (€ 13 million) relates to the impact on the CSM of hedging for pre-recognition interest rate movements. The adjustments to the insurance claims and benefits (€ 58 million) consist of € 9 million impact of changes of inflation on the liability for incurred claims, € 46 million related to changes to future services on onerous contracts and € 3 million impact on the loss component of hedging for pre-recognition interest rate movements.
In 2024, the adjustment to the net insurance contract revenue (€ 17 million) relates to the impact on the CSM of hedging for pre-recognition interest rate movements. The adjustments to the insurance claims and benefits (€ 17 million) consist of € 25 million impact of changes of inflation on the liability for incurred claims, € -9 million related to changes to future services on onerous contracts and € 1 million impact on the loss component of hedging for pre-recognition interest rate movements.
7.4.5 Acquisitions
See accounting policy H.
Acquisitions 2025
Acquisition HumanTouch Holding
On 3 July 2025, a.s.r. reached an agreement to acquire the remaining 55% interest in HumanTouch Holding B.V. (HumanTouch Holding), the parent company of HumanTotalCare B.V. (HumanTotalCare), from Elechos B.V. (45%) and Stichting CbusineZ (10%). On 1 October 2025 a.s.r. completed the acquisition by acquiring the remaining shares for a total consideration of € 108 million.
This acquisition supports a.s.r.’s strategy of combining targeted acquisitions with organic growth, reinforcing its position in occupational health and reintegration services. HumanTotalCare operates under several well-known brands ArboNed, Mensely, HumanCapitalCare, Focus, and IT&Care, serving approximately 65,000 employers and 1.4 million employees across the Netherlands with services focused on vitality, absenteeism, and sustainable employability.
In December 2025, a.s.r. established the final acquisition balance sheet of HumanTouch Holding, in accordance with IFRS 3 business combinations, within twelve months of the closing date. The balance sheet is based on fair value and uses the following techniques and assumptions:
The intangible assets that were newly recognised relate to € 109 million for customer relationships and brand names. The valuation techniques used to measure the fair value is based on the Multi-period Excess Earnings Method (MEEM) for customer relationships and the Relief of Royalty method for brand names.
To derive the goodwill, the excess purchase price is determined by deducting the book value of the equity adjusted for the previously acquired goodwill from the purchase consideration in equity terms. Goodwill amounting to € 115 million is recognised.
Financial assets and liabilities were remeasured to fair value at the closing date.
Final fair values of the assets and liabilities acquired on acquisition date
| Acquisition date balance sheet based on fair value | |
|---|---|
| Intangible assets | 122 |
| Property, plant and equipment | 63 |
| Other assets | 26 |
| Cash and cash equivalents | 8 |
| Total assets | 218 |
| Provisions | 3 |
| Borrowings | 68 |
| Deferred tax liabilities | 28 |
| Other liabilities | 38 |
| Total liabilities | 137 |
| Net assets and liabilities | 81 |
| Less: | |
| Consideration paid | 108 |
| Previous held interest | 88 |
| 196 | |
| Excess purchase consideration | 115 |
a.s.r. has remeasured its previously held 45% interest in HumanTouch Holding to its acquisition-date fair value. The resulting gain of € 27 million was recognised in the line item Other income in the income statement (see section 7.6.10). The total consideration transferred for the acquisition of the remaining 55% interest amounted to € 108 million. The fair value of the previously held interest, which amounted to € 88 million, and the consideration transferred were used to determine the goodwill arising on acquisition. The goodwill recognised for an amount of € 115 million is not tax deductible and reflects expected synergies and strategic benefits from full ownership, particularly in the field of occupational health services and reintegration.
Cash and cash equivalents related to the acquisitions
| Consideration paid | -108 |
| Acquired cash and cash equivalents | 8 |
| Decrease in cash and cash equivalents at acquisition date | -100 |
From 1 October 2025, HumanTotalCare has been fully consolidated within the Distribution and Services segment, contributing € 60 million in fee income and € 4 million in net result after tax to a.s.r.’s consolidated results for Q4 2025.
Had the acquisition occurred on 1 January 2025, the contribution of HumanTotalCare to fee income and net result after tax would have been € 232 million and € 13 million, respectively. For the previously held 45% interest, an amount of € 4 million is recorded in the line item share of result of associates and joint ventures, representing a.s.r.'s share in the net result of HumanTotalCare for the period 1 January till 30 September 2025.
The transaction has had no impact on the employment status of HumanTotalCare’s approximately 2,000 employees (1.428 FTE).
No material contingent consideration or indemnification assets were recognised.
Other acquisitions
During 2025, a.s.r. acquired several other companies non-material to a.s.r., which became subsidiaries in segment Distribution and Services.
Acquisitions 2024
During 2024, a.s.r. acquired eleven insurance brokerage companies and increased its share in an associate, whereby these acquired entities became subsidiaries in segment Distribution and Services.
7.4.6 Discontinued operations
See accounting policy I.
On 1 February 2024, a.s.r. reached an agreement to sell Knab to the BAWAG Group AG. Closing of the transaction took place on 1 November 2024. As of the agreement date, Knab’s activities were classified as discontinued. For further information see the 2024 consolidated financial statements.
7.5 Notes to the consolidated balance sheet
7.5.1 Intangible assets
See accounting policy C.
Intangible assets
| 31 December 2025 | 31 December 2024 | |
|---|---|---|
| Goodwill | 357 | 233 |
| Other intangible assets | 447 | 359 |
| Total intangible assets | 805 | 592 |
Intangible assets
| Goodwill | Other intangible assets | Total 2025 | Total 2024 | |
|---|---|---|---|---|
| Cost price | 370 | 667 | 1,037 | 723 |
| Accumulated amortisation and impairments | -13 | -219 | -233 | -131 |
| At 31 December | 357 | 447 | 805 | 592 |
| At 1 January | 233 | 359 | 592 | 649 |
| Acquisition | - | 22 | 22 | 5 |
| Amortisation and impairments | - | -94 | -94 | -50 |
| Transfer | -2 | - | -3 | 1 |
| Changes in the composition of the group | 126 | 161 | 287 | -13 |
| At 31 December | 357 | 447 | 805 | 592 |
In 2025, changes in the composition of the group mainly related to the acquisition of HumanTotalCare and several other acquisitions within the Distribution and Services segment. For further details on the goodwill and other intangible assets recognised in connection with the acquisition of HumanTotalCare, see section 7.4.5.
In 2024, changes in the composition of the group related to the sale of Knab, see section 7.4.6.
Amortisation and impairments increased in 2025 by € 44 million to € 94 million, mainly driven by impacts from reassessment of the remaining lifetime of the intangible assets, increasing amortisation (€ 21 million), and impairments on other intangible assets(€ 16 million), which mainly consist of an impairment of € 10 million on the customer relationship within the Asset Management segment, following the planned transfer of servicing of the mortgage portfolio of Knab to Bawag in 2026, which is part of the sale of Knab.
Goodwill
For the purpose of impairment testing, goodwill is allocated to the CGU's of the relevant operating segment.
Goodwill allocation per segment
| 31 December 2025 | 31 December 2024 | |
|---|---|---|
| Non-life | 16 | 16 |
| Life | 43 | 43 |
| Asset Management | 35 | 35 |
| Distribution and Services | 263 | 139 |
| Total goodwill | 357 | 233 |
The addition in 2025 of goodwill within the Distribution and Services segment mainly relates to the acquisition of HumanTotalCare, for which € 115 million goodwill is recognised, see section 7.4.5.
Goodwill has an indefinite useful life and is not amortised. a.s.r. performs an impairment test annually, or more frequently if events or circumstances warrant so, to ascertain whether goodwill has been subject to impairment.
For the CGU's within the Non-life, Life, Asset Management and Distribution and Services segments, the results of these tests, using updated multiples and discount rates, show excess recoverable values over the book values and no goodwill impairment is recognised. A deterioration within reasonable limits on one of the assumptions in isolation would not lead to an impairment. The buffer is also capable of absorbing a combination of negative factors. However, should circumstances on multiple factors deteriorate significantly, it could lead to a negative outcome for the buffer (the difference between the recoverable value and the book value).
Other intangible assets
The other intangible assets mainly consist of customer relationships, trade names and software. The other intangible assets are amortised straight-line over their useful life, which is determined individually (between 3 and 20 years). The amortisation charges on other intangible assets are recorded in the operating and other expenses (see section 7.6.11).
7.5.2 Property, plant and equipment
See accounting policies P and V.
Property, plant and equipment
| 31 December 2025 | 31 December 2024 | |
|---|---|---|
| Land and buildings for own use | 143 | 164 |
| Plant | 353 | 386 |
| Equipment | 64 | 53 |
| Property, plant and equipment owned | 560 | 603 |
| Land and buildings | 100 | 65 |
| Vehicles | 18 | 8 |
| Right-of-use assets | 117 | 72 |
| Total property, plant and equipment | 678 | 676 |
Changes in property, plant and equipment
| Land and buildings for own use | Plant | Equipment | Right-of-use Assets | Total 2025 | Total 2024 | |
|---|---|---|---|---|---|---|
| At 1 January | 164 | 386 | 53 | 72 | 676 | 732 |
| Additions | - | - | 12 | 6 | 18 | 25 |
| Transfers to Investment property | -19 | - | - | - | -19 | - |
| Depreciations | -6 | -20 | -14 | -9 | -48 | -53 |
| Impairments | - | - | -3 | - | -3 | -3 |
| Revaluations through profit of loss | - | -14 | - | - | -14 | -15 |
| Revaluations through equity | 6 | 1 | - | - | 6 | 2 |
| Other | -1 | - | - | - | -1 | -10 |
| Changes in the composition of the group | - | - | 15 | 48 | 63 | -4 |
| at 31 December | 143 | 353 | 64 | 117 | 678 | 676 |
| Gross carrying amount as at 31 December | 272 | 433 | 122 | 167 | 994 | 1,020 |
| Accumulated depreciation as at 31 December | -128 | -80 | -53 | -50 | -311 | -341 |
| Accumulated impairments as at 31 December | - | - | -6 | - | -6 | -3 |
| Net carrying value as at 31 December | 143 | 353 | 64 | 117 | 678 | 676 |
| Revaluation surplus | ||||||
| At 1 January | 53 | 3 | - | - | 56 | 54 |
| Revaluation in the year | 6 | 1 | - | - | 6 | 3 |
| Other | -1 | - | - | - | -1 | -1 |
| at 31 December | 58 | 3 | - | - | 61 | 56 |
Depreciation of property, plant and equipment is recorded in the operating and other expenses, see section 7.6.11.
The fair value of land and buildings for own use is based on the external valuations and the significant inputs used in determining the fair value of plant are disclosed in section 7.7.1.3.
7.5.3 Investment property
See accounting policy D.
Investment property is leased to third parties and is diversified over the rural, residential, offices and retail sectors. The significant inputs are the net initial yield and market rental value. For more information see section 7.7.1.
Changes in investment property
| 2025 | 2024 | |
|---|---|---|
| At 1 January | 3,364 | 3,051 |
| Changes in value of investments, realised/unrealised gains and losses: | ||
| - Fair value gains and losses | 226 | 226 |
| Purchases | 141 | 246 |
| Disposals | -276 | -159 |
| Transferred from property and equipment | 19 | - |
| Transfer of real estate equity funds to investments | -256 | - |
| Changes in the composition of the group | 1 | - |
| At 31 December | 3,220 | 3,364 |
In 2025, the decrease in purchases of € 106 million compared to 2024 mainly relates to residential (€ 35 million) and offices (€ 75 million). The increase of disposals in 2025 by € 117 million relates to retail (€ 98 million) and residential (€ 19 million). In 2025, transfer of real estate equity funds to investments relates to ASR DSPF. During 2025, a.s.r. lost control of ASR DSPF as voting rights for a.s.r. are capped to 40% following a change in the fund agreement, resulting in deconsolidation of ASR DSPF. Subsequently, a.s.r.'s share in ASR DSPF is classified as an associate and presented under investments as real estate equity funds. For more information see section 7.5.4.
Rental income is recognised as direct investment income. In 2025, rentals amounted to € 137 million (2024: € 144 million).
Direct operating expenses arising from investment property amounted to € 56 million (2024: € 52 million). Given the overall low vacancy rate, virtually all direct operating expenses relate to investment properties generating rental income. Direct operating expenses of investment property are classified as operating and other expenses within the investment operating expenses.
Investment property consists mainly of assets expected to be recovered after more than one year after the balance sheet date.
7.5.4 Associates and joint ventures
See accounting policy Q.
Associates and joint ventures
| Interest | 31 December 2025 | 31 December 2024 | |
|---|---|---|---|
| At equity method | |||
| Associates and joint ventures | ranging between 10 % and 50 % | 408 | 457 |
| At FVTPL | |||
| Real estate equity funds | ranging between 25 % and 85 % | 5,265 | 4,775 |
| Other equity funds | ranging between 0 % and 20 % | 913 | 553 |
The associates and joint ventures at equity method (€ 408 million; 2024: € 457 million) consists of € 226 million associates (2024 : € 292 million) and € 183 million joint ventures (2024: € 165 million).
The main associates at equity method are OB Capital Cooperatief U.A. and N.V. Levensverzekering-Maatschappij 'De Hoop'.
The joint ventures at equity method are the real estate companies Amvest Vastgoed B.V. and Amvest Development Fund B.V.
Per 1 October 2025, HumanTotalCare no longer qualifies as an investment in associates following the acquisition of the remaining 55% of the shares and is fully consolidated, see section 7.4.5.
The real estate equity funds consist of the ASR Dutch Mobility Office Fund (ASR DMOF), ASR Dutch Prime Retail Fund (ASR DPRF), ASR Dutch Core Residential Fund (ASR DCRF), ASR Dutch Farmland Fund (ASR DFLF), ASR Dutch Science Parc Fund (ASR DSPF), Amvest Residential Core Fund (Amvest RCF) and Amvest Living & Care Fund (Amvest LCF).
During 2025, a.s.r. lost control of ASR DSPF as voting rights for a.s.r. are capped to 40% following a change in the fund agreement. For more information see section 7.5.3.
The other equity funds consist of five (2024: five) equity funds managed by a.s.r.
The interests in these funds are classified and presented as an investment at FVTPL. For more information, see section 7.5.5 and section 7.7.1.
Investments in associates and joint ventures generally have a duration of more than one year after the balance sheet date.
Changes in associates and joint ventures at equity method
| 2025 | 2024 | |
|---|---|---|
| At 1 January | 457 | 426 |
| Acquisition | 32 | 18 |
| Disposal | -63 | -3 |
| Share of profit/(loss) | 30 | 28 |
| Dividend | -48 | -12 |
| At 31 December | 408 | 457 |
Some participating interests in which a.s.r. has an interest of less than 20% qualify as associates, because a.s.r. has significant influence as a result of contractual agreements. a.s.r. also has interests of 50% or more in associates at FVTPL. a.s.r. has no control over these entities as the ability to direct the relevant activities is limited by contractual agreements and therefore does not consolidate these entities.
The information disclosed in the following tables is based on the most recent financial information available from the associates and joint ventures. This is primarily based on the investee's financial statements and their accounting policies. If these policies differ from a.s.r.'s accounting policies, carrying amounts in a.s.r.’s consolidated financial statements have been changed to be in line with a.s.r.’s policies.
Financial information available from the associates and joint ventures
| 31 December 2025 | 31 December 2024 | |||||||
|---|---|---|---|---|---|---|---|---|
| Associates and joint ventures at equity method | Real estate equity funds | Other equity funds | Total | Associates and joint ventures at equity method | Real estate equity funds | Other equity funds | Total | |
| Total assets | 736 | 12,974 | 11,327 | 25,037 | 864 | 11,752 | 9,812 | 22,428 |
| Total liabilities | 154 | 1,597 | 8 | 1,759 | 260 | 1,590 | 12 | 1,862 |
| Total income | 142 | 454 | 839 | 1,435 | 260 | 396 | 1,554 | 2,210 |
| Result from continuing operations | 41 | 1,062 | 831 | 1,934 | 41 | 839 | 1,545 | 2,425 |
| Total comprehensive income | 38 | 1,025 | 831 | 1,894 | 44 | 839 | 1,545 | 2,428 |
The total assets of the real estate equity funds consist primarily of investment property, € 12,408 million (2024: € 11,287 million) and € 11,245 million (2024: € 9,750 million) of the total assets of the other equity funds consist of equities.
The interest in the real estate equity funds are as follows:
Investments in real estate equity funds
| 31 December 2025 | 31 December 2024 | |
|---|---|---|
| ASR DPRF | 587 | 588 |
| ASR DCRF | 1,055 | 1,000 |
| ASR DFLF | 1,904 | 1,748 |
| ASR DMOF | 148 | 149 |
| ASR DSPF | 168 | - |
| Amvest RCF | 1,097 | 1,012 |
| Amvest LCF | 307 | 278 |
| Total | 5,265 | 4,775 |
7.5.5 Investments
See accounting policy E.
Investments
| 31 December 2025 | 31 December 2024 | |
|---|---|---|
| At FVTPL | 73,966 | 75,119 |
| At FVOCI | 2,638 | 2,841 |
| At amortised cost | 2,537 | 2,633 |
| Total investments | 79,141 | 80,593 |
7.5.5.1 Investments at FVTPL
Investments at FVTPL
| 31 December 2025 | 31 December 2024 | |
|---|---|---|
| Financial investments - own risk | ||
| Real estate equity funds | 6,102 | 5,428 |
| Mortgage equity funds | 2,043 | 2,031 |
| Debt equity funds | - | 639 |
| Government bonds | 16,263 | 15,774 |
| Corporate bonds | 10,696 | 10,621 |
| Asset-backed securities | 2,162 | 3,023 |
| Other investment funds | 2,532 | 2,068 |
| Equities | 913 | 553 |
| Mortgage loans | 24,821 | 25,398 |
| Private loans | 8,433 | 9,584 |
| Total investments at FVTPL | 73,966 | 75,119 |
Investments at FVTPL mainly decreased as a result of higher interest rates, exchange rate impacts and redemptions on investments.
In 2025, next to the annual update of the parameters used in the mortgage valuation models, a.s.r. processed several updates in the mortgage valuation models, which are considered a change in estimate. The mortgage spread model is updated in line with industry standards that were published in 2025, reducing the volatility of the mortgage spreads used in the valuation. For prepayments, the model is refined and parameters were updated. Total impact of the update on the mortgage valuation model and parameter update is a reduction of the fair value of mortgages of € 165 million, which had a negative impact on earnings before tax of the same amount.
For the real estate equity funds for which a.s.r. has significant influence the exemption of IAS 28 was used, thereby measuring the investments at FVTPL and presenting them as a separate category within the investments at FVTPL. For a breakdown of the real estate equity funds, see section 7.5.4.
Other investment funds consist amongst others of private debt funds of € 1,136 million (2024: € 629 million) and private equity funds of € 590 million (2024: € 358 million). In 2025, debt equity funds are reclassified to other investment funds following the integration of Aegon life's investments towards a.s.r.'s target system for investments.
Private loans consists for € 2,558 million (2024: € 2,199 million) of savings-linked mortgage loans.
a.s.r. has bonds amounting to € 3,226 million (2024: € 3,427 million) and shares amounting to nil (2024: € 10 million) that have been transferred, but do not qualify for derecognition. The majority of these investments are part of a securities lending programme whereby the investments are lent in exchange for a fee with collateral obtained as a security. The collateral furnished as security representing a fair value of € 4,451 million (2024: € 4,925 million) consists of mortgage loans and corporate and government bonds. See accounting policy N about securities lending.
At year-end 2025 and 2024, debt instruments at FVTPL consisted entirely of investments mandatorily measured as such.
Based on their contractual maturity, an amount of € 59,987 million (2024: € 58,171 million) of fixed income investments is expected to be recovered after more than one year after the balance sheet date. For assets without a contractual maturity date, it is expected that they will be recovered after more than one year after the balance sheet date.
For more detailed information about the fair value valuation of the investments, see section 7.7.1.
7.5.5.2 Investments at FVOCI
Investments at FVOCI
| 31 December 2025 | 31 December 2024 | |
|---|---|---|
| Equities | 2,491 | 2,696 |
| Preference shares | 135 | 134 |
| Other participating contracts | 12 | 11 |
| Total investments at FVOCI | 2,638 | 2,841 |
a.s.r. sold equity instruments held at FVOCI for an amount of € 1,086 million (2024: € 1,218 million) in the ordinary course of business. The sales resulted in a gain of € 53 million (2024: € 156 million gain) which is directly recognised in retained earnings. The decrease was partly offset by acquisitions and positive fair value movements.
For assets without a contractual maturity date, it is expected that they will be recovered after more than one year after the balance sheet date.
7.5.5.3 Investments at amortised cost
Investments at amortised cost
| 31 December 2025 | 31 December 2024 | |
|---|---|---|
| Mortgage loans | 2,529 | 2,624 |
| Private loans | 8 | 9 |
| Total investments at amortised cost | 2,537 | 2,633 |
Certain mortgage loans shown within the category investments at amortised cost are designated in portfolio fair value interest rate hedging relationships, and are fair valued with respect to the hedged interest rate. For 2025, this resulted in a higher carrying value of € 17 million (2024: € 109 million higher). None of the financial assets has been reclassified during the financial year.
Based on their contractual maturity, an amount of € 2,459 million (2024: 2,432 million) of debt instruments is expected to be recovered after more than one year after the balance sheet date. For assets without a contractual maturity date, it is expected that they will be recovered after more than one year after the balance sheet date.
7.5.6 Investments related to direct participating insurance contracts
See accounting policy E.
Investments related to direct participating insurance contracts
| 31 December 2025 | 31 December 2024 | |
|---|---|---|
| Real estate equity funds | 1,057 | 243 |
| Mortgage equity funds | - | 352 |
| Debt equity funds | - | 18 |
| Government bonds | 6,630 | 6,373 |
| Corporate bonds | 3,702 | 3,375 |
| Asset-backed securities | 527 | 333 |
| Other investment funds | 959 | 896 |
| Derivatives | -411 | 73 |
| Equities | 16,028 | 16,078 |
| Mortgage loans | 1,753 | 1,421 |
| Private loans | 241 | 245 |
| Other investments | 2,815 | 3,617 |
| Total investments related to direct participating insurance contracts | 33,302 | 33,025 |
Investments related to direct participating insurance contracts are mandatorily measured at FVTPL.
In 2025, a.s.r. harmonised the presentation of investments related to direct participating insurance contracts. Following this harmonisation, investments in mortgage equity funds are presented as mortgage loans.
Within other investments, an amount of € 2,242 million (2024: € 2,486 million) consists of cash and cash equivalents held within investment funds.
Direct participating insurance contracts are managed on behalf of policyholders on a fair value basis. Although individual instruments may (or may not) have a maturity depending on their nature, this does not impact the liquidity position of a.s.r.
7.5.7 Derivatives
See accounting policy E.
Derivatives
| 31 December 2025 | 31 December 2024 | |||
|---|---|---|---|---|
| Asset | Liability | Asset | Liability | |
| Derivatives not designated in a hedge | 15,598 | 15,206 | 11,534 | 8,438 |
| Derivatives designated as fair value hedges | 307 | 247 | 233 | 228 |
| Total | 15,905 | 15,453 | 11,767 | 8,666 |
Derivatives consist primarily of derivatives used to hedge interest rate movements. Derivatives are classified mandatorily as FVTPL and changes in the fair value of derivatives at FVTPL are recorded in net fair value gains and (losses), see section 7.6.5.
Derivatives held for mortgage loans of Aegon hypotheken to hedge the interest rate risk are designated under fair value hedge accounting using the EU carve-out on hedge accounting, only net accounting ineffectiveness has an impact on the net result (for more information, see below under hedge accounting).
a.s.r. trades both cleared and non-cleared derivatives on the basis of standardised contracts and exchanges cash variation margin with its counterparties. The derivatives are valued daily and cash collateral is exchanged to reflect the change in mark-to-market (MtM) of the derivatives. Because of this periodic margining process, counterparty risk on derivatives is negligible.
In addition to the above variation margin obligations, there is also an initial margin obligation for central cleared derivatives which further reduces the risk of a.s.r. and its counterparties that they cannot fulfil their obligations.
Notional amounts are not recognised as assets or liabilities in the balance sheet, however notional amounts are used in determining the fair value of the derivatives. Notional amounts do not reflect the potential gain or loss on a derivative transaction.
Derivatives by type of instrument
| 31 December 2025 | 31 December 2024 | |||||
|---|---|---|---|---|---|---|
| Asset | Liability | Notional amount | Asset | Liability | Notional amount | |
| Foreign exchange contracts | 24 | 38 | 5,068 | 46 | 189 | 4,172 |
| Interest rate contracts | ||||||
| - Swaps | 14,722 | 14,999 | 265,404 | 10,644 | 8,334 | 230,555 |
| - Options | 700 | 163 | 10,211 | 704 | 49 | 8,266 |
| - Futures | 10 | - | 2,446 | 52 | 3 | 4,340 |
| - Caps | 152 | 152 | 2,874 | - | - | - |
| Inflation linked swaps | 250 | 75 | 5,776 | 277 | 37 | 2,724 |
| Equity index contracts | 47 | 27 | 8,476 | 44 | 55 | 11,246 |
| Total derivatives | 15,905 | 15,453 | 300,255 | 11,767 | 8,666 | 261,302 |
Net derivatives decreased primarily as a result of negative revaluations due to changes in the long-term interest swap rates compared to year-end 2024. In 2025, following the integration of Aegon life's derivatives portfolio towards a.s.r.'s target system for investments, presentation of accrued interest receivable and accrued interest payable on interest swaps is harmonised, resulting in an increase in the carrying amount of interest swaps of both the asset side as well as the liability side for the same amount.
Interest caps are part of the structured entities related to securitisation of mortgages (see section 7.5.17). In 2025, following the integration of the Saecure entities in a.s.r.'s target system for investments, presentation of these back to back caps is updated and the caps are presented as separate assets and liabilities for the same amount.
The derivatives do not include the derivatives liabilities relating to direct participating insurance contracts of € - 411 million (2024: € 73 million assets).
In addition to the use of swaps and options a.s.r. manages interest rate risk by using bond forwards, included in interest rate contracts futures.
The notional amounts of both receiver and payer swaps are included in the total notional amounts of foreign exchange contracts.
The fair value of interest rate contracts is calculated by first determining the cash flows of the floating leg based on the Euribor-curve corresponding the interest reset period (3 months, 6 months or 12 months) of the swap. Then the net present value of the floating and fixed leg is determined by discounting the cash flows with the relevant curve (such as €STR, SOFR and SONIA).
The fair value of the interest rate contracts using the above valuation method form the basis for the amount of collateral that is exchanged between a.s.r. and its counterparties in accordance with the underlying contracts. For more information see section 7.8 on risk management.
Derivative assets of € 13,721 million assets (2024: € 10,323 million) and derivative liabilities € 13,583 million liabilities (2024: € 7,455 million) are expected to be recovered or settled more than one year after the balance sheet date.
Hedge accounting
Macro fair value hedge accounting under the EU carve-out is applied by Aegon hypotheken and Knab (till date of disposal in 2024).
Derivatives designated as fair value hedges
| 2025 | 2024 | |
|---|---|---|
| Fair value changes mortgage loans recognised in profit or loss under EU carve-out | -75 | 46 |
| Offset amount of fair value changes recognised on derivatives used as hedging instrument | 78 | -44 |
| Total accounting ineffectiveness under EU carve-out recognised in profit or loss | 3 | 2 |
7.5.8 Deferred taxes
Deferred taxes
| 31 December 2025 | 31 December 2024 | |
|---|---|---|
| Deferred tax assets | 36 | 101 |
| Net deferred tax | 36 | 101 |
Deferred taxes represent the difference between the carrying amount of assets and liabilities and their tax base at the enacted tax rate, taking into account tax-exempt components. The current tax rate is 25.8% (2024: 25.8%). The deferred taxes are calculated with the enacted tax rate of 25.8%.
For subsidiaries outside the fiscal unity the unused tax losses for which no deferred tax has been recognised amount to € 22 million (2024: € 28 million). These unused tax losses include expected losses which are already provided for.
Deferred tax assets and liabilities are expected to be recovered more than one year after the balance sheet date.
Changes in deferred taxes
| 1 January 2025 | Changes recognised in profit or loss | Changes recognised in other comprehensive income | Changes in composition of the group | 31 December 2025 | |
|---|---|---|---|---|---|
| Intangible assets | -85 | 21 | -7 | -29 | -100 |
| Property, plant and equipment | 8 | -21 | 5 | -12 | -20 |
| Investment property | -843 | 103 | 236 | - | -504 |
| Investments | -24 | 326 | -269 | - | 32 |
| Financial assets held for trading | -657 | 608 | - | - | -49 |
| Liabilities arising from insurance contracts | 2,093 | -1,155 | - | - | 937 |
| Employee benefits | -252 | 53 | -48 | - | -248 |
| Amounts received in advance | -97 | 97 | - | - | - |
| Fiscal reserves | -57 | 9 | - | - | -47 |
| Tax losses carry forward | - | - | - | 1 | 1 |
| Other | 13 | 1 | 6 | 12 | 33 |
| Net deferred tax | 101 | 41 | -77 | -28 | 36 |
Changes in deferred taxes
| 1 January 2024 | Changes recognised in profit or loss | Changes recognised in other comprehensive income | Changes in composition of the group | 31 December 2024 | |
|---|---|---|---|---|---|
| Intangible assets | -83 | -3 | 2 | -1 | -85 |
| Property, plant and equipment | 4 | 6 | -2 | - | 8 |
| Investment property | -707 | -136 | - | - | -843 |
| Investments | 549 | -297 | -59 | -217 | -24 |
| Financial assets held for trading | -219 | -556 | - | 118 | -657 |
| Liabilities arising from insurance contracts | 1,470 | 623 | - | - | 2,093 |
| Employee benefits | -180 | -33 | -39 | - | -252 |
| Amounts received in advance | -78 | -19 | - | - | -97 |
| Fiscal reserves | -60 | 3 | - | - | -57 |
| Other | -61 | -36 | - | 110 | 13 |
| Net deferred tax | 636 | -448 | -97 | 10 | 101 |
In 2025, the decrease in the deferred tax asset is mainly caused by the changes to the tax base of the technical provisions and their related assets. Changes in the composition of the group relates to the acquisition of HumanTouch Holding and other acquisitions within the Distribution & Services segment, see section 7.4.5.
7.5.9 Other assets
See accounting policy R.
Other assets
| 31 December 2025 | 31 December 2024 | |
|---|---|---|
| Financial assets | ||
| Due from customers | 103 | 72 |
| Other receivables | 670 | 666 |
| Impairments | -13 | -25 |
| Cash collateral paid | 4,723 | 2,341 |
| 5,483 | 3,053 | |
| Non-financial assets | ||
| Taxes receivable | 37 | 175 |
| Prepaid costs | 7 | 10 |
| Property developments | 12 | 18 |
| Other non-financial assets | 57 | 67 |
| 113 | 270 | |
| Total other assets | 5,596 | 3,323 |
Cash collateral paid increased by € 2.4 billion as a result of higher derivative liabilities, mainly driven by rising interest rates. For more information regarding derivatives see section 7.5.7.
An amount of € 5,585 million (2024: € 3,312 million) of other assets is expected to be recovered within one year after the balance sheet date.
The following table shows the recognized impairments on other assets.
Impairments
| 2025 | 2024 | |
|---|---|---|
| At 1 January | -25 | -34 |
| Increase in impairment through profit and loss | -5 | -2 |
| Reversal of impairment through profit and loss | 6 | 1 |
| Reversal of impairment due to disposal | - | 9 |
| Other | 11 | - |
| At 31 December | -13 | -25 |
7.5.10 Cash and cash equivalents
See accounting policy S.
Cash and cash equivalents
| 31 December 2025 | 31 December 2024 | |
|---|---|---|
| Cash and bank balances | 1,769 | 2,228 |
| Short-term deposits | 220 | 336 |
| Money market investments | 720 | 1,629 |
| Total cash and cash equivalents | 2,709 | 4,194 |
All cash and cash equivalents are freely available. The cash components include no cash related to cash collateral on derivative instruments (2024: € 2,663 million).
Interest expenses on cash collateral is mainly based on €STR (2024: €STR).
7.5.11 Equity
See accounting policy T.
7.5.11.1 Share capital
Share capital
| 31 December 2025 | 31 December 2024 | |||
|---|---|---|---|---|
| Number of Shares (in millions) | Amounts (in € millions) | Number of Shares (in millions) | (Amount (in € millions) | |
| Ordinary shares | ||||
| - Authorised capital; par value of € 0.16 | 325 | 52 | 325 | 52 |
| - Of which unsubscribed | 116 | 19 | 114 | 18 |
| Subscribed and paid-up capital | 209 | 33 | 211 | 34 |
| Preference shares | ||||
| - Authorised capital; par value of € 0.16 | 325 | 52 | 325 | 52 |
| - Of which unsubscribed | 325 | 52 | 325 | 52 |
| Subscribed and paid-up capital | - | - | - | - |
In 2025, share capital decreased to € 33 million (2024: € 34 million) due to the cancellation of 2,213 thousand treasury shares, as approved at the Annual General Meeting of the Shareholders on 21 May 2025, see section 7.5.11.5.
7.5.11.2 Share premium reserve
In 2025, the share premium reserve decreased by € 43 million due to the cancellation of 2,213 thousand treasury shares, as approved at the Annual General Meeting of the Shareholders on 21 May 2025, see section 7.5.11.5.
In 2024, there were no changes in the share premium reserve.
7.5.11.3 Unrealised gains and losses recorded in equity
Unrealised gains and losses recorded in equity
| 31 December 2025 | 31 December 2024 | |||||
|---|---|---|---|---|---|---|
| Investments at FVOCI | Revaluation of property in own use and plants | Total | Investments at FVOCI | Revaluation of property in own use and plants | Total | |
| Gross unrealised gains and losses | 529 | 61 | 590 | 476 | 56 | 532 |
| Related tax | -90 | -16 | -106 | -86 | -14 | -100 |
| Total unrealised gains and losses recorded in equity | 439 | 45 | 484 | 390 | 42 | 432 |
7.5.11.4 Actuarial gains and losses
The balance of actuarial gains and losses related to the pension obligation increased in 2025 by € 135 million after tax and € 182 million before tax. (2024: increased by € 113 million after tax and € 152 million before tax). The increase is mainly due to an increase in the discount rate (see section 7.5.15). Remeasurement of post-employment benefits other than pensions increased by € 2 million after tax (2024: nil).
7.5.11.5 Treasury shares
In February 2025, a.s.r. announced a share buyback programme for the amount of € 125 million. The repurchase was completed on May 6, 2025. Therefore, during the period from 20 February 2025 through 6 May 2025, a.s.r. repurchased 2,404 thousand shares under an open market share buyback programme for an amount of € 125 million (average share price € 52.00).
In the Annual General Meeting of the Shareholders on 21 May 2025 the resolution was adopted to cancel 2,213 thousand shares which were acquired in 2024. The cancellation was effected in July 2025. In 2024, no shares were cancelled.
In June 2025, a.s.r. announced a share buyback programme for 300 thousand shares related to the employee share purchase plan. Therefore, during the period from 16 June 2025 through 16 July 2025, a.s.r. repurchased 300 thousand shares under an open market share buyback programme for an amount of € 17 million (average share price € 55.91).The repurchase was completed on July 16, 2025.
In September 2025, a.s.r. participated in the partial selldown of Aegon Ltd.'s position in a.s.r. a.s.r. repurchased 1,875 thousand shares related to the accelerated bookbuild of Aegon Ltd. for an amount of € 105 million (average share price € 56.00), see section 7.7.4. a.s.r.'s participation in this first selldown by Aegon Ltd. is supplementary to a.s.r.'s existing share buyback program of € 525 million for the 2024-2026 plan period. a.s.r. will seek approval from the General Meeting of Shareholders on 20 May 2026 to cancel the repurchased shares.
As part of the employee share purchase plan a.s.r. sold 235 thousand shares (2024: 268 thousand shares) for an amount of € 11 million (2024: € 9 million). For more information on the employee share purchase plan, see section 7.7.6.
The amount of treasury shares held at year-end of € 245 million (2024: € 109 million) represents 4,555 thousand treasury shares (2024: 2,425 thousand).
7.5.11.6 Other equity instruments
Other equity instruments
| 2025 | 2024 | Coupon date | First possible redemption date | |
|---|---|---|---|---|
| Hybrid Tier 2 instrument 5% fixed interest | - | - | Annually with effect from 30 September 2015 | 30 September 2024 |
| Restricted Tier 1 instrument 4.625% fixed interest | 507 | 507 | Semi-annually with effect from 19 April 2018 | 19 October 2027 |
| Restricted Tier 1 instrument 6,625% fixed interest | 500 | 500 | Semi-annually with effect from 27 March 2024 | 27 December 2031 |
| Restricted Tier 1 instrument 6,5% fixed interest | 500 | - | Semi-annually with effect from 2 April 2025 | 2 October 2035 |
| Total other equity instruments | 1,507 | 1,007 |
The Tier 1 and Tier 2 instruments bear discretionary interest and have no maturity date, but can be redeemed at the option of a.s.r. on any coupon due date from the above-mentioned possible redemption dates.
The Tier 1 and Tier 2 instruments have subordination provisions, rank junior to all other liabilities and senior to only shareholder's equity. The conditions of the securities contain certain provisions for optional and required coupon payment deferral and mandatory coupon payment events.
The coupon payments in respect of the Tier 1 and Tier 2 instruments are deductible for tax purposes.
In April 2025, a.s.r. issued € 500 million perpetual subordinated restricted Tier 1 capital securities priced with a fixed rate coupon of 6.5% per annum (payable semi-annually) until 2 October 2035 (the 'first reset date'). The new issue is first callable at par during the six months period up to the first reset date and on each interest payment thereafter.
Distributed amounts to holders of equity instruments as discretionary interest
| 2025 | 2024 | |
|---|---|---|
| Hybrid Tier 2 instrument 5% fixed interest | - | 15 |
| Restricted Tier 1 instrument 4.625% fixed interest | 23 | 23 |
| Restricted Tier 1 instrument 6,625% fixed interest | 33 | 25 |
| Restricted Tier 1 instrument 6,5% fixed interest | 16 | - |
| Total distributed amounts | 73 | 63 |
The Tier 1 and Tier 2 instruments are classified as equity as there is no requirement to settle the obligation in cash or another financial asset or to exchange financial assets or financial liabilities under conditions that are potentially unfavourable for a.s.r.
7.5.11.7 Earnings per share
Basic earnings per share at year-end
| 2025 | 2024 | |
|---|---|---|
| Net result from continuing operations | 476 | 1,015 |
| Net result from discontinued operations | - | -121 |
| Net result attributable to holders of ordinary shares for calculating the earnings per ordinary share | 476 | 895 |
| Weighted average number of ordinary shares in issue | 206,443,522 | 210,798,737 |
| Basic earnings per ordinary share from continuing operations (in euros) | 2.30 | 4.82 |
| Basic earnings per ordinary share from discontinued operations (in euros) | - | -0.57 |
| Basic earnings per ordinary share (in euros) | 2.30 | 4.24 |
Diluted earnings per share at year-end
| 2025 | 2024 | |
|---|---|---|
| Net result attributable to holders of ordinary shares | 476 | 1,015 |
| - effect of Restricted Tier 1 capital instrument | 17 | 17 |
| Adjusted net result from continuing operations | 493 | 1,032 |
| Net result from discontinued operations | - | -121 |
| Adjusted net result attributable to holders of ordinary shares for calculating the diluted earnings per ordinary share | 493 | 912 |
| Weighted average number of ordinary shares in issue | 206,443,522 | 210,798,737 |
| Weighted average number of ordinary shares resulting from conversion of bonds Restricted Tier 1 | 21,645,022 | 21,645,022 |
| Weighted average number of shares used to calculate the diluted earnings per ordinary share | 228,088,544 | 232,443,759 |
| Diluted earnings per ordinary share from continuing operations (in euros) | 2.16 | 4.44 |
| Diluted earnings per ordinary share from discontinued operations (in euros) | - | -0.52 |
| Diluted earnings per ordinary share (in euros) | 2.16 | 3.92 |
Net result in the table is after tax and non-controlling interests.
For additional information related to net result, see section 7.2.2.
7.5.12 Subordinated liabilities
See accounting policy U.
Subordinated liabilities
| Nominal amount | Carrying value 2025 | Carrying value 2024 | |
|---|---|---|---|
| Hybrid Tier 2 instrument 5.125% fixed interest | - | - | 506 |
| Hybrid Tier 2 instrument 3.375% fixed interest | 500 | 508 | 508 |
| Hybrid Tier 2 instrument 7.000% fixed interest | 1,000 | 994 | 993 |
| Total subordinated liabilities | 1,500 | 1,503 | 2,007 |
In 2015, a.s.r. issued € 500 million subordinated liabilities in the form of Tier 2 notes, and maturing on 29 September 2045. The coupon was fixed at 5.125% and paid annually on 29 September with a step up at the first call date. In March 2025, holders of the notes were offered to tender their notes for cash in accordance with the terms and conditions as set out in the Tender Offer Memorandum. The Tender Offer also provided noteholders with the opportunity to sell their current holdings in the hybrid Tier 2 instrument and to apply for priority in the allocation of the subordinated restricted Tier 1 capital securities, see section 7.5.11.6. As a result, the carrying value of the subordinated liabilities decreased by € 412 million, settled on 4 April 2025. On 29 September 2025, the remaining outstanding notes with a principal amount of € 88 million were redeemed in full at their principal amount.
In 2019 a.s.r. issued € 500 million subordinated liabilities in the form of Tier 2 notes. The bond has a maturity date of 2049 and is first callable 3 months before the first reset date of 2 May 2029. The coupon is fixed at 3.375% and paid annually on 2 May. After the reset date the interest is calculated based on the 5 Year Mid Swap Rate plus a margin of 4.000 % and updated once every five years.
In 2022 a.s.r. issued € 1 billion subordinated liabilities, qualified as Tier 2 notes, to partially finance the business combination with Aegon NL. The Tier 2 notes have a maturity date of 2043 and are first callable on 7 December 2033. The coupon is fixed at 7.000% and paid annually on 7 December.
These notes are subordinated and ranking equally without any preference amongst themselves and (a) junior to the claims of all senior creditors of a.s.r., (b) equally with any parity obligations and (c) in priority to claims in respect of (i) any equity securities and (ii) any junior obligations.
The subordinated liabilities are classified as liabilities given the obligation to settle the loans and pay the coupon. They are considered Tier 2 own funds for regulatory purposes.
7.5.13 Insurance contract liabilities and reinsurance contract assets
See accounting policy F.
Insurance and reinsurance contracts
| Assets | Liabilities | |||
|---|---|---|---|---|
| 31 December 2025 | 31 December 2024 | 31 December 2025 | 31 December 2024 | |
| Non-life - GMM | - | - | 6,161 | 5,713 |
| Non-life - PAA | - | - | 2,133 | 1,992 |
| Non-life insurance contracts | - | 8,294 | 7,705 | |
| - | ||||
| Life - GMM | - | - | 54,956 | 56,443 |
| Life insurance contracts | - | - | 54,956 | 56,443 |
| Pre-recognition cash flows | - | - | 61 | 52 |
| Total insurance contracts | - | - | 63,312 | 64,200 |
| Non-life - GMM | 128 | 201 | - | - |
| Non-life - PAA | 78 | 82 | - | - |
| Life - GMM | 146 | 205 | - | - |
| Life - PAA | - | 3 | - | - |
| Total reinsurance contracts | 351 | 491 | - | - |
Pre-recognition cash flows consists of prepaid premiums for insurance contracts not yet recognised.
The tables in the following paragraphs show the movements in insurance contract balances for the different measurement models.
7.5.13.1 Insurance contracts - Non-life
Changes in insurance contracts by remaining coverage and incurred claims current year GMM and PAA
| Liabilities for remaining coverage | Liabilities for incurred claims | Total | ||||
|---|---|---|---|---|---|---|
| Contracts measured under PAA | ||||||
| Excluding loss component | Loss component | Contracts measured under GMM | Estimates of the present value of the future cash flows | Risk adjustment for non-financial risk | ||
| At 1 January 2025 | 2,058 | 25 | 3,492 | 2,059 | 71 | 7,705 |
| Changes in the income statement | ||||||
| Insurance contract revenue from contracts measured under GMM, of which: | -2,019 | - | - | - | - | -2,019 |
| Contracts recognised from transition date and retrospective approach | -1,691 | - | - | - | - | -1,691 |
| Contracts under the modified retrospective approach | - | - | - | - | - | - |
| Contracts under the fair value approach | -329 | - | - | - | - | -329 |
| Insurance contract revenue from contracts measured under PAA | -3,918 | - | - | - | - | -3,918 |
| Insurance service expenses | ||||||
| New incurred claims and benefits | - | -51 | 1,657 | 2,952 | 22 | 4,579 |
| Changes related to past services | - | - | -7 | -60 | -19 | -86 |
| Losses and reversals of losses on onerous contracts | - | 70 | - | - | - | 70 |
| Claims and benefits | - | 18 | 1,650 | 2,891 | 3 | 4,562 |
| Amortisation of insurance acquisition cash flows | 23 | - | - | - | - | 23 |
| Other insurance service operating expenses | - | - | 294 | 754 | - | 1,048 |
| Insurance service operating expenses | 23 | - | 294 | 754 | - | 1,071 |
| Total insurance service expenses | 23 | 18 | 1,944 | 3,645 | 3 | 5,633 |
| Insurance service result | -5,914 | 18 | 1,944 | 3,645 | 3 | -304 |
| Net finance expenses (income) from insurance contracts | 37 | - | 67 | 55 | 1 | 162 |
| Total changes in the income statement | -5,877 | 18 | 2,011 | 3,701 | 4 | -142 |
| Cash flows | ||||||
| Premiums received | 5,920 | - | - | - | - | 5,920 |
| Insurance service expenses paid, including investment components | -551 | - | -1,581 | -3,031 | - | -5,163 |
| Insurance acquisition cash flows | -37 | - | - | - | - | -37 |
| Total cash flows | 5,332 | - | -1,581 | -3,031 | - | 720 |
| Other | 11 | - | - | - | - | 11 |
| Transfer prepaid insurance service expenses from LRC to LIC | 550 | - | - | -550 | - | - |
| At 31 December 2025 | 2,074 | 44 | 3,922 | 2,178 | 76 | 8,294 |
Changes in insurance contracts by remaining coverage and incurred claims prior year GMM and PAA
| Liabilities for remaining coverage | Liabilities for incurred claims | Total | ||||
|---|---|---|---|---|---|---|
| Contracts measured under PAA | ||||||
| Excluding loss component | Loss component | Contracts measured under GMM | Estimates of the present value of the future cash flows | Risk adjustment for non-financial risk | ||
| At 1 January 2024 | 2,071 | 29 | 3,023 | 1,975 | 68 | 7,165 |
| Changes in the income statement | ||||||
| Insurance contract revenue from contracts measured under GMM, of which: | -2,046 | - | - | - | - | -2,046 |
| Contracts recognised from transition date and retrospective approach | -990 | - | - | - | - | -990 |
| Contracts under the modified retrospective approach | -465 | - | - | - | - | -465 |
| Contracts under the fair value approach | -591 | - | - | - | - | -591 |
| Insurance contract revenue from contracts measured under PAA | -3,567 | - | - | - | - | -3,567 |
| Insurance service expenses | ||||||
| New incurred claims and benefits | - | -29 | 1,536 | 2,655 | 20 | 4,182 |
| Changes related to past services | - | - | 49 | -65 | -22 | -38 |
| Losses and reversals of losses on onerous contracts | - | 24 | - | - | - | 24 |
| Claims and benefits | - | -5 | 1,585 | 2,590 | -2 | 4,168 |
| Amortisation of insurance acquisition cash flows | 24 | - | - | - | - | 24 |
| Other insurance service operating expenses | - | - | 298 | 738 | - | 1,036 |
| Insurance service operating expenses | 24 | - | 298 | 738 | - | 1,061 |
| Total insurance service expenses | 24 | -5 | 1,883 | 3,328 | -2 | 5,229 |
| Insurance service result | -5,589 | -5 | 1,883 | 3,328 | -2 | -385 |
| Net finance expenses (income) from insurance contracts | 107 | 1 | 90 | 72 | 3 | 273 |
| Total changes in the income statement | -5,482 | -4 | 1,973 | 3,400 | 1 | -112 |
| Cash flows | ||||||
| Premiums received | 5,579 | - | - | - | - | 5,579 |
| Insurance service expenses paid, including investment components | -527 | - | -1,504 | -2,866 | - | -4,897 |
| Insurance acquisition cash flows | -30 | - | - | - | - | -30 |
| Total cash flows | 5,021 | - | -1,504 | -2,866 | - | 651 |
| Other | -78 | - | - | 75 | 2 | - |
| Transfer prepaid insurance service expenses from LRC to LIC | 526 | - | - | -526 | - | - |
| At 31 December 2024 | 2,058 | 25 | 3,492 | 2,059 | 71 | 7,705 |
In 2025, a.s.r. implemented a voluntary change in accounting policy regarding the treatment of incurred claims that remain subject to future insurance risk within the Individual Disability portfolio, see section 7.3.2.1. As a result, amounts previously recognised as liabilities for incurred claims have been reclassified to liabilities for remaining coverage. As at 31 December 2024, liabilities for remaining coverage excluding loss component have increased by € 1,658 million (from € 400 million to € 2,058 million) and at the same time liabilities for incurred claims of contracts measured under GMM have decreased by € 1,728 million (from € 5,220 million to € 3,492 million). The impact on the opening balance as at 1 January 2024 is of a comparable magnitude. This reclassification also affects the measurement of the CSM, related experience adjustments (linked to current and past services) are recognised in the CSM rather than in the insurance service result.
In 2024, other relates to the transfer of the Aegon P&C acquired claims portfolio from GMM to PAA, so that the complete P&C portfolio would fall under the PAA model. This could be done due to the very limited CSM that was remaining on this portfolio at the moment of the transfer (€ 1 million early release to the insurance contract revenue).
Changes in insurance contracts measured under GMM, by measurement component current year
| Estimates of the present value of the future cash flows | Risk adjustment for non-financial risk | CSM | Total | |||
|---|---|---|---|---|---|---|
| Total | Of which, contracts recognised from transition date and retrospective approach | Of which contracts under fair value approach | ||||
| At 1 January 2025 | 5,271 | 215 | 226 | 162 | 65 | 5,713 |
| Changes in the income statement | ||||||
| Changes that relate to future services: | ||||||
| - Changes in estimates that adjust the CSM | -14 | -16 | 30 | 15 | 14 | - |
| - Changes in estimates that result in losses or the reversal of losses on onerous contracts | 45 | -2 | 3 | 3 | - | 46 |
| - Effects of contracts initially recognised in the period | -88 | 31 | 74 | 74 | - | 17 |
| Changes that relate to current services: | ||||||
| - CSM recognised in profit or loss for services provided | - | - | -106 | -98 | -8 | -106 |
| - Release of the risk adjustment for non-financial risk | - | -21 | - | - | - | -21 |
| - Experience adjustments | 22 | 18 | - | - | - | 40 |
| Changes relate to past service | 17 | -23 | - | - | - | -7 |
| Insurance service result | -19 | -14 | 1 | -6 | 7 | -30 |
| Net finance result from insurance contracts | 66 | 30 | 9 | 9 | - | 105 |
| Total changes in the income statement | 47 | 17 | 10 | 3 | 7 | 74 |
| Cash flows | ||||||
| Premiums received | 1,981 | - | - | - | - | 1,981 |
| Insurance service expenses paid | -1,581 | - | - | - | - | -1,581 |
| Insurance acquisition cash flows | -37 | - | - | - | - | -37 |
| Total cash flows | 363 | - | - | - | - | 363 |
| Other | 9 | - | 2 | 11 | -8 | 11 |
| At 31 December 2025 | 5,690 | 232 | 239 | 176 | 63 | 6,161 |
Changes in insurance contracts measured under GMM, by measurement component prior year
| Estimates of the present value of the future cash flows | Risk adjustment for non-financial risk | CSM | Total | |||
|---|---|---|---|---|---|---|
| Total | Of which, contracts recognised from transition date and retrospective approach | Of which contracts under fair value approach | ||||
| At 1 January 2024 | 4,942 | 222 | 198 | 150 | 48 | 5,362 |
| Changes in the income statement | ||||||
| Changes that relate to future services: | ||||||
| - Changes in estimates that adjust the CSM | -17 | -44 | 61 | 35 | 25 | - |
| - Changes in estimates that result in losses or the reversal of losses on onerous contracts | -23 | 13 | - | - | - | -9 |
| - Effects of contracts initially recognised in the period | -109 | 31 | 101 | 101 | - | 23 |
| Changes that relate to current services: | ||||||
| - CSM recognised in profit or loss for services provided | - | - | -143 | -135 | -8 | -143 |
| - Release of the risk adjustment for non-financial risk | - | -25 | - | - | - | -25 |
| - Experience adjustments | -52 | 7 | - | - | - | -45 |
| Changes relate to past service | 46 | 3 | - | - | - | 49 |
| Insurance service result | -154 | -14 | 19 | 2 | 17 | -150 |
| Net finance result from insurance contracts | 178 | 10 | 10 | 10 | - | 198 |
| Total changes in the income statement | 24 | -4 | 29 | 12 | 17 | 49 |
| Cash flows | ||||||
| Premiums received | 1,915 | - | - | - | - | 1,915 |
| Insurance service expenses paid | -1,504 | - | - | - | - | -1,504 |
| Insurance acquisition cash flows | -30 | - | - | - | - | -30 |
| Total cash flows | 381 | - | - | - | - | 381 |
| Other | -75 | -2 | - | - | - | -78 |
| At 31 December 2024 | 5,271 | 215 | 226 | 162 | 65 | 5,713 |
In 2025, a.s.r. implemented a voluntary change in accounting policy regarding the treatment of incurred claims that remain subject to future insurance risk within the Individual Disability portfolio, see section 7.3.2.1. As a result, amounts previously recognised as liabilities for incurred claims have been reclassified to liabilities for remaining coverage and subsequently the contractual service margin decreased by € 66 million as per 31 December 2024 from € 293 million to € 226 million.
In 2024, other relates to the transfer of the Aegon P&C acquired claims portfolio from GMM to PAA, so that the complete P&C portfolio would fall under the PAA model.
7.5.13.2 Insurance contracts - Life
Changes in insurance contracts by remaining coverage and incurred claims current year GMM
| Liabilities for remaining coverage | Liabilities for incurred claims | Total | ||
|---|---|---|---|---|
| Excluding loss component | Loss component | |||
| At 1 January 2025 | 56,025 | 198 | 220 | 56,443 |
| Changes in the income statement | ||||
| Insurance contract revenue of which: | -2,983 | - | - | -2,983 |
| Contracts recognised from transition date and retrospective approach | -2,008 | - | - | -2,008 |
| Contracts under the fair value approach | -975 | - | - | -975 |
| Insurance service expenses | ||||
| New incurred claims and benefits | - | -15 | 2,476 | 2,462 |
| Losses and reversals of losses on onerous contracts | - | -41 | - | -41 |
| Claims and benefits | - | -55 | 2,476 | 2,421 |
| Other insurance service operating expenses | - | - | 122 | 122 |
| Amortisation of insurance acquisition cash flows | 3 | - | - | 3 |
| Insurance service operating expenses | 3 | - | 122 | 124 |
| Total insurance service expenses | 3 | -55 | 2,598 | 2,546 |
| Investment components | -705 | - | 705 | - |
| Insurance service result | -3,685 | -55 | 3,303 | -437 |
| Net finance result from insurance contracts | -2,073 | 3 | - | -2,071 |
| Total changes in the income statement | -5,759 | -52 | 3,303 | -2,508 |
| Cash flows | ||||
| Premiums received | 4,297 | - | - | 4,297 |
| Insurance service expenses paid, including investment components | - | - | -3,301 | -3,301 |
| Insurance acquisition cash flows | -13 | - | - | -13 |
| Total cash flows | 4,284 | - | -3,301 | 983 |
| Other | 33 | 6 | - | 38 |
| At 31 December 2025 | 54,583 | 151 | 222 | 54,956 |
In 2025, premiums received is positively impacted by the effects of pension buy-outs (€ 2.8 billion).
Changes in insurance contracts by remaining coverage and incurred claims prior year GMM
| Liabilities for remaining coverage | Liabilities for incurred claims | Total | ||
|---|---|---|---|---|
| Excluding loss component | Loss component | |||
| At 1 January 2024 | 55,585 | 220 | 258 | 56,063 |
| Changes in the income statement | ||||
| Insurance contract revenue of which: | -2,906 | - | - | -2,906 |
| Contracts recognised from transition date and retrospective approach | -1,972 | - | - | -1,972 |
| Contracts under the fair value approach | -934 | - | - | -934 |
| Insurance service expenses | ||||
| New incurred claims and benefits | - | -15 | 2,443 | 2,428 |
| Losses and reversals of losses on onerous contracts | - | -9 | - | -9 |
| Incurred claims and benefits | - | -25 | 2,443 | 2,419 |
| Other insurance service operating expenses | - | - | 128 | 128 |
| Amortisation of insurance acquisition cash flows | 2 | - | - | 2 |
| Insurance service operating expenses | 2 | - | 128 | 130 |
| Total insurance service expenses | 2 | -25 | 2,571 | 2,549 |
| Investment components | -720 | - | 720 | - |
| Insurance service result | -3,624 | -25 | 3,292 | -357 |
| Net finance result from insurance contracts | 2,412 | 2 | - | 2,414 |
| Total changes in the income statement | -1,212 | -23 | 3,292 | 2,057 |
| Cash flows | ||||
| Premiums received | 1,670 | - | - | 1,670 |
| Insurance service expenses paid, including investment components | - | - | -3,330 | -3,330 |
| Insurance acquisition cash flows | -17 | - | - | -17 |
| Total cash flows | 1,653 | - | -3,330 | -1,677 |
| At 31 December 2024 | 56,025 | 198 | 220 | 56,443 |
For the Life segment the liability remaining coverage includes the incurred claims from certain second order events (for example from future premium waiver at disability or incurred survivor benefits) following the option to account for these events as part of the liability remaining coverage.
Changes in insurance contracts by measurement component current year
| Estimates of the present value of the future cash flows | Risk adjustment for non-financial risk | CSM | Total | |||
|---|---|---|---|---|---|---|
| Total | Of which, contracts recognised from transition date and retrospective approach | Of which, contracts under fair value approach | ||||
| At 1 January 2025 | 50,327 | 1,994 | 4,122 | 3,284 | 838 | 56,443 |
| Changes in the income statement | ||||||
| Changes that relate to future services: | ||||||
| - Changes in estimates that adjust the CSM | -183 | -286 | 470 | 172 | 298 | - |
| - Changes in estimates that result in losses or the reversal of losses on onerous contracts | 27 | -73 | - | - | - | -47 |
| - Effects of contracts initially recognised in the period | -226 | 115 | 117 | 100 | 17 | 6 |
| Changes that relate to current services: | ||||||
| - CSM recognised in profit or loss for services provided | - | - | -266 | -200 | -66 | -266 |
| - Release of the risk adjustment for non-financial risk | - | -132 | - | - | - | -132 |
| - Experience adjustments | 1 | - | - | - | - | 1 |
| Insurance service result | -381 | -377 | 321 | 72 | 249 | -437 |
| Net finance result from insurance contracts | -2,066 | -115 | 111 | 109 | 2 | -2,071 |
| Total changes in the income statement | -2,448 | -492 | 432 | 181 | 250 | -2,508 |
| Cash flows | ||||||
| Premiums received | 4,297 | - | - | - | - | 4,297 |
| Insurance service expenses paid | -3,301 | - | - | - | - | -3,301 |
| Insurance acquisition cash flows | -13 | - | - | - | - | -13 |
| Total cash flows | 983 | - | - | - | - | 983 |
| Other | 24 | - | 14 | -1 | 15 | 38 |
| At 31 December 2025 | 48,886 | 1,502 | 4,568 | 3,465 | 1,103 | 54,956 |
Following approval from the DNB, a.s.r. life applied the PIM in 2025. The introduction of the PIM resulted in a decrease in the risk adjustment and a corresponding increase in the CSM. As a result, in 2025 the release of the risk adjustment decreased by € 30 million, the CSM release increased by € 27 million and the loss component decreased by € 52 million. The primary driver of this impact is the difference between the discount/accretion rate applied to the risk adjustment (based on the actual discount rate) and the rate applied to the CSM (based on the locked‑in discount rate). This rate differential contributed negatively to the insurance finance result by € 94 million. A smaller portion of the total impact relates to onerous groups of insurance contracts, for which part of the loss component recognised in profit or loss in prior years is now reversed.
Further details on the risk adjustment assumption change are provided in section 7.5.13.4.3 Risk Adjustment. The impact of the risk adjustment change on the operating result is disclosed in section 7.10 Operating result.
Changes in insurance contracts by measurement component prior year
| Estimates of the present value of the future cash flows | Risk adjustment for non-financial risk | CSM | Total | |||
|---|---|---|---|---|---|---|
| Total | Of which, contracts recognised from transition date and retrospective approach | Of which, contracts under fair value approach | ||||
| At 1 January 2024 | 50,313 | 2,082 | 3,668 | 3,122 | 545 | 56,063 |
| Changes in the income statement | ||||||
| Changes that relate to future services: | ||||||
| - Changes in estimates that adjust the CSM | -455 | -65 | 520 | 188 | 332 | - |
| - Changes in estimates that result in losses or the reversal of losses on onerous contracts | 4 | -24 | - | - | - | -20 |
| - Effects of contracts initially recognised in the period | -49 | 28 | 31 | 31 | - | 10 |
| Changes that relate to current services: | ||||||
| - CSM recognised in profit or loss for services provided | - | - | -211 | -171 | -40 | -211 |
| - Release of the risk adjustment for non-financial risk | - | -151 | - | - | - | -151 |
| - Experience adjustments | 14 | - | - | - | - | 14 |
| Insurance service result | -486 | -211 | 340 | 49 | 292 | -357 |
| Net finance result from insurance contracts | 2,177 | 123 | 114 | 114 | 0 | 2,414 |
| Total changes in the income statement | 1,690 | -88 | 454 | 162 | 292 | 2,057 |
| Cash flows | ||||||
| Premiums received | 1,670 | - | - | - | - | 1,670 |
| Insurance service expenses paid | -3,330 | - | - | - | - | -3,330 |
| Insurance acquisition cash flows | -17 | - | - | - | - | -17 |
| Total cash flows | -1,677 | - | - | - | - | -1,677 |
| At 31 December 2024 | 50,327 | 1,994 | 4,122 | 3,284 | 838 | 56,443 |
Further details on the risk adjustment changes are provided in section 7.5.13.4.3.
7.5.13.3 Reinsurance contracts - Non-life and Life
Changes in reinsurance contracts by remaining coverage and incurred claims current year
| Assets for remaining coverage | Assets for incurred claims | Total | |||
|---|---|---|---|---|---|
| 2025 | Excluding loss recovery component | Loss recovery component | Estimates of the present value of the future cash flows | Risk adjustment for non-financial risk | |
| At 1 January | 373 | - | 116 | 2 | 491 |
| Changes in the income statement: | |||||
| Allocation of reinsurance premiums paid | -820 | - | - | - | -820 |
| Amounts recoverable from reinsurers | - | - | 724 | 1 | 725 |
| Changes in amounts recoverable arising from changes in assets for incurred claims | - | - | -6 | - | -6 |
| Net expenses from reinsurance contracts | -820 | - | 718 | - | -102 |
| Net finance result from reinsurance contracts | -40 | - | 3 | - | -36 |
| Total changes in the income statement | -860 | - | 721 | - | -138 |
| Cash flows: | |||||
| Premiums paid | 752 | - | - | - | 752 |
| Reinsurance recoveries received | - | - | -739 | - | -739 |
| Total cash flows | 752 | - | -739 | - | 13 |
| Other | -17 | - | 2 | - | -15 |
| At 31 December | 248 | - | 100 | 3 | 351 |
Changes in reinsurance contracts by remaining coverage and incurred claims prior year
| Assets for remaining coverage | Assets for incurred claims | Total | |||
|---|---|---|---|---|---|
| 2024 | Excluding loss recovery component | Loss recovery component | Estimates of the present value of the future cash flows | Risk adjustment for non-financial risk | |
| At 1 January | 392 | - | 123 | 2 | 518 |
| Changes in the income statement: | |||||
| Allocation of reinsurance premiums paid | -679 | - | - | - | -679 |
| Amounts recoverable from reinsurers | - | - | 566 | - | 566 |
| Changes in amounts recoverable arising from changes in assets for incurred claims | - | - | 13 | -1 | 12 |
| Net expenses from reinsurance contracts | -679 | - | 579 | -1 | -101 |
| Net finance result from reinsurance contracts | 21 | - | 5 | - | 26 |
| Total changes in the income statement | -658 | - | 584 | -1 | -75 |
| Cash flows: | |||||
| Premiums paid | 655 | - | - | - | 655 |
| Reinsurance recoveries received | - | - | -607 | - | -607 |
| Total cash flows | 655 | - | -607 | - | 48 |
| Other | -16 | - | 16 | - | -0 |
| At 31 December | 373 | - | 116 | 2 | 491 |
Changes in reinsurance contracts by measurement component current year
| Estimates of the present value of the future cash flows | Risk adjustment for non-financial risk | Contractual service margin | Total | |||
|---|---|---|---|---|---|---|
| 2025 | Total | Of which, contracts recognised from transition date and retrospective approach | Of which, contracts under fair value approach | |||
| At 1 January | -164 | 469 | 100 | 73 | 27 | 406 |
| Changes in the income statement: | ||||||
| Changes that relate to future services | ||||||
| - Changes in estimates that adjust the CSM | 7 | 12 | -19 | -19 | - | - |
| - Effects of contracts initially recognised in the period | -2 | 29 | -27 | -27 | - | - |
| Changes that relate to current services: | ||||||
| - CSM recognised in the income statement for services received | - | - | -3 | -3 | - | -3 |
| - Release of the risk adjustment for non-financial risk | - | -41 | - | - | - | -41 |
| - Experience adjustments | 7 | - | - | - | - | 7 |
| Changes relate to past service | -7 | - | - | - | - | -7 |
| Net expenses from reinsurance contracts | 4 | 1 | -49 | -49 | 1 | -44 |
| Net finance result from reinsurance contracts | 11 | -52 | 3 | 3 | - | -39 |
| Total changes in the income statement | 14 | -52 | -46 | -47 | 1 | -83 |
| Cash flows: | ||||||
| Premiums paid | 634 | - | - | - | - | 634 |
| Reinsurance recoveries received | -666 | - | - | - | - | -666 |
| Total cash flows | -32 | - | - | - | - | -32 |
| Other | 5 | - | -21 | -17 | -4 | -17 |
| At 31 December | -176 | 417 | 33 | 10 | 23 | 274 |
In December 2025, Aegon life has entered into an additional longevity reinsurance contract. The contract reinsures a specified portfolio of insurance contracts of a buy-out against possible future mortality developments. The size of the underlying portfolio is € 1.3 billion. The reinsurer will pay benefits as long as the participants live and receive fixed payments from Aegon life. A net reinsurance asset/liability is recognised in accordance with applicable IFRS requirements, using the general measurement model. See section 7.8.2.1.1on the collateral which has been posted with respect to the contract.
Further details on the RA changes are provided in section 7.5.13.4.3.
Changes in reinsurance contracts by measurement component prior year
| Estimates of the present value of the future cash flows | Risk adjustment for non-financial risk | Contractual service margin | Total | |||
|---|---|---|---|---|---|---|
| 2024 | Total | Of which, contracts recognised from transition date and retrospective approach | Of which, contracts under fair value approach | |||
| At 1 January | -139 | 483 | 93 | 68 | 25 | 437 |
| Changes in the income statement: | ||||||
| Changes that relate to future services | ||||||
| - Changes in estimates that adjust the CSM | -13 | 3 | 10 | 6 | 4 | - |
| - Effects of contracts initially recognised in the period | - | - | - | - | - | - |
| Changes that relate to current services: | ||||||
| - CSM recognised in the income statement for services received | - | - | -6 | -4 | -2 | -6 |
| - Release of the risk adjustment for non-financial risk | - | -41 | - | - | - | -41 |
| - Experience adjustments | -3 | - | - | - | - | -4 |
| Changes relate to past service | - | - | - | - | - | - |
| Net expenses from reinsurance contracts | -16 | -39 | 4 | 3 | 2 | -51 |
| Net finance result from reinsurance contracts | -6 | 25 | 3 | 3 | - | 22 |
| Total changes in the income statement | -22 | -14 | 7 | 5 | 2 | -29 |
| Cash flows: | ||||||
| Premiums paid | 539 | - | - | - | - | 539 |
| Reinsurance recoveries received | -528 | - | - | - | - | -528 |
| Total cash flows | 11 | - | - | - | - | 11 |
| Other | -13 | - | - | - | - | -14 |
| At 31 December | -164 | 469 | 100 | 73 | 27 | 406 |
7.5.13.4 Assumptions used
In estimating the fulfilment cash flows included in the contract boundary, a.s.r. considers the range of all possible outcomes in an unbiased way specifying the amount of cash flows, timing and probability reflecting conditions existing at the measurement date, using a probability-weighted average of all possible scenarios. In determining possible scenarios, a.s.r. uses all the reasonable and supportable information available to them without undue cost and effort, which includes information about past events, current conditions and future forecasts.
The following are key assumptions and methodologies used in the valuation of the insurance liabilities and are discussed in more detail further in this chapter:
actuarial assumptions: addressing mortality and longevity, lapse, cancellation and surrender assumptions and for expenses;
risk adjustment;
discount rate; and
coverage units
7.5.13.4.1 Changes in estimates
Assumptions are reviewed periodically, based on historical experience, observable market data, including market transactions such as acquisitions and reinsurance transactions, anticipated trends and legislative changes. Similarly, the models and systems used for determining our insurance liabilities are reviewed periodically and, if deemed necessary, updated based on emerging best practices and available technology.
The main impacts of model updates and annual update of the non-economic assumptions are the impacts on mortality, expense, spouse age difference , disability and mortgages (see section 7.5.5.1).
Mortality assumption
In 2025, a.s.r. implemented a refinement to the mortality model, enabling the model to absorb large outliers in mortality data between years. With this refinement, the mortality model is able to fully use the Covid-19 years, which were previously not (2020 and 2021) or only partially (2022 till 2024) taken into account. Next to the refinement, the a.s.r. mortality table is updated to the latest available data.
Furthermore, a.s.r. has updated the mortality experience factors models of both Pensions and Individual life & Funeral, applying socio-economic, age- and gender-dependent experience factors in the models.
The updates of the mortality models and assumptions resulted in an increase on the insurance liabilities fulfilment cashflows of € 37 million, decreasing the CSM with € 42 million, and a positive impact on pre-tax earnings of € 5 million, as the updates also had an impact on the loss component. Harmonisation of the experience factors resulted in a reduction of the insurance liabilities fulfilment cashflows of € 137 million, increase of the CSM with € 100 million, and had a positive impact on pre-tax earnings of € 37 million, as the updates also had an impact on the loss component.
Expense assumption
In 2025, a.s.r. implemented several refinements to the maintenance expense methodology, and the parameters used for the maintenance expense reserve were updated. These updates consisted of numerous changes, which in aggregate resulted in a reduction of € 11 million of the insurance liabilities fulfilment cashflows, increasing the CSM with € 18 million. The updates also impact the loss component, leading to a negative impact on pre-tax income of € 7 million.
Spouse age difference assumption
In 2025, a.s.r. updated the methodology within the Pensions business to determine the spouse age difference in case of an unknown spouse. This update resulted in an increase of € 28 million of the insurance liabilities fulfilment cashflows, decreasing the CSM. The updates did not had an impact on the loss component.
Direct method for direct participating insurance contracts
In 2025, a.s.r. harmonised the accounting of direct participating insurance contracts between a.s.r. life and Aegon life, which are accounted for under the VFA method. As a result of the change in methodology from indirect to direct method and harmonisation of the NDIC approach, changes in the fair value of underlying items are accounted for through profit or loss increasing the insurance contract revenue, with a similar effect on insurance service expenses. This impacts disclosures in section 7.4.3, section 7.5.14.1, section 7.5.14.2, section 7.6.1 and section 7.6.2. The change to direct method aligns IFRS with the Solvency II measurement . There is a minor impact on insurance liabilities and pre-tax income in 2025, as the processed change is mostly presentation.
Disability
For the Disability business including inflation, a.s.r. updated the non-economic assumptions, including updates for assumptions for disability percentage and recovery rates, which resulted in a reduction of € 51 million on the insurance liabilities fulfilment cashflows, increasing the CSM. On the liability for incurred claims the update of disability assumptions had a negative impact. Group disability has experienced adverse claims development due to elevated incidence rates, especially related to psychological absenteeism and long COVID. There remains some uncertainty in the incidence rates due to the dependence on external agency UWV for testing or re-testing disabled participants. The impact on pre-tax income in 2025 of all updates is a loss of € 104 million, consisting of € 67 million loss from impact on past services, while € 37 million loss is related to a dotation to the loss component.
Coverage units
a.s.r. has reassessed the defined coverage units applied in all Disability portfolio's (Individual Disability, Group Disability and Sickness leave). This resulted in changes in coverage units and the determination of the release of the CSM. These are non-material changes.
Risk adjustment correction factor
In 2025, update of the risk adjustment correction factor parameter resulted in a total increase on the risk adjustment of € 41 million, decreasing the CSM with the same amount. The updates did not had an impact on the loss component.
7.5.13.4.2 Actuarial assumptions
Cash flow estimates include both market variables directly observed in the market or derived directly from markets and non-market variables, such as mortality and longevity. The best estimate assumptions regarding mortality and longevity include recent trend assumptions for life expectancy in the Netherlands and a.s.r.’s past experience and are generally developed based on a blend of company experience and industry wide studies, taking into consideration product characteristics, own risk selection criteria, the insured population, recent mortality trend assumptions.
Lapse, cancellation and surrender assumptions are non-economic assumptions and reflect the expected policyholder behaviour. As such the rates usually depend on issue year, policy year, major business lines and sales channels. Such granularity is usually enough to capture how the product terms and conditions as well as regulations can influence the timing and volume of lapse and surrenders. Calendar year-based adjustments and dynamic policyholder behaviour are considered when needed in specific circumstances.
Expenses are included in the fulfilment cash flows, when they are directly attributable to insurance contracts and have been allocated to the business lines. These expenses include acquisition expenses, investment expenses related to direct participating contracts as well as overhead costs that a.s.r. considers to be unavoidable when fulfilling the in-force contracts.
7.5.13.4.3 Risk adjustment
The risk adjustment is determined for each portfolio of insurance contracts using a Cost of Capital (CoC) method similar to the risk margin used for reporting under the Solvency II framework. a.s.r. currently uses the Solvency II model to quantify the risks, adjusted for the following points:
Excluding general operational risk;
Excluding market risk (if any);
Excluding reinsurance counterparty default risk;
Added a reinsured risk adjustment by calculating the risk adjustment gross and net of reinsurance;
A CoC rate of 6% is used, diversification effects are applied for disability, taking into account a going concern basis; and
The IFRS 17 discount rate curve is used.
In 2025, DNB approved the PIM for a.s.r. life. Following this approval, a.s.r. life applied the PIM to its Solvency II capital calculations. The application of the PIM affects the Solvency II risk margin. Because the IFRS 17 risk adjustment is determined using a cost‑of‑capital (CoC) approach that is aligned with the methodology underlying the Solvency II risk margin, the risk adjustment was also affected. The impact resulting from the application of the PIM is considered a change in estimate under IFRS 17 and is applied prospectively. As a.s.r. life applies year‑to‑date accounting, the effect is reflected in the reporting period 2025.
The application of the PIM resulted in:
a decrease in the risk adjustment measured on the current (actual) discount curve of € 331 million;
an increase in the contractual service margin (CSM) measured on the locked‑in discount curve of € 373 million; and
a decrease in the loss component of € 52 million.
These changes affect the measurement of the Insurance liabilities.
The above movements also affected profit or loss for the period. The risk adjustment release for 2025 decreased by € 30 million and the CSM release increased by € 27 million. The impact on the release of the loss component was limited. The reduction in the risk adjustment was mainly driven by differences between the actual and locked‑in discount curves, which resulted in a negative impact of € 94 million on insurance finance expenses.
The risks that are generally incorporated through the risk adjustment are mortality, longevity, disability, lapse, catastrophe and expense risk. A projection of expected future risks is made and all these risks are projected into the future. The total risk for every future year is determined based on correlations between the risks described in Solvency II. The projected total risk for every year is multiplied by a cost of capital charge and discounted at the balance sheet date.
The Risk Adjustment is based on a Cost of Capital method. a.s.r. has created a method to transfer the outcome of the Risk Adjustment to a confidence level. The risk adjustment is calculated at a range of confidence levels, as set out below in the table. The implied confidence levels are determined for both the one year and multiyear view, gross of reinsurance.
Confidence levels
| 31 December 2025 | ||
|---|---|---|
| 1 year view | Ultimate view | |
| Range | 95% - 98% | 66% - 76% |
The implied confidence levels at 31 December 2025 were equal to those implied at 31 December 2024.
7.5.13.4.4 Discount
Discount curves to discount the expected future fulfilment cash flows are determined using a liquid risk-free curve to which an illiquidity premium is added. The risk-free curve is based on the 6-month EURIBOR swap rate and includes a credit-risk adjustment and a first smoothing point of 20 years. a.s.r. uses an UFR of 3.20% in 2025 (2024: 3.25%) for the construction of the curve from the first smoothing point (FSP). The impact of the decrease in UFR is € 36 million on the value of the insurance contract liabilities and € 10 million on the liabilities arising from direct participating insurance contracts.
The liability illiquidity premium (LIP) is the adjustment resulting from differences between the liquidity characteristics of the group of insurance contracts and the liquidity of the assets used to establish the yield curve. The LIP is derived from a.s.r.’s current asset portfolio using a top-down approach per entity or liability product. In 2025, a.s.r. Has updated the LIP used for a.s.r. life and Aegon life, with offsetting impacts between the portfolios, In aggregate, the update of the LIP reduced the value of the insurance contract liabilities by € 110 million.
The discount curves are also applicable to the liabilities arising from direct participating insurance contracts. Further information on these contracts can be found in section 7.5.14.
The range of application ratio's follow the SCR Mass Lapse methodology.
Discount curves used in the valuation of the insurance contract liabilities and liabilities arising from direct participating insurance contracts
| Years | ||||||||
|---|---|---|---|---|---|---|---|---|
| Range LIP | 1 | 5 | 10 | 20 | 30 | 40 | 50 | |
| 31 December 2025 | 0% (min) | 2.07% | 2.47% | 2.85% | 3.20% | 3.19% | 3.18% | 3.18% |
| 100% (max) | 2.65% | 3.05% | 3.43% | 3.78% | 3.68% | 3.57% | 3.49% | |
| 31 December 2024 | 50% (min) | 2.64% | 2.54% | 2.67% | 2.66% | 2.63% | 2.72% | 2.81% |
| 100% (max) | 3.23% | 3.13% | 3.26% | 3.25% | 3.12% | 3.11% | 3.13% |
7.5.13.4.5 Coverage units
Coverage units are determined based on the expected insurance contract services. The insurance contract services are determined considering the (weighted) quantity of the benefits provided from insurance and investment (return/related) services. If a contract provides coverage for more than one insured event or if it provides additional investment (return/related) services, the coverage unit reflects all material benefits.
a.s.r. has defined coverage units that differ per product type to best reflect a product's characteristics and the nature of the services provided to the policyholder. Insurance services are typically depicted by a metric that is based on the maximum amount that a policyholder would receive if the insured event were to occur, such as the total benefits amount or the death benefit amount. For investment-type services, coverage units are based on the total service that a.s.r. expects to provide the policyholder over the lifetime of the contract, which is best represented by the coverage unit 'total premium'.
The table below presents the defined coverage units per type of product for Life and Non-life business:
Coverage units
| Product type | Coverage unit driver |
|---|---|
| Pensions | |
| Defined Benefit (DB) | Attainable pension |
| Defined Contribution (DC) - open book | Attainable pension |
| Defined Contribution (DC) - closed book | Total premium |
| Pensions - Term insurance | Sum assured including indexation |
| Individual Life | |
| Unit-linked | Total premium |
| Term Insurance | Sum assured (including indexation) |
| Saving Mortgage | Sum assured (including indexation) |
| Annuity | Annuity payable |
| Traditional Saving / Endowment | Sum assured (including indexation) |
| Funeral | |
| Funeral | Sum assured including indexation |
| Non-life/Income | |
| Individual disability | Sum assured including indexation |
| Group disability | Sum assured |
| Sickness Leave | Sum assured |
7.5.13.5 Contracts issued in the period
The following tables summarise the effect on the measurement components of insurance and reinsurance contracts arising from the initial recognition of contracts measured under the GMM that were initially recognised in the year.
Contracts issued: Non-life insurance contracts current year
| 2025 | Profitable contracts issued | Onerous contracts issued | Total |
|---|---|---|---|
| Expected claims and insurance service operating expenses | 1,290 | 160 | 1,450 |
| Insurance acquisition cash flows | 34 | 3 | 37 |
| Estimates of the present value of future cash outflows | 1,325 | 162 | 1,487 |
| Estimates of the present value of future cash inflows | -1,427 | -148 | -1,575 |
| Risk adjustment for non-financial risk | 29 | 2 | 31 |
| CSM | 74 | - | 74 |
| Losses recognised on initial recognition | - | 17 | 17 |
In 2025, Non-life onerous contracts consist of Group Disability contracts which were originally priced at a profitable level but turned onerous due to a higher experienced claims ratio.
Contracts issued: Non-life insurance contracts prior year
| 2024 | Profitable contracts issued | Onerous contracts issued | Total |
|---|---|---|---|
| Expected claims and insurance service operating expenses | 598 | 817 | 1,415 |
| Insurance acquisition cash flows | 22 | 9 | 30 |
| Estimates of the present value of future cash outflows | 620 | 826 | 1,446 |
| Estimates of the present value of future cash inflows | -744 | -811 | -1,555 |
| Risk adjustment for non-financial risk | 23 | 8 | 31 |
| CSM | 101 | - | 101 |
| Losses recognised on initial recognition | - | 23 | 23 |
In 2024, onerous Non-life contracts issued consist for about two thirds of Sickness Leave yearly prolongations at a combined ratio slightly above 100% due to an increased claims ratio, whereby cost synergies were not yet taken into account. The remainder consists of a part of the Group Disability production, which was priced slightly above 100% for commercial reasons, which is more than offset by profitable other Group Disability products in the same portfolio.
Contracts issued: Life insurance contracts current year
| 2025 | Profitable contracts issued | Onerous contracts issued | Total |
|---|---|---|---|
| Expected claims and insurance service operating expenses | 3,346 | 23 | 3,369 |
| Insurance acquisition cash flows | 13 | - | 13 |
| Estimates of the present value of future cash outflows | 3,359 | 24 | 3,383 |
| Estimates of the present value of future cash inflows | -3,589 | -19 | -3,609 |
| Risk adjustment for non-financial risk | 113 | 2 | 115 |
| CSM | 117 | - | 117 |
| Losses recognised on initial recognition | - | 6 | 6 |
In 2025, Life profitable contracts are mainly driven by the three pension buyouts amounting to € 2,810 million and onerous contracts decreased from € 474 million to € 23 million.
Contracts issued: Life insurance contracts prior year
| 2024 | Profitable contracts issued | Onerous contracts issued | Total |
|---|---|---|---|
| Expected claims and insurance service operating expenses | 141 | 474 | 615 |
| Insurance acquisition cash flows | 2 | 15 | 17 |
| Estimates of the present value of future cash outflows | 143 | 489 | 632 |
| Estimates of the present value of future cash inflows | -186 | -495 | -681 |
| Risk adjustment for non-financial risk | 12 | 16 | 28 |
| CSM | 31 | - | 31 |
| Losses recognised on initial recognition | - | 10 | 10 |
Contracts issued: reinsurance contracts
| 2025 | 2024 | |
|---|---|---|
| Estimates of present value of cash inflows | 1,233 | - |
| Estimates of present value of cash outflows | -1,235 | - |
| Risk adjustment for non-financial risk | 29 | - |
| CSM | -27 | - |
In December 2025, Aegon life has entered into another longevity reinsurance contract with a reinsurer. See section 7.5.13.3 for further details on the new reinsurance contract. The contract has a negative CSM as the reinsurance assumptions regarding mortality mirror the relatively prudent assumptions a.s.r. uses on the insurance side.
7.5.13.6 Expected release of the CSM
The following table illustrates when a.s.r. expects to recognise the remaining CSM as revenue for contracts measured under the GMM.
Expected release of the CSM current year
| 31 December 2025 | < 1 year | 1-2 years | 2-3 years | 3-4 years | 4-5 years | 5-10 years | 10-20 years | 20-30 years | > 30 years | Total |
|---|---|---|---|---|---|---|---|---|---|---|
| Insurance contracts | ||||||||||
| Non-Life GMM | 41 | 28 | 17 | 18 | 13 | 52 | 52 | 16 | 2 | 239 |
| Life GMM | 246 | 231 | 221 | 211 | 202 | 881 | 1,223 | 701 | 652 | 4,568 |
| Reinsurance contracts | ||||||||||
| Non-Life GMM | 12 | 5 | -1 | -1 | -1 | -4 | -4 | -1 | - | 4 |
| Life GMM | -3 | -3 | -2 | -2 | -2 | -10 | -13 | -1 | - | -36 |
| Total expected release of the CSM | 297 | 262 | 234 | 225 | 212 | 919 | 1,258 | 715 | 654 | 4,774 |
Following the implementation of PIM at a.s.r. life in 2025, CSM increased with € 373 million, see section 7.5.13.4.3, increasing the expected release of the CSM for Life GMM compared to prior year.
Expected release of the CSM prior year
| 31 December 2024 | < 1 year | 1-2 years | 2-3 years | 3-4 years | 4-5 years | 5-10 years | 10-20 years | 20-30 years | > 30 years | Total |
|---|---|---|---|---|---|---|---|---|---|---|
| Insurance contracts | ||||||||||
| Non-Life GMM | 39 | 26 | 14 | 14 | 14 | 69 | 42 | 6 | 3 | 227 |
| Life GMM | 186 | 186 | 176 | 170 | 163 | 736 | 1,102 | 701 | 701 | 4,122 |
| Reinsurance contracts | ||||||||||
| Non-Life GMM | -7 | -7 | -5 | - | - | -5 | -2 | - | - | -26 |
| Life GMM | -2 | -3 | -2 | -2 | -2 | -13 | -28 | -14 | -8 | -74 |
| Total expected release of the CSM | 217 | 203 | 183 | 181 | 175 | 786 | 1,115 | 693 | 696 | 4,249 |
7.5.13.7 Claims development table Non-life
The table below is a ten-year summary of movements in gross cumulative claims in connection with the Non-life portfolio for the period from 2016 to 2025.
Ten-year summary of changes in gross cumulative claims
| Claims year | |||||||||||
|---|---|---|---|---|---|---|---|---|---|---|---|
| 31 December 2025 | 2016 | 2017 | 2018 | 2019 | 2020 | 2021 | 2022 | 2023 | 2024 | 2025 | Total |
| At year end | |||||||||||
| 1st claim year | 2,216 | 2,237 | 2,348 | 2,418 | 2,614 | 3,206 | 3,469 | 4,462 | 4,391 | 4,815 | |
| 2017 | 2,262 | ||||||||||
| 2018 | 2,310 | 2,312 | |||||||||
| 2019 | 2,295 | 2,375 | 2,367 | ||||||||
| 2020 | 2,314 | 2,382 | 2,445 | 2,464 | |||||||
| 2021 | 2,251 | 2,338 | 2,449 | 2,510 | 2,621 | ||||||
| 2022 | 2,274 | 2,325 | 2,483 | 2,514 | 2,630 | 3,091 | |||||
| 2023 | 2,312 | 2,402 | 2,580 | 2,633 | 2,783 | 3,294 | 3,673 | ||||
| 2024 | 2,314 | 2,389 | 2,560 | 2,577 | 2,759 | 3,304 | 3,651 | 4,462 | |||
| 2025 | 2,310 | 2,385 | 2,541 | 2,559 | 2,724 | 3,245 | 3,679 | 4,493 | 4,401 | ||
| Estimates of undiscounted gross cumulative claims 31 December 2025 | 2,310 | 2,385 | 2,541 | 2,559 | 2,724 | 3,245 | 3,679 | 4,493 | 4,401 | 4,815 | |
| Cumulative gross paid claims | 2,085 | 2,105 | 2,172 | 2,144 | 2,186 | 2,519 | 2,699 | 3,353 | 2,976 | 2,219 | |
| Gross liabilities claims years 2016 to 2025 | 225 | 280 | 369 | 415 | 539 | 727 | 980 | 1,140 | 1,425 | 2,596 | 8,697 |
| Gross liabilities claims years before 2016 | 1,177 | ||||||||||
| Effect of discounting | -1,663 | ||||||||||
| Effect of the risk adjustment margin for non-financial risk | 132 | ||||||||||
| Other | -2,166 | ||||||||||
| Gross liabilities for incurred claims | 6,176 | ||||||||||
Other includes a correction for gross liabilities (after effect of discounting) for claims reported under liabilities for remaining coverage, which are represented in the figures for gross liabilities claims years 2016 to 2025 and before 2016. These consist primarily of incurred claims that remain subject to future insurance risk within the Individual Disability portfolio, see section 7.3.2.1. Others also includes claims payables in transfer.
Ten-year summary of changes in gross cumulative claims
| Claims year | |||||||||||
|---|---|---|---|---|---|---|---|---|---|---|---|
| 31 December 2024 | 2015 | 2016 | 2017 | 2018 | 2019 | 2020 | 2021 | 2022 | 2023 | 2024 | Total |
| At year end | |||||||||||
| 1st claim year | 2,027 | 2,216 | 2,237 | 2,348 | 2,418 | 2,614 | 3,206 | 3,469 | 4,462 | 4,391 | |
| 2016 | 2,017 | ||||||||||
| 2017 | 2,051 | 2,262 | |||||||||
| 2018 | 2,062 | 2,310 | 2,312 | ||||||||
| 2019 | 2,052 | 2,295 | 2,375 | 2,367 | |||||||
| 2020 | 2,047 | 2,314 | 2,382 | 2,445 | 2,464 | ||||||
| 2021 | 2,009 | 2,251 | 2,338 | 2,449 | 2,510 | 2,621 | |||||
| 2022 | 2,033 | 2,274 | 2,325 | 2,483 | 2,514 | 2,630 | 3,091 | ||||
| 2023 | 2,069 | 2,312 | 2,402 | 2,580 | 2,633 | 2,783 | 3,294 | 3,673 | |||
| 2024 | 2,072 | 2,314 | 2,389 | 2,560 | 2,577 | 2,759 | 3,304 | 3,651 | 4,462 | ||
| Estimates of undiscounted gross cumulative claims 31 December 2024 | 2,072 | 2,314 | 2,389 | 2,560 | 2,577 | 2,759 | 3,304 | 3,651 | 4,462 | 4,391 | |
| Cumulative gross paid claims | 1,859 | 2,051 | 2,060 | 2,113 | 2,084 | 2,108 | 2,417 | 2,548 | 3,151 | 2,013 | |
| Gross liabilities claims years 2015 to 2024 | 213 | 263 | 329 | 447 | 493 | 650 | 886 | 1,103 | 1,311 | 2,379 | 8,075 |
| Gross liabilities claims years before 2015 | 1,176 | ||||||||||
| Effect of discounting | -1,521 | ||||||||||
| Effect of the risk adjustment margin for non-financial risk | 132 | ||||||||||
| Other | -2,241 | ||||||||||
| Gross liabilities for incurred claims | 5,622 | ||||||||||
7.5.14 Liabilities arising from direct participating insurance contracts
See accounting policies F1. For information on assumptions used, see section 7.5.13.4.
| 31 December 2025 | 31 December 2024 | |
|---|---|---|
| Life insurance contracts | 38,057 | 38,377 |
| Pre-recognition cash flows | -8 | -11 |
| Total liabilities arising from direct participating insurance contracts | 38,049 | 38,366 |
Pre-recognition cash flows mainly concern acquisition cash flows relating to insurance contracts, specifically Werknemerspensioen, not yet recognised.
7.5.14.1 Life – direct participating insurance contracts
Changes in liabilities arising from direct participating insurance contracts by remaining coverage and incurred claims current year VFA
| Liabilities for remaining coverage | Liabilities for incurred claims | Total | ||
|---|---|---|---|---|
| Excluding loss component | Loss component | |||
| At 1 January 2025 | 38,087 | 68 | 222 | 38,377 |
| Changes in the income statement | ||||
| Insurance contract revenue of which: | -1,404 | - | - | -1,404 |
| Contracts recognised from transition date and retrospective approach | -1,299 | - | - | -1,299 |
| Contracts under the fair value approach | -105 | - | - | -105 |
| Insurance service expenses | ||||
| New incurred claims and benefits | - | -20 | 1,131 | 1,111 |
| Losses and reversals of losses on onerous contracts | - | 22 | - | 22 |
| Claims and benefits | - | 3 | 1,131 | 1,133 |
| Other insurance service operating expenses | - | - | 158 | 158 |
| Amortisation of insurance acquisition cash flows | 5 | - | - | 5 |
| Insurance service operating expenses | 5 | - | 158 | 163 |
| Total insurance service expenses | 5 | 3 | 1,289 | 1,297 |
| Investment components | -1,022 | - | 1,022 | - |
| Insurance service result | -2,422 | 3 | 2,311 | -108 |
| Net finance result from insurance contracts | 370 | - | - | 370 |
| Total changes in the income statement | -2,052 | 3 | 2,311 | 262 |
| Cashflows | ||||
| Premiums received | 1,688 | - | - | 1,688 |
| Insurance service expenses paid, including investment components | - | - | -2,288 | -2,288 |
| Insurance acquisition cash flows | -13 | - | - | -13 |
| Total cash flows | 1,674 | - | -2,288 | -614 |
| Other | 30 | 2 | - | 32 |
| At 31 December 2025 | 37,739 | 73 | 245 | 38,057 |
Changes in liabilities arising from direct participating insurance contracts by remaining coverage and incurred claims prior year VFA
| Liabilities for remaining coverage | Liabilities for incurred claims | Total | ||
|---|---|---|---|---|
| Excluding loss component | Loss component | |||
| At 1 January 2024 | 35,790 | 75 | 228 | 36,093 |
| Changes in the income statement | ||||
| Insurance contract revenue of which: | -1,081 | - | - | -1,081 |
| Contracts recognised from transition date and retrospective approach | -994 | - | - | -994 |
| Contracts under the fair value approach | -87 | - | - | -87 |
| Insurance service expenses | ||||
| New incurred claims and benefits | - | -12 | 779 | 767 |
| Losses and reversals of losses on onerous contracts | - | 6 | - | 6 |
| Claims and benefits | - | -6 | 779 | 772 |
| Other insurance service operating expenses | - | - | 155 | 155 |
| Amortisation of insurance acquisition cash flows | 4 | - | - | 4 |
| Insurance service operating expenses | 4 | - | 155 | 159 |
| Total insurance service expenses | 4 | -6 | 934 | 932 |
| Investment components | -1,263 | - | 1,263 | - |
| Insurance service result | -2,340 | -6 | 2,197 | -149 |
| Net finance result from insurance contracts | 3,072 | - | - | 3,071 |
| Total changes in the income statement | 732 | -7 | 2,197 | 2,922 |
| Cashflows | ||||
| Premiums received | 1,557 | - | - | 1,557 |
| Insurance service expenses paid, including investment components | - | - | -2,203 | -2,203 |
| Insurance acquisition cash flows | -12 | - | - | -12 |
| Total cash flows | 1,545 | - | -2,203 | -658 |
| Other | 20 | - | - | 20 |
| At 31 December 2024 | 38,087 | 68 | 222 | 38,377 |
Changes in liabilities arising from direct participating insurance contracts by measurement component current year VFA
| Estimates of the present value of the future cash flows | Risk adjustment for non-financial risk | CSM | Total | |||
|---|---|---|---|---|---|---|
| Total | Of which, Contracts recognised from transition date and retrospective approach | Of which, contracts under fair value approach | ||||
| At 1 January 2025 | 36,587 | 530 | 1,260 | 1,063 | 197 | 38,377 |
| Changes in the income statement | ||||||
| Changes that relate to future services | ||||||
| - Changes in estimates that adjust the CSM | 28 | -63 | 35 | 9 | 26 | - |
| - Changes in estimates that do not adjust the CSM, ie losses on groups of onerous contracts and reversals of such losses | -9 | -1 | - | - | - | -10 |
| - Effects of contracts initially recognised in the period | 30 | 3 | - | - | - | 33 |
| Changes that relate to current services | ||||||
| - CSM recognised in profit or loss for services provided | - | - | -95 | -89 | -6 | -95 |
| - Release of the risk adjustment for non-financial risk | - | -38 | - | - | - | -38 |
| - Experience adjustments | 3 | - | - | - | - | 3 |
| Insurance service result | 51 | -99 | -59 | -80 | 21 | -108 |
| Net finance result from insurance contracts | 370 | - | - | - | - | 370 |
| Total changes in the income statement | 421 | -99 | -59 | -80 | 21 | 262 |
| Cash flows | ||||||
| Premiums received | 1,688 | - | - | - | - | 1,688 |
| Insurance service expenses paid, including investment components | -2,288 | - | - | - | - | -2,288 |
| Insurance acquisition cash flows | -13 | - | - | - | - | -13 |
| Total cash flows | -614 | - | - | - | - | -614 |
| Other | 32 | - | - | - | - | 32 |
| At 31 December 2025 | 36,426 | 431 | 1,201 | 983 | 217 | 38,057 |
Changes in liabilities arising from direct participating insurance contracts by measurement component prior year (VFA)
| Estimates of the present value of the future cash flows | Risk adjustment for non-financial risk | CSM | Total | |||
|---|---|---|---|---|---|---|
| Total | Of which, Contracts recognised from transition date and retrospective approach | Of which, contracts under fair value approach | ||||
| At 1 January 2024 | 34,288 | 541 | 1,264 | 1,072 | 193 | 36,093 |
| Changes in the income statement | ||||||
| Changes that relate to future services | ||||||
| - Changes in estimates that adjust the CSM | -139 | 51 | 88 | 63 | 25 | - |
| - Changes in estimates that do not adjust the CSM, ie losses on groups of onerous contracts and reversals of such losses | 18 | -29 | - | - | - | -10 |
| - Effects of contracts initially recognised in the period | 12 | 4 | - | - | - | 16 |
| Changes that relate to current services | ||||||
| - CSM recognised in profit or loss for services provided | - | - | -102 | -72 | -30 | -102 |
| - Release of the risk adjustment for non-financial risk | - | -40 | - | - | - | -40 |
| - Experience adjustments | -14 | - | - | - | - | -14 |
| Insurance service result | -122 | -14 | -13 | -8 | -5 | -149 |
| Net finance result from insurance contracts | 3,060 | 2 | 9 | - | 9 | 3,071 |
| Total changes in the income statement | 2,938 | -12 | -4 | -8 | 4 | 2,922 |
| Cash flows | ||||||
| Premiums received | 1,557 | - | - | - | - | 1,557 |
| Insurance service expenses paid, including investment components | -2,203 | - | - | - | - | -2,203 |
| Insurance acquisition cash flows | -12 | - | - | - | - | -12 |
| Total cash flows | -658 | - | - | - | - | -658 |
| Other | 20 | - | - | - | - | 20 |
| At 31 December 2024 | 36,587 | 530 | 1,260 | 1,063 | 197 | 38,377 |
At year-end 2025, the liabilities included a guarantee provision for a carrying amount of € 57 million (2024: € 58 million).
An amount of € 517 million (2024: € 417 million) of the liabilities arising from direct participating insurance contracts is related to the a.s.r. pension DC plans.
For more information on the assumptions used and changes in estimates, see section 7.5.13.4.
7.5.14.2 Contracts issued in the period
The following tables summarise the effect on the measurement components of insurance contracts arising from the initial recognition of contracts that were initially recognised in the year.
Contracts issued: Liabilities arising from direct participating insurance contracts
| 2025 | Profitable contracts issued | Onerous contracts issued | Total |
|---|---|---|---|
| Insurance service expenses payable | 504 | 1,055 | 1,559 |
| Insurance acquisition cash flows | 4 | 4 | 8 |
| Estimates of the present value of future cash outflows | 508 | 1,059 | 1,567 |
| Estimates of the present value of future cash inflows | -508 | -1,029 | -1,538 |
| Risk adjustment for non-financial risk | - | 3 | 3 |
| CSM | - | - | - |
| Losses recognised on initial recognition | - | 33 | 33 |
Onerous contracts in 2025 relate to the 2026 DC Pension production which resulted in losses due to mortality and expense assumption updates.
In 2025, a.s.r. harmonised the accounting of direct participating insurance contracts between a.s.r. life and Aegon life, which are accounted for under the VFA method. As a result of the change in methodology from indirect to direct method, estimates of the present value of cash inflows and cash outflows increased with a net neutral impact on CSM and equity. For more information, see section 7.5.13.4.
Contracts issued: Liabilities arising from direct participating insurance contracts
| 2024 | Profitable contracts issued | Onerous contracts issued | Total |
|---|---|---|---|
| Insurance service expenses payable | 39 | 25 | 64 |
| Insurance acquisition cash flows | 8 | 4 | 12 |
| Estimates of the present value of future cash outflows | 47 | 29 | 76 |
| Estimates of the present value of future cash inflows | -47 | -17 | -64 |
| Risk adjustment for non-financial risk | - | 4 | 4 |
| CSM | - | - | - |
| Losses recognised on initial recognition | - | 16 | 16 |
7.5.14.3 Expected release of the CSM
The following table illustrates when a.s.r. expects to recognise the remaining CSM as revenue.
Expected release of the CSM
| < 1 year | 1-2 years | 2-3 years | 3-4 years | 4-5 years | 5-10 years | 10-20 years | 20-30 years | > 30 years | Total | |
|---|---|---|---|---|---|---|---|---|---|---|
| 2025 | 88 | 82 | 77 | 71 | 66 | 261 | 301 | 155 | 98 | 1,200 |
| 2024 | 94 | 88 | 82 | 76 | 71 | 280 | 314 | 155 | 102 | 1,260 |
7.5.15 Employee benefits
See accounting policy G.
Employee benefits
| 31 December 2025 | 31 December 2024 | |
|---|---|---|
| Post-employment benefits pensions | 4,750 | 4,974 |
| Post-employment benefits other than pensions | 30 | 35 |
| Post-employment benefit obligation | 4,780 | 5,010 |
| Other long-term employee benefits | 30 | 27 |
| Total | 4,810 | 5,037 |
The employee benefits decreased by € 227 million to € 4,810 million (2024: € 5,037 million) primarily due to the increase in the discount rate from 3.51% in 2024 to 4.00% in 2025. The remeasurements resulted in an increase of € 135 million in equity in the actuarial gains and losses.
An amount of € 4,588 million (2024: € 4,839 million) of the employee benefits is expected to be settled more than twelve months after the balance sheet date.
Costs of post-employment and other long-term employee benefits
| 2025 | 2024 | |
|---|---|---|
| Post-employment benefits pensions | -241 | -238 |
| Post-employment benefits other than pensions | -2 | -1 |
| Total | -242 | -239 |
| Cost of post-employment and other long-term employee benefits | -243 | -239 |
The costs of the post-employment benefits pensions relate to the current DC pension plan of a.s.r., the previous DB plans of a.s.r. and Aegon NL, plus the DC plans of the other group companies.
7.5.15.1 Post-employment benefits pensions
a.s.r. has a number of DC and DB post-employment benefit plans for its employees and former employees. The majority of employees are formally employed by a.s.r. A limited number of employees are employed by other group companies. The pension plans of other group companies are disclosed in a subsection of this section.
a.s.r. life and Aegon life, insurance companies and group entities, are the insurers of the majority of the post-employment DB plans. a.s.r. life is also the insurer of the current pension DC plans.
Defined Contribution plans
a.s.r. employees
All pension buildup for existing and new employees as of 1 January 2021 are included in the post-employment DC plans. The DC plan has two components with defined benefit elements with a marginal impact; survivors' pension and the option to buy a guaranteed income. Both components are accounted for in the same way as the DC plan. The recognised expenses for the DC plan in 2025 amounts to € 82 million (2024 € 83 million).
Former Aegon employees
With the integration of Aegon NL and a.s.r. on 1 October 2023, the Aegon DC plan with asr IORP became non-contributory; from that date, the employees of Aegon NL are included in the DC plan of a.s.r.
Other group companies employees
The other group companies, which are entities mainly operating in the Distribution and Services segment, have DC plans, insured with a.s.r. life. The recognised expenses for these DC plans in 2025 amounts to € 22 million (2024: € 19 million), of which € 1.5 million relates to the employees of HumanTotalCare (see section 7.4.5).
Defined Benefit plans
Net defined benefit liability
Defined benefit obligation for all the above mentioned plans
| 2025 | 2024 | |
|---|---|---|
| Net defined benefit liability at 1 January | 4,974 | 5,160 |
| Included in income statement | ||
| Interest cost | 174 | 175 |
| Other | -2 | -2 |
| Total | 172 | 174 |
| Remeasurement of liabilities included in OCI | ||
| Discount rate change | -186 | -64 |
| Other assumptions change | 7 | -40 |
| Experience adjustments | -3 | -48 |
| Total | -182 | -151 |
| Benefits | -219 | -211 |
| Other | 4 | 2 |
| Net defined benefit liability at 31 December | 4,750 | 4,974 |
| At 31 December | ||
| Defined benefit obligation | 4,750 | 4,974 |
| Fair value of plan assets | ||
| Net defined benefit liability | 4,750 | 4,974 |
a.s.r. employees
All employees who commenced service between 1 January 2006 and 31 December 2020 are included in one post-employment DB plan (‘Basic plan’). All other employees remain active within the existing plan at the date of first employment. Previous plans for former employees are also still active.
As per 31 December 2020, the contribution to the DB pension scheme ended, therefore no accrual rate and pensionable salary and minimum franchise is required for this scheme.
The DB pension scheme had a retirement age of 68 years;
The DB scheme was based on average-salary pension; and
Future inflation indexation agreements are in force.
Employees account for 18% (2024: 19%) of the DB obligation, 58% (2024: 55%) of the DB obligation relates to former employees currently receiving pension benefits, 22% (2024: 24%) of the DB obligation relates to deferred pensioners and 2 % (2024: 2%) of the DB obligation relates to other members.
Former Aegon employees
The DB obligation of Aegon NL classifies as multiple-employer contract. a.s.r. has an obligation to pay part of the guarantee premium, which is an insurance premium to pay for the guarantee provided by Aegon life. Each year when there is a decision related to additional entitlements stemming from indexation, a new guarantee premium is calculated. This premium is based on the total of entitlements, including the previous annual layers of indexation bought in the past. The indexation annuity, which is based on contractual tariff, is extracted from the indexation depot. The guarantee premium, which is calculated based on the difference between the current market price and the contractual tariff for indexation, is paid in full by a.s.r. to Aegon life, and subsequently 29% thereof is recovered from Aegon Ltd. (2025: € 4 million; 2024: € 4 million). These contributions from Aegon Ltd. are set out in the formal terms of the plan, and thus affect remeasurements of the net DB liability. An amount of € 59 million (2024: € 80 million) was netted of the DB obligation and included in OCI.
As per 31 December 2019, the contribution to the DB pension scheme ended, therefore no accrual rate and pensionable salary and minimum franchise is required for this scheme.
The DB pension scheme had a retirement age of 68 years;
The DB scheme was based on average-salary pension; and
Future inflation indexation agreements are in force.
Employees account for 0% (2024 0%) of the DB obligation, 57% (2024 55%) of the DB obligation relates to former employees currently receiving pension benefits, 41% (2024 43%) of the DB obligation relates to deferred pensioners and 2% (2024 2%) of the DB obligation relates to other members.
Experience adjustments
Experience adjustments are actuarial gains and losses that have arisen due to differences between actuarial assumptions. The following table provides information about experience adjustments with respect to qualifying plan assets and the DB obligation:
Experience adjustments
| (in € thousands) | 2025 | 2024 |
|---|---|---|
| Experience adjustments to qualifying investments, gain (loss) | - | - |
| As a % of liabilities as at 31 December | 0.0% | 0.0% |
| Experience adjustments to defined benefit obligation, gain (loss) | 3,320 | 47,989 |
| As a % of liabilities as at 31 December | 0.1% | 1.0% |
Assumptions
The principal actuarial assumptions and parameters at year-end
| 2025 | 2024 | |
|---|---|---|
| a.s.r. DB plan | ||
| Discount rate a.s.r. | 4.00% | 3.51% |
| - Effect thereof on DB obligation (millions) | -143 | -28 |
| Duration (years) | 12 | 13 |
| Mortality (years) | 19 | 20 |
| Effect of change in other assumptions (mainly Mortality)(millions) | -2 | -20 |
| Former Aegon NL DB plan | ||
| Discount rate a.s.r. | 4.00% | 3.51% |
| - Effect thereof on DB obligation (millions) | -60 | -22 |
| Duration (years) | 13 | 14 |
| Mortality (years) | 19 | 21 |
| Effect of change in other assumptions (mainly Mortality)(millions) | 10 | -20 |
In the calculation of the DB obligation the:
Discount rate is based on an internal curve for high quality corporate bonds;
For the pension scheme the most recent mortality table ‘a.s.r. 2025 prognosetafel’ is used, in combination with a.s.r. specific experience factors for the pension portfolio;
The period of indexation is based on the expected duration of the separate account to fund the future inflation indexation.
The sensitivity of the above actuarial assumptions to feasible possible changes at the reporting date to one of the relevant actuarial assumptions whilst other assumption remain constant, would have affected the DB obligation by the amounts shown below:
Sensitivity of actuarial assumptions
| Increase | Decrease | |
|---|---|---|
| Discount rate (1% movement) | -446 | 553 |
| Future mortality (1 year movement) | -121 | 120 |
Non-qualifying plan assets
The portfolios of global investments related to the ended DB pension schemes of a.s.r. and former Aegon NL are considered non-qualifying plan assets. The non-qualifying assets, which are managed by a group company, are not presented as part of the net DB obligation.
For the non-qualifying assets backing the post-employment benefit plans, a.s.r. has drawn up general guidelines for the asset mix based on criteria such as geographical location and ratings. To ensure the investment guidelines remain in line with the conditions of the post-employment benefit obligations, a.s.r. regularly performs Asset Liability Management (ALM) studies. Transactions in the non-qualifying assets are done within the guidelines. As the post-employment benefit plans are a liability on group level, the underlying insurance and market risks are in scope of a.s.r.’s risk policies (section 7.8).
The overall interest-rate risk of the Group is managed using interest-rate swaps and swaptions. a.s.r. manages the interest rate risk through an overlay interest hedging strategy using swaps and swaptions for the company as a whole (see section 7.8.3). The swaps and swaptions are not specifically allocated to the respective post-employment benefit plans.
a.s.r. has separate accounts to fund future inflation indexation for the employees and former employees included in the a.s.r. post-employment defined benefit plan. As such this has been included in the DB obligation. The fair value of these assets amounted to € 286 million (2024: € 348 million) for a.s.r. and € 530 million (2024: € 548 million) in relation to Aegon NL. The Aegon NL non-qualifying plan assets are ringfenced and amount to € 2,210 million (2024: € 2,366 million).
7.5.15.2 Post-employment benefits other than pensions
The other post-employment benefits plans consist of personnel arrangements for financial products (such as mortgages and health insurance), which remain in place after retirement.
Changes in the defined benefit obligation
| 2025 | 2024 | |
|---|---|---|
| Defined benefit obligation at 1 January | 35 | 39 |
| Included in income statement | ||
| Other | 1 | 2 |
| Total | 1 | 2 |
| Remeasurement of liabilities included in OCI | ||
| Other assumptions change | -3 | -1 |
| Total | -3 | -1 |
| Benefits | -4 | -4 |
| Defined benefit obligation at 31 December | 30 | 35 |
Experience adjustments are actuarial gains and losses that have arisen due to differences between actuarial assumptions. The following table provides information about experience adjustments with respect to qualifying plan assets and the DB obligation:
Experience adjustments to defined benefit obligation
| (in € thousands) | 2025 | 2024 |
|---|---|---|
| Experience adjustments to defined benefit obligation, loss (gain) | 2,651 | 661 |
| As a % of liabilities as at 31 December | 8.9% | 1.9% |
Principal actuarial assumptions and parameters at year-end
| 2025 | 2024 | |
|---|---|---|
| Discount rate | 3.6% | 3.3% |
Discounts on employee mortgages have been fixed in amounts granted on the reference date December 2017 and for former Aegon NL employees on the reference date January 2023.
In the calculation of the DB obligation the:
Discount rate is based on an internal curve for high quality corporate bonds;
For a.s.r. post-employment benefit obligations the most recent mortality table ‘a.s.r. 2025 prognosetafel’ is used, in combination with a.s.r. specific experience factors for the pension portfolio;
For former Aegon NL post-employment benefit obligations the 'a.s.r. 2025 prognosetafel' is used, in combination with a.s.r. specific experience factors for the pension portfolio.
The sensitivity of the above actuarial assumptions to feasible possible changes at the reporting date to one of the relevant actuarial assumptions whilst other assumption remain constant, would have resulted in nil (2024: nil) impact on the DB obligation
7.5.15.3 Other long-term employee benefits
Other long-term employee benefits consist of the employer's share of liabilities arising from long-term services, such as jubilee benefits.
Changes in other long-term employee benefits
| 2025 | 2024 | |
|---|---|---|
| Net liability as at 1 January | 27 | 19 |
| Total expenses | 5 | 10 |
| Other | -2 | -2 |
| Net liability as at 31 December | 30 | 27 |
Underlying assumptions
| 31 December 2025 | 31 December 2024 | |
|---|---|---|
| Discount rate | 3.3% | 3.1% |
| Salary increases | 2.2% | 2.1% |
| Expected remaining service years a.s.r. | 8.1 | 8.4 |
| Expected remaining service years former Aegon NL | 8.1 | 8.4 |
7.5.16 Provisions
Changes in provisions
| 2025 | 2024 | |
|---|---|---|
| At 1 January | 413 | 414 |
| Additional foreseen amounts | 17 | 37 |
| Reversal of unused amounts | -18 | -3 |
| Usages in course of year | -294 | -34 |
| Changes in the composition of the group | 3 | -1 |
| At 31 December | 121 | 413 |
The provisions were created for:
Settlement to the claimants for unit-linked products;
VAT and legal issues;
Employee restructuring expenses;
Retention of disability risk instead of insuring it with the Employee Insurance Agency (Uitvoeringsinstituut Werknemersverzekeringen - UWV);
Dismantling costs wind turbines; and
Other expenses.
The provision for settling unit-linked product claims covers legal and operational costs from longstanding disputes regarding transparency and charges. In November 2023, a.s.r. agreed to a capped settlement of € 250 million with five consumer protection organisations. This agreement became effective in February 2025, once virtually all affiliated customers had accepted their individual offers and granted full and final release, after which execution commenced. In addition, a leniency scheme was also introduced for non-affiliated participants.
At year-end 2025, a.s.r.’s remaining provision to finalise the compensation agreements associated with the unit-linked dispute amounts to € 53 million (2024: € 300 million). For further details on contingent liabilities, see section 7.7.7.2.
The provision for VAT and legal issues is based is determined using the best estimates available at year-end, supported expert opinions.
The provisions for employee restructuring are based on arrangements agreed in the Collective Bargaining Agreement, restructuring plans, and on decisions made by a.s.r.’s management. The restructuring provision amounting to € 42 million (2024: € 57 million) relates mainly to the reorganisation of a.s.r. due to the integration of Aegon NL entities and the consequential program to achieve a lower cost level. This program will be continued in 2026.
The timing of the outflow of resources related to these provisions is uncertain because of the unpredictability of the outcome and the time required for the settlement of disputes.
An amount of € 95 million (2024: € 368 million) of the provisions is expected to be settled within twelve months after the balance sheet date.
7.5.17 Borrowings
See accounting policies U and V.
Borrowings
| 31 December 2025 | 31 December 2024 | |
|---|---|---|
| Loans | 3,181 | 3,061 |
| Lease liabilities | 120 | 74 |
| Total Borrowings | 3,301 | 3,135 |
Changes in borrowings
| 2025 | 2024 | |||||
|---|---|---|---|---|---|---|
| Loans | Lease Liabilities | Total | Loans | Lease Liabilities | Total | |
| At 1 January | 3,061 | 74 | 3,135 | 5,363 | 88 | 5,451 |
| Proceeds from issues of loans | 502 | 7 | 509 | 1,091 | 15 | 1,106 |
| Repayments | (410) | (12) | (422) | (582) | (17) | (600) |
| Interest accrued | 1 | 2 | 3 | 3 | 2 | 5 |
| Amortisation premiums and discounts | 1 | - | 1 | 1 | - | 1 |
| Changes in the composition of the group | 26 | 48 | 74 | (2,816) | (4) | (2,820) |
| Other | - | 1 | 1 | 2 | (9) | (8) |
| Total Borrowings | 3,181 | 120 | 3,301 | 3,061 | 74 | 3,135 |
As at year-end, borrowings had the following terms to maturity:
Maturity of borrowings
| 31 December 2025 | 31 December 2024 | |
|---|---|---|
| Maturity - Falling due within 1 year | 70 | 115 |
| Maturity - Falling due between 1 and 5 years | 908 | 846 |
| Maturity - Falling due after 5 years | 2,323 | 2,174 |
| Maturity Borrowings | 3,301 | 3,135 |
At year-end 2025, the fair value of borrowings was € 3,322 million (2024: € 3,136 million). For information regarding the fair value, see section 7.7.1.2. The average interest rate payable on loans was 4.49% (2024: 4.18%). The average incremental borrowing rate on the lease liabilities was 4.05% (2024: 3.81%).
On 20 March 2024, a.s.r. (through Aegon Hypotheken) closed a transaction under the Dutch SAECURE programme to sell Class A mortgage-backed securities (RMBS). ‘SAECURE 22’ consisted of a principal amount of € 600 million of class A notes with the first optional redemption date (FORD) April 2030.
On 30 January 2025, a.s.r. (through a.s.r. life) closed a transaction under the Dutch Delphinus programme to sell Class A mortgage-backed securities (RMBS). ‘Delphinus 2025-I’ consisted of a principal amount of € 500 million of class A notes with the FORD March 2031.
During 2025, SAECURE 18 was fully redeemed at the FORD for an amount of € 254 million.
The following structured entities are group companies and have been consolidated:
SAECURE 17 B.V.;
SAECURE 18 NHG B.V.;
SAECURE 20 B.V.;
SAECURE 21 B.V.;
SAECURE 22 B.V.;
Aegon Hypotheken Financiering B.V.;
Aegon Hypotheken Prefunding B.V.;
Hypotheken Prefunding 2 B.V.;
Delphinus 2023-I B.V.;
Orcinus 2023 B.V.;
Delphinus 2025-I B.V.
The structured entities relate to the funding or securitisation of mortgage loans. a.s.r. holds no shares in the structured entities. The contractual agreements with these entities do not include provisions in which a.s.r. could be required to provide financial support in certain circumstances. a.s.r. has not provided, nor has intentions to provide, financial or other support without having a contractual obligation to do so.
7.5.18 Due to banks
See accounting policy E.
The amounts due to banks decreased from € 5,550 million to € 4,110 million, mainly as a result of the decrease in liability recognised for cash collateral under ISDAs (International Swaps and Derivatives Association) and Client Clearing Agreements (CCA) concluded with counterparties and the settlement of repurchase agreements. There is no significant difference between the carrying amount and the fair value of these liabilities (see section 7.7.1.2). The average interest rate for the cash collateral received in 2025 is 2.18% and based on €STR (2024: 3.65%).
In 2024 € 517 million of cash on the balance sheet has been borrowed by entering into repurchase agreements. The asset recognised for cash collateral paid on reverse repurchase agreements is presented under other financial assets. The liability recognised for cash collateral received on repurchase agreements is presented under due to banks. The liability related to cash collateral received on derivate instruments is also included in due to banks. In 2025 the repurchase agreements were settled.
a.s.r.'s unsecured Revolving Credit Facility (RCF) amounts to € 600 million in 2025 (2024: € 600 million). The RCF can be used for multiple purposes including investment purposes, balance sheet management and short-term cash flow management. As per year-end 2025 the RCF is undrawn and fully available.
a.s.r.'s overdraft facility amounts to € 150 million in 2025 (2024 € 150 million). This facility can be used in respect of a.s.r.'s residential mortgage business. As per year-end 2025 the overdraft facility is undrawn and fully available.
An amount of € 3,449 million due to banks (2024: € 5,158 million) is expected to be settled within twelve months after the balance sheet date.
7.5.19 Other liabilities
Other liabilities
| 31 December 2025 | 31 December 2024 | |
|---|---|---|
| Financial liabilities | ||
| Due to customers | 295 | 249 |
| Trade payables | 376 | 371 |
| Non-financial liabilities | ||
| Deferred income | 11 | 11 |
| Short-term employee benefits | 47 | 44 |
| Other non-financial liabilities | 640 | 647 |
| Total other liabilities | 1,369 | 1,322 |
The carrying value of other liabilities approximates their fair value (see section 7.7.1.2 for further information on other financial liabilities).
An amount of € 51 million (2024: € 184 million) of the other liabilities is expected to be settled more than one year after the balance sheet date.
The other non-financial liabilities consist mainly of accounts payable, accrued liabilities, VAT and other taxes to be paid.
7.6 Notes to the consolidated income statement
7.6.1 Insurance contract revenue
See accounting policy W1.
Insurance contract revenue
| 2025 | Non-life | Life | Total |
|---|---|---|---|
| Contracts not measured under the PAA | |||
| Amounts relating to changes in liabilities for remaining coverage: | |||
| - Expected insurance claims, benefits and expenses | 1,797 | 3,852 | 5,649 |
| - Release of the risk adjustment for non-financial risk for risk expired | 21 | 170 | 191 |
| - CSM recognised in profit or loss for services provided | 106 | 361 | 466 |
| - Other/ experience adjustments arising from premiums not relating to future service | 72 | -2 | 70 |
| Recovery of insurance acquisition cash flows | 23 | 7 | 30 |
| 2,019 | 4,387 | 6,406 | |
| Contracts measured under the PAA | 3,918 | - | 3,918 |
| Insurance contract revenue | 5,937 | 4,387 | 10,324 |
Insurance contract revenue
| 2024 | Non-life | Life | Total |
|---|---|---|---|
| Contracts not measured under the PAA | |||
| Amounts relating to changes in liabilities for remaining coverage: | |||
| - Expected insurance claims, benefits and expenses | 1,788 | 3,459 | 5,247 |
| - Release of the risk adjustment for non-financial risk for risk expired | 25 | 191 | 216 |
| - CSM recognised in profit or loss for services provided | 143 | 312 | 456 |
| - Other/ experience adjustments arising from premiums not relating to future service | 66 | 18 | 84 |
| Recovery of insurance acquisition cash flows | 24 | 6 | 31 |
| 2,046 | 3,987 | 6,033 | |
| Contracts measured under the PAA | 3,567 | - | 3,567 |
| Insurance contract revenue | 5,614 | 3,987 | 9,601 |
The increase in total insurance contract revenue was € 323 million in Non-life segment and € 400 million in the Life segment.
The insurance contract revenue related to the a.s.r. and Aegon NL post-employment benefit plans of € 254 million (2024: € 254 million) are not included in the life figures since these have been eliminated in the consolidation process.
Insurance Contract Revenue reconciliation
| 31 December 2025 | 31 December 2024 | |||
|---|---|---|---|---|
| Notes to the consolidated balance sheet | Notes to the consolidated income statement | Notes to the consolidated balance sheet | Notes to the consolidated income statement | |
| 7.5.13.1 Insurance contracts Non-Life | 5,937 | 5,614 | ||
| 7.5.13.2 Insurance contracts Life | 2,983 | 2,906 | ||
| 7.5.14.1 Life - Direct participating insurance contracts | 1,404 | 1,081 | ||
| 7.6.1 Insurance contract revenue Non-Life | 5,937 | 5,614 | ||
| 7.6.1 Insurance contract revenue Life | 4,387 | 3,987 | ||
| Total | 10,324 | 10,324 | 9,601 | 9,601 |
7.6.2 Insurance service expenses
See accounting policy W2.
Total insurance service expenses increased by € 766 million to € 9,475 million comprising claims and benefits (€ 757 million increase) and insurance service operating expenses (€ 9 million increase). The increase in insurance service expenses was € 404 million in the Non-life segment and € 362 million in the Life segment.
7.6.3 Net result from reinsurance contracts
See accounting policy W1.
Net result from reinsurance contracts
| 2025 | 2024 | |
|---|---|---|
| Allocation of reinsurance premiums paid | -820 | -679 |
| Amounts recoverable from reinsurers | 725 | 566 |
| Changes in amounts recoverable arising from changes in liability for incurred claims | -6 | 12 |
| Net result from reinsurance contracts | -102 | -101 |
7.6.4 Direct investment income
See accounting policy W3.
Direct investment income
| 2025 | 2024 | |
|---|---|---|
| Interest income from investments at FVTPL | 2,053 | 2,160 |
| Interest income from derivatives | 5,837 | 3,449 |
| Interest income from debt instruments at amortised cost | 191 | 184 |
| Total interest income | 8,080 | 5,793 |
| Dividends received | 431 | 385 |
| Investment income related to direct participating insurance contracts | 160 | 11 |
| Rental income from investment property | 137 | 144 |
| Other direct investment income | 30 | 18 |
| Total dividend and other investment income | 758 | 558 |
| Total direct investment income | 8,838 | 6,351 |
Interest income increased mainly due to lower variable interest rates on receiver swaps compared to last year.
For equity instruments measured at FVOCI, dividends received during the year amount to € 73 million (2024: € 61 million), of which € 11 million (2024: € 8 million) relates to instruments derecognised during the year.
The effective interest method has been applied to an amount of € 191 million (2024: € 184 million) of the interest income from financial instruments measured at amortised cost. Included within interest income is nil (2024: nil) of interest received on impaired fixed-income securities.
The interest income from interest derivatives and interest expenses on interest derivatives (see section 7.6.8) is not netted in the income statement. However, the net interest result on interest derivatives amounts to € 358 million (2024: € 54 million). In 2025, following the integration of Aegon life's derivatives portfolio towards a.s.r.'s target system for investments, presentation of interest income and interest expenses on derivates is harmonised, resulting in an increase of interest income and interest expenses for derivatives of the same amount, with no impact on the total result.
7.6.5 Net fair value gains (and losses)
See accounting policy D and E.
Net fair value gains (and losses) per category
| 2025 | 2024 | |
|---|---|---|
| Net fair value gains (and losses) on financial instruments measured at FVTPL | ||
| Investments | ||
| - Real estate equity funds | 347 | 219 |
| - Mortgage equity funds | -48 | 50 |
| - Government bonds | -1,479 | -441 |
| - Corporate bonds | -4 | 210 |
| - Asset-backed securities | - | 1 |
| - Other investment funds | -109 | 123 |
| - Equities | 58 | 32 |
| - Mortgage loans | -681 | 982 |
| - Private loans | -307 | 87 |
| Investments related to direct participating insurance contracts | 802 | 3,218 |
| Derivatives | -2,892 | -253 |
| Cash and cash equivalents | 3 | 23 |
| -4,310 | 4,250 | |
| Net fair value gains (and losses) on financial instruments not measured at FVTPL | ||
| Net foreign exchange gains (and losses) | 11 | -2 |
| Derecognition of financial assets at amortised cost | -1 | - |
| Derecognition of financial liabilities at amortised cost | -5 | - |
| 4 | -2 | |
| Other net fair value gains (and losses) | ||
| Investment property, property for own use and plant | 212 | 211 |
| 212 | 211 | |
| Total net fair value gains (and losses) | -4,093 | 4,459 |
Net fair value gains and losses mainly arise from movements in interest rates and revaluations, and includes fair value gains and losses on assets as well as realised gains and losses on derivatives. Net fair value gains and losses for investments related to direct participating insurance contracts are mainly due to movements in stock market prices as well as movements in interest rates.
7.6.6 Impairments
See accounting policy C and E.
Impairments
| 2025 | 2024 | |
|---|---|---|
| Intangible assets | -16 | - |
| Property, plant and equipment | -3 | -3 |
| Financial assets at amortised cost | 1 | 1 |
| Total impairments | -18 | -2 |
| Impairments are presented in the following income statement line items: | ||
| Impairments on financial assets | 1 | 1 |
| Other expenses | -19 | -3 |
| Total impairments | -18 | -2 |
In 2025, the impairment on intangible assets related to an impairment of € 10 million in segment Asset Management and € 6 million in segment Non-life, see section 7.5.1.
For more information regarding loss allowance see section 7.8.4.7.
7.6.7 Net finance income and expenses from (re)insurance contracts
See accounting policy W4.
The table on the next page shows the sources of finance income and expenses recognised in profit or loss and other comprehensive income in relation to the total net finance expenses from (re)insurance contracts.
Investment and (re)insurance finance result current period
| 2025 | Non-Life | Life GMM | Life VFA | Other | Total |
|---|---|---|---|---|---|
| Investment income | |||||
| Direct investment income | 517 | 7,851 | 160 | 309 | 8,838 |
| Net fair value gains (and losses) | -166 | -4,715 | 802 | -15 | -4,093 |
| Net impairment (loss)/reversal on financial assets | - | 1 | - | 1 | 1 |
| Amounts recognised in other comprehensive income | 32 | 76 | - | -1 | 107 |
| Total investment income | 383 | 3,213 | 963 | 295 | 4,854 |
| Net finance expenses from insurance contracts | |||||
| Changes in fair value of underlying items of direct participating contracts | - | - | -936 | - | -936 |
| Effects of risk mitigation option | - | - | 565 | - | 565 |
| Interest accreted | -259 | -1,534 | - | - | -1,793 |
| Effect of changes in interest rates and other financial assumptions | 113 | 3,654 | 1 | - | 3,767 |
| Effect of measuring changes in estimates at current rates and adjusting the CSM at rates on initial recognition | -15 | -49 | - | - | -65 |
| Total net finance expenses from insurance contracts | -162 | 2,071 | -370 | - | 1,538 |
| Net finance income from reinsurance contracts | |||||
| Interest accreted | 8 | 6 | - | - | 14 |
| Other | -2 | -49 | - | - | -50 |
| Total net finance income from reinsurance contracts | 6 | -43 | - | - | -36 |
| Total | 227 | 5,241 | 592 | 295 | 6,355 |
Investment and (re)insurance finance result prior period
| 2024 | Non-Life | Life GMM | Life VFA | Other | Total |
|---|---|---|---|---|---|
| Investment income | |||||
| Direct investment income | 480 | 5,424 | 11 | 436 | 6,351 |
| Net fair value gains (and losses) | 203 | 1,068 | 3,218 | -29 | 4,459 |
| Net impairment (loss)/reversal on financial assets | 1 | - | - | 1 | |
| Amounts recognised in other comprehensive income | 57 | 180 | - | 7 | 243 |
| Total investment income | 740 | 6,671 | 3,229 | 414 | 11,054 |
| Net finance expenses from insurance contracts | |||||
| Changes in fair value of underlying items of direct participating contracts | - | - | -3,232 | - | -3,232 |
| Effects of risk mitigation option | - | - | 180 | - | 180 |
| Interest accreted | -312 | -2,023 | -24 | - | -2,360 |
| Effect of changes in interest rates and other financial assumptions | 44 | -323 | 4 | - | -275 |
| Effect of measuring changes in estimates at current rates and adjusting the CSM at rates on initial recognition | -4 | -67 | - | - | -71 |
| Total net finance expenses from insurance contracts | -272 | -2,414 | -3,072 | - | -5,757 |
| Net finance income from reinsurance contracts | |||||
| Interest accreted | 11 | 9 | - | - | 20 |
| Other | -1 | 7 | - | - | 6 |
| Total net finance income from reinsurance contracts | 10 | 16 | - | - | 26 |
| Total | 478 | 4,273 | 157 | 414 | 5,322 |
See section 7.6.5 for more information regarding net fair value gains (and losses).
Amounts recognised in other comprehensive income relate to revaluation of equity instruments held at FVOCI.
7.6.8 Other finance expenses
Breakdown of the other finance expenses
| 2025 | 2024 | |
|---|---|---|
| Other finance expenses on financial liabilities not measured at fair value | ||
| Subordinated liabilities | -98 | -115 |
| Borrowings | -144 | -179 |
| Due to banks | -95 | -149 |
| Other financial liabilities | -14 | -3 |
| Other finance expenses on other liabilities | ||
| Employee benefits | -175 | -176 |
| Derivatives | -5,475 | -3,395 |
| Other finance or fee expenses | -9 | -1 |
| Other finance expenses on assets | -18 | -13 |
| Total other finance expenses | -6,029 | -4,031 |
Other finance expenses increased by € 1,997 million mainly due to higher expenses on derivative contracts. In 2025, following the integration of Aegon life's derivatives portfolio towards a.s.r.'s target system for investments, presentation of interest income and interest expenses on derivates is harmonised, resulting in an increase of interest income and interest expenses for derivatives of the same amount, with no impact on the total result. The interest income on derivatives are disclosed in section 7.6.4.
7.6.9 Fee income
Fee income
| 2025 | 2024 | |
|---|---|---|
| Asset management for third parties | 100 | 144 |
| Other fee income | 489 | 374 |
| Total fee income | 589 | 518 |
Other fee income mainly relates to the fee income from the Distribution and Services entities including fee income earned by HumanTotalCare following the acquisition of the remaining 55% share, see section 7.4.5.
7.6.10 Other income
Other income
| 2025 | 2024 | |
|---|---|---|
| Proceeds from sales of property developments | 33 | 16 |
| Realised gains on derecognition of associates and joint ventures at equity method | 35 | - |
| Revenues generated by wind farms and solar parks | 46 | 43 |
| Revenues projects | 9 | 12 |
| Other income | 66 | 35 |
| Total other income | 189 | 107 |
Other income increased compared to 2024, mainly due to a revaluation of a property development project and pro-rata VAT deductions.
7.6.11 Operating and other expenses
Operating and other expenses
| 2025 | 2024 | |
|---|---|---|
| Salaries and wages | -615 | -567 |
| Social security contributions | -90 | -81 |
| Employee benefit charges | -115 | -113 |
| Employee discounts | -3 | -3 |
| Other short-term employee benefits | -30 | -33 |
| Total cost of own staff | -854 | -797 |
| Cost of external staff | -188 | -204 |
| Consultancy costs and fees | -221 | -209 |
| Marketing, advertising and public relations expenses | -25 | -19 |
| Technology and system costs | -155 | -165 |
| Amortisation of other intangible assets (chapter 7.5.1) | -78 | -47 |
| Depreciation of property, plant and equipment (chapter 7.5.2) | -26 | -29 |
| Restructuring provision expenses | -19 | -27 |
| Commission expenses | -805 | -789 |
| Costs associated with sale of development property | -18 | -13 |
| Operating expenses of wind farms and solar parks | -28 | -28 |
| Impairments on non-financial assets | -19 | -3 |
| Realised losses on derecognition of associates and joint ventures at equity method | -2 | |
| Other | -32 | -73 |
| Amounts attributed to insurance acquisition cash flows | 43 | 38 |
| Insurance acquisition cash flows recognised in profit or loss | -13 | -8 |
| Total operating and other expenses | -2,437 | -2,376 |
Presentation of the operating and other expenses in the income statement
| 2025 | 2024 | |
|---|---|---|
| Total operating expenses are presented in the following income statement line items: | ||
| Insurance service operating expenses | -1,359 | -1,350 |
| Investment operating expenses | -215 | -205 |
| Other expenses | -864 | -821 |
| Total operating and other expenses | -2,437 | -2,376 |
Segmentation of a.s.r.'s internal workforce
| Segments | 2025 | 2024 |
|---|---|---|
| Non-life | 1,764 | 1,728 |
| Life | 899 | 752 |
| Asset Management | 704 | 771 |
| Distribution and Services | 3,743 | 2,436 |
| Holding and Other | 1,580 | 1,687 |
| Total workforce | 8,689 | 7,373 |
The average number of of employees working for a.s.r. in 2025 is 7,669 FTE (2024: 7,526 FTE).
Employees related to administrative activities and overhead are allocated to segment Holding and Other.
During 2025, a.s.r.'s workforce increased, which is primarily driven by the acquisition of HumanTotalCare on 1 October, adding 1,428 FTE to a.s.r.'s workforce.
The following fees for the financial years have been charged by the Group's auditor to a.s.r. and its subsidiaries, on an accrual basis (excluding VAT).
Consultancy cost and fees include the Auditor's fee. For information on Auditor's fees see the table below:
Auditor's fees
| 2025 | 2024 | ||
|---|---|---|---|
| KPMG | Other auditor | KPMG | |
| Audit of the financial statements | 15.2 | - | 15.9 |
| Audit-related services | 2.3 | 1.2 | 2.3 |
| Total audit fees | 17.5 | 1.2 | 18.2 |
Fees for audit engagements include fees paid for the audit of the consolidated and company financial statements, interim reports and other reports.
In the above-mentioned years the fees relate to the network of the Group's auditor.
7.6.12 Income tax expense
Income tax (expense) / gain
| 2025 | 2024 | |
|---|---|---|
| Current taxes for the current period | -199 | -95 |
| Current taxes referring to previous periods | 26 | 156 |
| Total current tax | -172 | 62 |
| Deferred taxes arising from current period | 41 | -448 |
| Total deferred tax | 41 | -448 |
| Total income tax (expense) / gain | -131 | -387 |
The expected income tax expense is determined by applying the tax rate in the Netherlands to the result before tax. In 2025, this rate was 25.8% (2024: 25.8%). The enacted tax rate for 2026 will be 25.8%.
The impact of the current tax to previous periods is to a highly extent set off in the deferred taxes arising from current period.
Reconciliation of expected income tax (expense) / gain with the actual income tax (expense) / gain
| 2025 | 2024 | |
|---|---|---|
| Result before tax from continuing operations | 696 | 1,464 |
| Current tax rates | 25,8% | 25,8% |
| Expected income tax expense | -180 | -378 |
| Effects of: | ||
| Tax on interest on other equity instruments | 21 | 15 |
| Tax-exempt dividend | 16 | 11 |
| Tax-exempt capital gains | 10 | -1 |
| Tax-exempt associates and joint ventures | - | 2 |
| Tax-exempt other income | - | -3 |
| Changes in impairments | -2 | -2 |
| Adjustments for taxes due on previous financial years | - | -15 |
| Other effects | 4 | -16 |
| Total income tax (expense) / gain | -131 | -387 |
The result is almost entirely earned and taxable in the Netherlands.
The effective income tax rate is 18.8% (2024: 26.4%). The decrease of the effective income tax rate is mostly driven by the decrease of the result before tax from continuing operations, while the total impact from tax exempt items increased, resulting in a relatively larger impact from tax exempt items on the effective income tax rate.
International Tax Reform – Pillar II Model rules (Amendments to IAS 12)
The EU Directive Pillar Two, implemented in the Netherlands as the 'Wet minimum belasting', and is effective for accounting periods beginning on or after 1 January 2024, applies to multinational enterprises and large-scale domestic groups with consolidated revenues of € 750 million or more in at least two out of the last four years. These revenues, as defined by the OECD, include any form of income and are therefore not limited to revenue recognised in accordance with IFRS 15. a.s.r. operates in the Netherlands as a large-scale domestic group and should, in principle, be subject to the top-up tax rules under Pilar 2. a.s.r. has determined that any top-up tax due under Pillar 2 is an income tax within the scope of IAS 12 and accounts for it as a current tax when it is incurred.
However, a.s.r. has assessed the potential exposure to Pillar 2 and does not expect the impact of the Pillar 2 income taxes to be material. This is because a.s.r. can rely on:
The domestic group exemption during the first five years after the Pillar 2 legislation comes into effect; and
The Transitional CbCR Safe Harbour rules during the first three years after the Pillar 2 legislation comes into effect, which allows a.s.r. to reduce the top-up tax to zero.
Although a.s.r. could reduce any top-up tax to zero during the first five years by applying a combination of the domestic group exemption and the Transitional CbCR Safe Harbour rules, a.s.r. notes that it applies the temporary mandatory relief from recognising and disclosing information about deferred taxes related to Pillar 2 income taxes.
a.s.r. will continue to monitor the developments of Pillar 2 legislation, the applicability of the domestic group exemption, and the applicability of the CbCR Safe Harbour rules on the Group's financial position.
7.7 Other notes
7.7.1 Fair value of assets and liabilities
See accounting policy B.
7.7.1.1 Financial assets and liabilities measured at fair value
Breakdown of financial assets measured at fair value
| Fair value based on quoted prices in an active market | Fair value based on observable market data | Fair value not based on observable market data | ||
|---|---|---|---|---|
| 31 December 2025 | Level 1 | Level 2 | Level 3 | Total fair value |
| Investments at FVTPL | ||||
| Investments - own risk | ||||
| Real estate equity funds | - | - | 6,102 | 6,102 |
| Mortgage equity funds | - | - | 2,043 | 2,043 |
| Government bonds | 15,946 | 317 | - | 16,263 |
| Corporate bonds | 9,693 | 1,003 | - | 10,696 |
| Asset-backed securities | - | - | 2,162 | 2,162 |
| Other investment funds | 640 | 584 | 1,308 | 2,532 |
| Equities | 913 | - | - | 913 |
| Mortgage loans | - | - | 24,821 | 24,821 |
| Private loans | 46 | 8,375 | 11 | 8,433 |
| 27,239 | 10,280 | 36,447 | 73,966 | |
| Investments related to direct participating insurance contracts | ||||
| Real estate equity funds | 1,057 | - | - | 1,057 |
| Government bonds | 6,630 | - | - | 6,630 |
| Corporate bonds | 3,702 | - | - | 3,702 |
| Asset-backed securities | - | - | 527 | 527 |
| Other investment funds | 407 | 457 | 95 | 959 |
| Derivatives | - | -411 | - | -411 |
| Equities | 16,028 | - | - | 16,028 |
| Mortgage loans | - | - | 1,753 | 1,753 |
| Private loans | - | 241 | - | 241 |
| Other investments | 2,813 | 2 | - | 2,815 |
| 30,637 | 289 | 2,376 | 33,302 | |
| Investments at FVOCI | ||||
| Equities | 2,436 | - | 55 | 2,491 |
| Preference shares | - | 130 | 5 | 135 |
| Other participating contracts | 12 | - | - | 12 |
| 2,448 | 130 | 60 | 2,638 |
Breakdown of financial assets measured at fair value
| Fair value based on quoted prices in an active market | Fair value based on observable market data | Fair value not based on observable market data | ||
|---|---|---|---|---|
| 31 December 2025 | Level 1 | Level 2 | Level 3 | Total fair value |
| Derivatives | ||||
| Foreign exchange contracts | - | 24 | - | 24 |
| Interest rate contracts | ||||
| - Swaps | - | 14,722 | - | 14,722 |
| - Options | - | 700 | - | 700 |
| - Futures | 10 | - | - | 10 |
| - Caps | - | 152 | - | 152 |
| Equity index contracts | 34 | 13 | - | 47 |
| Inflation linked swaps | - | 250 | - | 250 |
| 44 | 15,860 | - | 15,905 | |
| Cash and cash equivalents | 1,989 | 720 | - | 2,709 |
| Total financial assets measured at fair value | 62,358 | 27,279 | 38,883 | 128,520 |
Breakdown of financial liabilities measured at fair value
| Fair value based on quoted prices in an active market | Fair value based on observable market data | Fair value not based on observable market data | ||
|---|---|---|---|---|
| 31 December 2025 | Level 1 | Level 2 | Level 3 | Total fair value |
| Financial liabilities | ||||
| Derivatives | ||||
| Foreign exchange contracts | - | 38 | - | 38 |
| Interest rate contracts | ||||
| - Swaps | - | 14,999 | - | 14,999 |
| - Options | - | 163 | - | 163 |
| - Caps | - | 152 | - | 152 |
| Equity index contracts | 2 | 25 | - | 27 |
| Inflation linked swaps | - | 75 | - | 75 |
| 2 | 15,451 | - | 15,453 | |
| Total financial liabilities measured at fair value | 2 | 15,451 | - | 15,453 |
Breakdown of financial assets measured at fair value
| Fair value based on quoted prices in an active market | Fair value based on observable market data | Fair value not based on observable market data | ||
|---|---|---|---|---|
| 31 December 2024 | Level 1 | Level 2 | Level 3 | Total fair value |
| Investments at FVTPL | ||||
| Investments - own risk | ||||
| Real estate equity funds | - | - | 5,428 | 5,428 |
| Mortgage equity funds | - | - | 2,031 | 2,031 |
| Debt equity funds | 12 | 64 | 562 | 639 |
| Government bonds | 14,516 | 1,259 | - | 15,774 |
| Corporate bonds | 9,854 | 767 | - | 10,621 |
| Asset-backed securities | - | - | 3,023 | 3,023 |
| Other investment funds | 740 | 720 | 608 | 2,068 |
| Equities | 553 | - | - | 553 |
| Mortgage loans | - | - | 25,398 | 25,398 |
| Private loans | 29 | 9,535 | 19 | 9,584 |
| 25,704 | 12,346 | 37,070 | 75,119 | |
| Investments related to direct participating insurance contracts | ||||
| Real estate equity funds | 243 | - | - | 243 |
| Mortgage equity funds | - | - | 352 | 352 |
| Debt equity funds | 18 | - | - | 18 |
| Government bonds | 6,373 | - | - | 6,373 |
| Corporate bonds | 3,375 | - | - | 3,375 |
| Asset-backed securities | - | - | 333 | 333 |
| Other investment funds | 299 | 224 | 373 | 896 |
| Derivatives | -31 | 104 | - | 73 |
| Equities | 16,078 | - | - | 16,078 |
| Mortgage loans | - | - | 1,421 | 1,421 |
| Private loans | - | 245 | - | 245 |
| Other investments | 2,493 | 1,124 | - | 3,617 |
| 28,850 | 1,697 | 2,478 | 33,025 |
Breakdown of financial assets measured at fair value
| Fair value based on quoted prices in an active market | Fair value based on observable market data | Fair value not based on observable market data | ||
|---|---|---|---|---|
| 31 December 2024 | Level 1 | Level 2 | Level 3 | Total fair value |
| Investments at FVOCI | ||||
| Equities | 2,643 | - | 53 | 2,696 |
| Preference shares | - | 129 | 4 | 134 |
| Other participating contracts | 11 | - | - | 11 |
| 2,654 | 129 | 57 | 2,841 | |
| Derivatives | ||||
| Foreign exchange contracts | - | 46 | - | 46 |
| Interest rate contracts | ||||
| - Swaps | - | 10,644 | - | 10,644 |
| - Options | - | 704 | - | 704 |
| - Futures | 52 | - | - | 52 |
| Equity index contracts | 31 | 13 | - | 44 |
| Inflation linked swaps | - | 277 | - | 277 |
| 84 | 11,684 | - | 11,767 | |
| Cash and cash equivalents | 2,564 | 1,629 | - | 4,194 |
| Total financial assets measured at fair value | 59,855 | 27,485 | 39,606 | 126,946 |
Breakdown of financial liabilities measured at fair value
| Fair value based on quoted prices in an active market | Fair value based on observable market data | Fair value not based on observable market data | ||
|---|---|---|---|---|
| 31 December 2024 | Level 1 | Level 2 | Level 3 | Total fair value |
| Financial liabilities | ||||
| Derivatives | ||||
| Foreign exchange contracts | - | 189 | - | 189 |
| Interest rate contracts | ||||
| - Swaps | - | 8,334 | - | 8,334 |
| - Options | - | 49 | - | 49 |
| - Futures | 3 | - | - | 3 |
| Equity index contracts | - | 55 | - | 55 |
| Inflation linked swaps | - | 37 | - | 37 |
| 3 | 8,663 | - | 8,666 | |
| Total financial liabilities measured at fair value | 3 | 8,663 | - | 8,666 |
Cash and cash equivalents (excluding money market instruments) are classified as level 1 when not subject to restrictions. Money market instruments are classified as level 2.
Reclassification between categories
| 2025 | To level 1 | To level 2 | To level 3 | Total |
|---|---|---|---|---|
| From | ||||
| Level 1: Fair value based on quoted prices in active market | - | 119 | - | 119 |
| Level 2: Fair value based on observable market data | 487 | - | - | 487 |
| Level 3: Fair value not based on observable market data | - | - | - | - |
Debt instrument funds are adjusted from level 2 to level 1 (€ 487 million) and from level 1 to level 2 (€ 119 million). These movements are based respectively on increased and decreased observability of the inputs during the period.
Reclassification between categories
| 2024 | To level 1 | To level 2 | To level 3 | Total |
|---|---|---|---|---|
| From | ||||
| Level 1: Fair value based on quoted prices in active market | - | 73 | - | 73 |
| Level 2: Fair value based on observable market data | 122 | - | - | 122 |
| Level 3: Fair value not based on observable market data | - | - | - | - |
Debt instrument funds are adjusted from level 2 to level 1 (€ 122 million) and from level 1 to level 2 (€ 73 million). These movements are based respectively on increased and decreased observability of the inputs during the period.
The following two tables show the movement in financial assets measured at fair value including investments relating to direct participating insurance contracts and investment property that are categorised within level 3.
Changes in financial assets classified as FVOCI categorised within level 3
| 2025 | 2024 | |
|---|---|---|
| At 1 January | 57 | 62 |
| Unrealised gains and losses recognised in other comprehensive income | 3 | -4 |
| At 31 December | 60 | 57 |
Changes in financial assets at FVTPL categorised within level 3
| 2025 | 2024 | |
|---|---|---|
| At 1 January | 39,548 | 37,424 |
| Changes in value of investments, realised/unrealised gains and losses: | ||
| - Fair value gains and losses | -497 | 1,394 |
| Purchases | 6,523 | 6,492 |
| Disposals | -2,924 | -3,467 |
| Repayments | -3,424 | -2,193 |
| Net transfer of real estate equity funds | 178 | - |
| Exchange rate differences | -7 | 8 |
| Other changes | -575 | -110 |
| At 31 December | 38,823 | 39,548 |
| Total revaluations of investments, held at end of period, recognised in the income statement | -474 | 1,381 |
The net transfer of real estate equity funds relates to ASR DSPF. As per April 2025 a.s.r. lost control of ASR DSPF, see sections 7.5.3 and 7.5.4.
Other changes mainly relate to a reclassification of the savings part of savings mortgages of Aegon life from mortgage loans (level 3) to private loans (level 2) following harmonisation of the presentation of savings mortgages.
Unobservable inputs used in determining the fair value for financial assets measured at fair value (recurring basis) that are categorised within level 3
Investments at FVOCI
The main non-observable market input for the equities classified as level 3 is the net asset value as published by the investee. It is estimated that a 10% increase in valuation of these equities would have no impact on net result due to the non-recycling nature of equity treatment, but would increase equity by € 5 million (2024: € 5 million), being approximately 0.1% (before tax) (2024: 0.1% (before tax)) of total equity.
Investments at FVTPL
The mortgage loan portfolio is classified as level 3 'not measured on the basis of market observable data'. Non-observable market inputs are used in the valuation methods, in addition to the observable market inputs. The valuation method used to determine the fair value of the mortgage loan portfolio is based on the mortgage spread, adapted for a delayed response to interest rate movements, and of the risk-free interest rate curve and assumptions for unexpected full prepayments, originating costs, and the options related to early redemption and moving. In line with industry standards that were published in 2025, a.s.r. updated the mortgage spread model, reducing the volatility of the mortgage spreads used in the valuation. See section 7.5.5.1 for further details on the model update.
The mortgage loan portfolio consists of high-quality mortgages with a relatively fixed return, limited arrears. The mortgage loan portfolio consists only of Dutch mortgages with a limited counterparty default risk in line with the strategic investment plan, see section 7.8.4.
The fair value of asset-backed securities is based on quotes retrieved from brokers or data vendors. The quotes are validated monthly and challenged if deemed necessary. The fair value of securitisations are determined based on a discounted cash flow model in case market quotes are insufficiently liquid.
The main non-observable market input for the other investment funds classified as level 3 is the net asset value as published by the investee. It is estimated that a 10% increase in valuation of these equities would increase result before tax and equity by € 131 million (2024: € 61 million), being approximately 1.3% (before tax) (2024: 0.6% (before tax)) of total equity.
The method of determining the fair value of the mortgage equity funds is based on the valuation of the underlying mortgage loans. The discounting curve used in this valuation is based on the two lowest tariffs in the market, excluding that of a.s.r.
The table on the next page discloses the sensitivities to non-observable market inputs for the real estate equity funds.
Unobservable and observable inputs used in determination of fair value
| 31 December 2025 | ||||||
|---|---|---|---|---|---|---|
| Fair value | Valuation technique | Gross | Gross theoretical rental value (€) | Gross | Gross yield (%) | |
| Investments at fair value through profit or loss | ||||||
| Real estate equity funds associates | 5,265 | DCF | 200,951,044 | 3.8% | ||
| Real estate equity funds third parties | 838 | |||||
| Total real estate equity funds | 6,102 | |||||
Unobservable and observable inputs used in determination of fair value
| 31 December 2024 | ||||||
|---|---|---|---|---|---|---|
| Fair value | Valuation technique | Gross | Gross theoretical rental value (€) | Gross | Gross yield (%) | |
| Investments at fair value through profit or loss | ||||||
| Real estate equity funds associates | 3,485 | DCF | 118,027,068 | 3.4% | ||
| Real estate equity funds third parties | 1,943 | |||||
| Total real estate equity funds | 5,428 | |||||
The significant inputs to the level 3 values of real estate equity funds associates are disclosed in accounting policy B.
An increase (decrease) in the gross yield in isolation will result in a lower (higher) fair value of the real estate equity funds associates. An increase (decrease) in the theoretical rental value in isolation will result in a higher (lower) fair value.
The main non-observable market input for the real estate equity funds third parties is the net asset value as published by the investee. An increase or decrease in the net asset value of equities classified as level 3 will have a direct proportional impact on the fair value of the investment.
7.7.1.2 Financial assets and liabilities not measured at fair value
Breakdown of financial assets and liabilities not measured at fair value
| Fair value based on quoted prices in an active market | Fair value based on observable market data | Fair value not based on observable market data | |||
|---|---|---|---|---|---|
| 31 december 2025 | Level 1 | Level 2 | Level 3 | Total fair value | Total carrying value |
| Financial assets | |||||
| Mortgage loans | - | - | 2,479 | 2,479 | 2,529 |
| Private loans | - | - | 8 | 8 | 8 |
| Other financial assets | 4,876 | 607 | - | 5,483 | 5,483 |
| Total financial assets not measured at fair value | 4,876 | 607 | 2,487 | 7,970 | 8,020 |
| Financial liabilities | |||||
| Subordinated liabilities | - | 1,695 | - | 1,695 | 1,503 |
| Borrowings | - | 3,202 | 120 | 3,322 | 3,301 |
| Due to banks | 3,344 | 766 | - | 4,110 | 4,110 |
| Other financial liabilities | 50 | 622 | - | 672 | 672 |
| Total financial liabilities not measured at fair value | 3,394 | 6,285 | 120 | 9,799 | 9,585 |
Breakdown of financial assets and liabilities not measured at fair value
| Fair value based on quoted prices in an active market | Fair value based on observable market data | Fair value not based on observable market data | |||
|---|---|---|---|---|---|
| 31 December 2024 | Level 1 | Level 2 | Level 3 | Total fair value | Total carrying value |
| Financial assets | |||||
| Mortgage loans | - | - | 2,576 | 2,576 | 2,624 |
| Private loans | - | - | 9 | 9 | 9 |
| Other financial assets | 2,559 | 494 | - | 3,053 | 3,053 |
| Total financial assets not measured at fair value | 2,559 | 494 | 2,585 | 5,639 | 5,687 |
| Financial liabilities | |||||
| Subordinated liabilities | - | 2,205 | - | 2,205 | 2,007 |
| Borrowings | - | 3,062 | 74 | 3,136 | 3,135 |
| Due to banks | 5,429 | 121 | - | 5,550 | 5,550 |
| Other financial liabilities | 24 | 605 | - | 629 | 620 |
| Total financial liabilities not measured at fair value | 5,453 | 5,993 | 74 | 11,520 | 11,312 |
The method of determining the fair value of the mortgage loans at amortised cost is the same to that of mortgage loans held at FVTPL. For information regarding the measurement of the fair value of the mortgage loans, see section 7.7.1.1.
Amounts due to banks classified as level 1 comprise the liability recognised for the cash collateral received.
7.7.1.3 Property (including land and buildings for own use and plant)
Breakdown of the fair value of the investment property, land and buildings for own use and plant
| Fair value based on quoted prices in an active market | Fair value based on observable market data | Fair value not based on observable market data | ||
|---|---|---|---|---|
| 31 December 2025 | Level 1 | Level 2 | Level 3 | Total fair value |
| Investment property | - | - | 3,220 | 3,220 |
| Land and buildings for own use | - | - | 143 | 143 |
| Plants | - | - | 353 | 353 |
| Total | - | - | 3,716 | 3,716 |
Breakdown of the fair value of the investment property, land and buildings for own use and plant
| Fair value based on quoted prices in an active market | Fair Value based on observable market data | Fair Value not based on observable market data | ||
|---|---|---|---|---|
| 31 December 2024 | Level 1 | Level 2 | Level 3 | Total fair value |
| Investment property | - | - | 3,364 | 3,364 |
| Land and buildings for own use | - | - | 164 | 164 |
| Plants | - | - | 386 | 386 |
| Total | - | - | 3,913 | 3,913 |
The property portfolio is classified as a level 3 ‘not measured on the basis of market observable market data’. Non- observable market inputs are used in the valuation methods, in addition to the observable market inputs. The fair value measurement at reporting date is based on valuations by independent professional appraisers. These valuations have been performed annually, with quarterly updates, for the entire portfolio of investment property, buildings for own use and plant. Independent professional appraisers use reference transactions of comparable properties, in combination with the DCF and income capitalisation method, to determine the fair value of the property or plant. The reference transactions of comparable objects of the property portfolio are generally based on observable data consisting of the land register ‘Kadaster’ and the rural land price monitor as published by the Dutch Government ‘Grondprijsmonitor’ in an active property market.
The property has a relatively fixed return. The property portfolio is well diversified and consists of residential, retail, offices and rural property, throughout the Netherlands. The retail portfolio focusses on core retail locations with relative low vacancy rates. The following table shows a breakdown of the fair value and vacancy rates of the portfolio of investment property.
Breakdown of investment property
| Fair value | Vacancy rate | |||
|---|---|---|---|---|
| 31 December 2025 | 31 December 2024 | 2025 | 2024 | |
| Retail | 61 | 153 | 2.4% | 3.1% |
| Residential | 2,678 | 2,512 | 1.6% | 1.7% |
| Rural | 244 | 220 | - | - |
| Offices | 212 | 399 | 40.3% | 15.4% |
| Property under development | 10 | 67 | 100.0% | 100.0% |
| Parking | 13 | 13 | - | - |
| Total | 3,220 | 3,364 | 4.3% | 5.2% |
The movements in plant and investment property measured at fair value (recurring basis) that are categorised within level 3 are presented in section 7.5.2 and section 7.5.3.
The significant inputs to the level 3 values of investment property are disclosed in accounting policy B.
An increase (decrease) in the gross yield in isolation will result in a lower (higher) fair value of the investment property and land and buildings for own use. An increase (decrease) in the theoretical rental value in isolation will result in a higher (lower) fair value.
The significant unobservable and observable inputs to the Level 3 values of plant are the energy prices and market interest rates. An increase (decrease) of the discount rate will lead to a lower (higher) fair value measurement
The table below discloses the sensitivities to non-observable market inputs for the property portfolio (excluding property under development, parking and plant).
Unobservable and observable inputs used in determination of fair value
| 31 December 2025 | ||||||
|---|---|---|---|---|---|---|
| Fair value | Valuation technique | Gross | Gross theoretical rental value (€) | Gross | Gross yield (%) | |
| Investment property - Fair value model | ||||||
| Retail | 61 | DCF | total | 2,166,637 | mean | 3.5% |
| max | 744,980 | max | 6.1% | |||
| min | 95,250 | min | 1.8% | |||
| Residential | 2,678 | DCF | total | 110,074,304 | mean | 4.1% |
| max | 5,733,508 | max | 12.1% | |||
| min | - | min | - | |||
| Rural | 244 | DCF | total | 5,828,651 | mean | 2.4% |
| max | 2,351,106 | max | 3.5% | |||
| min | 13,336 | min | 1.5% | |||
| Offices | 212 | DCF | total | 12,488,319 | mean | 5.9% |
| max | 7,321,181 | max | 8.8% | |||
| min | - | min | - | |||
| Property under development | 10 | |||||
| Parking | 13 | |||||
| Land and buildings for own use | 143 | DCF | total | 10,509,850 | mean | 7.3% |
| max | 8,966,945 | max | 13.6% | |||
| min | 1,542,905 | min | 7.1% | |||
| Plant | 353 | |||||
| Total | 3,716 | |||||
Unobservable and observable inputs used in determination of fair value
| 31 December 2024 | ||||||
|---|---|---|---|---|---|---|
| Fair value | Valuation technique | Gross | Gross theoretical rental value (€) | Gross | Gross yield (%) | |
| Investment property - Fair value model | ||||||
| Retail | 153 | DCF | total | 10,744,691 | mean | 7.0% |
| max | 1,871,288 | max | 11.6% | |||
| min | 104,781 | min | 2.4% | |||
| Residential | 2,512 | DCF | total | 126,143,320 | mean | 5.0% |
| max | 5,438,948 | max | 11.8% | |||
| min | 5,179 | min | 2.6% | |||
| Rural | 220 | DCF | total | 5,646,002 | mean | 2.6% |
| max | 2,043,427 | max | 3.8% | |||
| min | 12,900 | min | 1.5% | |||
| Offices | 399 | DCF | total | 19,446,857 | mean | 4.9% |
| max | 6,440,939 | max | 9.5% | |||
| min | 60,128 | min | 3.4% | |||
| Property under development | 67 | |||||
| Parking | 13 | |||||
| Land and buildings for own use | 163 | DCF | total | 14,465,170 | mean | 9.1% |
| max | 8,663,755 | max | 22.1% | |||
| min | 1,542,905 | min | 6.8% | |||
| Plant | 386 | |||||
| Total | 3,913 | |||||
7.7.2 Cash flows from operating activities
Cash flows from operating activities
| (in € millions) | 2025 | 2024 |
|---|---|---|
| Cash generated from operating activities | ||
| Result before tax from continuing and discontinued operations | 696 | 1,625 |
| Adjustments on non-cash items included in result: | ||
| Revaluation through profit or loss | 1,607 | 523 |
| Retained share of result of associates and joint ventures | 18 | -16 |
| Depreciation and amortisation | 150 | 113 |
| Impairments | 20 | 28 |
| Addition to provision | 12 | 37 |
| Other | 57 | -25 |
| Changes in operating assets and liabilities: | ||
| Net (increase) / decrease in investment property | 96 | -86 |
| Net (increase) / decrease in investments | -475 | -1,992 |
| Net (increase) / decrease in investments related to direct participating contracts | 525 | 545 |
| Net (increase) / decrease in derivatives | -199 | -930 |
| Net (increase) / decrease in savings deposits | - | -102 |
| Net (increase) / decrease in amounts due to banks | -1,440 | 616 |
| Net (increase) / decrease in reinsurance contracts | 277 | -48 |
| Net increase / (decrease) in liabilities arising from insurance contracts | 1,761 | -1,007 |
| Net increase / (decrease) in liabilities arising from direct participating contracts | -611 | -658 |
| Net (increase) / decrease in other operating assets and liabilities | -3,033 | 780 |
| Income tax received (paid) | -32 | -102 |
| Cash flows from operating activities | -569 | -699 |
| Further details on cash flows from operating activities: | ||
| Interest received | 7,996 | 5,793 |
| Interest paid | -5,703 | -3,587 |
| Dividend received | 431 | 383 |
| Further details on lease payments: | ||
| Total cash outflow for leases | -10 | -15 |
7.7.3 Offsetting of financial assets and liabilities
The following tables include information about rights to offset and the related arrangements. The amounts included consist of all recognised financial instruments that are presented net in the balance sheet under the IFRS-EU offsetting requirements (legal right to offset and intention to settle on a net basis) and amounts presented gross in the balance sheet but subject to enforceable master netting arrangements or similar arrangements.
a.s.r. mitigates credit risk in derivative contracts by entering into collateral agreements, where practical, and in ISDA master netting agreements for each of the legal entities of a.s.r. to facilitate a.s.r.’s right to offset credit risk exposure. The credit support agreement will normally dictate the threshold over which collateral needs to be pledged by a.s.r. or its counterparty. Transactions requiring a.s.r. or its counterparty to post collateral are typically the result of over-the-counter derivative trades, comprised mostly of interest rate swaps, currency swaps and credit swaps. These transactions are conducted under terms that are customary to standard borrowing, derivative, securities lending and securities borrowing activities, as well as requirements determined by exchanges where the bank acts as intermediary.
Offsetting of financial assets
| Gross amounts of recognised financial assets | Gross amounts of recognised financial liabilities set off in the balance sheet | Net amounts of financial assets presented in the balance sheet | Related amounts not set off in the balance sheet | Net amount | ||
|---|---|---|---|---|---|---|
| Financial assets subject to offsetting, enforceable master netting arrangements and similar agreements | Financial instruments | Cash Collateral received (excluding surplus) | ||||
| 31 December 2025 | ||||||
| Derivatives | 15,631 | - | 15,631 | 10,302 | 3,344 | 1,985 |
| Total financial assets | 15,631 | - | 15,631 | 10,302 | 3,344 | 1,985 |
| 31 December 2024 | ||||||
| Derivatives | 11,704 | - | 11,704 | 8,149 | 3,261 | 294 |
| Total financial assets | 11,704 | - | 11,704 | 8,149 | 3,261 | 294 |
Offsetting of financial liabilities
| Gross amounts of recognised financial liabilities | Gross amounts of recognised financial assets set off in the balance sheet | Net amounts of financial liabilities presented in the balance sheet | Related amounts not set off in the balance sheet | Net amount | ||
|---|---|---|---|---|---|---|
| Financial liabilities subject to offsetting, enforceable master netting arrangements and similar agreements | Financial instruments | Cash Collateral pledged (excluding surplus) | ||||
| 31 December 2025 | ||||||
| Derivatives | 15,452 | - | 15,452 | 10,302 | 3,358 | 1,792 |
| Total financial liabilities | 15,452 | - | 15,452 | 10,302 | 3,358 | 1,792 |
| 31 December 2024 | ||||||
| Derivatives | 8,664 | - | 8,664 | 8,149 | 515 | - |
| Total financial liabilities | 8,664 | - | 8,664 | 8,149 | 515 | - |
7.7.4 Related party transactions
A related party is a person or entity that has significant influence over another entity, or has the ability to affect the financial and operating policies of the other party. Parties related to a.s.r. include associates, joint ventures, key management personnel, close family members of any person referred to above, entities controlled or significantly influenced by any person referred to above and any other affiliated entity.
The Group regularly enters into transactions with related parties during the conduct of its business. These transactions mainly involve loans, deposits and commissions, and are conducted on terms equivalent to those that prevail in at arm's length transactions.
Positions and transactions between a.s.r., associates, joint ventures and other related parties
The table below shows the financial scope of a.s.r.’s related party transactions:
Associates;
Joint ventures;
Aegon Ltd. and its group companies (since Aegon Ltd. has significant influence over a.s.r.).
Related party transactions current year
| Associates | Joint ventures | Aegon Ltd. Group | Total | |
|---|---|---|---|---|
| 2025 | ||||
| Balance sheet items with related parties as at 31 December | ||||
| Loans and receivables | 45 | 1 | 2 | 48 |
| Other liabilities | - | - | 5 | 5 |
| Transactions in the income statement for the financial year | ||||
| Fee income | 44 | - | 20 | 64 |
| Operating and other expenses | - | - | 62 | 62 |
Related party transactions prior year
| Associates | Joint ventures | Aegon Ltd. Group | Total | |
|---|---|---|---|---|
| 2024 | ||||
| Balance sheet items with related parties as at 31 December | ||||
| Loans and receivables | 46 | 1 | 8 | 55 |
| Transactions in the income statement for the financial year | ||||
| Interest income | 1 | - | - | 1 |
| Fee income | 39 | - | 22 | 61 |
| Operating and other expenses | 2 | - | 78 | 80 |
No provisions for impairments have been recognised on the loans and receivables for the years 2025 and 2024.
Aegon Ltd. group
Aegon Ltd. has an exclusive right until 4 July 2028 to nominate up to two members of the Supervisory Board (if Aegon Ltd. holds more than 20% of the shares it may nominate two members, if it holds 20% or less but more than 10% of the shares it may nominate one member). In addition, Aegon Ltd. has the right to designate its nominees for the Audit and Risk Committee and the ESG Committee if certain conditions are met. Furthermore, in case the incumbent CEO of a.s.r. does not serve the full term due to earlier resignation or dismissal, the appointment of the successor requires the unanimous vote of all Supervisory Directors in office.
Transitional service agreements (TSAs) safeguard the availability of services between a.s.r. and Aegon Ltd. group (including its subsidiaries), during the integration of the Aegon entities obtained with the business combination of 2023, such as IT infrastructure and asset management services. Prices are determined on an at arm's length basis. To ensure full disentanglement from the Aegon Ltd. group over the integration period, strict timelines and a strong governance have been put in place. The amounts outstanding are unsecured and will be settled in cash. No guarantees have been given or received.
In September 2025, a.s.r. participated in the partial selldown of Aegon Ltd.'s position in a.s.r. Therefore, a.s.r. repurchased 1,875 thousand shares related to the accelerated bookbuild of Aegon Ltd. This repurchase represents a 15% participation in the offering by Aegon Ltd. for an amount of € 105 million (average share price € 56.00). With the partial selldown, Aegon Ltd.'s shareholding in a.s.r. is reduced by 6% from 29.96% to approximately 24%. See section 7.5.11.5 for more information.
The DB obligation of former Aegon NL classifies as multiple-employer contract. For more information, see section 7.5.15.1.
In 2025, a.s.r. paid € 200 million dividend to Aegon Ltd. (2024: € 188 million). In 2025 a.s.r. received € 55 million from Aegon Ltd. for tax settlement for the years 2022 and 2023, when Aegon Nederland was still part of the fiscal unity Aegon.
Key management personnel
The remuneration of the key management personnel is disclosed in section 7.7.5.
The Management Board (MB) consists of 6 members. The three members of the Executive Board (EB) are also members of the MB. The members of the MB have mortgage loans with a.s.r. amounting to € 2,529 thousand (2024: € 2,282 thousand). The mortgages have been issued at arm's length conditions. For mortgage loans for personnel, issued before 1 January 2015, interest-rate discount under the normal employee conditions can be applicable. For one member of the MB this interest-rate discount is applicable. The interest-rate discount is reimbursed via the monthly salary payment and part of the fringe benefits, see section 7.7.5. The average interest on the mortgage loans for MB-members is 2.52% (2024: 2.44%). In 2025, the mortgage loans of MB-members were settled for an amount of € 88 thousand (2024: € 131 thousand). The members of the Supervisory Board (SB) have no mortgage loans.
7.7.5 Key management personnel remuneration
Transactions with key management personnel (MB members and SB) are transactions with related parties. Additional information on the remuneration of members of the MB and SB is disclosed in the remuneration report; see section 5.3.
Annual remuneration Management Board
| Amounts in € thousands | Executive board | MB members | Total 2025 | Executive board | MB members | Total 2024 |
|---|---|---|---|---|---|---|
| Fixed compensation | ||||||
| Base salary in cash | 3,249 | 1,545 | 4,794 | 2,987 | 1,392 | 4,379 |
| Base salary in shares | 773 | 154 | 928 | 713 | 145 | 858 |
| Fringe benefits1 | 84 | 86 | 170 | 82 | 77 | 159 |
| Other | ||||||
| Extraordinary items2 | - | 43 | 43 | - | 51 | 51 |
| Pension expense3 | 900 | 365 | 1,266 | 785 | 342 | 1,127 |
| Total remuneration | 5,007 | 2,194 | 7,201 | 4,567 | 2,007 | 6,574 |
- Variations arise as a result of the fiscal treatment of lease vehicles depending on the price and private use of the car, personal allowance and social security.
- In 2025 and 2024, based on existing rights before the Aegon NL transaction, a number of Aegon Ltd. shares were settled in cash to MB members (former Aegon Ltd. employees).
- The annual pension expenditure is based on a premium table. Further changes in the cost of pension benefits are mainly due to the impact of age. The pension costs include DC pensions based on maximum pensionable salary cap, compensation for the maximum pensionable salary cap (to be used for pensions at the employees’ discretion), and VPL. The amount presented is excluding amounts related to the indexation of the defined benefit plan, as they are not expenses in the current year.
In the table above, ‘Executive Board’ refers to the three members of the EB as at 31 December 2025 and 31 December 2024.
The total remuneration of the SB in 2025 amounts to € 564 thousand (2024: € 527 thousands). The total annual remuneration of key management personnel, consisting of all members of the MB and SB, amounts to € 7,765 thousand (2024: € 7,101 thousand).
The number of shares that are allocated (granted) for EB members is 8,680 shares and for MB members is 1,734 shares (2024: EB 5,051 shares and MB 2,004 shares). The shares are purchased by the EB and MB at a discount of 18.5%. The average grant price of the share is € 44.99 (2024: € 36.57), which is equal to the opening stock price on the Euronext Amsterdam stock exchange on the 1st trading day after the salary-payment date in each month in the period January to December 2025 (2024: January to December), taken into consideration the aforementioned discount.
The personnel conditions, e.g. discount on non-life insurance products, that apply to all personnel also apply to key management personnel. No discount is provided on life insurance products.
7.7.6 Employee Share Purchase Plan
In 2019 a.s.r. issued an employee share purchase plan (ESPP or ‘the plan’). a.s.r. employees are thereby given the opportunity to acquire a.s.r. shares at a discount. a.s.r. can suspend or withdraw the plan at any time. There is no option under the plan for either a.s.r. or the employee to settle in cash or other assets. Therefore the plan is an equity-settled share-based payments plan.
In 2023, a.s.r. has introduced the revised remuneration policy for EB and MB members, see section 7.7.5.
Under the terms of the plan the granting and vesting is predefined. The grant date of the plan is the moment the employee registers to participate in the plan. The shares vest immediately on the transaction date when cash is received from the employee, unconditionally, subject only to a post-vesting transfer restriction of five years. Otherwise, there are no specific restrictions to the share (i.e. voting power, dividend restrictions).
The employees purchase the shares at a discount of 18.5%. The fair value of the a.s.r. share with a lock-up of five years at the grant date equals the purchased price by the employee. The ESPP has an impact on equity through the adjustment in the treasury shares and retained earnings. See section 7.5.11.5 Treasury shares for more information.
The number of shares purchased by employees during the reporting period was 235 thousand for an amount of € 11 million (2024: 268 thousand for an amount of € 9 million).
7.7.7 Contingent liabilities and assets
7.7.7.1 General claims and disputes
The Group is a respondent in a number of claims, disputes and legal proceedings arising from the normal conduct of business.
Provisions are formed for such occurrences if, in management's opinion and after consultation with its legal advisors, a.s.r. is likely to have to make payments and the payable amount can be estimated with sufficient reliability. The probable costs related to the compensation schemes for unit-linked insurance contracts have been fully recognised based on management's current knowledge of relevant facts, claims and events. These provisions are included in the legal provisions (see section 7.5.16) and, for 2024, under the liabilities arising from insurance contracts. Further information on the unit-linked insurance contracts is provided in section 7.7.7.2.
Dutch insurers continue to receive insurance policies complaints and claims based on grounds other than the cost compensation. Possible future legal proceedings could have a substantial financial and reputational impact. However it is not possible at this time to make reliable estimates of the number of expected proceedings, possible future precedents and the financial impact of possible future proceedings. Currently there are no indications that an additional provision would be necessary for a.s.r.
As for other claims and legal proceedings, against a.s.r. known to management (and for which, in accordance with the defined principles, no provision has been formed), management believes, after having sought expert advice, that these claims have no chance of success, or that a.s.r. can successfully mount a defence against them, or that the outcome of the proceedings is unlikely to result in a significant loss for a.s.r.
7.7.7.2 Pending litigation portfolio and product-related issues
Unit-linked products (beleggingsverzekeringen)
Since 2006, Dutch unit-linked life insurance products have been subject to public criticism regarding fees and transparency, giving rise to industry-wide compensation schemes and collective claims initiated by consumer groups. a.s.r. was involved in several collective actions, which were ultimately resolved through a comprehensive settlement with five consumer protection organisations, finalised in February 2025. The agreement did not admit excessive charges and was accepted by virtually all affiliated customers. All related proceedings have been withdrawn, and the participating organisations have agreed not to initiate new actions.
Following the settlement's finalisation, a leniency scheme was introduced for non-affiliated customers with a closing date of 1 June 2025. A substantial portion of the settlement and leniency scheme obligation has already been paid in 2025, with the remainder scheduled for settlement in the first half of 2026.
These settlements have substantially reduced outstanding legal exposure. Nonetheless, Dutch insurers may continue to face residual risk, including the possibility of future claims and reputational impact. For further details regarding the recognised provisions, see section 7.5.16 .
Optas
In 2019 Optas had been merged into Aegon life, based on prior approval and instruction by the DNB. A limited number of policyholders opposed the merger and appealed the permission of DNB at the administrative Court. On 13 February 2023 the Administrative Court granted the objections and annulled the permission granted by the DNB. The Court found that DNB should have required that all policyholders should have been individually informed in writing regarding the merger and given the possibility to oppose the merger. The Court also found that DNB should have shared all (including those marked classified and sensitive) documents relating to the permission to the objectors. Based on the law (Wft) the legality of the merger is not affected by an administrative annulment. This has been confirmed by ruling of the Civil Court in a case against Aegon life, and by the Supreme Court of the Netherlands. An appeal procedure that is still pending relates to alleged rights to indexation of pension rights, that was lodged by a limited number of policyholders. In first instance the claims of these policyholders were denied by the District Court in Rotterdam. Aegon life does not expect the pending litigation at the Appeals Court to have a material impact on a.s.r.'s business, results of operations and financial position. However, there can be no assurances in this respect.
7.7.7.3 Obligations and guarantees
a.s.r. has entered into private loans agreements € 262 million (2024: € 502 million) and private equity agreements € 574 million (2024: € 100 million). Other commitments mainly consist of future purchases of interests in investment funds and amounts to € 813 million (2024: € 463 million).
a.s.r. has irrevocable facilities of € 1,250 million (2024: € 1,223 million) which mainly relate to mortgage loan offers issued. Mortgage loan commitments represent undrawn mortgage loan facilities provided and outstanding proposals on mortgages. In 2025 there are no sales of mortgage loans related to pre-announced redemptions on mortgage loans (2024: € 74 million).
Investment obligations for an amount of € 142 million (2024: € 345 million) have been assumed / issued for investment property.
The sale of real estate which relates to properties that are under contract to be sold as per 31 December 2025 amounts to € 146 million (2024: € 17 million). Real estate commitments represent the committed pipeline of investments in real estate projects.
Investment obligations and guarantees for a total amount of € 3 million (2024: € 3 million) have been issued for real estate development projects and the acquisition of property. Those guarantees were issued by principals for the execution of projects for the benefit of clients.
The share of contingent liabilities incurred in relation to interests in joint ventures amounts to € 13 million (2024: € 14 million). These contingent liabilities, not shown in the balance sheet, relate to investment obligations entered into by a.s.r. (for its share of approximately 50%) for real estate development projects of Amvest.
In October 2017, Aegon NL sold its shares in Unirobe Meeùs Groep (UMG) for € 295 million to Aon Groep Nederland. a.s.r. (after the business combination with Aegon NL) indemnifies and holds Aon Groep Nederland group (including UMG) harmless (until 2027) for and against any damage incurred resulting from unit-linked insurance claims prior to 1 January 2017 with respect to UMG’s portfolio of Unit Linked Policies. The aggregate liability for a.s.r. is maximised at an amount equal to the purchase price.
The Dutch guarantee fund for motorised traffic has a latent claim on all insurers offering legal liability products. In line with the advice of the guarantee fund a.s.r.'s contingent liability is € 11 million (2024: € 13 million).
7.7.7.4 Expected future lease payments
The following table sets out the expected future lease payments for investment property and plants, showing the undiscounted lease payments to be received after the reporting date.
| 31 December 2025 | 31 December 2024 | |
|---|---|---|
| To be received within 1 year | 22 | 39 |
| To be received between 1 and 2 years | 16 | 30 |
| To be received between 2 and 3 years | 14 | 24 |
| To be received between 3 and 4 years | 13 | 18 |
| To be received between 4 and 5 years | 11 | 16 |
| To be received after 5 years | 87 | 98 |
| Total undiscounted lease payments | 163 | 226 |
The investments properties, in retail, residential, offices and rural markets are leased to third parties, consisting of various lease terms in a range between shorter than one year and undetermined period with competitive rents mostly indexed to consumer prices. The plants are leased to third parties with lease terms longer than ten years.
7.7.8 Events after the balance sheet date
In July 2025, a.s.r. and Pensioenfonds Zorg & Welzijn (PFZW) announced that an agreement was reached to divide the real estate activities of Amvest as per January 2026. Following this announcement and approval by the Dutch Authority for the Financial Markets (Autoriteit Financiële Markten - AFM) and the Dutch Authority for Consumers and Markets (Autoriteit Consument & Markt - ACM), in January 2026 a.s.r. sold its' shares in Amvest Vastgoed B.V. to PFZW. The management of a.s.r.'s separate account, comprising approximately 7,500 residential units, is transferred to a.s.r. Besides, the development portfolio of Amvest Development Fund B.V. is split between PFZW and a.s.r.
In January 2026, a.s.r. reached an agreement with BOVAG on the full acquisition of all insurance activities of Bovemij N.V. (Bovemij), representing a premium volume of circa € 400 million. The purchase price amounts to € 185 million and will be paid in cash by a.s.r. Bovemij specialises in insurance and additional services for the mobility sector. Customers of Bovemij will continue to receive advisory and distribution services for insurance products under the trusted Bovemij and ENRA labels. For the distribution of insurance products, a.s.r. and BOVAG will establish a joint venture in which both parties will hold a 50% stake. Completion of the transaction is expected in the second half of 2026 and is subject to regulatory approvals.
On 18 February 2026, a.s.r. announced a share buyback of € 190 million (including €15 million for the management and the employee share plans) starting on 18 February 2026, which is expected to be completed before 19 May 2026.
7.7.9 List of principal group companies
List of principal group companies
| Company | Equity interest | Rate of control | Seat | Segment |
|---|---|---|---|---|
| ASR Aanvullende Ziektekostenverzekeringen N.V.1 | 100.00 | 100.00 | Utrecht | Non-life |
| ASR Basis Ziektekostenverzekeringen N.V.1 | 100.00 | 100.00 | Utrecht | Non-life |
| ASR Schadeverzekering N.V.1 | 100.00 | 100.00 | Utrecht | Non-life |
| ASR Wlz-uitvoerder B.V. | 100.00 | 100.00 | Utrecht | Non-life |
| ASR Ziektekostenverzekeringen N.V.2 | 100.00 | 100.00 | Utrecht | Non-life |
| ASR Levensverzekering N.V.1 | 100.00 | 100.00 | Utrecht | Life |
| ASR Utrecht Real Estate Investments Netherlands B.V. | 100.00 | 100.00 | Amsterdam | Life |
| ASR Premiepensioeninstelling N.V.3 | 100.00 | 100.00 | Amsterdam | Life |
| Aegon Levensverzekering N.V.1 | 100.00 | 100.00 | Den Haag | Life |
| Aegon Spaarkas N.V.1 | 100.00 | 100.00 | Den Haag | Life |
| Aegon DL B.V.2 | 100.00 | 100.00 | Den Haag | Life |
| Home Free Nederland B.V.2 | 100.00 | 100.00 | Zeist | Life |
| Orcinus 2023 B.V. | 0.00 | 100.00 | Utrecht | Life |
| Delphinus 2023-I B.V. | 0.00 | 100.00 | Utrecht | Life |
| Delphinus 2025-I B.V. | 0.00 | 100.00 | Utrecht | Life |
| SAECURE 17 B.V. | 0.00 | 100.00 | Amsterdam | Life |
| SAECURE 20 B.V. | 0.00 | 100.00 | Amsterdam | Asset Management |
| SAECURE 21 B.V. | 0.00 | 100.00 | Amsterdam | Asset Management |
| SAECURE 22 B.V. | 0.00 | 100.00 | Amsterdam | Asset Management |
| Aegon Hypotheken Financiering B.V. | 0.00 | 100.00 | Amsterdam | Asset Management |
| Aegon Hypotheken Prefunding B.V. | 0.00 | 100.00 | Amsterdam | Asset Management |
| Hypotheken Prefunding 2 B.V. | 0.00 | 100.00 | Amsterdam | Asset Management |
| ASR Administratieve Dienstverlening B.V.2 | 100.00 | 100.00 | Utrecht | Asset Management |
| ASR Real Estate B.V.34 | 100.00 | 100.00 | Utrecht | Asset Management |
| ASR Vermogensbeheer N.V.34 | 100.00 | 100.00 | Utrecht | Asset Management |
| Aegon Hypotheken B.V.3 | 100.00 | 100.00 | Den Haag | Asset Management |
| dRA Exploitatie B.V.3 | 100.00 | 100.00 | Lochem | Distribution & Services |
| BSB Assurantiën B.V.3 | 85.00 | 85.00 | Geleen | Distribution & Services |
| Anac Backoffice B.V.3 | 100.00 | 100.00 | Eindhoven | Distribution & Services |
| ASR Vitaliteit & Preventieve Diensten B.V. | 100.00 | 100.00 | Utrecht | Distribution & Services |
| Assurantiekantoor Lodewijk B.V.3 | 100.00 | 100.00 | Wezep | Distribution & Services |
| Boval Assurantiën B.V.3 | 100.00 | 100.00 | Velserbroek | Distribution & Services |
| Corins B.V.3 | 100.00 | 100.00 | Amsterdam | Distribution & Services |
- Registered insurance companies
- These are companies for which a statement of joint and several liability under section 403, Book 2 of the Dutch Civil Code has been issued.
- Other Wft registered companies
- These are companies for which a statement of joint and several liability under section 403, Book 2 of the Dutch Civil Code has been issued.
| Company | Equity interest | Rate of control | Seat | Segment |
|---|---|---|---|---|
| Dutch ID B.V. | 100.00 | 100.00 | Velserbroek | Distribution & Services |
| Felison Assuradeuren B.V.1 | 100.00 | 100.00 | Velserbroek | Distribution & Services |
| Van Helvoort Assuradeuren B.V.1 | 100.00 | 100.00 | Gemert | Distribution & Services |
| Van Helvoort Registermakelaars in Assurantiën B.V.1 | 100.00 | 100.00 | Gemert | Distribution & Services |
| PoliService B.V.1 | 100.00 | 100.00 | Hardinxveld-Giessendam | Distribution & Services |
| Supergarant Verzekeringen B.V.1 | 100.00 | 100.00 | Leidschendam | Distribution & Services |
| Van Kampen Geld B.V.1 | 100.00 | 100.00 | Hoorn | Distribution & Services |
| Van Kampen Groep Holding B.V.1 | 100.00 | 100.00 | Hoorn | Distribution & Services |
| ZZP Nederland Verzekeringen B.V.1 | 100.00 | 100.00 | Groningen | Distribution & Services |
| D&S Holding B.V.2 | 100.00 | 100.00 | Velserbroek | Distribution & Services |
| D&S Participaties B.V.2 | 100.00 | 100.00 | Velserbroek | Distribution & Services |
| Advies van a.s.r. B.V.1 | 100.00 | 100.00 | Den Haag | Distribution & Services |
| Aegon Bemiddeling B.V.1 | 100.00 | 100.00 | Den Haag | Distribution & Services |
| Robidus Groep B.V. | 94.92 | 94.92 | Den Haag | Distribution & Services |
| Robidus Arbo B.V.2 | 94.92 | 94.92 | Zaandam | Distribution & Services |
| Robidus Risk Consulting B.V.2 | 94.92 | 94.92 | Zaanstad | Distribution & Services |
| Robidus Services B.V.2 | 94.92 | 94.92 | Zaanstad | Distribution & Services |
| Robidus Solutions B.V.2 | 94.92 | 94.92 | Zaanstad | Distribution & Services |
| Bronkhorst Bedrijfskompas B.V. | 94.92 | 94.92 | Putten | Distribution & Services |
| NIPED Prevention B.V. | 94.92 | 94.92 | Amsterdam | Distribution & Services |
| Nedasco B.V.1 | 100.00 | 100.00 | Amersfoort | Distribution & Services |
| GHW Assurantiegroep B.V.1 | 100.00 | 100.00 | Nijmegen | Distribution & Services |
| Bastiaens & Cox B.V.1 | 100.00 | 100.00 | Venlo | Distribution & Services |
| De Regt Adviesgroep B.V.1 | 100.00 | 100.00 | Den Haag | Distribution & Services |
| TKP Pensioen B.V. | 100.00 | 100.00 | Groningen | Distribution & Services |
| HumanTouch Holding B.V. | 100.00 | 100.00 | Son en Breugel | Distribution & Services |
| HumanTotalCare B.V. | 100.00 | 100.00 | Eindhoven | Distribution & Services |
| HumanCapitalCare B.V. | 100.00 | 100.00 | Eindhoven | Distribution & Services |
| ArboNed B.V. | 100.00 | 100.00 | Utrecht | Distribution & Services |
| Mensely B.V. | 100.00 | 100.00 | Eindhoven | Distribution & Services |
| Pensioen Gilde B.V. | 100.00 | 100.00 | Emmen | Distribution & Services |
| ASAM N.V.2 | 100.00 | 100.00 | Utrecht | Holding & Other |
| ASR Betalingscentrum B.V.2 | 100.00 | 100.00 | Utrecht | Holding & Other |
| ASR Deelnemingen N.V.2 | 100.00 | 100.00 | Utrecht | Holding & Other |
| ASR Nederland N.V. | 100.00 | 100.00 | Utrecht | Holding & Other |
| ASR Service Maatschappij N.V.2 | 100.00 | 100.00 | Rotterdam | Holding & Other |
| ASR Real Estate Development B.V. | 100.00 | 100.00 | Utrecht | Holding & Other |
| ASR Vooruit B.V.1 | 100.00 | 100.00 | Utrecht | Holding & Other |
| Aegon Administratie B.V.2 | 100.00 | 100.00 | Den Haag | Holding & Other |
| Servicemaatschappij "De Hoofdpoort" N.V.2 | 100.00 | 100.00 | Utrecht | Holding & Other |
- Other Wft registered companies
- These are companies for which a statement of joint and several liability under section 403, Book 2 of the Dutch Civil Code has been issued.
The principal group companies are located in the Netherlands. For notes to equity interests in associates and joint ventures, see section 7.5.4. The list of equity interests which are required under Sections 379 and 414, Book 2 of the Dutch Civil Code has been filed with the Trade Register of the Chamber of Commerce in Utrecht.
The statements of joint and several liability under section 403, Book 2 of the Dutch Civil Code for Obra Services B.V., Robidus Risk Consulting B.V., Robidus Services B.V. and Robidus Solutions B.V. have all been issued by Robidus Groep B.V. All other statement of joint and several liability in the list of principal group companies have been issued by a.s.r. Nederland N.V.
Certain structured entities, in which a.s.r. does not hold any shares, are consolidated. For more information on these structured entities, see section 7.5.17.
7.7.10 Profit appropriation
The EB will propose to the AGM to distribute a final dividend of €
7.8 Risk management
Risk management (RM) is an integral part of a.s.r.’s day-to-day business operations. a.s.r. applies an integrated approach to managing risks, ensuring that strategic targets are met. Value is created by striking the right balance between risk, return and capital whilst ensuring that obligations to stakeholders are met.
7.8.1 Risk management system
It is of great importance to a.s.r. that risks within all business segments are timely and adequately controlled. In order to do so, a.s.r. implemented a RM framework based on internationally recognised and accepted standards (such as COSO ERM and ISO 31000 RM principles and guidelines). Using this framework, material risks that a.s.r. is, or can be, exposed to, are identified, measured, managed, monitored, reported and evaluated. The RM framework is both applicable to a.s.r. group and the underlying (legal) business entities.
7.8.1.1 Risk Management Framework
The figure shows the RM framework as applied by a.s.r.
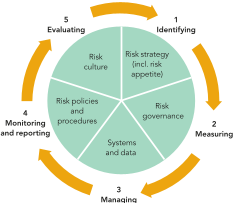
Risk Management framework
The RM framework consists of risk strategy (including risk appetite), risk governance, systems and data, risk policies and procedures, risk culture, and RM process. The RM framework contributes to achieving the strategic, tactical and operational objectives as set out by a.s.r. The overall effectiveness of the RM framework is evaluated as part of the regular internal review of the system of governance.
Risk strategy (incl. risk appetite)
Risk strategy is defined to contain at least the following elements:
Strategic, tactical and operational objectives that are pursued;
The risk appetite in pursuit of those strategic, tactical and operational objectives.
a.s.r.’s risk strategy aims to ensure that decisions are made within the boundaries of the risk appetite, as stipulated annually by the EB and the MB (see section Risk strategy and risk appetite).
Risk governance
Risk governance can be seen as the way in which risks are managed, through a sound risk governance structure and clear tasks and responsibilities, including risk ownership. a.s.r. employs a risk governance framework that entails the tasks and responsibilities of the Risk Management organisation and the structure of the Risk committees (see section Risk governance).
Systems and data
Systems and data support the RM process and provide management information to the risk committees and other relevant bodies. a.s.r. finds it very important to have qualitatively adequate data, models and systems in place, in order to be able to report and steer correct figures and to apply risk-mitigating measures timely. To ensure this, a.s.r. has designed a policy for data quality and model validation in line with Solvency II. Tools, models and systems are implemented to support the RM process by giving guidance to and insights into the key risk indicators, risk tolerance levels, boundaries and actions, and remediation plans to mitigate risks (see section Systems and data).
Risk policies and procedures:
Risk policies and procedures are part of the a.s.r. policy house. Policy documents are submitted for approval to the relevant (risk) committee in accordance with the applicable governance. Policies are evaluated annually, tested against internal and external market developments, and changes in laws and regulations, and updated as necessary in accordance with the governance defined in the policy.
Each risk policy must include at least:
The scope within a.s.r. to which the policy applies.
A demonstrable and consistent link with relevant laws and regulations and/or strategy.
Key requirements to achieve the policy’s objectives.
The risk categories to which the policy line applies
Description of the method for controlling the risk.
Specific risk tolerances and limits within the relevant risk categories in accordance with the risk appetite statements.
The frequency and content of regular stress tests and the circumstances that would justify ad-hoc stress tests.
The processes and reporting procedures applied.
Exceptions and Escalations.
The classification of risks within a.s.r. is performed in line with, but is not limited to, the Solvency II risks. Each risk category consists of one or more policies or procedures that explicates how risks are identified, measured and controlled within a.s.r. (see section Risk policies and procedures).
Risk culture
An effective risk culture is one that enables and rewards individuals and groups for taking risks in an informed manner. It is a term describing the values, beliefs, knowledge, attitudes and understanding about risk. All the elements of the RM framework combined make an effective risk culture.
Within a.s.r. risk culture is an important element that emphasises the human side of Risk Management. The MB has a distinguished role in expressing the appropriate norms and values (tone at the top). a.s.r. employs several measures to increase the risk awareness and, in doing so, the risk culture (see section Risk culture).
Risk management process
The RM process contains all activities within the RM processes to structurally 1) identify risks; 2) measure risks; 3) manage risks; 4) monitor and report on risks; and 5) evaluate the risk profile and RM framework. At a.s.r., the RM process is used to implement the risk strategy in the steps mentioned. These five steps are applicable to the risks within the company to be managed effectively (see section Risk Management process).
Evaluating the effectiveness of the RM and control system
The assurance level that a.s.r. provides regarding the effectiveness of the RM and control system, as well as insight into any shortcomings, is determined by the full set of activities within the so-called assurance chain, which includes the first and second line functions. a.s.r. applies assurance mapping for all relevant risk categories, specifying for each risk which control activities are performed by the first and second line functions. This integrated approach ensures that relevant control functions collectively provide a consistent and reliable basis for evaluating the effectiveness of the RM and control system. Based on the outcome, additional control measures and improvement actions are implemented where necessary. Shortcomings and improvement measures are transparently reported to the EB and the A&RC.
Integration of Aegon and a.s.r.
In 2024, the integration of Aegon and a.s.r. in the area of risk management commenced. This included the harmonisation of financial and non-financial risk policies, the introduction of a new taxonomy for non-financial risks, the start of the Internal Model Approval Process (IMAP) for a.s.r. life, and the organisational integration of Group Risk Management (GRM). In 2024, the GRM teams of Aegon and a.s.r. were fully merged into a single department, with uniform management, processes, and reporting lines. In 2025, this integration was consolidated and further refined. The integrated GRM department now functions as a stable, uniform line within the organisation. The new taxonomy and reporting structure are now fully embedded across the entire group, and the risk management framework has been further optimised.
7.8.1.1.1 Risk management strategy and risk appetite
a.s.r.’s risk strategy aims to ensure that decisions are made within the boundaries of the risk appetite, as stipulated annually by the EB and the MB.
Risk appetite is defined as the level and type of risk a.s.r. is willing to bear in order to meet its strategic, tactical and operational objectives. The risk appetite is formulated to give direction to the management of the (strategic) risks. The risk appetite contains a number of qualitative and quantitative risk appetite statements and is defined for both financial (FR) and non-financial risks (NFR). The statements highlight the risk preferences and limits of the organisation and are viewed as key elements for the realisation of the strategy. The statements and limits are defined at both group level and at legal entity level and are determined by the a.s.r. risk committee and approved by the SB.
The statements are evaluated yearly to maintain alignment with the strategy. Since 2024, a.s.r. has adopted a new, more detailed taxonomy for non-financial risks consisting of two levels. In 2025, this structure has become fully operational and now serves as the standard for reporting on non-financial risks. The classification at both level 1 and level 2 has been retained. In each risk report, risk colours are assigned at both levels.
The NFR statements have been updated in 2025 compared to 2024. These are fully aligned with the revised taxonomy introduced in 2024. The year 2025 focused on further concretisation and continued development of data driven risk reporting.
The FR statements have changed noticeably compared to 2024. These changes have been driven by the harmonisation of the financial risk policies of a.s.r. and Aegon. The policies have also been revised for the Internal Model Approval Process (IMAP) of a.s.r. life.
Risk appetite statement ASR Nederland N.V. 2025
| 1a | ASR Nederland N.V. maintains a moderate risk appetite regarding strategic risks. Strategic risks may have significant impact, but excessive risk aversion may hinder the achievement of strategic objectives. ASR prioritizes long-term value creation over volume, maintains financial robustness to meet obligations, and serves stakeholder interests (customers, employees, society, investors) in a balanced and sustainable manner. Risks are only accepted when necessary to achieve strategic goals. | NFR |
| 1b | ASR Nederland N.V. maintains a moderate risk appetite regarding strategic sustainability risks. ASR balances sustainability ambitions with financial objectives and stability, striving to be one of Europe’s most sustainable financial institutions. ASR acts in accordance with its sustainability ambitions and adequately manages related risks. | NFR |
| 1c | ASR Nederland N.V. maintains a moderate risk appetite regarding personnel risks. This enables ASR to attract and retain talented, skilled, sustainably employable, and vital employees, while accepting risks necessary to safeguard organisational agility. | NFR |
| 1d | ASR Nederland N.V. maintains a minimal risk appetite regarding customer and advisor risks. ASR puts the customer first , meets its obligations, and ensures customers can easily and quickly manage their affairs through a digital environment with personal contact when needed. ASR invests in technology and customer service to achieve above-average satisfaction, while maintaining strict quality and compliance standards and ensuring customer data quality. | NFR |
| 2a | ASR Nederland N.V. maintains a moderate risk appetite regarding risks that may negatively impact our internal processes. ASR accepts certain risks inherent to the execution of primary, supporting, and governance processes, provided they remain within defined boundaries and are carefully managed. Operational excellence is pursued through robust control mechanisms to minimise incorrect acceptances, policy and claims handling errors, payment and transaction mistakes, fraud, and other operational failures. | NFR |
| 2b | ASR Nederland N.V. maintains a moderate risk appetite regarding risks related to outsourcing. ASR collaborates with external parties under adequate governance and control mechanisms to manage outsourcing risks. The objective is to ensure reliable and efficient partnerships without compromising operational integrity and service quality. | NFR |
| 2c | ASR Nederland N.V. maintains a minimal risk appetite regarding business continuity and crisis management. ASR invests in measures to limit the (customer) impact of realistic disruptions caused by cyberattacks, IT outages, third-party failures, natural disasters, and pandemics. Critical business functions are made resilient through continuity plans and crisis management processes. | NFR |
| 3a | ASR Nederland N.V. maintains an averse risk appetite regarding information security and cyber resilience. Information security and cyber resilience are essential for operational processes and business continuity. ASR only accepts risks when absolutely necessary and invests to the maximum extent in required measures to minimise cyber risks and comply with legal obligations. Systems, data, and digital processes are secured and resilient in accordance with availability, confidentiality, and integrity requirements. | NFR |
| 3b | ASR Nederland N.V. maintains a moderate risk appetite regarding IT risks. Well-functioning IT is essential for business execution and strategic objectives. Risks may be taken in deploying IT resources and adopting new technologies, provided they are well understood and effectively managed. | NFR |
| 4 | ASR Nederland N.V. maintains a moderate risk appetite regarding project risks. Projects essential to strategic objectives are executed in a controlled manner, with attention to timeliness, budget, and quality. Risks are accepted only when well understood and effectively managed. | NFR |
| 5a | ASR Nederland N.V. maintains a minimal risk appetite regarding the integrity of financial reporting. Material financial losses and reputational damage are prevented through robust controls and by ensuring high-quality IFRS and Solvency II data. | NFR |
| 5b | ASR Nederlands N.V. maintains a minimal risk appetite regarding the integrity of non-financial reporting. Material financial losses and reputational damage are prevented through robust controls. | NFR |
| 5c | ASR Nederland N.V. maintains a minimal risk appetite regarding the reliability of models. ASR invests in the development and documentation of robust modelling methods and designs, with adequate control mechanisms to minimise errors and misinterpretations. Reliable models are used to support informed decision-making. | NFR |
| 5d | ASR Nederland N.V. maintains a minimal risk appetite regarding tax risks. The tax policy emphasises compliance, transparency, and responsible tax management, avoiding aggressive strategies. Tax is viewed as a driver of social cohesion and sustainable growth. ASR commits to timely and accurate tax compliance, with planning based on reasonable legal interpretations and actual economic activity. | NFR |
| 6a | ASR Nederland N.V. maintains an averse risk appetite regarding Customer Due Diligence (CDD) risks. ASR takes adequate measures to comply with CDD obligations and to minimise potential risks. | NFR |
| 6b | ASR Nederland N.V. maintains an averse risk appetite regarding the integrity of personal data. ASR holds a significant amount of sensitive information about its customers and other stakeholders. Compliance with privacy legislation is therefore essential to safeguard their privacy rights and protect the organisation’s reputation. ASR invests in robust privacy measures to uphold these rights and ensure legal compliance. | NFR |
| 6c | ASR Nederland N.V. maintains an averse risk appetite regarding the integrity of the organisation. ASR invests in compliance with laws and regulations and promotes ethical behaviour within the organisation. Ethical conduct and regulatory compliance are essential to ASR’s reputation. | NFR |
| 6d | ASR Nederland N.V. maintains an averse risk appetite regarding the integrity of product ans service delivery. Reliable products and services are essential to ASR’s reputation. ASR invests in processes and systems to meet responsibilities towards customers and distribution partners, including compliance with legal obligations such as the duty of care. A risk-averse approach is adopted to safeguard compliance and uphold stakeholder trust. | NFR |
| 6e | ASR Nederland N.V. maintains an averse risk appetite regarding risks related to staff integrity. ASR does everything possible to meet ethical standards and minimise potential risks, ensuring compliance with laws, regulations, and internal standards (including the a.s.r. Code of Conduct). ASR invests in training and awareness to meet legal, ethical, and societal standards regarding staff behaviour and professional competence. | NFR |
| 7 | ASR Nederland N.V. has a minimum SCR ratio of 120%. | FR |
| 8a | ASR Nederland N.V. has an excess of liquidity after a severe stress event of 12 months | FR |
| 8b | ASR Nederland N.V. has at least a single A rating and therefore has sufficient capital redundancy in accordance with the S&P Capital Model. | FR |
| 8c | ASR Nederland N.V. has a maximum financial leverage ratio of 40%. Financial leverage ratio = Debt / (Debt + Equity). | FR |
| 8d | ASR Nederland N.V. has a maximum double leverage ratio of 135%.Double leverage ratio = Total value of associates / (equity attributable to shareholders + hybrids and subordinated liabilities). | FR |
| 8e | ASR Nederland N.V. has a minimum interest coverage ratio of between 4 and 8. Interest coverage ratio = EBIT operational / interest expense. | FR |
| 9 | ASR Nederland N.V. remains within the bandwidth of periodically reassessed market risk budgets | FR |
| 10a | ASR Nederland N.V. remains within the limits of the interest rate risk policy on SCR for interest rate risk and ratio sensitivity for rate changes | FR |
| 10b | ASR Nederland N.V. remains within the limits of the interest rate risk policy on SCR for interest rate volatility risk | FR |
| 10c | ASR Nederland N.V. remains within the limits of the interest rate risk policy on ratio sensitivity for inflation rate changes | FR |
| 11 | ASR Nederland N.V. (excl. ASR Ziektekosten) has a maximum combined ratio of 99%. | FR |
7.8.1.1.2 Risk governance
a.s.r.’s risk governance can be described by:
risk ownership;
the implemented three lines model and associated (clear delimitation of) tasks and responsibilities of key function holders; and
the risk committee structure to ensure adequate decision making.
Risk ownership
The EB has the final responsibility for risk exposures and management within the organisation. Part of the responsibilities have been delegated to persons that manage the divisions where the actual risk-taking takes place. Risk owners are accountable for one or more risk exposures that are inextricably linked to the department or product line they are responsible for. Through the risk committee structure, risk owners provide accountability for the risk exposures.
Three lines model
The risk governance structure is based on the ‘three lines’ model. The three lines model consists of three lines with different responsibilities with respect to the ownership of controlling risks. The table below provides insight in the organisation of the three lines model within a.s.r.
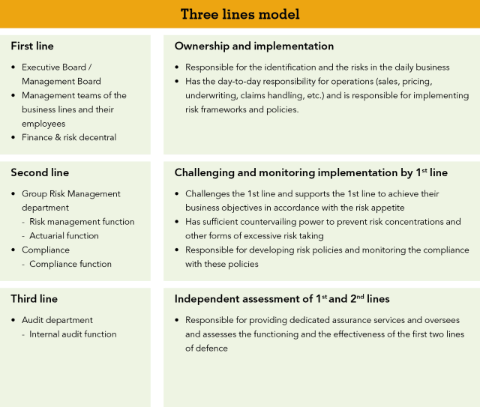
Positioning of key functions
Within the risk governance, the key functions (compliance, risk, actuarial and audit) are organised in accordance with Solvency II regulation. They play an important role as countervailing power of management in the decision-making process. The four key functions are independently positioned within a.s.r. In all the risk committees one or more key functions participate. The second line report to the CRO, which is a member of the management board. All key functions have direct communication lines with the EB and can escalate to the chairman of the Audit & Risk Committee of the SB. Furthermore, the key functions have regular meetings with the supervisors of the Dutch Central Bank (DNB) and / or The Dutch Authority for the Financial Markets (AFM).
Group Risk Management
GRM is responsible for the execution of the RM function (RMF) and the Actuarial Function (AF). The department is led by the RMF holder. GRM consists of the following four sub-departments:
Operational Risk Management;
Financial Risk Management;
Model Validation;
Methodology.
Operational Risk Management
Operational Risk Management (ORM) is responsible for second-line strategic and operational (including IT) RM and the enhancement of the risk awareness for a.s.r. and its subsidiaries. The responsibilities of ORM include the development of risk policies and procedures, the annual review and update of the risk strategy (risk appetite), the coordination of the SRA process leading to the risk priorities and emerging risks and Own Risk and Solvency Assessment (hereafter: ORSA) scenarios and the monitoring of the non-financial risk profile. For the management of operational risks, a.s.r. has a solid Risk-Control framework in place that contributes to its long-term solidity. The quality of the framework is continuously enhanced by the analysis of operational incidents, periodic risk assessments and monitoring by the RMF. ORM actively promotes risk awareness at all levels to contribute to the vision of staying a socially relevant insurer.
Financial Risk Management
Financial Risk Management (FRM) is responsible for the second line financial RM and supports both the AF and RMF. An important task of FRM is to be the countervailing power to the EB and management in managing financial risks for a.s.r. and its subsidiaries. FRM assesses the accuracy and reliability of the market risk, counterparty risk, insurance risk and liquidity risk, risk margin and best estimate liability. As part of the AF, FRM reviews the technical provisions, monitors methodologies, assumptions and models used in these calculations, and assesses the adequacy and quality of data used in the calculations. Furthermore, the AF expresses an opinion on the underwriting policy and determines if risks related to the profitability of new products are sufficiently addressed in the product development process. The AF also expresses an opinion on the adequacy of reinsurance arrangements. Other responsibilities of financial RM are e.g. support monitoring Solvency II compliancy (e.g. changes in Solvency II regulation), updating policies on valuation and risk, activities related to the DNB, assessment of the ORSA (financial parts), assessment of strategic initiatives.
Model Validation
Model Validation (MV) is responsible for performing validation activities or having them carried out in accordance with the drawn up annual model validation plan. MV is responsible for supervising compliance with the model validation policy, discussing and challenging the (draft) validation reports and advising the MV Committee. MV is a separate sub-department within GRM and is part of the RMF. The MV Department independently reviews models used for risk, capital, pricing, and valuation purposes. It ensures that models are reliable, well-governed, and compliant with internal standards and regulatory requirements. The team regularly tests and reports on model performance to support sound decision-making. In addition to validating the various models, Model Risk Management (monitoring findings, updating policy documents, coordinating and assessing the process) is also part of the core activities.
Methodology
Methodology is responsible for establishing methodologies for the Partial Internal Model (hereafter: PIM). The Methodology department is responsible for setting up the internal model, including documentation and maintenance of the documentation. It also handles continuous education by: (1) updating training materials; (2) providing training sessions; (3) assessing the suitability of training levels. Additionally, it analyses the functioning of the internal model, periodically calibrates the internal model parameters, monitors the suitability of the internal model, and conducts annual comparisons of PIM and SF results. In addition, Methodology maintains methodologies which strongly relate to the PIM, among others for mortgage valuation, mortality best estimates, LAC DT and LAC TP.
Compliance
The responsibilities of Compliance include the development of compliance policies and procedures, the annual review and update of the compliance risk strategy (risk appetite) and the monitoring of the non-financial risk profile concerning compliance risks. An important task of Compliance is to be the countervailing power to the EB and other management in managing compliance risks for a.s.r. and its subsidiaries. The mission of the compliance function is to enhance and ensure a controlled and sound business operation.
As second line, Compliance encourages the organisation to comply with relevant rules and regulations, ethical standards and the internal standards derived from them (‘rules’) by providing advice and formulating policies. Compliance supports the first line in the identification of compliance risks and assesses the effectiveness of RM on which Compliance reports to the relevant risk committees, the MB and the Audit & Risk Committee (hererafter: A&RC) of the SB. In doing so, Compliance uses a compliance risk and monitoring framework. In line with RM, Compliance also creates further awareness to comply with the rules and desired ethical behaviour. Compliance coordinates interaction with regulators in order to maintain effective and transparent relationships with those authorities.
Audit
Audit a.s.r., the third line, strengthens a.s.r.’s ability to create, protect, and preserve value by providing the EB with independent, risk-based, and objective assurance, advice, insights, and outlooks. Audit helps a.s.r. to successfull achieve its objectives, enhance governance, risk management, and control processes, and improve decision-making and oversight at a.s.r. Furthermore, Audit strengthens a.s.r.’s reputation and credibility with its stakeholders and increases a.s.r.’s ability to serve the public interest.
Audit performs various types of activities:
Through a systematic and structured approach, audits are conducted to provide an objective and independent opinion on the effectiveness of governance, risk management, and control processes.
Conducting specific investigations at the request of the EB or the A&RC and/or the SB.
Providing solicited and unsolicited advice
Risk committee structure
a.s.r. has established a structure of risk committees with the objective to monitor the risk profile for a.s.r. group, its legal entities and its business lines in order to ensure that it remains within the risk appetite and the underlying risk tolerances and risk limits. When triggers are hit or likely to be hit, risk committees make decisions regarding measures to be taken, being risk-mitigating measures or measures regarding governance, such as the frequency of their meetings. For each of the risk committees a statute is drawn up in which the tasks, composition and responsibilities of the committee are defined.
Risk committee structure
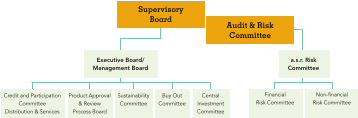
Audit & Risk Committee
The Audit & Risk Committee (A&RC) was established by the SB to gain support, among other things, in the following matters:
Assessment of the risk appetite proposal and quarterly monitoring of the risk profile;
Assessment of the annual report, including the financial statements of a.s.r.;
The relationship with the independent external auditor, including the assessment of the quality and independence of the independent external auditor and the proposal by the SB to the AGM to appoint the independent external auditor;
The performance of the audit function, compliance function, the AF and the RMF;
Compliance with rules and regulations; and
The financial position.
The A&RC has four members of the SB, one of whom acts as the chairman.
a.s.r. Risk Committee
The a.s.r. risk committee monitors a.s.r.’s overall risk profile on a quarterly basis. At least annually, the a.s.r. risk committee determines the risk appetite statements, limits and targets for a.s.r. This relates to the overall a.s.r. risk appetite and the subdivision of risk appetite by financial and non-financial risks. The risk appetite is then submitted to the a.s.r. Audit & Risk Committee, which advises the SB on the approval of the risk appetite. The a.s.r. risk committee also monitors the progress made in managing risks included in the risk priorities and emerging risks of the EB.
All members of the MB participate in the a.s.r. risk committee, which is chaired by the CEO. The involvement of the EB ensures that risk decisions are being addressed at the appropriate level within the organisation. In addition to the EB, the Key Functions (Risk management, Compliance, Internal audit, Actuarial function) are members of the Committee.
Non-Financial Risk Committee
The Non-Financial Risk Committee (NFRC) discusses, advises and decides upon non-financial risk policies and procedures. The most relevant non-financial risk policies are approved by the a.s.r. risk committee. The NFRC monitors a.s.r.’s overall non-financial risk profile, in particular whether non-financial risks of a.s.r. and the business entities are managed adequately and whether the risk profile stays within the agreed risk limits. If the risk profile exceeds the limits, the NFRC takes mitigating actions. The NFRC reports to the a.s.r. risk committee. The NFRC is chaired by a member of the EB. The NFRC discusses the most important risks from the underlying non-financial risk committees (Business Risk Committee (BRC)).
Financial Risk Committee
The Financial Risk Committee (FRC) discusses, advises and decides upon financial risk policies. The most relevant financial risk policies are approved by the a.s.r. risk committee. The FRC monitors that financial risks of a.s.r. and the business entities are managed adequately and monitors that the risk profile stays within the agreed risk limits. If the risk profile exceeds the limits, the NFR takes mitigating actions. The FRC reports to the a.s.r. risk committee. The Chairman of the FRC is the CFO.
Credit and Participation Committee Distribution & Services
In the Credit and Participation Committee Distribution & Services (hereafter: CPC D&S), acquisition, credit, and combined participation and credit proposals (D&S proposals) within the scope of the Distribution and Services segment of a.s.r. (D&S segment) are assessed. The CPC D&S is authorised to decide on proposals with a total investment between € 2 million and € 7.5 million. The management of D&S is independently authorised for decisions up to € 2 million. Decisions on proposals above € 7.5 million are reserved for the EB, with advice from the CPC D&S. The chair of the CPC D&S is the CFO of a.s.r.
Product Approval and Review Process Board
The Product Approval & Review Process Board (PARP Board) is responsible for the final decision-making process around the introduction of new products and adjustments in existing products. The committee evaluates a.o. if potential risks in newly developed and adjusted products are sufficiently addressed. New products need to be developed in such a way that they are cost efficient, reliable, useful and secure for our clients. New products also need to have a strategic fit with a.s.r.’s mission to be a solid and trustful insurer. In addition, the risks of existing products are evaluated, as requested by the PARP as a result of product reviews. The PARP Board is chaired by the managing Director of Services. The chair of the PARP reports to both COO's and yearly to the MB.
Sustainability Committee
The Sustainability Committee (hereafter: SC) aims to review and advise on central and decentralised draft policies related to sustainability before these policies are submitted for approval to the Board of Directors or the competent committee. Additionally, dilemmas, complications, and conflicting interests in the field of sustainability (including ESG and CDD/KYC) that arise at a.s.r. and/or one of the (sub)committees are discussed. The chair of the SC is the Director of Communications. For more information on the SC see section 5.1.6. of the annual report of a.s.r.
Buy Out Committee
In 2025, the Buy Out Committee was added to the Risk Committee Structure. The Buy Out Committee approves the pricing assumptions and methodology related to buyouts. In addition, it determines the buyout strategy and sets risk appetite, which is approved by the MB.
The Buy Out Committee also monitors completed buy outs and makes use of emerging experience to adjust assumptions and methodology where necessary. It follows developments on the buy out market and a.s.r.’s position. It ensures that improvement plans are followed up. The Buy Out Cimmittee is chaired by the CFO.
Central Investment Committee
In addition to the risk committee structure, the Central Investment Committee (CIC) monitors tactical decisions and the execution of the investment policy. It takes investment decisions within the boundaries of the strategic asset allocation as agreed upon in the FRC. The CIC bears particular responsibility for investment decisions exceeding the mandate of the investment department. The CIC is chaired by the CFO.
Distribution & Services
The a.s.r. subsidiaries D&S Holding, Corins and Robidus operate their own risk management system. On a quarterly basis, they report to a.s.r. amongst others on the key (developments in) non‑financial risks. These outcomes are discussed with a.s.r. GRM and Compliance and are subsequently discussed with either the SB or the EB of a.s.r.
7.8.1.1.3 Systems and data
GRC tooling is implemented to support the RM process by giving guidance and insight into the key risk indicators, risk tolerance levels, boundaries and actions and remediation plans to mitigate risks. The availability, adequacy and quality of data and IT systems is important in order to ensure that correct figures are reported and risk mitigating measures can be taken in time. It is important to establish under which conditions the management information that is submitted to the risk committees has been prepared and which quality safeguards were applied in the process of creating this information. This allows the risk committees to ascertain whether the information is sufficient to base further decisions upon.
a.s.r. has a Data Quality policy in place to support the availability of correct management information. This policy is evaluated on an annual basis and revised at least every three years to keep the standards in line with the latest developments on information and data management. The quality of the information is reviewed based on the following aspects, based on Solvency II:
completeness (including documentation of accuracy of results)
adequacy
reliability
timeliness
Adherence to this policy is ensured by the three lines model. With a Central Data Office, additional measures are taken to increase maturity in data management practices.
The data risk governance and committee structure in place ensures that ownership and decision making regarding assumptions and the plausibility of the results is effectively organised.
The information involved tends to be sensitive. To prevent unauthorised persons from accessing it, it is disseminated using a secure channel or protected files. a.s.r.’s information security policy contains guidelines in this respect.
a.s.r.’s information security policy is based on relevant laws and market standards, like ISO 2700x, COBIT 2019, NIST Cybersecurity framework, SOC2 principles, PCI DSS, COSO, BS 25999, ISO 31000 and ITIL. These standards describes best practices for the implementation of information security. For the Digital Operational Resilience Act (hereafter: DORA), important changes in 2025 per DORA pillar are:
ICT Risk Management: a strengthened, centralised, and top-down approach has been adopted through an IT Risk Framework for ICT governance and risk management. Best practice controls are now mandatory and implemented via comply-or-explain principles.
Incident Management: IT incident monitoring has been intensified with a new process to promptly notify and report major DORA incidents to regulators. There is now more focus on business continuity rather than solely IT continuity.
Digital Resilience: focus on the critical and important business functions, with controls formalised or adjusted as necessary to comply with DORA.
Management of Third-Party Risk: concentration risks and critical suppliers have been identified. Reporting has been improved, and a processing register along with mandatory reporting templates have been implemented. Where necessary, contracts with third-party suppliers have been revised.
ICT Information Sharing: information exchange between a.s.r., other financial institutions, and regulators has been improved, with active contributions to collaborations.
As of 2025, a.s.r. substantially complies with the DORA regulations, which have been integrated into a.s.r.'s information security policy. The requirements for design and implementation have been met, and our current focus is on demonstrating the operational effectiveness.
There are technical solutions for accomplishing this, by enforcing a layered approach (defence-in-depth) of technical measures to avoid unauthorised persons to compromise a.s.r. data and systems. In this perspective, one may think of methods of logical access management, intrusion detection techniques, in combination with firewalls are aimed at preventing hackers and other unauthorised persons from accessing information stored on a.s.r. systems. Nevertheless, confidential information can also have been committed to paper. On top of technical measures a.s.r. implemented physical measures and measures that help create the desired level of awareness of personnel as part of the information security environment. The resilience of these measures is actively tested.
When user defined models (e.g. spreadsheets) are used for supporting the RM framework, the ‘a.s.r. Standard for End user computing’ defines and describes a.s.r. practices in order to guard the reliability and confidentiality of these tools and models. a.s.r. recognises the importance of sound data quality and information management systems. The management of IT and data risks of the implemented tools, models and systems (including data) is part of Operational (IT) Risk Management.
7.8.1.1.4 Risk policies and procedures
a.s.r. has established guidelines, including policies that cover all main risk categories (market, counterparty default, liquidity, underwriting, strategic and operational). These policies address the accountabilities and responsibilities regarding management of the different risk types. Furthermore, the methodology for risk measurement is included in the policies. The content of the policies is aligned to create a consistent and complete set. GRM maintains the risk policies, Compliance maintains the compliance policies and both GRM and Compliance monitor the proper implementation in the business. New risk policies or updates of existing risk policies are approved by the risk committees as mentioned previously. a.s.r. has established an overall policyhouse (formally managed by the Compliance Function), including an integrated policy calendar which includes all risk related documents. This guarantees that policies are drawn up and reassessed in a timely manner where ownership and responsibilities are clear.
a.s.r. employees gain risk management knowledge and skills through the implementation of risk management policies, procedures and practices and the execution and testing of controls within business processes for sound and controlled business operations. Training courses that cover the main risk-related topics, presentations, workshops, gamification and the use of governance, risk & compliance tooling also contribute to this. In addition, risk management employees keep their knowledge and skills up to date through training courses - including in the context of permanent education - that cover specific risk-related topics.
7.8.1.1.5 Risk culture
Risk awareness is a vital component of building a sound risk culture within a.s.r. that emphasises the human aspect in the management of risks. In addition to gaining sufficient knowledge, skills, capabilities and experience in RM, it is essential that an organisation enables objective and transparent risk reporting in order to manage them more effectively.
The MB clearly recognises the importance of RM and is therefore represented in all of the major group level risk committees. Risk Management is involved in the strategic decision-making process, where the company’s risk appetite is always considered. The awareness of risks during decision-making is continually addressed when making business decisions, for example by discussing and reviewing risk scenarios and the positive and / or negative impact of risks before finalising decisions.
It is very important that this risk awareness trickles down to all parts of the organisation, and therefore management actively encourages personnel to be aware of risks during their tasks and projects, in order to avoid risks or mitigate them when required. The execution of risk analyses is embedded in daily business in, for example, projects, product design and outsourcing.
In doing so, a.s.r. aims to create a solid risk culture in which ethical values, desired behaviours and understanding of risk in the entity are fully embedded. Integrity is of the utmost importance at a.s.r.: this is translated into a code of conduct and strict application policies for new and existing personnel, such as taking an oath or solemn affirmation when entering the company, and the ‘fit and proper’ aspect of the Solvency II regulation, ensuring that a.s.r. is overseen and managed in a professional manner.
Furthermore, a.s.r. believes it is important that a culture is created in which risks can be discussed openly and where risks are not merely perceived to be negative and highlight that risks can also present a.s.r. with opportunities. Risk Management (both centralised and decentralised) and Compliance are positioned as such, that they can communicate and report on risks independently and transparently, which also contributes to creating a proper risk culture.
7.8.1.1.6 Risk management process
The RM process typically comprises of five important steps: 1) identifying; 2) measuring; 3) managing; 4) monitoring and reporting; and 5) evaluating. a.s.r. has defined a procedure for performing risk analyses and standards for specific assessments. The five different steps are explained in this chapter.
Identifying
Management should endeavour to identify all possible risks that may impact the strategic, tactical and operational objectives of a.s.r., ranging from the larger and / or more significant risks posed on the overall business, down to the smaller risks associated with individual projects or smaller business lines. Risk identification comprises of the process of identifying and describing risk sources, events, and the causes and effects of those events.
Measuring
After risks have been identified, quantitative or qualitative assessments of these risks take place to estimate the likelihood and impact associated with them. Methods applicable to the assessment of risks are:
Sensitivity analysis
Stress testing
Scenario analysis
Expert judgments (regarding likelihood and impact)
Portfolio analysis
Managing
Typically, there are four strategies to managing risk:
Accept: risk acceptance means accepting that a risk might have consequences, without taking any further mitigating measures.
Avoid: risk avoidance is the elimination of activities that cause the risk.
Transfer: risk transference is transferring the impact of the risk to a third party.
Mitigate: risk mitigation involves the mitigation of the risk likelihood and / or impact.
RM strategies are chosen in a way that ensures that a.s.r. remains within the risk appetite tolerance levels and limits.
Monitoring and reporting
The risk identification process is not a continuous exercise. Therefore, risk monitoring and reporting are required to capture changes in environments and conditions. This also means that RM strategies could, or perhaps should, be adapted in accordance with risk appetite tolerance levels and limits.
Evaluating
The evaluation step is twofold. On the one hand, evaluation means risk exposures are evaluated against risk appetite tolerance levels and limits, taking (the effectiveness of) existing mitigation measures into account. The outcome of the evaluation could lead to a decision regarding further mitigating measures or changes in RM strategies. On the other hand, the RM framework (including the risk management processes) is evaluated by the RM function, in order to continuously improve the effectiveness of the RM framework as a whole.
7.8.1.1.7 Assessment of the RM and Internal Control system
As part of the Statement on RM (hereafter: VOR, 'Verklaring omtrent Risicobeheersing'), and Internal Control system, a.s.r. applies a structured process to assess the design and effectiveness of its RM and control system. This process is aligned with the Dutch Corporate Governance Code and regulatory requirements and includes:
Framework and Governance: based on internationally recognised standards (COSO ERM, ISO 31000) and operating within the three lines model, with clear allocation of responsibilities and escalation paths to the EB and A&RC.
Assessment Approach: combines self-assessments by the first line, second-line reviews by Risk Management and Compliance, and independent audits by Internal Audit to provide a comprehensive view of system effectiveness.
Assurance Mapping: assurance mapping is used to document the level of assurance for each critical risk category. This mapping identifies responsibilities, testing activities, and any gaps across the assurance chain, which includes first- and second-line functions. The mapping is updated annually and discussed in relevant risk committees.
Effectiveness Assessment: key elements of the RM process are supported by defined effectiveness criteria, monitored against thresholds to confirm proper functioning and provide confidence to the EB.
GRC Technology: GRC software supports risk registration, control tracking, incident management, and reporting through dashboards and risk reports.
Monitoring and Reporting: continuous second-line monitoring and consolidated reporting ensure oversight and accountability, with improvement actions implemented where necessary.
Assessment of Control System maturity
a.s.r. identified several areas for further improvement within its risk management and internal control system. To enhance the overall maturity and effectiveness of the framework, a.s.r. is implementing improvement measures across the following topics:
Risk Governance: a.s.r. evaluates whether risk categories are sufficiently embedded across the risk chain based on assurance mapping.
Systems and Data: improved data quality in GRC tooling and dashboarding ensures accuracy, relevance, and alignment with user needs.
Processes: a.s.r. aims to improve the execution of risk analyses by strengthening structural planning and ensuring timely, high-quality delivery
Risk Frameworks: enhancing frameworks to the desired maturity level, ensuring consistency, adequate control mix, and integration into ORM policies and procedures.
Monitoring: strengthen second-line monitoring by further developing the monitoring plan.
These initiatives aim to increase maturity of the RM and internal control system ensuring stronger governance and improved transparency.
Key Developments
In 2025, a.s.r. continued to further develop its RM and internal control system following the successful integration of Aegon activities in 2024. The focus was on creating efficient, data-driven processes, standardising methodologies, and reducing complexity through centralisation. These measures aim to improve transparency, ensure consistent practices across the organisation, and maintain cost efficiency.
Key initiatives included the optimisation of risk management policies and procedures, refinement of risk appetite, development of control frameworks and reporting standards, and the redesign and standardisation of Governance, Risk and Compliance (GRC) tooling. Additional improvements focused on reducing control burden, accelerating reporting cycles, and leveraging innovative solutions such as AI to support the risk management process.
As part of the PIM, which combines internal model components with standard formula capital charges to determine the SCR, a.s.r. continued to monitor and adjust internal models to ensure alignment with its risk profile and governance requirements. The Model Risk Management (MRM) policy was revised to introduce stricter compliance requirements while allowing greater flexibility for tailored control measures.
These developments provide a solid foundation for a future-proof risk management system aligned with a.s.r.’s strategic objectives. Efforts will continue in 2026 to further embed these enhancements within the organisation.
7.8.1.2 a.s.r.’s risk categories
A clear and consistent risk taxonomy is fundamental to translating the risk strategy into well-defined risk appetite statements. It provides a structured framework of risk categories relevant to the organisation, serving as a common basis for identifying, assessing, reporting, and monitoring risks. This structure enables strategic objectives to be aligned with specific risk categories, allowing risk appetite to be explicitly determined for each category.
a.s.r. introduced a new, two-tier taxonomy for non-financial risk (NFR) in 2024. This taxonomy became fully operational in 2025 and now constitutes the standard framework for NFR reporting. The classifications at both Level 1 and Level 2 have been preserved, with risk indicators assigned at both levels in each risk report. Within a.s.r. the following two non-financial risk categories are distinguished:
Operational risk
Strategic risk
a.s.r. also revised the taxonomy for the financial risks in 2024. Where the risks used to be categorised based on the Standard Formula taxonomy, separate categories are now defined for risks types with a comparable degree of appetite. This results in the following four categories of financial risks:
Underwriting risk
Investment & counterparty default risk
Mismatch risk
Liquidity risk
The Partial Internal Model (PIM) is used the manage the exposure of the different risk types within the appetite of the corresponding category. a.s.r. life, Aegon life, and Aegon Spaarkas have implemented a PIM, which combines internal model components with Standard Formula capital charges to determine the Solvency Capital Requirement (SCR). Following the Use Test requirements of Solvency II, the PIM is also used in the risk management system of a.s.r.
In addition, a.s.r. recognises sustainability risks arising from environmental, social or governance (ESG) events or conditions. These risks can be financial and non-financial and can be both strategic and operational. This means that all six main risk categories that a.s.r. recognises can be affected by sustainability risks. In chapter 6 of the annual report and in the paragraph climate change, a.s.r. briefly describes how a.s.r. identifies, measures and manages climate risks and opportunities for its business.
Underwriting risk
Underwriting risk is the risk that premium and / or investment income or outstanding reserves will not be sufficient to cover current or future payment obligations, due to the application of inaccurate technical or other assumptions and principles when developing and pricing products. a.s.r. recognises the following insurance risks:
Life underwriting risk
Health underwriting risk
Non-life underwriting risk
Investment & counterparty risk
The risk of changes in values caused by market prices or volatility of market prices differing from their expected values, or losses due to the unexpected failure to pay or credit rating downgrade of counterparties and debtors. The following types of risks are distinguished:
Fixed income risk
Mortgage prepayment risk
Equity level risk
Equity volatility risk
Property risk
Currency risk
Concentration risk / market concentration risk
Counterparty default risk
Mismatch risk
The risk of losses caused by market movements that impact the assets and liabilities side of the balance sheet differently. The following risk types are distinguished:
Interest rate risk
Interest rate volatility risk
Inflation risk
Liquidity risk
Liquidity risk is the risk that a.s.r. is not able to meet its financial obligations to policyholders and other creditors when they become due and payable, at a reasonable cost and in a timely manner.
Operational risk
Operational risk is the risk of losses caused by weak or failing internal procedures, weaknesses in the action taken by personnel, weaknesses in systems or because of external events. The following subcategories of operational risk are used, among others:
Process
Information technology
Project
Reporting & Model
Integrity
Strategic risk
Strategic risk is the risk of a.s.r. or its business lines failing to achieve the objectives due to incorrect decision-making, incorrect implementation and / or an inadequate response to changes in the environment. Such changes may arise in the following areas:
Macro-economic
Geopolitical instability
Climate change and energy transition
Cyber and information security
Artificial intelligence
Regulation
Biodiversity
Social tensions
Pandemics
Strategic risk may arise due to a mismatch between two or more of the following components: the objectives (resulting from the strategy), the resources used to achieve the objectives, the quality of implementation, the economic climate and / or the market in which a.s.r. and / or its business lines operate.
7.8.1.3 Climate change & Biodiversity
In addition to the six main risk categories, a.s.r. acknowledges that sustainability risks - stemming from environmental, social, or governance (ESG) factors - are not separate risks, but risks that affect the existing categories. These sustainability risks can manifest as both financial and non-financial impacts, and may influence strategic as well as operational aspects. Consequently, each of the six main risk categories recognised by a.s.r. can be affected by ESG-related developments.
Climate-related risks are divided into physical, transition and reputational risks. Physical risks arise from more frequent and severe climate events. Physical risks can be acute, such as extreme weather events, or chronic when they arise from gradual changes such as water shortages or rising temperatures. Transition risks result from the process of adjustment towards a climate-neutral society. The failure to appropriately address these adjustments can result in reputational risk.
Risk assessments
Transition risks apply in particular to investments and financing. The scenario analysis for transition risks is performed by considering the proposal from the Strategic Asset Allocation (SAA) 2025 under four climate scenarios. The dynamically managed market risk budgets are resilient to the climate impact with regard to the development of the SII ratio over the coming 20 years.
The ORSA assesses the overall solvency needs of a.s.r. in the context of the strategic plans making allowance for the current and expected solvency positions, the risk appetite and solvency targets. Physical climate risks are mainly associated with the Non-life portfolio and adequately priced in the products. Physical climate risks (a major storm and major flood) are assessed in the ORSA combined business scenario’s for the Non-life portfolio. Within life and health insurance, the impact is mainly in the longer term and was not quantified in the standard ORSA horizon of five years. Therefore, since the ORSA 2023, a.s.r. introduced a climate scenario with a horizon of ten years. Starting point for this climate scenario is the failed transition, which is the most negative scenario from the SAA study. In addition a.s.r. Real estate, Non-Life, Health and Disability are exposed to physical climate risk.
As part of CSRD, a.s.r. conducted an update of its Double Materiality Assessment (DMA) in 2025, following the completion of the first assessment in 2024. The DMA is performed every three years, between these years an update of the assessment is made. The updated material topics are included in chapter 6. In parallel, a.s.r. is in the process of integrating risk management activities related to CSRD sustainability reporting into its existing risk management framework. Risk related to CSRD reporting are identified and corresponding controls were established to ensure the accuracy, completeness, and timeliness of sustainability reporting, particularly regarding newly disclosed items. Furthermore, a governance structure is in place to address sustainability matters, including reporting obligations. The ongoing integration of CSRD-related risk management activities is expected to enhance organisational efficiency, strengthen the reliability of reporting, and ensure compliance with regulatory requirements.
Overall, climate risks as a result of climate change and the energy transition are incorporated into a.s.r.’s risk appetite and part of the regular risk management processes such as the annual group-wide SRA process. Material climate risks identified in the SRA process, including storms and floods, are incorporated into the scenario analysis of the ORSA and quantified by the business actuary teams.
Technical provisions
The net impact of climate change and biodiversity loss on the current Technical Provisions or SCR calculation is considered to be limited. In the previous years assessments of the impact of sustainability factors on the portfolio and on prudential risks have been performed that substantiate this conclusion. The assessment of the impact of sustainability factors on the portfolio has been updated in 2025 and was input for the non-economic assumptions setting processes. Based on these and other analysis the limited net impact is confirmed. For the Life and Pension business the impact of climate change on life expectancy is considered to be limited. Increased inflation caused by social or geopolitical factors is adequately valued in the liabilities. The inflation sensitivity of the technical provision related to claims that are directly linked to an index are hedged with inflation swaps and inflation linked bonds. The inflation sensitivity of the technical provision related to costs are only partly hedged with inflation swaps and for the remainder hedged with real estate and stocks. The Non-life business is characterised by a short contract boundary, most premiums can therefore yearly be adjusted to the gradually impact of climate change.
Part of the DMA is the financial materiality assessment (see section 6.1.4.2). The results of 2024 and the update in 2025 of the financial materiality assessment did not result in different conclusions regarding the scope of the Actuarial Function. The material financial risks that were identified are related to climate change, biodiversity loss and consumers and/or end-users. These risks are related to future developments (medium- and long term horizons) and are not directly related to the current Technical provisions. E.g. the future development of climate change does not have impact on current frequency and severity of events. The Actuarial Function has continuously attention for developments of ESG risks and the potential impact on the technical liabilities, the reinsurance contracts and pricing- and underwriting policies.
Based on the assessments a.s.r. does not consider ESG to have impact on the method or results of current Technical Provisions or SCR calculation. The ESG risks are expected to be within the limits of the SCR. This conclusion is applicable to both the a.s.r. and Aegon portfolios.
Reference is made to section 6.1.4.3 for more information how a.s.r. identifies, measures and manages climate risks and opportunities for its business.
7.8.2 Underwriting risk
Underwriting risk is the risk that future insurance claims and benefits cannot be covered by premium and / or investment income, or that insurance liabilities are not sufficient, because future expenses, claims and benefits differ from the assumptions used in determining the best estimate liability. Underwriting risk manifests itself in both the Non-life and the Life portfolio. The Non-life portfolio covers the property and casualty, disability and healthcare sectors. The Life portfolio consists of individual life and funeral and pensions business.
Risk-mitigating measures are used to reduce and contain the volatility of results or to decrease the possible negative impact on value as an alternative for the capital requirement. Proper pricing, underwriting, reinsurance, claims management, and diversification are the main risk mitigating actions for underwriting risks. By offering a range of different insurance products, with various product benefits and contract lengths, and across Life, Disability and Health and P&C underwriting risk, a.s.r. reduces the likelihood that a single risk event will have a material impact on a.s.r.’s financial condition.
The solvency buffer is held by a.s.r. to cover the risk that claims may exceed the available insurance provisions and to ensure its solidity. The solvency position of a.s.r. is determined and continuously monitored in order to assess if a.s.r. meets the regulatory requirements.
a.s.r. life, Aegon life and Aegon spaarkas use a Partial Internal Model (PIM) to calculate the solvency position. The PIM contains Internal Models for (i) mortality risk and (ii) longevity risk. For the other risks, the Solvency II standard formula is applied. a.s.r. non-life and a.s.r. health use the Solvency II standard formula (SF) to calculate the solvency position.
The Solvency Capital Requirement (SCR) for each insurance risk is determined as the change in own funds caused by a predetermined shock which is calibrated to a 1-in-200-year event. The basis for these calculations are the Solvency II technical provisions which are calculated as the sum of a best estimate and a risk margin.
The underwriting risk arising from the insurance portfolios of a.s.r. is as follows:
Underwriting risk - required capital
| 31 December 2025 | 31 December 2024 | |||
|---|---|---|---|---|
| Total | IM | Total | IM | |
| Life underwriting risk | 2,037 | 1,280 | 2,757 | 1,039 |
| Health underwriting risk | 1,686 | - | 1,572 | - |
| Non-life underwriting risk | 769 | - | 745 | - |
| Total excluding diversification between underwriting risks | 4,492 | 1,280 | 5,074 | 1,039 |
The Life underwriting risk decreased mainly as a result of the implementation of the PIM methodology for a.s.r. life where longevity risk and mortality risk are based on the PIM. Furthermore, there is a lower impact due to assumption changes and economic variances.
The Health underwriting risk increased mainly as a result of the growth of the sum insured. Non-life underwriting risk increased due to growth of the sum insured, changes in interest rates and a the new reinsurance agreement with a.s.r. health.
Solvency II sensitivities
a.s.r. has assessed the impact of various sensitivities on the solvency ratio. The sensitivities as at 31 December 2025 and 2024, expressed as impact on the group solvency ratio (in percentage points) are as follows:
Solvency II sensitivities - insurance risks
| Effect on: | Available capital | Required capital | Ratio | |||
|---|---|---|---|---|---|---|
| Type of risk (%-points) | 31 December 2025 | 31 December 2024 | 31 December 2025 | 31 December 2024 | 31 December 2025 | 31 December 2024 |
| Expenses +10% | -5 | -5 | -1 | -1 | -6 | -6 |
| Mortality rates, all products -5% | -5 | -5 | - | - | -5 | -5 |
| Lapse rates -10% | - | - | - | - | - | - |
Solvency II sensitivities - explanation
| Risk | Scenario |
|---|---|
| Expense risk | Measured as the impact of a 10% increase in expense levels. |
| Mortality risk | Measured as the impact of a 5% decrease in all mortality rates. |
| Lapse risk | Measured as the risk of a 10% decrease in lapse rates. |
The table shows that the SCR sensitivities in 2025 are similar to the sensitivities of 2024. The impact on the ratio is the opposite if a reversed scenario is taken into account.
7.8.2.1 Life Underwriting risk
The Life portfolio can be divided into Individual life and Funeral and Pensions. The insurance contracts are sold primarily to retail and wholesale clients through intermediaries.
The products are sold as insurance products in cash or unit-linked contracts. With respect to products in cash, the investment risk is fully borne by the insurer whereas, in the case of unit-linked products, the majority of the investment risk is for the policyholder’s account.
The solvency capital requirement (SCR) for Life underwriting risks is determined per policy for the Funeral and Individual Life portfolio and per participant for the Pension portfolio. All shocks are applied to each policy/participant and an SCR value is only determined if applying the shock leads to a higher best estimate.
The following Life underwriting risks are involved:
Mortality risk
Mortality risk is associated with (re)insurance obligations, such as endowment or term assurance policies, where a payment or payments are made in case of the policyholder’s death during the contract term. The required capital for this risk under SF is calculated as the change in own funds of a permanent increase of mortality rates by 15% for all ages and each policy. The SF calculation applies to the 2024 figures of a.s.r. life. As of 2025, a.s.r life is also based on an Internal Model to calculate the mortality risk factor, al long with Aegon life and Aegon spaarkas. This risk factor contains shocks on both the level (experience) and the trend (population) of the mortality table. It projects mortality rates by age and gender.
Longevity risk
Longevity risk is associated with (re)insurance obligations where payments are made until the death of the policyholder and where a decrease in mortality rates results in higher technical provisions. The required capital for this risk under SF is calculated as the change in own funds of a permanent decrease of mortality rates by 20%. The SF calculation applies to the 2024 figures of a.s.r. life. As of 2025, a.s.r life is also based on an Internal Model to calculate the longevity risk factor, al long with Aegon life and Aegon spaarkas. This risk factor contains shocks on both the level (experience) and the trend (population) of the mortality table. It projects mortality rates by age and gender.
Disability-morbidity risk
Morbidity or disability risk is associated with all types of insurance compensating or reimbursing losses (e.g. loss of income, adverse changes in the best estimate of the liabilities) caused by changes in the morbidity or disability rates. Solvency II prescribes a 35% increase in disability rates for the first year, 25% for subsequent years, combined with a decrease in recovery rates of 20%. The disability-morbidity risk is calculated on policy level by increasing the experience percentage with 35% for the first year and 25% in the second. For the IBNR reserve the shock is simplified to an average of 30% for the 2-year IBNR cashflow. Because revalidation risk is very small, no shock is modelled for this risk.
Lapse risk
Lapse risk is the risk of losses (or adverse changes in the best estimate of the liabilities) due to an unanticipated (higher or lower) rate of policy lapses, terminations, changes to paid-up status (cessation of premium payment) and surrenders.
Lapse risk arises from economic losses due to policyholder behaviour deviating from expectations. Insurance contracts typically provide policyholders with a variety of options that they may or may not exercise. Lapse risk is the risk that actual policyholder behaviour deviates from the assumptions built into the reserve calculations. This includes assumptions about lapses, withdrawals, premium payment levels, allocation of funds, and the utilisation of possible options in the products.
In general, a lapse shock is only applied if a Solvency II lapse event is actually considered possible under the conditions of the insurance contract. For instance a paid-up policy that cannot be surrendered is not taken into account.
The effect of the lapse risk is equal to the highest result of a permanent increase in lapse rates of 50%, a permanent decrease in lapse rates of 50% or a mass lapse event (an instant lapse event of 40% of all policies). For the mass lapse event, the lapse risk is calculated as the maximum on policy level of a mass surrender or a mass paid-up event.
Within the Individual life portfolio there is a group of policies directly linked to a mortgage loan ('Spaarhypotheken'). In case the mortgage loan is not provided by a.s.r., but by another party, which is the case for most of these policies, the interest that a.s.r. reimburses to the policyholder is transfered from the party that has provided the mortgage loan. This cashflow of interests from the provider of the mortgage loan to a.s.r. represents an asset. The cashflow and value of this asset depends on the cashflow of the linked savings policy. Therefore, the change in this asset value due to mortality or lapse is taken into account when determining the SCR for Life insurance risks.
Expense risk
A calculation is made of the effect on own funds of a permanent increase in costs used for determining the best estimate. It consists of an increase in the costs of 10% and an increase in the cost inflation of 1 percentage point per year. For investment costs only an increase of 10% applies, since it has been substantiated that increases due to inflation including a shock can be absorbed by the Best Estimate itself and asset management for external parties.
Life catastrophe risk
Catastrophe risk arises from extreme events which are not captured in the other Life underwriting risks, such as pandemics. The capital requirement for this risk is calculated as a 0.5%-points increase in mortality rates in the first projected year for (re)insurance obligations where the increase in mortality rates leads to an increase in technical provisions.
Employee benefits
a.s.r. has a number of defined benefit plans for own staff in place. These are schemes, under which staff are awarded pension benefits upon retirement, usually dependent on one or more factors such as years of service and salary. The defined benefit obligation is calculated by independent actuaries at each reporting date.
Pension obligations are calculated using the projected unit credit method. Inherent to this method is the application of actuarial assumptions to discount rates, mortality rates and consumer price indices.
The assumptions are reviewed and updated at each reporting date based on available (market) data. The discount rate (31 December 2025: 4,00%) is based on the return (zero coupon rate) of high-quality corporate bonds (AA rating) and the cash flow pattern of the pension obligation. For SCR purposes, the IFRS value of the own pension contract is based on the IAS19 valuation methodology. The explanatory guidelines explain that the IAS19 valuation is consistent with Solvency II.
As of 1 January 2021 a defined contribution plan is in place. The accrued pensions (until 1 January 2021) will remain guaranteed at a.s.r. life and are not transferred to the defined contribution plan. The former employees of Aegon NL were added to the defined contribution plan as of 1 October 2023.
Other information
Within the life business the longevity risk is dominant and arises from group pension business (including buyouts) and individual annuities. The longevity risk is partly offset by mortality risk that arises from the Funeral portfolio and Individual Life policies with mortality. For Aegon life the longevity risk is also reduced by longevity risk reinsurance contracts. The other main risks the life business is exposed to are expense risk and lapse risk.
The table summarises the required capital for abovementioned life insurance risks based on the PIM after application of Loss Absorbing Capacity of Technical Provisions (LAC TP). The impact of LAC TP decreased in 2025 to € 109 million (2024: € 165 million).
Life underwriting risk - required capital
| 31 December 2025 | 31 December 2024 | |
|---|---|---|
| Mortality risk | 276 | 237 |
| Longevity risk | 1,512 | 1,855 |
| Disability-morbidity risk | 30 | 24 |
| Lapse risk | 573 | 768 |
| Expense risk | 733 | 861 |
| Revision risk | - | - |
| Catastrophe risk (subtotal) | 243 | 246 |
| Diversification | -1,330 | -1,234 |
| Life underwriting risk | 2,037 | 2,757 |
As of 2025, due to the changed risk taxonomy lapse persistency mortgages and lapse contagion liabilities are no longer part of the life underwriting risk, but part of spread risk.
The impact for mortality and longevity risk is mainly driven by the PIM implementation for a.s.r. life. Note that for a.s.r life mortality and longevity risk included in the 2024 figures is based on SF. Expense risk decreased mainly due to the assumption updates and economic varianciances. Lapse risk decreased mainly due to the removal of lapse persistency mortgages and lapse contagion liabilities as a result of a change in the risk taxonomy. Note that the total underwriting risk is lower than the sum underlying component because of diversification benefits between the SF and IM risks.
For the Life portfolio, the provision at year-end (provided figures are without reductions resulting from reinsurance contracts) can be broken down as follows under Solvency II:
Life portfolio - technical provisions per segment
| 31 December 2025 | 31 December 2024 | |
|---|---|---|
| Insurance with profit participation | ||
| Best estimate | 18,760 | 21,106 |
| Risk margin | 612 | 846 |
| Technical provision | 19,372 | 21,952 |
| Other life insurance | ||
| Best estimate | 30,755 | 30,640 |
| Risk margin | 734 | 1,048 |
| Technical provision | 31,489 | 31,687 |
| Index-linked and unit-linked insurance | ||
| Best estimate | 36,859 | 37,119 |
| Risk margin | 484 | 585 |
| Technical provision | 37,343 | 37,704 |
| Total | ||
| Best estimate | 86,374 | 88,865 |
| Risk margin | 1,830 | 2,478 |
| Technical provision | 88,204 | 91,343 |
In 2025, the technical provision decreased with € 3,139 million. This was mainly caused by the development of economic parameters, which has a downward effect on the best estimate liabilities of all the portfolios except Other Life insurance. In the segment Other Life insurance buy-outs are included which increased the best estimate liabilities, which was offset by increase of interest rates. The risk margin decreased in 2025 with € 648 million, mainly due the PIM implementation for a.s.r. life.
7.8.2.1.1 Managing Life underwriting risk
Life underwriting risk is mitigated by pricing, underwriting policies and reinsurance.
Pricing is based on profit capacity calculations. A calculation is made of the price required to cover the insurance liabilities, expenses and risks.
Underwriting policies describe the types of risks and the extent of risk a.s.r. is willing to accept. Policyholders may be subjected to medical screening for both Individual life and Funeral insurance.
Reinsurance
Reinsurance and other risk-mitigating measures are used to reduce the volatility of results or to decrease the possible negative impact on value as an alternative to the capital requirement. Reinsurance arrangements have been set up to mitigate the effects of catastrophes on earnings.
The level of retention in different reinsurance contracts is aligned with the size and the risk profile of the underlying portfolios. This includes taking account of the cost of reinsurance on the one hand, and the risk that is retained on the other.
In December 2025, Aegon life has entered into another longevity reinsurance contract with a reinsurer. The contract reinsures a specified portfolio of insurance contracts of a buy-out against possible future mortality developments. The size of the underlying portfolio is € 1.3 billion. The reinsurer will pay benefits as long as the participants live and receive fixed payments from Aegon life. A net reinsurance asset/liability is recognised in accordance with applicable IFRS requirements, using the general measurement model.
The total of indemnity swap reinsurance contracts related underlying portfolios corresponded to approximately € 13.9 billion of liabilities (2024: approximately € 12.5 billion). The agreements cover the longevity risk associated with policyholders, including deferred pensioners and in-payment policies of pensioners and dependents during the full run-off of these policies.
All agreements are collateralised to mitigate any potential counterparty risk and the agreements have no impact on the services and guarantees that are provided to the policyholders. At year-end 2025 € 432 million (market value € 427 million) has been posted as collateral with respect to the longevity reinsurance contracts (2024: € 491 million collateral, market value € 519 million). Collateral positions as part of the reinsurance transaction are included in the regular financial statements disclosures on collateral, i.e. as part of the counterparty default risk notes in the risk management paragraph and the note on transfer of financial assets.
Together, these agreements mitigate approximately 30% of the longevity risk exposure of a.s.r. As such, these agreements strongly reduce the concentration of risk exposure in longevity risk and help to diversify the risk profile of a.s.r.
7.8.2.2 Health underwriting risk and Non-life underwriting risk
7.8.2.2.1 Health underwriting risk
The Health underwriting portfolio of a.s.r. is diverse. The portfolio can be divided into two main product types:
SLT Health portfolio (Similar to Life Techniques) Income Protection, which can be divided into:
Individual Disability (Zelfstandigen)
Group Disability (WIA)
Premium waiver in case of disability (PVI)
NSLT Health portfolio (Not Similar to Life Techniques), which can be divided into:
Income Protection (Sickness, and Individual and Group Accident)
Medical Expenses (Basic and Supplementary)
The insurance contracts are sold primarily to retail and wholesale clients through intermediaries.
The Health insurance portfolio of a.s.r. contains the following underwriting risks:
SLT Health risk
This risk is applicable to the SLT Health portfolio. The calculation is scenario-based, according to the standard formula.
NSLT Health risk
This risk is applicable to the NSLT Health portfolio. The calculation is factor-based. The risk is calculated similarly to the Non-life insurance risk.
Health Catastrophe risk
This risk is applicable to the entire Health portfolio. The calculation is scenario-based.
SLT Health Risk
Mortality risk
Mortality risk is associated with (re)insurance obligations where payments are made upon the death of the policyholder and where an increase in mortality rates results in higher technical provisions. The required capital is calculated as the change in own funds of a permanent 15% increase in mortality rates. The increase in mortality rates is applied to portfolios where payments are contingent on mortality risk. The increase in mortality rates leads to an increase of the own funds. Therefore the mortality risk is zero for the Health portfolio.
Longevity risk
Longevity risk is associated with (re)insurance obligations where payments are made until the death of the policyholder and where a decrease in mortality rates results in higher technical provisions. The required capital is calculated as the change in own funds of a permanent 20% decrease in mortality rates. The decrease in mortality rates is applied to portfolios where payments are contingent on longevity risk.
Disability-morbidity risk
Morbidity or disability risk is the main risk to the SLT Health portfolio. The scenario analysis consists of a 35% increase in disability rates for the first year, 25% for subsequent years, combined with a decrease in revalidation rates of 20%.
Expense risk
A calculation is made of the effect of a permanent increase in costs, which is used for determining the best estimate. The scenario analysis contains an increase in the costs of 10% and an increase in the cost inflation of 1 percentage point per year.
Revision risk
The revision risk is the risk that a higher benefit is caused by either inflation or a revision of the disability percentage. Benefits that are sensitive to inflation and / or an increase in the disability percentage will be increased by 4%.
Lapse risk
Lapse risk is the risk of losses (or adverse changes in the best estimate of the liabilities) due to an unanticipated (higher or lower) rate of policy lapses, terminations, changes to paid-up status (cessation of premium payment) and surrenders. The effect of the lapse risk is equal to the highest result of a permanent 50% increase in lapse rates, a permanent 50% decrease in lapse rates or a mass lapse event (40% mass lapse). For the SLT Health portfolio, the mass lapse event is dominant.
Future management action
According to the insurance conditions, a.s.r. non-life has the ability to adjust the premiums and insurance conditions group wise in the future for the disability portfolio. Therefore, the contract boundary of the disability contracts without an individual risk assessment at acceptance is equal to the contract term. For contracts with an individual risk assessment at acceptance, the contract boundary is equal to the end age, because the contracts will be tacitly renewed until the end age is reached, without repeating the risk assessment. These contracts with an individual risk assessment involve the Individual Self-employed and the Individual Employees portfolio’s. For these portfolio’s, a.s.r. non-life applies a future management action (FMA), as noted in article 23 of the Delegated Acts. The trigger, as defined in the FMA, is hit in the Income Protection Disability-Morbidity Risk (article 156 DA) scenario.
For a number of Loyalis products within the group disability portfolio, it is determined annually whether the insured amounts are indexed. For the majority of the portfolio, there is a conditional indexation based on a (discretionary) management decision, based among other things on interest result. In a financially unfavourable year, there is the possibility of not paying out indexation, which is a FMA as noted in article 23 of the Delegated Acts.
NSLT Health Risk
NSLT Premium and reserve risk
The premium risk is the risk that the premium is not adequate for the underwritten risk. The premium risk is calculated over the maximum of the expected earned premium of the next year, and the earned premium of the current year. The reserve risk is the risk that the current reserves are insufficient to cover their run-off over a 12 month time horizon.
The NSLT Premium and reserve risk can be split into the following underwriting risks:
Medical Expense
The premium risk is the risk that the premium is not adequate for the underwritten risk. The premium risk is calculated over the maximum of the expected earned premium of the next year, and the earned premium of the current year.
Reserve risk is the risk that the current reserves are insufficient to cover the claims over a 12-month time horizon.
Income Protection
This component is calculated for policies for which an increase in mortality rates or morbidity rates or disability rates leads to an increase in the best estimate. There are three scenarios, which are calculated for all NSLT Health and portfolios.
NSLT lapse risk
The basic and additional health insurance are compulsory insurance contracts for one year without intermediate possibility of termination and therefore lapse risk is negligible for the basic health insurance.
Health catastrophe risk
Medical Expense
A health catastrophe for the NSLT Health portfolio is an unexpected future event with a duration of one year. The risk is determined ultimo year. The amount of catastrophe risk is apparent from the number of insured and parameters for mass accident scenario and pandemic scenario that have been approved by DNB in consultation with Health Insurers Netherlands. Accident concentration is not applicable for NSLT Health. The catastrophe risk has a projection of one year (T) following from the contract boundary of one year in accordance with the Dutch Health Insurance Act. After year T the risk is ‘zero’. Catastrophe risk for a.s.r. health supplementary equals zero because these contracts have a maximum compensation for claims.
Income Protection Mass accident scenario
In this scenario, an accident takes place during a major public event. The risk is that 10% of the attendees are killed, 3.5% are permanently disabled, 16.5% are disabled for 12 months and 30% need medical attention.
Income Protection Accident concentration scenario
In this scenario, an accident takes place on site, with the most of our insured at the same location. The risk is that 10% of those present are killed, 3.5% are permanently disabled, 16.5% are disabled for 12 months and 30% need medical attention.
Income Protection Pandemic scenario
In this scenario, there is a pandemic, which causes 1% of those affected to be hospitalised and 20% to see a local practitioner.
The table summarises the required capital for abovementioned Health insurance risks based on the standard model.
Health underwriting risk - required capital
| 31 December 2025 | 31 December 2024 | |
|---|---|---|
| Health SLT | 1,336 | 1,234 |
| Health Non-SLT | 519 | 499 |
| Catastrophe Risk (subtotal) | 92 | 88 |
| Diversification | -262 | -249 |
| Health (Total) | 1,686 | 1,572 |
| Mortality risk | - | - |
| Longevity risk | 77 | 79 |
| Disability-morbidity risk | 1,130 | 1,021 |
| Expense risk | 150 | 156 |
| Revision risk | 289 | 288 |
| Lapse risk | 323 | 296 |
| Diversification | -634 | -605 |
| Health SLT (subtotal) | 1,336 | 1,234 |
| Medical expenses insurance and proportional reinsurance | 173 | 155 |
| Income protection insurance and proportional reinsurance | 410 | 403 |
| Diversification | -64 | -59 |
| Health Non-SLT (subtotal) | 519 | 499 |
| Mass accident risk | 30 | 27 |
| Accident concentration risk | 75 | 75 |
| Pandemic risk | 45 | 38 |
| Diversification | -57 | -51 |
| Catastrophe risk (subtotal) | 92 | 88 |
The SCR for the Health Non-SLT risk differs from the sum of the amounts reported in the OTSO QRTs. This difference is caused due to a diversification benefit on group level.
For the SLT Health portfolio, the provision at year-end can be broken down as follows under Solvency II.
SLT Health portfolio - technical provisions per segment
| 31 December 2025 | 31 December 2024 | |
|---|---|---|
| Best estimate | 5,156 | 4,968 |
| Risk margin | 539 | 545 |
| Technical provision | 5,695 | 5,513 |
For the NSLT Health portfolio, the provision at year-end can be broken down as follows under Solvency II.
NSLT Health portfolio - technical provisions per segment
| 31 December 2025 | 31 December 2024 | |
|---|---|---|
| Best estimate | 652 | 603 |
| Risk margin | 66 | 60 |
| Technical provision | 718 | 663 |
7.8.2.2.2 Non-life underwriting risk
Non-life Insurance risk can be broken down into:
Premium and reserve risk
Non-life catastrophe risk
Lapse risk
Premium- and reserve risk
The premium- and reserve risk is derived at the level of a legal entity based on the standard model. The premium- and reserve risk is the risk that the premium respectively the reserve is not adequate for the underwritten risk. The reserve risk is associated with historical years, and the premium risk is associated with the future year(s). The premium risk is calculated over the maximum of the expected earned premium for the next year and the earned premium for the current year. For the calculation of the premium- and reserve risk, several input data and parameters are necessary, as described in the standard model. The geographical spread, when a (re)insurer underwrites products in different countries, is not relevant for a.s.r. non-life as there is no material exposure outside the Netherlands.
Non-life Catastrophe Risk Module
Catastrophe risk is defined as the risk of loss or adverse change in the value of insurance liabilities, resulting from significant uncertainty of pricing and provisioning assumptions related to extreme or exceptional events. The Non-life SCR Catastrophic Risk Module used, consists of natural catastrophe risk (Windstorm and Hail), man-made catastrophe risk (Fire, Motor and Liability) and other Non-life catastrophe risk. The Non-life Catastrophe Risk Module is derived at the level of a legal entity based on the standard model.
Lapse risk
The lapse risk is the loss in basic own funds caused by the discontinuance of 40% of the policies for which discontinuation would result in an increase of technical provisions (without the risk margin). The calculation is based on the type of discontinuance which most negatively affects the basic own funds, which is for Non-life immediately termination of the policy.
The table summarises the required capital for abovementioned Non-life underwriting risks based on the standard model.
Non-life underwriting risk - required capital
| 31 December 2025 | 31 December 2024 | |
|---|---|---|
| Premium and reserve risk | 709 | 670 |
| Lapse risk | 69 | 58 |
| Catastrophe risk | 164 | 193 |
| Diversification | -172 | -177 |
| Non-life underwriting risk | 769 | 745 |
| Natural catastrophe risk | 131 | 168 |
| Man-made catastrophe risk | 96 | 94 |
| Other non-life catastrophe risk | 20 | 19 |
| Diversification | -84 | -87 |
| Catastrophe risk (subtotal) | 164 | 193 |
For the Non-life portfolio, the provision at year-end can be broken down as follows under Solvency II:
Non-life portfolio - technical provisions per segment
| 31 December 2025 | 31 December 2024 | |
|---|---|---|
| Best estimate | 1,907 | 1,872 |
| Risk margin | 114 | 108 |
| Technical provision | 2,020 | 1,980 |
7.8.2.2.3 Managing Health and Non-life underwriting risk
Health and Non-life insurance risk is managed by monitoring claims frequency, the size of claims, inflation, handling time, benefit and claims handling costs, and biometrical risks (disability, recovery, illness, death). Concentration risk also qualifies as an insurance risk.
In recent years, measures have been taken to improve profitability and reduce risk. Examples are: premium increases, stricter acceptance criteria, shorter claims filing terms and making use of the claims reassessment arrangement between the Dutch Association of insurers and social security institute UWV. Effects are being monitored closely and assessed to be effective.
Claims frequency, size of claim and inflation
To mitigate the risk of claims, a.s.r. bases its underwriting policy on claims history and risk models. The policy is applied to each client segment and to each type of activity. In order to limit claims and / or ensure that prices are adjusted correctly, the acceptance policy is continually refined using a number of indicators and statistical analyses. The product lines also use knowledge or expectations with respect to future trends to estimate the frequency, size and inflation of claims. The risk of unexpected major damage claims is contained by policy limits, the concentration of risk management and specific risk transfer contracts (e.g. reinsurance).
Handling time
The time required for handling and settling claims is an important factor. The settlement of claims that have a long handling time, such as liability claims, can take many years. Analyses are performed regularly and based on a.s.r.’s experience in similar cases, historical trends – such as the pattern of liabilities – increases in risk exposure, payment of damages, the scale of current and not yet settled damage claims, court rulings and economic conditions.
Benefit and claims handling costs
Taking estimated future inflation into account, benefit and claims handling costs are managed based on regular reviews and related actions.
Disability risk
Disability risk is controlled by means of regular evaluation of historical claims patterns, expected future developments and price adjustments. Disability risk is mitigated by a.s.r. through underwriting criteria and a proactive reintegration policy. a.s.r. non-life ended the mitigation of its disability risk through reinsurance in 2023. The Individual Health SLT portfolio and a small part (Aegon) of the Group Health SLT portfolio is reinsured by a reinsurance contract. For the a.s.r. part of the portfolio this consists of inactive contracts only, for the Aegon part there is one remaining contract active until 1 January 2026. The reinsuring cash flows concern existing claims and are calculated separately in the cash flows models.
Concentration risk
Geographically, the risk exposure of a.s.r. on its health and Non-life portfolio is almost entirely concentrated in the Netherlands. Concentration of insurance risks is particularly prevalent in the fire risk portfolio (i.e. home and content, with storm and flood risk forming the most important factor). Storm and flood risk is managed by means of suitable reinsurance (see also ‘Reinsurance’).
There is also a concentration of risk in group disability schemes. Group disability contracts are underwritten within the scope of disability cover for employees in the Netherlands (WIA).
Reinsurance
When deemed effective in terms of capital relief versus costs incurred, a.s.r. enters into reinsurance agreements to mitigate Non-life and Health insurance risks. Reinsurance can be taken out for each separate claim (per risk), for the accumulation of claims due to natural disasters or to human actions (per event), or for both these risks.
The level of retention in the various reinsurance contracts is aligned with the size and the risk profile of the underlying portfolios, taking into account of the cost of reinsurance on the one hand, and the risk that is retained on the other.
To limit risk concentration, reinsurance contracts are placed with various reinsurance companies. a.s.r. requires the counterparties to be rated at least single A-. The structure of the reinsurance program has remained largely the same as in previous years in terms of cover and limits.
In 2025 a.s.r. purchased excess of loss reinsurance for accident year 2026 for Windstorm. The limit of the reinsurance contract is increased with € 100 million to € 900 million.
The Individual Health SLT portfolio and a small part of the Group Health SLT portfolio is reinsured by a reinsurance contract. The reinsuring cash flows concern existing claims and are calculated separately in the cash flows models. The total share of the reinsurances for a.s.r. amounted to € 119 million per 31 December 2025.
In 2025, part of the health portfolio of a.s.r. health basic and a.s.r. health supplementary has been reinsured at a.s.r. non-life via a quota share agreement. The internal reinsurance aims to better diversify the health risks within the a.s.r. group. The internal reinsurance has no effect on the a.s.r. results and has a limited effect on the required capital of a.s.r.
7.8.3 Market risk
Market risk is the risk of potential losses due to adverse movements in financial market variables. Exposure to market risk is measured by the impact of movements in financial variables such as equity prices, interest rates and property prices.
The various types of market risk which are discussed in this section, are:
mismatch risk
equity risk (including equity volatility risk)
property risk
currency risk
spread risk
concentration risk
In December 2025, a.s.r. life received approval to use a PIM for determing the required capital. This extends the use of the PIM from Aegon life and Aegon spaarkas to the a.s.r. life entity. This change is applied prospectively. The PIM contains separate modules for (i) interest rate risk, (ii) equity risk, (iii) property risk and (iv) spread risk. For the other risks, the Solvency II standard formula is applied. a.s.r. non-life and a.s.r. health use the Solvency II standard formula to calculate the solvency position. The total market risk is the sum of the SF and IM risks and diversification benefits.
The table summarises the required capital for market risks calculated as the sum of SF and IM risks, diversification benefits and excludes Deterministic Adjustment (DA). Following the harmonisation of the risk taxonomy per year-end 2025 mortgage prepayment risk is included in spread risk per year-end 2024 mortgage prepayment risk was included in life risk.
Market risk - required capital
| 31 December 2025 | 31 December 2024 | |
|---|---|---|
| Mismatch | 2,434 | 1,465 |
| Equity | 2,239 | 1,892 |
| Property | 1,311 | 1,709 |
| Currency | 157 | 403 |
| Spread | 3,534 | 2,218 |
| Concentration | - | - |
| Diversification | -4,133 | -2,235 |
| Total | 5,541 | 5,452 |
The main market risks of a.s.r. are mismatch, equity, property and spread risk. This is in line with the risk budgets based on the strategic asset allocation study. The total market risk amounted to € 5,541 million per year-end 2025 (2024: € 5,452 million). This includes a SF component of € 1,617 million (2024: € 3,485 million) and an IM component of € 4,108 million (2024: € 1,966 million). Note that the total market risk is lower than the sum of the SF component and the IM component because of diversification benefits between the SF and IM risks.
The increase in mismatch risk is mainly driven by the introduction of PIM for a.s.r. Life. The interest rate hedge of a.s.r. life aligned with this new model.
The increase in equity risk is driven by both a higher equity exposure and a increase of the symmetric adjustment of the equity capital charge to 7,90% (2024: 2,86%). Besides this, the introduction of PIM for a.s.r. Life also leads to an increase of equity risk.
The decrease in property risk is mainly driven by the introduction of PIM for a.s.r. Life. Besides this, the increase of the real estate portfolio leads to an increase of property risk.
The decrease in currency risk is the result of both (i) a changed hedge policy in 2025 and (ii) the introduction of PIM for a.s.r. life. The currency risk of shares in scope of PIM are taken into account in the equity risk module and therefore not in scope of SCR Currency risk. The other changes are mainly caused by the fact that a.s.r. life as of 2025 uses a PIM to calculate the solvency position.
The increase in spread risk is mainly driven by the introduction of PIM for a.s.r. life and the harmonisation of the risk taxonomy per year-end 2025 . Because of this harmonisation the mortgage prepayment risk is included in spread risk as of 2025, per year-end 2024 mortgage prepayment risk was included in life risk.
Concentration risk remained nil.
The diversification effect shows the effect of having a well-diversified investment portfolio.
a.s.r. accepts and manages market risk for the benefit of its customers and other stakeholders. a.s.r.’s risk management and control systems are designed to ensure that these market risks are managed effectively and efficiently, aligned with the risk appetite for the different types of market risks. Market risk reports are submitted to FRC at least once a month. In these reports different types of market risks are monitored and tested against the limits according to the financial risk policies.
The value of investment funds at year-end 2025 was € 11,703 million (2024: € 10,755 million). a.s.r. applies the look-through approach for investment funds to assess the market risk.
As part of PIM the DA is identified for Aegon life to mitigate volatility caused by the basis risk between (i) the EIOPA VA reference portfolio and (ii) the asset portfolio of Aegon life. The value of the DA at year-end 2025 was € -105 million (2024: € -148 million). Note that the DA is not included in the required capital for market risks, but is rather added on top level to the BSCR.
Solvency II sensitivities
The Solvency II SCR is a Value at Risk-measure. Therefore, Solvency II ratio sensitivities are disclosed as the alternative analysis, instead of IFRS sensitivities, as permitted by IFRS. The sensitivities of the solvency ratio as at 31 December 2025, expressed as the impact on the group solvency ratio (in percentage points) are as presented in the table below. The total impact is split between the impact on the solvency ratio related to movement in the available capital and the required capital. The sensitivities are based on the situation per 31 December 2025 and include Financial Institutions.
Solvency II sensitivities - market risks
| Effect on: | Available capital | Required capital | Ratio | |||
|---|---|---|---|---|---|---|
| Scenario (%-point) | 31 December 2025 | 31 December 2024 | 31 December 2025 | 31 December 2024 | 31 December 2025 | 31 December 2024 |
| Interest rate +0.5% (2025 incl. UFR=3.30% / 2024 incl. UFR=3.30%) | -3 | -4 | +2 | +3 | -1 | -1 |
| Interest rate -0.5% (2025 incl. UFR=3.30% / 2024 incl. UFR=3.30%) | +1 | +4 | -3 | -3 | -2 | +1 |
| Interest steepening +10 bps | -1 | -1 | - | - | -1 | -1 |
| Volatility Adjustment -10 bps | -9 | -10 | +6 | +6 | -3 | -4 |
| Spread shock sovereigns +50bp en VA +8bp (2024: VA +8bp) | -7 | -7 | +6 | +6 | -1 | -2 |
| Mortgage spread +25 bps (2024: +50 bps) | -6 | -12 | +2 | +4 | -4 | -8 |
| Equity prices -20% | -10 | -10 | +12 | +14 | +1 | +3 |
| Equity prices +20% | +11 | +11 | -9 | -12 | +1 | -2 |
| Property values -10% | -12 | -11 | +2 | +2 | -10 | -9 |
| Spread widening +75bp en VA +18bp (2024: VA +19bp) | +14 | +15 | -8 | -7 | +5 | +7 |
Solvency II sensitivities - explanation
| Risk | Scenario |
|---|---|
| Interest rate risk (incl. UFR=3.30% / 3.30%) | Measured as the impact of a parallel 0.5% upward and downward movement of the interest rates. For the liabilities, the extrapolation to the UFR (UFR=3.30% for 2025 and UFR=3.30% for 2024) after the last liquid point of 20 years remained unchanged. |
| Interest steepening | Measured as the impact of a linear steepening of the interest rate curve between 20Y and 30Y of 1 bps to 10 bps. |
| Volatility Adjustment | Measured as the impact of a 10 bps decrease in the Volatility Adjustment. |
| Government spread | Measured as the impact of an increase of spread on Government bonds of 50 bps. At the same it is assumed that the Volatility Adjustment will increase by +8bp (2024: +8bp). |
| Mortgage spread | Measured as the impact of a 25 bps (in 2024: 50 bps) increase of spreads on mortgages. |
| Equity risk | Measured as the impact of a 20% downward movement in equity prices. |
| Equity risk | Measured as the impact of a 20% upward movement in equity prices. |
| Property risk | Measured as the impact of a 10% downward movement in the market value of real estate. |
| Spread risk (including impact of spread movement on VA) | Measured as the impact of an increase of spread on loans and corporate bonds of 75 bps. At the same time, it is assumed that the Volatility Adjustment will increase by +18bp (2024: +19bp) based on reference portfolio. |
As of 2025, for equity risk both an upward and downward movement is reported. Furthermore, inflation sensitivity has been removed, as this has no longer an impact on the Solvency II ratio of a.s.r. The mortgage spread sensitivity is measured as of 2025 with a 25 bps impact (2024: 50 bps), which is more representative for a.s.r. The 2024 figures have not been restated for this change.
Spread widening will lead to a VA increase. At 31 December 2025, a corporate spread widening of 75 bps corresponded with 18 bps of VA increase (2024: 19 bps). A 50bps of government spread widening corresponded with 8 bps of VA increase (2024: 8 bps). In 2025, the mortgage spread impact decreased due to the decrease of the shock applied compared with previous year.
7.8.3.1 Mismatch risk
Following the harmonisation of the risk taxonomy, interest rate risk has been renamed to mismatch risk as of 2025. Mismatch risk is the risk that the value of assets or liabilities will change due to fluctuations in interest rates. a.s.r. is exposed to interest rate risk, as both its assets and liabilities are sensitive to movements in long- and short-term interest rates. Insurance products are exposed to interest rate risk. Especially the life insurance products are long-term and therefore particularly sensitive to interest rate risk. The interest rate risk of insurance products depends, besides the term to maturity, on interest rate guarantees and profit-sharing features.
SCR. Mismatch risk consists of the following risk types:
interest rate level risk (both IM and SF),
interest rate volatility risk (IM).
Mismatch risk is managed by aligning fixed-income investments to the profile of the liabilities. Among other instruments, swaptions and interest rate swaps are used for hedging the specific interest rate risk arising from interest rate guarantees and profit sharing features in life insurance products. An interest rate risk policy is in place for a.s.r. as well as for the registered insurance companies. Interest rate risk reports are submitted to the FRC at least once a month. In these reports the interest rate risk is monitored and tested against the limits according to the financial risk policies.
The required capital for interest rate risk is determined by calculating the impact on the available capital due to changes in the yield curve.
The Solvency II SF interest rate risk is the maximum loss of (i) an upward shock and (ii) a downward shock of the yield curve.
The used shocks vary by maturity and the absolute shocks are higher for shorter maturities (descending: 75% to 20% and ascending: -70% to -20%):
The yield curve up shock contains a minimum shock of 100bps;
The yield curve down shock is zero in case the yield curve is negative;
The yield curves of all currencies are shocked simultaneously.
All adjustments (credit spread, volatility adjustment) on the yield curve are considered constant.
The yield curve is extrapolated to the UFR. The yield curve after shock is not extrapolated again to the UFR.
The Solvency II IM for interest rate risks differ from the standard formula results for the following reasons:
The Solvency II PIM interest rate curve shocks are calibrated based on historical market data;
The Solvency II PIM assumes that the UFR does not change in a shock scenario, while the standard formula interest rate shock assumes that the whole curve moves, including the UFR;
In addition, the Solvency II PIM includes a capital requirement for interest rate volatility risk. This is defined as the risk of adverse financial impacts due to the difference in interest rate volatility sensitivity between assets and liabilities.
a.s.r. has assessed various scenarios to determine the sensitivity to interest rate risk. The impact on the solvency ratio is calculated by determining the difference in the change in available and required capital and include financial institutions.
Solvency II sensitivities - interest rate
| Effect on: | Available capital | Required capital | Ratio | |||
|---|---|---|---|---|---|---|
| Scenario (%-point) | 31 December 2025 | 31 December 2024 | 31 December 2025 | 31 December 2024 | 31 December 2025 | 31 December 2024 |
| Interest rate +0.5% (2025 incl. UFR=3.30% / 2024 incl. UFR=3.30%) | -3 | -4 | +2 | +3 | -1 | -1 |
| Interest rate -0.5% (2025 incl. UFR=3.30% / 2024 incl. UFR=3.30%) | +1 | +4 | -3 | -3 | -2 | +1 |
| Interest steepening +10 bp | -1 | -1 | - | - | -1 | -1 |
| Volatility Adjustment -10 bp | -9 | -10 | +6 | +6 | -3 | -4 |
7.8.3.2 Equity risk
The equity risk takes into account the risk arising from the sensitivity of the values of assets, liabilities and financial instruments to changes in the level or in the volatility of market prices of equities. Exposure to equity markets exists in both assets and liabilities. Asset exposure exists through direct equity investments. In order to maintain a good understanding of the actual equity risk, a.s.r. applies the look-through approach for investment funds to assess the equity risk. The equity risk of insurance products depends on guarantees, profit-sharing features and fees charged to separate accounts.
Equity risk consists of the following risk types:
equity risk (both IM and SF),
equity volatility risk (IM).
The Solvency II SF equity risk is determined by calculating the impact on the available capital due to an immediate drop in equity prices.
Equities listed in regulated markets in countries in the EEA or OECD are shocked by 39% together with the symmetric adjustment (type I).
Equities in countries that are not members of the EEA or OECD, unlisted equities, alternative investments, or investment funds in which the look-through principle is not possible, are shocked by 49% together with the symmetric adjustment (type II).
Investments of a strategic nature are shocked by 22%.
The equity capital of the renewable investments qualifying as an infrastructure investment (e.g. wind farm Wieringermeer) is shocked by 30% together with the symmetric adjustment.
The Solvency II IM includes an equity shock, which differs from the standard formula shock:
Equity risk shocks are calibrated based on a.s.r.'s own portfolio's.
The equity exposures are also shocked for equity volatility risks.
Solvency II sensitivities - equity prices
| Effect on: | Available capital | Required capital | Ratio | |||
|---|---|---|---|---|---|---|
| Scenario (%-point) | 31 December 2025 | 31 December 2024 | 31 December 2025 | 31 December 2024 | 31 December 2025 | 31 December 2024 |
| Equity prices -20% | -10 | -10 | +12 | +14 | +1 | +3 |
| Equity prices +20% | +11 | +11 | -9 | -12 | +1 | -2 |
Composition of equity risk portfolio
The total fair value of equities and similar investments at year-end 2025 was € 4,826 million (2024: € 4,732 million). The increase of the equity portfolio is both due to transactions and positive returns on the equity markets. Please note that the total fair value of equities and similar investments referred to in this section does not include "Assets held for index-linked and unit-linked contracts". Although the risks of these assets are primarily for the policyholders, guarantees within certain products may transfer some of the risk to a.s.r.
The equities are diversified across the Netherlands (including participating interests), other European countries and the United States. A limited part of the portfolio consists of investments in emerging markets and alternatives. A portfolio of equity options with a value of € 13 million is in place to mitigate the equity risk.
The table shows the exposure of the equity portfolio to different categories. The total value is including the equities in externally managed funds. The category Other contains mainly the investments of ASR infrastructure Renewables (AIR) in windmill - and solarparks which are in scope of 'Qualifying infrastructure equities other than corporate' (€ 155 million).
The composition of the equity portfolio is similar to previous year, The main differences are caused by the fact that a.s.r. life as of 2025 calculates the SCR in accordance with the PIM, which also impacts assets in scope of equity risk. The increase of 'Alternatives' is due the the fact that non-rated bonds of a.s.r. life are now in scope of equity risk instead of spread risk. The decrease of 'Other' is because the investment in AIR is threatend different, under PIM the net asset value of this participation is shocked, instead of applying looktrough.
Composition equity risk portfolio

7.8.3.3 Property risk
The property risk takes into account the risk arising from the sensitivity of the values of assets, liabilities and financial instruments to changes in the level or in the volatility of market prices of real estate. The property risk depends on the total exposure to real estate. In order to maintain a good understanding of the actual property risk, a.s.r. applies the look through approach for investment funds and participations which activities are primarily real estate investments.
The Solvency II SF property risk is determined by calculating the impact on the available capital due to an immediate drop in property prices by 25%. Both assets and liabilities are taken into account. The product Agrarische Impact Erfpacht (AIE) has effectively a lower charge due to the underlying risk mitigating characteristics of this product.
The Solvency II IM for property risk includes an IM property shock on the real estate portfolio, calibrated on a.s.r.'s own portfolio's as opposed to a 25% shock in the SF. As of 2025, the a.s.r. life portfolio is included in the calibration of the IM property shock.
The sensitivity of the solvency ratio to changes in property value is monitored on a monthly basis. Sensitivity of regulatory solvency (Solvency II) to changes in property prices is shown in the following table.
Solvency II sensitivities - property values
| Effect on: | Available capital | Required capital | Ratio | |||
|---|---|---|---|---|---|---|
| Scenario (%-point) | 31 December 2025 | 31 December 2024 | 31 December 2025 | 31 December 2024 | 31 December 2025 | 31 December 2024 |
| Property values -10% | -12 | -11 | +2 | +2 | -10 | -9 |
Composition of property risk portfolio
The property risk depends on the total exposure to property, which includes both property investments and property held for own use. The fair value of property was € 10,314 million at year-end 2025 (2024: € 9,712 million). The increase of the real estate portfolio is both due to transactions and positive returns on the real estate markets.
Please note that the total exposures to property referred to in this section does not include "Assets held for index-linked and unit-linked contracts". Although the risks of these assets are primarily for the policyholders, guarantees within certain products may transfer some of the risk to a.s.r.
Composition property risk portfolio

7.8.3.4 Currency risk
Currency risk measures the impact of losses related to changes in currency exchange rates. The table provides an overview of the currencies with the largest exposures. a.s.r. has currency risk to insurance products in mainly American dollars (USD), Great British Pound (GBP) and Australian dollars (AUD).
A currency risk policy is in place for a.s.r. as well as for the registered insurance companies. For different investment categories a.s.r. has defined a target hedge ratio. Currency risk reports are submitted to KLFC at least once a month. In these reports the currency risk is monitored and tested against the limits according to the financial risk policies.
The required capital for currency risk is determined by calculating the impact on the available capital due to a change in exchange rates. Both assets and liabilities are taken into account and a look-through approach is applied for investment funds. For each currency the maximum loss due to an upward and a downward shock of 25% is determined except for a small number of currencies where lower shocks are applied (a.o. Danish crown).
Currency risk - required capital
| 31 December 2025 | 31 December 2024 | |
|---|---|---|
| SCR currency risk - required capital | 157 | 403 |
In 2025 the Solvency II SF currency risk has decreased with € 246 million. The decrease in currency risk is the result of both (i) a changed hedge policy in 2025 and (ii) the introduction of PIM for a.s.r. life. The currency risk of shares in scope of PIM are taken into account in the equity risk module and therefore not in scope of SCR Currency risk.
Specification currencies with largest exposure
The total foreign exchange exposure at year-end 2025 was € 534 million (2024: € 1,523 million). The decrease in 2025 (approximately € 990 million) is the result of both (i) a changed hedge policy in 2025 and (ii) the introduction of PIM for a.s.r. life. The currency risk of shares in scope of PIM is taken into account in the equity risk module and therefore not in scope of SCR Currency risk.
Please note that the total foreign exchange exposure referred to in this section does not include "Assets held for index-linked and unit-linked contracts". Although the currency risk of these assets are primarily for the policyholders, guarantees within certain products may transfer some of the risk to a.s.r.
Composition currency portfolio

7.8.3.5 Spread risk
Spread risk arises from the sensitivity of the value of assets and liabilities to changes in the level of credit spreads on the relevant risk-free interest rates. a.s.r. has a policy of maintaining a well-diversified high-quality investment grade portfolio while avoiding large risk concentrations. Going forward, the volatility in spreads will continue to have possible short-term effects on the market value of the fixed income portfolio. In the long run, the credit spreads are expected to be realised and contribute to the growth of the own funds. Exposure to spread risk exists in both assets and liabilities. Asset exposure exists mainly through fixed income investments and mortgages. In order to maintain a good understanding of the actual spread risk, a.s.r. applies the look-through approach for investment funds. The spread risk of insurance products depends on guarantees and profit-sharing features.
The Solvency II SF spread risk is equal to the sum of the capital requirements for bonds, structured products and credit derivatives. Bonds and loans guaranteed by governments or international organisations could be in scope of counterparty default risk instead of spread risk. The capital requirement depends on (i) the market value, (ii) the modified duration and (iii) the credit quality category.
The Solvency II PIM for spread risk includes an IM spread shock which differs from the standard formula:
Spread shocks are calibrated on a.s.r.'s own fixed income portfolio's.
In contrast to the standard formula, government bonds are shocked with a factor larger than zero.
Mortgages are in scope of the spread risk module, while under the standard formula mortgages are in scope of counterparty default risk. Hence, as a result, the spread risk inherent in a.s.r.'s mortgage portfolio is partly included in this section and partly under counterparty default risk. In particular, the mortgage portfolios of a.s.r. life, Aegon life and Aegon spaarkas are included in this section since these entities use the Partial Internal Model (PIM), while the mortgage portfolios of a.s.r. non-life and a.s.r. health are included under counterparty default risk since these entities apply the Solvency II Standard Formula (SF).
The Solvency II PIM includes pre-payment risk on the mortgage portfolio.
Furthermore, the Solvency II PIM makes use of a dynamic volatility adjustment approach, while the standard formula does not. The Dynamic Volatility Adjustment (DVA) methodology follows an asset-only approach, ensuring spread widening is the biting scenario.
The performance of the fixed income portfolio is assessed under a broad range of credit scenarios and the model determines which part of the (short-term) losses experienced by the assets are recouped.
The sensitivity to spread risk is measured as the impact of an increase of spread on loans and corporate bonds of 75 bps. The VA is based on a reference portfolio. An increase of 75 bps of the spreads on loans and corporate bonds within the reference portfolio leads to an increase of the VA with 18 bps in 2025 (2024: 19bps). The credit spread sensitivity decreased to +5 increase in solvency ratio for a 75 bps spread shock, combined with a 18 bps VA shock.
Solvency II sensitivities - spread risk
| Effect on: | Available capital | Required capital | Ratio | |||
|---|---|---|---|---|---|---|
| Scenario (%-point) | 31 December 2025 | 31 December 2024 | 31 December 2025 | 31 December 2024 | 31 December 2025 | 31 December 2024 |
| Spread +75 bp / VA +18bp (2024: VA +19bp) | +14 | +15 | -8 | -7 | +5 | +7 |
Composition of spread risk portfolio
Spread risk is managed on a portfolio basis within limits and risk budgets established by the relevant risk committees. Where relevant, credit ratings provided by the external rating agencies are used to determine risk budgets and monitor limits. A limited number of fixed-income investments do not have an external rating. These investments are generally assigned an internal rating. Internal ratings are based on methodologies and rating classifications similar to those used by external agencies.
The following tables provide a detailed breakdown of the fixed-income exposure by (i) rating class and (ii) sector. Assets in scope of spread risk are, by definition, not in scope of counterparty default risk. The total exposure of assets in scope of spread risk is € 61,562 million (2024: € 54,693 million).
The increase in exposure is mainly due to the introduction of PIM for a.s.r. life, as a result of which a.s.r. life's mortgage portfolio is now in the scope of spread risk. As of 2024, this mortgage portfolio was still in scope of counterparty default risk. In the composition diagrams below, this leads to an increase in (i) the category "mortgages" in the breakdown by sector and (ii) an increase in the category "not rated" in the breakdown by rating. As a result, the relative exposure of the other categories has decreased.
The composition fixed income portfolio by sector slightly changed compared to previous years. The category 'government core' has been replaced by 'government AAA-AA'. The 2024 figures have been adjusted accordingly.
Please note that the total fixed-income exposure referred to in this section does not include "Assets held for index-linked and unit-linked contracts". Although the risks of these assets are primarily for the policyholders, guarantees within certain products may transfer some of the risk to a.s.r.
Composition spread risk portfolio by sector

Composition spread risk portfolio by rating

Please note that the category 'Not rated' consists mainly of mortgages (2025: 40% and 2024: 28%).
7.8.3.6 Market risk concentrations
Concentrations of market risk constitute an additional risk to an insurer. Concentration risk is the concentration of exposures to the same counterparty. Other possible concentrations (region, country, etc.) are not in scope. The capital requirement for concentration risk is determined in three steps:
determine the exposure above threshold. The threshold depends on the credit quality of the counterparty;
calculation of the capital requirement for each counterparty, based on a specified factor depending on the credit quality;
aggregation of individual capital requirements for the various counterparties.
According to the spread risk module, bonds and loans guaranteed by a certain government or international organisation are not in scope of concentration risk. Bank deposits can be excluded from concentration risk if they fulfil certain conditions.
a.s.r. continuously monitors exposures in order to avoid concentrations in a single obligor outside of the risk appetite and has an overall limit on the total level of the required capital for market risk concentrations. The calculation of the market risk concentrations applies to the total investment portfolio, where, in line with Solvency II, government bonds are not included.
The required capital for market risk concentrations is nil as per year-end 2025 (2024: nil).
7.8.4 Counterparty default risk
Counterparty default risk reflects possible losses due to unexpected default or deterioration in the credit standing of counterparties and debtors. Counterparty default risk affects several types of assets:
mortgages
savings-linked mortgage loans
derivatives
reinsurance
receivables
cash and cash equivalents
Assets that are in scope of spread risk are, by definition, not in scope of counterparty default risk and vice versa. The Solvency II regime makes a distinction between two types of exposures:
Type 1: These counterparties generally have a rating (reinsurance, derivatives, current account balances, deposits with ceding companies and issued guarantee (letter of credit). The exposures are not diversified.
Type 2: These counterparties are normally unrated (receivables from intermediaries and policyholders, mortgages with private individuals or SMEs). The exposures are generally diversified.
The total capital requirement for counterparty risk is an aggregation of the capital requirement for type 1 exposure and the capital requirement for type 2 exposure by taking 75% correlation.
Counterparty default risk - required capital
| 31 December 2025 | 31 December 2024 | |
|---|---|---|
| Type 1 | 144 | 159 |
| Type 2 | 96 | 234 |
| Diversification | -15 | -24 |
| Total | 226 | 369 |
In 2025, the Solvency II SF Counterparty default has decreased with € 143 million. The counterparty risk type 1 is lower compared to previous year, mainly due to the decreased cash position. The counterparty risk type 2 is significantly lower per year-end 2025, mainly due to the introduction of PIM for a.s.r. life, as a.s.r. life's mortgage portfolio is now in the scope of spread risk.
7.8.4.1 Mortgages
Mortgages are granted for the account and risk of third parties and for a.s.r.’s own account. The a.s.r. portfolio consists only of Dutch mortgages with a limited counterparty default risk. The fair value of a.s.r.’s mortgage portfolio in scope of Counterparty default risk is € 2,789 million at year-end 2025 (2024: € 11,846 million). The decrease in exposure is mainly due to the introduction of PIM for a.s.r. life, as a.s.r. life's mortgage portfolio is now in the scope of spread risk.
Please note that the mortgages of Aegon life, a.s.r. life and Aegon spaarkas are in scope of Solvency II IM spread risk.
Composition mortgage portfolio

The Loan-to-Value ratio is based on the value of the mortgage according to Solvency II principals with respect to the a.s.r. calculated collateral. The percentage of mortgages which are in arrears for over three months remained stable at 0.04% in 2025 (2024: 0.04%).
7.8.4.2 Savings-linked mortgage loans
The counterparty default risk of the savings-linked mortgage loans ('Spaarlossen') depends on the counterparty. For 11% of the portfolio, the counterparties are Special Purpose Vehicles. The risk is limited due to the robust quality of the mortgages in the Special Purpose Vehicles in combination with the tranching. a.s.r. has a cession-retrocession agreement with the counterparty for 86% of the portfolio, for which the risk is limited. Effectively, a.s.r. recognises the underlying receivable from the counterparty (or in the case of insolvency of the counterparty the mortgage loans transfers as collateral), mitigating the counterparty default risk of the savings-linked mortgage loans.
Composition savings-linked mortgage loans portfolio

7.8.4.3 Derivatives
Over the Counter (OTC) derivatives are primarily used by a.s.r. to manage the interest-rate risks incorporated into the insurance liabilities. Interest-rate derivatives are traded with a well-diversified and qualitative dealer panel with whom there is an established International Swaps and Derivatives Association (ISDA) contract and a Credit Support Annex (CSA) in place. These CSAs include specific agreements on the exchange of collateral limiting market and counterparty risk. The outstanding value of the interest rate derivative positions is matched by collateral received from eligible counterparties, minimising the net counterparty default risk. In addition, a sizeable part of the interest-rate swap portfolio (and virtually all new interest rate swaps) are centrally cleared, which significantly reduces counterparty default risk.
7.8.4.4 Reinsurance
a.s.r. collaborates with reinsurers. When entering into reinsurance contracts a.s.r. requires the counterparty to be rated at least single A. With respect to long-tail business and other sectors, the minimum permitted rating is single A.
The table shows the exposure to reinsurers which are in scope of counterparty default risk. The total exposure to reinsurers at year-end 2025 was € 274 million (2024: € 340 million). Counterparty default risk is immaterial for Aegon life’s reinsurance exposure and therefore not in scope of the Composition table. As of 2025 part of the insurance portfolio of a.s.r. health is internally reinsured by a.s.r. non-life. On group level these reinsurance contracts do not contribute to Counterparty default risk and therefore not in scope of the Composition table.
Composition reinsurance counterparties by rating

7.8.4.5 Receivables
The receivables with a counterparty default risk amounted to € 637 million at year-end 2025. This consists of Health insurance fund receivables (€ 182 million), intermediaries receivables (€ 97 million), policyholders receivables (€ 46 million) and other (non-insurance) receivables (€ 311 million).
7.8.4.6 Cash and cash equivalents
The current accounts in scope of counterparty default risk amounted € 1,105 million in 2025 (2024: € 2,494 million), this excludes commercial papers.
Composition cash accounts by rating
| 31 December 2025 | 31 December 2024 | |
|---|---|---|
| AAA | 0 | 40 |
| AA | 117 | 176 |
| A | 988 | 2,278 |
| Lower than A | 0 | 0 |
| Total | 1,105 | 2,494 |
7.8.4.7 Expected credit loss
The recognition and measurement of impairments is forward-looking, and apply to all debt instruments measured at amortised cost and at FVOCI. Initially, a provision is required for credit losses expected within the next 12 months. This is referred to as ‘Stage 1’. If there is a significant increase in credit risk between the moment of origination and the reporting date, but the exposure is not in default, the exposure is in ‘Stage 2’. If the exposure is in default, this is referred to as ‘Stage 3’. For both ‘Stage 2’ and ‘Stage 3’, a provision is required for expected credit losses over the remaining lifetime of the financial asset.
Expected credit loss measurement
The impairment requirements outline a ‘three-stage’ model for impairment based on changes in credit quality since initial recognition as summarised below:
A financial instrument that is not credit-impaired on initial recognition is classified into ‘Stage 1’ and has its credit risk continuously monitored by a.s.r.:
a) If a significant increase in credit risk (‘SICR’) since initial recognition is identified, the financial instrument is moved to ‘Stage 2’ but is not yet deemed to be credit impaired.
b) If the financial instrument is credit-impaired, the financial instrument is then moved to ‘Stage 3’.Financial instruments in Stage 1 have their ECL measured at a 12-month expected credit losses that result from default events possible within the next 12 months.
Financial instruments in Stages 2 or 3 have their ECL measured based on expected credit losses on a lifetime basis.
ECL is measured on either a 12-month basis (Stage 1) or lifetime basis (Stages 2/3) depending on whether a significant increase in credit risk has occurred since initial recognition or whether an asset is considered to be credit-impaired.
Expected credit losses are the discounted product of the Probability of Default (PD), Exposure at Default (EAD), and Loss Given Default (LGD), defined as follows:
PD represents the likelihood of a borrower defaulting on its financial obligation, either over the next 12 months (12-month PD), or over the remaining lifetime (lifetime PD) of the obligation;
EAD is based on the amounts a.s.r. expects to be owed at the time of default, over the next 12 months (12-month EAD) or over the remaining lifetime (lifetime EAD);
LGD represents a.s.r.’s expectation of the extent of the loss on a defaulted exposure. LGD varies by type of counterparty, type and seniority of the claim, and availability of collateral or other credit support. LGD is expressed as a percentage loss per unit of exposure at the time of default (EAD). LGD is calculated on a 12-month or lifetime basis, where the 12-month LGD is the percentage of loss expected to be made if the default occurs in the next 12 months, and the lifetime LGD is the percentage of loss expected to be made if the default occurs over the remaining expected lifetime of the loan.
A pervasive concept in measuring ECL is that it should consider forward-looking information. a.s.r. has performed historical analyses to identify the key economic variables impacting credit risk and expected credit losses for each portfolio. Expert judgment was also applied in this process.
a.s.r. employs a model to calculate ECL on the asset class mortgage loans at amortised cost.
Asset classes not covered by the ECL calculations are considered either to have immaterial credit risk or to be short-term in nature.
Given the nature and credit quality of the mortgage loans measured at amortised cost, with only limited number of mortgages with payment arrears and in general sufficient collateral, the total loss allowance of mortgages that is recognised per 31 December 2025 is less than € 1 million (31 December 2024: less than € 1 million), with no material transfers between Stage 1, Stage 2 and Stage 3 for the reported period.
The total of undiscounted ECL at initial recognition for purchased or originated credit-impaired financial assets recognised during 2025 amounts to € 0 million (2024: € 0 million), as no credit-impaired financial assets are originated or purchased by a.s.r.
The following tables further specify the changes in gross carrying amounts of the mortgage loans measured at amortised cost. The gross carrying amounts in these tables are the clean values, thus excluding the accrued interest.
Changes in gross carrying amounts of mortgage loans measured at amortised cost
| 2025 | Stage 1 (12-month ECL) | Stage 2 (Lifetime ECL) | Stage 3 (Lifetime ECL) | Total |
|---|---|---|---|---|
| At 1 January | 2,566 | 55 | 4 | 2,624 |
| Stage transfers | -28 | 28 | - | - |
| Purchases and originations | 173 | - | - | 173 |
| Repayments | -198 | -2 | -1 | -200 |
| Other changes | -69 | - | - | -69 |
| Gross carrying amount at 31 December | 2,444 | 81 | 3 | 2,529 |
| 2024 | Stage 1 (12-month ECL) | Stage 2 (Lifetime ECL) | Stage 3 (Lifetime ECL) | Total |
|---|---|---|---|---|
| At 1 January | 14,121 | 414 | 18 | 14,552 |
| Stage transfers | 34 | -34 | - | - |
| Purchases and originations | 408 | 2 | - | 410 |
| Repayments | -322 | -7 | -1 | -330 |
| Changes in the composition of the group | -11,730 | -320 | -13 | -12,063 |
| Other changes | 55 | - | - | 55 |
| Gross carrying amount at 31 December | 2,566 | 55 | 4 | 2,624 |
Per 31 December 2025, private loans measured at amortised cost are in Stage 1 for an amount of € 8 million, and nil in Stage 2 and Stage 3 (31 December 2024: € 9 million in Stage 1, nil in Stage 2 and Stage 3).
7.8.5 Liquidity risk
Definition and Framework
Liquidity risk is the risk that a company is not able to meet its financial obligations to policyholders and other creditors when they become due and payable, at a reasonable cost and in a timely manner. This risk is not quantified in the Solvency Capital Requirement (SCR).
Liquidity risk management has several levels:
Short-term management: This covers the day-to-day cash requirements and aims to meet short-term liquidity risk targets.
Medium-to-long-term management: This considers the strategic matching of liquidity and funding needs in different business conditions. This is also part of the strategic asset allocation process.
Stress management: This refers to the ability to respond to a potential crisis resulting from a market event and/or a company-specific event.
Sources of Liquidity Risk
Although a significant proportion of the investment portfolio can be quickly converted into cash under normal circumstances, some assets, such as private loans, mortgage loans, real estate, may not be possible to sell at a reasonable price on short notice. Specific events that can have a sudden, adverse impact on available liquidity include:
A large change in interest rates or credit spreads.
Insolvency or loss of confidence of a counterparty were current accounts or credit facility is held.
Unexpected lapses in the insurance portfolios.
Margin calls related to derivative agreements.
General market circumstances in which liquidity becomes scarce.
Monitoring and Stress Testing
The liquidity position is monitored continuously through various reports, such as the Liquiditeiten Allocatie Plan and the Liquidity Stress Test. The latter tests the ability to meet all potential cash demands and is conducted for at least two scenarios:
Base scenario: Assumes current market conditions ('business as usual').
Stressed scenario: A scenario in which both liabilities and assets are stressed. This represents a very extreme scenario with respect to the materialization of liquidity risk.
Risk Mitigation Techniques
The policy aims to ensure that sufficient highly liquid assets are held to meet all payment obligations, both in normal and extreme conditions. The primary mitigation techniques are:
Holding liquid assets: A buffer of liquid assets is maintained, comprising of cash, and cash equivalents and investment-grade securities for which there is an active and liquid market. Furthermore, a portion of liquid assets must be held in overnight liquidity.
External funding facilities: To ensure liquidity under all market circumstances, committed external facilities are available, such as repo-facilities and liquidity facilities with third parties.
Strategic Asset Allocation: The strategic asset allocation reflects the expected and contingent liquidity needs of the liabilities.
Contingency planning: An adequate and up-to-date policy and contingency plan are in place to enable management to act effectively and efficiently in times of crisis.
The following table shows the contractual undiscounted cash flows of the insurance liabilities based on Solvency II. All other line items as well as the total carrying value are based on IFRS principles.
The insurance liabilities include the impact of expected lapses and mortality as well as non-profit sharing cash flows. Profit sharing cash flows of insurance liabilities are not taken into account, nor are equities, property and swaptions. Furthermore, cash flows of the pension benefit obligations are taken into account.
Contractual cash flows
| Payable on demand | < 1 years | 1-5 years | 5-10 years | > 10 years | Carrying value | |
|---|---|---|---|---|---|---|
| 31 December 2025 | ||||||
| Insurance liabilities | 750 | 4,292 | 32,597 | 25,037 | 76,712 | 101,360 |
| Pension Benefit Obligation | - | 133 | 1,066 | 1,342 | 6,036 | 4,810 |
| Derivatives liabilities | - | 209 | 2,141 | 4,868 | 10,541 | 15,453 |
| Financial liabilities | 3,550 | 2,664 | 757 | 1,082 | 1,531 | 9,585 |
| Future interest payments | - | 109 | 394 | 416 | 704 | - |
| Total | 4,301 | 7,405 | 36,954 | 32,744 | 95,525 | 131,209 |
| Payable on demand | < 1 years | 1-5 years | 5-10 years | > 10 years | Carrying value | |
|---|---|---|---|---|---|---|
| 31 December 2024 | ||||||
| Insurance liabilities | 712 | 4,352 | 29,731 | 23,847 | 75,592 | 102,565 |
| Pension Benefit Obligation | - | 125 | 1,012 | 1,292 | 6,001 | 5,037 |
| Derivatives liabilities | - | 768 | 2,091 | 1,996 | 3,310 | 8,666 |
| Financial liabilities | 4,397 | 1,448 | 1,322 | 1,052 | 3,070 | 11,312 |
| Future interest payments | - | 228 | 750 | 746 | 1,226 | - |
| Total | 5,109 | 6,922 | 34,906 | 28,932 | 89,199 | 127,580 |
The insurance contract liabilities contractual cash flows for the period 1-5 years can be split into: 1-2 years € 15,314 million (2024 € 13,455 million), 2-3 years € 5,969 million (2024 € 5,525 million), 3-4 years € 5,807 million (2024 € 5,479 million) and 4-5 years € 5,506 million (2024 € 5,271 million).
When the amount payable is not fixed the amount reported is determined by reference to the conditions existing at the reporting date.
Financial liabilities payable on demand include the liability recognised for cash collateral received under ISDAs, concluded with counterparties. The related cash collateral received is recognised as cash and cash equivalents, and not part of the liquidity risk exposure table.
7.8.6 Operational risk
Operational risk concerns the risk of direct and / or indirect losses which can occur within a.s.r. as a result of inadequate or failing (changing) internal processes, people, systems and/or as a result of external events. Operational risks occurred are most times being caused by the failure of processes, people, systems, external events or a combination of these factors.
Operational risk - required capital
| 31 December 2025 | 31 December 2024 | |
|---|---|---|
| SCR operational risk - required capital | 419 | 430 |
The SCR for operational risk amounts to € 419 million at the end of 2025 (2024: € 430 million) and is determined with the standard formula under Solvency II. The operational risk is based on the basic SCR, the volumes of premiums and technical provisions, and the amount of expenses.
There is no benefit of diversification for operational risk.
7.8.7 Strategic and operational risk management
The system of internal control includes the management of risks at different levels in the organisation, both operational and strategic.
7.8.7.1 Strategic Risk Management
Strategic risk management aims to identify and manage the most important risks that (may) impact a.s.r.’s strategic objectives. The process of strategic risk analysis (SRA) is designed to identify, measure, manage, monitor, report and evaluate those risks that are of strategic importance to a.s.r.:
Identifying
Through the SRA process, identification of risks is structurally organised through the combined top-down and bottom-up SRA approach. The SRA outcomes are jointly translated into ‘risk priorities’ and ‘emerging risks’, in which the most important risks for a.s.r. are represented.
Measuring
Through the SRA process, the likelihood and impact of the identified strategic risks are assessed, taking into account (the effectiveness of) risk mitigating measures and planned improvement actions. Information from other processes is used to gain additional insights into the likelihood and impact. One single risk priority can take multiple risks into account. In this manner, the risk priorities provide (further) insights into risk interdependencies.
Managing
As part of the SRA process, the effectiveness of risk mitigating measures and planned measures of improvement is assessed. This means risk management strategies are discussed, resulting in refined risk management strategies.
Monitoring and reporting
The output of the SRA process is translated into day-to-day risk management and monitoring and reporting, both at group and product line level. At group level, the risk priorities are discussed in the a.s.r. Risk Committee and the Audit & Risk Committee. At the level of the business lines, risks are discussed in the BRC’s.
Evaluating
Insights regarding likelihood and impact are evaluated against solvency targets in the SRA process. Based on this evaluation, conclusions are formulated regarding the adequacy of solvency objectives at group and individual legal entity level.
Climate change
One of the areas within Strategic Risk Management concerns climate change. For a.s.r., climate change is a direct and indirect risk, both to its assets and liabilities. In section 5.4.3 Identified risks and 6.2.1 Climate change, the relevant climate related risks for a.s.r. are discussed including how these risks are managed. Climate change related risks have had no direct impact on the valuation in the current accounting and disclosures of a.s.r.'s assets and liabilities.
7.8.7.2 Operational Risk Management
Operational Risk Management (ORM) involves the management of all possible risks that may influence the achievement of the business goals and that can cause financial or reputational damage. ORM includes the identification, analysis, prioritisation and management of these risks in line with the risk appetite. The policy on ORM is drafted and periodically evaluated under the coordination of ORM. The policy is implemented in the (decentralised) business entities under the responsibility of the management boards. A variety of risks is covered by ORM policies, such as the Process, IT, outsourcing, project, reporting policy etc.
Identifying
With the operational targets as a starting point, each business entity performs risk assessments to identify events that could influence these targets. In each business entity the a first line risk manager facilitates the periodic identification of the key operational risks. All business processes are taken into account to identify the risks. All identified risks are prioritised and recorded in a risk-control framework.
The risk policies prescribe specific risk analyses to be performed to identify and analyse the risks. For IT systems, Information Security Analyses (DIVA - Dienstverlening en Informatie Veiligheids Analyse) have to be performed and for large outsourcing projects a specific risk analysis is required.
Measuring
All risks in the risk-control frameworks are assessed on likelihood and impact. Where applicable, the variables are quantified, but often judgments of subject matter experts are required. Based on the estimation of the variables, each risk is labelled with a specific level of concern (1 to 4). Gross risks with a level of concern 3 or 4 are considered ‘key’.
Managing
For each risk, identified controls are implemented into the processes to keep the level of risk within the agreed risk appetite (level of concern 1 or 2). In general, risks can be accepted, mitigated, avoided or transferred. A large range of options is available to mitigate operational risks, depending on the type. An estimation is made of the net risk, after implementing the control(s). A more effective and efficient approach to managing risks is required driven by increased complexity of processes, data processing and the need for a timely and accurate view on the risk profile. a.s.r. is therefore in the process of shifting towards a more automated approach to manage risks, for example automated controls, data analysis and the use of AI for reporting purposes.
Monitoring and reporting
The effectiveness of ORM is periodically monitored by the first line risk manager at each business line or legal entity. For each key control in the risk-control framework a testing calendar is established based on auditing standards. Each key control is tested regularly and the outcomes of the effectiveness of the management of key risks are reported to the (local) management. Outcomes are also reported to the NFRC and a.s.r. risk committee.
Evaluating
Periodically, yet at least annually, the risk-control frameworks and ORM policies are evaluated to see if revisions are necessary. The risk management function also challenges the business segments and legal entities regarding their risk-control frameworks.
Effectiveness criteria of the RM process
As part of the Statement on RM (VOR), the EB is required to provide annual assurance on the effectiveness of the internal RM and control system with respect to operational, compliance, and reporting risks for the past financial year. The effectiveness criteria focus on the RM process, which is a key component of a.s.r.’s RM system. The following indicators have been defined:
Risk Analysis (ORA): percentage of Operational Risk Assessments completed
Risk Analysis (SIRA): percentage of Strategic/Compliance Risk Assessments completed
Testing: percentage of controls found to be ineffective (regardless of materiality)
Action Tracking: percentage of overdue actions originating from control testing
ORM/Compliance Reporting: percentage of Level 2 operational and compliance risk categories outside risk appetite
Together, the set of effectiveness criteria provides a comprehensive view of the RM process. The effectiveness criteria are applied to assess the level of assurance the EB can provide regarding the functioning of the RM and control system for operational and compliance risks.
Operational incidents
Operational incidents are reported to GRM, in accordance with the operational risk policy. Root cause analyses are performed to evaluate the causes of losses in order to learn from these experiences. An overview of the largest operational incidents and the level of operational losses is reported to the NFRC. Actions are defined and implemented to avoid repetition of operational incidents.
ICT
Through IT risk management, a.s.r. devotes attention to the confidentiality, integrity and availability of ICT, including End User Computations. The logical access control for key systems used in the financial reporting process remains a high priority in order to enhance the integrity of applications and data. The logical access control procedures also prevents fraud by improving segregation of duties and by offsetting current and desired access levels within the systems and applications. Proper understanding of information, security and cyber risks is essential and the reason for which continuous actions are carried out to create awareness among employees. All of a.s.r.’s security measures are tested periodically. To increase cyber resilience, a.s.r. is participating in de DNB Threat Intel Based Ethical Red Teaming exercise.
Business Continuity Management
Operations and the execution of critical processes can be disrupted significantly by unforeseen circumstances or calamities. Preparation and practice enable a.s.r. to resume its most important business activities with limited interruptions and to react quickly and effectively during such situations.
Critical processes and the people, assets and technology needed to run them are identified during the Business Impact Analysis. The factors and calamities that can threaten the availability these processes are identified in the Threat Analysis. If the impact of certain events can be unacceptable large, mitigating actions are taken. In response to the large dependence of a.s.r. of automated systems, cyber threats are always addressed during these analyses.
a.s.r. defines a crisis as: one or more business lines are (in danger of being) disrupted due to a calamity or potentially suffering reputational damage beyond the acceptable. In order to manage the crisis, and to be able to react timely, efficiently and effectively, a.s.r. has set up a crisis organisation.
There is a central crisis team led by a member of the board. Additionally each business line has its own team to deal with smaller crises. The measures to ensure continuity of critical processes are tested regularly and all crisis teams are trained annually to be able to act effectively during such situations. The plans to deal with the various scenarios, including cyber threats, are also practiced periodically.
Recovery and Resolution
a.s.r. has to comply with Dutch legislation that addresses the recovery and settlement of insurance companies ('Wet herstel en afwikkeling van verzekeraars' in Dutch). The objective of this legislation is that insurance companies are well-prepared to recover from financial difficulties they may face and that insurance companies can be resolved by the resolution authority (in the case of a.s.r. this is DNB) in an orderly manner, when they are not able to recover and have failed or are likely to fail. To ensure the orderly resolution of critical functions that an insurance company may perform, DNB prepares an ex ante resolution plan in which it identifies, ex ante, such functions and plans the resolution strategy for such functions. In exceptional cases, DNB may identify material impediments that need to be resolved by the insurance company in order to ensure the resolvability of these functions. The Wet herstel en afwikkeling verzekeraars, which currently is not based on European legislation, will be amended for the implementation of the European Insurance Recovery and Resolution Directive (IRRD). These changes will take effect as per 30 January 2027.
As part of the legislation a.s.r. is obliged to draw up a Preparatory Crisis Plan ('Voorbereidend Crisisplan' in Dutch) every three years, that has been approved by DNB. In 2024, a.s.r.’s Preparatory Crisis Plan is updated and helps to be prepared and supports the organisation in various scenarios of extreme financial stress. The Preparatory Crisis Plan describes and quantifies the measures that can be applied to handle a crisis situation and to resume business. These measures are tested in the scenario analysis, in which the effects of each recovery measure on a.s.r.’s financial position (solvency and liquidity) are quantified. The required preparations for implementing the measures, their implementation time and effectiveness, potential obstacles, impact on clients and operational effects are also assessed. The main purpose of the Preparatory Crisis Plan is to increase the chances of early intervention in the event of a financial crisis situation and to further guarantee that the interest of clients and other stakeholders are protected.
Reasonable assurance and model validation
a.s.r. aims to obtain reasonable assurance regarding the adequacy and accuracy of the outcomes of models that are used to provide best estimate values and solvency capital requirements. To this end, multiple instruments are applied, including model validation. Two times a year a model inventory is performed by the product lines to determine if and when a model (re)validation is required. Triggers for model (re)validation are diverse, e.g. regulation, conversions, analysis of change. Materiality is determined by means of an assessment of impact and complexity. Impact and complexity is expressed in terms of High (H), Medium (M), or Low (L). The model inventories are discussed in the Model Committee.
In the pursuit of reasonable assurance, model risk is mitigated and unacceptable deviations are avoided, against acceptable costs.
7.9 Capital management
Key figures
Eligible own funds

SCR

The Solvency II ratio increased to 218% (31 December 2024: 198%) and includes the benefit of the transition to the PIM methodology for a.s.r. life of +12%-points. Capital deployment contributes -6%-points for the acquisition of the remaining shares of HumanTotalCare (-2%-points) and closing of three buy-outs (-4%-points).
The EOF increased to € 13,007 million (31 December 2024: € 12,321 million) mainly driven by the transition to the PIM methodology for a.s.r. life, positive impact from excess returns, new business and positive impact from market variances, partly offset by the own funds impact of acquisition of the remaining shares of HumanTotalCare, closing of three pension buy-outs, operational variances, dividend distribution and share buybacks.
The SCR decreased to € 5,966 million (31 December 2024: € 6,209 million), driven by the transition to the PIM methodology for a.s.r. life, the release in the period net of contribution of new business and operational developments. This is partly offset by increases from the capital requirement from the closing of three pension buy-outs and market variances including the impact of the downgrade of France and increased equity dampener.
As of 2025, the required capital of the subrisks are calculated excluding the impact of Loss Absorbing Capacity of Technical Provisions (LAC TP), due to changes in the LAC TP model (2024: include LAC TP). Therefore, LAC TP is shown separately as of 2025.
Other Capital Required relate to other financial sectors such as de Hoop and TKP.
Reconciliation total IFRS equity vs EOF Solvency II
| 31 December 2025 | 31 December 2024 | |
|---|---|---|
| IFRS equity | 10,124 | 9,833 |
| Adjustments | -1,262 | -898 |
| Elimination intangible assets | -858 | -633 |
| Net revaluation insurance liabilities | 3,925 | 2,421 |
| Other revaluations | -1,161 | -801 |
| Excess of assets over liabilities | 10,767 | 9,922 |
| Subordinated liabilities in OF | 2,937 | 2,964 |
| Other EOF items | -697 | -566 |
| Eligible own funds to meet SCR | 13,007 | 12,321 |
The table above presents the reconciliation of IFRS equity to Solvency II. The main differences between the IFRS equity and EOF Solvency II are:
Adjustment of other equity instruments (the other equity instruments excludes any discretionary interest);
Elimination of intangible assets, such as goodwill, as this is not recognised under Solvency II;
Net revaluation of insurance liabilities due to differences between IFRS 17 and SII, such as the applied yield curve. This is after tax-impact of 25.8%;
Other revaluations for example the revaluation of Financial Institutions;
The addition of subordinated liabilities and other equity instruments (excluding any discretionary interest);
Other EOF items, for example foreseeable dividend and non-available minority interest.
7.9.1 Capital management objectives
Management
a.s.r. is committed to maintain a strong capital position for a.s.r. and the insurance entities to be a robust and sustainable insurer for its policyholders and other stakeholders. The objective is to maintain a solvency ratio well above the minimum levels as defined in the risk appetite statements and above the relevant management threshold levels.
a.s.r. uses limits and targets for capital management of a.s.r. and the insurance entities that are based on the Solvency II requirements. a.s.r. uses the Partial Internal Model to calculate and report the required capital for a.s.r. life, Aegon life, Aegon spaarkas and the Solvency II SF model to calculate and report required capital for the other insurance entities. The capital limits and targets are annually defined in the risk appetite statements and monitored continuously. The priority in defining the capital limits and targets is protecting the financial rights of the policyholders. Secondly, the interest of shareholders is considered. a.s.r. actively manages its in-force business, which is expected to result in free capital generation over time. Additionally, business improvement and balance sheet restructuring should improve the capital generation capacity while advancing the risk profile of the company.
The internal minimum solvency ratio for a.s.r as formulated in the risk appetite statements is 120%. The lower limit solvency target is 140%. The management threshold level for the solvency ratio is above 160%. The solvency ratio stood at 218% on 31 December 2025 (2024: 198%), which is comfortably above the internal requirement of 120% and the management threshold level of 160%. If and when a.s.r. operates above 175% for a prolonged period and a.s.r. cannot invest this capital in value-creating opportunities, a.s.r. may return capital to shareholders. If a.s.r. elects to return capital, it intends to do so in the form that is most efficient for shareholders at that specific point in time, such as additional dividends or share buybacks.
The legal entities are individually capitalised and surplus capital is in principle held at the level of the OTSO's. a.s.r. aims to maintain the surplus capital above the management thresholds at the insurance entities for the creation of return and capital generation. Dividend upstream from the OTSO's covers external dividends, coupon payments on hybrids/senior financing instruments, holding costs and strategic investments. In 2025, € 700 million dividend was distributed from a.s.r. and € 230 million own shares have been bought back (2024: € 654 million dividends and € 100 million share buy-backs).
To support its ability to pay out the proposed dividend, a.s.r. seeks to maintain a liquidity buffer at the holding company at year-end that is at least equal to or in excess of the dividends paid out in the previous year plus the regular holding costs and interest payments for the one-year period. The holding liquidity buffer may include next to bank accounts and liquid investments the unrestricted part of the committed Revolving Facility available to the Holding, subject to a cap of 25% of the total year-end holding liquidity. In addition, a.s.r. aims to ensure that the liquidity buffer during the year is sufficient to cover regular holding costs and interest payments for at least one year.
The graph shows how the eligible own funds of a.s.r. relate to the different capital targets.
Market value own funds under SCR
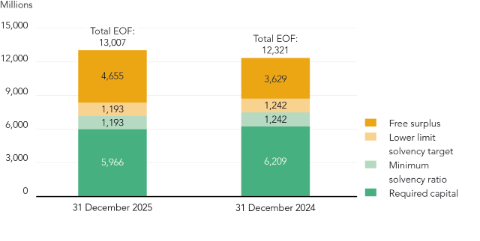
7.9.2 Solvency ratio and a.s.r. ratings
The required capital stood at € 5,966 million per 31 December 2025 (2024: € 6,209 million). The required capital (before diversification) consists for 2025 € 5,436 million out of market risk and the insurance risk amounted to € 4,492 million.
a.s.r.'s Solvency II ratio, including financial institutions, complied during 2025 with the applicable externally imposed capital requirement. The contribution to the Solvency II Group solvency of the financial institutions in the group are calculated in accordance with the relevant sectoral capital requirements for these financial institutions.
The table presents the solvency ratio at group level as at the date indicated.
Eligible own funds to meet the SCR
| 31 December 2025 | 31 December 2024 | |
|---|---|---|
| Eligible Own Funds Solvency II | 12,618 | 11,968 |
| Required capital | 5,743 | 6,006 |
| Solvency II ratio excluding Financial Institutions | 220% | 199% |
| Eligible Own Funds Solvency II | 13,007 | 12,321 |
| Required capital | 5,966 | 6,209 |
| Solvency II ratio including Financial Institutions | 218% | 198% |
The Solvency II ratio stood at 220% (excluding financial institutions) at 31 December 2025 (2024: 199%). The Solvency II ratio including financial institutions stood at 218% as at 31 December 2025 (2024: 198%). The Solvency II ratios presented are not final until filed with the regulators.
Under Solvency II it is permitted to reduce the required capital with the mitigating tax effects resulting from a 1-in-200-year loss (Shock loss). There is a mitigating tax effect to the extent that the Shock loss (BSCR + Operational risk) is deductible for tax purposes and can be compensated with taxable profits. This positive tax effect can only be taken into account when sufficiently substantiated (‘more likely than not’). a.s.r. included a beneficial effect on its solvency ratio(s) due to the application of the LAC DT. The LAC DT benefit was € 1,611 million at year-end 2025 (2024: € 1,541 million).
Furthermore, the a.s.r. SCR includes LAC TP which is the part of the technical provisions that can be used to absorb some of the SCR shock losses, as the expected future profit sharing to policyholders will be reduced if actual losses would arise. LAC TP amounted to € 109 million at year-end 2025 (2024: € 165 million).
On 8 January 2025, the amendments to the Solvency II Directive were published in the Official Journal of the European Union. The changes contained in the amended Directive must be incorporated into national legislation by 29 January 2027 and will become applicable to insurers as of 30 January 2027. These amendments to the Solvency II Directive also require updates to the Solvency II Delegated Regulation and to other Solvency II delegated acts (technical and implementing standards). The Solvency II Delegated Regulation was amended and is published in the Official Journal of the European Union on 18 February 2026. Revised technical and implementing standards and EIOPA guidelines, as well as new standards and guidelines will become applicable by the same date (as of 30 January 2027).
The amendments introduce various changes to the Solvency II framework, most notably affecting the liability discount curve, the risk margin, the Volatility Adjustment (VA), the Dynamic Volatility Adjustment (DVA), and the long‑term impact of the climate‑change transition plan on Solvency II requirements.
In addition to the revisions to the Solvency II Directive, on 8 January 2025, the Insurance Recovery and Resolution Directive (IRRD) was published, which provides a recovery and resolution framework for insurance companies at European level. This framework must be implemented by EU Member States in national legislation and will become applicable by the same dates as the Solvency II amendments. The IRRD is – to a large extent - comparable to the local Insurance Recovery and Resolution framework currently in force in the Netherlands.
Standard & Poor’s (S&P) upgraded the ratings for a.s.r., its life and non-life insurance entities on 12 September 2025, due to a.s.r.’s strong financial risk profile, solid capital position, and robust business risk profile.
The outlook on all ratings is stable.
Ratings per legal entity
| Ratings Standard & Poor's | Type | Rating | Outlook | Rating & outlook since |
|---|---|---|---|---|
| ASR Nederland N.V. | ICR | A- | Stable | 12 September 2025 |
| ASR Levensverzekering N.V. | IFSR | A+ | Stable | 12 September 2025 |
| ASR Levensverzekering N.V. | ICR | A+ | Stable | 12 September 2025 |
| ASR Schadeverzekering N.V. | IFSR | A+ | Stable | 12 September 2025 |
| ASR Schadeverzekering N.V. | ICR | A+ | Stable | 12 September 2025 |
| AEGON Levensverzekering N.V. | IFSR | A+ | Stable | 12 September 2025 |
| AEGON Levensverzekering N.V. | ICR | A+ | Stable | 12 September 2025 |
ICR: Issuer Credit Rating
IFSR: Insurer Financial Strength Rating
Rating reports can be found on the corporate website: www.asrnl.com.
7.9.3 Additional information
1. Capital Market transactions
In the first quarter of 2025, a.s.r. successfully issued € 500 million in Subordinated Restricted Tier 1 securities, carrying a fixed coupon of 6.5% per annum until the first reset date in 2035. The net proceeds from this issue were mainly used to repurchase € 500 million of the a.s.r. 5.125% Tier 2 notes.
2. Share buyback programme
At the beginning of 2025, a.s.r. announced its share buyback program of € 125 million. This was completed in May 2025. In total, 2,403,923 shares of a.s.r. have been repurchased at an average price of € 52.00 per share.
In June 2025, a.s.r. repurchased 300 thousand shares under an open market share buyback programme of € 8 million (average share price was € 55.14). This was part of the employee share purchase plans. The repurchase was completed in July 2025.
In the third quarter of 2025, a.s.r. repurchased 1,875,000 shares in the accelerated bookbuild by Aegon Ltd. (Aegon) that took place on 2 September 2025. This represents 15% of the offering. At the offer price of € 56.00 per share the repurchase amounted to a total amount of € 105 million. a.s.r. intends to propose cancelation of the repurchased shares at the next Annual General Meeting (AGM).
3. Dividend
a.s.r. has proposed a total dividend of € 3.41 per share over the full year 2025 (2024: € 3.12 per share). Taking into account the interim dividend of € 1.27 per share, the final dividend amounts to €
7.10 Operating result
a.s.r. manages its business primarily using operational key performance indicators (KPIs). The operating result is the KPI covering the overall profitability of the business. Furthermore, a.s.r. uses other operational measures such as the Non-Life ratio, the life operating expenses as well as the availability and creation of capital, based on the Solvency II PIM, as key figures in business decision making (see section 7.9).
The operating result is managed and presented at the consolidated a.s.r. and at a segment level (see section 7.4.3) and is also a key profitability indicator at business line level. The operating result is an inclusive measure covering all result components that can be influenced by the regular business. As such the operating result is the single bottom line performance indicator covering the performance of the business.
Operating result as presented below is an Alternative Performance Measure (non-GAAP financial measure) and is not a measure of financial performance under IFRS. Because it is not determined in accordance with IFRS, operating result as presented by a.s.r. may not be comparable to other similarly titled measures of performance of other companies.
In 2024, a.s.r. made amendments to the operating result with an impact of € 66 million.
Additional information on these amendments is presented in the subsequent sections in this paragraph.
Definition of operating result
Operating result is calculated by using the result before tax from continuing operations reported in accordance with IFRS, adjusted for the following:
1. Adjustments to the insurance service result:
The impact of changes to future services on onerous contracts;
The impact of changes of inflation on the liability for incurred claims;
The amortisation of pre recognition interest rate hedged developments prior to initial CSM recognition. When a.s.r. explicitly hedges pre-recognition interest movements to protect the profitability of new business Level of Aggregation (LoA), the valuation of this interest rate hedge as per date of initial recognition CSM will be added to CSM of this new business LoA. Consequently, the interest hedge will be amortised over the remaining period of the LoA, equal to the period of release of the CSM of the respective LoA.
2. Adjustments to the investment and finance result: investment and finance result, excluding general investment operating expenses, is replaced by an Operating Investment and Finance Result (which is part of the Operating Result) and is defined as the expected return on the investments in excess of the expected interest accrual on the insurance liabilities, the directly attributable investment operating expenses, all hybrid expenses (including hybrid expenses through OCI) and the UFR drag for each reporting period.
The operating result should reflect the operational performance of a.s.r. and should exclude revaluation effects on the assets and (insurance related) liabilities as a result of interest and spread movements and/or equity and real estate market movements.
If a.s.r. is to value the present value of future cash flows, it is common market practice to make use of a forward curve (based on the current discount curve) plus a certain premium reflecting the risk of invested assets. This premium is defined as the implied spread at the beginning of the period over which the result is calculated.
The expected return is calculated as:
For the fixed income investments: the market value of the fixed income assets at the beginning of the period multiplied by the total of the one-year forward swap rate and the implied spread at the beginning of the period;
For equities and real estate investments: the market value of the equity and real estate assets at the beginning of the period multiplied by a total return assumption;
For Insurance related liabilities: the market value of the insurance related liabilities at the beginning of the period multiplied by the one-year forward rate of the IFRS17 curve (i.e. including the Liability Illiquidity Premium and Credit Risk Adjustment);
The other assets / liabilities at the beginning of the period multiplied by the one-year forward curve.
The implied spread per fixed income asset category is defined as the required increase above the swap curve to determine the current market value. The implied spreads are calculated quarterly. a.s.r. has defined five fixed income asset categories that each have an implied spread.
The balance sheet at the beginning of the period is based on a.s.r.’s look-through principle, i.e. all assets in the same asset category have a similar risk-profile (e.g. fixed income funds are classified as fixed income and not as equities, real estate funds are classified as real estate, etc.).
For real estate and equity investments, a.s.r. applies a total return assumption of 5.5% and 6.6% (pre-tax) respectively. This assumption is evaluated each year.
3. Other adjustments and incidental items:
Model- and methodological changes of a fundamental nature, in the measurement of the insurance liabilities;
Results of non-core operations;
Non-recurring or one-off items related to the ongoing business;
Non-recurring or one-off items not related to the ongoing business, such as (non-exhaustive) restructuring costs, regulatory costs not related to business activities, changes in own pension arrangements and expenses related to mergers and acquisitions (M&A) activities and start-ups.
The treatment of intercompany transactions and eliminations between group companies has been split into continued and discontinued operations. In cases where the a.s.r. group continues to provide services to a discontinued operation subsequent to the disposal, the elimination of intragroup transactions between the continuing operations and the discontinued operation before the disposal will be treated in a way that reflects the continuance of these transactions, and as such impacts the operating result. This could have an impact on insurance service result, investment and finance result and other adjustments and incidental items.
The RoE, which is based on the operating result, is defined as:
The operating result adjusted for the applicable tax divided by
The IFRS equity adjusted for the unrealised capital gains reserve that may be reclassified subsequently to profit or loss and equity components of discontinued operations and non-core activities.
Historical comparison
a.s.r. introduced the operating result in 2015 prior to the IPO. The operating result has since been the KPI for managing the profitability of the business.
IFRS result before tax versus operating result
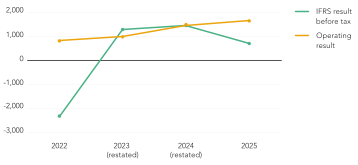
The four-year comparison of the IFRS result before tax and the operating result shows that, as expected, the IFRS results show more volatility than the operating result. In 2022 this was mainly driven by sharply rising interest rates resulting in significant revaluations. In 2025 this was also the case but to a lesser extent. Operating result is less sensitive to financial market developments, as, amongst others, the Operating Investment and Finance Result is based on a standard return.
In 2023, IFRS result exceeded operating result mainly due to the downward adjustment of investment and finance result to the normalised operating investment and finance result. In 2025 the adjustment to the investment and finance result was the main cause of the upward adjustment to the operating result (see below). The 2023 results have been restated due to the sale of Knab, the 2024 results have been restated due to the accounting policy change related to Individual disability policies, see section 7.3.2.1.
Reconciliation of IFRS result for the year to operating result
The reconciliation of the IFRS result for the year to the operating result is presented as follows:
IFRS result to operating result
| 2025 | 2024 (restated) | |
|---|---|---|
| Result before tax | 696 | 1,464 |
| Minus adjustments related to the insurance service result | -34 | -14 |
| Minus adjustments related to the investment and finance result | -762 | 173 |
| Minus adjustments related to the other result | -146 | -158 |
| Operating result | 1,637 | 1,463 |
In 2025, adjustments related to the insurance service result (€ -34 million) consist mainly of the amortisation of pre-recognition interest rate hedged developments prior to the initial CSM recognition (€ -16 million) and the non-economic assumption update for inflation in the liability for incurred claims of Disability (€ -9 million), a charge related to interest accretion on provisions for undercoverage of separate accounts (€ -8 million) and expenses for regulatory pension reform (€ -6 million).These were partly offset by changes to future services on onerous contracts (€ 11 million of which € -46 million in Non-life and € 57 million in Life), mainly due to updates of assumptions on disability, mortality and surrender).
Adjustments related to the investment and finance result (€ -762 million) were mostly driven by revaluations with a negative P&L impact due to increasing interest rates and a steepening of the curve, partly offset by positive real estate revaluations.
Adjustments related to the other result (€ -146 million) consist of costs for integration of the Aegon NL business lines (€ -88 million) charged to the Holding, project costs for the regulatory pension reform and CSRD, project costs for the implementation of the PIM of a.s.r. life, amortisations of intangible assets recognised in earlier acquisitions (€ -71 million)and a derecognition gain on the earlier 45% share in HumanTotalCare and on the sale of some participations in Distribution and Services (€ 35 million).
The operating result of 2024 was adjusted by € 35 million to € 1,463 million following the change in accounting policy for the measurement of the liability for remaining coverage and incurred claims for Individual disability contracts, see section 7.3.2.1.
In 2024, adjustments related to the insurance service result (€ -14 million) mainly consist of the non-economic assumption update for inflation in the liability of incurred claims of Disability (€ -25 million) and the amortisation of pre-recognition interest rate hedged developments prior to the initial CSM recognition (€ -18 million). These were partly offset by changes to future services on onerous contracts (€ 39 million, mostly reflecting synergies in expense provisioning).
Adjustments related to the investment and finance result (€ 173 million) were mainly related to revaluations due to market developments to arrive at normalised investment returns in the operating result.
Adjustments related to the other result of € -158 million mainly consist of the following items:
the cost of integration of Aegon NL (€ - 83 million)
restructuring provision expenses (€ - 27 million);
amortisation of other intangible assets identified in business combinations (€ - 42 million).
7.11 Company financial statements
7.11.1 Company balance sheet
Company balance sheet
| (in € millions and before profit appropriation) | Note | 31 December 2025 | 31 December 2024 (restated) |
|---|---|---|---|
| Non-current assets | |||
| Intangible assets | 7.11.3.4 | 250 | 295 |
| Property, plant and equipment | 7.11.3.5 | 221 | 230 |
| Financial fixed assets | |||
| - Subsidiaries | 7.11.3.6 | 10,767 | 10,714 |
| - Loans to group companies | 7.11.3.7 | 47 | 123 |
| - Investments | 7.11.3.8 | 151 | 252 |
| Total financial fixed assets | 10,966 | 11,090 | |
| Total non-current assets | 11,437 | 11,615 | |
| Current assets | |||
| Other receivables | 7.11.3.10 | 5,793 | 6,391 |
| Cash and cash equivalents | 7.11.3.11 | 674 | 715 |
| Total current assets | 6,467 | 7,106 | |
| Total assets | 17,904 | 18,721 | |
| Equity | |||
| Share capital | 7.11.3.12 | 33 | 34 |
| Share premium reserve | 7.11.3.12 | 4,028 | 4,070 |
| Actuarial gains and losses | 7.11.3.12 | -38 | -175 |
| Legal reserves | 7.11.3.12 | 1,697 | 857 |
| Retained earnings | 7.11.3.12 | 2,599 | 3,335 |
| Net result for the year | 549 | 958 | |
| Less: interim dividend | -262 | -245 | |
| Unappropriated result | 7.11.3.12 | 286 | 713 |
| Equity attributable to shareholders | 8,605 | 8,834 | |
| Other equity instruments | 7.11.3.12 | 1,507 | 1,007 |
| Equity attributable to holders of equity instruments | 10,111 | 9,841 | |
| Provisions | |||
| Employee benefits | 7.11.3.13 | 4,810 | 5,036 |
| Other provisions | 7.11.3.14 | 57 | 79 |
| Total provisions | 4,866 | 5,115 | |
| Long-term liabilities | |||
| Subordinated liabilities | 7.11.3.15 | 1,503 | 2,007 |
| Borrowings | 7.11.3.16 | 827 | 826 |
| Debts to group companies | 7.11.3.17 | 177 | 208 |
| Deferred tax liabilities | 7.11.3.9 | 304 | 430 |
| Total long-term liabilities | 2,810 | 3,470 | |
| Current liabilities | |||
| Other liabilities | 7.11.3.18 | 116 | 295 |
| Total current liabilities | 116 | 295 | |
| Total equity and liabilities | 17,904 | 18,721 |
The numbers following the line items refer to the relevant sections in the notes to the company financial statements.
7.11.2 Company income statement
Company income statement
| (in € millions) | Note | 2025 | 2024 (restated) |
|---|---|---|---|
| Operating expenses | 7.11.3.19 | -308 | -279 |
| Other expenses | -3 | -1 | |
| Other income | - | 1 | |
| Income from subsidiaries and investments | |||
| Share of result in subsidiaries | 1,150 | 1,414 | |
| Investment income | 7.11.3.20 | 25 | 225 |
| Fair value gains and losses | 4 | 10 | |
| Interest expenses | 7.11.3.21 | -551 | -255 |
| Result before tax | 317 | 1,117 | |
| Income tax (expense) / gain | 232 | 81 | |
| Result after tax from continuing operations | 549 | 1,198 | |
| Discontinued operations | |||
| Result after tax from discontinued operations | - | -240 | |
| Net result | 549 | 958 |
The share of result in subsidiaries is presented net of tax. Therefore the income tax gains are to be compared with the result before tax excluding share of result in subsidiaries. For a consolidated analysis of the effective tax rate, see section 7.6.12.
7.11.3 Notes to the company financial statements
7.11.3.1 Changes in comparative figures
The impact of these changes on a.s.r.’s result before tax and shareholders returns is summarised in section 7.3.2.
7.11.3.2 Accounting policies
The company financial statements are prepared in accordance with Title 9, Book 2 of the Dutch Civil Code. The consolidated financial statements of a.s.r. for 2025 have been prepared in accordance with IFRS – including the IAS and Interpretations – as accepted within the EU and with part 9 of the book of the Dutch Civil Code. In accordance with Section 362(8), Book 2 of the Dutch Civil Code, the same accounting policies for the recognition and measurement of assets and liabilities and determination of results applied to the company financial statements are applied to the consolidated financial statements.
Investments in subsidiaries are recognised, using the equity method, in accordance with the accounting policies used in a.s.r.’s consolidated financial statements whereby the goodwill, if any, is presented separately. The share of result of subsidiaries is reported in conformity with the accounting policies used in a.s.r.’s consolidated financial statements.
Lease contracts are disclosed using IFRS 16 based on the option under RJ 292.1.
Unless stated otherwise, all amounts presented in these financial statements are in millions of €. Calculations in the tables are made using unrounded figures. As a result rounding differences can occur.
7.11.3.3 Acquisitions and legal mergers
In 2024 and 2025, there were no acquisitions and legal mergers for ASR Nederland N.V.
7.11.3.4 Intangible assets
Intangible assets
| 2025 | 2024 | |
|---|---|---|
| Goodwill | 17 | 17 |
| Other intangible assets | 233 | 277 |
| Total intangible assets | 250 | 295 |
Changes in intangible assets
| Goodwill | Other intangible assets | Total 2025 | Total 2024 | |
|---|---|---|---|---|
| Cost price | 17 | 363 | 381 | 347 |
| Accumulated amortisation and impairments | - | -131 | -131 | -52 |
| At 31 December | 17 | 233 | 250 | 295 |
| At 1 January | 17 | 277 | 295 | 31 |
| Amortisation and impairments | - | -73 | -73 | -27 |
| Transfer | - | 29 | 29 | 290 |
| At 31 December | 17 | 233 | 250 | 295 |
No impairments were deemed necessary.
Intangibles assets mainly relates to the intangible assets acquired through the acquisition of Aegon NL in 2023 and relates mainly to customer relationships, trade names and software. Intangible assets are amortised straight-line over their useful life, which is determined individually (between 5 and 20 years).
7.11.3.5 Property and equipment
Property and equipment
| 2025 | 2024 | |
|---|---|---|
| Right-of-use assets: | ||
| Land and buildings owned by subsidiary | 207 | 210 |
| Vehicles | 7 | 6 |
| Other | 6 | 15 |
| Total property and equipment | 221 | 230 |
The right-of-use assets includes property and equipment that is leased by a.s.r. Land and buildings owned by subsidiary relates mainly to the a.s.r. head office, which is owned by a.s.r. life.
Changes in property and equipment
| 2025 | 2024 | |
|---|---|---|
| At 1 January | 230 | 256 |
| Additions | 7 | 1 |
| Depreciation | -14 | -20 |
| Impairments | -3 | -3 |
| Changes in the composition of the group | - | -4 |
| At 31 December | 221 | 230 |
| Gross carrying amount as at 31 December | 302 | 364 |
| Accumulated depreciation as at 31 December | -81 | -131 |
| Accumulated impairments as at 31 December | - | -3 |
| Net carrying value as at 31 December | 221 | 230 |
Depreciation of property and equipment is recorded in the operating expenses (see section 7.11.3.20).
7.11.3.6 Subsidiaries
Subsidiaries
| 2025 | 2024 | |
|---|---|---|
| At 1 January | 10,714 | 11,520 |
| Additions | 45 | 10 |
| Share of result | 1,150 | 1,414 |
| Dividend received | -1,249 | -1,587 |
| Revaluations | 121 | 198 |
| Other changes | -88 | 13 |
| Changes in the composition of the group | 73 | -854 |
| At 31 December | 10,767 | 10,714 |
In 2025, other changes relates to the derecognition the previously held 45% interest in HumanTouch Holding following the acquisition of the remaining 55% interest in HumanTouch Holding, which was acquired by a.s.r. Deelnemingen N.V., whereas the minority share was held by ASR Nederland N.V. For further information, see section 7.4.5.
In 2024 the changes in the composition of the group relate to Knab.
7.11.3.7 Loans to group companies
Loans to group companies
| 2025 | 2024 | |
|---|---|---|
| At 1 January | 124 | 378 |
| Issues | 8 | 30 |
| Repayments | -82 | -285 |
| Revaluations | 1 | 1 |
| Accrued interest | -3 | -1 |
| At 31 December | 47 | 124 |
The loans to group companies with a principal amount of € 47 million (2024: € 121 million) are expected to be settled more than one year after the balance sheet date and have an average interest rate of 5,56% (2024: 6.15%). Interest income on loans to group companies amounts to € 2 million (2024: € 6 million). The repayments in 2025 relate to subordinated loans to ASR Basis Ziektekostenverzekeringen N.V. The repayment in 2024 relates to Knab.
7.11.3.8 Investments
In 2025 and 2024 excess cash is invested in corporate bonds.
7.11.3.9 Deferred tax liabilities
The deferred tax liabilities mainly arises from the difference in commercial and fiscal valuation of employee benefits (including the assets resulting from the insurance contracts, which are administrated by a.s.r. life and Aegon life) amounting to € 247 million (2024: € 252 million). The other deferred tax consists of intangible fixed assets, investment property and technical provision valuations to market value.
7.11.3.10 Other receivables
The other receivables include receivables from subsidiaries, which include the receivable (reimbursement right) with respect to insurance contracts for the pension plan of a.s.r. administered by a.s.r. life and Aegon life amounting to € 5,697 million (2024: € 6,133 million). The value is equal to the value of the related insurance contracts administered by a.s.r. life and Aegon life, which are both eliminated in the consolidated financial statements. The other receivables amounting to € 5,793 million (2024: € 6,391 million) are classified as current. The remaining portion of the receivables from subsidiaries is payable on demand.
7.11.3.11 Cash and cash equivalents
Cash and cash equivalents are fully and freely available.
7.11.3.12 Equity
Statement of changes in equity
Share capital | Share premium reserve | Actuarial gains and losses | Legal reserves | Retained earnings | Unappropriated result | Other equity instruments | Equity | |
|---|---|---|---|---|---|---|---|---|
| At 1 January 2025 | 34 | 4,070 | -175 | 857 | 3,335 | 713 | 1,007 | 9,840 |
| Appropriation of the result previous year | - | - | - | - | 713 | -713 | - | - |
| Net result for the year | - | - | - | - | 549 | - | 549 | |
| Dividend paid | - | - | - | - | -405 | -262 | - | -667 |
| Remeasurement of post-employment benefit obligation | - | - | 137 | - | - | - | - | 137 |
| Unrealised change in value | - | - | - | 121 | -30 | - | - | 91 |
| Change in reserves required by law | - | - | 718 | -718 | - | - | - | |
| Discretionary interest on other equity instruments | - | - | - | - | -73 | - | - | -73 |
| Issue of other equity instruments | - | - | - | - | - | - | 500 | 500 |
| Cost of issue of other equity instruments | - | - | - | - | -3 | - | - | -3 |
| Treasury shares acquired (-) / sold | - | - | - | - | -236 | - | - | -236 |
| Increase (decrease) in capital | - | -43 | - | - | 43 | - | - | - |
| Other movements | - | - | - | - | -26 | - | - | -26 |
| At 31 December 2025 | 33 | 4,028 | -38 | 1,697 | 2,599 | 286 | 1,507 | 10,111 |
Share capital | Share premium reserve | Actuarial gains and losses | Legal reserves | Retained earnings | Unappropriated result | Other equity instruments | Equity | |
|---|---|---|---|---|---|---|---|---|
| At 1 January 2024 | 34 | 4,070 | -288 | 842 | 2,865 | 858 | 1,004 | 9,385 |
| Appropriation of the result previous year | - | - | - | - | 858 | -858 | - | - |
| Net result for the year | - | - | - | - | 958 | - | 958 | |
| Dividend paid | - | - | - | - | -382 | -245 | - | -627 |
| Remeasurement of post-employment benefit obligation | - | - | 113 | - | - | - | 113 | |
| Unrealised change in value | - | - | - | 198 | -35 | - | - | 163 |
| Change in reserves required by law | - | - | - | -183 | 183 | - | - | - |
| Discretionary interest on other equity instruments | - | - | - | - | -63 | - | - | -63 |
| Issue of other equity instruments | - | - | - | - | - | - | 500 | 500 |
| Redemptions of other equity instruments | - | - | - | - | - | - | -502 | -502 |
| Cost of issue of other equity instruments | - | - | - | - | -5 | - | - | -5 |
| Treasury shares acquired (-) / sold | - | - | - | - | -103 | - | - | -103 |
| Increase (decrease) in capital | - | - | - | - | - | - | - | - |
| Other movements | - | - | - | - | 17 | - | 5 | 22 |
| At 31 December 2024 | 34 | 4,070 | -175 | 857 | 3,335 | 713 | 1,007 | 9,840 |
Share capital
For a breakdown of the share capital, see section 7.5.11.1.
Legal reserves
The legal reserves relate mainly to the revaluation of investments in group companies. The legal reserves are maintained in relation to the (not yet received as dividend) share in the result (and other additions to equity) of group companies accounted for using the equity method since initial recognition reduced with the amount of dividend that a.s.r. is able to distribute without restrictions. The legal reserves are not freely distributable. See section 7.9 for more information on the regulatory restrictions.
In 2025, a.s.r. refined the methodology used to determine the legal revaluation reserve for investment property and illiquid FVTPL investments. This refinement is applied prospectively. The refinement affects the holding’s legal reserves through the participating‑interest reserve (wettelijke reserve deelnemingen), as the legal‑reserve requirements of subsidiaries roll up to the holding. The resulting movement is presented within ‘Change in reserve required by law’ in the statement of changes in equity.
Treasury shares
Treasury shares are part of the retained earnings. For more information on treasury shares, see section 7.5.11.5.
Other equity instruments
The other equity instruments relate to three different hybrid Tier 1 instruments (2024: two different hybrid Tier 1 instruments) classified as equity. See section 7.5.11.6 for more information.
Freely distributable items
The part of equity attributable to shareholders (equity, excluding other equity interest) that is available for dividend distributions is limited by the Dutch Civil Code and the Dutch Supervisory Rules and Regulations (Solvency II requirements). The distribution of capital is restricted in accordance with the Dutch Civil Code for share capital and statutory reserves. The Solvency II requirements stipulate that a.s.r. must maintain a minimum amount of capital.
The freely distributable reserves is based on the lowest outcome of the restrictions from the Dutch Civil Code and the Solvency II requirements. This is further explained in the table below:
Distributable items
| 2025 | 2024 | |
|---|---|---|
| Equity attributable to shareholders | 8,605 | 8,779 |
| Non distributable items | ||
| - Share capital1 | 33 | 34 |
| - Legal reserves | 1,697 | 857 |
| Distributable items based on the Dutch Civil Code | 6,874 | 7,888 |
| Reserves available for financial supervision purposes | 13,007 | 12,321 |
| Solvency II requirement under the Financial Supervision Act | 5,966 | 6,209 |
| Distributable items based on the Solvency II requirements | 7,041 | 6,112 |
| Freely distributable items (lower of the values above) | 6,874 | 6,112 |
- Less the nominal value of treasury shares if applicable
For more information on Solvency II capital management objectives see section 7.9.1.
7.11.3.13 Employee benefits
Employee benefits can be broken down as follows (see section 7.5.15 for further details):
Employee benefits
| 2025 | 2024 | |
|---|---|---|
| Post-employment benefits pensions | 4,750 | 4,974 |
| Post-employment benefits other than pensions | 30 | 35 |
| Post-employment benefit obligation | 4,780 | 5,010 |
| Other long-term employee benefits | 30 | 27 |
| Total | 4,810 | 5,036 |
Employee benefits amounting to € 221 million (2024: € 214 million) will be settled within 12 months after year-end.
7.11.3.14 Other provisions
Changes in provisions
| 2025 | 2024 | |
|---|---|---|
| At 1 January | 79 | 84 |
| Additional provisions | 17 | 28 |
| Reversal of unused amounts | -8 | -1 |
| Utilised in course of year | -31 | -32 |
| At 31 December | 57 | 79 |
Provisions primarily relate to provisions for employee restructuring and retained disability risk. See section 7.5.16 for more information.
The timing of the outflow of resources related to these provisions is uncertain because of the unpredictability of the outcome and time required for the settlement of disputes.
An amount of € 42 million (2024: € 52 million) of the provisions is expected to be settled within twelve months after the balance sheet date.
7.11.3.15 Subordinated liabilities
For information regarding the subordinated liabilities see section 7.5.12.
7.11.3.16 Borrowings
Borrowings
| 2025 | 2024 | |
|---|---|---|
| Loans | 598 | 597 |
| Lease liabilities | 228 | 229 |
| Total borrowings | 827 | 826 |
The loans relate to the issue of the green senior bond under the a.s.r. Green Finance Framework of € 600 million in 2023. The bond has a maturity of five years with a fixed rate coupon of 3.625%.
The lease liabilities consist primarily € 217 million (2024: € 215 million) of the lease of the a.s.r. head office from a.s.r. life. The interest rate for the lease of the head office is 1.5% (2024: 1.5%). The maturity of this contract is 30 years, which includes the total of five extension options of five years each.
An amount of € 8 million (2024: € 15 million) of the lease liabilities is expected to be settled within twelve months after the balance sheet date.
7.11.3.17 Debts to group companies
Debts to group companies with a principal amount of € 175 million (2024: € 205 million) have an average interest rate of 3.53% in 2025 (2024: 3.86%). The maturity of the loans varies from one till two years. An amount of € 130 million of the debt to group companies is expected to be settled within one year after the balance sheet date.
There is no significant difference between the carrying amount of the debt to group companies and the fair value of these liabilities. No securities or guarantees have been agreed and no collateral is posted.
7.11.3.18 Other liabilities
Other liabilities
| 2025 | 2024 | |
|---|---|---|
| Short-term employee benefits | 24 | 27 |
| Trade payables | 14 | 24 |
| Other liabilities | 78 | 243 |
| Total other liabilities | 116 | 295 |
The carrying amount of other liabilities is a good approximation of their fair value.
An amount of € 92 million (2024: € 110 million) is expected to be settled within twelve months after the balance sheet date.
Other liabilities decreased by € 165 million due to reclassification of intercompany positions to Other receivables.
7.11.3.19 Operating expenses
The operating expenses of € 308 million (2024: € 279 million) are operating expenses relating to holding activities. See section 7.6.11 for the total operating expenses of the Group. Operating expenses also include depreciation of the right-of-use assets owned by group companies of € 13 million (2024: € 16 million).
The average number of employees working for a.s.r. is 5,949 (2024: 7,684), all working in the Netherlands. ASR Nederland B.V. allocates expenses to group companies according to the extent to which the expenses incurred can be related to the activities of the group company. This allocation is reassessed each year.
7.11.3.20 Investment income
The investment income of € 25 million (2024: € 225 million) mainly decreased as a result of an decrease in the interest income relating to the employee benefits obligation allocated to the holding, which is part of expenses for the year ended 2025.
7.11.3.21 Interest expense
The interest expense relates primarily to the interest on subordinated liabilities, interest owed to credit institutions, interest on the lease liabilities and to the interest relating to the employee benefits obligation allocated to the holding.
Interest expenses related to loans and lease liabilities with group companies amount to € 10 million (2024: € 12 million).
7.11.3.22 Related party transactions
A related party is a person or entity that has significant influence over another entity, or has the ability to affect the financial and operating policies of the other party. Parties related to the company a.s.r. include subsidiaries, members of the EB and MB, members of the SB, close family members of any person referred to above, entities controlled or significantly influenced by any person referred to above and any other affiliated entity.
a.s.r. enters into transactions with related parties during the conduct of its business. These transactions mainly involve loans, debts, deposits and commissions, and are conducted on terms equivalent to those that prevail in arm’s length transactions.
Related party transactions in relation to members of the EB, MB and SB are mentioned in section 7.7.4 of the consolidated financial statements. In this chapter are also the related party transactions in relation to Aegon Ltd. and its group companies (since Aegon Ltd. has significant influence over a.s.r.) mentioned.
The remuneration of the EB and SB members of a.s.r. is disclosed in section 7.7.5 of the consolidated financial statements.
The loans (including interest income) and debts to group companies are described in 7.11.3.7 respectively 7.11.3.17 of the company financial statements.
The post-employment benefit plan of a.s.r. is administered by a.s.r. life and Aegon life. For information regarding to this plan reference is made to section 7.11.3.10 of this company financial statements.
7.11.3.23 Contingent liabilities
Joint and several liability
ASR Nederland N.V. forms a fiscal unity for corporate income tax and VAT with nearly all of its subsidiaries. The company and its subsidiaries that form part of the fiscal unity are jointly and separately liable for taxation payable by the fiscal entity.
A statement of joint and several liability under section 403, Book 2 of the Dutch Civil Code has been issued by a.s.r. for the companies identified in section 7.7.9.
Utrecht, 24 March 2026
Executive Board
Jos Baeten
Ewout Hollegien
Ingrid de Swart
Supervisory Board
Joop Wijn
Bob Elfring
Sonja Barendregt
Gisella Eikelenboom
Gerard van Olphen
Daniëlle Jansen Heijtmajer
Lard Friese

8 Additional information
8.1 About this report
Scope
In this integrated Annual Report, a.s.r. provides a transparent overview of its activities and results for the reporting year starting at 1 January 2025 and lasting up to and including 31 December 2025. The financial information in this Annual Report has been consolidated for a.s.r. and all its group entities. All qualitative information relates to a.s.r. as a whole, unless a specific business line is explicitly mentioned. All non-financial quantitative information for 2025 includes a.s.r. and its group entities, unless stated otherwise. The full list of principal group companies and associates can be found in section 7.4.1.
Standards
The consolidated financial statements of a.s.r. have been prepared in accordance with IFRS – including the IAS and Interpretations – as adopted by the EU, and with the financial reporting requirements included in Title 9, Book 2 of the Dutch Civil Code, where applicable. Pursuant to the options offered by Section 362, Book 2 of the Dutch Civil Code, a.s.r. has prepared its company financial statements in accordance with the same principles as those used for the consolidated financial statements. All amounts quoted in these financial statements are in euros and rounded to the nearest million, unless otherwise indicated. Calculations are made using unrounded figures. As a result, rounding differences can occur. The Group Solvency II ratio is based on the Partial Internal Model (PIM), applicable to Aegon life, Aegon spaarkas and, since DNB approval on 9 December 2025, also to a.s.r. life. The other insurance entities continue to calculate their solvency capital requirement using the Solvency II Standard Formula. In addition to the information in this Annual Report, a.s.r. also publishes a separate Solvency and Financial Condition Report.
a.s.r. prepares the management report in accordance with article 2:391 of the Dutch Civil Code and EU Directive 2013/34/EU (EU Accounting Directive), which includes the corporate sustainability reporting requirements, introduced through EU Directive 2022/2464 (CSRD). This report offers an overview of key developments and performance of a.s.r. and shows how a.s.r. deals with key risks, opportunities, and uncertainties. The topics presented are based on a stakeholder dialogue and materiality analysis, conducted with the EB and different a.s.r. stakeholders.
Process
The information in this Annual Report is delivered by various staff functions and business segments. For the preparation of the Annual Report, a steering group (SG) and a review group (RG) have been set up to guide the process and review the content. The SG represents the CEO, the Director Group Finance, Head of Sustainability & Benchmarks and Reporting, and the Director Corporate Communication. The RG is represented by Board Members, directors and relevant key functions. Before gathering information and writing the Annual Report, the SG decided on the structure and key messages of the report. The reporting specialists then translated the outcomes and decisions into draft reports, which were reviewed by a committee of members from the SG and RG. During the reporting process, the review group delivered feedback on the draft Annual Report. The final draft texts of the Annual Report are discussed in the respective meetings of the EB, the A&RC and the SB. Disclosure of the Annual Report is subject to the approval of the EB and the SB.
Audit and assurance of the auditor
The consolidated financial statements 2025 have been audited by a.s.r.’s external auditor, KPMG. KPMG’s audit opinion can be found in section 8.2.1. In addition to the financial results, KPMG performed a review - with a limited level of assurance - of the Sustainability Statements (section 6) in this Annual Report, including the incorporations by reference in other sections. KPMG’s assurance report can be found in section 8.2.2.
8.2 Auditor reports
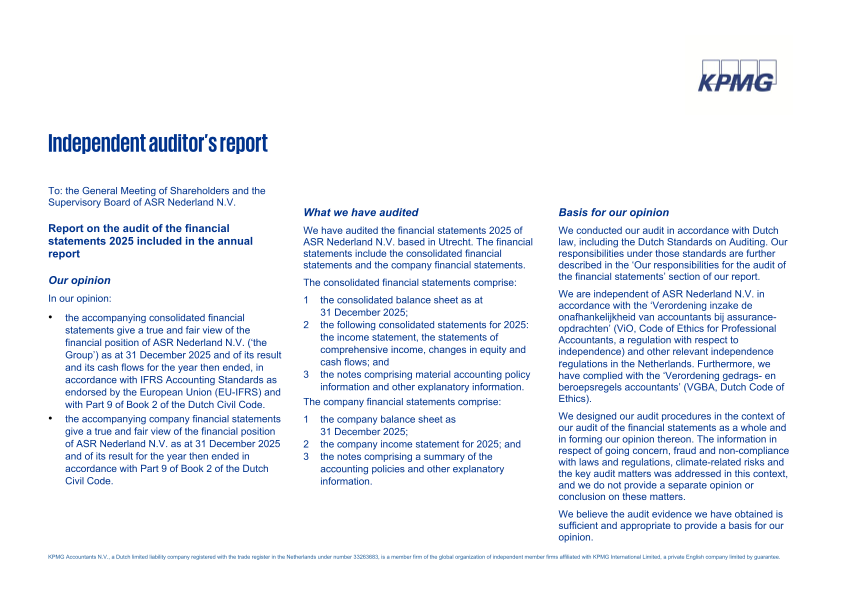
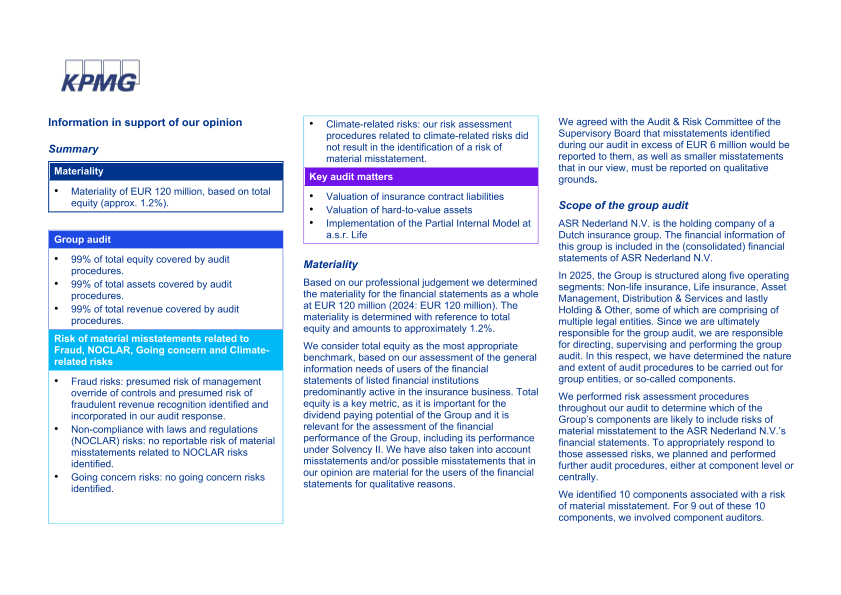
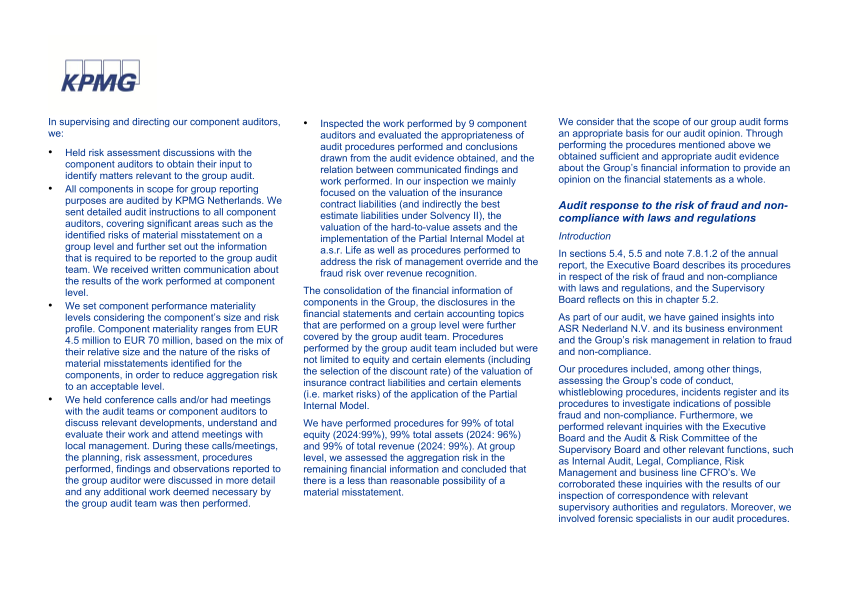

8.3 Sustainable Development Goals
Contribution to the Sustainable Development Goals
| SDG 1: end of poverty in all its form everywhere | a.s.r. is committed to preventing and resolving financial difficulties. Through its Doenkracht programme, a.s.r. raises awareness, supports financial education, and empowers individuals to better understand and manage their financial situation. Customers facing payment arrears and unable to meet their obligations are offered tailored support and solutions. A company-wide policy on socially responsible debt collection ensures that late payments are handled consistently and with compassion. |
| SDG 3: Ensure healthy lives and promote well-being for all at all ages | a.s.r. provides health and disability insurance to individuals who live and work in the Netherlands. A portion of its impact investments supports the development of new medicines. a.s.r. is committed to preventing illness by promoting health and vitality among customers and employees. This is achieved through a.s.r. Vitality and various health programmes focused on physical activity, sports and sleep. Furthermore, a.s.r. contributes to the sustainable employability of its customers’ employees by supporting reintegration processes and offering preventive services to reduce the risk of (long-term) sickness. | |
| SDG 5: Achieve gender equality and empower all women and girls | a.s.r.’s commitment to diversity, equity and inclusion is outlined in its Diversity, Equity and Inclusion (DEI) Policy. One of the strategic targets is to achieve at least 40% female representation within the management population by 2026. This target applies to the Supervisory Board, Management Board and top management. To ensure equal pay for work of equal value, a.s.r. conducts an annual gender pay gap analysis. The analysis confirms that there is no adjusted gender pay gap at a.s.r. | |
| SDG 7: Ensure access to affordable, reliable, sustainable and modern energy for all | a.s.r. aims to contribute positively to the energy transition and to combat climate change. This is achieved, for example, through impact investments such as the acquisition of wind farms in the Netherlands. Through its participation in the ASR Dutch Core Residential Fund, a.s.r. has improved the sustainability of residential properties in recent years by implementing insulation measures and investing in on-site sustainable energy generation. a.s.r. offers the Verduurzamingshypotheek (sustainability mortgage) as a standard product alongside its mortgage offering. This enables customers to make their homes more sustainable. | |
| SDG 8: Promote sustained, inclusive and sustainable economic growth, full and productive employment and decent work for all | a.s.r. aims to provide equal opportunities for all employees, regardless of gender, age, religious belief, physical or mental ability, background or sexual orientation. This commitment is outlined in the Diversity, DEI Policy. To monitor the development of cultural diversity, a.s.r. participates in the Cultural Diversity Barometer of Statistics Netherlands (CBS). In addition, a.s.r. conducts an annual Denison scan, which measures perceptions and progress on equal opportunities within the DEI module. a.s.r. has set a target to achieve a score of 85 or higher by 2026. The Policy on Responsible Investments (PRI) aligns investment decisions with ethical practices, including the promotion of living wages. | |
| SDG 10: Reduce inequality within and among countries | a.s.r. is committed, through its PRI, to promoting equal opportunities and reducing inequality. By investing in companies that actively contribute to improved working conditions and the provision of living wages, a.s.r. supports income growth for vulnerable groups. In addition a.s.r. fosters inclusion through clear customer communication and accessible products, with particular attention to individuals who may struggle with complex financial information. Internally, discrimination is actively addressed through codes of conduct and ESG guidelines. | |
| SDG 13: Take urgent action to combat climate change and its impacts | Climate resilience is enhanced through products that help customers adapt to climate risks, reducing financial uncertainty and increasing impact investments. The PRI includes criteria on the climate impact of investments and has an exit strategy for investments in fossil fuels. a.s.r. is member of the Net Zero Asset Managers initiative, a global platform committed to decarbonising investment portfolios and contributing to the Paris Agreement. Insurance can also be a powerful means of stimulating CO2 reduction. Insurers can help their customers to make more sustainable choices by providing valuable information on reducing emissions, energy saving or the use of sustainable materials. | |
| SDG 15: Protect, restore and promote sustainable use of terrestrial ecosystems, sustainably manage forests, combat desertification, and halt and reverse land degradation and halt biodiversity loss | a.s.r. actively contributes to the protection and sustainable use of terrestrial ecosystems through its investment strategy and real estate management. The Climate Transition Plan, published in 2025, outlines key actions such as promoting climate-positive crops, implementing biodiversity measures in farmland leases and supporting regenerative agriculture to improve soil health and biodiversity. In asset management, a.s.r. applies exclusion criteria to companies with high biodiversity impact and engages with investee companies to develop biodiversity action plans, particularly in sectors such as agriculture, forestry, energy and materials. Impact investments target solutions that address biodiversity loss, including sustainable food systems, circular packaging and water technologies. These efforts are aligned with the Kunming-Montreal Global Biodiversity Framework and aim to halt and reverse biodiversity loss before 2030. In 2025, a.s.r. reaffirmed its commitment as a signatory to the Finance for Biodiversity Pledge and is actively implementing its commitments. a.s.r.’s dedication to material reuse in urban and infrastructure development supports the circular economy by reducing waste and contributing to resource lifecycle extension. |
8.4 Stichting Continuïteit ASR Nederland
For information purposes only
Stichting Continuïteit ASR Nederland (the Foundation) was established on 26 May 2016. The Foundation has been established under Dutch law. Its objectives are to promote and protect the interests of a.s.r., its business and its stakeholders, and to counter possible influences that might threaten the continuity, independence, strategy and/or identity of a.s.r. or its business to such an extent that these could be considered contrary to the aforementioned interests.
a.s.r. has granted a call option to the Foundation under an agreement dated 27 May 2016; this agreement outlines the conditions under which the call option can be exercised. The call option is a continuous and repeatedly exercisable right, pursuant to which the Foundation is entitled to subscribe for preference shares, up to the lower of (a) the total number of shares that form a.s.r.’s issued capital at the time when the call option is exercised, less the number of preference shares already held by the Foundation at that time (if any) and less one, or (b) the maximum number of preference shares that may be issued under the authorised share capital as shown by the Articles of Association of a.s.r. at the time when the call option is exercised. The Foundation has the right to exercise the call option at any time, either fully or in part. The exercise price for preference shares issuable under the call option is equal to 25% of the nominal amount of those preference shares.
The call option is continuous in nature and can be exercised repeatedly and on more than one occasion, each time that the Foundation considers, or reasonably expects, there to be an act that is, in the opinion of the Foundation, materially contrary to the interests of a.s.r., its business or its stakeholders, which may include the following (to the extent materially contrary to the aforementioned interests), (i) the announcement of a public offer for shares in the capital of a.s.r., or the legitimate expectation that such a public offer will be announced, without agreement on the offer having been reached with a.s.r. or the offer being supported by a.s.r., and (ii) an activist shareholder (or group of activist shareholders acting in concert) in a.s.r. directly or indirectly representing at least 25% of the ordinary shares forming part of a.s.r.’s issued share capital.
Ultimately after the Foundation has held preference shares for a period of 20 months (or for such longer period as the Foundation deems appropriate given the facts and circumstances at hand), the Foundation may request, by means of a notice to that effect, that a.s.r. considers submitting, as soon as practicable, a proposal to the General Meeting for a resolution to cancel all preference shares. a.s.r. is free to propose such a resolution without this being requested by the Foundation if non-cancellation of the preference shares in a timely manner were to result in the Foundation being required to make a mandatory public offer in respect of a.s.r. In addition, if and when a.s.r. has issued preference shares to the Foundation, a.s.r. will convene a General Meeting, to be held within 20 months following such issuance, for the purpose of adopting a resolution on the cancellation of all such preference shares.
The Foundation has not exercised the call option and did not acquire any preference shares during the year under review.
The Foundation has an independent board. The membership of the Board of the Foundation is as follows:
Mr. J.W. Winter (Chair);
Mr. R.J. van de Kraats;
Ms. M.E. Groothuis;
The Board of the Foundation had two board meetings in 2025. The matters discussed included the Business Combination with Aegon NL, the full-year 2024 results of a.s.r., the execution of a.s.r.’s strategy, the financing of a.s.r. and other developments in the markets in which a.s.r. operates and the general course of affairs at a.s.r. At these meetings, a representative of the EB of a.s.r. provided the Board of the Foundation with information on the developments within a.s.r. and the relationship with its stakeholders. The Board of the Foundation also monitored the developments of a.s.r. outside of its Board meetings, for instance through occasional contacts with the EB and the receipt of press releases issued by a.s.r. As part of the regular preparation the Board also had one meeting to assess and discuss ‘what if’ scenarios.
The Foundation is an independent legal entity for the purpose of Section 5:71(1)(c) of the Dutch Financial Markets Supervision Act.
Utrecht, the Netherlands, 25 March 2026
Stichting Continuïteit ASR Nederland
Mr. J.W. Winter (Chair)
Mr. R.J. van de Kraats
Ms. M.E. Groothuis
8.5 Provisions of the Articles of Association regarding profit appropriation
Articles 35, 36 and 37 of the Articles of Association:
Distributions – General Article 35
35.1 A distribution can only be made to the extent that the Company’s equity exceeds the Non-Distributable Equity
35.2 The Executive Board (EB) may resolve to make interim distributions, provided that it appears from interim accounts to be prepared in accordance with Section 2:105(4) of the Dutch Civil Code that the requirement referred to in Article 35.1 has been met and, if it concerns an interim distribution of profits, taking into account the order of priority described in Article 37.1.
35.3 Subject to Article 19.10, the EB may adopt, and amend from time to time, a dividend and reservation policy for the Company. Amendments to such a policy shall be discussed in the General Meeting.
35.4 The preferred shares do not carry any entitlement to distributions other than as described in Articles 12.2, 37.1 and 38.3.
35.5 Distributions on ordinary shares shall be made in proportion to the aggregate nominal value of those ordinary shares. Distributions on preferred shares (or to the former holders of preferred shares) shall be paid in proportion to the amounts paid up (or formerly paid up) on those preferred shares.
35.6 The parties entitled to a distribution shall be the relevant shareholders, usufructuaries and pledgees, as the case may be, at a date to be determined by the EB for that purpose. This date shall not be earlier than the date on which the distribution was announced.
35.7 The General Meeting may resolve, subject to Article 31.1, that all or part of such a distribution, instead of being made in cash, shall be made in the form of shares in the Company’s capital or in the form of the Company’s assets.
35.8 A distribution shall be payable no later than thirty days after the date on which such distribution was declared, unless the EB sets a different date. If it concerns a distribution in cash, such distribution shall be payable in such currency as determined by the EB.
35.9 A claim for payment of a distribution shall lapse after five years have expired after the distribution was declared.
35.10 For the purpose of calculating any distribution, shares held by the Company in its own capital shall not be taken into account. No distribution shall be made to the Company in respect of shares held by it.
Distributions – Reserves
Article 36
36.1 All reserves maintained by the Company shall be attached exclusively to the ordinary shares. The Company shall not attach any reserve to the preferred shares.
36.2 Subject to Article 31.1, the General Meeting is authorised to resolve to make a distribution from the Company’s reserves.
36.3 Without prejudice to Articles 36.4 and 37.2, distributions from a reserve shall be made exclusively to the holders of ordinary shares.
36.4 The EB may resolve to charge amounts to be paid up on any class of shares against the Company’s reserves, irrespective of whether those shares are issued to existing shareholders.
Distributions – Profits
Article 37
37.1 Subject to Article 35.1, the profits shown in the Company’s annual accounts in respect of a financial year shall be appropriated as follows, and in the following order of priority:
a. To the extent that any preferred shares have been cancelled without the payment described in Article 12.2 paragraph b. having been made in full on those preferred shares and without any such deficit subsequently having been paid in full as described in this Article 37.1 or Article 37.2, any such deficit shall be paid to those who held those preferred shares immediately before such cancellation became effective;
b. To the extent that any Preferred Distribution (or part thereof) in relation to previous financial years has not yet been paid in full as described in this Article 37.1 or Article 37.2, any such deficit shall be paid on the preferred shares;
c. The Preferred Distribution shall be paid on the preferred shares in respect of the financial year to which the annual accounts pertain;
d. Subject to Article 19.10, the EB shall determine which part of the remaining profits shall be added to the Company’s reserves; and
e. Any remaining profits shall be at the disposal of the General Meeting for distribution to the holders of ordinary shares.
37.2 To the extent that the distributions described in Article 37.1 paragraphs a. through c. (or any part thereof) cannot be paid out of the profits shown in the annual accounts, the deficit shall be paid out of the Company’s reserves, subject to Articles 35.1 and 35.2.
37.3 Without prejudice to Article 35.1, a distribution of profits shall be made only after the adoption of the annual accounts that show that such distribution is allowed.

9 Appendix
9.1 Reference tables
9.1.1 Datapoints that derive from other EU legislation
Datapoints that derive from other EU legislation
| Disclosure requirement | Data point | Sustainability statements | Appendix | SFDR reference | Pillar 3 reference | Benchmark regulation reference | EU Climate Law reference | Section |
|---|---|---|---|---|---|---|---|
| ESRS 2 GOV-1 | 21 (d) | Board's gender diversity | x | x | 5.1.5 | ||
| ESRS 2 GOV-1 | 21 (e) | Percentage of board members who are independent | x | 5.1.3 | |||
| ESRS 2 GOV-4 | 30 | Statement on due diligence | x | 6.1.3.3 | |||
| ESRS 2 SBM-1 | 40 (d) i | Involvement in activities related to fossil fuel activities | x | x | x | 2.2 2.4 | |
| ESRS 2 SBM-1 | 40 (d) ii | Involvement in activities related to chemical production | x | x | 2.2 2.4 | ||
| ESRS 2 SBM-1 | 40 (d) iii | Involvement in activities related to controversial weapons | x | x | 2.2 2.4 | ||
| ESRS 2 SBM-1 | 40 (d) iv | Involvement in activities related to cultivation and production of tobacco | x | 2.2 2.4 | |||
| ESRS E1-1 | 14 | Transition plan to reach climate neutrality by 2050 | x | 6.2.1.3 | |||
| ESRS E1-1 | 16 (g) | Undertakings excluded from Paris-aligned Benchmarks | x | x | 6.2.1.3 | ||
| ESRS E1-4 | 34 | GHG emissions reduction targets | x | x | x | 6.2.1.6 | |
| ESRS E1-5 | 38 | Energy consumption from fossil sources disaggregated by sources (only high climate impact sectors) | x | Not material | |||
| ESRS E1-5 | 37 | Energy consumption and mix | x | Not material | |||
| ESRS E1-5 | 40-43 | Energy intensity associated with activities in high climate impact sectors | x | Not material | |||
| ESRS E1-6 | 44 | Gross Scope 1, 2, 3 and Total GHG emissions | x | x | x | 6.2.1.7 | |
| ESRS E1-6 | 53-55 | Gross GHG emissions intensity | x | x | x | 6.2.1.7 | |
| ESRS E1-7 | 56 | GHG removals and carbon credits | x | 6.2.1.7 | |||
| ESRS E1-9 | 66 | Exposure of the benchmark portfolio to climate-related physical risks | x | Phased-in, not reported in 2025 | |||
| ESRS E1-9 | 66 (a); 66 (c) | Disaggregation of monetary amounts by acute and chronic physical risk; Location of significant assets at material physical risk | x | Phased-in, not reported in 2025 | |||
| ESRS E1-9 | 67 (c) | Breakdown of the carrying value of its real estate assets by energy-efficiency classes | x | Phased-in, not reported in 2025 | |||
| ESRS E1-9 | 69 | Degree of exposure of the portfolio to climate-related opportunities | x | Phased-in, not reported in 2025 | |||
| ESRS E2-4 | 28 | Amount of each pollutant listed in Annex II of the E-PRTR Regulation emitted to air, water and soil | x | Not material | |||
| ESRS E3-1 | 9 | Water and marine resources | x | Not material | |||
| ESRS E3-1 | 13 | Dedicated policy | x | Not material | |||
| ESRS E3-1 | 14 | Sustainable oceans and seas | x | Not material | |||
| ESRS E3-4 | 28 (c) | Total water recycled and reused | x | Not material | |||
| ESRS E3-4 | 29 | Total water consumption in m3 per net revenue on own operations | x | Not material | |||
| ESRS 2- SBM 3 - E4 | 16 (a) i | Activities negatively affecting biodiversity sensitive areas | x | 6.2.2.1 | |||
| ESRS 2- SBM 3 - E4 | 16 (b) | Material negative impacts with regards to land degradation, desertification or soil sealing | x | 6.2.2.1 | |||
| ESRS 2- SBM 3 - E4 | 16 (c) | Operations that affect threatened species | x | 6.2.2.1 | |||
| ESRS E4-2 | 24 (b) | Sustainable land / agriculture practices or policies | x | 6.2.2.4 | |||
| ESRS E4-2 | 24 (c) | Sustainable oceans / seas practices or policies | x | 6.2.2.4 | |||
| ESRS E4-2 | 24 (d) | Policies to address deforestation | x | 6.2.2.4 | |||
| ESRS E5-5 | 37 (d) | Non-recycled waste | x | 6.2.3.4 | |||
| ESRS E5-5 | 39 | Hazardous waste and radioactive waste | x | 6.2.3.4 | |||
| ESRS 2- SBM3 - S1 | 14 (f) | Risk of incidents of forced labour | x | 6.1.4.4 | |||
| ESRS 2- SBM3 - S1 | 14 (g) | Risk of incidents of child labour | x | 6.1.4.4 | |||
| ESRS S1-1 | 20 | Human rights policy commitments | x | 6.3.1.2 | |||
| ESRS S1-1 | 21 | Due diligence policies on issues addressed by the fundamental International Labor Organisation Conventions 1 to 8 | x | 6.3.1.2 | |||
| ESRS S1-1 | 22 | Processes and measures for preventing trafficking in human beings | x | 6.3.1.2 | |||
| ESRS S1-1 | 23 | Workplace accident prevention policy or management system | x | 6.3.1.2 | |||
| ESRS S1-3 | 32 (c) | Grievance/complaints handling mechanisms | x | 6.3.1.2 | |||
| ESRS S1-14 | 88 (b) and (c) | Number of fatalities and number and rate of work-related accidents | x | x | 6.3.1.5 | ||
| ESRS S1-14 | 88 (e) | Number of days lost to injuries, accidents, fatalities or illness | x | 6.3.1.5 | |||
| ESRS S1-16 | 97 (a) | Unadjusted gender pay gap | x | x | 6.3.1.5 | ||
| ESRS S1-16 | 97 (b) | Excessive CEO pay ratio | x | 5.3.3 6.3.1.5 | |||
| ESRS S1-17 | 103 (a) | Incidents of discrimination | x | 6.3.1.5 | |||
| ESRS S1-17 | 104 (a) | Non-respect of UNGPs on Business and Human Rights and OECD | x | x | 6.3.1.5 | ||
| ESRS 2- SBM3 – S2 | 11 (b) | Significant risk of child labour or forced labour in the value chain | x | 6.1.4.4 | |||
| ESRS S2-1 | 17 | Human rights policy commitments | x | 6.3.2.2 | |||
| ESRS S2-1 | 18 | Policies related to value chain workers | x | 6.3.2.2 | |||
| ESRS S2-1 | 19 | Non-respect of UNGPs on Business and Human Rights principles and OECD guidelines | x | x | 6.3.2.2 | ||
| ESRS S2-1 | 19 | Due diligence policies on issues addressed by the fundamental International Labor Organisation Conventions 1 to 8 | x | 6.3.2.2 | |||
| ESRS S2-4 | 36 | Human rights issues and incidents connected to its upstream and downstream value chain | x | 6.3.2.4 | |||
| ESRS S3-1 | 16 | Human rights policy commitments | x | 6.3.3.2 | |||
| ESRS S3-1 | 17 | Non-respect of UNGPs on Business and Human Rights, ILO principles or and OECD guidelines | x | x | 6.3.3.2 | ||
| ESRS S3-4 | 36 | Human rights issues and incidents | x | 6.3.3.5 | |||
| ESRS S4-1 | 16 | Policies related to consumers and end-users | x | 6.3.4.2 | |||
| ESRS S4-1 | 17 | Non-respect of UNGPs on Business and Human Rights and OECD guidelines | x | x | 6.3.4.2 | ||
| ESRS S4-4 | 35 | Human rights issues and incidents | x | 6.3.4.4 | |||
| ESRS G1-1 | 10 (b) | United Nations Convention against Corruption | x | 6.4.1.3 | |||
| ESRS G1-1 | 10 (d) | Protection of whistle- blowers | x | 6.4.1.3 | |||
| ESRS G1-4 | 24 (a) | Fines for violation of anti-corruption and anti-bribery laws | x | x | 6.4.1.4 | ||
| ESRS G1-4 | 24 (b) | Standards of anti- corruption and anti-bribery | x | 6.4.1.4 |
9.1.2 TNFD recommendations
TNFD recommendations
| TNFD | Content | Corresponding ESRS paragraphs | a.s.r. CSRD reference |
|---|---|---|---|
| Governance | Disclose the organisation’s governance of nature-related dependencies, impacts, risks and opportunities. | ||
| Governance A | Describe the board’s oversight of nature related dependencies, impacts, risks and opportunities. | ESRS 2 GOV-1 | 6.1.3.1 |
| Governance B | Describe management’s role in assessing and managing nature-related dependencies, impacts, risks and opportunities. | ESRS 2 GOV-1 | 6.1.3.1 |
| Governance C | Describe the organisation’s human rights policies and engagement activities, and oversight by the board and management, with respect to Indigenous Peoples, Local Communities, affected and other stakeholders, in the organisation’s assessment of, and response to, nature-related dependencies, impacts, risks and opportunities. | ESRS 2 SBM-2 | 6.1.4.1 |
| Strategy | Disclose the effects of nature-related dependencies, impacts, risks and opportunities on the organisation’s business model, strategy and financial planning where such information is material. | ||
| Strategy A | Describe the nature-related dependencies, impacts, risks and opportunities the organisation has identified over the short, medium and long term. | Climate and Nature Transition Plan | Chapter - Nature-related dependencies, impacts, risks and opportunities |
| Strategy B | Describe the effect nature-related dependencies, impacts, risks and opportunities have had on the organisation’s business model, value chain, strategy and financial planning, as well as any transition plans or analysis in place. | ESRS E4-1 | 6.2.2.2 |
| Strategy C | Describe the resilience of the organisation’s strategy to nature-related risks and opportunities, taking into consideration different scenarios. | ESRS E4-1 | 6.2.2.2 |
| Strategy D | Disclose the locations of assets and/or activities in the organisation’s direct operations and, where possible, upstream and downstream value chain(s) that meet the criteria for priority locations. | Climate and Nature Transition Plan | Chapter - How a.s.r. Measures its nature footprint |
| Risk and impact management | Describe the processes used by the organisation to identify, assess, prioritise and monitor nature-related dependencies, impacts, risks and opportunities. | ||
| Risk and impact management A (i) | Describe the organisation’s processes for identifying, assessing and prioritising nature-related dependencies, impacts, risks and opportunities in its direct operations. | ESRS E4-1 | 6.2.2.1 |
| Risk and impact management A (ii) | Describe the organisation’s processes for identifying, assessing and prioritising nature-related dependencies, impacts, risks and opportunities in its upstream and downstream value chain(s). | ESRS E4-1 | 6.2.2.1 |
| Risk and impact management B | Describe the organisation’s processes for managing nature-related dependencies, impacts, risks and opportunities. | ESRS E4-2 | 6.2.2.4 |
| ESRS E4-3 | 6.2.2.5 | ||
| Risk and impact management C | Describe how processes for identifying, assessing, prioritising and monitoring nature-related risks are integrated into and inform the organisation’s overall risk management processes. | ESRS E4-1 Transition plan | 6.2.2.2 |
| ESRS 2 GOV-5 | 6.1.3.4 | ||
| Metrics and Targets | Disclose the metrics and targets used to assess and manage material nature-related dependencies, impacts, risks and opportunities. | ||
| Metrics and Targets A | Disclose the metrics used by the organisation to assess and manage material nature-related risks and opportunities in line with its strategy and risk management process. | Climate and Nature Transition Plan | Chapter - How a.s.r. measures its nature footprint |
| Metrics and Targets B | Disclose the metrics used by the organisation to assess and manage dependencies and impacts on nature. | Climate and Nature Transition Plan | Chapter - How a.s.r. Measures its nature footprint |
| Metrics and Targets C | Describe the targets and goals used by the organisation to manage nature-related dependencies, impacts, risks and opportunities and its performance against these. | ESRS E4-4 | 6.2.2.6 |
9.1.3 Finance for Biodiversity
Finance for Biodiversity
| FfB dislosures | Content | Corresponding ESRS paragraphs or Climate and Nature Transition Plan chapters | a.s.r. CSRD reference / CNTP reference |
|---|---|---|---|
| Collaboration | Collaboration and knowledge sharing | ||
| • Name and format of collaborative initiative(s) • Types of institutions collaborated with • Key activities • Tangible outcomes | E4-3 actions related to biodiversity and ecoystems | 6.2.2.5 | |
| Engaging | Integrate biodiversity criteria in ESG reporting and actively engage with companies | ||
| 1. Identified biodiversity topics and challenges 2. Goals and objectives 3. Mode(s) of engagement action 4. Engagement outcomes 5. Escalation (if applicable) | 1. ESRS 2 SBM-3 (impact, risks and opportunities) | 6.1.4.3 | |
| 2. Climate and Nature Transition Plan - Climate and Nature ambition | Chapter Climate and Nature ambition | ||
| 3.+ 4. ESRS E4-3 (actions and resources related to biodiversity and ecosystems) | 6.2.2.6 | ||
| Impact | Dislose and report | ||
| Step (1): Disclose the impact assessments conducted on your investments and financing activities Step (2): Report on how decision-making is influenced by the results of the impact assessments | Step 1):Climate and Nature Transition Plan - Dependencies, impacts, risks, opportunities and resilience | Chapter Nature-related dependencies, impacts, risks and opportunities | |
| Step (2): ESRS E4-1 (Consideration of biodiversity and ecosystems in strategy and business model) | 6.2.2.2 | ||
| Targets | Setting targets | ||
| • Description of the targets • Scope of the targets • Data and Methodologies • Challenges and Actions • Evolution of the targets | ESRS E4-4 (targets related to biodiversity and ecosystems) | 6.2.2.6 | |
This page is intentionally left blank.
9.2 Supplementary data points
9.2.1 Financial indicators
Key figures
| 2025 | 2024 | 2023 | 2022 (restated IFRS 17) | 2021 (IFRS4) | |
|---|---|---|---|---|---|
| Operating result (€ million) | 1,637 | 1,4631 | 973 | 805 | 1,009 |
| IFRS net result (€ million) | 565 | 9561 | 1,086 | -1,709 | 942 |
| Operating return on equity (%) | 14.1 | 13.41 | 11.6 | 10.6 | 16.3 |
| Solvency II ratio (%)2 | 218 | 198 | 176 | 221 | 196 |
| Dividend per share (€) | 3.41 | 3.12 | 2.89 | 2.70 | 2.42 |
| Total dividend (€ million) | 700 | 654 | 610 | 385 | 329 |
| Share buyback (€ million) | 330 | 100 | - | 75 | 75 |
| Total equity (€ million) | 10,124 | 9,8881 | 9,377 | 6,177 | 7,385 |
| Total equity attributable to shareholders (€ million) | 8,604 | 8,8331 | 8,339 | 615 | 6,363 |
| Premiums and DC volume (€ million) | 13,375 | 10,376 | 8,825 | 651 | |
| Contractual Service Margin (€ million) | 5,975 | 5,5091 | 5,168 | 1,829 | |
| Operating expenses (€ million) | 1,471 | 1,413 | 1,107 | 702 | 725 |
| Combined ratio (Non-life segment) (%) | 92.2 | 90.91 | 93.5 | 94.4 | 91.8 |
| Credit rating (S&P) | A+ | A | A | A | A |
| Organic capital creation (€ million) | 1,315 | 1,193 | 874 | 653 | 594 |
| Interest coverage ratio IFRS based (%) | 4.2 | 8.2 | 8.7 | -22.9 | 13.8 |
- This figure is restated.
- The Group Solvency II ratio is based on the Partial Internal Model (PIM), applicable to Aegon Life, Aegon Spaarkas and a.s.r. Life. The other insurance entities calculate their solvency capital requirement using the Solvency II Standard Formula. The Group Solvency II ratio includes financial institutions.
9.2.2 Investor community indicators
Shares
| (in numbers) | 31 December 2025 | 31 December 2024 | 31 December 2023 | 31 December 2022 | 31 December 2021 |
|---|---|---|---|---|---|
| Authorised capital | 325,000,000 | 325,000,000 | 325,000,000 | 325,000,000 | 325,000,000 |
| Issued share capital | 209,113,565 | 211,326,978 | 211,326,978 | 149,827,056 | 138,057,204 |
| Own shares held by a.s.r. | 4,554,997 | 2,424,597 | 178,816 | 1,902,772 | 2,263,812 |
| Outstanding shares | 204,558,568 | 208,902,381 | 211,148,162 | 147,924,284 | 135,793,392 |
Dividend history
| (in €) | 2025 | 2024 | 2023 | 2022 | 2021 |
|---|---|---|---|---|---|
| Dividend (in millions) | 700 | 654 | 610 | 385 | 329 |
| Dividend per share | 3.41 | 3.12 | 2.89 | 2.70 | 2.42 |
Dividend per share
| (in €) | 2025 | 2024 | 2023 | 2022 | 2021 |
|---|---|---|---|---|---|
| Interim dividend | 1.27 | 1.16 | 1.08 | 0.98 | 0.82 |
| Final dividend | 2.14 | 1.96 | 1.81 | 1.72 | 1.6 |
| Total dividend | 3.41 | 3.12 | 2.89 | 2.70 | 2.42 |
Share price performance
| (in €) | 2025 | 2024 | 2023 | 2022 | 2021 |
|---|---|---|---|---|---|
| Starting price as at 1 January | 45.78 | 42.70 | 44.35 | 40.50 | 32.85 |
| Highest closing price | 63.26 | 48.76 | 44.92 | 45.99 | 40.98 |
| Lowest closing price | 45.42 | 41.60 | 34.45 | 34.65 | 31.92 |
| Closing price as at 31 December | 60.62 | 45.78 | 42.70 | 44.35 | 40.50 |
| Market cap as at 31 December (€ million) | 12,676 | 9,675 | 9,016 | 6,560 | 5,500 |
| Average daily volume shares (numbers) | 424,708 | 419,134 | 623,604 | 497,953 | 463,387 |
Shareholder return
| (in %, including dividend reinvested) | 2025 | 2024 | 2023 | 2022 | 2021 |
|---|---|---|---|---|---|
| Shareholder return including dividend reinvested in a.s.r. shares | 40.0 | 14.5 | 3.2 | 16.3 | 30.4 |
| Euronext AEX Index | 11.1 | 14.6 | 17.2 | -11.4 | 30.5 |
| Euronext AMX Index | 14.9 | -7.4 | 2.3 | -11.1 | 18.5 |
| STOXX Europe 600 insurance Index | 30.4 | 24.6 | 14.6 | 5.6 | 21.1 |
9.2.3 ESG ratings
a.s.r. is rated by various ESG benchmarks & rating agencies, an explanation on the latest scores is provided in section 3.3.4.
Scores international ESG ratings and benchmarks
| ESG benchmark | Score low | Score high | 2025 | 2024 | 2023 | 2022 | 2021 |
|---|---|---|---|---|---|---|---|
| Dow Jones Sustainability Index | 0 | 100 | 82 / #91 | 82 / #9 | 79 / #8 | 84 / #10 | 86 / #8 |
| MSCI | CCC | AAA | AA | AA | AA | A | A |
| Sustainalytics ESG Risk Rating | 100 | 0 | 11.5 / #7 | 11.2 / #4 | 9.6 / #2 | 9.1 / #1 | 10.0 / #1 |
| Carbon Disclosure Project | D- | A | B | B | B | B | B |
| ISS ESG | D- | A+ | B- (prime) | C+ (prime) | C+ (prime) | C+ (prime) | C (prime) |
| FTSE4Good | 0 | 5 | 4.3 | 5.0 | 5.0 | 3.9 | 4.1 |
| Fair Insurance Guide (Eerlijke Verzekeringswijzer) | N/A | N/A | #1 | #1 | #1 | #1 | #1 |
| VBDO (once every two years) | N/A | N/A | #1 | N/A | #2 | N/A | #3 |
| VBDO Tax Transparency Benchmark | 0 | 35 | 42 / #2 | 31 / #14 | 31 / #11-14 | 31 / #5 | 28 / #6 |
- Ranking World and Europe unknown at time of publication of this Annual Report.
9.2.4 Net Promoter Score (NPS) per business line
Overview of NPS-c per business line
| (NPS-c score between -100 and 100) | 2025 | 2024 | 2023 | 2022 | 2021 |
|---|---|---|---|---|---|
| a.s.r. | 54 | 52 | 48 | 51 | 49 |
| P&C | 48 | 39 | 41 | 59 | 59 |
| Disability | 68 | 67 | 67 | 65 | 60 |
| Health | 52 | 42 | 35 | 49 | 49 |
| Funeral | 54 | 53 | 48 | 50 | 47 |
| Individual life | 50 | 47 | 53 | 49 | 38 |
| Pensions | 56 | 61 | 62 | 57 | 52 |
| Mortgages | 33 | 36 | 38 | 39 | 43 |
In 2025, for the first time, a.s.r. is reporting on its Net Promoter Score-interaction (NPS-i), a customer satisfaction metric based on both online and offline channels. NPS-i represents the weighted average score of the NPS-c (contact moments between client and a.s.r.) and NPS-d (digital client interaction, e.g. website or online portal). Closely monitored through NPS surveys, the NPS-i, gives insight into the customer experience and highlights areas for improvement.
NPS-i per business line
| (score between -100 and 100) | NPS-i | NPS-c | NPS-d |
|---|---|---|---|
| a.s.r. | 25 | 54 | 6 |
| P&C | 29 | 48 | 17 |
| Disability | 12 | 68 | -3 |
| Health | 34 | 52 | 15 |
| Pensions | 25 | 54 | -3 |
| Individual life | 19 | 50 | -12 |
| Funeral | 41 | 56 | 4 |
| Mortgages | NA | 33 | NA |
9.3 Glossary
Amortised cost
The amount at which a financial asset or financial liability is measured on initial recognition net of principal repayments, plus or minus accumulated amortisation using the effective interest method or any difference between that initial amount and the amount at maturity, and minus any reduction for impairments or collectability.
Associate
An entity over which a.s.r. has significant influence and which is neither a subsidiary nor an interest in a joint venture.
Authorised agent
An intermediary in the insurance industry who has the authority to sell insurance, issue policies, collect premiums, and handle claims on behalf of an insurance company. This agent acts as an extension of the insurance company and has specific powers outlined in a power of attorney.
Avond4Daagse
The Avond4daagse is an annual Dutch community walking event during which participants of all ages follow organised routes over four consecutive evenings.
Claims ratio
The cost of claims, net of reinsurance in Non-life, excluding the internal costs and exclusively commissions paid of handling non-life claims, less interest accrual on reserves, and a margin of prudence for health, expressed as a percentage of net earned premiums.
Climate adaptation
The process of adjusting to actual or expected climate change and its effects. The goal is to reduce vulnerability and enhance resilience to the impacts of climate change.
Climate mitigation
The efforts and actions taken to reduce or prevent the emission of greenhouse gases into the atmosphere.
Closed books
Closed books are policies that are no longer sold but are still on the books of a life insurance carrier as insurance coverage is still given and insurance policy contract services and/or cashflows are expected.
Contractual service margin (CSM)
CSM represents the unearned profit a.s.r. will recognise as it provides insurance contract services in the future and is determined at recognition as the equal and opposite amount of the estimates of the future cash flows including acquisition cash flows, an adjustment for the time value of money and a risk adjustment.
Derivative
A financial instrument with all three of the following characteristics: (a) Its value changes in response to the change in a specified interest rate, financial instrument price, commodity price, foreign exchange rate, index of prices or rates, credit rating or credit index, or other variable, provided, where a non-financial variable is concerned, the variable is not specific to a party to the contract (sometimes referred to as the underlying); (b) It requires no initial net investment or else an initial net investment which is lower than would be required for other types of contracts that would be expected to have a similar response to changes in market factors and (c) It is settled at a future date.
Developing and promoting sustainable products/services
a.s.r. offers various sustainable products and services in all its business segments, such as sustainable repair and the Verduurzamingshypotheek. Offering sustainable products and services enables a.s.r. to contribute towards a sustainable, future-proof society. Furthermore, sustainable products and services increase the appeal of a.s.r. for the growing group of customers that regard sustainability as important. The Sustainable Insurance Policy states that sustainability considerations (such as potential impact on ESG topics) are integrated into the different phases of the product policy.
Dirty fair value
The fair value of an asset or liability, including related accrued interest.
Discounted cash flow method
A valuation technique whereby expected future cash flows are discounted at a rate that expresses the time value of money and a risk premium that reflects the extra return that investors demand as compensation for the risk that the cash flows may not materialise.
Discretionary Participation Feature
A contractual right to receive, as a supplement to guaranteed benefits, additional benefits that are likely to be a significant portion of the total contractual benefits, the amount or timing of which is contractually at the discretion of the issuer, which are contractually based on the performance of a specified pool of contracts or type of contract, realised and/or unrealised investment returns on a specified pool of assets held by the issuer, or the profit or loss of the company, fund or other entity that issues the contract.
Diversity, equity and inclusion
Diversity
All aspects in which people differ from each other. These visible aspects such as age and skin colour and the less visible aspects such as cultural, social and ethnic backgrounds, sexual and gender identities, competences, work styles, education levels, perspectives and views make us authentic and unique as human beings. a.s.r. believes that these differences make the organisation stronger together.
Equity
Every person is unique, but everyone’s contribution is of equal or comparable value. Equity means that everyone can participate fully and has access to equal opportunities.
Inclusion
With inclusion, a.s.r. sees a culture in which differences are recognised, valued and made use of. An environment in which everyone has their place, experiences the freedom and safety to be their authentic and unique selves, and where we do not exclude anyone.
Double Materiality Assessment (DMA)
The DMA considers both impact materiality (the actual or potential impact of a.s.r. on people and the environment) and financial materiality (the risks or opportunities that sustainability topics may present for a.s.r. itself in a financial way).
Embedded derivative
A component of a hybrid instrument that also includes a non-derivative host. The host contract may be a bond or equity, a lease, an insurance contract or a contract of purchase and sale.
Embodied carbon
Embodied carbon emissions are GHG emissions arising from the extraction, production, transportation and assembly of (building) materials.
Emissions own activities
Scope 1 emissions are direct emissions from company-owned and controlled resources.
Scope 2 emissions are indirect emissions from the generation of purchased energy, from a utility provider.
Scope 3 emissions are all indirect emissions - not included in scope 2 - that occur in the value chain of the reporting company, including both upstream and downstream emissions.
Employee benefits
All forms of consideration given by an entity in exchange for service rendered by employees.
Employee contribution
a.s.r.'s employee contribution to local society is measured by the volunteering hours of both a.s.r. employees as well as external employees working on behalf of a.s.r. These hours are non-profit and might include activities of the Doenkracht programme. This contribution can be done in a team or on an individual basis. For some activities the time is estimated based on a standardised table. Activities include improving financial literacy, being a financial buddy, reading aloud to children, as well as team activities for societal organisations. Employees that are involved in an activity within a domain (Financial self-reliance and Helping by doing) more than once per calendar year are considered a double count. And as such only included once in the figure reported for number of employees involved. Volunteering hours also include training hours, travel time and the actual execution of the employee contribution.
Environmental, Social and Governance (ESG)
ESG refers to the three main areas of concern that have developed as central factors in measuring the sustainability and societal impact of an investment in a company. These areas cover a broad set of concerns increasingly included in the non-financial factors that feature in the valuation of investments in equities, property, corporate and fixed-income bonds. ESG is the catch-all term for the criteria used in what has become known as socially responsible investment.
EU Taxonomy
EU Taxonomy Regulation establishes an EU classification system – or taxonomy – that provides investors, including financial sector entities and corporates, with uniform criteria specifying which economic activities are considered to contribute to the sustainable objectives of the EU. This should provide non-financial and financial actors with clarity on which of their activities are considered sustainable in order to scale up sustainable investments and thereby contribute to the overall objectives of the EU’s 2018 Sustainable Finance Action Plan and 2020 renewed Sustainable Finance Strategy.
EU Taxonomy eligibility
Eligibility used under the EU Taxonomy Regulation means that the economic activity is mentioned in the technical screening criteria and have therefore the potential to be considered or become sustainable, so-called ‘taxonomy aligned’.
EU Taxonomy alignment
Alignment used under the EU Taxonomy Regulation means that the economic activity meets the technical screening criteria for alignment, including the criteria that the activity cause no significant harm to one or more of the other EU Taxonomy Regulation environmental objectives, while at the same time respecting minimum safeguards. These minimum safeguards are set out in particular in the OECD Guidelines for Multinational Enterprises and the UN Guiding Principles on Business and Human Rights, including the principles and rights set out in the eight fundamental conventions identified in the Declaration of the International Labour Organisation on Fundamental Principles and Rights at Work and the International Bill of Human Rights.
Expense ratio
Expenses, including the internal costs of handling non-life claims, minus internal investment expenses and restructuring provision expenses, expressed as a percentage of net earned premiums.
Fair value
The price that would be received to sell an asset or paid to transfer a liability in an orderly transaction between market participants at the measurement date.
Full Time Equivalent (FTE)
Full Time Equivalent is a unit of account for the size of a job or total workforce. One FTE is equal to an employee working a full working week (being at least 38 hours) during the entire reporting year.
Global Real Estate Survey Benchmark (GRESB)
The GRESB is a benchmark that looks at the sustainability performance of more than 700 institutional investment funds worldwide.
Goodwill
An asset representing the future economic benefits arising from other assets acquired in a business combination which are not individually identified and separately recognised.
General Measurement Model (GMM)
The default model for the measurement of insurance contracts, except for direct participating contracts. The model comprises of four building blocks to determine the insurance liability, being future cash flows, discounting, risk adjustment and contractual service margin.
Green House Gas (GHG)
These are gases in the Earth's atmosphere that trap heat, contributing to the greenhouse effect and global warming. The main greenhouse gases include carbon dioxide (CO₂), methane (CH₄), nitrous oxide (N₂O) and fluorinated gases. Each of these gases has different sources and varying impacts on the climate.
Gross written premiums
Total revenues (earned or otherwise) expected to be received for insurance contracts over the life of the contract, including reinsurance premiums.
Hedge accounting
Hedge accounting (IFRS 9/IAS 39), is an accounting method used to align the financial reporting of hedging instruments (such as derivatives) and the underlying hedged items (such as mortgage loans) to better reflect the company's risk management activities. The goal is to reduce the volatility in the profit and loss account caused by changes in the value of the hedging instruments and the associated hedged items.
HR indicators
The definitions of the HR indicators mentioned in section 3.2 are included below. The scope of the HR indicators is a.s.r. employees excluding subsidiaries, redundant employees, incapacitated employees and employees employed through the Meedoendesk, unless specified otherwise. Some HR indicators are only covered in the Sustainability statements and explained in section 6.3.1.
Absenteeism rate
The absenteeism rate is the percentage of calendar days that employees called in sick compared to the total calendar days in the reporting period. Maternity leave and pregnancy-related sickness are excluded.
Employee Mood Monitor (eMood®)
The eMood® score measures how employees feel in terms of happiness at work, vitality and productivity. The average of these scores is called the mood of a.s.r. All weekly scores are consolidated in the average score per year. External staff with the exception of self-employed persons are in scope.
Employee engagement (Denison Culture Scan)
Employee engagement is measured through the annually performed Denison Culture Scan. Employees are asked to fill in a questionnaire on the basis of four drivers of engagement: vision, core values, empowerment and knowledge development. The results are compared with a global benchmark of more than 1,200 large organisations that use the Denison scan. Employees employed through the Meedoendesk and external staff are in scope.
Employees followed training courses (%)
The percentage of employees who have completed at least one training course during the reporting period.
Employees employed through the Meedoendesk
Employees that are employed through the Meedoendesk and qualify for the Dutch Participation Act (Participatiewet). Contractors are out of scope, employees employed through the Meedoendesk are in scope.
Employee turnover
The employee turnover is measured through a percentage which is the total outflow of employees divided by the average number of employees. Redundant employees and employees employed through the Meedoendesk are in scope.
eNPS
The eNPS is the extent to which employees would actively recommend a.s.r. as an employer. This is also measured via the Employee Mood Monitor. The eNPS provides a.s.r. an insight in the loyalty and perceived attraction of a.s.r. as an employer. External staff with the exception of self-employed persons are in scope.
FTE
Total number of internal FTE that have an employment contract with a.s.r. or one of its subsidiaries.
Gender diversity (%)
The proportion (in %) of female / male employed at a.s.r.
Gender pay gap
The gender pay gap as mentioned in sections 3.2.2 and 6.3.1.5 refers to the unadjusted gender pay gap.
The gender pay gap is calculated as follows: (average gross hourly wage for women - average gross hourly wage for men) / average gross hourly wage for men. In the unadjusted pay gap, a.s.r. does not correct for type of work, age and work experience, but looks at all men and woman as a whole. In the adjusted pay gap all factors above are included as correction factor in the calculation.
Gross average hourly wages split by gender
Gross average wage per hour in €, split by gender and per management layer.
Nil absenteeism
Nil absenteeism is the proportion (in %) of employees who have not reported sick during the reporting period.
Part-time and full-time employees
Part-time employees are the number of employees that have contract hours of less than 38 hours per week.
Full-time employees are the number of employees that have contract hours of at least 38 hours per week.
Pay ratio (incl. highest paid and average)
a.s.r. is transparent concerning the remuneration of the EB. Not only in terms of actual amounts, but also in accordance with the Dutch Corporate Governance Code as compared with the average of the remuneration of the employees at a.s.r. The average pay ratio calculation is the difference expressed in a ratio between the average of the remuneration of the employees at a.s.r. and the highest paid individual at a.s.r.
Pay ratio (incl. highest paid and median)
a.s.r. is transparent concerning the remuneration of the EB. Not only in terms of actual amounts, but also in accordance with the Global Reporting Initiative as compared with the median of the remuneration of the employees at a.s.r. The median pay ratio is the difference expressed in a ratio between the median of the remuneration of the employees at a.s.r. and the highest paid individual at a.s.r. Part-time employees are excluded from the calculation of the ratio because accurate extrapolation to full time employees is not possible through certain loan components.
Total spending on training and development
Total a.s.r. investment in € on training and development programmes.
Vacancies filled internally
Internally filled vacancies are the number of vacancies filled by internal candidates, in absolute numbers and in percentage by dividing by total filled vacancies. Redundant employees, incapacitated employees and employees employed through the Meedoendesk are in scope.
Impairment
The amount by which the carrying amount of an asset or a cash-generating unit exceeds its recoverable amount. The asset's carrying amount is reduced to its fair value and the impairment loss is recognised through the income statement.
Institution for Occupational Retirement Provision (IORP)
IORP is a pension vehicle in the form of a separate legal entity which can operate a pension DC scheme on a separate account basis during the pension accrual phase. When an employee reaches his or her retirement age, the IORP transfers the accrued capital to a pension insurer of the employee's choice to pay the pension benefits. Employers wishing to insure any additional risks (such as survivors' pensions) can do so through an IORP.
Insurance contracts
A contract under which one party (a.s.r.) accepts significant insurance risk from another party (the policyholder) by agreeing to compensate the policyholder if a specified uncertain future event adversely affects the policyholder.
Insurance contract revenue
Insurance contract revenue under the general measurement model and Variable fee approach consists mainly of the sum of the changes in the liability for remaining coverage due to the insurance service expenses incurred in the period measured at the amounts expected at the beginning of the period, the change in the risk adjustment for non-financial risk, and the amount of contractual service margin for the services provided in the period. Insurance contract revenue under the premium allocation approach is based on the expected premium receipts for providing coverage in the period, based on the passage of time.
Intangible asset
An identifiable, non-monetary asset without physical substance.
Intermediary
A person or organization that acts as a middleman or mediator between two or more parties to facilitate communication or transactions. In the context of insurance, an intermediary is often responsible for advising clients on various insurance products, helping with policy purchases and assisting with claims.
International Financial Reporting Standards (IFRS)
As of 1 January 2005, these standards have been the generally accepted international accounting policies that apply to all listed companies in the EU. They make annual results easier to compare and offer a better understanding of a company's financial position and performance.
International Integrated Reporting Council (IIRC)
The IIRC is a global coalition of regulators, investors, companies, standard setters, the accounting profession, academia and NGOs. The coalition promotes communication about value creation as the next step in the evolution of corporate reporting.
Investment contract
A life insurance contract that transfers FR with no significant insurance risk.
Investment property
Property held to earn rentals or for capital appreciation or both.
Joint venture
A contractual arrangement under which two or more parties undertake an economic activity that is subject to joint control.
Materiality
An aspect is considered material if it is relevant to the stakeholders, has a reasonably estimable economic, environmental, and/or social impact and can have a major impact on the development of a.s.r. The greater the impact of the aspect on both society and a.s.r.'s business operations, results and strategy, the greater its materiality.
Net Promoter Score (NPS)
The NPS is a management tool that can be used to gauge the customer satisfaction of an organisation's customers. a.s.r. uses several NPS indicators, namely the:
NPS-c: measures customer satisfaction after contact with an a.s.r. employee by phone (offline);
NPS-d: measures customer satisfaction after interactions via digital channels (online);
NPS-r: evaluates overall customer satisfaction, independent of specific customer interactions;
NPS-i: combines NPS-c and NPS-d to assess satisfaction across both online and offline channels.
Non-participating life insurance contracts
In non-participating life insurance contracts, all values relating to the policy (death benefits, cash surrender values, premiums) are usually determined at policy issue, for the life of the contract, and cannot usually be altered after issue.
Notional amount
An amount of currency, number of shares, number of units of weight or volume or other units specified in a derivatives contract.
Nu, later en altijd
'Nu, later en altijd' is the brand asset developed for the in 2023 launched marketing campaign of a.s.r. It translates to 'Now, later and always'. With its financial services and role as responsible investor, a.s.r. aims for an improved financial situation for its customers and a sustainable society for today, tomorrow and for future generations to come.
Operating lease
A lease that does not transfer substantially all the risk and rewards incidental to ownership of an asset.
Operating Return on Equity
A measure of financial performance calculated by dividing the operating result (after hybrid costs and net of taxes) by the average adjusted equity attributable to shareholders for the reporting period.
Option
A financial instrument that conveys the right to buy (call option) or sell (put option) a security at a reference price during a specified time frame.
Organic capital creation (OCC)
The sustainable creation of capital from both the change in the Eligible own funds (EOF) and the change in the Solvency Capital Requirement (SCR) on Solvency II basis. To express the change in SCR in EOF-equivalent terms, the change in SCR is multiplied by the Solvency II target ratio. The OCC consists of three elements: (1) Business Capital Generation, (2) Finance Capital Generation and (3) Net SCR impact. In this definition, sustainable means: generated by the company on its own account, net of external and one-off effects. This results in a view on the Solvency II figures that is comparable with the definition of the operational result on IFRS basis.
Pension DB
Defined benefit pension plan is a type of pension plan in which an employer/sponsor promises a specified pension payment, lump-sum, or combination thereof on retirement that depends on an employee's earnings history, tenure of service and age, rather than depending directly on individual investment returns.
Pension DC
A defined contribution plan is a type of retirement plan in which the employer, employee or both make contributions on a regular basis. Individual accounts are set up for participants and benefits are based on the amounts credited to these accounts plus any investment earnings on the money in the account.
Photovoltaics
Photovoltaics is the conversion of light into electricity using semiconducting materials that exhibit the photovoltaic effect.
Partial Internal Model (PIM)
The Solvency II framework allows an insurance company to calculate the SCR using either the standard formula or, subject to supervisory approval, their own internal model (either full or partial). Partial internal models can be used to model one or more of the standard formula risk modules or sub-modules, the capital requirements for operational risk or for the loss-absorbing capacity of technical provision for either the whole business or one or more business units.
Premium allocation approach (PAA)
PAA is an optional simplification of the GMM. The PAA simplifies the measurement of the liability for remaining coverage. The measurement of the liability for incurred claims does not change and is measured conform the GMM. Revenue recognised is based on the expected premium receipts allocated to the period, based on the passage of time.
Private equity
An asset class consisting of equity securities of companies that are not publicly traded on a stock exchange. The transfer of private equity is strictly regulated. In the absence of a marketplace, any investor looking to sell their stake in a private company personally has to find a buyer.
Provision
A liability of uncertain timing or amount. Provisions are recognised as liabilities if it is probable that an outflow of resources embodying economic benefits will be required to settle the obligations (assuming that a reliable estimate can be made).
Recoverable amount
The recoverable amount of an asset or a cash-generating unit is its fair value less costs to sell or its value in use, whichever is higher.
Return on Equity (ROE)
A measure of financial performance calculated by dividing the net result attributable to holders of equity instruments by the average equity attributable to shareholders for the reporting period.
Science Based Targets
a.s.r. considers a target to be science-based if it is based on, the best available or latest, scientific data, as can be derived from the references in the ESRS and the definitions in voluntary frameworks such as the SBTi and SBTN frameworks. In general, to qualify as a target, also in line with ESRS, a target needs to be measurable, outcome-orientated and time-bound. Although one can have its targets validated by, for example, SBTi, this is not a condition for a target to be science-based; a target can be science-based without being validated by SBTi or another validating body.
Science Based Targets Initiative (SBTi)
SBTi is a corporate climate action organisation that enables companies and financial institutions worldwide to play their part in combating the climate crisis. They develop standards, tools and guidance which allow companies to set GHG emissions reductions targets in line with what is needed to keep global heating below catastrophic levels and reach net-zero by 2050 at the latest. Its subsidiary provides target validation services.
Scope 1, 2 and 3 emissions
These are categories of greenhouse gas emissions.
Scope 1 covers direct emissions.
Scope 2 covers indirect emissions from purchased electricity.
Scope 3 includes all other indirect emissions.
Securities lending
This refers to the lending of securities by one party to another, with the latter agreeing to return the securities on a specified future date. The borrower usually provides the lender with collateral. Securities lending allows the owner of the securities to generate extra income.
Socially Responsible Investment (SRI)
Investing with due regard for ethical standards, policies and procedures, in line with the interests of a.s.r. stakeholders, where the integration of ESG criteria is key. To achieve this a.s.r. uses multiple ESG approaches such as the exclusion of controversial activities, exclusion of companies and countries due to their ethical performance, the engagement dialogue, the integration of ESG assessments in the portfolio construction and impact investments. A detailed description of a.s.r.'s SRI policy is published on www.asrnl.com.
Solvency II
Solvency II is an EU regulatory regime that has been in force in all member states since 1 January 2016. It has introduced a new, harmonised Europe-wide regime for insurance companies and sets regulatory requirements for solvency and risk governance.
Stakeholders
Stakeholders are individuals or organisations that have an interest, of whatever nature, in an organisation. They have a link with its activities, share in its earnings, influence its performance and assess its ESG effects. a.s.r.'s main stakeholder groups are customers, employees, shareholders and the society as a whole.
Stakeholder Engagement
The process of involving key stakeholders in the decision-making process regarding sustainability issues with the aim to strengthen the relationship to create mutual insight and understanding and opportunities for collaboration.
Subsidiary
An entity that is controlled by ASR Nederland N.V. (the parent company) or a subsidiary of ASR Nederland N.V.
Sustainable repair
The Sustainable repair indicator presents claims for P&C that were repaired as a share of total repairable claims. Research by CE Delft shows that the climate impact of repair is three to six times lower than that of replacement. The definition of sustainable repair was adapted as of reporting year 2023, in line with most recent research of CE Delft, a Dutch research centre specialised in (climate impact related to) energy, raw materials and transport. Please refer to the research paper here (in Dutch).
Sustainable reputation
Sustainable reputation reflects the brand reputation of a.s.r. in the Netherlands in the areas of sustainability, transparency and reliability. The score is calculated by determining how much % of the respondents give a top 2 score on a 5-point-scale. E.g. a score of 40 means 40% of the respondents give a top 2 score.
Transaction date
The date at which a.s.r. enters into the contractual terms of an instrument.
Value creation model
In section 2.3, a.s.r.'s value creation model is disclosed. This model illustrates how a.s.r. perceives the process of achieving sustainable value for its customers, employees, investors, and society. Different types of resources serve as inputs into the business model of a.s.r. The different business activities of a.s.r. use these inputs to create intended outputs and outcomes and hence added value to a.s.r.'s different key stakeholders.
Value chain model
The value chain outlines the relationship between the business activities of a.s.r. and the preceding and underlying links.
Value in use
Value in use is the present value of the future cash flows expected to be derived from an asset or cash-generating unit.
Variable fee approach (VFA)
VFA is required for insurance contracts that meet specific requirements whereby a link between payments to the policyholder and the returns on underlying items, such as some ‘participating’, ‘with profits’ and ‘unit linked’ contracts, is key. The interest on the CSM for such contracts is accreted implicitly through adjusting the CSM for the change in the variable fee. The variable fee represents a.s.r.’s share of the fair value of the underlying items less amounts that do not vary based on the return of the underlying items. The CSM is also adjusted for the time value of money and the effect of changes in financial risks not arising from underlying items such as options and guarantees.
9.4 Abbreviations
| Abbreviation | Definition |
|---|---|
| €STR | Euro Short-Term Rate |
| A&RC | Audit & Risk Committee |
| ACM | Dutch Authority for Consumers and Markets (Autoriteit Consument & Markt) |
| AEX | Amsterdam Exchange Index |
| AF | Actuarial Function |
| AFM | Dutch Authority for the Financial Markets (Autoriteit Financiële Markten) |
| AGM | Annual General Meeting |
| AI | Artificial Intelligence |
| AI Act | European Artificial Intelligence Act |
| AIE | Advanced Internal Evaluation |
| AIFM | Alternative Investment Fund Managers |
| AIR | Adjusted Interest Rate |
| ALM | Asset Liability Management |
| AMSB | Administrative, Management and Supervisory Bodies |
| Amvest LCF | Amvest Living & Care Fund |
| Amvest RCF | Amvest Residential Core Fund |
| AMX | Amsterdam Midcap Index |
| AOV | Occupational Disability Insurance |
| AP | Dutch Data Protection Authority (Autoriteit Persoonsgegevens) |
| ASR DCRF | ASR Dutch Core Residential Fund |
| ASR DFLF | ASR Dutch Farmland Fund |
| ASR DMOF | ASR Dutch Mobility Office Fund |
| ASR DPRF | ASR Dutch Prime Retail Fund |
| ASR DSPF | ASR Dutch Science Park Fund |
| ATNi | Access to Nutrition initiative |
| AUD | Australian Dollar |
| AuM | Assets under Management |
| AVB | Business liability insurance |
| AZWA | Supplementary Healthcare & Welfare Agreement (Aanvullend Zorg- en WelzijnsAkkoord) |
| BAV | Professional liability insurance |
| BCM | Business Culture Manager |
| BIO | Biodiversity & Ecosystems (taxonomy category) |
| bps | Basis points |
| BRC | Business Risk Committee |
| BSCR | Basic Solvency Capital Requirement |
| BVPA | Dutch Association for Public Affairs (Beroepsvereniging voor Public Affairs) |
| CAHRA | Conflict-Affected and High-Risk Areas |
| CAPM | Capital Asset Pricing Model |
| CBS | Statistics Netherlands (Centraal Bureau voor de Statistiek) |
| CC IM | Competence Center Intermediary |
| CCA | Climate change adaptation |
| CCM | Climate change mitigation |
| CCR | Counterparty Credit Rating (Standard & Poor's) |
| CDD | Customer Due Diligence |
| CE | Circular Economy (taxonomy category) |
| CEO | Chief Executive Officer |
| CFO | Chief Financial Officer |
| CGU | Cash Generating Unit |
| CHRO | Chief Human Resources Officer |
| CIC | Central Investment Committee |
| CISO | Chief Information Security Officer |
| CLA | Collective Labour Agreement |
| CLT | Cross‑Laminated Timber |
| CMD | Capital Markets Day |
| CO₂ | Carbon dioxide |
| CO2e | CO2 equivalent |
| CoC | Cost of Capital |
| COO | Chief Operating Officer |
| COR | Combined Ratio |
| COSO | Committee of Sponsoring Organizations of the Treadway Commission |
| CPI | Consumer Price Index |
| CRM | Customer Relationship Management |
| CRO | Chief Risk Officer |
| CRREM | Carbon Risk Real Estate Monitor |
| CSA | Credit Support Annex |
| CSDDD | Corporate Sustainability Due Diligence Directive |
| CSM | Contractual service margin |
| CSP | concentrated solar power |
| CSRD | Corporate Sustainability Reporting Directive |
| CTO | Chief Technology Officer |
| D&IT | Digital & IT |
| D&S | Distribution and Services |
| DA | Dynamic Adjustment |
| DB | Defined benefit |
| DBA | Employment Relationships Deregulation Act (Wet Deregulering Beoordeling Arbeidsrelaties) |
| DC | Defined contribution |
| DCC | Dutch Climate Coalition |
| DCF | Discounted Cash Flow |
| DCRF | Dutch Core Residential Fund |
| DEC | Dutch Engagement Coalition |
| DEI | Diversity, equity and inclusion |
| DFLF | Dutch Farmland Fund |
| DGBC | Dutch Green Building Council |
| DJSI | S&P Global Dow Jones Sustainability Index |
| DKK | Danish crown |
| DMA | Double Materiality Assessment |
| DMOF | Dutch Mobility Office Fund |
| DNB | Dutch Central Bank (De Nederlandsche Bank) |
| DORA | Digital Operational Resilience Act |
| DPIA | Data Protection Impact Assessment |
| DPO | Data Protection Officer |
| DPRF | Dutch Prime Retail Fund |
| DSPF | Dutch Science Park Fund |
| DTC | Digital Trust Centre |
| DUFAS | Dutch Fund and Asset Management Association |
| DVA | Dynamic volatility Adjustment |
| EAD | Exposure at Default |
| EB | Executive Board |
| EC | European Commission |
| ECB | European Central Bank |
| ECL | Expected Credit Loss |
| EEA | European Economic Area |
| EED | Energy Efficiency Directive |
| EGM | Extraordinary General Meeting |
| EIOPA | European Insurance and Occupational Pensions Authority |
| eMood® | Employee Mood Monitor |
| eNPS | Employee Net Promoter Score |
| EOF | Eligible own funds |
| ERM | Enterprise Risk Management |
| ESG | Environmental, Social and Governance |
| ESPP | Employee share purchase plan |
| ESRS | European Sustainability Reporting Standards |
| EU | European Union |
| Euribor | Euro Interbank Offered Rate |
| FCAB | Framework for Climate Adaptive Buildings |
| FMA | Future Management Action |
| FR | financial risks |
| FRC | Financial Risk Committee |
| FRM | Financial Risk Management |
| FSP | Financial Services Provider |
| FTE | Full-Time Equivalent |
| FVOCI | Fair Value through Other Comprehensive Income |
| FVTPL | Fair Value Through Profit or Loss |
| GBP | Pound Sterling |
| GDDZ | Green Deal Sustainable Healthcare |
| GDP | Gross Domestic Product |
| GDPR | General Data Protection Regulation |
| GHG | greenhouse gas |
| GIIN | Global Impact Investing Network |
| GMM | General Measurement Model |
| GP | General Practitioner |
| GRC | Governance, Risk and Compliance |
| GRESB | Global Real Estate Survey Benchmark |
| GRI | Global Reporting Initiative |
| GRM | Group Risk Management |
| GWP | Gross Written Premiums |
| HKD | Hong Kong Dollar |
| HR | Human Resources |
| HTH | HumanTouch Holding B.V. |
| IAS | International Accounting Standards |
| IBNR | Incurred but not reported |
| ICR | Insurance contract revenue |
| ICT | Information and Communications Technology |
| IFRS | International Financial Reporting Standards |
| IFSR | Insurer Financial Strength Rating (Standard & Poor's) |
| ILO | International Labour Organisation |
| IM | Investment Manager / Internal Model |
| IMAP | Internal Model Application Process |
| IMP | Individual Monitoring Plan |
| INREV | European Association for Investors in Non‑Listed Real Estate Vehicles |
| IORP | Institution for Occupational Retirement Provision (Premiepensioeninstelling) |
| IRO | Impact, Risk and Opportunity |
| IRRD | Insurance recovery and resolution directive |
| ISAE | International Standard on Assurance Engagements |
| ISDA | International Swaps and Derivatives Association |
| ISIN | International Securities Identification Number |
| IT | Information Technology |
| IVBN | Dutch Association of Institutional Investors in Real Estate (Vereniging van Institutionele Beleggers in Vastgoed) |
| IZA | Integrated Care Agreement (Integraal Zorgakkoord) |
| KNMI | Royal Netherlands Meteorological Institute (Koninklijk Nederlands Meteorologisch Instituut) |
| KPI | key performance indicator |
| KWbN | Royal Dutch Walking Association (Koninklijke Wandelbond Nederland) |
| kWh | kilowatt-hour |
| KYC | Know Your Customer |
| LAC DT | Loss Absorbing Capacity Deferred Tax |
| LAC TP | Loss-Absorbing Capacity of Technical Provisions |
| LEAP | Locate, Evaluate, Assess and Prepare approach of TNFD |
| LGD | Loss Given Default |
| LIC | Liability for Incurred Claims |
| LIP | Liability Investment Portfolio |
| LoC | Level of Concern |
| LRC | Liability for Remaining Coverage |
| LTO | Netherlands Agricultural and Horticultural Association (Land- en Tuinbouw Organisatie Nederland) |
| LULUCF | Land Use, Land-Use Change and Forestry |
| M&A | Mergers and Acquisitions |
| MB | Management Board |
| MDM | Master Data Management |
| MEEM | Methodology for Economic Evaluation Models |
| MiFID | Markets in Financial Instruments Directive |
| MLRO | Money Laundering Reporting Officer |
| MRM | Market Risk Management |
| MSCI | Morgan Stanley Capital International |
| MTA | Social team activity (Maatschappelijke Team Activiteit) |
| MtM | Mark-to-Market |
| MV | Model Validation |
| N&ESGC | Nomination & Environmental, Social and Governance Committee |
| N/A | Not applicable |
| NAICS | North American Industry Classification System |
| NCFG | National Coalition for Financial Health (Nationale Coalitie voor Financiële Gezondheid) |
| NCSC | National Cyber Security Centre |
| NFR | Non-financial risks |
| NFRC | Non-Financial Risk Committee |
| NGOs | Non-governmental and non-profit organisations |
| NHG | National Mortgage Guarantee (Nationale Hypotheek Garantie) |
| NPS | Net Promoter Score |
| NPS-c | Net Promoter Score for contact moments |
| NPS-d | Net Promoter Score for digital channels |
| NPS-i | Net Promoter Score for interactions |
| NPS-r | Net Promoter Score for customer relationship |
| NSLT | Not Similar to Non-life Techniques |
| NSR | Dutch Debt Assistance Route (Nederlandse Schuldhulproute) |
| NZAM | Net Zero Asset Managers Initiative |
| NZIA | Net-Zero Insurance Alliance |
| OCC | organic capital creation |
| OECD | Organisation for Economic Co-operation and Development |
| OIFR | Operating Investment and Finance Result |
| OIS | Overnight Indexed Swap |
| OISR | Operating Insurance Service Result |
| Oncra | Open Natural Carbon Removal Accounting |
| OR a.s.r. | Works Council a.s.r. (Ondernemingsraad a.s.r.) |
| ORA | Operational Risk Assessment |
| ORM | Operational Risk Management |
| ORSA | Own Risk and Solvency Assessment |
| OTC | Over the Counter |
| OTSO | Supervised entity (Onder toezicht staande onderneming) |
| P&C | Property & Casualty |
| p.a. | per annum |
| PAA | Premium allocation approach |
| PARP | Product Approval & Review Process |
| PCAF | Partnership for Carbon Accounting Financials |
| PCF | Privacy Control Framework |
| PD | Probability of Default |
| PFZW | Dutch pension fund for the care and welfare sector (Pensioenfonds Zorg en Welzijn) |
| PII | Personal Identifiable Information |
| PIM | Partial Internal Model |
| PLFW | Platform Living Wage Financials |
| PMO | Preventive Medical Examination (Preventief Medisch Onderzoek) |
| PO | Privacy Office |
| PPC | Pollution Prevention and Control |
| PRI | Policy on Responsible Investments |
| PSO | TNO Social Entrepreneurship Performance Ladder |
| PVI | Private Value Investment |
| R&D | Research & Development |
| RA | Risk adjustment |
| RAS | Risk Appetite Statements |
| RBAC | Role-Based Access Control |
| RC | Remuneration Committee |
| RCF | Responsible Corporate Finance |
| RCSII | Research Centre for Sustainable Investments & Insurance |
| RG | Review Group |
| RI&E | Risk Inventory and Evaluation |
| RICS | Royal Institution of Chartered Surveyors |
| RIVM | National Institute for Public Health and the Environment (Rijksinstituut voor Volksgezondheid en Milieu) |
| RM | Risk Management |
| RMBS | Residential Mortgage‑Backed Securities |
| RMF | Risk Management Framework |
| ROE | Return on Equity |
| RT1 | Restricted Tier 1 |
| RVU | Early Retirement Regulation (Regeling voor vervroegde uittreding) |
| S&P | Standard & Poor's |
| SAA | Strategic Asset Allocation |
| SB | Supervisory Board |
| SBB | Share buyback |
| SBTi | Science-Based Targets initiative |
| SCA | Smart Claims Assistent |
| SCR | Solvency Capital Requirement |
| SDGs | Sustainable Development Goals |
| SEK | Swedish Krone |
| SER | Dutch Social and Economic Council (Sociaal-Economische Raad) |
| SF | Standard formula |
| SFDR | Sustainable Finance Disclosure Regulation |
| SG | Steering Group |
| SII | Solvency II |
| SIRA | Systematic integrity risk analysis |
| SKGZ | Dutch Foundation for Dispute Resolution in Healthcare (Stichting Klachten en Geschillen Zorgverzekeringen) |
| SLT | Similar to Life Techniques |
| SME | Small and medium-sized Enterprises |
| SOFR | Secured Overnight Financing Rate |
| SONIA | Sterling Overnight Index Average |
| SPPI | Solely Payment of Principle and Interest |
| SPT | Pension fund for Dentists and Dental-specialists (Pensioenfonds Tandartsen en Tandarts-specialisten) |
| SPV | Special purpose vehicle |
| SRA | Strategic risk analysis |
| TAZ | Future-Proof Labour Market Care & Welfare (Toekomstbestendige Arbeidsmarkt Zorg & welzijn) |
| TNFD | Task Force on Nature-related Financial Disclosures |
| TSAs | Transitional Service Agreements |
| TVOG | Time value of financial options and guarantees |
| UFR | Ultimate Forward Rate |
| UK | United Kingdom |
| UMG | Underwriting Management Group |
| UN PRI | United Nations Principles for Responsible Investments |
| UNGC | United Nations Global Compact |
| UNGPs | The United Nations Guiding Principles on Business and Human Rights |
| US | United States |
| USD | United States Dollar |
| UWV | Employee Insurance Agency (Uitvoeringsinstituut Werknemersverzekeringen) |
| VA | Volatility Adjustment |
| VAT | Value Added Tax |
| VBDO | Dutch Association of Investors for Sustainable Development (Vereniging van Beleggers voor Duurzame Ontwikkeling) |
| VFA | Variable fee approach |
| VKG | Van Kampen Groep |
| VNO-NCW | Confederation of Netherlands Industry and Employers |
| VOR | Risk Management Statement (Verklaring Omtrent Risicobeheersing) |
| VPL | Act Early retirement and life-course savings scheme (Wet aanpassing fiscale behandeling VUT/prepensioen en introductie levensloopregeling) |
| WCAG | Web Content Accessibility Guidelines |
| Wft | Financial Supervision Act (Wet Financieel Toezicht) |
| WIA | Work and Income according to Labour Capacity Act (Wet Werk en Inkomen naar Arbeidsvermogen) |
| WITL | Working Independently of Time and Location |
| WOZ | Property Valuation Act (NL) |
| Wtp | Future Pensions Act (Wet toekomst pensioenen) |
| WTR | Water & Marine Resources (taxonomy category) |
| Wwft | Anti-Money Laundering and Anti-Terrorist Financing Act (Wet ter voorkoming van witwassen en financieren van terrorisme) |
| ZN | Dutch Healthcare Insurers Association (Zorgverzekeraars Nederland) |
| ZVW | Health Insurance Act (Zorgverzekeringswet) |
Contact details
Contact
a.s.r. likes to receive feedback or questions from stakeholders on the Annual Report. If you want to give a.s.r. feedback, please feel free to contact us.
ASR Nederland N.V.
Archimedeslaan 10
P.O. Box 2072
3500 HB Utrecht
The Netherlands
www.asrnl.com
Commercial register of Utrecht, no. 30070695
Investor Relations
+31 (0)30 257 86 00
www.asrnl.com/investor-relations
Corporate Communications
Press officer
+31 (0)6 2341 7756
a.kuipers@asr.nl
Publication
Design & Realisation
ASR Nederland N.V.
TD Cascade B.V.
Tangelo Software B.V.
Photography
Wilco van Deijen
Raphaël Drent
Milan Hofmans
Menno Ridderhof
Thijs Rooijmans
Elise Smook
Getty images
Text
ASR Nederland N.V.