
Board Report
The Board Report (management report) consists of the chapters 1 Introduction, 2 About Us, 3 Our Performance, 4 Risk Management, 5 Corporate Governance (paragraphs Board report and Declarations), and paragraph Sustainability statement of the 6 Performance Statements.
OCI Global Brand
OCI N.V. is referred to as OCI Global, OCI, OCI N.V., the Company, or the Group throughout this Annual Report. Subsidiaries are referred to in this Annual Report by their brand names or by their registered names in the notes to the financial statements.
Forward-looking statements
This Annual Report contains forward-looking statements. By their nature, these statements involve risks and uncertainties. Readers should not put reliance on these statements. In addition, future actual events, results and outcomes likely differ from these statements made.
European single electronic reporting format
(ESEF) and PDF version
(ESEF) and PDF version
This is the PDF/printed version of OCI N.V.’s 2025 Annual Report. This version has been prepared for ease of use and does not contain ESEF information as specified in the Regulatory Technical Standards on ESEF (Delegated Regulation (EU) 2019/815). The official ESEF reporting package is available on our website. In case of any discrepancies between this PDF version and the ESEF reporting package, the latter prevails.
1 Introduction
CEO Letter

A Transformational Year for OCI
Dear Stakeholders,
2025 marked a defining year for OCI, as we reached our 75-year anniversary. Since its origins, OCI and its predecessor business have played a pivotal role across a broad range of industries, including construction, infrastructure, building materials, cement, nitrogen fertilizers, melamine, methanol and biomethanol, and more recently, low-carbon and transition-focused products such as blue ammonia. This enduring capacity for evolution has long been a defining hallmark of OCI’s legacy.
Over the last three years, our most recent strategic review has fundamentally transformed the portfolio and generated gross proceeds of USD 11.9 billion to date, which – together with operating cash flows – has enabled approximately USD 7 billion (equivalent to approximately EUR 31 per share) in shareholder distributions since 2022.
2025 was characterized by continued disciplined execution, strategic portfolio transformation, and the achievement of major transactional milestones. Operationally, our continuing European nitrogen business (OCI Nitrogen) delivered resilient operational performance despite natural gas and commodity volatility, as well as a heavy turnaround year. We have remained steadfast in our investment in this Dutch facility, in contrast to the wave of capacity curtailments and shutdowns across Europe, underscoring our conviction that OCI Nitrogen remains a high-quality, strategically critical asset within the European supply chain. Following the recent completion of our OCI Ammonia Holdings (OAH) divestment, we have also preserved OCI Nitrogen’s ammonia import flexibility through a dedicated throughput agreement.
Subsequent to the year end, geopolitical developments in the Middle East have contributed to heightened market volatility and increased uncertainty, resulting in a sharp increase in European natural gas prices, and, consequently, materially higher production costs. To date, these effects have been partially mitigated by higher product prices; however, farmer affordability remains an important factor in the sustainability of the spread between selling prices and production costs.
In addition, the dislocation of global trade flows, pressures on energy supply, and disruptions at various petrochemical facilities in the Middle East have affected global methanol prices. Against this backdrop, and since the outbreak of the conflict, the share price of Methanex - in which the Company held a 12.9% interest at the beginning of the year, received as part of the consideration for the sale of the OCI Methanol Group - increased sharply, alongside a significant rise in trading liquidity. The Company capitalised on these favourable market conditions and announced the sale of 3.33 million shares through an accelerated block trade on 16 March. The significant increase in available trading capacity under Rule 144, based on trailing average liquidity, was also a contributing factor in the Board’s authorisation for Management to evaluate further divestments, subject to market conditions.
Delivering on Our Strategic Review
Sale of OCI Methanol
A major milestone was the completion of the sale of our global methanol business (OCI Methanol) to Methanex Corporation (Methanex) on 27 June 2025. The agreement, signed in August 2024, transferred 100% ownership for gross proceeds of USD 2.05 billion, including a 12.9% equity consideration, making OCI Methanex’s second-largest shareholder. Following the expiration of the lock-up period in October 2025, we sold 3.3 million Methanex shares through an accelerated block sale on 13 March 2026. As a result of the disposition, OCI now owns approximately 8.6% of the outstanding Methanex shares. This structure preserves exposure to the methanol sector while maintaining optionality around future monetization.
Beaumont New Ammonia
Construction of the facility in Beaumont, Texas, progressed through final commissioning activities in 2025, culminating in first production on 29 December. On 25 March 2026, following the successful completion of performance testing, we announced the formal handover of the facility to Woodside, including the transfer of the operations team. As part of the divestment, OCI has received the USD 470 million deferred consideration, representing 20% of total proceeds, less amounts deducted for outstanding construction obligations, certain closing-related adjustments, and remaining estimated close-out costs. These items are included in the previously disclosed total cost to complete of USD 1.8 billion and were reflected in OCI’s 2025 year-end liability of USD 228 million on an undiscounted basis, implying expected net proceeds of USD 242 million in 2026. The transaction is expected to generate an IRR of approximately 70%.
Sale of OCI Ammonia Holding (OAH) to AGROFERT
In Q4 2025, OCI reached an agreement to divest its ammonia distribution and terminal business OAH to AGROFERT, a significant European nitrogen products manufacturer for EUR 290 million. OCI shareholders approved the transaction at an EGM on 22 January 2026 and the transaction closed on 31 March following receipt of the required regulatory approvals. Net proceeds will be subject to customary closing adjustments.
Strategic options for OCI Nitrogen
Our objective remains to effect a strategic transaction for the remaining OCI Nitrogen business, an integrated producer of ammonia, premium nitrogen products including CAN, CAN+S, UAN, melamine and low-carbon CAN.
Strengthening Our Financial Position and Returning Capital
Following the completion of these divestments, OCI continued to prioritize capital returns, distributing USD 1.7 billion in 2025, structured as capital repayments within available fiscal capital reserves and extraordinary cash dividends. Following the close of the OCI Methanol sale, OCI also fully retired its USD 600 million 2033 bonds in August, completing the repayment of all outstanding long-term gross debt.
Proposed Strategic Combination with Orascom Construction
In September 2025, we announced the proposed transaction with Orascom Construction to establish a scalable infrastructure and investment platform anchored in Abu Dhabi. Agreement on the envisaged combination was reached on 9 December 2025, subject to customary conditions including shareholder approval.
In early January 2026, the Enterprise Chamber of the Amsterdam Court of Appeals (the “EC”) issued a preliminary ruling in connection with the proposed transaction. As part of this ruling, the EC temporarily suspended the holding of a general meeting to vote on the transaction and appointed two independent non-executive directors to OCI’s board. These directors have a specific mandate to evaluate the transaction and, where appropriate, to make proposals in this regard to an extraordinary general meeting. Any proposal relating to the transaction may only be submitted to the general meeting with their consent.
Future Strategic Pathway
OCI is committed to ensuring that any decision regarding the Company’s strategic future, whether in relation to the proposed Orascom transaction, a similar transaction, or other alternative options, is taken in the best interests of the Company and all its stakeholders, including minority shareholders.
As we mark our 75‑year heritage, our focus remains firmly on performance excellence, disciplined capital allocation, and the delivery of enduring long-term value.
Hassan Badrawi
Chief Executive Officer
OCI Global
2 About Us
Our company
OCI N.V. (OCI Global) is a value-driven business, which aims to evolve industries while creating value for its stakeholders. OCI is listed on Euronext in Amsterdam.
Strategic reorientation
As described in the CEO Letter, the execution of the strategic review during 2025 resulted in significant portfolio changes across the Group. Following the divestment of the OCI Methanol business, the transfer of Beaumont New Ammonia (BNA) and the closing of the ammonia distribution and terminal business, our objective remains to effect a strategic transaction for the sole remaining operating business: OCI Nitrogen (OCIN).
This section outlines the implications of these developments for the presentation of the financial and sustainability information in this Annual Report, including the continuing and discontinued operations.
About this report
The segment Nitrogen EU includes both OCIN and OCI Ammonia Holding B.V. (OAH). On 24 November 2025, we announced an agreement to sell 100% of our equity interests in OAH, comprising OCI Terminal Europoort B.V. (OTE) and OCI Ammonia Distribution B.V. (OAD) to AGROFERT. The transaction closed on 31 March 2026. OAH was classified as held for sale following the announced divestment but does not meet the IFRS criteria to be classified as a discontinued operation and, as such its results continue to be presented within the European Nitrogen segment in the financial statements. In the sustainability statement and section Our products of the management report, the entities included in the OAH sale agreement are classified as discontinued operations.
Reference is made to the CEO Letter, Financial performance, sections 22 Discontinued operations and assets & liabilities held for sale, 28 Segment reporting, 29 Contingencies and 33 Subsequent events in the financial statements, and section 1.1.1.3 Effect of discontinued operations in the sustainability statement.
This Annual Report begins with a summary of our financial performance, followed by Risk Management, Corporate Governance, the financial statements, and the sustainability statement prepared in accordance with the European Sustainability Reporting Standards (ESRS). With the Corporate Sustainability Reporting Directive (CSRD) expected to be transposed into national law by 2026, which mandates ESRS, OCI has chosen to comply voluntarily for this year under review. Going forward, we are not committed to continuing voluntary reporting.
Our products
We are active in chemicals production and produce and distribute hydrogen and nitrogen-based products, including fertilizers, fuels and feedstock to agricultural, transport and industrial customers around the world. During 2025, we sold 3.31 million metric tonnes of hydrogen products, generating revenue of USD 1,6052 million.
- Product sales volumes 2025 - total: 3.3 million metric tonnes, continuing operations: 2.3 million metric tonnes, discontinued operations: 1.0 million metric tonnes.
- Net revenue 2025 - total: USD 1,605 million, continuing operations: USD 1,086 million, discontinued operations: USD 519 million.
Our nitrogen products
Merchant ammonia
Ammonia (24.9%1 of our revenue) is a colorless gas that is a building block for industrial chemicals and nitrogen fertilizers, and can be applied as a direct fertilizer. Ammonia is the highest energy density non-hydrocarbon product. The principal raw material used in the conventional production of ammonia is natural gas.
- Ammonia revenue 2025 - total: 24.9%, continuing operations: 23.3%, discontinued operations: 27.8%.
Calcium ammonium nitrate (CAN)
Calcium ammonium nitrate (25.4%1 of our revenue), branded as OCI Nutramon, is a nitrogen fertilizer with an addition of dolomite. While the nitrate enables immediate nutrient uptake by crops due to its high absorption properties, the added dolomite reduces soil acidification potential and subsequent liming need.
- CAN revenue 2025 - total: 25.4%, continuing operations: 39.7%, discontinued operations: 0.0%.
Urea ammonium nitrate (UAN)
Urea ammonium nitrate (8.3%1 of our revenue) is a liquid fertilizer which consists of urea and ammonium nitrate. Due to its nitrate component it is easily absorbed by plants.
- UAN revenue 2025 - total: 8.3%, continuing operations: 13.0%, discontinued operations: 0.0%.
Ammonium sulfate (AS)
Ammonium sulfate (1.4%1 of our revenue) is a solid crystalline fertilizer, which contains nitrogen and sulfur. It is highly soluble in water and easily stored and transported.
- AS revenue 2025 - total: 1.4%, continuing operations: 2.2%, discontinued operations: 0.0%.
Ammonium nitrate + sulfur (AN + S)
Ammonium nitrate + sulfur (3.4%1 of our revenue), branded as OCI Dynamon, is an integrated nitrogen-sulphur fertilizer combining both components in a single granule. The positive synergy results in optimal crop yield and high quality.
- AN + S revenue 2025 - total: 3.4%, continuing operations: 5.3%, discontinued operations: 0.0%.
Renewable ammonia
We are one of the only producers today of International Sustainability and Carbon Certification (ISCC) certified renewable ammonia (0.5%1 of our revenue). This is produced either using biomethane at our Dutch and United States ammonia plants (bio-ammonia) or using hydrogen from electrolysis of renewable electricity at our former Egyptian ammonia facilities (renewable ammonia).
- Renewable ammonia revenue 2025 - total: 0.5%, continuing operations: 0.8%, discontinued operations: 0.0%.
Melamine
Melamine (7.7%1 of our revenue) is an organic-based substance, which consists of 66% nitrogen. Its application lies predominantly within home renovation and construction markets as an intermediate in wood-based panels and a component of glue. OCI Nitrogen Europe is one of the world's largest melamine producers.
- Melamine revenue 2025 - total: 7.7%, continuing operations: 12.0%, discontinued operations: 0.0%.
Carbon dioxide (CO2)
CO2 (0.1%1 of our revenue) is an odorless gas, which can be captured from industrial processes and sold to third parties for use in various applications, such as carbonated drinks production, and food and beverage preservation.
- CO2 revenue 2025 - total: 0.1%, continuing operations: 0.1%, discontinued operations: 0.0%.
Our diesel exhaust fluid (DEF)
Diesel exhaust fluid (2.3%1 of our revenue), which is also known as AdBlue® in Europe, is a non-hazardous aqueous urea solution consisting of approximately 67.5% deionized water and approximately 32.5% urea.
- DEF revenue 2025 - total: 2.3%, continuing operations: 3.6%, discontinued operations: 0.0%.
Methanol in our discontinued operations
Methanol
Methanol (22.8%1 of our revenue) is a clear chemical liquid predominantly produced from natural gas, which is highly versatile in its application ranging from powering ships and vehicles to heating homes.
- Methanol revenue 2025 - total: 22.8%, continuing operations: 0.0%, discontinued operations: 63.1%.
Green (renewably-sourced) methanol
Green methanol (3.3%1 of our revenue) can be produced either by using biomethane instead of natural gas in existing facilities, from biogenic fraction of gasification of municipal solid and biomass waste, or by chemically combining CO2 and hydrogen produced via electrolysis. We use waste, residues and by-products as feedstocks.
- Green methanol revenue 2025 - total: 3.3%, continuing operations: 0.0%, discontinued operations: 9.2%.
3 Our Performance
Financial performance
We reported total FY 2025 revenues of USD 1,086.0 million for continuing operations, an increase of 11% YoY, and total FY 2025 adjusted EBITDA for continuing operations of USD 46.4 million, an improvement of USD 78.3 million YoY.
Performance summary
Continuing operations1 (unless otherwise stated)
$ millionunless otherwise stated | 2025 | 2024 |
|---|---|---|
Revenue | 1,086.0 | 975.1 |
Adjusted EBITDA | 46.4 | (31.9) |
EBITDA | (8.9) | (125.5) |
Depreciation, amortization and impairment | (103.8) | (107.1) |
Operating loss | (112.7) | (232.6) |
Net finance (cost) / income | (248.4) | 70.0 |
Adjusted net loss attributable to shareholders | (51.2) | (166.3) |
Loss from continuing operations attributable to shareholders | (343.7) | (163.5) |
Profit from discontinued operations attributable to shareholders | 527.4 | 5,142.3 |
Net profit attributable to shareholders | 183.7 | 4,978.8 |
Weighted average number of ordinary shares outstanding as per 31 December (shares in million) | 211.4 | 211.0 |
- Continuing operations include Nitrogen EU and other (corporate entities) segments of the group.
Revenue - continuing operations
Revenue from continuing operations increased by USD 110.9 million from USD 975.1 million in 2024 to USD 1,086.0 million in 2025, primarily due to:
Increase in average benchmark prices for ammonia, CAN and UAN in 2025 of 6%, 19% and 29%, respectively;
Increase in total own product and traded third party sales in 2025 of 6%. The continuing operations of the business only sold nitrogen products in 2025 and 2024. Total own product sales volumes were higher at 2,048.4 million metric tonnes in 2025, compared to 1,967.3 million metric tonnes in 2024 driven by higher CAN, UAN and DEF sales volumes. Ammonia sales volumes were lower at 322.6 million metric tonnes in 2025, compared to 408.9 million metric tonnes in 2024 due to planned maintenance and unplanned outages. Traded third party sales were higher at 271.2 tonnes in 2025, compared to 224.1 tonnes in 2024;
Adjusted EBITDA - continuing operations
Adjusted EBITDA from continuing operations was higher at USD 46.4 million in 2025 versus a loss of USD 31.9 million in 2024. Reported EBITDA also improved to a loss of USD 8.9 million compared to a loss USD 125.5 million in 2024 driven by improved performance of Nitrogen EU segment and reduction of corporate costs.
- OCI N.V. uses Alternative Performance Measures (APM) to provide a better understanding of the underlying developments of the performance of the business. The APMs are not defined in IFRS and should be used as supplementary information in conjunction with the most directly comparable IFRS measures. The definition of the APM and a detailed reconciliation between the APM and the most directly comparable IFRS measure can be found on pages - of this report.
Operating loss - continuing operations
Operating loss improved by USD 119.9 million to USD 112.7 million in 2025 versus USD 232.6 million in 2024, primarily as a result of:
Gross profit increased by USD 21.7 million due to a USD 110.9 million increase in revenue offset by USD 89.2 million increase in cost of goods sold;
Please refer to the section Revenue - continuing operations for further details on increase in revenue in 2025.
The increase in cost of goods sold is primarily due to the relatively higher gas prices as well as ammonia imports following the unplanned / planned outages to mitigate supply risks in 2025;
Selling, general and administrative expenses decreased by USD 60.2 million to USD 171.7 million in 2025 from USD 231.9 million in 2024 primarily due to the reduction of corporate and transaction costs;
Other income increased by USD 29.6 million to USD 35.4 million in 2025 from USD 5.8 in 2024 primarily due to higher gain from sale of associates in 2025;
Net finance cost / income- continuing operations
Net finance cost of USD 248.4 million versus net finance income USD 70.0 million, an adverse movement year-on-year of USD 318.4 million, primarily as a result of:
Net foreign exchange losses of USD 167.2 million in 2025, compared to a gain of USD 113.5 million in 2024, representing an adverse year-on-year movement of USD 280.7 million. The net foreign exchange losses are mainly attributed to the devaluation of the USD relative to the EUR and its impact on the revaluation of the USD cash in OCI N.V., which is an entity with EUR functional currency. In 2025, OCI's policy has been to return capital to investors in USD, and thus the exposure to the USD position was not hedged;
The modification loss of USD 72.5 million in 2025 which was triggered by the initiation of the repayment process on the 2033 bonds at a premium of 110.75%, equivalent to USD 64.5 million;
Offset by the decrease in interest expenses by USD 41.7 million to USD 47.6 million in 2025 due to repayment of the OCI N.V. Bridge Loan Facility, the OCI N.V. 2025 bonds and OCI N.V. Revolving Credit Facility;
Adjusted net loss - continuing operations
Total adjusted net loss attributable to owners of the Company was USD 51.2 million in 2025, compared to a loss of USD 166.3 million in 2024, an improvement of USD 115.1 million.
Profit from discontinued operations attributable to shareholders
Profit from discontinued operations attributable to shareholders declined by USD 4,614.9 million to USD 527.4 million in 2025 from USD 5,142.3 million in 2024. The decline was primarily due to the successful divestment of IFCo, Beaumont New Ammonia and Fertiglobe in 2024, and the Methanol business in 2025, therefore a smaller scope of discontinued operations in 2025;
Statement of cash flows
$ million | 2025 | 2024 |
|---|---|---|
Cash and cash equivalents in statement of financial position at 1 January | 2,052.9 | 156.9 |
Cash and cash equivalents included in assets held for sale | 1.2 | 769.1 |
Bank overdraft repayable on demand | (6.1) | (90.4) |
Cash and cash equivalents in statement of cash flows at 1 January | 2,048.0 | 835.6 |
Cash flows (used in) / from operating activities | (82.2) | 223.4 |
Cash flows from / (used in) investing activities | 500.7 | 7,912.7 |
Cash flows used in financing activities | (2,407.1) | (6,130.6) |
Net cash flows | (1,988.6) | 2,005.5 |
Currency translation adjustments | (11.0) | (91.9) |
Cash and cash equivalents included in assets held for sale disposed | (31.1) | (701.2) |
Cash and cash equivalents | 17.3 | 2,048.0 |
Cash and cash equivalents in statement of financial position | 17.9 | 2,052.9 |
Cash and cash equivalents included in assets held for sale | - | 1.2 |
Bank overdraft repayable on demand | (0.6) | (6.1) |
Cash and cash equivalents in statement of cash flows | 17.3 | 2,048.0 |
Cash flows from operating activities
Related to total operations, net cash outflows from operating activities were USD 82.2 million in 2025 compared to inflows of USD 223.4 million in 2024. The change is driven by higher net loss, lower net cash from operating activities in relation to discontinued operations, offset by improvement in changes in other working capital in 2025.
Net loss for continuing operations was USD 343.7 million in 2025 compared to net loss of USD 165.1 million in 2024, an adverse movement year-on-year of USD 178.6 million;
Changes in other working capital items (inventories, trade receivables, provisions, and trade payables other than related to the Beaumont New Ammonia project) resulted in a net outflow of USD 37.9 million in 2025 compared to USD 130.5 million in 2024, an improvement of USD 92.6 million;
Net cash used in operating activities by discontinued operations was USD 4.8 million in 2025, compared to cash inflow of USD 556.1 million in 2024. The decrease in net cash from discontinued operations was due to a decrease in the scope of discontinued operations in the current period after the divestment of IFCo, BNA, Fertiglobe in 2024, and the Methanol business in 2025;
Cash flows from investing activities
Related to total operations, net cash inflows from investing activities were USD 500.7 million in 2025 compared to USD 7,912.7 million in 2024. The higher cash inflows in 2024 is driven by proceeds from the divestment of IFCo, Beaumont New Ammonia, and Fertiglobe;
The net cash inflow from investing activities in 2025 is primarily driven by the cash proceeds from sale of the Methanol business of USD 1.29 billion;
Investing cash flows from continuing operations include the cash outflows to fund the construction of the Beaumont New Ammonia project in 2025 of USD 628.6 million versus USD 155.3 million in 2024 post the completion of the sale;
Investing cash flows from continuing operations also included capital expenditure of USD 120.2 million in 2025, compared to USD 76.3 million in 2024, and proceeds from sale of associate of USD 44.4 million in 2025;
Net cash used in investing activities by discontinued operations was USD 84.3 million during in 2025, compared to USD 571.8 million in 2024, a decrease of USD 487.5 million. The decrease is due to the successful divestment of IFCo, Beaumont New Ammonia and Fertiglobe in 2024, and the Methanol business in 2025, therefore a smaller scope of discontinued operations in 2025;
Cash flows from financing activities
Cash used in financing activities in 2025 totalled USD 2,407.1 million (2024: USD 6,130.6 million), which mainly consisted of distributions paid to owners of the company, repayment of the 2033 bonds, changes in OCIN's inventory financing and net cash used in financing activities in relation to discontinued operations;
In 2025, distributions paid to owners of the company amounted to of USD 1,698.1 million including withholding taxes (2024: 3,229.1 million);
Repayments of borrowings totalled USD 776.7 million in 2025, mainly relating to the tender of the 2033 bonds at 110.75% of par. The repayment amount was USD 664.5 million;
Proceeds from borrowings in 2025 totalled USD 98.2 million, which primarily consisted of changes in OCIN's inventory financing;
Net cash used in financing activities by discontinued operations was USD 6.5 million in 2025, compared to USD 1,178.5 million in 2024, a decrease of USD 1,172.0 million. The decrease year-over-year is due to the sale of IFCo in 2024, which had its own financing structure.
Net debt as at 31 December
Net debt: entities not classified as held for sale
$ million | 31 December 2025 | 31 December 2024 |
|---|---|---|
Short-term interest-bearing debt | 62.0 | 682.1 |
Gross interest-bearing debt | 62.0 | 682.1 |
Cash and cash equivalents | (17.9) | (2,052.9) |
Net cash | 44.1 | (1,370.8) |
Gross interest-bearing debt - entities not classified as held for sale
Total gross interest-bearing debt for entities not classified as held for sale decreased by USD 620.1 million, which consisted of the tender of the 2033 bonds, and changes in the outstanding amounts of inventory financing facilities within the Group.
Cash and cash equivalents - entities not classified as held for sale
Cash and cash equivalents for entities not classified as held for sale decreased by USD 2,035.0 million, mainly due to distributions paid to owners of the Company, the tender of the 2033 bonds, funding of the Beaumont New Ammonia project, offset by the cash inflows from the sale of the Methanol business.
Net debt/cash - entities not classified as held for sale
Total net debt for entities not classified as held for sale stood at USD 44.1 million as of 31 December 2025, from net cash of USD 1,370.8 million as of 31 December 2024.
Market review
Total operations
'000 metric tons | 2025 | 20241 |
|---|---|---|
Own Product | ||
Ammonia | 462.9 | 751.9 |
Calcium Ammonium Nitrate (CAN) | 1,133.4 | 1,041.1 |
Urea Ammonium Nitrate (UAN) | 332.5 | 318.5 |
Total Fertilizer | 1,928.8 | 2,111.5 |
Melamine | 62.9 | 99.8 |
DEF / AdBlue | 197.0 | 99.0 |
Total Nitrogen Products | 2,188.7 | 2,310.3 |
Methanol2 | 664.9 | 1,320.1 |
Total Own Product Sold | 2,853.6 | 3,630.4 |
Traded third Party | ||
Ammonia | 174.7 | 96.2 |
UAN | 6.4 | 7.9 |
Methanol | 201.8 | 452.5 |
Ethanol & other | 7.7 | 95.9 |
AS | 92.1 | 120.0 |
Total Traded Third Party | 482.7 | 772.5 |
Total Own Product and Traded Third Party | 3,336.3 | 4,402.9 |
- Excludes entities that were disposed in 2024.
- Including OCI's 50% share of Natgasoline volumes
Continuing operations
'000 metric tons | 2025 | 2024 |
|---|---|---|
Own Product | ||
Ammonia | 322.6 | 408.9 |
Calcium Ammonium Nitrate (CAN) | 1,133.4 | 1,041.1 |
Urea Ammonium Nitrate (UAN) | 332.5 | 318.5 |
Total Fertilizer | 1,788.5 | 1,768.5 |
Melamine | 62.9 | 99.8 |
DEF / AdBlue | 197.0 | 99.0 |
Total Nitrogen Products | 2,048.4 | 1,967.3 |
Total Own Product Sold | 2,048.4 | 1,967.3 |
Traded third Party | ||
Ammonia | 172.7 | 96.2 |
UAN | 6.4 | 7.9 |
AS | 92.1 | 120.0 |
Total Traded Third Party | 271.2 | 224.1 |
Total Own Product and Traded Third Party | 2,319.6 | 2,191.4 |
Ammonia
Northwest Europe ammonia prices increased to an average $612/t in H2 2025, a 6% increase year-over-year compared to the average in H2 2024, and a 20% increase compared to H1-2025, driven by supply issues in Trinidad and the Middle East, and delays to new capacity in the United States.
Introduction of the European Union's CBAM: CBAM entered its definitive phase on 1 January 2026, creating an even playing field for EU producers, as importers face a similar cost structure to the EU ETS.
Nitrates
Benchmark urea prices increased by 20% in Q4 2025 compared to Q4 2024, supported by CBAM driving strong demand. CAN and UAN prices increased 14% and 29% year-over-year in H2 2025 to an average of €332/t and €338/t respectively compared to the averages in H2 2024, and were relatively flat compared to H1 2025 (-1% and +4% change respectively).
The EU saw price support for nitrates due to the European Commissions’ progressive import tariffs on Russian and Belarusian Nitrogen Fertilizers. An investigation into an Import quota on Russian Ammonia and an additional Anti-Dumping Duty on Russian urea are currently also underway, and the EU renewed anti-dumping duties on UAN from the US, Trinidad, and Russia in 2026.
Outlook
Subsequent to year-end, geopolitical developments in the Middle East have created a volatile and uncertain market backdrop and have led to a significant increase in European natural gas prices, resulting in materially higher production costs for nitrogen producers.
While fertilizer prices, including nitrates, have also increased, and AdBlue prices are tracking urea, there is typically a timing lag between changes in feedstock costs and realized selling prices. Given the rapidly evolving situation, visibility on the duration of elevated gas prices and the sustainability of higher fertilizer pricing remains limited.
Notwithstanding these recent events, the European chemical sector overall continues to face structural challenges driven by increased regulatory pressure, sustained high energy costs, and declining competitiveness. These conditions have threatened the viability of higher-cost domestic ammonia production and led to curtailments of European capacity.
OCI’s nitrogen facility in the Netherlands is a high-quality, strategically critical asset within the European nitrogen supply chain, and well-positioned relative to peers. Steadfast investments in the past years have resulted in a top quartile cost position, and OCIN's increasingly diversified downstream portfolio of premium nitrogen products of nitrates, low-carbon CAN, AdBlue and melamine, together with a preserved flexibility to import ammonia through a dedicated throughput agreement following the sale of the terminal in Rotterdam continue to provide a certain degree of protection against headwinds arising from volatile natural gas and commodity markets.
This is further supported by evolving regulatory measures including the introduction of the EU Carbon Border Adjustment Mechanism (CBAM) in 2026 and renewed anti-dumping duties. Ongoing international policy developments, including potential revisions to CBAM, the EU Emissions Trading System, and international tariffs (MFN, USA), contribute to broader cross-regulatory uncertainty in the fertilizers market and may influence atypical purchasing.
4 Risk Management
Enterprise risk management and internal controls
Our businesses inherently involve risks. Our management is aware of these risks and takes a measured mitigation approach. Our Board and management foster a transparent companywide process for risk management and internal controls. This is driven by our conviction that risk management is most effective when it is aligned with our strategy and integrated at all management levels. Our risk management therefore is as dynamic as the industry and environments in which we operate.
Our approach to Risk Management
Enterprise risk management (ERM) framework
Risk management is a companywide activity with roles and responsibilities allocated across all levels of the group to secure our in-control position. Our risk management approach is aligned with the Committee of Sponsoring Organizations of the Treadway Commission (COSO) ERM framework. Equipped with updated insights from the market, industry, and geopolitics, we follow a bottom-up and top-down approach to ensure all relevant business risks are identified, managed, and reported in a timely and comprehensive manner.
Each quarter, executive management together with key stakeholders, monitors and assesses the consolidated group risk profile comprising of strategic, operational, financial and compliance risks. The Internal Audit & Risk team assists the Audit Committee, Executive Committee, senior management, and local management by facilitating risk identification and promoting risk awareness and ownership across our organization.
Annually, we assess the effectiveness of our internal risk management and control systems in relation to operational, compliance and reporting risks. Based on this self-assessment, the Internal Audit & Risk Team provides reasonable assurance to the Audit Committee that this risk management approach is well designed and works effectively throughout the year. In the financial year 2025, the results of our assessment were discussed with the Audit Committee, and the assessment did not identify any major failings, changes, or improvements to OCI's internal risk management and control systems.
The Board has the overall responsibility for maintaining a sound and effective risk management and internal control program. The Audit Committee supports the Board in monitoring our risk exposure, including the design and effectiveness of our internal control program. While every OCI employee is responsible for managing risk within his or her own area of activity, the Executive Committee – and particularly the CFO − oversees the Group-wide risk policy and leads the effort in mitigating all types of risks.
Internal control framework (ICF)
The Internal Audit & Risk team is managed at the Group level and works across all operating companies. This ensures our ICF is properly institutionalized and applied, and we are continuously aligned with our independent auditors.
Our ICF is aligned with the Internal Control Integrated Framework of the COSO and the Dutch Corporate Governance Code. It is designed to provide reasonable assurance that the risks we face are properly evaluated and mitigated, and that management is provided with all the information necessary to make informed decisions.
Our Internal Audit & Risk team performs fraud risk assessments across the organization which are built into our ERM, ICF and Internal Audit activities. Our fraud risk assessments include the identification of internal controls that mitigate fraud risks.
The EU’s Corporate Sustainability Reporting Directive (CSRD) came into effect on 1 January 2024 and management, with the support of the Internal Audit & Risk team, is implementing the internal control framework to incorporate the necessary sustainability controls. The CSRD (which mandates the use of the ESRS) is expected to be transposed into Dutch national law in 2026, and we have chosen to comply voluntarily.
Our ERM and ICF systems are designed to proactively identify, monitor, mitigate, and manage risks
OPERATING COMPANIES | CORPORATE MANAGEMENT | INTERNAL AUDIT & RISK | BOARD OVERSIGHT | |
|---|---|---|---|---|
Key responsibilities |
|
|
|
|
Review and reporting processes |
|
|
|
|
Our key business risks and management’s assessment of potential risk development
Our risk appetite is designed to adapt to changes in our strategic priorities. It is split into four main categories. These categories support our ability to mitigate our risks and protect OCI's ability to create sustainable long-term value.
STRATEGIC | OPERATIONAL | FINANCIAL | REGULATORY |
|---|---|---|---|
Risks that may impede our ability to achieve strategic objectives that we believe are critical to our performance and shareholders' value. These are risks that are considered strategic matters for the Board and Executive Committee and may impact the company. | Risks that may impede our ability to achieve operational objectives and performance. These risks can be internal or external and are typically directly managed and monitored by the local management teams of each operating company and supervised by our Executive Committee. | Risks related to financial, accounting, and reporting controls and processes that may impede our ability to meet financial commitments, obligations, and daily operating needs. | Risks related to non-compliance with, or changes in, laws and regulations that may require changes in the way we do business. |
Risk appetite | Risk appetite | Risk appetite | Risk appetite |
Strategic risks


Risk | Risk trend | Risk appetite | Description | Risk management approach |
|---|---|---|---|---|
DIVESTMENT OF STRATEGIC ASSETS |  | Low | As part of the 2024 sale of Fertiglobe and Beaumont New Ammonia, there are certain indemnities and deferred contingent considerations that, if triggered, could reduce the remaining cash proceeds received from these sales. Subsequent to year‑end 2025, OCI has completed the divestment of its previously announced strategic assets, including the formal handover of the Beaumont New Ammonia facility to Woodside and the sale of OCI Ammonia Holding B.V. to AGROFERT. The deferred consideration has been received, and only post‑closing obligations and indemnities remain, as disclosed under Provisions and Discontinued operations and assets & liabilities held for sale. Following these divestments, OCI’s smaller operational footprint increases exposure to market concentration risks, including potential impacts from single‑plant outages and elevated European natural gas prices, which may affect the resilience of the remaining assets. | Residual post‑closing obligations and indemnities related to the completed divestments are being managed by a cross‑organizational group with significant experience in M&A, legal, compliance, and divestiture processes, ensuring these exposures remain contained and are addressed in line with contractual requirements. Market concentration risks are mitigated through active commercial and operational planning, as well as the broader measures outlined under “Changes to conditions affecting our markets and commodities” (page ). |
STRATEGIC DECISION-MAKING CONSTRAINTS |  | Low | OCI is in the final stages of its strategic review, with most divestments completed and multiple strategic pathways available for the remaining business. These options include, among others, a potential sale of the remaining business to Orascom Construction previously announced by the Company. The governance measures introduced by the Enterprise Chamber on 19 January 2026, including the appointment of two interim independent non‑executive directors with specific oversight responsibilities, may extend decision‑making timelines for certain strategic options. Longer regulatory or governance timelines may limit OCI’s ability to respond swiftly to changing market and valuation conditions, reduce flexibility to execute on potential strategic scenarios, and delay access to time‑sensitive investment or partnership opportunities. In addition, certain reserved‑matter provisions under the Purchase and Sale Agreement with Orascom Construction may limit OCI’s ability to take specific decisions independently while the strategic review remains ongoing, potentially further extending decision‑making timelines. | While proceedings before the Enterprise Chamber remain ongoing, the Board of Directors continues to evaluate the strategic options available to OCI. In parallel, OCI maintains active scenario planning across all viable pathways and closely monitors market conditions, valuation parameters, regulatory developments, and legal considerations. By preparing for multiple potential outcomes, OCI preserves strategic optionality and remains ready to advance the most beneficial path. |
Operational risks
Risk | Risk trend | Risk appetite | Description | Risk management approach |
|---|---|---|---|---|
CHANGES TO CONDITIONS AFFECTING OUR MARKETS AND COMMODITIES | | Moderate | Our products are global commodities whose supply-demand dynamics can be affected by global trends such as population growth (which impacts demand for food), swings in crop and agricultural prices, and global production capacity. The price volatility of raw materials, particularly natural gas, can impact our profitability and production. The price of natural gas can be impacted by increased demand, global weather patterns, country sanctions and restrictions, and supply deterioration. Recent geopolitical developments in the Middle East have added to volatility in European natural gas and LNG markets, driven by increased risk premiums and uncertainty in global energy supply chains. This volatility was further amplified by a sharp increase in European natural gas prices, which significantly raised production costs for nitrogen producers and contributed to elevated uncertainty in energy markets. | Our product mix is exposed to a variety of cyclical and seasonal patterns which mitigates the impact of fluctuations in individual products and contributes to a more stable revenue stream. We continuously evaluate our price exposure and have hedged our raw material feedstock positions where appropriate, in line with our risk appetite and our assessment of underlying market factors. We have policies in place to respond to competitive dynamics and maintain mutually beneficial relationships with key customers. Our sales, marketing, distribution, and logistics teams work diligently to expand our sales channels, strengthen customer relationships, negotiate favorable contracts and stay closely connected to market developments through targeted commercial engagement. Our manufacturing teams ensure that our plants operate efficiently and reliably to produce high-quality products that meet or exceed international standards. In terms of the availability and cost of natural gas, our key feedstock, we assess hedging opportunities through a mix of long-term contracts and financial derivatives in the Netherlands. Currently, less than 2% of our volume is hedged, reflecting our approved risk‑management strategy and the structural characteristics of our commercial arrangements. |
BUSINESS INTERRUPTION AND PRODUCTION | | Low | Our production facilities may experience unplanned shutdowns or utilization rate reductions due to equipment failures or safety incidents, which may result in lost volumes, unplanned costs, investigations and potential fines. Examples of our risk exposure include insufficient reliability and maintenance programs, poor management of major turnarounds, and major safety incidents. Recent production outages have highlighted the importance of maintaining robust reliability and maintenance programs to mitigate unexpected disruptions. | We have consistently invested in advanced technologies at our facilities, which maximizes reliability and efficiency. We have made significant investments in our facilities to refurbish, debottleneck, and improve efficiency, reliability, and safety. We have a well-developed preventative maintenance system. This includes scheduled maintenance turnarounds, frequent follow-ups on action items from previous shutdowns including comprehensive training programs for our plant employees. We maintain adequate spare parts positions and winterization procedures (where appropriate) as well as reliability initiatives where required. We perform third-party expert audits on plant reliability and pre-turnaround audits. Our plants have Business Continuity plans to respond to adverse events, and for large and extended shutdowns, our plants have business interruption insurance. Our goal is reliable and safe plant operation. As such, we investigate all major safety incidents and actively implement all key recommendations generally through capital projects, updated processes or procedures, and/or trainings. |
Risk | Risk trend | Risk appetite | Description | Risk management approach |
|---|---|---|---|---|
BUSINESS CONTINUITY DUE TO HEADCOUNT REDUCTIONS | | Low | Our ability to execute our strategic goals depends heavily on our ability to retain competent, experienced and engaged employees. Prolonged organizational uncertainty and extended transition timelines may heighten pressure on key personnel, increasing the risk of turnover in critical roles. This could disrupt continuity in essential operations and place additional strain on remaining staff as they manage higher workloads and ongoing change initiatives. | We have been able to retain knowledgeable and experienced employees thanks to our reputation and effective retention incentives. The success of our company depends on positive employee relationships across diverse backgrounds. We continue to foster a positive and respectful working environment and equal opportunity workplace, through our expanded diversity and inclusion program, code of conduct training, tuition reimbursement and employee engagement. We also provide training for our employees, to raise awareness on these topics. We continue to maintain employee succession plans for key positions across the group to ensure effective knowledge transfer in support of our strategic goals. |
CYBERSECURITY AND IT SECURITY & GOVERNANCE | | Low | Despite our IT security measures, our information technology and infrastructure may be vulnerable to cyber-attacks or breaches. Any such breach could result in business disruption or compromise our systems and result in downtime or a leak of personal and/or business sensitive data adversely affecting our reputation. We are highly dependent on our ERP to manage our business. New or emerging cybersecurity risks and segregation of duties exposures, may hinder our ability to achieve all benefits and business synergies from our ERP. | We recognize that cybersecurity threats pose a significant risk to our operations, data integrity, and stakeholder trust. To address these risks, we continuously assess and update our security controls and defense strategies to strengthen our security posture and minimize our vulnerabilities to cyber-attacks. Our policies and procedures govern amongst others, user access and segregation of duties, and compliance with these controls is actively monitored and improved. Our IT team focuses on safeguarding both our IT infrastructure and Operational Technology environments. The team continuously assesses our segregation of duties and user access provisioning to ensure that significant IT issues, risks, or deficiencies have been adequately addressed through mitigating procedures. We complement internal capabilities with external expertise to implement action plans under our comprehensive cybersecurity management system. This includes regular internal and external security assessments, IT audits, and continuous improvement initiatives to maintain acceptable risk levels. In addition, we maintain a group-wide cyber insurance program as part of our broader resilience strategy, ensuring financial protection while continuing to evolve and strengthen our defenses against emerging threats. In line with the EU NIS2 Directive, we have taken compliance preparedness as an opportunity to further enhance this approach—reinforcing governance frameworks, improving incident response capabilities, and ensuring robust protection of critical systems and data across all environments. We also employ artificial intelligence (AI) in a limited and controlled capacity to enhance productivity, support day-to-day activities, and improve the quality and speed of our work. To ensure responsible use of these tools and to effectively mitigate associated risks, we have established a structured, multi-layered approach to data protection, system security, and governance oversight. |
Risk | Risk trend | Risk appetite | Description | Risk management approach |
|---|---|---|---|---|
ABILITY TO MAINTAIN OUR HEALTH, SAFETY AND ENVIRONMENT | | Low | Securing safe and healthy working conditions is our highest priority. Our production sites are large industrial plants, and many of our raw materials are classified as substances that are dangerous and health hazardous. Such a working environment contains potential occupational health risks, as well as process and occupational safety risks to employees and contractors working on site. | We minimize exposure to conditions that could negatively affect health, security, and safety. Furthermore, we minimize the probability and consequences of process safety and product safety accidents negatively affecting people, the environment, and our assets. We promote high standards of environmental responsibility by limiting incidents that cause environmental damage. Our OCIN facility maintains ISO Certification. We implement strict HSE training and operating discipline at every plant to minimize HSE risks, and we closely monitor our plants through regular management site visits and HSE audits, in addition to comprehensive knowledge sharing across the group. Our safety and emissions records meet or exceed international standards, underscoring our commitment to providing our employees with a safe, secure, and environmentally conscious workplace. We actively monitor our material sustainability topics by undertaking an annual risk assessment to identify KPIs of strategic importance. These KPIs are tracked closely by senior management and presented in our sustainability statement. |
MAJOR COUNTERPARTY SHUTDOWNS | | Low | The European chemical sector continues to face structural challenges driven by increased regulatory pressure, sustained high energy costs, and declining competitiveness. These conditions have led several industry participants to reduce production or shut down operations at specific sites. At the Chemelot industrial cluster, the site of OCIN’s operations, this includes the cessation of operations by Fibrant B.V. and the announced closure of activities by service providers such as Cedo. These developments contribute to a contraction of the industrial ecosystem, increasing the risk of counterparty disruption, including reduced availability of critical services, operational interruptions, or financial distress among counterparties. Given the interconnected nature of the Chemelot cluster, disruptions affecting one participant can have cascading effects on others, potentially leading to higher operating costs and reduced operational flexibility. Additionally, credit limits in our securitization program are being reduced, making it more difficult to secure credit insurance and increasing counterparty‑default risk. | We continuously explore alternative customer options for our ammonia volumes, which remains readily sellable in a globally traded commodity market. In parallel, we closely monitor the financial health of counterparties affected by site shutdowns and when early‑warning indicators signal increased risk we apply additional mitigation measures such as adjusted credit terms or revised commercial arrangements. |
Regulatory risks
Risk | Risk trend | Risk appetite | Description | Risk management approach |
|---|---|---|---|---|
CHANGES IN REGULATORY CONDITIONS IN THE MARKETS IN WHICH WE OPERATE | | Low | Changes in laws, regulations and the related interpretations may alter the environment in which we do business. This includes changes in governance, health and safety, competition and product-related laws and regulations, as well as changes in accounting standards and taxation requirements. This also includes the impact of proposed climate change related regulations at both international and national levels. Key examples: the European Union’s proposed carbon dioxide reduction targets, more stringent regulations in verifying sustainability and greenhouse gas emissions, the carbon border adjustment mechanism (“CBAM”) and the potential EU restrictions on nitrogen fertilizer application. Failure to comply with these laws may result in substantial fines, penalties, or other sanctions such as the obligation to invest in newer equipment, permit revocations or facility shutdowns. Consequently, we may experience delays in obtaining or be unable to obtain, required permits. This may delay or interrupt our operations. In addition, global geopolitics has created uncertainty around tariff implementation in key markets, which may affect product or feedstock pricing (e.g. threat of elevated tariffs by the Trump administration). Our ability to manage regulatory, tax and legal matters and to resolve pending matters within current estimates may impact our results. Currently, the CBAM assesses imports with equivalent carbon costs to create a level playing field for EU companies and to prevent carbon leakage. The EU is considering suspending or removing the CBAM for specific products, specifically fertilizers, which would negatively impact OCI’s business. | We actively monitor regulatory developments to ensure we comply with the laws and regulations of the countries in which we operate, including climate and HSE legislation. Additionally, we provide comments and feedback regarding proposed or draft rules, specifically when draft rules are open for public comments. In 2025, we continued our work with state governments, politicians and authorities in the Netherlands to advance our business objectives. We have continued our participation in the Tailormade Agreement program from the Dutch government, with the intention to accelerate the reduction of industrial CO2 emissions from our Dutch operations and discuss tailored government support on matters such as regulatory hurdles to achieve that acceleration. We continue to closely monitor and maintain flexibility to change trade flows that minimize tariffs and optimize regulatory developments while continuing to comply with regulations. |
5 Corporate Governance
Co-Chair's introduction
2025 marked the culmination of the strategic review, which the Board of Directors approved and oversaw over the last three years. As a result of this journey, and with the most recent sale of OAH to AGROFERT, OCI successfully divested the vast majority of its ammonia, nitrogen fertilizers, and methanol assets, contributing to shareholder distributions of approximately USD 7 billion to shareholders over the past four years.
In line with our commitment to exploring all available options to the company, in September 2025, the Board of Directors was presented with the opportunity to establish a global infrastructure and investment platform through a potential sale of its remaining business to Orascom Construction. This transaction was agreed with Orascom Construction on 9 December 2025 and closing was subject to, inter alia, OCI shareholder approval for which an extraordinary meeting of shareholders was scheduled on 22 January 2026.
The proposed transaction is currently paused, pending further evaluation by the Board, including two newly appointed independent directors as per the Enterprise Chamber of the Amsterdam Court of Appeal’s decision in January 2026.
Notwithstanding the strategic activity, the Board of Directors also continued to focus on effectively running OCI’s operations and supervising key initiatives and projects, including:
Ensuring OCIN continues to focus on safe and reliable operations and commercial excellence while streamlining the company structure to effectuate the sale of OAH;
The successful completion and delivery of Beaumont New Ammonia to Woodside;
Continuing to right-size the company’s corporate cost base while retaining key personnel during the transition;
Strengthening of OCI’s capital allocation and debt repayments;
Ensuring CSRD compliance.
For the year ended 31 December 2025, the Board reports the following:
The Board has reviewed and discussed the audited financial statements and sustainability statement for the year 2025.
The Board has discussed with the independent auditor the outcomes of their audit with reasonable assurance of the financial statements in accordance with International Standards on Auditing and limited assurance on the sustainability statement in accordance with International Standards on Assurance Engagements.
The Board has received written confirmation of the independent auditor's independence.
Based on the review and discussions referred to above, the Board has approved that the audited consolidated and parent company financial statements and sustainability statement be included in this Annual Report.
The Board recommends that the General Meeting of Shareholders adopts the 2025 financial statements included in this Annual Report and looks forward to overseeing the activities of OCI in 2026.
Michael Bennett
Co-Chair
10 April 2026
Board report
OCI N.V. (OCI Global) is a public limited liability company (naamloze vennootschap) established under the laws of the Netherlands, with its official seat in Amsterdam, the Netherlands. Its shares are listed on the Amsterdam stock exchange, Euronext Amsterdam.
Governance framework
Introduction
OCI Global is committed to the principles of good corporate governance and has implemented a robust governance structure. The Board believes that good corporate governance practices align the interests of all stakeholders by having structures in place that ensure the business is managed with integrity and efficiency, which maximizes the Company's profitability and sustainable long-term value creation.
Organizational structure
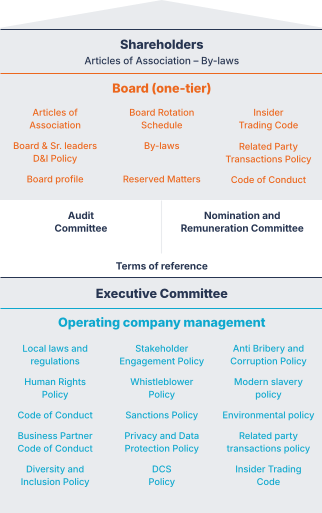
The Board sets the strategic mandate with operational, financial, and sustainability goals related to management.
The Executive Committee manages the achievement of these goals and the day-to-day operations. In executing the goals, the Executive Committee is supported by (and collaborates with) expert teams, several corporate functions, plus operating companies and their teams. Each operating company is led by a managing director and a finance director who report to the Executive Committee.
Governance structure
OCI Global has designed its corporate governance structure in compliance with its articles of association, by-laws, the requirements of the Dutch civil code, the applicable Dutch corporate governance code (hereafter "the Code"), the applicable securities laws, rules and regulations of the Amsterdam stock exchange and international best practices. All governance and compliance policies and procedures are available on our website under Corporate Governance. Please refer to page for the Sustainability Governance Framework.
The Board of Directors and Executive Committee
OCI Global is managed by a one-tier Board comprised of an Executive Director and Non-Executive Directors. The Board maintains two committees as part of its supervisory role: the Audit Committee (AC) and the Nomination and Remuneration Committee (N&RC). In connection with the strategic review and recent divestments, the Health, Safety and Environment & Sustainability Committee (HSE&SC) has been dissolved in May 2025, and handed its responsibilities to the Executive Committee reporting into the Board.
A special Board Committee (Transaction Committee) was established in May 2025 to prepare the decision making of the Board with regard to a potential sale of the remaining business to Orascom Construction. The Transaction Committee comprises of the following two independent Non-Executive Directors: Mr Van de Kraats and Mr Fraser. In addition, the Board concluded that Mr. Sawiris has a conflict of interest with the Company in relation to the potential sale of the remaining business to Orascom Construction and has tasked Mr. Van de Kraats with the duties and powers that Mr. Sawiris could not perform due to this conflict of interest, or that he should otherwise refrain from performing in view of his conflict of interest. Mr. Van de Kraats has in such capacity been appointed as Chair of the Transaction Committee.
The Board is collectively responsible for OCI’s management and strategy. The Board promotes a culture of openness and accountability within the Board and across the entire organization. The tasks, responsibilities and procedures of the Board are set out in OCI’s by-laws, which are available on our website.
The Board has delegated the operational management of the business to the Executive Committee, apart from certain reserved matters as set out in OCI’s articles of association, by-laws and a Board resolution regarding delegation of authorities and reserved matters.
Further details about the Board can be found in the Board profile section in this Annual Report.
The Board is authorized to represent OCI Global. In addition, the Co-Chair of the Board, the Executive Chair, and the members of the Executive Committee are authorized to solely represent OCI Global.
OCI Global has a Group Delegation of Internal Authority Policy in place in which the authority is delegated to management to internally approve commitments that relate to daily management and operations of the Company and its group entities. It governs which internal approvals are required for which actions leading to an efficient yet controlled process. Checks and balances have been set by implementing three authorizing steps for entering into external commitments; consisting of consultation, internal approval and a dual signing authority of two people who commit in the name of OCI Global group entities.
Executive Committee
The Executive Committee is charged with the day-to-day management of OCI Global. The Executive Committee members report to the Executive Chair and the members are responsible for the continuity of OCI. The EC's mandate is to pursue the strategies set by the Board, to optimize OCI's business, and create a culture that contributes to sustainable long-term value creation for the remaining operations. Each Executive Committee member has an individual responsibility for certain business segments, functional areas, projects and tasks.
The Executive Committee is comprised of the following members:
Hassan Badrawi, with title Chief Executive Officer, born in 1976, Egyptian/ British
Beshoy Guirguis, with title Chief Financial Officer, born in 1985, Egyptian/ Canadian
Maud de Vries, with title Chief Legal and Human Capital officer, born in 1972, Dutch
Non-Executive Directors
The role of the Non-Executive Directors is supervisory in nature. The Non-Executive Directors supervise the general course of affairs at the Company and its business. These responsibilities include safeguarding:
The interests of all stakeholders.
That OCI fosters a culture aimed at sustainable long-term value creation for its remaining business.
The effectiveness of the internal risk management and control systems.
The establishment and maintenance of internal procedures to ensure that all relevant information is provided to the Board in a timely fashion.
Stakeholder engagement.
During 2025, the Board was composed of nine Non-Executive Directors: Mr. Michael Bennett, Mr. Sipko Schat (retired 21 May 2025), Mr. Robert Jan van de Kraats, Mr. Gregory Heckman, Ms. Anja Montijn-Groenewoud (retired 21 May 2025), Mr. David Welch, Mr. Dod Fraser, Ms. Heike van de Kerkhof (retired 21 May 2025) and Ms. Nadia Sawiris. Mr. Michael Bennett is the Co-Chair and Senior Independent Non-Executive Director and Mr. Robert Jan van de Kraats is the Vice-Chair and Independent Non-Executive Director. Further details about the Non-Executive Directors can be found in the Board profile section of this Annual Report.
The Co-Chair is primarily responsible for the functioning of the Board and its Committees. Together with the Company Secretary, the Co-Chair sets the agenda for Board meetings and leads an induction program for new Directors tailored to their respective needs, applicable laws and regulations. The Vice-Chair acts as the contact for shareholders and other stakeholders of the Company with respect to concerns which have not been resolved through the normal channels of the Co-Chair, the Executive Chair or the Executive Committee members.
Appointment of Directors
In 2025 the Board evaluated its composition in response to OCI's ongoing strategic transformation and the resized organization and decided to reduce the number of Non-Executive Directors from nine to six.
During the AGM on 21 May 2025, Mr. Sipko Schat, after a tenure of 12 years, Ms. Anja Montijn-Groenewoud, after a tenure of 9 years, and Ms. Heike van de Kerkhof, after a tenure of 5 years, resigned from their respective positions. All other Directors were reappointed for a one-year term. Mr. Michael Bennett was reappointed as Non-Executive Director in accordance with the nomination by the Board for a period of one year beyond the 12-year maximum term set out as best practice in the Code. The reason for his reappointment was his wide range of knowledge and experience in the nitrogen and methanol industries, internationally and specifically in the United States, and his specific knowledge and invaluable experience of the Company's business and operations developed over the term of his tenure. On 22 January 2026, the Enterprise Chamber of the Amsterdam Court of Appeal appointed two non-executive directors to OCI’s board, Mr. J.F. Breek and Mr. C.M. Molhuysen. This brings the total number of Non-Executive Directors to eight.
Board rotation schedule
OCI has implemented a one-year appointment term for both Executive and Non-Executive Directors, and OCI’s rotation schedule as included in the table below aims to avoid, as far as possible, a situation in which Directors retire at the same time.
Board composition and independence
The composition of the Board arms OCI with leadership that is diverse in skills, experience, nationality, age, gender and background, thereby maximizing the Board’s ability to independently and critically act without emphasis on particular interests.
The Board maintains autonomy by ensuring the majority of the Non-Executive Directors, including the Co-Chair of the Board, is independent. Currently the majority – five of the six Non-Executive Directors, which is 83.9% – qualify as independent. Ms. Nadia Sawiris is not considered independent within the meaning of the Code.
The Board’s composition, independence, competencies, and qualifications are detailed in the Board Profile and the Board, Executive Committee and Senior Leaders Diversity & Inclusion Policy that can both be found on our website. The Board Profile is assessed annually, taking into account the required competencies and expertise required for OCI’s mission and strategic priorities, opportunities and threats. Appointments of new Board members are made based on objective selection criteria highlighting the specific skills and experience needed to ensure a balanced Board composition and to match the overall Board profile.
Diversity & inclusion
The Board recognizes diversity and inclusion at all levels throughout the organization and within its Board and considers it important in providing a range of perspectives, approach, insights and challenge needed to support judicious decision-making and achieving meaningful discussions. Inclusion fosters a sense of belonging for all of us, and allows us to seek deeper connections with our colleagues, customers, suppliers, shareholders, local communities, and other stakeholder parties.
The Board of OCI N.V., advised by the Nomination and Remuneration Committee, is accountable for reviewing and updating a Diversity and Inclusion Policy for the Board, Executive Committee and senior leaders. The policy applies to the Board, Executive Committee, and senior leaders of OCI N.V. and its majority-owned subsidiaries, and minority-owned entities, which are invited to adopt the policy voluntarily, and establishes a framework for promoting diversity and inclusion at the most senior levels of OCI, including the Board, Executive Committee, and senior leaders, focusing on diverse skills, experiences, and perspectives, setting diversity ambitions, and fostering an inclusive workplace culture worldwide. It aligns with legal diversity requirements under Dutch law and other applicable regulations. The policy is published on our website and is reported on annually in the corporate governance section of the Annual Report.
The Board, upon recommendation of the Nomination and Remuneration Committee, is responsible for the selection of Directors of the Board, and subsequently, putting forward their (re-)appointment to the General Meeting of Shareholders for approval. During the 2025 AGM, the focus was on keeping the required skills, given the transformational phase of the Company. The Board composition will be reevaluated once there is more clarity on the Company’s future direction. The Executive Committee, upon advice from Global HR, is responsible for the selection and appointment of their direct reports and Site Leads.
As of the General Meeting held on May 21, 2025, the composition of the Board in terms of gender diversity is as follows:
Non-Executive Directors: 5 Male (83.33%), 1 Female (16.67%)
Executive Directors: 1 Male (100%); and
Executive Committee: 2 Male (66.67%), 1 Female (33.3%)
Board involvement
The Board interacts with senior management throughout the entire organization and is kept regularly informed about relevant topics by OCI’s senior leaders and experts during Board and Committee meetings, site visits, and also as part of their ongoing professional education.
Board profile
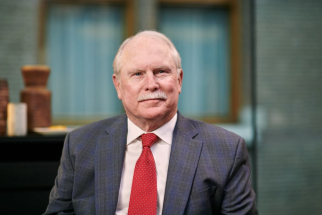 | Michael Bennett | 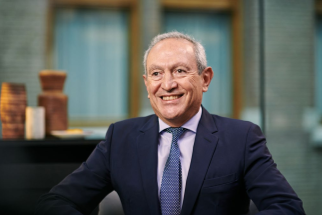 | Nassef Sawiris | |
|---|---|---|---|---|
Year of birth | 1953 | 1961 | ||
Gender | Male | Male | ||
Nationality | American | Egyptian/Belgian | ||
Initial appointment date | January 2013 | January 2013 | ||
Date of last re-appointment | May 2025 | May 2025 | ||
End of current term | 2026 | 2026 | ||
Ordinary shares owned1 | 30,500 | 104,003,478 | ||
Board Committee membership and attendance (prorated to membership)23 | BoD (4/4) | BoD (4/4) | ||
Career and current external appointments | Michael Bennett has 36 years’ experience in the nitrogen industry and is a past Chairman of both The Fertilizer Institute and the Methanol Institute in the United States. He served as the Chief Executive Officer and a Director of Terra Industries Inc., a producer of nitrogen fertilizer products, from 2001 until its acquisition by CF Industries Holdings in April 2010. He also served as Chairman and President for Terra Industries LP, director of Alliant Energy Corporation, and SandRidge Energy and as Board member at Morningside College in Sioux City, Iowa. Mr. Bennett currently serves on several non-profit Boards. | Mr. Sawiris joined the Orascom Group in 1982, became the Chief Executive Officer (CEO) of OCI’s predecessor, Orascom Construction Industries (OCI S.A.E.) in 1998 and was also appointed Chairman of OCI S.A.E. in 2009 until the formation of OCI and remained CEO until 2020. In his capacity of Executive Chair of OCI Global, Mr. Sawiris provides overall strategic leadership. Mr. Sawiris is the Executive Chair of Aston Villa FC, a supervisory director of Adidas AG, a non-executive director of XRG, a member of the J.P. Morgan International Council, a member of Exor N.V. Partners Council, a member of the Cleveland Clinic’s International Leadership Board Executive Committee since 2011, and in 2013 he became a member of the University of Chicago’s Board of Trustees. Mr. Sawiris has previously served on the Boards of BESIX SA, LafargeHolcim Ltd, Orascom Construction Plc, Fertiglobe plc, Joe & the Juice, the Egyptian Exchange and NASDAQ Dubai. Mr. Sawiris holds a BA in Economics from the University of Chicago, USA. | ||
Expertise and experience | ||||
- As at 31 December 2025
- Board and Committees: BoD: Board of Directors, AC: Audit Committee and N&RC: Nomination and Remuneration Committee
- In addition to Board meetings the Board participated in additional Board calls to discuss/approve specific projects
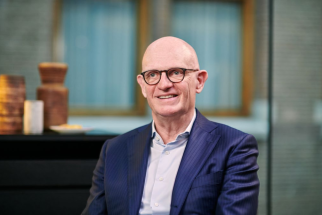 | Robert Jan van de Kraats |  | Gregory Heckman | |
|---|---|---|---|---|
Year of birth | 1960 | 1962 | ||
Gender | Male | Male | ||
Nationality | Dutch | American | ||
Initial appointment date | June 2014 | June 2015 | ||
Date of last re-appointment | May 2025 | May 2025 | ||
End of current term | 2026 | 2026 | ||
Ordinary shares owned1 | 3,725 | 40,000 | ||
Board Committee membership and attendance (prorated to membership)23 | BoD (4/4) | BoD (4/4) | ||
Career and current external appointments | Mr. van de Kraats has over 25 years of experience in (non) executive and financial management, with expertise in risk management. He has held various senior finance and operational positions in the business services, credit insurance and technology sectors. He was CFO and member of the Executive Board of Randstad Holding N.V. from 2001 until 2018 (and its Vice-Chairman since 2006) and Chair of the Board of Directors of TMF-Group until 2023 and Vice Chairman of the Supervisory Board of Schiphol Group until 2024. Mr. Van de Kraats is member of the Supervisory Board of Royal Ahold Delhaize, Director of Randstad Beheer B.V., and Chair of the Supervisory Board of Valcon B.V. and Goldschmeding Foundation. | Mr. Heckman has more than 40 years of experience in the agriculture, energy, and food processing industries. Since 2019, he has been Chief Executive Officer of Bunge Global SA, a leading global agribusiness and food ingredients company. He also serves on the company’s board of directors, a position he has held since October 2018. Before leading Bunge, Mr. Heckman was a Founding Partner of Flatwater Partners and served as the CEO of The Gavilon Group from 2008 to 2015. At Gavilon, he oversaw significant growth in the agriculture and energy sectors, culminating in the sale of the agriculture business to Marubeni Corporation and the energy business to NGL Energy Partners. Prior to that, he held positions as the Chief Operating Officer of ConAgra Foods Commercial Products and President and COO of ConAgra Trade Group. Beyond his executive roles, Mr. Heckman serves as Deputy Chair on the board of the Federal Reserve Bank of St. Louis and the board of FCLT Global. He is also a member of the CEO Council for the NYSE Board Services and actively participates in the Executive Committee of the Chair’s Council for Greater St. Louis, Inc. Mr. Heckman holds a B.S. in agriculture economics and marketing from the University of Illinois at Urbana-Champaign. | ||
Expertise and experience | ||||
- As at 31 December 2025
- Board and Committees: BoD: Board of Directors, AC: Audit Committee and N&RC: Nomination and Remuneration Committee
- In addition to Board meetings the Board participated in additional Board calls to discuss/approve specific projects
 | David Welch |  | Dod Fraser | |
|---|---|---|---|---|
Year of birth | 1953 | 1950 | ||
Gender | Male | Male | ||
Nationality | American | American | ||
Initial appointment date | May 2019 | May 2019 | ||
Date of last re-appointment | May 2025 | May 2025 | ||
End of current term | 2026 | 2026 | ||
Ordinary shares owned1 | 4,131 | 4,000 | ||
Board Committee membership and attendance (prorated to membership)23 | BoD (4/4) | BoD (4/4) | ||
Career and current external appointments | Ambassador Welch served 32 years with the U.S. diplomatic service. When he retired, he was Assistant Secretary of State for Near Eastern Affairs, the senior-most U.S. diplomat for the region. He was Ambassador to Egypt and served in Pakistan, Syria, Jordan, and Saudi Arabia. In 2008, he attained the lifetime rank of Career Ambassador, one of only about 60 diplomats to achieve this designation. From 2009-2019, he was President for International and Government Affairs at Bechtel, responsible for international representation, global security, internal and external communications, and the Washington Office. He was a board member of the Fertiglobe, U.S.-Saudi Business Council, the U.S.-U.A.E. Business Council and the U.S.-Egypt Business Council. Mr. Welch is a member of the Council on Foreign Relations and the American Academy of Diplomacy and serves on several non-profit Boards. | Mr. Fraser brings comprehensive experience in corporate finance, investment banking, and the nitrogen fertilizers and oil and gas industries. Mr. Fraser has held Board positions at OCI GP LLC (the general partner of OCI Beaumont’s previously listed MLP), Smith International, Terra Industries Inc. (now part of CF Industries), Forest Oil Corporation, Subsea 7 S.A. and served as a Non-Executive Chairman of the Board of Rayonier Inc. From 1995 to 2000, Mr. Fraser served as Managing Director and Group Executive, Global Oil and Gas, for Chase Manhattan Bank (now JPMorgan Chase & Co.). From 1978 to 1995, he held various positions of increasing responsibility with Lazard Freres & Co., most recently as General Partner. Mr. Fraser currently serves as a President of consulting firm Sackett Partners since 2000, and he holds a Board positions at Fleet Topco Limited, the private holding company of Argus Media Ltd. Mr. Fraser has also been a trustee of Resources for the Future, a Washington-based environmental policy think-tank. | ||
Expertise and experience | ||||
- As at 31 December 2025
- Board and Committees: BoD: Board of Directors, AC: Audit Committee and N&RC: Nomination and Remuneration Committee
- In addition to Board meetings the Board participated in additional Board calls to discuss/approve specific projects
 | Nadia Sawiris | |
|---|---|---|
Year of birth | 1998 | |
Gender | Female | |
Nationality | American | |
Initial appointment date | May 2023 | |
Date of last re-appointment | May 2025 | |
End of current term | 2026 | |
Ordinary shares owned1 | - | |
Board Committee membership and attendance (prorated to membership)23 | BoD (4/4) | |
Career and current external appointments | Ms. Nadia Sawiris has varied experience in investments and finance across New York, Cairo and London. Ms. Sawiris has experience in commercial real estate investing and most recently held a Business Development and Investor Relations position at Ramp, a leading corporate card company and finance automation platform. Additionally, Ms. Sawiris has experience in the finance sector from venture capital and private equity to investment banking. Ms. Sawiris currently holds the position of Investment Executive at NNS US and she is board member of Joe & The Juice. | |
Expertise and experience | ||
- As at 31 December 2025
- Board and Committees: BoD: Board of Directors, AC: Audit Committee and N&RC: Nomination and Remuneration Committee
- In addition to Board meetings the Board participated in additional Board calls to discuss/approve specific projects
Board summary of skills and experience
Michael | Nassef | Robert Jan | Gregory | David | Dod | Nadia | |
|---|---|---|---|---|---|---|---|
Independent | ● | ● | ● | ● | ● | ||
International business experience | ● | ● | ● | ● | ● | ● | ● |
Commercial/Marketing | ● | ● | ● | ● | ● | ||
HSE | ● | ● | ● | ● | |||
Strategic management | ● | ● | ● | ● | ● | ● | ● |
Financial expertise: banking | ● | ● | ● | ● | |||
Financial expertise: accounting | ● | ● | |||||
Nitrogen/Methanol experience | ● | ● | ● | ● | |||
Emerging Markets experience | ● | ● | ● | ● | ● | ● | |
Tax/Legal/Compliance | ● | ● | ● | ||||
HR & executive compensation | ● | ● | ● | ● | |||
Risk management / Internal Control & Audit | ● | ● | ● | ||||
Government/Regulatory knowledge | ● | ● | ● | ● | ● | ||
Sustainability | ● | ● | ● | ● | ● | ● | |
Change management / Business consolidation | ● | ● | ● | ● | ● | ● | ● |
Technology / IT / Digitization | ● |
2025 Board and Committee meetings
The following paragraphs summarize how the duties of the Board and the Committees were carried out during 2025, including the focus topics that were reviewed, discussed and advised on.
Board
General
In early 2023, the Board launched a strategic review that continued until 2025 with the objective of unlocking and pursuing value creation for OCI’s stakeholders. This resulted in the divestments of Iowa Fertilizer Company to Koch Industries, Fertiglobe to ADNOC, and Beaumont New Ammonia to Woodside. In June 2025, we closed the sale of our global methanol business to Methanex Corporation. In November, we reached an agreement to divest OCI’s ammonia distribution and terminal business to AGROFERT, a significant European nitrogen products manufacturer. The transaction closed on 31 March 2026. In late March 2026, the Beaumont New Ammonia facility has successfully completed performance testing and has now been formally handed over to Woodside, including the transfer of the operations team. We continue to position the remaining OCI Nitrogen business for a strategic transaction in 2026. Notwithstanding this strategic activity, the Board remained focused on matters contributing to sustainable medium- and long-term value creation for the remaining operations and continues to be involved in shaping strategy through regular discussions and focus on supervising medium- to long-term strategic initiatives aligned with OCI’s mission while safeguarding the running of OCI’s remaining operations responsibly and effectively, and executing on its existing decarbonization strategies.
Responsibilities and duties
The Board is entrusted with the management of the Company. In the exercise of their duties, the Directors are guided by the interests of the Company and the business connected with it. Each Director is responsible for the general course of affairs. The Executive Director, together with the members of the Executive Committee are charged with the daily management and are responsible for the continuity of the Company. The Non-Executive Directors are charged with the supervision of the performance of duties by the Executive Director and the Executive Committee as well as the general course of affairs of the Company and the business connected with it.
Based on the by-laws, the Board is charged with the following duties and responsibilities:
Develop strategy toward sustainable long-term value creation while taking into account its effects on people and the environment, and weighing the interests of all stakeholders involved;
Foster a culture aimed at sustainable long-term value creation;
Take responsibility for the internal audit function, identification and analysis of risks associated with the Company’s strategy, and the consequent implementation, maintenance and monitoring of the internal risk management and control systems;
Take responsibility for the financial and sustainability reporting.
Composition
The Board is composed of seven Directors, of whom one is Executive Director (“Executive Chair”) and six are Non-Executive Directors, as set out in the Board profile section on page of this Annual Report.
Meetings held in 2025
The Board shall meet as often as deemed necessary for the proper functioning of the Board and shall meet at least four times a year. Three meetings were held during 2025 and several interim (ad hoc) updates were given, in writing and via calls. The Board also participated in training sessions about CSRD; the Statement on Risk Management (Verklaring Omtrent Risicobeheersing) that aims to increase transparency, accountability, and control in listed companies; regulatory developments and developments and guidelines in the area of executive and Board remuneration and related governance. The Board also visited OCI's corporate office in Amsterdam, The Netherlands. Attendance rates for each Board member can be found in their individual Board profiles, within this Governance section.
Focus topics in 2025
The Board specifically focused on the following topics during 2025:
Strategic review
Operational excellence and safety
Medium- and long-term strategy
Cost optimization initiatives including operational performance and right-sizing of the organisation
Retention of people
Closing of sale of the Methanol business
Sale of OCI Ammonia Holding B.V. to AGROFERT
A potential sale of the remaining business to Orascom Construction
Bondholders’ agreement
Sustainability strategy and performance, and sustainability governance and sustainability growth projects for the ongoing business (including decarbonization and low carbon initiatives)
HSE culture and performance
Diversity and inclusion and D&I policy for Board, Executive Committee and Senior Leadership and the rest of the workforce
Stakeholder engagement
Composition of the Board and governance structure considering the transition of the Company, including Board Committee Composition, dissolution of the HSE&SC and handing over HSE&SC responsibilities to the Executive Committee reporting to the Board
Capital allocation, going concern assessment, cashflow assessment and debt capital structure optimization
Budget and business plan
Quarterly financial statements, trading updates and Annual Report, sustainability reporting and CSRD compliance
Corporate Governance structure and compliance with the Dutch Corporate Governance Code
Dividend strategy and dividend payments
Internal controls and risk management
Cybersecurity and IT
Related party transactions
Board evaluation
General meetings of shareholders
Audit Committee
General
The Audit Committee (AC) is a standing committee of the Board of OCI Global. The Board establishes Terms of Reference for the AC, which describe the role and responsibility of the AC, its composition, and the manner in which it performs its duties. The current Terms of Reference can be found on the OCI website.
Responsibilities and duties
The AC's main role is to inform and advise the Board on how it has used its powers, and of major developments in the area of its responsibilities. The AC reports annually on its activities and its dealings with the independent auditor and presents its deliberations and findings to the Board.
The AC is charged with the following responsibilities and duties:
Assessment of the functioning external auditor, including assessing and evaluating the independent auditor and lead partner;
Supervision of the internal audit function, including reviewing the internal audit function reports and discussing the internal audit function’s responsibilities, budget and staffing;
Supervision of financial reporting and publications, including the Annual Report and the Board report, interim financial statements, the earnings press release and the reports of the independent auditor;
Discuss with the Board the Company's major financial risk exposures and the steps the Board has taken to monitor and control such exposures, including the Company's risk assessment and risk management policies;
Supervision of compliance with legislation and regulations, including obtaining reports from the Executive Directors, the compliance officer, the Director Internal Audit & Risk and the independent Auditor to the effect that the Company and its subsidiaries comply with the applicable legislation and regulations and the internal rules of the Company;
Discuss consequences of legislative and regulatory initiatives with the Board and independent auditor;
Review and discuss financing and finance-related strategies;
Monitor the sustainability reporting process, including risk management, internal control and internal audit regarding sustainability reporting;
Monitor sustainability reporting requirements and review of the Company’s disclosures in the Annual Report, as well as any periodic disclosures on sustainability,
as further set out in the Terms of Reference of the Audit Committee.
Composition
The AC consists of at least three Non-Executive Directors of whom more than half shall be independent within the meaning of Clause 3 of the Board Profile and at least one member shall have competence in accounting or auditing. Currently the AC is composed of the following four Non-Executive Directors:
Mr. Robert Jan van de Kraats (Chair, given his competence in accounting and auditing as per section 2(3) of the Audit Committee Decree 2016);
Mr. Michael Bennett;
Mr. Dod Fraser.
Other interested Non-Executive Directors may attend AC meetings at their discretion.
Meetings held in 2025
The AC shall meet as often, and at least four times a year, as required for a proper functioning of the AC and at least once a year with the independent Auditor without the Executive Directors being present.
The Chair of the AC met with the internal and independent auditor in advance of every AC meeting to ensure that all relevant issues were sufficiently addressed. The head of the internal audit function, the independent Auditor and the CFO attended all AC meetings in 2025. The independent auditor was able to meet with the AC without the presence of management.
Four meetings were held during 2025. Attendance rates for each AC member can be found in their Board profiles in this Governance section.
Focus topics in 2025
Annual Report including the financial statements and non-financial information
Quarterly financials, earnings press releases and trading updates
Closing of sale of the Methanol business and the announced sale of OCI Ammonia Holding B.V., including impact on financial statement presentation, funding, and going concern
Evaluation of Risk Management and Internal Controls including the key risks facing the Group
IT and IT (cyber) security
Audit reports
In-control statement and underlying in-control situation
Evaluation of, and disclosures regarding Related Party Transactions including the proposed sale of the remaining business to Orascom Construction
Capital allocation generally, including dividend plan/strategy, capital repayments and impact on future cashflows
CSRD reporting/compliance
Finance and internal audit organization
Refinancing/net debt reduction
Tax, key developments, tax rates, tax compliance and tax position
Evaluation Group’s Compliance Framework and effectiveness
Financial hedging control framework
Monitoring of material claims and litigation and related impact on the financial statements
Assessment of the functioning of the independent auditor, its appointment, including scope, risk assessment and materiality
Internal Audit Plan and Internal Audit findings
Retention of people
Nomination and Remuneration Committee
General
The Nomination and Remuneration Committee (N&RC) is a standing committee of the Board of OCI Global. The Non-Executive Directors establish the Terms of Reference for the N&RC, which describe the role and responsibility of the N&RC, its composition, and the manner in which it performs its duties. The current Terms of Reference can be found on the OCI website.
Responsibilities and duties
The N&RC informs the Non-Executive Directors about the way it has used its powers and of major developments in the area of its responsibilities and reports its deliberations and findings to the Non-Executive Directors. The N&RC is charged with the following responsibilities and duties:
Nomination
Review composition and size of the Board to ensure continued presence of the expertise, diversity and independence required to lead the Company adequately;
Establish and monitor the rotation and succession planning for the Board and its Committees;
Assess the functioning of individual Directors and the Board as a whole;
Monitor succession planning, talent management and development for senior management in OCI;
Establish and maintain the Company’s Diversity & Inclusion Policy for the Board and Senior Leadership, while overseeing its implementation;
Review the presence, composition and size of the Executive Committee;
Establish and monitor the succession planning for the Executive Committee and make recommendations to the Executive Chair with regard to the (re-) appointment of individual Executive members.
Remuneration
Propose adequate Remuneration Policies for Non-Executive Directors and the Executive Chair to the Board;
Make recommendations to the Board regarding the individual remuneration package of the Executive Chair and each element therein, in particular peer group assessments, performance measures, and corresponding targets and target levels in the short-term incentives (STI) and long-term incentives (LTI) programs for Executive Directors, and performance realization;
Provide advice and recommendations to the Executive Chair regarding the individual remuneration package of the Executive Committee members;
Prepare the Remuneration Report;
On behalf of the Board, engage with shareholders, investors, investor representative bodies, voting agencies, and other stakeholders on the topic of Board remuneration at the Company in its broadest sense, as further set out in the:
Terms of Reference of the Nomination and Remuneration Committee.
More information on the Remuneration Policies for Non-Executive Directors and the Executive Chair and the 2024 Directors’ remuneration can be found in the Remuneration Report beginning on page .
Composition
The N&RC consists of at least three Non-Executive Directors, among which the Senior Independent Director, and of which more than half shall be independent within the meaning of Clause 3 of the Board Profile. Currently the N&RC is composed of five Non-Executive Directors:
Mr. David Welch (Chair);
Mr. Michael Bennett (Senior Independent Director);
Ms. Nadia Sawiris;
Mr. Gregory Heckman.
Other interested Non-Executive Directors may attend the meeting upon choice.
The Chief Executive Officer, the Chief Legal & Human Capital Officer, the Group Human Capital Director and the Global Head of Reward attend the meetings of the N&RC as invitees on a regular basis. As a principle, Executive Directors are not present when their own remuneration is discussed.
Meetings held in 2025
The N&RC shall meet as often, and at least twice a year, as required for a proper functioning of the N&RC. Three meetings were held during 2025. Attendance rates for each N&RC member can be found in their Board profiles in this Governance section.
Focus topics in 2025
Reviewing the Board Committees’ composition and Non-Executive Directors' succession planning;
Reviewing the Non-Executive Directors’ and Executive Directors’ Remuneration Policies;
Reviewing Executive Director's base salary and total remuneration;
Evaluating the Board’s and the Committee’s performance;
Evaluating the performance results and determining the short-term incentive (annual bonus) and the long-term incentives;
Target setting for the 2025 short-term incentive (annual bonus) and the 2025 long-term incentive shares;
Drafting the 2024 Remuneration Report;
Maintaining an ongoing Board remuneration dialogue with the Company’s major investors and proxy advisors, and ensuring appropriate stakeholder management with regard to Board remuneration in general;
Overseeing the implementation of, and adequate reporting on, the applicable remuneration and people-related governance regulations;
Monitoring OCI’s general responsibilities towards its own workforce (excluding the Health & Safety Management System) including the Company’s impacts on value chain workers and related risks and opportunities.
In 2025, the Committee sought advice and benchmark information from external advisers.
Assessment and evaluation of the Board
The Board annually conducts a self-assessment under the responsibility of the Co-Chair, assisted by the Company Secretary.
The first stage of the review involved Lintstock engaging with the Co-Chair and Company Secretary to set the context for the evaluation and to tailor the survey content to the specific circumstances of OCI. All Board members were then invited to complete an online survey addressing the performance of the Board (the Executive Director and the Non-Executive Directors as a collective and the functioning of the individual Board members) and its Committees.
The anonymity of the respondents was ensured throughout the process to promote an open exchange of views.
The exercise was weighted to ensure that core areas of Board and Committee performance were addressed, with a particular focus on the following topics:
Board support, composition and dynamics and management and focus of meetings:
The Board’s composition in the area of size, skills and expertise, geographical coverage and diversity, also in light of the ongoing strategic transformation.
The Board’s dynamics, culture in the boardroom, and the Non-Executive Director’s support of management, challenge of management and engagement outside Board meetings.
The quality of information, highlighting the key dilemmas and focus topics and support available to the Board.
Management of Board meetings and effectiveness of the Board's decision-making.
Governance structure, Board Committee structure and Executive Committee role and responsibilities.
Oversight of strategic review and capital structure:
The strategic review, the potential sale of the remaining business to Orascom Construction and recent divestments, focus, oversight, information, communication and decision-making process.
The Board’s focus on the external environment, macroeconomic conditions, investor sentiment, competitor strategies and performance and divestments.
Risk management and internal control:
The Board’s oversight of risks; appetite for, assessment exposure to and evaluating plans to mitigate risks.
The Board's oversight of OCI's approach to health & safety, global markets/environment and compliance
Human Capital oversight:
OCI’s approach to talent management, also in the context of the future of OCI and human-capital related challenges facing OCI in the transformation phase.
The organizational structure of OCI following transformation.
Evaluation conclusions
The Board engaged well with the review process, providing several useful insights. The report on the results of the evaluation of the Board and its Committees are discussed in the Board and Committee meetings.
Recent focus has necessarily centered on the proposed combination with Orascom Construction and the Board’s oversight thereof, which has been conducted in a constructive manner. Beyond this, the Board’s ongoing oversight of OCI, its key stakeholders and relevant external developments was considered to be appropriate, in light of the Company’s current circumstances and anticipated trajectory. The Board’s priorities for the coming year will include the successful integration of the Court Appointed Non-Executive Directors, and the disciplined evaluation and pursuit of the most value creating strategic options, with a continued and consistent focus on delivering sustainable value for OCI’s shareholders.
Shareholders’ rights and meetings
OCI’s shareholders exercise their rights through the Annual General Meeting (AGM). The AGM is held no later than six months after the end of OCI’s financial year (which equals a calendar year). The 2025 AGM was held on 21 May 2025.
The AGM has the authority to discuss and decide on (inter alia) the following main items:
The adoption of the annual accounts;
The release of the Directors from liability for their respective duties, insofar as the exercise of such duties is reflected in the annual accounts and/or otherwise disclosed to the AGM prior to the adoption of the annual accounts;
The appointment of the independent auditor;
The (re)appointment, dismissal and suspension of the Directors;
Amendments to the Remuneration Policy applicable to the Board;
An advisory vote regarding the Remuneration Report applicable to the Board;
The issue of shares and the restriction or exclusion of pre-emptive rights of shareholders (both insofar not delegated to the Board);
The reduction of share capital; and
The approval of those decisions of the Board that entail a significant change in the identity or character of OCI or its business.
The agenda for each AGM is published on OCI’s website in advance of the AGM. After the AGM the minutes and specific voting results are made available on OCI’s website as well.
Shareholders representing more than 3% of the issued share capital may submit proposals for the agenda, if substantiated and submitted in writing at least 60 calendar days in advance of the AGM.
Additional general meetings, Extraordinary General Meetings (EGM), may be convened at any time by the Board or by one or more shareholders representing more than 10% of the issued share capital. During 2025, the Board convened one EGM which was held on 3 February 2025.
Votes representing shares can usually be cast at a general meeting either personally or by proxy. No restrictions are imposed on these proxies, which can be granted electronically or in writing to OCI or independent third parties. OCI’s shareholders may cast one vote for each share. All resolutions adopted by the general meeting are passed by an absolute majority of the votes cast, unless Dutch law or OCI’s articles of association prescribe a larger majority.
The following proposals were voted on during the 2025 general meetings:
The adoption of the Annual Accounts 2024;
The amendment of the articles of association;
The discharge of the Executive Directors and Non-Executive Directors from liability;
The reappointment of Mr. Michael Bennett, Ms. Nadia Sawiris, Mr. Gregory Heckman, Mr. Robert Jan van de Kraats, Mr. Dod Fraser and Mr. David Welch as Non-Executive Director and the reappointment of Mr. Nassef Sawiris as Executive Director;
To advise on the 2024 Remuneration Report;
The extension of the designation of the Board as the authorised body to issue shares in the share capital of OCI, to restrict or exclude pre-emptive rights upon the issuance of shares and to repurchase shares in the share capital of OCI;
The cancellation of shares in the share capital of the Company held or repurchased by the Company;
The appointment PwC as auditor charged with the auditing of the Annual Accounts for the financial year 2025; and
Twice two proposals to amend of the articles of association of the Company (the Articles of Association) to first increase, and subsequently decrease, the nominal value of the shares in the Company's share capital, to facilitate a capital repayment, once subject to continued progress on the execution of the announced transactions and the strategic review, and once subject to closing of the sale of 100% of the Company's equity interests in its Global Methanol Business.
Independent auditor
OCI’s independent auditor is appointed by the AGM. The Audit Committee evaluates the functioning of the independent auditor during the year and recommends to the Board the independent auditor to be proposed for (re)appointment by the AGM. At the 2025 AGM, PricewaterhouseCoopers Accountants N.V. (PwC) was appointed as independent auditor for OCI for the year 2025. In anticipation of, and subject to (i) the transposition of the CSRD into Dutch law, and (ii) applicability of such law to the Company during the financial year 2025, PwC was also appointed as auditor charged with the assurance of the Sustainability Reporting for the financial year 2025.
The independent auditor attends all Audit Committee meetings. During these meetings, the independent auditor discusses the scope and the financial statements, including the consolidated and company financial statements and related notes, as well as the scope and outcomes of the limited assurance engagement on the selected non-financial indicators, as included in the sustainability statement, to provide limited assurance.
The independent auditor receives the financial information per quarter and can comment on and respond to such information, which is also included in OCI’s quarterly condensed financial statements.
The independent auditor is also present at the AGM and may be questioned on its statement of the fairness of the financial statements it audited, including the consolidated financial statements and the Company financial statements and related notes, as well as on the scope and outcome of the limited assurance engagement on the selected non-financial indicators included in the sustainability statement.
Audit Committee (delegated) pre approval is required for any auditor service. The Audit Committee evaluates the independence at the start of the audit and throughout the audit period.
Internal auditor
The Internal Audit & Risk team reports to the Audit Committee and the CFO, supporting them by facilitating the identification of risks and fostering a culture of risk awareness and ownership throughout the organization. The department provides quarterly updates to the Audit Committee, covering the outcomes of internal audits, risk assessments from operating companies, and group consolidated risk dashboards. Additionally, it conducts periodic independent internal audits to address specific issues at both subsidiary and holding company levels. The Executive Committee holds responsibility for defining the organization’s risk appetite and collaborates with functional leaders and (local) management to identify, analyze, and mitigate strategic, operational, compliance, and reporting risks, including those related to sustainability.
The performance of the Internal Audit & Risk department in fulfilling its responsibilities is assessed in consultation with the Audit Committee, with input from the CFO. The department is also subject to an independent comprehensive assessment every five years as required by the Institute of Internal Auditors (third party, Kwaliteitstoetsingen IIA Nederland). For more detailed information on risk management, please refer to the risk management section on pages to .
Decree Article 10 EU Takeover Directive
OCI confirms that it has no anti-takeover instruments, i.e.: measures that are primarily intended to block future hostile public offers for its shares. Although the members of the Sawiris family have not entered into any formal shareholders agreement, they have historically coordinated their voting on the OCI shares and should therefore be regarded as parties acting in concert (personen die in onderling overleg handelen) as defined in section 1:1 of the Dutch Financial Supervision Act (Wet op het financieel toezicht). Their collective voting rights act as an implicit anti-takeover element.
Compliance with the Code
OCI complies with the applicable principles and best practice provisions of the Dutch corporate governance code as in effect for the financial year 2025. Reference is made to the Corporate Governance section of our website for an overview of OCI’s governance related documents.
Potential conflicts of interest
Potential or actual conflicts of interest are governed by OCI’s articles of association and by-laws whose regulations are in line with the relevant principles of the Dutch corporate governance code and Dutch law. A Director shall immediately report any conflict of interest or potential conflict of interest that is of material significance to the other Directors and may not take part in any discussion or decision-making that involves a subject or transaction in relation to which he/she has a potential conflict of interest with OCI.
On 9 December 2025 OCI Global announced that it entered into an agreement to pursue a potential sale of the remaining business to Orascom Construction. At the time a potential sale of the remaining business to Orascom Construction emerged as the potentially most attractive strategic option for OCI Global, the Board carefully considered how to safeguard disinterested and independent decision-making by the Board. The Board considered that Mr. Sawiris held approximately 42% of the OCI Global shares and that the Sawiris family (including through NNS Holding (Cyprus) Limited) held a majority of the OCI shares. Furthermore, the Board considered that Mr. Sawiris held approximately 42% of the Orascom Construction shares and that the Sawiris family (including through NNS Holding (Cyprus) Limited) held a majority of the Orascom Construction shares. The Board also considered the familial ties between Mr. Sawiris and Ms. Sawiris. Both Mr. Sawiris and Ms. Sawiris declared a conflict of interest in relation to the potential sale of the remaining business. In view of the importance of the potential sale and the fact that Mr. Sawiris was OCI's sole executive director, the Board considered it appropriate to task Mr. Van de Kraats, with the duties and powers that Mr. Sawiris could not perform due to his conflict of interest, or that he should otherwise refrain from performing in view of his conflict of interest.
The Board furthermore tasked the non-executive directors, other than Mr. Van de Kraats and Ms. Sawiris, with the duties and powers that Ms. Sawiris could not or should not perform due to her conflict of interest as well as with the duties and powers of Mr. Van de Kraats in his capacity of non-executive director where it regarded the potential sale of the remaining business to Orascom Construction. The Board furthermore established a special committee with Mr. Fraser and Mr. Van de Kraats as members. The purpose of this committee was to facilitate close cooperation between Mr. Van de Kraats, in carrying out his special duties and powers in the context of the potential sale, and Mr. Fraser, who would be more closely involved discharging his duties as non-executive director. This transaction committee prepared the Board's decision-making regarding the potential sale of the remaining business to Orascom Construction.
In early January 2026, the Dutch association for retail shareholders (the “VEB”) and a number of other shareholders petitioned the Enterprise Chamber of the Amsterdam Court of Appeals (the “Court”) for an inquiry into the course of events and to take measures to prevent the transaction from being carried out in the short term. The Court has issued a preliminary ruling temporarily prohibiting a shareholder vote on the transaction and appointing two independent non‑executive directors to OCI’s board. These directors have the specific task of evaluating this transaction and as such, any form of the transaction may only be submitted for approval of the general meeting with their consent.
Related party transactions
OCI has a Related Party Transactions Policy in place, providing adequate protection for the interests of OCI and its stakeholders which has been prepared with due observance of the requirements of Dutch law, the Dutch corporate governance code, OCI’s articles of association and by-laws.
The overview of related party transactions in 2025 is disclosed in the Financial Statements in note 31.
2025 Directors' Remuneration
2025 Remuneration Report
This 2025 Remuneration Report provides an account of the implementation and execution of OCI’s remuneration policies for the Executive Director and the Non-Executive Directors during 2025. It consists of four sections:
The account from the Nomination and Remuneration Committee (N&RC), including the letter of the Chair of the Committee, which details the work of the Committee in 2025. This includes our stakeholder engagement and specific remuneration decisions made by the N&RC in response to the company performance and events in 2025, and looks forward to 2026 and beyond.
The 2025 Executive Director's remuneration package which provides the entitlements and costs of the various components of remuneration the Executive Director earned for his work and performance delivered in relation to the FY 2025. This section describes the execution of each of his remuneration elements in 2025, including the detail on pay-for-performance.
The 2025 Non-Executive Directors' remuneration packages, providing the entitlements and costs of the various components of remuneration the Non-Executive Directors earned for their work delivered in relation to FY 2025. This section describes the execution of each of their remuneration elements in 2025.
The five-year comparison, showing the statutory comparison between the company performance, Directors' remuneration, and average employee remuneration in the period 2021 - 2025.
This Remuneration Report is prepared in accordance with the Dutch statutory remuneration governance and legal requirements; the draft, non-binding, guidelines of the European Commission for Directors' remuneration disclosure have also been taken into account.
This 2025 Remuneration Report will be put forward for approval to our shareholders (advisory vote) at the 2026 Annual General Meeting.
All amounts in this Remuneration Report are in US dollars, unless stated otherwise. Details regarding the remuneration of our key management personnel can be found in note 32 of the Consolidated Financial Statements.
Account from the Nomination and Remuneration Committee
Statement of voting at the General Meeting of Shareholders
The table below shows the voting result on the resolution related to Directors' remuneration put forward to OCI's General Meeting of Shareholders held on 21 May, 2025 in comparison with the voting result achieved OCI's General Meeting of Shareholders held on 29 May, 2024.
AGM resolutions | Percentage of votes cast in favor of the resolution |
|---|---|
AGM 2025: Resolution to approve the 2024 Directors’ Remuneration Report (advisory vote) | 99.98% |
AGM 2024: Resolution to approve the 2023 Directors’ Remuneration Report (advisory vote) | 99.06% |
Letter from the Chair of the Nomination and Remuneration Committee
On behalf of the Board, I am pleased to present our 2025 Remuneration Report. This Report sets out in detail how our Directors' remuneration policies and principles were implemented and executed in 2025, and provides detail on the 2025 Directors' remuneration entitlements and costs.
During 2025, OCI continued to achieve significant milestones in its strategic transformation. In 2025, the Board also decided to further transform the company's governance structure to match the resized organization and prepare for the new strategic direction in 2026 and beyond. The number of Non-Executive Directors on the Board was reduced from nine to six NEDs. Also, the number of Committees was reduced from three to two, with the work of the now abolished HSE&S Committee integrated into the work and remit of the Audit Committee. As a result, the composition of the Nomination & Remuneration Committee changed, with Sipko Schat, Anja Montijn-Groenewoud, and Robert Jan van der Kraats stepping down as Chair and Members respectively. They are sincerely thanked for their valuable contributions over the years. At the same time, the Committee welcomed Nadia Sawiris as a new Member. And I had the privilege to join the Committee and succeed Sipko Schat as Chair.
The purpose of our Directors' remuneration is to incentivize and reward our Directors' efforts towards sustainable long-term value creation for all our stakeholders. As part of the Board review, the N&RC conducted its annual review of the Non-Executive and the Executive Directors’ remuneration policies, and, in particular, the impact of the company's ongoing transformation on these policies. During this review, the Board concluded that the current design of the Executive and Non-Executive Directors' remuneration policies remain sufficiently fit-for-purpose pending the strategic transformation for 2026. In the course of 2026, these policies will be reviewed again, and, in line with the Dutch legal and governance requirements, put forward to the General Meeting of Shareholders in 2027 for approval, whether amended or not. The Board is committed to involving investors, shareholders and other stakeholders in this review process before making any amendments to our Board remuneration policies.
During 2025, we maintained our dialogue with our major investors and their representative bodies, and the proxy advisors. The feedback we received on our 2024 Remuneration Report and the voting result at the AGM in 2025 was very much appreciated. Also in 2026, the N&RC remains dedicated to ensuring the remuneration provided to the Executive Chair and the Non-Executive Directors continues to be aligned with the company's future developments and shareholders' interests.
This Remuneration Report will be subject to an advisory vote at our 2026 General Meeting of Shareholders.
On behalf of the Nomination and Remuneration Committee,
David Welch
Chair, Nomination and Remuneration Committee
31 March, 2026
Board and Committee composition in 2025
Until 21 May, 2025, the Board was composed of the following nine Non-Executive Directors: Michael Bennett, Sipko Schat, Dod Fraser, Gregory Heckman, Heike van de Kerkhof, Robert Jan van de Kraats, Anja Montijn-Groenewoud, Nadia Sawiris, and David Welch. In response to OCI's ongoing strategic transformation and the resized organization, Sipko Schat, Heike van de Kerkhof, and Anja Montijn-Groenewoud stepped down as Non-Executive Directors from the Board on 21 May 2025, at the end of their term. For the remaining part of 2025, the Board was composed of the following six Non-Executive Directors: Michael Bennett, Robert Jan van de Kraats, Gregory Heckman, David Welch, Dod Fraser, and Nadia Sawiris. Michael Bennett is the Co-Chair and Senior Independent Non-Executive Director, and Robert Jan van de Kraats is the Vice-Chair and Independent Non-Executive Director.
During 2025, the N&RC was composed of the following Non-Executive Directors:
Sipko Schat (Chair until 21 May, 2025)
David Welch (new Member and Chair as of 21 May, 2025)
Michael Bennett (Senior Independent Director)
Gregory Heckman
Robert Jan van de Kraats (Member until 21 May, 2025)
Anja Montijn-Groenewoud (Member until 21 May, 2025)
Nadia Sawiris (new Member as of 21 May, 2025)
A Special Board Committee (the “Transaction Committee”, or the “TC”) was established in May 2025 to – among other things – prepare the decision making of the Board with regard to the final phase of the strategic review (the "Final Phase"). Furthermore, the Chair of the TC was tasked with the duties and powers that Mr. Sawiris cannot perform due to this conflict of interest in relation to the Final Phase pursuant to section 2:126 (6) Dutch Civil Code, or that he should otherwise refrain from performing in view of his conflict of interest pursuant to section 2:8 Dutch Civil Code. Mr. Van de Kraats has in such capacity been appointed as Chair of the TC, and Mr Fraser as member of the TC.
Further details about the Executive Directors and the Non-Executive Directors, the N&RC, and the TC can be found in the Board profile section of this Annual Report.
Looking back on 2025
This section provides an overview of the main business achievements of OCI in 2025, the company's environment during the year, and how the 2025 remuneration provided to our Directors aligns with these events and the (long-term) performance of the company. The Board’s 2025 remuneration decisions, made upon the advice of the N&RC, reflect these events.
Company performance
Our key 2025 financial results (total) are as follows:
Following the divestments, revenues decreased from USD 4,083.8 million in 2024 to USD 1,604.8 million in 2025, a decrease of 60.7% year-on-year.
Adjusted EBITDA was down from USD 825.8 million in 2024 to USD 121.6 million in 2025, a decrease of 85.2% year-on-year.
2025 Adjusted net loss increased from a loss of USD (11.8) million in 2024 to a loss of USD (33.5) million in 2025, an increase of 183.9% year-on-year.
A net debt position of USD 53.8 million was realized at 31 December, 2025, after capital repayments to shareholders of USD 1,698.1 million (including the Dutch statutory withholding taxes at source) during the calendar year 2025 (in 2024, this was a net cash position of USD 1,372.0 million at 31 December 2024, and capital repayments to shareholders of USD 1,923.1 million and dividend distributions to shareholders of USD 1,387.6 million, i.e. USD 3,310.7 million in total, during the calendar year 2024).
Reference is made to the section Financial performance in this Annual Report for more detail.
In March 2023, the Board launched a multi-faceted strategic review, with the objective of closing the discount to OCI’s intrinsic value and unlocking value for its shareholders. During 2025, OCI continued to achieve significant milestones in its strategic transformation. Following its sale in August 2024, we divested 100% of our equity interest in our OCI Methanol businesses in Europe and the US to Methanex Corporation in June 2025. As part of the sale of our Clean Ammonia project in Beaumont, Texas, to Woodside Energy Group Ltd in September 2024, it was agreed that OCI would continue to manage the construction, commissioning and startup of the facility. This resulted in the first production in December 2025. In late March 2026, we achieved Project Completion, at which time the facility was formally handed over to Woodside Energy shortly thereafter. In November 2025, we sold 100% of our equity interests in OCI Ammonia Holding B.V. to AGROFERT, a.s. This sale encompassed OCI’s ammonia import and storage terminal in Rotterdam (OCI Terminal Europoort B.V.), and OCI’s ammonia distribution platform, serving third party off-site European customers (OCI Ammonia Distribution B.V.). This transaction closed on 31 March 2026. Reference is made to note 22 Discontinued operations and assets & liabilities held for sale in the Financial Statements of this Annual Report for more financial details on these sales and closings.
Despite commodity volatility, lower utilization rates and a dynamic regulatory environment, our European nitrogen business delivered resilient operational performance, and our European Nitrogen platform delivered improved profitability. During 2025, the Executive Chair (together with the Executive Committee members) also completed the execution of various cost optimization initiatives, which had commenced in 2023, across the Group’s functions and locations.
2025 Short-term incentive
Our Executive Chair is rewarded in alignment with his position as major shareholder. Therefore, in 2025, like in previous years, the Executive Chair waived his eligibility for the Executive Directors' short-term incentive.
Long-term incentives in 2025
During 2025, as part of the strategic transformation process, the Board decided to terminate all share-based incentive plans for Executive Directors and employees. As part of the wrap-up of these plans, the Executive Chair, the CEO and the CLHCO waived their eligibility for the vesting of their outstanding, unvested 2023 and 2024 ED PSU awards and One-Off Share Awards issued to them in earlier years. Also, no new 2025 ED PSU award was made to the Executive Chair. No replacing compensation was offered.
Stakeholder engagement
In our remuneration decisions, we seek alignment with shareholder expectations to ensure their support. During 2025, we continued our dialogue with our major investors and their representative bodies, and the proxy advisors on our 2024 remuneration report disclosures. We only received neutral and positive feedback which was very much appreciated.
Looking forward
Our strategic direction for 2026 and beyond will drive the N&RC's remuneration decisions and execution of our Board remuneration policies in 2026, as well as the design of OCI's Directors' remuneration policies for 2027 and beyond.
We are looking forward to our continued engagement with our key shareholders and proxy advisors throughout the coming year. The N&RC welcomes any open conversation, questions, and feedback.
2025 Executive Directors' Remuneration
This section of the Remuneration Report explains how the Executive Directors' remuneration policy approved by the Annual Meeting of Shareholders in 2023 was applied in 2025.
Introduction
OCI Global is a value-driven business which aims to evolve industries while creating maximum value for our shareholders and other stakeholders. Our business strategy requires us to be agile and quick to respond to market opportunities and our recent strategic transformation is a reflection of this.
Our current 2023 - 2026 OCI Executive Directors' remuneration policy was adopted in May 2023, and provides a mix of remuneration instruments with a focus on short-term and long-term variable compensation for our Executive Director. The incentives are designed to focus on the strategic priorities, objectives and targets that are fundamental to the Group’s successes. Health and safety, commitments to earnings, operational excellence, IT business optimization, global commercial strategies, sustainable solutions, decarbonization, and diversity and inclusion support the alignment with the long-term interests of our shareholders.
2025 Executive Directors' annual base salaries
The 2025 annual base salary provided to our Executive Chair is set out in the table below. At the beginning of 2025, the Executive Chair requested the Board to refrain from any salary increase in 2025.
2025 Executive Chair's annual base salary
Executive Director | Role | 2024 Annual base salary | 2025 Annual base salary | 2025 Benefits allowance | 2025 Total |
|---|---|---|---|---|---|
Nassef Sawiris | Executive Chair | 840,000 | 840,000 | 210,000 | 1,050,000 |
Peer Group
The N&RC regularly assesses the effectiveness of OCI's Executive Directors' remuneration policy. To ensure the competitiveness of the Executive Directors' remuneration, the remuneration levels, components and mix are benchmarked regularly against the remuneration data from a peer group of international companies. The current peer group is set out in the table below.
Current Peer group for Executive Directors' compensation
Company | Location HQ | Company | Location HQ |
|---|---|---|---|
Arkema | France | Mosaic | USA |
AKZO Nobel | Netherlands | Nutrien | Canada |
Bunge | USA | Olin | USA |
Celanese | USA | OMV | Austria |
CF Industries | USA | Philips | Netherlands |
Evonik | Germany | Repsol | Spain |
Givaudan | Switzerland | SBM Offshore | Netherlands |
K+S | Germany | Solvay | Belgium |
Lyondellbasell | United Kingdom | Westlake Chemicals | USA |
Methanex | Canada | Yara International | Norway |
Short term incentive
Our Executive Chair is rewarded in alignment with his position as major shareholder. Therefore, in 2025, like in previous years, the Executive Chair waived his eligibility for the Executive Directors' short-term incentive.
Overview of the 2025 Executive Director's remuneration
The 2025 total remuneration package and pay mix for our Executive Chair comprised of fixed remuneration only, that is guaranteed rewards in cash. The table on the next page provides an overview of the remuneration provided to the Executive Chair in the financial year 2025 and the comparative financial year 2024 (including the remuneration provided to the former Executive Directors in relation to the financial year 2024).
The table shows the entitlements and the costs for OCI N.V. stand alone of these entitlements. Entitlements are defined as:
Payments in cash related to the financial year at hand which are typically paid out to Executive Directors in cash in the financial year at hand, i.e. the annual base salary.
Payments in cash related to the financial year at hand which are typically paid out to Executive Directors in cash in the year following the financial year at hand; these are:
the remuneration entitlements from undertakings belonging to the OCI group of companies, and
the short-term variable incentive in cash (annual bonus) which relates to the performance year which is also the financial year at hand.
The monetary equivalent value of the long-term variable incentive awards in share units made in earlier years, and of which the performance period generally ends on 31 December of the financial year at hand, and which will vest in shares to Executive Directors in the year following the financial year at hand.
2025 Executive Directors' remuneration entitlements and costs for OCI N.V. stand alone
Fixed remuneration12 | Variable compensation12 | Total remuneration | Fixed / Variable ratio | ||||||||||||
|---|---|---|---|---|---|---|---|---|---|---|---|---|---|---|---|
Executive Director | Annual base salary | Remuneration from Group Undertakings3 | Short-term incentives (annual bonus)4 | Long-term incentives | Fixed portion | Variable portion | |||||||||
2025 | 2024 | 2025 | 2024 | 2025 | 2024 | 2025 | 20247 | 2025 | 2024 | 2025 | 2024 | 2025 | 2024 | ||
Nassef Sawiris | entitlements | 1,050,000 | 1,050,000 | n/a | 118,750 | n/a8 | 0 | 2,204,104 | 1,050,000 | 3,372,854 | 100% | 34.7% | 0% | 65.3% | |
Executive Chair | costs | n/a | (30,405) | 1,477,238 | 1,166,856 | 2,527,238 | 2,186,451 | 41.5% | 46.6% | 58.5% | 53.4% | ||||
Former Executive Directors(members of the Executive Committee) | |||||||||||||||
Hassan Badrawi | entitlements | n/a | 518,219 | n/a | 118,750 | n/a | 0 | n/a | 2,087,780 | n/a | 2,724,749 | n/a | 23.4% | n/a | 76.6% |
costs | n/a | 41,345 | 167,449 | 1,023,023 | 167,449 | 1,582,587 | n/a | 35.4% | n/a | 64.6% | |||||
Maud de Vries | entitlements | n/a | 252,350 | n/a | 12,934 | n/a | 0 | n/a | 1,040,135 | n/a | 1,305,419 | n/a | 20.3% | n/a | 79.7% |
costs | n/a | 0 | 105,278 | 582,956 | 105,278 | 835,306 | n/a | 30.0% | n/a | 70.0% | |||||
Former Executive Director(no longer in service)10 | |||||||||||||||
Ahmed El-Hoshy | entitlements | n/a | 563,281 | n/a | 259,570 | n/a | 0 | n/a | 4,111,871 | n/a | 4,934,723 | n/a | 16.7% | n/a | 83.3% |
costs | n/a | 308,904 | n/a | 1,340,570 | n/a | 2,212,755 | n/a | 39.4% | n/a | 60.6% | |||||
Total | entitlements | 1,050,000 | 2,383,850 | n/a | 510,005 | n/a | 0 | 0 | 9,443,890 | 1,050,000 | 12,337,745 | 100% | 23.5% | 0% | 76.5% |
costs | n/a | 319,844 | 1,749,965 | 4,113,405 | 2,799,965 | 6,817,099 | 37.5% | 39.7% | 62.5% | 60.3% | |||||
- Entitlement figures shown in this table are shown in US dollars, which forms the starting point for any remuneration amount provided to (former) Executive Directors. As a result, the IFRS costs for the 2024 and 2025 fixed remuneration in cash and the 2024 short-term incentive in cash shown in this table are the same as the entitlements. Note that in 2025, a part of this cash remuneration was paid in Arab Emirates dollars and British pounds to Nassef Sawiris. In 2024, the larger part of this cash remuneration was paid in British pounds to Nassef Sawiris, Hassan Badrawi, and Ahmed El-Hoshy, and all of the remuneration provided in cash was paid in euros to Maud de Vries. Also, to account for the company's wage tax withholding obligations, the relevant portions of their remuneration were taxed in local currency in the Netherlands, and, for Nassef Sawiris, Hassan Badrawi, and Ahmed El-Hoshy, also in the United Kingdom. As of 1 January, 2024, a fixed Fx rate has been applied consistently during the year for the conversion of (a part of) their annual base salaries into Arab Emirates dollars, British pounds and euros respectively. As differences may occur between the original USD dollar amounts and the local currency amounts converted back to US dollars, these differences are recognized as costs, yet not considered material.
- The figures shown in the columns do not include the statutory and mandatory employer contributions to social security insurances and medical benefit schemes paid in relation to the remuneration provided (for Nassef Sawiris: USD 360,027 in 2025 (USD 620,168 in 2024); Hassan Badrawi: USD 1,024,783 in 2024; Maud de Vries: USD 5,631 in 2024; Ahmed El-Hoshy: USD 1,462,858 in 2024.
- The remuneration from Group Undertakings refers to the remuneration the (former) Executive Directors received from Fertiglobe until the closing of the sale of OCI's equity holding in Fertiglobe to ADNOC on 15 October 2024. The Fertiglobe's General Meeting of Shareholders decides upon their Board and Committee fees after the end of the financial year to which they relate. Fertiglobe paid the Board and Committee fees to be paid to OCI Directors to OCI. OCI paid (a part of) the Fertiglobe fees received from Fertiglobe to the (former) Executive Directors, and retained the balance, if any. Ahmed El-Hoshy also received part of these Fertiglobe Board fees in the form of a Fertiglobe CEO salary, which represented 25% of his OCI annual base salary in 2024. The Fertiglobe 2024 Board and Committee fees and the Fertiglobe CEO salary were time prorated until 15 October, 2024, and paid in the year to the Directors. The 2024 costs figures in relation to this Fertiglobe remuneration paid to Executive Directors in this table reflect the accrued balance on 31 December 2024 between the Fertiglobe remuneration it paid out to the Executive Directors in 2024 and the payments of these fees which OCI N.V. stand alone were to receive from Fertiglobe in 2025. In this table, these figures have not been restated for the actual fees received from Fertiglobe after the Fertiglobe AGM in 2025, as the difference is not considered material. Note that in the 2024 Consolidated Financial Statements of the company, the fees received by OCI N.V. from Fertiglobe stand alone were eliminated as a result of the consolidation of the Fertiglobe Annual Accounts in the OCI N.V. Annual Accounts up to the disposal date of Fertiglobe. On a consolidated group level, the 2024 costs figures were therefore different than shown here in this table.
- Annual bonus figures shown in these columns refer to the entitlements accrued in relation to the performance year which is also the financial year at hand, and the associated costs for OCI N.V. stand alone. They are paid out to Executive Directors in the following year, typically in March or April. Note that the Executive Chair, being the majority shareholder, has waived his annual bonus entitlements so far.
- The long-term incentive entitlements and costs figures shown here refer to the entitlements Executive Directors accrued in relation to conditional awards in performance stock units made under the OCI N.V. Executive Directors' long-term incentive programs during a three-year period of which the financial year at hand is the third and final year. Upon vesting, which is subject to the achievement of the applicable performance condition, these performance stock units will be converted into OCI shares applying a 1:1 ratio. The entitlement figures shown here also include the value of the dividend equivalents that were awarded conditionally during the vesting period, and which vest to them on the same performance basis. The costs figures shown here reflect the recognized IFRS costs accrued by OCI N.V. stand alone during the financial years 2024 and 2025 for the unvested OCI stock units awarded conditionally to individual Executive Board members under the company's long-term share plans. These figures may also include a correction for the costs of the long-term incentive that vested in the financial year at hand, if there was a remaining balance between the costs accrued in previous financial years and the actual costs at vesting.
- No long-term incentives vested to Executive Directors in 2025 as a result of the Board abolishing all share plans, and, subsequently, the Executive Chair, the CEO and the CLHCO waiving their eligibility to the vesting of their outstanding unvested Executive Directors' long-term incentive share awards; these awards were forfeited upon waiving. Also, the Executive Chair waived his eligibility for receiving a 2025 PSU award under the OCI N.V. 2019 Executive Directors' Performance Stock Unit Plan. As a result, the 2025 LTI entitlements shown in this table are zero. In line with the applicable IFRS accounting rules, the remaining costs of the forfeited awards were accelerated. Note that the 2025 LTI costs figures for the Executive Chair shown in this table are reflective of the IFRS accelerations, for which an amount of USD 1,436,903 is included in his total 2025 LTI costs. The 2025 LTI costs for Hassan Badrawi and Maud de Vries shown in this table solely relate to the acceleration of the costs as a result of this forfeiture.
- The 2024 long-term incentive refers to the (performance) shares awarded conditionally to Executive Directors in 2022, 2023 and 2024, and any dividend equivalents (in shares or cash) awarded conditionally during the vesting period as follows: (i)The 2024 entitlement figure for the Executive Chair shown here is based on the actual number of shares from the underlying conditional award as well as the related dividend equivalent awards in cash that vested to him on 14 March 2025 based on the overall performance result achieved, and the OCI share price on 31 December 2024. Note that the 2024 entitlement figures shown here differed from the actual value of the OCI shares delivered to him on the vesting date, i.e. 14 March, 2025, because the share price and the Fx rate euro/ British pound to US dollar on these dates differed; the latter entitlement figures is shown in the table 'Long-term variable compensation movements in 2025' in this Remuneration Report. (ii) The 2024 entitlement figures for Hassan Badrawi, Maud de Vries and Ahmed El-Hoshy shown here are based on the number of performance shares awarded conditionally to them in 2022 and 2024 and the accrued and dividend equivalent awards in shares which were prorated for their time served as a Director until 1 June 2024 after which they vested on the same date. These vestings were reflective of the overall actual performance result achieved for the 2022 performance shares, and an at-target result for the 2024 performance shares. Their entitlements stemming from these vestings as shown here are established using the OCI share price and the Fx rate euro to USD dollar on 1 June 2024. (iii) The 2024 entitlement figure for Ahmed El-Hoshy shown here also includes the the cash amounts he received in lieu of (a) his One-Off Share award made to him in 2022 and the related, accrued dividend equivalent awards in shares, and (b) the performance shares awarded conditionally to him in 2023 and the related, accrued dividend equivalent awards in shares which were prorated for the time served as a Director on 1 June 2024 and an at-target vesting result. The cash-in-lieu amounts were established using the OCI share price and the Fx rate euro to US dollar on 15 October 2024.
- Nassef Sawiris did not receive any annual bonus payout in relation to the financial (performance) years 2024 and 2025. As Executive Chair, he requested the Board to waive his annual bonus entitlement.
- When Hassan Badrawi and Maud de Vries stepped down as Executive Directors from the Board of OCI NV on 29 May 2024, they did not receive any severance.
- When Ahmed El-Hoshy stepped down as Executive Director from the Board of OCI NV on 29 May 2024, he did not receive any severance. His departure from the company on 15 October 2024 was governed by UK law per his local employment agreement with OCI (UK) Ltd.
The total costs of the 2025 Executive Directors' remuneration to OCI N.V. stand alone was USD 2,799,965, a 58.9% decrease from USD 6,817,099 in 2024. The main factors impacting the 2025 total costs were (i) the Executive Chair, the CEO and the CLHCO waived their eligibility to the vesting of their outstanding, unvested Executive Directors' long-term incentives, and (ii) no 2025 long-term incentive was awarded to the Executive Chair. During 2025, the Board decided to terminate all share-based incentive plans for Executive Directors and employees. As part of the wrap-up of these plans, the Executive Chair, the CEO and the CLHCO waived their eligibility for any vesting of their 2023 and 2024 ED PSU awards and the 2022 One-Off Share Awards issued to them in earlier years. These awards were forfeited upon waiving. Also, the Executive Chair waived his eligibility for receiving a 2025 PSU award under the OCI N.V. 2019 Executive Directors' Performance Stock Unit Plan. As a result, their 2025 LTI entitlements are zero. In line with the applicable IFRS accounting rules, the remaining costs of the forfeited awards were accelerated upon forfeiture.
Note that the 2024 costs figures shown in this table reflect the costs for OCI N.V. stand alone only, that is, prior to the consolidation of the Fertiglobe annual accounts. They are based on the International Financial Reporting Standards as endorsed by the European Union (IFRS-EU) and are included in the total consolidated Group costs, including Fertiglobe, as shown in 2024 comparative figures in the Consolidated Financial Statements in this Annual Report. For further details on the consolidated costs for the Group, reference is made to note 28 of the Consolidated Financial Statements.
Long-term incentive
The OCI Long-Term Incentive (LTI) program for Executive Directors is a reward in performance stock units (PSUs) for company results achieved over a period of three years. Under the OCI Executive Directors' remuneration policy, the on-target LTI opportunity is 150% of annual base salary for the Executive Chair. The actual vesting result is established based on the achievements against the targets set for the various performance measures, and ranges from 25% of the target awards (if all performance conditions are met at the minimum - threshold - level) to 200% of the target awards (if all performance conditions are met at the maximum level). The maximum LTI opportunity of 200% translates to a maximum vesting opportunity of 300% of annual base salary for the Executive Chair. Upon vesting, all stock units that vest are converted to OCI shares on a 1:1 ratio. After vesting and delivery of these shares, a two-year holding period is applicable per the Dutch remuneration governance regulations. Furthermore, these shares are subject to a general minimum portfolio requirement, under which the Executive Chair is required to hold a minimum number of shares at all times during his Directorship (see page of this Remuneration Report for further detail).
Overview of Executive Directors' long-term variable compensation movements in 2025
The table below shows the movements in the (conditional) LTI entitlements in shares of each (former) Executive Board members during 2025.
Overview of Executive Directors' long-term variable compensation movements in 2025
Executive Director | Award1 | Date of award | (Scheduled) | (Scheduled) end date holding period | Value of target award on the date of award (gross) | Share price at the date of award2 | Target # of stock units awarded (gross) | Total # of stock units awarded/ forfeited in prior years (gross)3 | # of stock units under deferral at 1 January 2025 (gross) | # of stock units awarded/ forfeited during 20254 | # of stock units under deferral at 31 December 2025 (gross) | # of stock units that vested during 2025 (gross) | Share price at the date of vesting5 | Value of the vested award on the date of vesting (gross) |
|---|---|---|---|---|---|---|---|---|---|---|---|---|---|---|
Nassef Sawiris | 2022 ED PSU | Feb 7 2022 | March 14 2025 | Feb 7 2027 | 1,250,000 | 29.01 | 43,093 | 0 | 43,093 | 16,376 | 0 | 59,469 | 12.49 | 742,472 |
2023 ED PSU | Feb 7 2023 | Feb 7 2026 | Feb 7 2028 | 1,575,000 | 32.18 | 48,945 | 0 | 48,945 | (48,945) | 0 | n/a | n/a | n/a | |
2024 ED PSU | Feb 7 2024 | Feb 7 2027 | Feb 7 2028 | 1,575,000 | 29.15 | 54,033 | 0 | 54,033 | (54,033) | 0 | n/a | n/a | n/a | |
Former Executive Directors(members of the Executive Committee) | ||||||||||||||
Hassan Badrawi | 2022 one-off share award | May 25 2022 | May 25 2025 | June 1 2024 | 700,000 | 37.36 | 18,737 | 0 | 18,737 | (18,737) | 0 | n/a | n/a | n/a |
2023 ED PSU | Feb 7 2023 | Feb 7 2026 | June 1 2024 | 1,811,250 | 32.18 | 56,287 | (31,270) | 25,017 | (25,017) | 0 | n/a | n/a | n/a | |
Maud de Vries | 2022 one-off share award | May 25 2022 | May 25 2025 | June 1 2024 | 450,000 | 37.36 | 12,045 | 06 | 12,045 6 | (12,045) | 0 | n/a | n/a | n/a |
2023 ED PSU | Feb 7 2023 | Feb 7 2026 | June 1 2024 | 1,102,500 | 32.18 | 34,262 | (19,034)7 | 15,228 7 | (15,228) | 0 | n/a | n/a | n/a | |
- Awards referring to PSUs consist of performance stock units conditionally granted, whereby the number of stock units vesting to Executive Directors depends on the actual performance achieved against targets. Upon approval from the Annual General Meeting of Shareholders in May 2022, One-off share awards were granted to Executive Directors in 2022 discretionarily as a one-off reward for the exceptional company performance in 2021. They consist of restricted stock units.
- OCI shares are listed at the Euronext Amsterdam stock exchange, and, hence, the share price is noted in euros. The values shown in this column are the share prices converted to US dollars on the basis of the relevant exchange rates. The share price in euros used for the 2022 ED PSU awards is € 25.34, for the 2022 one-off share awards € 35.06, for the 2023 ED PSU awards € 30.07, and for the 2024 ED PSU awards € 27.09.
- The figures in this column include the forfeiture of unvested stock units as a result of the proration of the awards of the CEO and CLHCO for the time they served as Director on 1 June 2024.
- The figures in this column include (i) the performance adjustment to the 2022 ED PSU award of the Executive Chair which vested on 14 March 2025, and (ii) the forfeiture of the outstanding, unvested stock units as a result of the Board deciding to terminate all share plans, and the resulting waiver of the Executive Chair, the CEO and the CLHCO of their outstanding, unvested awards.
- OCI shares are listed at the Euronext Amsterdam stock exchange, and, hence, the share price is noted in euros. The values shown in this column reflect the share price in euro applicable to the vesting of the respective awards converted to US dollar on the basis of the relevant exchange rate. For the 2022 ED PSU award that vested to the Executive Chair in 2025, the applicable share price at vesting was € 11.49.
- In the 2024 Annual Report, the # of stock units awarded / forfeited during 2024 and, as a result, the total number of stock units under deferral at 31 December 2024 (gross) had inadvertently been published as (24,937) and 15,228; this should have been (3,716) and 12,045.
- In the 2024 Annual Report, the # of stock units awarded / forfeited during 2024 and, as a result, the total number of stock units under deferral at 31 December 2024 (gross) had inadvertently been published as (22,313) and 17,852; this should have been (24,937) and 15,228.
Executive Directors' long-term variable compensation: awards made in 2025
The Executive Chair was not eligible for receiving a 2025 PSU award under the OCI N.V. 2019 Executive Directors' Performance Stock Unit Plan. As majority shareholder, he requested the Board to waive his eligibility in light of the Board's decision to terminate all company share plans.
Executive Directors' long-term variable compensation with the performance period ending in 2025
No (conditional) award in performance stock units (PSUs) made under the OCI N.V. 2019 Executive Directors' Performance Stock Unit Plan in 2023 with the performance period ending in 2025 vested to the Executive Director; this award lapsed during 2025; for further detail, see under 'Unvested awards outstanding in 2025' in this Remuneration Report.
Executive Directors' long-term variable compensation in 2025: awards that vested during 2025 or were outstanding in 2025
Awards that vested in 2025: 2022 PSU awards
The performance period of the conditional award made to the Executive Chair in 2022 under the OCI N.V. 2019 Executive Board Performance Stock Unit Plan, ended on 7 February, 2025. The realized overall performance resulted in a vesting at 138% of the target level. For details on this vesting, reference is made to the Remuneration Report in our 2024 Annual Report.
The conditionally awarded performance share units, including the conditionally awarded dividend equivalents, vested on 14 March, 2025 to the Executive Chair (the vesting was delayed as a result of the closed period in relation to the Q4 2024 results publication ending on that date). The performance share units were fully settled in shares on a 1:1 basis in accordance with the rules of the Plan. The (gross) value of these vested performance shares on 31 December, 2024 is shown in the table ‘2025 Executive Board remuneration entitlements and IFRS costs for OCI N.V. stand alone' in this Remuneration Report. The gross monetary value of this vesting on the date of vesting are shown in the table 'Long-term variable compensation movements in 2025' on the previous page.
Note that the conditional awards in performance share units made in 2022 to Hassan Badrawi, Maud de Vries and Ahmed El-Hoshy had already vested (on a prorated basis) on 1 June, 2024 upon their resignation from the Board.
Unvested awards outstanding in 2025: 2022 ED One-Off Share awards and 2023 ED PSU awards
During 2025, the Board decided to terminate all share-based incentive plans for Executive Directors and employees. As part of the wrap-up of these plans, the Executive Chair, the CEO and the CLHCO waived their eligibility for any vesting of their (conditional) 2023 and 2024 ED PSU awards and the 2022 One-Off Share Awards issued to them in earlier years. As a result, these awards lapsed in full. No replacing compensation was offered.
Share Ownership
Subject to the share ownership guidelines for the Executive Directors of the Board, the Executive Chair is required to accrue a minimum portfolio of OCI shares which he needs to hold onto during his Board membership. Both OCI shares acquired through the company's (Executive Directors' and employee) long-term share schemes and purchased as a personal investment by the Executive Director concerned count towards this minimum. Where it concerns OCI shares acquired through the company's (Executive Directors' and employee) long-term share schemes, these are the net shares delivered to them; any unvested awards and any tax shares withheld to meet the tax obligations due do not count towards this minimum.
As of 1 January, 2024, the value of the shares to be held at all times are 200% of base salary for the Executive Chair. As the base chemicals industry is subject to significant economic volatility, as reflected in the OCI share price, the corresponding number of shares to be held at all times is kept stable until reviewed, which will be done on a regular basis. As long as he has not accrued this minimum portfolio, the Executive Chair is restricted from selling any of the OCI shares he owns. As Nassef Sawiris and his family own the majority of the OCI shares, his portfolio of OCI shares exceeds the minimum portfolio requirement by far.
In addition to these share ownership guidelines the Dutch remuneration governance regulations require that a two-year holding period is applied to all shares vesting from the company's Executive Directors' long-term share schemes.
The table below summarizes the shareholdings of the Executive Chair on 31 December 2025 and 31 December 2024 (for comparative purposes). Please note that the Board profile of the Executive Chair states the most recent share ownership per the date of publication of this Annual Report. His Board profile can be found on page in this Annual Report.
Executive Directors' shareholdings in 2025
Executive Director | # of shares owned on 31 December 2025 | 2025 Shareholding(as a % of the minimum requirement) | # of shares owned on 31 December 2024 | 2024 Shareholding(as a % of the minimum requirement) |
|---|---|---|---|---|
Nassef Sawiris | 104,003,478 | Majority shareholder in OCI N.V. | 81,468,139 | Majority shareholder in OCI N.V. |
Please also note that although that the Executive Chair owns OCI shares that are free from restrictions (i.e. the holding period has already been completed, and these shares are in excess of the minimum portfolio requirement), a further approval for selling such shares must still be obtained from the Board. Also, any sale needs to be in compliance with the OCI Insider Trading Code and other statutory insider trading rules, as well as other relevant statutory laws, rules and regulations, such as the Dutch Market Abuse regulations, applicable at the time.
Malus and Claw back
The short and long-term incentives of the (former) Executive Directors are subject to malus and claw back provisions. These malus and claw back provisions may be applied in the case of the occurrence of certain events, where these are only discovered after the actual performance results and the related amounts to be paid out (in case of the short-term incentive) or the number of OCI shares to vest and be delivered to Executive Directors have already been established by the Board:
There is a material misstatement of the financial results which resulted in a payout and/or the vesting of an award being greater than would have been the case if the misstatement had not been made;
The extent to which any performance target and/or condition satisfied was based on an error, or on inaccurate or misleading information or assumptions which results in a payout or the vesting of an award being greater than would have been the case had the error not been made;
Serious misconduct of the individual;
Circumstances arose prior to payout or vesting which would have warranted summary dismissal or dismissal for urgent cause at that time; and
Any other circumstances allowed under Article 2: 135(8) of the Dutch Civil Code.
Depending on the timing of these circumstances, a (downward) malus adjustment will be made prior to payout or vesting, i.e. prior to the transfer of ownership of the cash payment or OCI shares. Or, a claw back will be set in motion, if the variable incentive has already been paid out, or the shares have already vested and been delivered to Executive Directors. Upon discovery, the same event may result in a (downward) malus adjustment and/or claw back of more than one short-term and long-term incentive. No malus adjustments or claw backs were applied to the variable remuneration the Executive Directors received in 2025 and prior years.
Other terms and conditions
Appointment terms, notice periods, and severance arrangements
The Executive Chair was engaged under a Board services agreement with a maximum term of four years ending latest on the date of the Annual General Meeting of Shareholders in the fourth calendar year after their first appointment. In May 2024, the Meeting of Shareholders approved to change the appointment term for all Board members, including the Executive Chair, from a maximum period of four years to one year, subject to re-appointment by the General Meeting of Shareholders. The terms and conditions in his Board services agreement are in alignment with the relevant Dutch Corporate Governance Code provisions. Additionally, the Executive Chair holds an employment agreement with a local company to facilitate local employer and employee wage tax withholding and payment of social security contributions in the countries where he works. His employment agreement contains similar terms and conditions to his service agreement.
Termination of his Board services agreement is subject to a notice period of three months for either party. If the company would terminate the service agreement with the Executive Chair other than due to an urgent cause or serious culpability, the Executive Chair is entitled to a severance payment of an amount equal to 100% of annual base salary, in line with the Dutch Corporate Governance Code. No severance is payable in case the agreement is terminated (early) at the initiative of the Executive Chair.
Loans
Neither OCI nor any of its subsidiaries have granted any personal loans or guarantees to the Executive Chair in 2025.
2025 Non-Executive Directors' Remuneration
This section of the Remuneration Report explains how the current Non-Executive Directors' remuneration policy was applied in 2025.
The remuneration of Non-Executive Directors consists of fixed fees for general Board membership as well as for Committee memberships. These fees are paid in cash only. Their remuneration is not subject to company or personal achievements, i.e. Non-Executive Directors are not granted any variable, performance related remuneration, to ensure their independence. Their remuneration is set at levels required to attract qualified Non-Executive Directors with the (diversity in) personal skills competencies and international experience required to oversee the Company’s strategy and contribute to its performance and the long-term value creation.
The table on the next page shows the Board and Committee fees that are in place since the adoption of the 2023 - 2026 Non-Executive Directors' remuneration policy in May 2023.
2025 Non-Executive Directors' Board and Committee fees
Chairman | Member | |
|---|---|---|
Main Board | 330,000 per annum | 165,000 per annum |
Audit | 27,500 per annum | 22,500 per annum |
N&RC | 27,500 per annum | 22,500 per annum |
HSE&S | 27,500 per annum | 22,500 per annum |
Non-Executive Directors also receive a fixed travel allowance in cash for continental or intercontinental trips, when attending Board meetings or other Board related events outside their country of residence. This travel allowance is USD 7,500 for intercontinental travel and USD 2,500 for continental travel per trip. In addition, Non-Executive Directors are reimbursed for actual business expenses made.
During 2025, the OCI Non-Executive Directors' remuneration policy was executed in line with the resolutions adopted at the Annual General Meeting on 3 May, 2023. No deviation or derogation was applied. The Chair and the one member of the Transaction Committee ('TC') did not receive any additional Committee fees for their work in the TC.
The table below shows the gross amounts of Board and Committee fees as well other remuneration each Non-Executive Director received in 2025. As these are all fixed payments in cash, these figures represent both the entitlements of the Non-Executive Directors in relation to 2025 and the costs for OCI N.V. stand alone. The cost figures shown in this table are based the International Financial Reporting Standards as endorsed by the European Union (IFRS-EU) and are included in the Consolidated Financial Statements in this Annual Report. The total cost to OCI N.V. stand alone was USD 1,665,208 in 2025, as compared to USD 2,040,000 in 2024. The decrease in costs of 18.4% was mainly caused by the reduction in the number of Non-Executive Directors on the Board during 2025.
Neither OCI nor any of its subsidiaries have granted any personal loans or guarantees to Non-Executive Directors in 2025.
2025 Non-Executive Directors' remuneration entitlements and costs for OCI N.V.stand alone
2025 | 2024 | |||||||
|---|---|---|---|---|---|---|---|---|
Non-Executive Director | Main Board fees | Committee fees | Other1 | Total | Main Board fees | Committee fees | Other | Total |
Michael Bennett | 330,000 | 36,290 | 15,000 | 381,290 | 330,000 | 22,500 | 15,000 | 367,500 |
Dod Fraser | 165,000 | 22,500 | 15,000 | 202,500 | 165,000 | 22,500 | 15,000 | 202,500 |
Gregory Heckman | 165,000 | 22,500 | 15,000 | 202,500 | 165,000 | 22,500 | 15,000 | 202,500 |
Robert Jan van de Kraats | 165,000 | 36,270 | 5,000 | 206,270 | 165,000 | 50,000 | 7,500 | 222,500 |
Nadia Sawiris | 165,000 | 22,560 | 15,000 | 202,560 | 165,000 | 22,500 | 0 | 187,500 |
David Welch2 | 165,000 | 25,625 | 15,000 | 205,625 | 165,000 | 22,500 | 15,000 | 202,500 |
former Non-Executive Directors | ||||||||
Sipko Schat | 64,315 | 19,489 | 5,000 | 88,804 | 165,000 | 50,000 | 5,000 | 220,000 |
Heike van de Kerkhof | 64,315 | 17,540 | 5,000 | 86,855 | 165,000 | 45,000 | 5,000 | 215,000 |
Anja Montijn-Groenewoud | 64,315 | 19,489 | 5,000 | 88,804 | 165,000 | 50,000 | 5,000 | 220,000 |
Total | 1,347,944 | 222,264 | 95,000 | 1,665,208 | 1,650,000 | 307,500 | 82,500 | 2,040,000 |
- The other fees received by Non-Executive Directors in in 2025 and 2024 relate to travel allowances.
- David Welch is an independent Non-Executive Director. He also held a Board position in Fertiglobe from its listing end 2021 until 15 October 2024. In 2025, he received the 2024 Fertiglobe Board fees to the amount of AED 315,847 from Fertiglobe. In 2024, he received the 2023 Fertiglobe Board fees to the amount of AED 787,689 from Fertiglobe. As an independent Director, he received Board fees directly from Fertiglobe. OCI did not collect these fees, nor did the N&RC and the Board of OCI N.V. oversee these fees. Although Fertiglobe was a Group Undertaking, for this reason, his Fertiglobe fees are not included in the above figures.
Five Year Comparison
In this section, the annual developments in OCI's performance, the remuneration provided to the Board, and the average remuneration of employees of the company, including the CEO pay ratio, over the five most recent financial years, are presented in a comparative manner.
CEO pay ratio
The comparison between the developments in the annual total remuneration of Executive Directors and the average annual remuneration on a full-time equivalent basis of employees of the company other than the Executive Directors is reflected in the developments in the CEO pay ratio.
In line with the current Corporate Governance Code, the CEO pay ratio is established as the ratio between:
the total annual remuneration of the highest paid Board member, and
the average annual remuneration of the employees of the company and group companies whose financial data is consolidated by the company
whereby:
the total annual remuneration of the Executive Chair and the total annual remuneration of the employees in the financial year include all the remuneration components (such as fixed remuneration, variable cash remuneration (bonus), share-based part of the remuneration, employer contributions to social security, pension, and other benefits, other allowances, etc.) as included in the consolidated Group annual accounts on an IFRS basis;
the total annual remuneration of the employees in the financial year is determined by the total annual remuneration of the employees in the financial year as included in the consolidated Group annual accounts on an IFRS basis minus the total annual remuneration of the Executive Chair;
the average annual remuneration of the employees is determined by dividing the total annual remuneration of the employees in the financial year (as included in the consolidated annual accounts on an IFRS basis) by the average number of FTEs during the financial year; and
the value of the share-based component of the remuneration is determined at the time of assignment in accordance with the applicable rules under IFRS.
Using this calculation method, the CEO pay ratio is 14.3 in 2025 (25.5 in 2024). This 2025 CEO pay ratio reflects the value of the Executive Chair’s annual total remuneration as a percentage of the value of the annual average total remuneration of OCI employees globally in the respective financial year, the Executive Chair being the highest paid Board member in 2025. The N&RC has reviewed the 2025 CEO pay ratio and its development over time from an internal equity perspective, and considers it sufficiently aligned given the size of OCI, the nature of its staffing model, and the locations and the sector we operate in.
Five-year developments of this ratio are shown in the graph below. The CEO remuneration for 2024 and previous years shown in this graph reflects the remuneration of the CEO as a Board member, the CEO being the highest paid Board member in 2024 and previous years1.
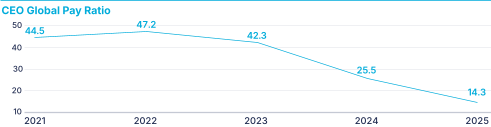
- This is the total remuneration for Ahmed El-Hoshy serving as CEO and Board member until 1 June 2024 as included in the consolidated Group annual accounts on an IFRS basis (for the 2024 CEO pay ratio, his remuneration is extrapolated for the entire year 2024, and also includes his Executive Director's remuneration that vested/ was paid in an accelerated manner on 1 June 2024 and 15 October 2024, respectively).
Development of directors’ remuneration, employee remuneration, and company performance
The tables the next two pages set out the change in OCI’s performance, the change in the average remuneration for employees at OCI (excluding the highest paid Director), and the change in remuneration for each (former) individual Director over the past five years.
The Board and the average employee remuneration and the year-on-year changes thereto are shown on an IFRS cost basis (OCI N.V. stand alone). Adjusted EBITDA and (Relative) TSR are considered the two main financial indicators reflecting the company's short-term and sustained long-term financial performance; these two financial metrics are also the main financial performance measures in the Executive Directors' variable compensation programs.
Company performance - 5-year comparison
OCI performance | 2025 | % change | 2024 | % change | 2023 | % change | 2022 | % change | 2021 | % change |
|---|---|---|---|---|---|---|---|---|---|---|
Adjusted EBITDA (USD million) | 121.6 | -85.3% | 825.8 | -32.0% | 1,214.2 | -68.8% | 3,891.0 | +54.0% | 2,526.5 | +190.5% |
Year-on-year TSR developments1 | 103.2 | -25.3% | 138.1 | -6.2% | 147.3 | -7.6% | 159.3 | +65.3% | 96.4 | +46.4% |
Relative TSR 2 | n/a | n/a | 92th percentile | +3.4% | 89th percentile | +25.4% | 71st percentile | +294.4% | 18th percentile | -69.0% |
- Year-on-year TSR developments against the 2013 base line of 100.
- In 2025, no 3-year relative TSR performance against peers as determined for the Executive Directors' long-term incentive programs was established as no Executive Directors' long-term incentives with a performance period ending in 2025 vested due to their forfeiture.
Employee remuneration- 5-year comparison
Average employee remuneration | 2025 | % change | 2024 | % change | 2023 | % change | 2022 | % change | 2021 | % change |
|---|---|---|---|---|---|---|---|---|---|---|
Average employee remuneration12 | 171,764 | 48.5% | 115,661 | +5.9% | 109,204 | +4.2% | 104,912 | +2.6% 2 | 102,293 2 | +9.8% 2 |
CEO pay ratio3456 | 14.3 | -44.1% | 25.5 | -39.6% | 42.3 | -10.4% | 47.2 | +6.0% | 44.5 | +13.5% |
- The average employee remuneration figures shown here represent the average employee remuneration compared to the CEO remuneration as used in the CEO pay ratio calculations.
- In the 2021 and 2022 Annual Reports, the average employee remuneration figures shown in this table were USD 99,927 (2021) and USD 112,265 (2022). These figures represented the average employee remuneration compared to the Other Executive Directors, i.e. the total annual remuneration of the employees in the financial year as included in the consolidated annual accounts on an IFRS basis minus the total annual remuneration of the Other Executive Directors. In this table, all 2021 to 2025 average employee remuneration figures represent the average employee remuneration compared to the CEO up to and including 2025 and compared to the Executive Chair as of 2025, as also included in the calculation of the (Board) CEO pay ratio.
- In the Remuneration Reports of the 2021 and 2022 Annual Reports (and earlier Annual Reports), the average employee remuneration in this table was referenced as the 'global employee reference group' and the CEO pay ratio as the '(global) internal pay ratio –" in this table.
- Compared to the disclosure in the 2022 Annual Report, the 2022 CEO pay ratio is restated from 43.2 to 47.2 to reflect an adjustment for other (not remuneration-related) personnel expenses in the average employee remuneration. As a result, the % change in the CEO pay ratio from 2021 to 2022 is restated from -2.9% to +6.0%.
- The 2024 CEO pay ratio reflects the ratio of the company cost for the annual total compensation for the organization's highest-paid Board member compared to the average annual total compensation for all employees in 2024, the CEO being the highest paid Board member in 2024. This is the total remuneration for Ahmed El-Hoshy serving as CEO and Board member until 1 June 2024 as included in the consolidated Group annual accounts on an IFRS basis and extrapolated for the entire year 2024; this includes his Executive Director's remuneration that vested/ was paid in an accelerated manner on 1 June 2024 and 15 October 2024, respectively.
- The 2025 CEO pay ratio reflects the ratio of the annual total compensation for the Executive Chair being the highest paid Board member in 2025 compared to the average annual total compensation for all employees in 2025.
Board remuneration - 5-year comparison
Executive Directors | 2025 | % change | 2024 | % change | 2023 | % change | 2022 | % change | 2021 | % change |
|---|---|---|---|---|---|---|---|---|---|---|
Nassef Sawiris | 2,527,238 | 15.6% | 2,186,451 | 11.4% | 1,962,744 | 33.0% | 1,475,981 | -52.2% | 3,086,600 | -22.4% |
Former Executive Directors(members of the Executive Committee) | ||||||||||
Hassan Badrawi | n/a | n/a | 1,582,587 | -54.8% | 3,499,068 | 7.6% | 3,251,431 | -14.4% | 3,797,040 | +17.8% |
Maud de Vries | n/a | n/a | 835,306 | -51.1% | 1,709,334 | -7.5% | 1,847,232 | 9.7% | 1,683,741 | +31.0% |
Former Executive Director(no longer in service) | ||||||||||
Ahmed El-Hoshy | n/a | n/a | 2,212,7551 | -49.9% | 4,421,022 | 3.9% | 4,253,252 | -6.6% | 4,555,423 | +32.7% |
- Ahmed El-Hoshy stepped down as Executive Director from the Board of OCI NV on 29 May 2024. On 15 October, 2024, upon closing of the sale of our equity holding in Fertiglobe to ADNOC, he left the company to join Fertiglobe. The amount shown reflects his 2024 Executive Director's remuneration.
Non-Executive Directors | 2025 | % change | 2024 | % change | 2023 | % change | 2022 | % change | 2021 | % change |
|---|---|---|---|---|---|---|---|---|---|---|
Michael Bennett | 381,290 | 3.8% | 367,500 | -2.6% | 377,500 | +22.8% | 307,500 | - | 307,500 | - |
Dod Fraser | 202,500 | 0.0% | 202,500 | -4.7% | 212,500 | +25.0% | 170,000 | - | 170,000 | - |
Gregory Heckman | 202,500 | 0.0% | 202,500 | -4.8% | 212,639 | +35.0% | 157,500 | - | 157,500 | - |
Robert Jan van de Kraats | 206,270 | -7.3% | 222,500 | -3.3% | 230,000 | +26.0% | 182,500 | - | 182,500 | - |
Nadia Sawiris | 202,560 | 8.0% | 187,500 | +31.7% | 142,329 | n/a | n/a | n/a | n/a | n/a |
David Welch1 | 205,625 | 1.5% | 202,500 | -4.7% | 212,500 | 34.9% | 157,500 | -31.9% | 231,359 | -6.5% |
former Non-Executive Directors | ||||||||||
Sipko Schat2 | 88,804 | -59.6% | 220,000 | -4.3% | 230,000 | +21.1% | 190,000 | - | 190,000 | - |
Heike van de Kerkhof3 | 86,855 | -59.6% | 215,000 | -1.1% | 217,479 | +38.1% | 157,500 | - | 157,500 | n/a |
Anja Montijn-Groenewoud4 | 88,804 | -59.6% | 220,000 | -4.3% | 230,000 | +29.6% | 177,500 | +2.4% | 173,333 | +3.5% |
Jérôme Guiraud | n/a | n/a | 76,4865 | -56.9% | 177,500 | - | 177,500 | - | 177,500 | +2.9% |
- David Welch is an independent Non-Executive Director. He also held a Board position in Fertiglobe from its listing end 2021 until 15 October 2024. In 2025, he received the 2024 Fertiglobe Board fees to the amount of AED 315,847 from Fertiglobe. In 2024, he received the 2023 Fertiglobe Board fees to the amount of AED 787,689 from Fertiglobe. As an independent Director, he received Board fees directly from Fertiglobe. OCI did not collect these fees, nor did the N&RC and the Board of OCI N.V. oversee these fees. Although Fertiglobe was a Group Undertaking, for this reason, his Fertiglobe fees are not included in the above figures.
- Sipko Schat stepped down from the Board on 21 May 2025; the amount shown represents his remuneration for the part of 2025 financial year he was a Director. No other remuneration was paid to him by OCI after his resignation from the Board.
- Heike van de Kerkhof stepped down from the Board on 21 May 2025; the amount shown represents her remuneration for the part of 2025 financial year she was a Director. No other remuneration was paid to her by OCI after her resignation from the Board.
- Anja Montijn-Groenewoud stepped down from the Board on 21 May 2025; the amount shown represents her remuneration for the part of 2025 financial year she was a Director. No other remuneration was paid to her by OCI after her resignation from the Board.
- Jérôme Guiraud stepped down from the Board on 3 May 2023; the amount shown represents his remuneration for the part of 2023 financial year he was a Director. No other remuneration was paid to him by OCI after his resignation from the Board.
Declarations
Introduction
This 2025 Annual Report comprises regulated information within the meaning of sections 1:1 and 5:25c of the Dutch Financial Supervision Act (Wet op het financieel toezicht).
For the consolidated and OCI 2025 financial statements (jaarrekening) within the meaning of section 2:361 of the Dutch Civil Code, reference is made to the financial statements. For the management report (jaarverslag) within the meaning of section 2:391 of the Dutch Civil Code, reference is made to the sections 1 Introduction, 2 About Us, 3 Our Performance, 4 Risk Management, 5 Corporate Governance (paragraphs Board report and Declarations), and 6 Performance Statements (paragraph Sustainability statement). OCI’s directors have signed the 2025 financial statements in line with section 2:101 paragraph 2 of the Dutch Civil Code.
Corporate governance statement
As referred to in article 2a of the Decree laying down additional requirements for Annual Reports (Besluit inhoud bestuursverslag) effective 1 January 2018 (the AR Decree), OCI is required to make a statement on corporate governance.
Information required to be included in the corporate governance statement as described in articles 3, 3a and 3b of the AR Decree can be found in the following sections of this Annual Report:
Information concerning compliance with the Dutch corporate governance code, as required by article 3 of the AR Decree, can be found in the Compliance with the Code section on page .
Information concerning OCI’s risk management and control frameworks relating to the financial reporting process, as required by article 3a(a) of the AR Decree, can be found in the Risk Management section beginning on page .
Information regarding the functioning of the General Meeting of Shareholders, and the authority and rights of OCI’s shareholders, as required by article 3a(b) of the AR Decree, can be found in the Shareholders’ rights and meetings section on page .
Information regarding the composition and functioning of OCI's Board and its Committees, as required by article 3a(c) of the AR Decree, can be found beginning on page .
Information regarding the diversity policy and concerning the composition of the Board, as required by article 3a(d) of the AR Decree, can be found in the Board composition and independence and Diversity & Inclusion sections on page .
Information concerning the requirements of the Decree Article 10 Takeover Directive (Besluit artikel 10 overnamerichtlijn), as required by article 3b of the AR Decree, can be found in the Decree Article 10 Takeover Directive section on page .
Information concerning the Board and Senior Leaders D&I Policy and the way in which it is implemented as required to be included in the corporate governance statement pursuant to best practice provision 2.1.6 of the Dutch corporate governance code can be found in section Diversity & inclusion of the Board Report on page .
The Dutch corporate governance code was first adopted in 2003 and amended in 2008, 2016, 2022 and 2025. The corporate governance code is available on the Corporate Governance Monitoring Committee website (http://www.mccg.nl).
In control statement
The Board is responsible for the design, implementation and operation of the internal risk management and control systems. In discharging this responsibility, the Board has assessed the design and effectiveness of OCI’s internal control and risk management systems which includes an assessment of our business conduct in relation to the treatment of the environment, people, and our policies and procedures to address bribery and corruption.
In performing its assessment of the risk management and control systems for the financial year 2025, the Board applied the COSO criteria to the design and operation of OCI’s internal risk management and control systems across strategic, operational, compliance and reporting risks. The assessment was informed by quarterly risk reviews, entity‑level Controls Self‑Assessments, Internal Audit testing under the IIA Standards, and management certifications. During the reporting year 2025, no significant deficiencies were identified in the internal risk management and control systems that would prevent their effective functioning. Where control gaps were noted, remediation actions have been initiated and are being monitored by management and the Audit Committee.
The Board recognizes the inherent limitations of internal risk management and control systems. Whilst OCI continuously works towards improving its processes and procedures, these systems cannot provide absolute certainty that all risks have been identified or are effectively mitigated. The level of certainty that can be provided is influenced by, among other things, inherent limitations to risk management, business considerations such as the company's risk appetite, the complexity of the company's operations, and the dynamic nature of the business environment.
Certain risks remain outside the company's direct control, as they depend on third parties or external circumstances beyond the organization's influence.
The principal risks the company faces, the company's risk management framework and the company's risk appetite are described in the Risk Management section of this management report.
Based on the aforementioned assessment and in accordance with the Dutch Governance Code, the Board states to the best of its knowledge and belief that:
The 2025 Board Report provides sufficient insights into any failings in the effectiveness of the internal risk management and control systems;
The internal risk management and control systems provide reasonable assurance that the 2025 financial statements do not contain any errors of material importance;
The internal risk management and control systems provide limited assurance that the 2025 sustainability reporting in the sustainability statement does not contain material inaccuracies.
The Board is not aware that the risk management and internal control systems, at the balance sheet date, do not provide sufficient comfort that the material operation and compliance risks identified in the Risk Management section of the Annual Report are effectively managed considering the company's risk appetite taking into account the complexity of the enterprise, the inherent limitations of these systems and the related disclosures in the Board report.
Based on the current state of affairs, it is justified that the financial reporting is prepared on a going concern basis; and
The 2025 Annual Report states the material strategic, operational, compliance, and reporting risks and the uncertainties to the extent they are relevant to the expectations of OCI’s continuity for the period of 12 months after the preparation of the 2025 Annual Report.
The above statements do not imply that our systems and procedures provide absolute assurance as to the realization of our operational, strategic, financial, and compliance business objectives, nor that they can prevent all misstatements, inaccuracies, errors, fraud and non-compliances with legislation, rules and regulations.
Directors’ statement pursuant to article 5:25c of the Dutch Financial Supervision Act
In accordance with Article 5:25c of the Dutch Financial Supervision Act (Wet op het financieel toezicht), the Directors declare that to the best of their knowledge:
The 2025 financial statements (jaarrekening) provide a true and fair view of the assets, liabilities, financial position and results of OCI and its subsidiaries included in the consolidated statements.
The Board Report (bestuursverslag) provides a true and fair view of the situation as at 31 December 2025, and of OCI's and its Group companies state of affairs for the financial year 2025, as well as the principal risks and uncertainties OCI faces.
The sustainability statement included in the Board Report has been drawn up in accordance with the sustainability reporting standards referred to in Article 29b ter of the Accounting Directive and with the specifications established pursuant to Article 8(4) of Regulation (EU) 2020/852 of the European Parliament and of the Council of 18 June 2020 of the establishment of a framework to facilitate sustainable investment, and amending Regulation (EU) 2019/2088.
The two non‑executive directors appointed in January 2026, pursuant to the ruling of the Enterprise Chamber of the Amsterdam Court of Appeals, have not co‑signed this Annual Report and the accompanying audited financial statements. Pursuant to their special mandate, they wish to adopt as neutral and independent a position as possible vis-à-vis the parties involved in the inquiry proceedings. They regard the signing of the 2025 financial statements as an act that is incompatible with that position. This decision should not be interpreted as expressing any disagreement in respect of the content of the Annual Report or the audited financial statements.
The court‑appointed directors have confirmed that they have been kept informed throughout the preparation process, had full access to all relevant information, and were afforded opportunity to review and discuss the Annual Report and the audited financial statements prior to publication. Their decision not to co-sign does not affect the validity, completeness, or timely publication of the Annual Report.
The following directors acknowledge their confirmations made above:
Mr. J.F. Breek
Mr. C.M. Molhuysen
Amsterdam, the Netherlands, 10 April 2026
The Board
David Welch
Dod Fraser
Gregory Heckman
Michael Bennett
Nadia Sawiris
Nassef Sawiris
Robert Jan van de Kraats
6 Performance Statements
Financial statements
Consolidated financial statements
Consolidated statement of financial position
As at 31 December
$ millions | Note | 31 December 2025 | 31 December 2024 |
|---|---|---|---|
Assets | |||
Non-current assets | |||
Property, plant and equipment | (7) | ||
Right-of-use assets | (7) | ||
Goodwill and other intangible assets | (8) | ||
Trade and other receivables | (9) | ||
Equity-accounted investees | (10) | ||
Financial assets at fair value through other comprehensive income | (11) | ||
Total non-current assets | |||
Current assets | |||
Inventories | (13) | ||
Trade and other receivables | (9) | ||
Income tax receivables | (12) | ||
Cash and cash equivalents | (14) | ||
Assets held for sale | (22) | ||
Total current assets | |||
Total assets | |||
Equity | |||
Share capital | (15) | ||
Share premium | (15) | ||
Reserves | (16) | ( | ( |
Retained earnings | |||
Equity attributable to owners of the Company | |||
Non-controlling interests | (17) | ||
Total equity | |||
Liabilities | |||
Non-current liabilities | |||
Lease obligations | (19) | ||
Trade and other payables | (20) | ||
Provisions | (21) | ||
Deferred tax liabilities | (12) | ||
Total non-current liabilities | |||
Current liabilities | |||
Loans and borrowings | (18) | ||
Lease obligations | (19) | ||
Trade and other payables | (20) | ||
Provisions | (21) | ||
Income tax payables | (12) | ||
Liabilities held for sale | (22) | ||
Total current liabilities | |||
Total liabilities | |||
Total equity and liabilities |
The notes on pages to are an integral part of these consolidated financial statements.
Consolidated statement of profit or loss and other comprehensive income
For the year ended 31 December
$ millions | Note | 2025 | 2024 |
|---|---|---|---|
Revenue | (28) | ||
Cost of sales | (23) | ( | ( |
Gross profit | |||
Other income | (24) | ||
Selling, general and administrative expenses | (23) | ( | ( |
Impairment losses on financial instruments | (9) | ( | |
Other expenses | (25) | ( | ( |
Operating loss | ( | ( | |
Finance income | (26) | ||
Finance cost | (26) | ( | ( |
Net foreign exchange (loss) / gain | (26) | ( | |
Net finance (cost) / income | ( | ||
Share of results of equity-accounted investees | (10) | ||
Loss before income tax | ( | ( | |
Income tax | (12) | ( | |
Loss from continuing operations | ( | ( | |
Profit from discontinued operations | (22) | ||
Net profit | |||
Other comprehensive income / (loss), net of tax | |||
Items that are or may be reclassified subsequently to profit or loss | |||
Movement in hedge reserve | (16) | ( | |
Movement in hedge reserve equity-accounted investees | (10) | ( | |
Currency translation differences from foreign operations | (16) | ( | |
Currency translation differences from foreign equity-accounted investees | ( | ||
Items that will not be reclassified to profit or loss | |||
Changes in the fair value of financial assets designated as fair value through other comprehensive income | (11) | ||
Other comprehensive income / (loss), net of tax | ( | ||
Total comprehensive income | |||
Net profit attributable to owners of the Company | |||
Net profit attributable to non-controlling interests | (17) | ||
Net profit | |||
Total comprehensive income attributable to owners of the Company | |||
Total comprehensive income attributable to non-controlling interests | (17) | ||
Total comprehensive income | |||
Basic loss per share from continuing operations (in USD) | (27) | ( | ( |
Diluted loss per share from continuing operations (in USD) | (27) | ( | ( |
Basic earnings per share attributable to owners of the Company (in USD) | (27) | ||
Diluted earnings per share attributable to owners of the Company (in USD) | (27) |
The notes on pages to are an integral part of these consolidated financial statements.
Consolidated statement of changes in equity
$ millions | Share capital | Share premium | Reserves | (Accumulated losses) / Retained earnings | Equity attributable to owners of the Company | Non-controlling interests | Total equity |
|---|---|---|---|---|---|---|---|
Balance at 1 January 2024 | ( | ( | |||||
Net profit | |||||||
Other comprehensive expense | ( | ( | ( | ( | |||
Total comprehensive income / (expense) | ( | ||||||
Impact difference in profit sharing non-controlling interests | |||||||
Dividend to non-controlling interests | ( | ( | |||||
Share capital increase1 | ( | ||||||
Capital repayment1 | ( | ( | ( | ||||
Issuing shares | ( | ||||||
Dividend payment | ( | ( | ( | ||||
Treasury shares sold / delivered | ( | ( | ( | ||||
Treasury shares acquired | ( | ( | ( | ||||
Share-based payments | |||||||
Repurchase of OCI Methanol Minorities | ( | ( | ( | ||||
Sale of shares in Fertiglobe | ( | ( | |||||
Balance at 31 December 2024 | ( | ||||||
Net profit | |||||||
Other comprehensive income | |||||||
Total comprehensive income | |||||||
Dividend to non-controlling interests | ( | ( | |||||
Share capital increase1 | ( | ||||||
Capital repayment1 | ( | ( | ( | ||||
Dividend payment | ( | ( | ( | ||||
Treasury shares sold / delivered | ( | ||||||
Treasury shares acquired | ( | ( | ( | ||||
Transfer of loss on disposal of equity investments | ( | ||||||
Share-based payments | ( | ( | ( | ||||
Balance at 31 December 2025 | ( |
- Share capital movements relate to the increase and subsequent decrease in the nominal value of the ordinary shares, to facilitate capital repayments.
The notes on pages to are an integral part of these consolidated financial statements.
Consolidated statement of cash flows
For the year ended 31 December
$ millions | Note | 2025 | 2024 |
|---|---|---|---|
Net loss from continuing operations | ( | ( | |
Adjustments for: | |||
Depreciation, amortization and impairment | (23) | ||
Gain from sale of associate | (24) | ( | |
Finance income | (26) | ( | ( |
Finance expense | (26) | ||
Net foreign exchange loss / (gain) | (26) | ( | |
Share of results of equity-accounted investees | (10) | ( | ( |
Equity-settled share-based payment transactions | (23.3) | ||
Income tax (benefit) / expense | (12) | ( | |
Changes in: | |||
Inventories | (13) | ( | |
Trade and other receivables | (9) | ( | ( |
Trade and other payables | (20) | ||
Provisions | (21) | ( | |
Cash flows: | |||
Interest paid | ( | ( | |
Lease interest paid | (19) | ( | ( |
Interest received | |||
Settlement interest derivatives | ( | ||
Net income tax paid | (12) | ( | ( |
Net cash (used in) / from operating activities - discontinued operations | ( | ||
Cash flow (used in) / generated from operating activities | ( | ||
Investments in property, plant and equipment and intangible fixed assets | (7) | ( | ( |
Cash paid to fund Clean Ammonia project1 | (20) | ( | ( |
Dividend from investments | |||
Net proceeds from disposal of investments | |||
Sale of investment in associate | |||
Net cash used in investing activities - discontinued operations | ( | ( | |
Cash flow generated from investing activities | |||
Proceeds from borrowings | (18) | ||
Repayment of borrowings | (18) | ( | ( |
Payment of lease obligations | (19) | ( | ( |
Purchase of treasury shares | ( | ( | |
Distributions paid to owners of the Company | (15) | ( | ( |
Withholding tax on dividends to owners of the Company | (15) | ( | ( |
Dividends paid to non-controlling interests | (17) | ( | |
Repurchase of OCI Methanol Minorities | (17) | ( | |
Settlement FX derivatives | ( | ||
Net cash used in financing activities - discontinued operations | ( | ( | |
Cash flow used in financing activities | ( | ( | |
Net cash flow | ( | ||
Net (decrease) / increase in cash and cash equivalents | ( | ||
Cash and cash equivalents at start of period | |||
Effect of exchange rate fluctuations on cash held | ( | ( | |
Cash and cash equivalents included in assets held for sale disposed | ( | ( | |
Cash and cash equivalents at end of period | |||
Cash and cash equivalents in statement of financial position | (14) | ||
Cash and cash equivalents included in assets held for sale | (22) | ||
Bank overdraft repayable on demand | (18) | ( | ( |
Cash and cash equivalents in statement of cash flows |
- Cash paid to fund the Clean Ammonia project has been re-presented from operating to investing activities in 2024 to align with the presentation in 2025.
For non-cash movements in loans and borrowings and lease obligations, reference is made to notes 18 and 19, respectively.
The notes on pages to are an integral part of these consolidated financial statements.
Notes to the consolidated financial statements
For the year ended 31 December
1 General
2 Basis of preparation
2.1 General
The consolidated financial statements have been prepared in accordance with International Financial Reporting Standards as adopted by the European Union (IFRS-EU). The consolidated financial statements have been prepared on the historical cost convention, except when otherwise indicated.
The financial year of the Group commences on 1 January and ends on 31 December. The Company's functional currency is the Euro (‘EUR’). The Group’s presentation currency is the US dollar, as the Group’s major contractual benefits and obligations are denominated in US dollar. All values are rounded to the nearest tenth of a million (in millions of USD), except when stated otherwise.
On 27 June 2025, OCI closed the sale of the Methanol division and during 2025 it returned capital to shareholders in the amount of USD 1.7 billion, thereby significantly reducing the size of OCI’s operations and values reported as continuing operations. Accordingly, management reassessed the materiality thresholds applicable for determining the required disclosures in accordance with IAS 1 and other relevant standards.
On 23 November 2025, OCI entered into an agreement for the sale of 100% of its equity interests in the OCI Ammonia Holding B.V ('Ammonia distribution business') to AGROFERT, a.s. The entities in scope of this sale agreement are classified as held for sale but do not meet the criteria for discontinued operations per IFRS 5. The transaction closed on 31 March 2026. Please refer to note 33 Subsequent events for further details.
On 22 September 2025, OCI announced that it was pursuing a potential sale of its remaining business to Orascom Construction PLC. Subsequently, on 9 December 2025, OCI announced that it and Orascom Construction PLC had reached an agreement in respect of their envisaged sale, subject to shareholder approval. Based on management’s assessment of the proposed transaction as at 31 December 2025, the Group concluded that the criteria for classification as held for sale and discontinued operations under IFRS 5 were not met. The Enterprise Chamber introduced certain provisional governance measures in January 2026, extending the timeline for the evaluation of this proposed or similar transactions with Orascom Construction PLC. In 2026, should there be material changes to the Company's business model or operations, management will reassess the impact on the estimates and disclosures in these financial statements and disclose any resulting changes in our future financial reporting.
The consolidated statement of financial position in 2025 and in 2024 separately disclose the assets and liabilities held for sale, adhering to the requirements of IFRS 5. Further information is included in note 22 Discontinued operations and assets & liabilities held for sale.
These financial statements have been authorized for issue by the Company's Board of Directors on 10 April 2026. These consolidated financial statements are subject to adoption by the Annual General Meeting of Shareholders.
2.2 Going concern
We have performed an assessment of the entity's ability to continue as a going concern for at least 12 months from the date of preparation of the consolidated financial statements and have not identified any events or conditions that may cast significant doubt on the entity's ability to continue as a going concern.
The going concern assessment included, amongst others, the impact of the completion of the sale of the Ammonia distribution business on 31 March 2026, (potential) settlement of indemnification liabilities and provisions, the funding of the remaining construction costs required to complete Woodside's Beaumont New Ammonia ("BNA") project including claims, the subsequent collection of the deferred consideration after completion of Woodside's Beaumont New Ammonia ("BNA") project on 25 March 2026, the sale of the Methanex shares subsequent to year-end for proceeds of USD 287.9 million, and the performance of the continuing business, including the operations of OCI Nitrogen B.V., ongoing corporate and transaction costs, as well as available credit facilities.
We have also prepared a forecast for the continuing operations, including cash flows for at least 12 months from the date of preparation of the financial statements and taking into account the developments in the industry and market price developments in gas, ammonia and fertilizer. Please refer to note 6.4 Capital management for further details. We further note that, as at the date of the financial statements and in preparing the going concern assessment, material aspects of the ongoing strategic review have been considered insofar as strategic developments are approved by the board and their realization is considered probable. We will continue to update this assessment in line with the Company's strategic developments.
2.3 Climate action integrated in strategic objectives
OCI is committed to environmental principles integrated into our strategic objectives. Following our strategic review and divestment of several facilities, OCI’s previous climate mitigation targets are under review as the material structure of our business has changed.
For OCI’s decarbonization roadmap, refer to the section Decarbonization roadmap and for the latest environmental performance, refer to the section Environmental performance of the Annual Report.
The impact of this climate roadmap has been considered when preparing these consolidated financial statements. For more information, refer to note 5 Critical accounting judgment, estimates and assumptions.
3 Material accounting policies
The Group has applied the accounting policies set out in note 3 consistently over both periods presented in these consolidated financial statements.
3.1 Consolidation
The consolidated financial statements include the financial statements of OCI, its subsidiaries and the Group’s interests in associates.
Subsidiaries
Subsidiaries are all companies to which OCI has power over the relevant activities of the investee, is exposed or has rights to variable returns from its involvement with the investee and has the ability to affect those returns through its power over the investee. Generally, control accompanies a shareholding of more than half of the shares issued and related voting power. Subsidiaries are fully consolidated from the date that control commences until the date that control ceases.
When the Group loses control over a subsidiary, it derecognizes the assets and liabilities of the subsidiary, and any related non-controlling interests and other components of equity. Any investment retained in the former subsidiary is recognized at fair value. The fair value shall be regarded as the fair value on initial recognition of a financial asset or, when appropriate, the cost on initial recognition of an investment in an associate. Any resulting gain or loss is recognized in profit or loss including related cumulative translation adjustments accumulated in other comprehensive income. If a subsidiary becomes an associate, the interest retained is subsequently measured in accordance with the equity method. The principal subsidiaries are listed in note 35.
Transactions eliminated in the consolidated financial statements
Intra-group balances and transactions, and any unrealized income and expenses arising from intra-group transactions, are eliminated in preparing the consolidated financial statements. Unrealized gains arising from transactions with equity-accounted investees are eliminated against the investment to the extent of the Group’s interest in the investees. Unrealized losses are eliminated in the same way as unrealized gains, but only to the extent that there is no evidence of impairment.
Non-controlling interests
Non-controlling interests are presented as a separate component in equity. ‘Profit or loss’ and ‘Total comprehensive income’ attributable to the non-controlling interests are presented as a separate line item in the consolidated statement of profit or loss and other comprehensive income.
Non-controlling interests are measured at their proportionate share of the acquiree’s identifiable net assets at the balance sheet date. Changes in the Group’s ownership interest in a subsidiary that do not result in a loss of control are accounted for as equity transactions. Non-controlling interests are derecognized when the underlying subsidiary is divested.
3.2 Equity-accounted investees
Associates
Associates are companies in which the Group exercises significant influence over the financial and operating policies, but does not have control. Significant influence is presumed to exist when the Group holds 20% to 50% of the outstanding shares and related voting rights of the investee. Associates are accounted for under the equity method. The Group’s share of the profit or loss of an associate is recognized in the Group's profit or loss from the date when significant influence begins up to the date when that significant influence ceases.
The Group's share of the other comprehensive income of an investee is recognized in consolidated other comprehensive income. Unrealized gains on transactions between the Group and its associates are eliminated to the extent of the Group’s interest in associates. Unrealized losses are eliminated unless the transaction provides evidence of an impairment of the asset transferred. Unrealized gains on transactions between two associates are not eliminated. Investments in associates with negative shareholder’s equity are impaired. The Group’s share of losses in an associate may equal or exceed its interest in the associate (which includes any long-term interest that, in substance, forms part of the Group’s net investment in an associate). In these cases, the Group recognizes a provision for further losses only to the extent that the Group has incurred a legal or constructive obligation or made payments on behalf of the associate.
3.3 Foreign currency
Foreign currency transactions
The financial statements of foreign operations, including subsidiaries, and associates, are prepared in the currencies which are determined based on the primary economic environment in which they operate (‘the functional currency’).
Transactions in currencies other than the functional currency are recorded at the rates of exchange prevailing on the transaction dates. At each balance sheet date, monetary items denominated in foreign currencies are revalued into the entity's functional currency at the then prevailing closing-rates.
Exchange differences arising on the settlement and translation of monetary items are included in profit or loss for the period, except when deferred to other comprehensive income for financial assets at fair value through other comprehensive income and the effective part of qualifying cash flow hedges.
Foreign currency translation
Upon consolidation, the assets and liabilities of subsidiaries with a functional currency other than the US dollars are translated into US dollars using the exchange rates prevailing at the balance sheet date. Income and expense items are translated using exchange rates prevailing at the date of the transactions. Investments in associates with a functional currency other than the US dollars are translated into US dollars using exchange rates prevailing on the balance sheet date. Exchange rate differences arising during consolidation and on the translation of investments in subsidiaries, associates and monetary items that form part of net investments in foreign operations are included in other comprehensive income, as ‘Currency translation differences’.
When a foreign operation is (partly) disposed of or sold, (the proportionate share of) the related currency translation differences that were recorded in other comprehensive income are recycled to profit or loss as part of the gain or loss on disposal or sale. Goodwill and fair value adjustments arising on the acquisition of a foreign subsidiary are considered as assets and liabilities denominated in the functional currency of the foreign subsidiary.
3.4 Cash and cash equivalents
Cash and cash equivalents comprise cash balances and call deposits with original maturities of three months or less from the acquisition date (original maturity) that are subject to an insignificant risk of changes in their fair value and are used by the Group in the management of its short-term commitments. Restricted cash comprises cash balances where specific restrictions exist on the Group's ability to use this cash.
3.5 Equity attributable to owners of the Company
Ordinary shares are classified as equity. Share premium is the excess amount received over the par value of the shares. Incremental costs directly attributable to the issue of new shares are recognized in equity as a deduction, net of tax, from the proceeds. When ordinary shares are repurchased, the amount of the consideration paid, which includes directly attributable costs, net of tax effects, is recognized as a deduction from ‘Reserves’. Repurchased shares are classified as treasury shares and are presented in ‘Reserves’. When treasury shares are sold or reissued subsequently, the amount received is recognized as an increase in ‘Reserves’, and the resulting surplus or deficit on the transaction is presented in share premium.
3.6 Property, plant and equipment
Items of property, plant and equipment are measured at cost less accumulated depreciation and any impairment. Cost includes any expenditure that is directly attributable to the acquisition of the asset. The cost of self-constructed assets includes cost of material, direct labor, other directly attributable cost incurred to bring the asset ready to its intended use, including the cost of asset retirement obligations and any capitalized borrowing cost.
Purchased software that is integral to the functionality of the related equipment is capitalized as part of that equipment. When different parts of property, plant and equipment have different useful lives, they are accounted for as separate items (major components) of property, plant and equipment.
Any gain or loss on disposal of an item of property, plant and equipment (calculated as the difference between the net proceeds from disposal and the carrying amount of the item) is recognized in profit or loss. Subsequent expenditures are capitalized only when it is probable that the future economic benefits associated with the expenditure will flow to the Group. Ongoing repairs and maintenance costs are expensed as incurred. Spare parts of property, plant and equipment are recognized under property, plant and equipment if the average turnover exceeds 12 months or more, the cost exceeds USD 10,000 and the part is key for the functioning of the plant. Other spare parts are recognized within inventories.
Property, plant and equipment under construction
Expenditures incurred for purchasing and constructing property, plant and equipment are initially recorded as ‘under construction’ until the asset is completed and ready for use. Upon the completion of the assets, the recognized costs are reclassified from ‘under construction’ to its final category of property, plant and equipment. Assets under construction are not depreciated and are measured at cost less any impairment losses.
Depreciation
Items of property, plant and equipment are depreciated on a straight-line basis through profit or loss over the estimated useful lives of each component, taking into account any residual values. Land is not depreciated. Items of property, plant and equipment are depreciated from the date that they are installed and are ready for use, or in respect of internally constructed assets, from the date that the asset is completed and ready for use.
Depreciation methods, useful lives and residual values are reviewed at each reporting date and adjusted if necessary by the Group.
The estimated useful lives for items of property, plant and equipment are as follows: | Years |
|---|---|
Buildings | 10 - 50 |
Plant and equipment | 4 - 25 |
Fixtures and fittings | 3 - 10 |
Borrowing costs
Borrowing costs attributable to the acquisition, construction or production of assets that necessarily take a substantial period of time to get ready for their intended use or sale, are recognized as part of the cost of those assets. All other borrowing costs are recognized as ‘Finance cost’ in the period in which they are incurred.
3.7 Goodwill and other intangible assets
Goodwill
Goodwill represents the excess of total consideration transferred over the sum of the net amount of identifiable assets acquired and liabilities assumed and the non-controlling interest of the acquiree. If the fair value of the net assets acquired is in excess of the aggregate consideration transferred, the gain is recognized in profit or loss.
Goodwill on acquisition of entities that qualify as subsidiaries is presented under ‘Goodwill and intangible assets’. Goodwill on acquisitions of entities that qualify as associates is included in ‘Equity-accounted investees’. Goodwill on acquisition of subsidiaries is allocated to cash-generating units for the purpose of impairment testing. The allocation is made to those cash-generating units or group of units that are expected to benefit from the business combination through which the goodwill arose, based on past experience.
Goodwill is initially measured at cost. After initial recognition, goodwill is measured at cost less any impairment losses. Goodwill is tested annually for impairment; an impairment loss is recognized for the amount by which the cash-generating unit’s carrying amount exceeds its recoverable amount. The recoverable amount of the cash-generating unit is determined by the higher of its fair value less cost to sell and its value in use. Impairment losses on goodwill are not reversed. Gains or losses on the disposal of an entity include the carrying amount of goodwill related to the entity sold. All other expenditures on internally-generated goodwill and other intangible assets are recognized in profit or loss as incurred.
3.8 Inventories
Inventories are measured at the lower of cost and net realizable value. The cost of inventories of raw materials, spare parts and supplies are based on the weighted average principle or the first-in-first-out method, and includes expenditures incurred in acquiring the inventories and bringing them to their existing location and condition. In case of manufactured inventories and work in progress, cost includes an appropriate share of production overheads based on normal operating capacity. Net realizable value is the estimated selling price in the ordinary course of business, less the estimated costs of completion and selling expenses.
3.9 Impairment of non-financial assets
Non-financial assets that have an indefinite useful life, for example goodwill, are not subject to amortization but are tested annually for impairment or more frequently when indicators of impairment arise. Assets with a finite useful life are subject to depreciation or amortization and are reviewed at each reporting date to determine whether there is an indication of impairment. If any such indication exists, then the assets’ recoverable amount is estimated.
For the purpose of assessing impairment, assets are grouped based on the lowest level for which there are separately identifiable cash flows (cash-generating units). An impairment loss is recognized for the amount by which the assets’ carrying amount exceeds its recoverable amount. The recoverable amount is the higher of an asset’s fair value less costs of disposal and its value in use. The value in use is the present value of the future cash flows expected to be derived from an asset or cash-generating unit by continued use. Impairment losses are recognized in profit or loss.
Non-financial assets, which are impaired, are tested periodically to determine whether the recoverable amount has increased and the impairment be (partially) reversed. Impairment losses on goodwill are not reversed.
For other assets, an impairment loss is reversed only to the extent that the asset’s carrying amount does not exceed the carrying amount that would have been determined, net of depreciation or amortization, if no impairment loss had been recognized. Reversal of impairments is only permitted if, in a subsequent period after an impairment loss has been recognized, the amount of the impairment loss decreases and the decrease can be related objectively to an event after the impairment loss was recognized.
3.10 Financial instruments
Financial assets
IFRS 9 contains three principal classification and measurement categories for financial assets: amortized cost, fair value through profit or loss (‘FVTPL’) and fair value through other comprehensive income (‘FVOCI’). The classification of financial assets under IFRS 9 is generally based on the business model in which a financial asset is managed and its contractual cash flow characteristics. Under IFRS 9, derivatives embedded in contracts where the host is a financial asset in the scope of the standard are never separated. Instead, the hybrid financial instrument as a whole is assessed for classification.
Amortized cost
Trade and other receivables are held to collect contractual cash flows and are expected to give rise to cash flows representing solely payments of principal and interest. The Group analyzed the contractual cash flow characteristics of those instruments and concluded that they meet the ‘hold-to-collect’ business model criteria for amortized cost measurement. Interest income from these assets is included in finance income using the effective interest rate method. Any gain or loss on derecognition is recognized directly in profit or loss. The Group sells certain trade receivables under a securitization agreement to a third party. For these selected debtors the Group will use the ‘hold-to-collect-and-sell business model’ as defined under IFRS 9 and will measure these receivables going forward at FVOCI.
Fair value through profit or loss (‘FVTPL’)
Derivative financial instruments held by the Group are classified in the category FVTPL, unless the instrument is designated in a hedge relationship and the hedge meets the requirements for hedge accounting.
Fair value through other comprehensive income (‘FVOCI’)
Equity investments, previously recognized as available-for-sale assets, are measured at FVOCI, based on the irrevocable election made by the Group. The Group elected this approach as these investments are not held for trading. Movements in the carrying amount are recognized in other comprehensive income, except for the recognition of impairment gains and losses, and interest income which are recognized in the profit or loss.
On derecognition the cumulative gain or loss recognized in other comprehensive income is not recycled from equity to profit or loss, and this cumulative change is reclassified within equity from accumulated other comprehensive income to retained earnings. Dividend income is recognized in profit or loss when the Group’s right to receive payment is established.
Gas purchase contracts
The Group has physical purchase contracts in place to procure natural gas for its production activities. These contracts are not accounted for as financial instruments if they meet the criteria for the own use exemption. The own use exemption applies to contracts that are entered into and continue to be held for the receipt of a non-financial item in accordance with the Group’s expected purchase, sale or usage requirements and where the Group does not have a past practice of settling these contracts for a net amount of cash.
Net investment hedging
When a derivative instrument or a non-derivative financial liability is designated as the hedging instrument in a hedge of a net investment in a foreign operation, the effective portion of changes in the fair value of a derivative or foreign exchange gains and losses for a non-derivative is recognized in other comprehensive income and presented in the translation reserve within equity. Any ineffective portion of the changes in the fair value of the derivative or foreign exchange gains and losses on the non-derivative is recognized immediately in profit or loss. The amount recognized in other comprehensive income is fully or partially reclassified to profit or loss as a reclassification adjustment on disposal or partial disposal of the foreign operation that results in a loss of control, respectively.
Securitization of trade receivables
The Group enters into securitization arrangements under which certain trade receivables are transferred to an external financial institution on a non-recourse basis. As substantially all risks and rewards of ownership are transferred, the receivables are derecognised upon transfer in accordance with IFRS 9. Where customer payments are subsequently received by the Group in respect of derecognised receivables, a corresponding payable to the financial institution is recognized until settled.
Cash flow hedge accounting
When a derivative is designated as a cash flow hedging instrument, the effective portion of changes in the fair value of the derivative is recognized in other comprehensive income and accumulated in the hedging reserve. The effective portion of changes in the fair value of the derivative that is recognized in other comprehensive income is limited to the cumulative change in fair value of the hedged item, determined on a present value basis, from inception of the hedge. Any ineffective portion of changes in the fair value of the derivative is recognized immediately in profit or loss. Net investment hedge accounting is discontinued when the hedging relationship ceases to meet the qualifying criteria as per IFRS 9, which includes when the hedging instrument expires or is terminated.
Financial liabilities
Financial liabilities, like loans and borrowings and trade and other payables, are measured at amortized cost, unless the financial liability:
Is a derivative at FVTPL;
Arose from the transfer of a financial assets that does not qualify for derecognition or if the continuing involvement approach applies;
Is a financial guarantee contract;
Is a commitment to provide a loan at a below-market interest rate; or
Is a contingent consideration resulting from a business combination to which IFRS 3 applies, measured at FVTPL.
Impairment
The impairment model requires the recognition of impairment provisions based on expected credit losses (ECL) rather than only incurred credit losses. The Group allocates each exposure to a credit risk grade based on data that is determined to be predictive of the risk of loss (including but not limited to external ratings, audited financial statements, management accounts, cash flow projections and available press information about customers) and applies experienced credit judgment. Credit risk grades are defined using qualitative and quantitative factors that are indicative of the risk of default and are aligned to external credit definitions from agencies (Standard & Poor’s). Exposure within each credit risk grade are segmented by geographic region classification and an ECL rate is calculated for each segment based on delinquency status and actual credit loss experience over the past seven years (if possible). These rates are multiplied by scalar factors to reflect differences between economic conditions during the period over which historical data has been collected, current conditions and the Group's view of economic conditions over the expected lives of the financial instruments.
Impairment of non-derivative financial assets
For the assessment of loss allowance for expected credit losses, a simplified model for trade receivables is applied. The loss allowance is measured at initial recognition and throughout the life of the receivable at an amount equal to lifetime ECL. They are estimated based on the present value of all cash shortfalls over the remaining expected life of the financial asset, i.e., the difference between:
The contractual cash flows that are due to an entity under the contract, and;
The cash flows that the holder expects to receive.
In order to assess the lifetime ECLs for trade receivables, both historic credit losses experience and forward-looking information is assessed. Expected losses on trade receivables are recognized on a separate line item in the statement of profit and loss, if any.
For other receivables (and other financial assets) the Group measures the loss allowance at an amount equal to the lifetime ECLs if the credit risk on that financial instrument has increased significantly since initial recognition. If at the reporting date, the credit risk of other receivables has not increased significantly since initial recognition, the Group measures the loss allowance for that financial instrument at an amount equal to 12-month ECL.
Valuation of derivative financial assets and financial liabilities
Derivative financial assets and derivative financial liabilities are measured at fair value. The Group investigates whether the counterparty’s creditworthiness gives rise to a change in fair value. When determining the fair value, credit value and debit value adjustments are taken into account.
3.11 Fertiglobe Escrow Indemnifications
As agreed between ADNOC and OCI as part of the sale of OCI's equity interests in Fertiglobe on 15 October 2024, a portion of the consideration was placed in an escrow arrangement. The receipt of any portion of this amount is contingent upon the expiration or settlement of a defined subset of indemnifications agreed within the transaction, which are based on the occurrence or non-occurrence of future events outside of the control of OCI. Under the mechanism, OCI could also be liable for a payment to the buyer in the case that the indemnities exceed the amount held in escrow. In any case, contractually the settlement of the release of consideration held in escrow and the indemnity liabilities is to be executed on a net basis. Consistent with both the substance of the transaction and its legal form, the amount held in escrow and the indemnification liability are presented on a net basis. Refer to note 22.4 Estimate of Fertiglobe Indemnifications and Earn-Out Mechanism. Changes in the measurement of the net asset or net liability are reflected as part of gain from the sale, presented as discontinued operations.
3.12 Provisions
Provisions are recognized when a present legal or constructive obligation based on past events exists, and it is probable that an outflow of economic benefits is required to settle the obligation. If the outflow is probable, but cannot be determined reliably, the obligation is disclosed. The non-current part of provisions is determined by discounting the expected future cash flows at a pre-tax rate that reflects current market assessments of the time value of money and the risks specific to the liability. The unwinding of the discount is recognized as finance cost.
Asset retirement obligations
The Group recognizes a provision if the Group has an obligation to restore a leased asset in its original condition at the end of its lease term or there are legal requirements with respect to cleanup of contamination of land, and a reliable estimate can be made. Based on the land lease of their production facilities, some entities have the obligation to restore their site upon decommissioning.
The Group has not recorded a liability for asset retirement obligations, as it does not believe there is currently a reasonable basis for estimating a date or range of dates of cessation of the operations, which is necessary to estimate the present value of this liability.
Claims and contingencies
The Group is exposed to contingencies resulting from historical actions and transactions, including the recent sales of IFCo, Clean Ammonia, Fertiglobe, and the Methanol business, as well as other historical transactions such as the 2019 Fertiglobe subscription agreement and the 2021 Fertiglobe IPO. These contingencies include, among others, contractual indemnifications.
For the accounting policies surrounding the Escrow arrangement related to the sale of Fertiglobe, see note 3.11 Fertiglobe Escrow Indemnifications.
In addition, the Group is subject to legal and regulatory proceedings in various jurisdictions. Such proceedings may result in criminal or civil sanctions, penalties, or disgorgement against the Group.
A provision is recognized when it is probable that an obligation exists, the outflow of resources embodying economic benefits is probable, and the amount of the obligation can be reliably estimated. If it is probable that an obligation to the Group exists, which will result in an outflow of resources and the amount of the outflow can be reliably estimated, a provision is recognized.
Onerous contracts
Onerous contracts are contracts for which the unavoidable costs of meeting the obligations under the contract exceed the economic benefits expected to be received under it. A provision for onerous contracts is measured at the present value of the lower of the expected cost of terminating the contract and the expected net cost of continuing with the contract. The net costs of continuing with the contract is determined based on both the incremental costs necessary to fulfill the obligation under the contract and an allocation of other costs that relate directly to fulfilling that contract. Before a provision is established, the Group recognizes any impairment loss on the assets associated with that contract.
3.13 Government grants
Government grants that compensate the Group for expenses incurred are recognized in profit or loss as ‘Other income’ on a systematic basis in the periods in which the expenses are recognized. When the grant relates to an asset, it is recognized at the nominal amount of the grant and subsequently recognized as income in equal amounts over the expected useful life of the related asset, if applicable.
Other government grants are recognized initially as deferred income at fair value when there is reasonable assurance that they will be received and the Group will comply with the conditions associated with the grant. Subsequently, these are recognized in profit or loss as ‘Other income’ on a systematic basis over the useful life of the asset.
European Emission Allowances
The Group receives European Emission Allowances (“EUAs”) as a result of its industrial activities in
The grant of these allowances is within the scope of IAS 20 Government Grants. The Group applies a specific accounting policy for the receipt of EUAs, different than the generic accounting for government grants. Upon initial recognition, the EUA’s are recognized as inventory at the nominal amount of the grant (Nil). Concurrently, a liability is recognized for the obligation to refund the allowances for CO2 emissions during the compliance period. When no excess or deficit is identified, no liability is recognized as the Group has sufficient EUAs to settle the liability.
The excess or deficit is calculated and recorded separately for each production facility. If a deficit in EUAs is identified, the Group has to purchase additional EUAs on the commodity markets to settle its liability to the Dutch Emission Authority. Purchased EUAs are recognized at cost and classified as inventory. The cost of the purchased EUAs to settle the liability for emission allowances during any given compliance period are recognized in cost of sales.
EUAs in excess of the liability to the Dutch Emission Authority that are controlled by the Group can be sold for the benefit of the Group. Sales of EUAs in excess of the liability for emission allowances during any given compliance period are recognized in cost of sales.
3.14 Lease accounting
Whether an arrangement is, or contains, a lease is assessed at the commencement date of the lease. In general, an arrangement is considered to be or to contain a lease when all of the following apply:
There is an identified asset;
The Group obtains substantially all economic benefits from the use of the asset; and
The Group can direct the use of the identified asset.
The Group utilizes the short-term and low-value lease exemptions of IFRS 16 and does not record lease liabilities nor right-of-use assets for leases meeting the criteria for one of these exemptions. Lease obligations are recognized based on the present value of the future minimum lease payments. Right-of-use assets are initially valued at an amount equal to the lease liabilities. As leases do not easily provide for an implicit rate, the Group uses the incremental borrowing rate. The measurement at initial recognition may include options to extend or terminate the lease when it is reasonably certain that the Group will exercise that option. For leases, each lease payment is allocated between the liability and finance cost. The finance cost is charged to the consolidated statement of profit or loss over the term of the lease so as to produce a constant periodic rate of interest on the remaining balance of the liability for each period. The right-of-use asset is depreciated over the shorter of the asset’s useful life and the lease term on a straight-line basis.
The Group has lease agreements with lease and non-lease components, which are generally accounted for as a single lease component. For leases of offices and buildings, we account for the lease and non-lease components separately. For these types of leases, the allocation of the consideration between lease and non-lease components is based on the relative stand-alone prices of lease components included in the lease arrangements. Leases are presented as ‘Right-of-use assets’ and ‘Lease obligations’. Short term leases (less than 12 months) or low value leases (less than USD 5,000) are expensed through the statement of profit or loss as incurred.
3.15 Revenue from contracts with customers
Revenues are recognized for the transfer of goods or services to customers in the ordinary course of the Group's activities, in the amounts that reflect the consideration to which the Group expects to be entitled in exchange for those goods or services. Revenue is recognized when the Group satisfies the performance obligations by transferring promised goods or services to customers.
The main performance obligation of the Group is the transfer of the Group's fertilizer and chemical products to customers. Revenue from the sale of fertilizer and chemical products are the two main revenue streams of the Group.
Goods are transferred when the customer obtains control of the asset. The timing of when control transfers depends on the sales and shipping terms agreed. Depending on its nature and the agreed sales terms, a performance obligation is either satisfied at certain point in time or over a certain period of time. Revenue is recognized net of expected discounts and rebates to customers. Accumulated experience and management judgment is used to estimate and provide for the discounts and rebates and revenue is only recognized to the extent that it is highly probable that a significant reversal will not occur.
The Group does not have any contracts where the period of time between the transfer of the promised goods or services to the customer and payment by the customer exceeds one year. Consequently, no adjustment is made to transaction prices for the time value of money.
3.16 Finance income and cost
Finance income comprises:
Interest income on funds invested (including on overnight and short term deposits, and financial assets at fair value through other comprehensive income);
Gains on the disposal of financial assets at fair value through other comprehensive income;
Fair value gains on financial assets at fair value through profit or loss; and
Gains on hedging instruments related to foreign currency and interest rate derivatives that are recognized in profit or loss including reclassifications of amounts previously recognized in other comprehensive income.
Interest income is recognized as it accrues in profit or loss, using the effective interest method.
Finance cost comprises:
Interest expense on borrowings;
Modification loss on tender of bonds;
Unwinding of the discount on provisions;
Interest expense related to lease obligations;
Losses on disposal of financial assets at fair value through other comprehensive income;
Fair value losses on financial assets at fair value through profit or loss;
Loss on hedging instruments related to foreign currency and interest rate derivatives that are recognized in profit or loss including reclassifications of amounts previously recognized in other comprehensive income; and
Impairment losses recognized on financial assets (other than trade receivables).
Borrowing costs that are not directly attributable to the acquisition, construction or production of a qualifying asset are recognized in profit or loss and expensed as incurred. Foreign currency gains and losses are recognized on a net basis as either finance income or finance cost depending on whether foreign currency movements are in a net gain or net loss position.
3.17 Employee benefits
Defined contribution plan
Certain Group subsidiaries provide to their employees pension plans, end of service remuneration plans and long-term service benefits. These pension plans qualify as defined contribution plans. Obligations for contributions to defined contribution plans are expensed as the related service is provided. Prepaid contributions are recognized as an asset to the extent that a cash refund or a reduction in future payments is available.
Short-term employee benefits
Short-term employee benefits are expensed as the related service is provided. A liability is recognized for the amount expected to be paid if both the Group has a present legal or constructive obligation to pay this amount as a result of past service provided by the employee and the obligation can be estimated reliably. Deferred cash plans are accrued over time as the performance conditions are satisfied.
Long-term employee benefits
The Group long-term employee benefits are recognized if both the Group has a present legal or constructive obligation to pay this amount as a result of past service provided by the employee and the obligation can be estimated reliably to determine its present value. The discount rate is the yield at the balance sheet date on triple-A (‘AAA’) credit rated bonds that have maturity dates approximating the terms of the Group's obligations. Re-measurements are recognized in profit or loss in the period in which they arise.
Termination benefits
Employee termination benefits are payable when employment is terminated before the normal retirement date, or whenever an employee accepts voluntary redundancy in exchange for these benefits. The Group recognizes termination benefits when the Group is demonstrably committed to either terminating the employment of current employees according to a detailed formal plan without possibility of withdrawal, or when the Group is providing termination benefits as a result of an offer made to encourage voluntary redundancy. Benefits falling due more than 12 months after balance sheet date are discounted to their present value.
Equity settled share-based payments
During prior years, certain employees (including senior executives) of the Group receive remuneration in the form of share-based payments, whereby employees render services as consideration for equity instruments. The grant date fair value of equity-settled share-based payment awards granted to employees is recognized as an employee expense, with a corresponding increase in equity, over the period (the vesting period) that the employees render service and become unconditionally entitled to the awards.
The amount recognized as an expense is adjusted to reflect the number of awards for which the related service and non-market performance conditions are expected to be met, such that the amount ultimately recognized as an expense is based on the number of awards that meet the related service and non-market performance conditions at the vesting date. At each reporting date, the progress of non-market conditions is measured and the expenses are trued-up accordingly.
The group discontinued all shared based payment arrangements in 2025.
3.18 Income tax
Current tax is the expected tax payable or receivable on the taxable income or loss for the year, using tax rates enacted or substantively enacted at the reporting date, and any adjustment to tax payable or receivable in respect of previous years. The amount of current tax payable or receivable is the best estimate of the tax amount expected to be paid or received that reflects uncertainty related to income taxes, if any. Current tax also includes any tax arising from fiscal unity restructuring and declaration of dividends. Current income tax receivable and payable are offset when there is a legally enforceable right to offset and when the current income tax relates to the same fiscal authority.
Deferred tax liabilities are recognized for all taxable temporary differences arising between the tax bases of assets and liabilities and their carrying amounts in the consolidated financial statements (‘balance sheet’ method).
Deferred tax assets are recognized for all deductible temporary differences, unused carry-forward losses and unused carry forward tax credits, to the extent that it is probable that future taxable profit will be available against which the deferred income tax assets can be utilized. Deferred tax assets are reviewed at each reporting date and are reduced to the extent that it is no longer probable that the related tax benefit will be realized; such reductions are reversed when the probability of future taxable profits improves.
Deferred income tax is not recognized if it arises from initial recognition of an asset or liability in a transaction that is not a business combination and at the time of the transaction it affects neither accounting nor taxable profit or loss. No deferred income tax is recognized from the initial recognition of goodwill. Also, no deferred tax is recognized from investments in subsidiaries and associates to the extent that the Group is able to control the timing of the reversal of the temporary differences and it is probable that they will not reverse in the foreseeable future.
Deferred income tax is measured at the tax rates that are expected to apply to the period when the asset is realized or the liability is settled, based on tax rates (and tax laws) that have been enacted or substantively enacted at the balance sheet date. Deferred income tax reflects uncertainty related to income taxes, if any.
Deferred income tax assets and liabilities are offset when there is a legally enforceable right to offset current tax assets against current tax liabilities and when the deferred income tax relates to the same fiscal authority.
In cases where it is concluded it is not probable that the tax authorities will accept a tax treatment, the effect of the uncertainty is reflected in the recognition and measurement of tax assets and liabilities or, alternatively, a provision is made for the amount that is expected to be settled, where this can be reasonably estimated. This assessment relies on estimates and assumptions and may involve a series of judgments about future events. New information may become available that causes the company to change its judgment regarding the adequacy of existing tax assets and liabilities. Such changes to tax assets and liabilities will impact the income tax expense in the period during which such a determination is made.
OCI has determined that the global minimum top-up tax, which is required to be paid under Pillar Two legislation, is an income tax in the scope of IAS 12. OCI has applied a temporary mandatory relief from deferred tax accounting for the impact of the top-up tax and accounts for Pillar Two taxes as a current tax when it is incurred.
3.19 Segment reporting
An operating segment is a component of an entity that engages in business activities for which it may earn revenues and incur expenses (including from transactions with other components of the same entity), whose operating results are regularly reviewed by the entity's Chief Operating Decision Maker (‘CODM’) to make decisions about resource allocation and to assess its performance, and for which discrete financial information is available.
The Group determines and presents operating segments on the basis of information that internally is provided to the CODM during the period. Operating segments are aggregated based on similar economic environments and similar products.
An operating segment is disclosed as reportable segment if its financial metrics exceed the quantitative thresholds of IFRS 8 or otherwise if management elects to present an operating segment as a reportable segment to maintain consistency with prior periods.
3.20 Consolidated statement of cash flows
The consolidated statement of cash flows has been prepared using the ‘indirect’ method. Cash flows in foreign currencies have been translated applying average exchange rates. Currency translation differences on cash are shown separately in the consolidated statement of cash flows. Cash flows from investing activities consist mostly of investments and divestments in property, plant and equipment, intangible assets, dividend income from investments, and acquisitions insofar as these are paid for in cash.
Proceeds from disposals of subsidiaries and other investments, and cash paid to fund the construction of the Clean Ammonia project are also presented as part of investing activities. Cash flows relating to capitalized borrowing cost are presented as cash flows from operating activities. Cash flows from financing activities consist of acquisition or divestment of non-controlling interests, dividends paid to non-controlling interests, proceeds from and repayment of borrowings, inclusive of premia or discounts, payment of lease obligations, and settlement of derivatives with the exception of interest rate derivatives which are presented as cash flows used in operating activities.
Cash flows from discontinued operations are presented separately from the cash flows from continuing operations.
3.21 Earnings per share
Earnings per ordinary share are calculated by dividing the profit or loss (net) attributable to holders of ordinary shares by the weighted average number of ordinary shares outstanding during the year. In making this calculation the (ordinary) treasury shares are deducted from the number of ordinary shares outstanding. The calculation of the diluted earnings per share is based on the weighted average number of ordinary shares outstanding plus the potential increase as a result of the conversion of convertible bonds and the settlement of share-based compensation plans (share option plans).
Anti-dilutive effects are not included in the calculation. An adjustment is made to profit or loss (net) to eliminate interest charges, whilst allowing for effect of taxation. In 2025, the Group did not have any dilutive instruments outstanding; accordingly, diluted earning per share equals basic earning per share. In 2024, diluted earning per share calculation, it was assumed that all outstanding equity-settled share option plans would vest. The dilutive effect of equity-settled share option plans is calculated based on the number of options issued, the exercise price of these options and the average market price of ordinary shares during the period.
The difference between the number of ordinary shares issued and the number of ordinary shares that would have been issued at the average market price of ordinary shares for the period is considered as dilutive. This dilutive effect is only applied if the option has intrinsic value (i.e. is in the money).
3.22 Assets Held for Sale
The Group classifies non-current assets or disposal groups as held for sale if their carrying amount will be recovered principally through a sale transaction rather than through continuing use, and a sale is considered highly probable. Non-current assets or disposal groups classified as held for sale are measured at the lower of their carrying amount and fair value less costs to sell.
Non-current assets such as deferred tax assets, assets arising from employee benefits and financial assets are specifically exempt from this measurement requirement. Depreciation and amortization on non-current assets (including those that are part of a disposal group) ceases from the date that the non-current assets (or disposal groups) meet the criteria to be classified as held for sale.
Non-current assets or all assets of disposal groups classified as held for sale are presented separately from the other assets in the statement of financial position. The liabilities of a disposal group classified as held for sale are presented separately from other liabilities in the statement of financial position.
The consolidated statement of financial position notes includes movement schedules representing the total movements associated with continuing operations, which is made up of continuing operations at the end of the reporting year and movements associated with disposal groups before they met the criteria to be classified as held for sale. Assets and liabilities held for sale are presented separately. Reference is made to note 22 Discontinued operations and assets & liabilities held for sale.
3.23 Discontinued Operations
The Group classifies a component of the business as discontinued operations if the following criteria are met: the operations and cash flows of the component can be clearly distinguished from the rest of the Group, and it represents a separate major line of the business, a separate geographical area of operations, or is included as part of a plan to dispose of a major line of business. Classification as a discontinued operation occurs at the earlier of the date of disposal or when the operation meets the criteria to be classified as held for sale.
The difference in IFRS 5 criteria applied to consider a component of the business as held for sale, compared to the criteria for discontinued operations, means that not all entities in the group are presented as both.
The results of discontinued operations are presented separately in the statement of profit or loss. When an operation is classified as discontinued operations, the comparative statement of profit or loss and other comprehensive income are re-presented as if the portion of the business had been discontinued from the start of the comparative year.
Intra-group transactions between continuing and discontinued operations are eliminated as part of the consolidated financial statements. Intra-group transactions are eliminated against discontinued operations when management determines that the arrangement is not expected to continue after the sale or disposal of the discontinued operation. Intra-group transactions are eliminated against continuing operations when management determines that the arrangement is expected to continue after the sale. These may include the purchases and sales of product in the normal course of business.
Some overhead costs, such as IT costs, personnel costs, and interest expenses, are expected to reduce after the sale of the disposal groups. To the extent that there is a legal agreement in place for overhead costs to transfer to the buyer of the disposal group, either as part of the purchase agreement or otherwise, these costs are presented as discontinued operations. All other stranded costs are presented as part of continuing operations.
3.24 Contractual Liabilities from the Clean Ammonia Sale
As a consequence of the sale of the Clean Ammonia project to Woodside Energy Group Ltd. ("Woodside"), OCI assumed an obligation to fund certain pre-operating and capex costs as defined in the sale agreement. This obligation is classified as a financial liability under the scope of IFRS 9. The financial liability is initially measured at fair value and subsequently measured at amortized cost. Cash payments made to fund these costs are presented within cash flows from investing activities in the consolidated statement of cash flows.
Subsequent remeasurements in the liability are due to changes in future expected cash flows and the impact of time value of money through the effective interest rate method. These changes are classified as part of the gain of the sale presented in discontinued operations, as per the guidance of IFRS 5. Management assessment of future costs is a significant judgment and estimate.
A portion of the proceeds from the sale relating to future employee services to be performed by the Group for Woodside's subsidiary, Beaumont New Ammonia LLC or BNA, have been deferred as a contract liability under the scope of IFRS 15. Recognition of this revenue occurs over time as the services are provided. This revenue is recorded by the entities providing the services, OCI Clean Ammonia M&O LLC and OCI Clean Ammonia CM LLC, which are both classified as discontinued operations.
4 New accounting standards and policies
On a regular basis, the IASB issues new accounting standards, amendments and revisions to existing standards and interpretations. These new accounting standards, amendments and revisions to existing standards and interpretations are subject to adoption by the European Union.
4.1 Standards, amendments, revisions and interpretations that became effective to OCI during 2025
The Group has applied the following amendment to the IFRS Accounting Standards that became effective for annual periods beginning on or after 1 January 2025:
Amendment to IAS 21 – Lack of Exchangeability;
The amendments listed above did not have any impact on the amounts recognized in prior periods and are not expected to significantly affect the current or future periods.
4.2 Standards, amendments, revisions and interpretations not yet effective for OCI
The Group assesses for the potential impact of any new or changes to the existing IFRS Accounting standards and interpretations thereof not yet in force or not yet applicable. The following new and amended standards are not expected to have a significant impact on the Group's consolidated financial statements. These include, among others:
IFRS 19 "Subsidiaries without Public Accountability: Disclosures";
Amendments to IFRS 9 and IFRS 7 "Classification and Measurement of Financial Instruments";
Amendments to IAS 21 "Translation to a Hyperinflationary Presentation Currency";
And amendments to IFRS 9 and IFRS 7 "Contracts Referencing Nature-dependent Electricity".
Further, in 2024, the IASB published IFRS 18 "Presentation and Disclosure in Financial Statements". IFRS 18 introduces, among others, a defined structure of the statement of profit or loss with required subtotals, required disclosures in the financial statements for certain management defined performance measures and enhanced principles on aggregation and disaggregation which apply to the primary financial statements. The implementation date of IFRS 18 is January 1, 2027, with earlier application permitted. We will start with our impact assessment in 2026.
5 Critical accounting judgment, estimates and assumptions
The preparation of the financial statements in compliance with IFRS Accounting Standards requires management to make judgments, estimates and assumptions that affect amounts reported in the consolidated financial statements. The estimates and assumptions are based on experience and various other factors that are believed to be reasonable under the circumstances and are used to judge the carrying amounts of assets and liabilities that are not readily apparent from other sources. The estimates and underlying assumptions are reviewed on an ongoing basis. Revisions to accounting estimates are recognized in the period in which the estimate is revised, or the case that the changed estimates affect both the current and future periods, in both the revision period and future periods. The most critical accounting policies involve a higher degree of judgment and complexity in applying these principles and therefore changes in the assumptions and estimates could result in significantly different results than those recorded in the financial statements. The following are the critical accounting policies:
Property, plant and equipment
Property, plant and equipment are carried at cost less accumulated amortization and any impairment. Management makes estimates regarding the useful lives and residual values and assumes that depreciation takes place on a ‘straight-line’ basis. The assets’ residual values and useful lives are reviewed, and adjusted if appropriate, at each balance sheet date. OCI assesses annually, or more frequently, whether indicators exist that suggest that an item of property, plant and equipment might be impaired. When impairment triggers are identified, an impairment test is conducted whereby the carrying amount is compared to the recoverable amount.
In the useful life reassessment and in assessing for impairment indicators, OCI also considers the impact of its ESG targets and of relevant transition and physical climate risks, if identified for a specific country or region. Transition risks are risks associated with transitioning to a lower-carbon economy and are primarily related to cost of climate impacts, new technologies, market developments and climate litigations. See Financial implications of climate change for further information on the impact of climate risks on the Group.
In determining the recoverable amounts of property, plant and equipment, OCI makes estimates and assumptions about future cash flows based on the value in use at each reporting date. In doing so, OCI also makes assumptions and estimates regarding the discount rates and other key assumptions in order to calculate the net present value of the future cash flows generated by the cash-generating unit the property, plant and equipment relates to.
Inventories
In determining the net realizable value of inventories, OCI estimates the selling prices in the ordinary course of business, cost of completion and cost to sell. In doing so, OCI makes estimates and assumptions based on current market prices, historical usage of various product categories versus current inventory levels and specific identified obsolescence risks (e.g. end of life of specific goods and spare parts and the impact of new environmental legislation).
Financial instruments
The fair value of financial instruments traded in active markets (financial instruments in the fair value hierarchy level 1) is based on quoted market prices at the balance sheet date. The fair value of financial instruments not traded in an active market with observable market prices (financial instruments in the fair value hierarchy level 2) is determined using generally accepted valuation techniques. These valuation techniques include estimates and assumptions about forward rates, discount rates based on a single interest rate, or on a yield-curve based on market conditions existing at the balance sheet date.
The fair value of borrowings and interest rate swaps is calculated based on the present value of the estimated future cash flows based on the yield-curve applicable at the balance sheet date. If the financial instrument contains a floating interest rate, the future expected interest rates are determined based on forward rates. The fair value of forward foreign exchange contracts is determined using quoted forward exchange rates at the balance sheet date. Gas price option and gas swap contracts are valued using applicable market yield curves.
All inputs for the fair value calculations represent observable market data that are obtained from external sources that are deemed to be independent and reliable. The net carrying amount of trade receivables and trade payables is assumed to approximate the fair value due to their short-term nature. The fair value of financial instruments with no observable market prices (financial instruments in the fair value hierarchy level 3) is based on assumptions that market participants would use when pricing these assets or liabilities, including assumptions about risk. Assumptions about risk include the risk inherent in a particular valuation technique used to measure fair value (such as a pricing model) and the risk inherent in the inputs to the valuation technique, including a risk adjustment when there is significant measurement uncertainty.
The fair value of non-current financial liabilities is estimated by discounting the future cash flows using original effective yield-curves. A significant and prolonged decline in the fair value of a financial asset at fair value through other comprehensive income below its acquisition cost is considered as an indicator that the financial asset at fair value through other comprehensive income is impaired.
Indemnification assets and liabilities
The Group has in some cases significant contractual indemnifications to the buyers of the IFCo, Fertiglobe, Clean Ammonia and the Methanol business assets in connection with their respective sales. The measurement of these indemnification assets and liabilities are subject to significant assumptions including, as required, management's estimate of future in- or outflow. In some of the indemnified exposures, the Group does not have conduct over the claims as control was transferred as part of the sale. Therefore, the management estimates (potential) exposures resulting from such claims based on information received at irregular intervals and publicly available (financial) information. The estimations are based on most likely outcome of a claim or based on weighted probability of series of potential outcomes. Upon resolution and based on unforeseen future developments, the Group may incur charges, which in some circumstances based on the nature of such indemnifications may be significant, in excess of the recorded amounts for such matters. Please refer to note 21 Provisions and 22 Discontinued operations and assets & liabilities held for sale for further details.
In regards to the Fertiglobe Escrow Indemnifications, the estimate of the net amount receivable or payable arising from the simultaneous settlement of the consideration held in escrow and related indemnification liabilities in connection with the sale of OCI’s equity interests in Fertiglobe to ADNOC on 15 October 2024 involves significant management judgment.
Management determines the estimate using an expected value methodology. This assessment is based on management's evaluation of the range of possible outcomes, the estimated net cash inflows or outflows associated with each outcome, and management's judgment regarding the probability of each scenario.
The estimate is inherently subject to a level of estimation uncertainty. This uncertainty arises, in part, because the amount and timing of ultimate settlement of the escrow and indemnification mechanism is dependent on future events that are outside the control of the Group. For further information, please refer to note 22.4 Estimate of Fertiglobe Indemnifications and Earn-Out Mechanism.
Provisions, contingent assets and liabilities
Recognition of provisions include significant estimates, assumptions and judgments. IFRS Accounting Standards require only those provisions to be recognized if there is an expected outflow of resources and if the cost of these outflows can be estimated reliably. Accordingly, management exercises considerable judgment in determining whether it is more likely than not that there is a present obligation as a result of a past event at the end of the reporting period, whether it is probable that there will be an outflow of resources and whether the amount of the obligation can be reliably estimated. Exposures for which the outflow/inflow of resources is less likely than not or those that cannot be reliably estimated are disclosed as contingent liabilities/assets, unless the likelihood is considered remote. These judgments are subject to change as new information becomes available. The required amount of a provision may change in the future due to new developments related to the matter. Revisions to estimates may significantly impact future profit or loss. Upon resolution, the Group may incur charges in excess of the recorded provisions for such matters.
Provisions for asset retirement obligations represent estimated costs of decommissioning. Due to the long time period over which future cash outflows are expected to occur, including the respective interest accretion, the recognition and measurement of these provisions is subject to assumptions. Amongst others, the estimated cash outflows could alter significantly if, and when, political developments affect future laws and regulations with respect to asset retirements. The Group has not recognized any asset retirement obligations because a reliable estimate of the amount of the obligations cannot be made. With respect to legal cases, the Group has to estimate the outcome. Regulatory and legal proceedings as well as government investigations often involve complex legal issues and are subject to substantial uncertainties. The Company periodically reviews the status of these proceedings with both the internal and external legal counsels. Please refer to note 21 Provisions and 29 Contingencies for further details.
Income taxes
The Group is subject to income taxes in several jurisdictions. Estimates are required in determining the Group-wide provision for income taxes. There are some transactions and calculations for which the ultimate tax position is uncertain during the ordinary course of business. The Group recognizes provisions for anticipated tax audit issues based on estimates of whether additional taxes will be due. Where the final tax outcome of these matters is different from amounts that were initially recorded, such differences will impact the current income tax and deferred tax provisions in the period in which such determination is made. The Group recognizes deferred tax assets to the extent that it is probable that future taxable profits will be available for the deferred tax asset to be recovered.
This is based on estimates of taxable future income by jurisdiction in which the Group operates and the period over which deferred tax assets are expected to be recoverable. In the event that actual results or new estimates differ from previous estimates and depending on the possible tax strategies that may be implemented, changes to the recognition of deferred tax assets may be required, which could impact the financial position and profit or loss.
In relation to Fertiglobe in 2024, estimates were also required to determine the impact of the Pillar Two legislation as the Pillar Two income taxes are closely linked to the provision of income taxes and the final outcome of tax audits for which an uncertain tax position is recognized.
Leases
The assessment of whether a contract is, or contains, a lease requires judgment with respect to whether the lessor has substantive substitution rights, the party that obtains economic benefits from use of the asset and the party responsible for making the ‘how and for what purpose’ decisions during the period of use. Judgment is also applied in order to assess whether the entity will exercise any extension or cancellation options of a lease. The group applies judgments in order to determine the incremental borrowing rate in order to calculate the lease liabilities.
CO2 emissions
OCI periodically reviews its obligations with respect to CO2 emissions under the ETS program. The estimation of CO2 emissions is primarily based on the expected utilization of the production capacity for the remaining part of the compliance period. The estimation of the utilization of the production capacity is dependent on a number of assumptions with inherent uncertainty making it a critical accounting estimate. The identification of the number of excess EUAs is dependent on this estimate.
Financial implications of climate change
OCI faces moderate risks and opportunities as a result of climate change and governmental actions to reduce greenhouse gas (GHG) emissions and create low-carbon and climate-resilient economies. Refer to section Our strategy and Strategic risks for a description of these risks and opportunities.
OCI is exposed to certain physical risks caused by rising global temperatures, such as extreme weather events and rising sea levels, and transition risks associated with shifting to a lower-carbon economy, such as changes in government regulations and costs for transitioning to lower emissions and higher resource efficiency technologies. The Group also monitors for shifting market dynamics and potential opportunities from changing consumer sentiment or government environmental regulations. These risks and opportunities are integrated in the Group's risk management and strategy development processes, resulting in a decarbonization strategy.
Following our strategic review and divestment of several facilities, OCI’s previous climate mitigation targets are under review as the material structure of our business has changed. At our remaining facilities, OCI is continuing with its decarbonization plans and pursuing our goal of achieving carbon neutrality by 2050.
OCI makes certain estimates and assumptions of the impact of climate risks on its future. Changes to these assumptions may influence the carrying amounts of assets and liabilities due to, among others, future re-assessment of useful lives of tangible or intangible assets, changed assumptions used as basis for impairment testing of such assets, changes to environmental and decommission provisions, and changes to cost of capital. Significant judgment may be needed to develop these estimates.
The carrying value of the property, plant and equipment included in the continuing operations primarily relate to the capitalized cost associated with the major maintenance activities (also referred to as turnarounds) which in general have a 3-4 year cycle. As such, the assets included in continuing operations have an average useful life of approximately 4 – 7 years. As result of the depreciation and investment policy applied, the financial implications of climate change are being considered at each turn around cycle thereby reducing the risk of identifying impairments as a result of climate change risk at the reporting date. Accordingly, for the year ended 31 December 2025, OCI did not identify any changes to the carrying value of assets or liabilities associated with climate change transition risks.
In addition, the introduction of Carbon Border Adjustment Mechanism ('CBAM') is not expected to have any significant negative implication on continuing operations.
Discontinued operations and held for sale presentation
The Group presents segments of the business as held for sale from the moment that the IFRS 5 criteria are met. The timing of this determination impacts the depreciation expense recorded in the Group, as depreciation ceases from the moment the segment is considered held for sale. The assessment of whether the IFRS 5 criteria are met requires judgment. Specifically, the Group considers this criterion that the sale is highly probable to be met if there is a binding sale agreement signed between the parties and no material impediments expected to closing.
Estimation of contractual liabilities from Clean Ammonia Sale
The measurement of the financial liability to fund the remaining costs to the account of OCI for the construction of the Clean Ammonia project is subject to estimation uncertainty and is a key judgment from management. OCI develops its estimate on the volume and timing of costs based on the overall project budget, agreements between BNA and its subcontractors, and knowledge of project planning. Key estimates which have an impact on the valuation of the liability include estimates of remaining construction costs and the timing of these cash flows.
The liability further includes OCI’s best estimate of the cost required to close out any contractual obligations which arise as part of the agreements with Woodside, including liquidated damages, construction subcontractor and insurance claims, and certain indemnities. Management determines its best estimate for future contractual outflows based on its judgment on the probability of various scenarios occurring.
6 Financial risk and capital management
The Group has exposure to credit, liquidity and market risks from financial instruments. These risks arise from exposures that occur in the normal course of business and are managed on a consolidated company basis.
This note presents information about the Group's exposure to each of the above risks, the Group's objectives, policies and processes for measuring and managing these risks. Additionally, it also includes the Group's management of capital.
Risk management framework
The Board of Directors has oversight responsibility for the establishment and monitoring of the Group's risk management framework. Senior (local) management is responsible for the effective operation of the internal risk management and control systems.
The Audit and Risk department facilitates and supervises the Risk Management function, ensuring compliance with OCI Internal Control Framework and supporting the Board of Directors in fulfilling their risk management responsibilities.
The Group's risk management policies and practices are established to identify and analyze the risks faced by the Group, to set appropriate risk limits and controls, and to monitor risks and adherence to limits. These policies and systems are reviewed regularly to reflect changes in market conditions and business activities, and the Group's strategic direction, including developments arising from the ongoing strategic review and portfolio adjustments.
The Group, through its training and management standards and procedures, aims to develop a disciplined and constructive control environment in which all employees understand their roles and responsibilities in risk management.
The Audit Committee oversees how management monitors compliance with the Group's risk management policies and procedures, and reviews the adequacy of the risk management framework in relation to the Group's evolving risk profile.
The Audit Committee is assisted in its oversight role by the Audit and Risk department, which undertakes both regular and ad hoc reviews of risk management controls and procedures, reporting its findings to the Audit Committee.
6.1 Credit risk
Credit risk is the risk of financial loss to the Group if a customer or counterparty to a financial instrument fails to meet its contractual obligations. This arises principally from the Group's receivables from trade and other receivables, and from outstanding cash balances with banks.
The Group's exposure to customer credit risk is monitored and mitigated by performing credit checks before selling any goods. The Group may contract specific credit insurance for certain receivables. Customers are typically billed after the goods have been delivered or the services have been performed. Customary payment terms for the Group's receivables is 30 days. In certain instances, the Group receives upfront payment for services and recognizes deferred revenue. The Group establishes an allowance, if needed, for impairment that represents its estimate of expected losses in respect of trade and other receivables.
IFRS 9 establishes a three-stage impairment model, based on whether there has been a significant increase in the credit risk of a financial asset since its initial recognition. As at 31 December 2025, management concluded no such significant increase in credit risk was present. Hence, the expected credit loss on instruments is calculated based on Stage 1 (i.e. 12-month expected credit losses). The Group has determined that expected credit losses on financial assets is immaterial as at 31 December 2025.
The Group was exposed to credit risk on the USD 464.3 million deferred consideration from the sale of Clean Ammonia. This amount reflects the present value of the deferred consideration, discounted to the reporting date. This receivable was settled upon handover of the BNA project to Woodside on 25 March 2026. Please refer to note 33 Subsequent events for further details.
The Group is party to a securitization agreement to sell certain trade receivables to an external financial institution. The agreement permits securitization of trade receivables up to USD 117.4 million (EUR 100.0 million). As per 31 December 2025 an amount of USD 107.3 million (EUR 91.4 million) of trade receivables were transferred.
With respect to transactions with financial institutions, the Group sets a minimum credit rating for counterparties. The maximum exposure to credit risk is the carrying amount of financial instruments, for an overview, reference is made to the tables below. There is no significant concentration by counterparty of credit risk in trade and other receivables. All banks holding deposits have an investment grade credit rating.
As at 31 December 2025, the outstanding cash balance is limited. In 2024, OCI increased its exposure limit with top tier banks in order to accommodate deposits for a large surplus cash balance as a result of the sale of IFCO, Fertiglobe and Clean Ammonia. Concentrations of receivables by region can be seen in the table below.
The maximum exposure to credit risk at the reporting date is as follows:
$ millions | Note | 2025 | 2024 |
|---|---|---|---|
Trade and other receivables (excl. Deferred consideration from sale of Clean Ammonia) | (9) | 207.5 | 211.2 |
Deferred consideration from sale of Clean Ammonia | (9) | 464.3 | 447.9 |
Cash and cash equivalents | (14) | 17.9 | 2,052.9 |
Total | 689.7 | 2,712.0 |
The maximum exposure to credit risk for trade and other receivables by geographic region is as follows:
$ millions | 2025 | 2024 |
|---|---|---|
Middle East and Africa | 2.9 | 12.9 |
Asia and Oceania | 0.4 | 1.7 |
Europe | 200.9 | 152.4 |
Americas | 3.3 | 44.2 |
Total | 207.5 | 211.2 |
The maximum exposure to credit risk for cash and cash equivalents by geographic region is as follows:
$ millions | 2025 | 2024 |
|---|---|---|
Asia and Oceania | 0.1 | 0.1 |
Europe | 17.1 | 2,024.5 |
Americas | 0.7 | 28.3 |
Total | 17.9 | 2,052.9 |
6.2 Liquidity risk
6.2.1 General
Liquidity risk is the risk that the Group will encounter difficulty in meeting the obligations associated with its financial liabilities that are settled by delivering cash or another financial asset.
The future obligations will be managed by the future incoming cash from operations and divestments, cash and cash equivalents of USD 17.9 million (2024: USD 2,052.9 million) and unused amounts on credit facility agreements in the amount of USD 600.0 million (2024: USD 600.0 million), reference is made to note 18' Undrawn bank facilities'.
The Group's approach to managing liquidity risk is to ensure that it will always have sufficient liquidity to meet its liabilities when due, under both normal and stressed conditions, without incurring unacceptable losses or risking damage to the Group's reputation.
The securitization of trade receivables is one mechanism used to manage the Group's liquidity risk. This is also safeguarded by using multiple financial institutions in order to mitigate any concentration of liquidity risk. The Group also makes use of inventory financing facility at OCI Nitrogen to manage its liquidity. As a result of the strategic reorientation and the simplification of the organizational structure, the financing strategy of the Group has become more decentralized which maximizes the flexibility to divest operating companies.
The liquidity risk is monitored internally at Group level. On an ongoing basis, the Group prepares liquidity forecasts to verify whether the Group is able to meet its future debt obligations. The Group has also carefully evaluated the funding of its business plan for at least the next 12 months from the date of issuance of the financial statements and has applied sensitivities to the forecast level of liquidity headroom available. Key assumptions include timing of proceeds from divestments, timing of settlement of indemnification liabilities and provisions, product pricing, natural gas pricing, utilization rates, and estimated corporate costs. Management has applied these assumptions to the forecasts, which would leave sufficient liquidity headroom. Refer to note 2.2 Going concern and note 18 Loans and borrowings of the notes to the consolidated financial statements for the Group's analyses of going concern and debt covenants, respectively.
The following are the contractual maturities of financial liabilities, including estimated interest payments and excluding the impact of netting agreements.
31 December 2025 | Note | Carrying amount | Contractual cash flow | Less than 1 year | Between 1 and 5 years | More than 5 years |
|---|---|---|---|---|---|---|
Financial liabilities | ||||||
Loans and borrowings | (18) | 62.0 | 63.5 | 63.5 | - | - |
Lease obligations | (19) | 93.3 | 94.3 | 10.5 | 25.6 | 58.2 |
Trade and other payables | (20) | 435.0 | 435.0 | 435.0 | - | - |
Derivatives | (20) | 7.8 | 7.8 | 7.8 | - | - |
Total | 598.1 | 600.6 | 516.8 | 25.6 | 58.2 |
31 December 2024 | Note | Carrying amount | Contractual cash flow | Less than 1 year | Between 1 and 5 years | More than 5 years |
|---|---|---|---|---|---|---|
Financial liabilities | ||||||
Loans and borrowings | (18) | 682.1 | 1,032.3 | 130.8 | 201.0 | 700.5 |
Lease obligations | (19) | 121.6 | 125.1 | 19.4 | 53.4 | 52.3 |
Trade and other payables | (20) | 848.2 | 847.8 | 847.9 | (0.1) | - |
Derivatives | (20) | 20.8 | 19.4 | 18.5 | 0.9 | - |
Total | 1,672.7 | 2,024.6 | 1,016.6 | 255.2 | 752.8 |
The interest on floating rate loans and borrowings is based on forward interest rates at period-end. This interest rate may change as the market interest rate changes.
6.2.2 Refinancing and deleveraging activity
2025
Upon closure of the MetCo transaction on 27 June 2025, the Company launched the formal tender process to settle the 2033 Bonds. The loan was repaid in full for USD 664.5 million plus USD 15.7 million of accrued interest on 7 August 2025.
2024
On 23 February 2024, OCI N.V. executed a EUR 400.0 million bridge loan facility, bearing interest at a rate of EURIBOR + 0.85%. The proceeds were used to partially repay the OCI N.V. Revolving Credit Facility. The bridge loan was repaid in full in August 2024;
On 29 August 2024, OCI closed on the sale of IFCO to Koch. As part of the sale, the bonds outstanding by IFCO were defeased and removed from IFCO's balance sheet on the date of closing;
In August 2024 after the closing of the sale of IFCO, OCI repaid USD 581.8 million of principal and interest on the revolving credit facility, which remains undrawn as of 31 December 2024;
On 15 October 2024, both the EUR and USD 2025 bonds issued by OCI N.V. became callable at par. On this date, OCI N.V. redeemed these bonds in full. The total redemption amount paid, which is made up of principal and accrued interest, was EUR 366.5 million (USD 399.1 million) and USD 295.0 million, respectively.
On 12 December 2024, OCI N.V. reduced the maximum commitment on its revolving credit facility from USD 1,100.0 million to USD 600.0 million. This reduction results in lower commitment fees going forward on the unused portion of the facility.
For an overview of all loans and borrowings, reference is made to note 18 Loans and borrowings.
6.3 Market risk
6.3.1 General
Market risk is the risk of changes in market prices, such as foreign exchange rates, interest rates, commodity prices and equity prices that will affect the Group's income or the value of its holdings of financial instruments. The objective of market risk management is to manage and control market risk exposures within acceptable parameters, while optimizing the return.
6.3.2 Foreign currency risk
The Group is exposed to foreign currency risk arising in separate ways:
Foreign exchange transaction risk
The Group entities predominantly execute their activities in their respective functional currencies. The Group is however exposed to foreign exchange transaction risk when Group entities enter into foreign currency denominated transactions. The Group monitors the exposure to foreign currency risk arising from operating activities and enters selectively into foreign exchange contracts to hedge foreign currency exposures. The nominal amount of the foreign currency derivatives outstanding used to hedge transaction risk as per 31 December 2025 was nil (2024: USD -3.6 million) and relates to the USD exposure of the Group (on Euro currencies). The functional currencies of the continuing operations of the Group is primarily the Euro.
The Group is exposed to the translation of foreign currency denominated monetary assets and liabilities. These exposures are managed by the Group's treasury function, which may hedge a portion of the foreign currency exposures estimated to arise in the foreseeable future.
The Group is exposed to foreign exchange fluctuations through monetary items denominated in foreign currencies other than the relevant functional currency and intercompany balances.
The summary of this exposure is as follows:
31 December 2025 | USD | EUR |
|---|---|---|
Trade and other receivables | 559.7 | - |
Trade and other receivables - Intercompany | 280.9 | - |
Trade and other payables | (267.9) | - |
Trade and other payables - Intercompany | (242.8) | - |
Loans and borrowings - Intercompany | (105.2) | (6.5) |
Cash and cash equivalents | 2.1 | - |
31 December 2024 | USD | EUR |
|---|---|---|
Trade and other receivables | 504.9 | - |
Trade and other receivables - Intercompany | 346.4 | 85.0 |
Trade and other payables | (660.4) | - |
Trade and other payables - Intercompany | (156.6) | - |
Loans and borrowings | (605.2) | - |
Loans and borrowings - Intercompany | (19.9) | (104.6) |
Cash and cash equivalents | 2,022.7 | - |
Hedge of net investment in foreign operations
The Group's risk management strategy is to hedge the spot foreign exchange risk on net investments in foreign operations. The risk management objective is to reduce foreign exchange results on net investments in USD.
In 2024, the Group decommissioned its net investment hedge as part of a change in its risk management objective, following the repayment of certain loan facilities and the sale of specific USD-denominated investments in subsidiaries. In 2025, a portion of the net investment hedge was realized upon the sale of the Methanol business.
The hedge relationship previously recognized was a hedge of the foreign currency exposures on net investment in foreign operations in USD. The hedge relationship was designated at the level of the Group for the purpose of the consolidated financial statements. The hedged items were all operational USD foreign operations of the Group. To comply with the risk management policy, the hedge ratio was based on hedging the spot rate foreign currency exposure of USD foreign operations with hedging instruments with same or lower notional amount. This resulted in a hedge ratio of 1:1 or 100%.
$ millions | Note | 2025 | 2024 |
|---|---|---|---|
Changes in fair value of hedging instruments carrying amount | - | 18.6 | |
Realization of net investment hedge | (22) | 37.9 | 92.5 |
Cumulative amount recognized1 | 0.8 | (37.2) |
- Cumulative amount recognized in currency translation reserve relating to hedging instruments.
Significant exchange rates
The following significant exchange rates applied during the year against the US dollar:
Average 2025 | Average 2024 | Closing 2025 | Closing 2024 | |
|---|---|---|---|---|
Euro | 1.1304 | 1.0818 | 1.1736 | 1.0349 |
The exposure of the group to foreign exchange rate changes is primarily with entities in the group with a EUR functional currency holding USD balances. The Group's exposure to foreign currency changes for all other currencies is not material.
The following tables demonstrate the sensitivity to a reasonably possible change in USD exchange rate to increase or (decrease) against the EUR. During 2025, the average fluctuation of EUR vs. USD was 8%. As at 31 December 2025, if the US dollar had weakened / strengthened by 8% against the Euro with all other variables held constant, the translation of cash and cash equivalents, foreign currency receivables, payables, and loans and borrowings would have resulted in an increase / decrease of USD 17.6 million of the profit of the year.
31 December 2025 | Change in FX rate | Direct effect on profit before tax | Direct effect on equity |
|---|---|---|---|
EUR - USD | 8 percent | 17.6 | - |
(8) percent | (17.6) | - |
31 December 2024 | Change in FX rate | Direct effect on profit before tax | Direct effect on equity |
|---|---|---|---|
EUR - USD | 6 percent | 106.5 | - |
(6) percent | (106.5) | - |
The figures in the above overview are determined based on the currency volatility of the respective years. As at 31 December 2025, a significant part of the Group's exposure to foreign currency transaction risk relates to working capital and intercompany balances.
6.3.3 Interest rate risk
The Group's cash flow interest rate risks arise from the exposure to variability in future cash flows of floating rate financial instruments and refinancing fixed rate borrowings. The Group regularly reviews its exposure to the global interest rate environment.
The Group analyses its interest rate exposure on a dynamic basis. The Group calculates the impact on profit or loss of a defined interest rate shift. The same interest rate shift is used for all currencies. The assumed movement in basis points for the interest rate sensitivity analysis is based on the currently observable market data, showing a higher volatility compared to prior years. The interest rate sensitivity calculation is based on the interest-bearing liabilities. With all other variables held constant, the Group's profit before tax is affected through the impact on floating rate borrowings plus refinancing of fixed rate borrowings.
The following table demonstrates the sensitivity to a reasonably possible change in interest rates on that portion of borrowings affected:
$ millions | In basis points | 2025 | 2024 |
|---|---|---|---|
Effect on profit before tax for the coming year | + 200 bps | (1.3) | (1.7) |
Effect on profit before tax for the coming year | - 200 bps | 1.3 | 1.7 |
6.3.4 Commodity price risk
Natural gas is one of the primary raw materials used in the Group's production processes. The Group is exposed to natural gas price commodity risk for those entities that buy natural gas at spot prices.
Management monitors the development of gas prices and products’ selling prices on a daily basis using external historical and forecast market data provided by several data vendors. Management analyzes the potential profit margin per product based on this data in order to make operational and hedging decisions.
For the entities that are impacted by changes in natural gas prices during 2025, a change in the average natural gas prices by USD 1 per MMBtu would impact the total annual cost of sales by USD 30.4 million (2024: USD 27.8 million), excluding the impact of hedges.
As of 31 December 2025, the continuing operations of the Group held some gas hedge contracts carried over from the sale of the Methanol business. These positions are measured at fair value through profit or loss. The total outstanding gas hedges in MMBtu as at 31 December 2025 are:
• Options (delta equivalent): nil (31 December 2024: 7.3 million)
• Flat priced contracts: 32.4 million (31 December 2024: nil)
These hedges have been settled subsequent to the year-end. Please refer to note 33 Subsequent events for details.
European Emission Allowance
In 2025, the Group generated additional liquidity by selling EUAs to the market. This generated total net proceeds of USD 38.9 million resulted from the sale. Included in the net proceeds received, a gross amount of USD 38.9 million was recognized in cost of sales related to the sale of excess EUAs.
6.3.5 Fair value risk on investment in Methanex Corp
On 27 June 2025, the Group received approximately 9.9 million shares in Methanex Corporation as part of the consideration for the disposal of the Methanol business. The investment is classified as an equity instrument designated at fair value through other comprehensive income ("FVOCI") on initial recognition. The shares are measured at fair value based on quoted market prices in an active market. Accordingly, the Group is exposed to fair value risk arising from fluctuations in the quoted market price of Methanex Corp's shares. A reasonably possible change in the share price at the reporting date would have increased/(decreased) the equity attributable to the owners of the Company by the amounts shown below. The sensitivity analysis has been prepared assuming that all other variables remain constant and reflects the impact of changes in the quoted market price of the shares as at 31 December 2025:
$ millions | Change in share price | 2025 |
|---|---|---|
Effect on equity attributable to owners of the Company | USD 1 per share | 9.9 |
Effect on equity attributable to owners of the Company | USD (1) per share | (9.9) |
Subsequent to the year-end, OCI through two separate block sale transactions sold approximately 5.3 million Methanex shares for net proceeds of USD 287.9 million. Please refer to note 33 Subsequent events for further details.
6.3.6 Financial instruments
The following table presents the various categories of financial instruments:
31 December 2025 | Note | Loans and receivables / payables at amortized cost | Derivatives at fair value | Financial assets at fair value through profit and loss | Financial assets at fair value through other comp. income |
|---|---|---|---|---|---|
Assets | |||||
Trade and other receivables | (9) | 194.2 | 0.2 | 464.3 | - |
Financial assets at fair value through other comprehensive income | (11) | - | - | - | 400.1 |
Cash and cash equivalents | (14) | 17.9 | - | - | - |
Total | 212.1 | 0.2 | 464.3 | 400.1 | |
Liabilities | |||||
Loans and borrowings | (18) | 62.0 | - | - | - |
Trade and other payables | (20) | 513.7 | 7.8 | - | - |
Total | 575.7 | 7.8 | - | - |
The Group has financial instruments carried at fair value.
As at 31 December 2025, the fair value of the shares in Methanex Corp. was USD 395.0 million. Reference is made to note 11 Financial assets at fair value through other comprehensive income.
The fair value of the investments in Methanex Corp and Orascom Construction, measured as fair value through other comprehensive income, are categorized as level 1 as the fair value is evidenced by a quoted share price.
For derivative financial instruments, the fair value is calculated within hierarchy category level 2.
The Group measures the deferred consideration from the sale of Clean Ammonia as fair value through profit or loss. The fair value is calculated on a discounted basis. In 2024, this asset was categorized as level 3 as the estimated payment date was a significant unobservable input. In 2025, this asset is categorized as level 2 as given the advanced stage of completion, the estimated payment date is no longer a significant input. The deferred consideration is discussed further in note 9 Trade and other receivables.
31 December 2024 | Note | Loans and receivables / payables at amortized cost | Derivatives at fair value | Financial assets at fair value through profit and loss | Financial assets at fair value through other comp. income |
|---|---|---|---|---|---|
Assets | |||||
Trade and other receivables | (9) | 189.5 | 2.4 | 447.9 | - |
Financial assets at fair value through other comprehensive income | (11) | - | - | - | 3.4 |
Cash and cash equivalents | (14) | 2,052.9 | - | - | - |
Total | 2,242.4 | 2.4 | 447.9 | 3.4 | |
Liabilities | |||||
Loans and borrowings | (18) | 682.1 | - | - | - |
Trade and other payables | (20) | 936.5 | 20.8 | - | - |
Total | 1,618.6 | 20.8 | - | - |
In 2025 and 2024, there were no transfers between the fair value hierarchy categories. The fair value of loans and borrowings and receivables are disclosed in notes 18 Loans and borrowings and 9 Trade and other receivables, respectively.
6.4 Capital management
The Board's policy is to maintain a strong capital base so as to maintain investor, creditor and market confidence. Capital primarily comprises ordinary share capital and retained earnings.
The Group has outstanding obligations, and in some cases material indemnifications arising from prior divestments. Accordingly, the Board is focused on ensuring that the capital base remains sufficient to support continuing operations, settle current obligations and potential indemnifications, and complete the ongoing strategic review.
The Group expects to receive in 2026 material cash inflows. The Group completed the sale of Ammonia distribution business to AGROFERT, a.s. on 31 March 2026, resulting in EUR 290.0 million (USD 340.3 million) of gross cash proceeds before customary closing adjustments and the closure of OAD's inventory financing and securitization programs. Further, the Group expects a net cash inflow from Clean Ammonia of USD approximately 242.4 million in 2026, being the net of USD 470.0 million in deferred consideration already settled and the USD 227.6 million of estimated remaining cash outflows to fund construction costs and to settle OCI's remaining contractual obligations on the Clean Ammonia project. These net proceeds are intended to be applied primarily toward the settlement of the current obligations, including corporate costs, and held as a reserve for potential future claims under the indemnifications provided.
The Group is required to maintain certain capital requirements, in order to maintain its access to loan facilities undrawn at year-end.
Upon closure of the MetCo transaction on 27 June 2025, the Company launched the formal tender process to settle the 2033 Bonds. The loan was repaid in full for USD 664.5 million plus USD 15.7 million of accrued interest on 7 August 2025. Refer to note 18 Loans and borrowings.
On 7 May 2025, OCI N.V. made an extraordinary distribution of USD 1,000 million through both repayment of capital and an extraordinary dividend. OCI N.V. paid a distribution of USD 698.3 million on 3 September 2025 through both a repayment of capital and an extraordinary dividend.
The Group's net debt / (cash) to equity ratio at the reporting date was as follows:
$ millions | Note | 31 December 2025 | 31 December 2024 |
|---|---|---|---|
Loans and borrowings | (18) | 62.0 | 682.1 |
Less: cash and cash equivalents | 17.9 | 2,052.9 | |
Net cash | 44.1 | (1,370.8) | |
Total equity | 1,074.8 | 2,246.8 | |
Net cash to equity ratio | 0.04 | (0.61) |
7 Property, plant and equipment and right-of-use assets
$ millions | Land and buildings | Plant and equipment | Fixtures and fittings | Under construction | Total |
|---|---|---|---|---|---|
Cost | 80.1 | 2,165.3 | 8.8 | 545.5 | 2,799.7 |
Accumulated depreciation | (21.3) | (1,535.7) | (7.3) | - | (1,564.3) |
At 1 January 2024 | 58.8 | 629.6 | 1.5 | 545.5 | 1,235.4 |
Movements in carrying amount: | |||||
Additions | - | 0.9 | - | 448.3 | 449.2 |
Disposals | (2.3) | (0.7) | (0.3) | - | (3.3) |
Depreciation | (4.1) | (122.1) | (0.8) | - | (127.0) |
Impairment | - | (5.3) | - | (7.5) | (12.8) |
Transfers | 1.6 | 59.5 | 0.3 | (61.4) | - |
Reclassified to assets held for sale | (50.3) | (248.1) | (0.1) | (828.7) | (1,127.2) |
Movement in exchange rates | (0.3) | (20.1) | - | (6.0) | (26.4) |
At 31 December 2024 | 3.4 | 293.7 | 0.6 | 90.2 | 387.9 |
Cost | 14.1 | 812.6 | 3.3 | 90.2 | 920.2 |
Accumulated depreciation | (10.7) | (518.9) | (2.7) | - | (532.3) |
At 31 December 2024 | 3.4 | 293.7 | 0.6 | 90.2 | 387.9 |
Movements in carrying amount: | |||||
Additions | 1.8 | - | - | 108.5 | 110.3 |
Depreciation | (0.7) | (87.8) | (0.2) | - | (88.7) |
Transfers | 0.2 | 148.6 | - | (148.8) | - |
Reclassified to assets held for sale | (2.9) | (20.2) | (0.1) | (32.8) | (56.0) |
Movement in exchange rates | 0.4 | 41.6 | - | 10.4 | 52.4 |
At 31 December 2025 | 2.2 | 375.9 | 0.3 | 27.5 | 405.9 |
Cost | 13.9 | 949.0 | 1.9 | 27.5 | 992.3 |
Accumulated depreciation | (11.7) | (573.1) | (1.6) | - | (586.4) |
At 31 December 2025 | 2.2 | 375.9 | 0.3 | 27.5 | 405.9 |
The transfers of USD 148.8 million (2024: USD 61.4 million) are assets under construction that were put into use during the year. Transfers mainly relate to OCIN for USD 145.2 million which is included as part of continuing operations and OTE for USD 3.3 million in the period before it was classified as held for sale. The additions of USD 110.3 million (2024: USD 449.2 million) mainly relate to OCIN for USD 104.0 million and OCI Holding Limited for USD 1.8 million which are part of continuing operations and OTE for USD 4.5 million in the period of the year before it met the criteria to be classified as held for sale.
The effect of movement in exchange rates in 2025 mainly relates to OCIN, which have a functional currency of the Euro, compared to the Group's presentation currency. The Euro increased by 13.4% against the US dollar in 2025.
The figures presented above includes any additions, depreciation, disposals, etc. made in disposal groups before they were categorized as held for sale. Additions for OCI Clean Ammonia LLC have ceased upon disposal in September 2024. This change in presentation along with capital expenditures not yet paid as at the year-end date results in a difference between the figure for investments in property, plant and equipment mentioned in the consolidated statement of cash flows and the figure for additions presented above.
For capital commitments reference is made to note 30 Commitments.
Impairment testing
In 2025, management identified an impairment trigger for OCI Nitrogen as a result of the carve-out of the profitable Ammonia distribution business (OAH), the announced closure of one of its major on-site customers and macro economic trends. Therefore, an impairment test was performed on the carrying amount of OCI Nitrogen excluding OAH. The activities of OAH are presented separately as held for sale and are therefore no longer included in the carrying amount tested for impairment.
An impairment loss is recognized only if the cash-generating unit's carrying amount exceeds its recoverable amount. The recoverable amount has been estimated based on value in use. Determining the recoverable amount of the cash‑generating unit requires significant judgments and estimates, including projections of future cash flows from the business as at the impairment testing date of 31 December 2025 and assessing whether developments after the reporting date indicate conditions that already existed at the balance sheet date and thus should be considered.
The tests were carried out by discounting future cash flows to be generated from the continuing use of the cash-generating unit. Key assumptions used in the calculation of recoverable amounts are the discount rate, the terminal value growth rate, selling price outlook per product, natural gas prices and the number of expected operating days per plant. Selling price outlook and natural gas prices assumptions during the forecast periods are based on the adoption of CBAM and consequential reduction of free allowance received under ETS. The terminal growth rate was determined based on the long-term inflation forecast for the Netherlands. The discount rate is estimated using the capital asset pricing model and adjusted to derive a pre‑tax measure. Selling price and natural gas price assumptions are based on a published independent price outlook prepared by global experts and applicable as of the reporting date. Other assumptions are based on past experience and external sources; however, these assumptions are unpredictable and inherently uncertain. The forecast used does not reflect the significant price changes observed after the balance sheet date due to geopolitical tensions.
The impairment tests are based on specific cash‑flow projections for the years 2026 to 2030, which captures the cyclical nature of the industry. For the subsequent years, residual values were calculated using the average EBITDA margin of the last two years of the projection period, applying a perpetual growth rate of 2.30% (2024: 2.95%). The estimated cash flows were discounted using a present value technique.
Based on the impairment test performed, the headroom was estimated at EUR 35.0 million (USD 41.1 million). As the recoverable amount of OCI Nitrogen exceeds its carrying amount, no impairment is recorded.
Upon the closing of the sale of OCI Ammonia Holding B.V., the remaining carrying value of the OCIN asset is approximately USD 290 million (2024: USD 350 million including OAH). Should geopolitical tensions continue for a sustained period, there is a risk that an impairment may be required due to the combination of elevated European natural gas prices, an insufficient compensatory increase in product prices, and other unforeseen events.
While this asset has been for sale for over two years, held-for-sale accounting requirements under IFRS 5 have not been met. Under held-for-sale accounting, the asset is measured at the lower of its carrying value or fair value less costs to sell.
Key assumptions and sensitivity analysis
The following key inputs were determined at 31 December 2025 and applied in performing the impairment test for OCI Nitrogen.
Key inputs | 2025 |
|---|---|
Pre-tax discount rate | 12.87% |
Post-tax discount rate | 9.55% |
Perpetual growth rate | 2.30% |
Average CAN price per mt | € 289.5 |
Average gas price per MWH | € 27.0 |
Average capital expenditure per year in EURm | € (76.9) |
The following changes in the key inputs could, individually, cause the value in use to fall to the level of carrying value.
2025 | Increase in pre-tax discount rate (bps) | Decrease in perpetual growth rate (bps) | Decrease in average CAN price per mt (EUR) | Increase in average gas price per MWH (EUR) | Increase in average capital expenditure per year in EURm |
|---|---|---|---|---|---|
Changes in key inputs | 96.0 | 92.0 | 11.86 | 0.38 | 2.70 |
Illustrative impact of key assumptions | Impact on value in use |
|---|---|
Average gas price increase of EUR 1 per MWH | € (91.6) |
Additional average costs or capital expenditures per year of EUR 5 million | € (64.8) |
Increase in post-tax discount rate by 1% | € (47.6) |
Right-of-use assets
$ millions | Land and buildings | Plant and equipment | Fixtures and fittings | Total |
|---|---|---|---|---|
At 1 January 2024 | 74.9 | 47.1 | 0.1 | 122.1 |
Movements in carrying amount: | ||||
Additions | 0.9 | 27.2 | - | 28.1 |
Modifications | 4.1 | 6.2 | - | 10.3 |
Disposals | (2.1) | (0.2) | - | (2.3) |
Depreciation | (6.8) | (24.7) | (0.1) | (31.6) |
Reclassified to held for sale | (1.2) | (4.7) | - | (5.9) |
Movement in exchange rates | (4.1) | (1.9) | - | (6.0) |
At 31 December 2024 | 65.7 | 49.0 | - | 114.7 |
Movements in carrying amount: | ||||
Additions | 1.4 | 7.8 | 0.1 | 9.3 |
Modifications | 5.3 | 3.9 | - | 9.2 |
Disposals | (0.9) | (20.1) | - | (21.0) |
Depreciation | (4.3) | (10.8) | - | (15.1) |
Reclassified to assets held for sale | (0.6) | (19.9) | (0.1) | (20.6) |
Movement in exchange rates | 8.5 | 3.6 | - | 12.1 |
At 31 December 2025 | 75.1 | 13.5 | - | 88.6 |
The additions of USD 9.3 million (2024: USD 28.1 million) mainly relate to OCIN for USD 3.1 million and OCI Holding Limited for USD 1.1 million. The additions also relate to OAD for USD 4.9 million before it was classified as part of a disposal group held for sale. The effect of movement in exchange rates of USD 12.1 million (2024: USD (6.0) million) mainly relates to OCIN, which has a different functional currency (Euro) compared to the Group’s presentation currency. The Group recognized expenses of USD 0.7 million (2024: USD 0.7 million) related to leases that either meet the short-term exemption or the low-value exemption of IFRS 16.
8 Goodwill and other intangible assets
$ millions | Goodwill | Other intangible assets | Under construction | Total |
|---|---|---|---|---|
Cost | 43.6 | 16.5 | 5.0 | 65.1 |
Accumulated amortization and impairment | - | (7.0) | - | (7.0) |
At 1 January 2024 | 43.6 | 9.5 | 5.0 | 58.1 |
Movements in carrying amount: | ||||
Additions | - | 2.0 | - | 2.0 |
Disposals | - | (5.2) | - | (5.2) |
Transfers | - | (4.5) | - | (4.5) |
Amortization | - | - | (4.8) | (4.8) |
Reclassified to assets held for sale | (23.0) | (1.0) | - | (24.0) |
Movement in exchange rates | (1.2) | (0.3) | (0.2) | (1.7) |
At 31 December 2024 | 19.4 | 0.5 | - | 19.9 |
Cost | 19.4 | 10.8 | - | 30.2 |
Accumulated amortization and impairment | - | (10.3) | - | (10.3) |
At 31 December 2024 | 19.4 | 0.5 | - | 19.9 |
Movements in carrying amount: | ||||
Amortization | - | (0.6) | - | (0.6) |
Reclassified to assets held for sale | (18.3) | - | - | (18.3) |
Movement in exchange rates | 2.5 | 0.1 | - | 2.6 |
At 31 December 2025 | 3.6 | - | - | 3.6 |
Cost | 3.6 | 6.7 | - | 10.3 |
Accumulated amortization and impairment | - | (6.7) | - | (6.7) |
At 31 December 2025 | 3.6 | - | - | 3.6 |
Goodwill
Goodwill held for use has been allocated to the cash generating units as follows:
Cash generating units | Reporting segment | 2025 | 2024 |
|---|---|---|---|
OCI Nitrogen ('OCIN') | Nitrogen Europe | 3.6 | 19.4 |
Total | 3.6 | 19.4 |
The goodwill associated with OTE is included in the balance of assets held for sale presented in 2025. Similarly, in 2024, goodwill associated with OCIB was included in the balance of assets held for sale. Further information is included in note 22 Discontinued operations and assets & liabilities held for sale.
For the result of impairment testing performed for OCI Nitrogen, please refer to Impairment testing.
9 Trade and other receivables
$ millions | Note | 2025 | 2024 |
|---|---|---|---|
Trade receivables (net) | 93.7 | 111.4 | |
Loans and trade receivables due from related parties | (31) | 8.9 | 3.4 |
Prepayments | 3.4 | 6.6 | |
Supplier advance payments | 5.4 | 5.6 | |
Commodity and natural gas derivatives | 0.2 | 1.5 | |
Foreign currency derivatives | - | 0.9 | |
Hedge and margin call deposits | 32.6 | - | |
Deferred consideration from sale of Clean Ammonia | (22) | 464.3 | 447.9 |
Other receivables | 63.3 | 81.8 | |
Total | 671.8 | 659.1 | |
Non-current | 0.2 | 0.3 | |
Current | 671.6 | 658.8 | |
Total | 671.8 | 659.1 |
The Group is party to a securitization agreement to sell certain trade receivables to an external financial institution. By doing so, the Group is able to receive cash flows from selected debtors sooner than would normally be the case.
Upon transfer of the balances, OCI derecognizes the trade receivables, since substantially all risks and rewards of ownership are transferred. The agreement permits securitization of trade receivables up to USD 117.4 million (EUR 100.0 million) (2024: USD 103.5 million / EUR 100.0 million). As per 31 December 2025 an amount of USD 107.3 million (EUR 91.4 million) (2024: USD 62.4 million / EUR 60.3 million) of trade receivables had been transferred. The transferred trade receivables are pledged as security under the securitization program. The Group's continuing operations incurred expenses of USD 3.8 million (2024: USD 5.2 million) in connection with the securitization program.
The carrying amount of ‘Trade and other receivables’ as at 31 December 2025 approximates its fair value. Remeasurement of trade and other receivables resulted in reversal of allowance for trade receivables being recognized amounting to USD 0.8 million in 2025, recorded in other income. In 2024 an allowance for trade receivables of USD 1.5 million was recognized.
The aging of current trade receivables at the reporting date were as follows:
$ millions | 2025 | 2024 | |
|---|---|---|---|
Neither past due nor impaired | 87.1 | 99.8 | |
Past due 1 - 30 days | 4.4 | 10.9 | |
Past due 31 - 90 days | - | 0.3 | |
Past due 91 - 360 days | 2.2 | 0.4 | |
Total | 93.7 | 111.4 |
Management believes that the unimpaired amounts that are past due by more than 30 days (USD 2.2 million) are collectible in full, based on historic payment behavior and extensive analysis of customer credit risk, including underlying customers’ credit ratings if they are available.
Deferred consideration from sale of Clean Ammonia
The deferred consideration from the sale of Clean Ammonia represents 20% of total proceeds (USD 470.0 million) from the divestment of Clean Ammonia (now renamed to Beaumont New Ammonia). For further information, refer to the note 22 Discontinued operations and assets & liabilities held for sale.
This financial asset is mandatorily measured as fair value through profit and loss (“FVTPL”). The change in the fair value between 31 December 2025 (USD 464.3 million) and 31 December 2024 (USD 447.9 million) is due to the passage of time and unwinding of the discount. This USD 16.4 million change in fair value is included in profit and loss and presented in discontinued operations as part of the gain on the sale of investment during the current period.
Deferred consideration was settled between OCI and Woodside on 25 March 2026 upon completion of the project. In 2026, the Group estimates net cash inflows of approximately USD 242.4 million after settlement of the deferred consideration, the remaining USD 222.9 million in construction costs and costs of other contractual obligations and USD 4.7 million in employee liabilities. Refer note 20 Trade and other payables for further information on the remaining Clean Ammonia liabilities as at 31 December 2025 and note 33 Subsequent events for further information on the project completion subsequent to year-end.
10 Equity-accounted investees
The following table shows the movements in the carrying amount of the Group's associates:
$ millions | 2025 | 2024 |
|---|---|---|
At 1 January | 35.2 | 399.5 |
Share in income / (loss) | 4.5 | (73.5) |
Divestment | - | (0.5) |
Dividends | - | (0.5) |
Other comprehensive income / (expense) | - | (3.6) |
Effect of movement in exchange rates | 4.9 | (2.3) |
Reclassified to assets held for sale | - | (283.9) |
At 31 December | 44.6 | 35.2 |
Associates | 44.6 | 35.2 |
Total | 44.6 | 35.2 |
Firewater LLC (Natgasoline LLC) is included in the Methanol business which was reclassified to held for sale in 2024 and subsequently sold to Methanex on 27 June 2025. Refer to note 22 Discontinued operations and assets & liabilities held for sale for further details.
The Group has interests in the following associate which is included in continuing operations:
Name | Type | Participation via | Country | Participation |
|---|---|---|---|---|
Rainbow Holdco B.V. | Associate | OCI Nitrogen B.V. | The Netherlands | 43.0% |
The following table summarizes the financial information of the Group's associates (on a 100% basis):
$ millions | 2025 | 2024 |
|---|---|---|
Non-current assets | 103.8 | 81.9 |
Net assets / (liabilities) | 103.8 | 81.9 |
Income | 10.5 | 6.7 |
Net profit / (loss) | 10.5 | 6.7 |
Associates in the continuing operations of the Group have no profit from discontinued operations.
11 Financial assets at fair value through other comprehensive income
$ millions | 2025 | 2024 |
|---|---|---|
Methanex Corp | 395.0 | - |
Orascom Construction PLC (UAE) | 5.1 | 3.4 |
Total | 400.1 | 3.4 |
Non-current | 400.1 | 3.4 |
Total | 400.1 | 3.4 |
On 27 June 2025, OCI received approximately 9.9 million shares in Methanex Corp. as consideration for the sale of the Methanol business. Refer to note 22 Discontinued operations and assets & liabilities held for sale for further details.
The Group has elected to present changes in the fair value of this equity investment as fair value through other comprehensive income ("FVOCI"). As at 31 December 2025, the fair value of this investment was USD 395.0 million . In 2025, the Group recognized a gain of USD 48.7 million in other comprehensive income due to share price development.
The fair value measurement is based on the quoted market price of the shares at the reporting date (Level 1 under IFRS 13) and does not reflect any potential discount that may arise in the event of a block sale, which may range between 5% and 7% based on market precedents.
Subsequent to the year-end, OCI through two separate block sale transactions sold approximately 5.3 million Methanex shares for net proceeds of USD 287.9 million. Please refer to note 33 Subsequent events for further details.
12 Income taxes
12.1 Income tax in the statement of profit or loss
The 2025 figures in the note below have been re-presented to disclose information about income tax expenses related to continuing operations.
$ millions | 2025 | 2024 |
|---|---|---|
Current tax | 0.1 | (6.2) |
Deferred tax | 12.8 | (1.4) |
Total income tax benefit / (expense) reported in profit or loss | 12.9 | (7.6) |
Current tax expense
$ millions | 2025 | 2024 |
|---|---|---|
Current year | (2.3) | (8.4) |
Changes in estimates relating to prior years | 2.4 | 2.2 |
Income tax benefit/ (expense) reported in profit or loss | 0.1 | (6.2) |
Deferred tax expense
$ millions | 2025 | 2024 |
|---|---|---|
Origination and reversal of temporary differences | 17.9 | (1.3) |
Changes in estimates relating to prior years | (5.1) | (0.1) |
Income tax benefit / (expense) reported in profit or loss | 12.8 | (1.4) |
12.2 Reconciliation of effective tax rate
OCI’s operations are subject to income taxes in various foreign jurisdictions. The statutory income tax rates for continuing operations vary from 0.0% to 25.8%, which results in a difference between the effective income tax rate and
$ millions | 2025 | % | 2024 | % |
|---|---|---|---|---|
(Loss) before income tax | (356.6) | (157.5) | ||
Enacted income tax rate in the Netherlands | 25.8% | 25.8% | ||
Income tax benefit calculated at the enacted Dutch tax rate | 92.0 | (25.8) | 40.6 | (25.8) |
Effect of tax rates in foreign jurisdictions | 0.2 | (0.1) | 0.1 | (0.1) |
Expenses non-deductible | (57.4) | 16.1 | (48.9) | 31.1 |
Income not subject to tax | 34.2 | (9.6) | 1.9 | (1.2) |
Adjustments prior years | (2.7) | 0.8 | 2.2 | (1.4) |
Recognition of previously unrecognized tax assets | - | - | 0.4 | (0.3) |
Unrecognized tax losses | (53.4) | 15.0 | (3.9) | 2.5 |
Total income tax benefit / (expense) in profit or loss | 12.9 | (3.6) | (7.6) | 4.8 |
The Group's consolidated effective tax rate for continuing operations for the period ended 31 December 2025 was 3.6% (2024: -4.8%) compared to the statutory tax rate of 25.8% in the Netherlands. The main driver for the lower effective tax rate is the impact of non-deductible expenses, primarily related to transaction costs, shareholder costs, and non-deductible interest expenses incurred by OCI N.V., as well as the effect of unrecognized tax losses. The aforementioned negative impact is partially offset by income not subject to tax related to the gain on the sale of associates.
Pillar Two global minimum tax
On 20 December 2021, the jurisdictions of the OECD/G20 Inclusive Framework on Base Erosion and Profit Shifting (‘OECD BEPS’) released the so-called Pillar Two Model Rules (also referred to as the “Global Anti-Base Erosion” or “GloBE” Rules) which are designed to ensure that large multinational enterprises ('MNE's) pay a minimum level of tax of 15% on the aggregated qualifying income arising in each jurisdiction where they operate (‘Pillar Two’). On 15 December 2022, the EU Member States unanimously adopted an EU directive ensuring a global minimum level of taxation and agreed to apply these rules for fiscal years starting on or after 31 December 2023. A taxpayer will fall within the scope of Pillar Two if it has more than EUR 750 million in consolidated revenues and is not listed as an excluded entity. A taxpayer in scope of Pillar Two calculates its effective tax rate for the aggregated activities in each jurisdiction where it operates and pays top-up tax for the difference between its effective tax rate per jurisdiction and the global minimum tax rate of 15%. Any resulting top-up tax is generally charged in the jurisdiction of the ultimate parent of the MNE (OCI N.V.), unless their domestic Pillar two top-up tax is leviable in the jurisdiction of operation.
OCI operates in the Netherlands, which has enacted new legislation to implement the global minimum top-up tax as per 1 January 2024. However, based on the Pillar Two Safe Harbor provisions, there is no current tax impact with respect to the continuing operations of OCI NV related to the year ended 31 December 2025. For the impact of the Pillar Two Rules on discontinued operations we refer to note 22 Discontinued operations and assets & liabilities held for sale.
12.3 Deferred income tax assets and liabilities
Changes in deferred tax asset and liabilities (net):
$ millions | 2025 | 2024 |
|---|---|---|
At 1 January | (4.2) | (7.3) |
Profit or (loss) | 12.8 | (2.0) |
Effect of movement in exchange rates (recognized in equity) | 0.2 | 0.2 |
Reclassification to assets/liabilities classified as held for sale | (8.9) | 4.9 |
At 31 December | (0.1) | (4.2) |
Recognized deferred tax assets and liabilities:
Assets | Liabilities | Net | ||||
|---|---|---|---|---|---|---|
$ millions | 2025 | 2024 | 2025 | 2024 | 2025 | 2024 |
Property, plant and equipment | 21.1 | 22.8 | (44.5) | (40.7) | (23.4) | (17.9) |
Inventory | - | 0.1 | (6.1) | (6.5) | (6.1) | (6.4) |
Trade and other receivables | 0.4 | 0.3 | - | (8.3) | 0.4 | (8.0) |
Provisions | 2.7 | - | - | - | 2.7 | - |
Operating losses carry forward and tax credits | 26.3 | 28.1 | - | - | 26.3 | 28.1 |
At 31 December | 50.5 | 51.3 | (50.6) | (55.5) | (0.1) | (4.2) |
Netting of fiscal positions | (50.5) | (51.3) | 50.5 | 51.3 | - | - |
Amounts recognized in the Statement of Financial Position | - | - | (0.1) | (4.2) | (0.1) | (4.2) |
Deferred tax assets and liabilities recognized in relation to property, plant and equipment will be realized over the depreciation period of the related asset, and mainly relate to OCIN. Deferred tax assets relate to temporary differences, tax credits and tax loss carryforwards. OCI has net tax loss carryforwards and interest limitation carried forward totaling USD 169.6 million. The loss carryforwards mainly relate to the NL operations.
Uncertain tax positions
The group is subject to the application of complex tax laws in multiple jurisdictions. Application of these complex tax laws may lead to uncertainties in determining tax positions. We aim to resolve these uncertainties in discussions with the tax authorities. The financial effect of the existing uncertainties per balance sheet date are determined in accordance with IAS 12 and IFRIC 23, which requires us to estimate the potential outcome of any tax position. Our estimate for the potential outcome of any uncertain tax position is judgmental.
As of 31 December 2025 and 31 December 2024, the continuing operations of the Group had no uncertain tax positions. For uncertain tax positions related to the discontinued operations, please refer to note 21 Provisions and 22 Discontinued operations and assets & liabilities held for sale.
The Group believes that its accruals for tax liabilities are adequate for all open tax years based on its assessment of many factors, including interpretations of tax law and prior experience.
Unrecognized deferred tax assets
Expiration scheme of gross unrecognized carry-forward tax losses, tax credits and deductible temporary differences:
2025 | Less than 1 year | Between 1 and 5 years | Between 5 and 10 years | Between 10 and 15 years | Between 15 and 20 years | Unlimited | Total |
|---|---|---|---|---|---|---|---|
Temporary differences | - | - | - | - | - | - | - |
Tax losses and credit carry forwards | - | - | - | - | - | 214.1 | 214.1 |
Unrecognized deferred tax assets | - | - | - | - | - | 214.1 | 214.1 |
2024 | Less than 1 year | Between 1 and 5 years | Between 5 and 10 years | Between 10 and 15 years | Between 15 and 20 years | Unlimited | Total |
|---|---|---|---|---|---|---|---|
Temporary differences | - | - | - | - | - | - | - |
Tax losses and credit carry forwards | - | - | - | - | - | 31.0 | 31.0 |
Unrecognized deferred tax assets | - | - | - | - | - | 31.0 | 31.0 |
The above unrecognized temporary differences, tax losses and tax credit carryforwards relate to tax jurisdictions in which OCI has suffered a tax loss in the current or a preceding period. Significant judgment is required in determining whether deferred tax assets can be utilized. OCI determines this based on expected taxable profits arising from the reversal of recognized deferred tax liabilities and based on budget, cash flow forecasts and impairment models and the recent history of taxable results. Where utilization is not considered probable, deferred tax assets are not recognized. In addition to the above, OCI N.V. has unrecognized interest deduction carry-forwards amounting to USD 346.0 million (2024: USD 209.0 million) with an unlimited carryforward period.
Changes in income tax receivables and payables:
$ millions | 2025 | 2024 |
|---|---|---|
At 1 January | (5.3) | (8.1) |
Profit or (loss) | (2.3) | (10.2) |
Changes in estimates relating to prior years | 2.4 | 2.3 |
(Receipts) / Payments | (0.4) | 7.3 |
Effect of movement in exchange rates | 0.1 | 0.1 |
Reclassification to assets/liabilities classified as held for sale | - | 3.3 |
At 31 December | (5.5) | (5.3) |
Income tax receivable | 0.4 | 2.5 |
Income tax payable | (5.9) | (7.8) |
Total | (5.5) | (5.3) |
13 Inventories
$ millions | 2025 | 2024 |
|---|---|---|
Finished goods | 42.3 | 118.6 |
Raw materials and consumables | 5.6 | 3.4 |
Spare parts, fuels and others | 19.6 | 16.0 |
Total | 67.5 | 138.0 |
During 2025, the reversal of write-downs amounted to USD 0.9 million (2024: USD 0.7 million).
14 Cash and cash equivalents
$ millions | 2025 | 2024 |
|---|---|---|
Bank balances | 6.2 | 33.5 |
Deposits | 11.7 | 2,019.4 |
Total | 17.9 | 2,052.9 |
Cash held by disposal groups are included as part of assets held for sale. Refer to note 22.
15 Equity attributable to owners of the Company
The movements in the number of shares can be summarized as follows:
2025 | 2024 | |
|---|---|---|
At 1 January | 211,357,989 | 210,997,647 |
Number of issued shares | - | 360,342 |
On issue at 31 December - fully paid | 211,357,989 | 211,357,989 |
Par value per share (in EUR) | 0.02 | 0.02 |
At 31 December (in millions of USD) | 5.6 | 5.6 |
The authorized capital of the Company amounts to EUR 12.0 million. The authorized capital is divided into 600 million shares, with a nominal value of EUR 0.02 each.
Movements in equity attributable to owners of the Company in 2025:
The share capital movements relate to the increase and subsequent decrease in the nominal value of the ordinary shares, to facilitate capital repayments and extraordinary distributions. Shareholders received cash distribution of USD
The movement in retained earning of USD 8.9 million relates to the share-based compensation expense recorded in 2025 net of release of share-based compensation reserve as a result of the termination of the share-based compensation plans. Refer to note 23.3 Share-based compensation arrangements.
Movements in equity attributable to owners of the Company in 2024:
The share capital movements relate to the increase and subsequent decrease in the nominal value of the ordinary shares, to facilitate a capital repayment in relation to the distribution. Shareholders received a cash distribution for the repayment of capital of EUR
An amount of USD 10.6 million related to share-based compensation expense was recognized in retained earnings.
16 Reserves
$ millions | Hedge reserve | Financial assets at fair value through other comprehensive income | Currency translation | Treasury shares | Total |
|---|---|---|---|---|---|
At 1 January 2024 | 4.8 | (27.0) | (428.6) | (7.4) | (458.2) |
Movement in hedge reserve | (3.4) | - | - | - | (3.4) |
Currency translation differences | - | - | (154.0) | - | (154.0) |
Realization of translation reserve | - | - | 144.7 | - | 144.7 |
Financial assets at fair value through other comprehensive income | - | 2.0 | - | - | 2.0 |
Other comprehensive income / (expense) | (3.4) | 2.0 | (9.3) | - | (10.7) |
Treasury shares sold / delivered | - | - | - | 27.5 | 27.5 |
Treasury shares acquired | - | - | - | (20.1) | (20.1) |
Issuing shares | - | - | - | (10.6) | (10.6) |
At 31 December 2024 | 1.4 | (25.0) | (437.9) | (10.6) | (472.1) |
Movement in hedge reserve | (3.0) | - | - | - | (3.0) |
Currency translation differences | - | - | 206.0 | - | 206.0 |
Realization of translation reserve | - | - | 103.3 | - | 103.3 |
Financial assets at fair value through other comprehensive income | - | 49.9 | - | - | 49.9 |
Other comprehensive income / (expense) | (3.0) | 49.9 | 309.3 | - | 356.2 |
Treasury shares sold / delivered | - | - | - | 3.7 | 3.7 |
Transfer of loss on disposal of equity investments | - | 25.5 | - | - | 25.5 |
Treasury shares acquired | - | - | - | (1.0) | (1.0) |
At 31 December 2025 | (1.6) | 50.4 | (128.6) | (7.9) | (87.7) |
OCI is a company incorporated under Dutch law. In accordance with the Dutch Civil Code, legal reserves have to be established in certain circumstances. The hedging reserve, the financial assets at fair value through other comprehensive income reserve and the currency translation reserve are legal reserves that limit distributions to shareholders to the extent that these reserves individually have a credit balance.
The reserve related to FVOCI instruments is used to record the cumulative change in fair value of financial assets measured at FVOCI. For further information, see note 11 Financial assets at fair value through other comprehensive income.
The currency translation reserve is used to record the cumulative effect of the translation of the financial information of subsidiaries in the Group with a functional currency of EUR to the Group's presentation currency of USD.
The currency translation reserve is impacted by the recycling of the applicable portion of the net investment hedge and accumulated currency translation differences related to the foreign operations that were disposed in FY 2025, consistent with IAS 21.
Treasury shares
During the financial year ended 31 December 2025 the company acquired 80,000 shares (2024: 1,087,727) and sold and delivered out of share-based payment plans 110,220 shares (2024: 951,895).
2025 | 2024 | |
|---|---|---|
Number of shares | 388,439 | 418,659 |
Average carrying value (historical cost) per share (USD) | 20.45 | 25.32 |
Total (in millions USD) | 7.9 | 10.6 |
Foreign exchange effect | - | - |
Total carrying value of treasury shares (in millions of USD) | 7.9 | 10.6 |
17 Non-controlling interests
Non-controlling interests 2025
The non-controlling interests balance is not material to the Group's financial position for the year ended 31 December 2025. Dividends declared to non-controlling interests during 2025 amounted to USD 4.0 million.
Movements in equity attributable to non-controlling interests in 2024 are as follows:
In 2024, total dividends declared to non-controlling interests amounted to USD 437.9 million.
Impact of difference in profit sharing with non-controlling interests: In the partnership agreement of Sorfert between OCI and the partner, a profit-sharing arrangement was agreed, where the other partner would receive a relatively higher portion of dividends in compensation for lower natural gas prices arranged for by the partner, which is recognized in cost of sales. As a result of this agreement, the non-controlling interests increased by USD 14.4 million in 2024. The effect of the profit sharing agreement represents the gross amount allocated to the partner. This amount is subsequently diluted by the other non-controlling interests in Fertiglobe.
Non-controlling interests in relation to Fertiglobe entities were derecognized during 2024 upon sale of the Fertiglobe business.
In September 2024, a 15% stake of the OCI Methanol Group was repurchased for a total consideration of USD 336.0 million in preparation of the sale of the Methanol business. Of this amount, USD 139.9 million was paid as a dividend to minorities. As a result of this transaction OCI's share in the OCI Methanol Group increased from 85% to 100% prior to the June 2025 sale. The following table summarizes the effect of the transaction on the Company's equity attributable to owners of the Company:
$ millions | 2024 |
|---|---|
Consideration for the shares | 195.1 |
Dividend to minorities | 139.9 |
Fee related to the purchase of the shares | 1.0 |
Total consideration for the purchase of the shares | 336.0 |
Dividend liability | (69.4) |
Non-controlling interest | 63.7 |
Effect on equity attributable to holders of the company | 330.3 |
For the year ended 31 December 2024, the non-controlling interests in the respective entities can be summarized as follows:
The financial information included below is on a proportionate basis. The ownership percentages and the balance sheet items presented represent the non-controlling shareholdings and balances as at December 31, 2024. The income statement items and dividend cash flows represent the amounts accrued up to the date of disposal.
2024 | Fertil | EFC | EBIC | Sorfert | Other Fertiglobe | Methanol business | N-71 | Total |
|---|---|---|---|---|---|---|---|---|
Non-controlling interests | - | - | - | - | - | - | 50.00% | - |
Non-current assets | - | - | - | - | - | - | 13.2 | 13.2 |
Current assets | - | - | - | - | - | - | 34.2 | 34.2 |
Non-current liabilities | - | - | - | - | - | - | (8.6) | (8.6) |
Current liabilities | - | - | - | - | - | - | (34.6) | (34.6) |
Net assets | - | - | - | - | - | - | 4.2 | 4.2 |
Revenues | 252.1 | 158.2 | 95.5 | 326.9 | 671.7 | 139.2 | 383.0 | 2,026.6 |
Profit / (Loss) | 70.1 | 81.7 | 41.6 | 100.7 | (76.7) | (7.3) | 7.0 | 217.1 |
Other comprehensive income | - | - | - | (9.1) | - | - | - | (9.1) |
Total comprehensive income / (expense) | 70.1 | 81.7 | 41.6 | 91.6 | (76.7) | (7.3) | 7.0 | 208.0 |
Dividend cash flows | - | - | (15.9) | (172.5) | (120.7) | (139.9) | - | (449.0) |
- Refer to note 22 for further details in relation to the dissolution of N-7.
18 Loans and borrowings
$ millions | 2025 | 2024 |
|---|---|---|
At 1 January | 682.1 | 2,157.4 |
Proceeds from loans | 98.2 | 967.1 |
Proceeds from / (Repayment of) bank overdraft facility | (6.0) | (84.1) |
Repayment and redemption of loans and borrowings | (776.7) | (2,330.5) |
Modification loss on 2033 bonds tender | 72.5 | - |
Amortization of transaction costs / (bond) premiums | 0.4 | 4.8 |
Effect of movement in exchange rates | 1.2 | (32.6) |
Reclassified to liabilities held for sale | (9.7) | - |
At end of year | 62.0 | 682.1 |
Current | 62.0 | 682.1 |
Total | 62.0 | 682.1 |
Covenants
The Revolving Credit Facility is subject to certain financial covenants. OCI N.V. does not have any amounts drawn on the revolving credit facility as at 31 December 2025. As per 31 December 2024 all financial covenants were met.
Refer to note 6.2 Liquidity risk and note 6.4 Capital management for additional discussion of the Company's liquidity risk and capital management.
Fair value measurement loans and borrowings
The fair value of the loans and facilities is calculated within hierarchy category level 2.
Proceeds from borrowings
Proceeds from borrowings in 2025 totaled an amount of USD 98.2 million (2024: USD 967.1) million, which consisted of changes in OCIN's inventory financing.
Redemptions
Redemptions of borrowings in 2025 totaled an amount of USD 776.7 million (2024: USD 2,330.5 million), which consisted of the full repayment of the 2033 N.V. bonds and changes in OCIN's inventory financing.
In April 2025, the Company reached an agreement with a group of bondholders of its USD 600 million 6.7% bonds due 2033. As part of this agreement, OCI committed to launch a tender offer for the 2033 Bonds after the successful closing of the MetCo transaction, at a price of 110.75% of par, plus accrued and unpaid interest.
The MetCo transaction closed on 27 June 2025 and shortly after the Company launched the formal tender process. The loan was repaid in full for USD 664.5 million plus USD 15.7 million of accrued interest on 7 August 2025.
The agreement with bondholders and the announced tender process resulted in a modification loss on the 2033 Bonds of USD 72.5 million in 2025. The modification loss includes the derecognition of any previously deferred transaction costs.
Undrawn bank facilities
As of 31 December 2025, the Group had not drawn external bank facilities in the amount of USD 600.0 million (2024: USD 600.0 million). This relates to the revolving credit facility at OCI N.V. of USD 600.0 million (2024: USD 600.0 million).
Bank overdraft
As of 31 December 2025, there were no overdraft balances outstanding. As of 31 December 2024, the bank overdraft facility of OCI N.V. amounted to USD 5.2 million and that of OCI Chemicals B.V. amounted to USD 0.9 million.
Loans and borrowings at 31 December 2025
Borrowing company | Type of loan | Principal amount ($ millions) | Interest rate | Date of maturity | Carrying amount ($ millions) | Long-term portion ($ millions) | Short-term portion ($ millions) | Fair value ($ millions) | Collateral / guarantee |
|---|---|---|---|---|---|---|---|---|---|
OCI N.V. | Unsecured loan facility | USD 600.0 | USD: SOFR + 1.6% | April 2027 | (2.1) | - | (2.1) | - | |
OCIN | Inventory financing | USD 63.5 | EURIBOR +0.85% | No defined maturity | 63.5 | - | 63.5 | 63.5 | |
OCIN | Bank Overdraft | N/a | N/a | No defined maturity | 0.6 | - | 0.6 | N/a | |
Total 31 December 2025 | 62.0 | - | 62.0 | N/a |
- Guaranteed, jointly and severally, by OCIN and OCI N.V.
Loans and borrowings at 31 December 2024
Borrowing company | Type of loan | Principal amount ($ millions) | Interest rate | Date of maturity | Carrying amount ($ millions)1 | Long-term portion ($ millions) | Short-term portion ($ millions) | Fair value ($ millions) | Collateral / guarantee |
|---|---|---|---|---|---|---|---|---|---|
OCI N.V. | Unsecured senior notes | USD 600.0 | Fixed 6.70% | March 2033 | 594.0 | - | 594.0 | 608.8 | |
OCI N.V. | Unsecured loan facility | USD 600.0 | USD: SOFR + 1.18% | April 2027 | (3.3) | - | (3.3) | - | |
OCI N.V. | Bank Overdraft | N/a | N/a | No defined maturity | 5.2 | - | 5.2 | n/a | |
OCI Chemicals B.V. | Bank Overdraft | N/a | N/a | No defined maturity | 0.9 | - | 0.9 | n/a | |
OCIN | Inventory financing | USD 85.4 | EURIBOR +0.85% | No defined maturity | 85.3 | - | 85.3 | 85.4 | |
Total 31 December 2024 | 682.1 | - | 682.1 | N/a |
- As at 31 December 2024, the carrying amount of loans and borrowings excludes interest of USD 11.6 million.
- Guaranteed, jointly and severally, by OCIN and OCI N.V.
19 Lease obligations
The Group leases a number of office spaces, warehouses, land, machinery and vehicles. Lease terms vary from 1 year to indefinite renewal options. Calculations of the lease obligation for leases with indefinite renewal options are made using a lease term based on the expected renewal periods.
$ millions | Non-current lease obligations | Current lease obligations | Total |
|---|---|---|---|
At 1 January 2024 | 113.8 | 28.5 | 142.3 |
Movements in carrying amount: | |||
Payments | - | (42.1) | (42.1) |
Accretion of interest | 4.6 | 0.8 | 5.4 |
Additions | 26.2 | 7.5 | 33.7 |
Disposals | (0.5) | - | (0.5) |
Transfers | (33.0) | 33.0 | - |
Modifications | 10.2 | 0.1 | 10.3 |
Reclassified to liabilities held for sale | (12.9) | (7.5) | (20.4) |
Effect of movement in exchange rates | (6.2) | (0.9) | (7.1) |
At 31 December 2024 | 102.2 | 19.4 | 121.6 |
Movements in carrying amount: | |||
Payments | - | (19.4) | (19.4) |
Accretion of interest | 2.5 | 0.1 | 2.6 |
Additions | 9.6 | 0.4 | 10.0 |
Disposals | (15.6) | (6.4) | (22.0) |
Transfers | (19.3) | 19.3 | - |
Modifications | 8.4 | 0.8 | 9.2 |
Reclassified to liabilities held for sale | (16.2) | (5.3) | (21.5) |
Effect of movement in exchange rates | 11.2 | 1.6 | 12.8 |
At 31 December 2025 | 82.8 | 10.5 | 93.3 |
For the lease obligations included as part of the disposal groups held for sale, reference is made to note 22 Discontinued operations and assets & liabilities held for sale.
20 Trade and other payables
$ millions | Note | 2025 | 2024 |
|---|---|---|---|
Trade payables | 111.4 | 158.5 | |
Trade payables due to related parties | 6.7 | 10.6 | |
Amounts payable under the securitization agreement | 55.9 | 38.7 | |
Other payables | 35.8 | 42.2 | |
Employee benefit liabilities | 0.4 | 0.2 | |
Accrued expenses | 78.3 | 82.7 | |
Accrued interest | - | 11.6 | |
Customer advance payment / deferred revenue | - | 5.5 | |
Derivative financial instruments | 7.8 | 20.8 | |
Financial liability from Clean Ammonia sale | (22) | 220.6 | 561.3 |
Contract liability from Clean Ammonia sale | (22) | 4.6 | 25.2 |
Total | 521.5 | 957.3 | |
Non-current | 0.4 | 1.2 | |
Current | 521.1 | 956.1 | |
Total | 521.5 | 957.3 |
Information about the Group's exposure to currency and liquidity risk is included in note 6 Financial risk and capital management. The carrying amount of ‘Trade and other payables’ approximates its fair value. The Group recognized revenue of USD 5.5 million (2024: USD 2.0 million) related to customer advance payments and deferred revenue accrued for as a liability at the beginning of the period.
Derivative financial instruments
Derivative financial instruments consist of commodity gas hedges contracts in order to hedge future gas price levels. The fair value of these contracts amounts to USD 7.8 million as per 31 December 2025 (2024: USD 20.8 million). All derivatives included in trade and other payables are classified in the fair value hierarchy level 2. For market and commodity risks related to these hedges we refer to note 6 Financial risk and capital management. These hedges have been settled subsequent to the year-end. Please refer to note 33 Subsequent events for details.
Contractual liabilities from Clean Ammonia Sale
OCI sold its Clean Ammonia project to Woodside on September 30, 2024. The USD 1,902.2 million initial cash proceeds received from Woodside and the USD 470.0 million of deferred proceeds are in part consideration for OCI to fund the capex and certain pre-operating expenses of the Clean Ammonia project until commissioning and completion of construction of the plant, which occurred on 25 March 2026. This obligation is recognized as a financial liability.
The Group estimates its remaining financial liability for the remaining costs to complete the project based on Beaumont New Ammonia LLC's agreements with its (sub)contractors, the schedule to completion, and OCI's in-depth knowledge of the project. In connection with the sale, OCI provided contractual obligations to Woodside relating to project delivery, liquidated damages, construction subcontractor and insurance claims, and other warranties. The financial liability recorded includes management's best estimate of such potential risks and the impact to expected future cash outflows based on management's judgment on the probability of various scenarios occurring. Based on the assessment of the underlying positions, management's best estimate of the maximum likely exposure from other indemnities beyond the financial liability is nil.
As at 31 December 2025, the measurement of the financial liability was USD 220.6 million (USD 222.9 million undiscounted) based on the expected costs for OCI to fulfill its obligations under the sale agreement. The change in the liability between 31 December 2024 and 31 December 2025 is due to project delays, unforeseen increases in the remaining construction costs to complete the project and changes in management's assumptions of contractual outflows, offset by cash payments made in 2025 to settle these costs.
OCI also agreed as part of the sale and purchase agreement with Woodside to provide employee services back to its former subsidiary, Beaumont New Ammonia LLC, during the construction and commissioning phases. As at 31 December 2025, the measurement of the contract liability was USD 4.6 million (USD 4.7 million undiscounted).
Subsequent to year-end on 25 March 2026, construction on the Beaumont New Ammonia project was deemed complete and the site handed over to Woodside. The Group retains the obligation to settle certain construction costs incurred prior to handover that are not yet invoiced or paid, and to settle out construction claims against the project. For further details, refer to note 33 Subsequent events.
There are a number of risks which may result in changes to the estimated costs to complete the project. Remaining construction costs are subject to a customary post‑closing settlement mechanism, with final settlement expected in H2 2026. The amounts disclosed for the remaining Clean Ammonia liability, including the estimated impact of construction claims and certain indemnities, are based on management's best estimates and judgment. The recognition and settlement of these obligations are subject to estimation uncertainty with respect to both amount and timing of related cash flows.
21 Provisions
$ millions | Claims and other provisions, onerous contracts |
|---|---|
At 1 January 2025 | 41.9 |
Recorded during the year | 10.3 |
Used during the year | (23.7) |
Reversed | (4.4) |
Effect of the movement in exchange rates | 4.9 |
At 31 December 2025 | 29.0 |
Non-current | 10.6 |
Current | 18.4 |
Total | 29.0 |
Provision for Legacy Fertiglobe indemnifications
Under the shareholder agreements and following the Fertiglobe IPO, OCI agreed to indemnify the other Fertiglobe shareholders against potential legacy legal liabilities. These indemnities remain in place even after OCI sold its stake in Fertiglobe, with their amounts increasing as the other shareholders’ ownership increased.
The increase in indemnity liabilities resulting from the sale of Fertiglobe on 15 October 2024 was offset by the recognized gain from that sale in 2024. In 2025, an indemnification obligation to ADNOC regarding a legacy legal matter was realized, requiring OCI to pay ADNOC USD 20.5 million in 2026. This amount payable is balanced by an indemnification asset that was realized and recorded under other receivables, totaling USD 51.2 million (compared to USD 30.3 million in 2024).
As of 31 December 2025 and based on management's assessment of the exposures, the estimated maximum liability under the remaining indemnity exposures is USD 25.0 million. As of 31 December 2025, management's best estimate for the remaining exposure under these indemnity arrangements is USD 8.3 million, which is recognized as a provision.
The indemnities will remain effective until March 2027, or until the expiry of applicable statutes of limitations, or upon final resolution of any associated proceedings. Consequently, it is currently not possible to estimate the time limitation with certainty.
Claims and other provisions
The Group is involved in various litigations, arbitrations and commercial disputes. In cases where it is probable that the outcome of the legal proceedings and commercial disputes will be unfavorable, and where the financial outcome can be measured reliably, a provision has been recognized. Reference is made to note 29 Contingencies for information with respect to major ongoing litigations and claims for which no provision has been recognized.
22 Discontinued operations and assets & liabilities held for sale
22.1 Results from Discontinued Operations
The profit or loss and other comprehensive income of the disposal groups of Fertiglobe, IFCo, OCI Clean Ammonia, the Methanol business and N-7 are presented separately as discontinued operations in the statement of profit or loss. Any gain from the sale of subsidiaries is presented as part of profit from discontinued operations in the consolidated statement of profit or loss. Of the profit from discontinued operations of USD 527.5 million (2024: USD 5,361.0 million), USD 527.4 million (2024: USD 5,142.3 million) is attributable to the owners of the company.
2025
2025 | Fertiglobe | IFCo | Clean Ammonia | Methanol business | N-71 | Total |
|---|---|---|---|---|---|---|
Revenue | - | - | 44.62 | 462.4 | 11.8 | 518.8 |
Cost of sales | - | - | - | (400.6) | (10.8) | (411.4) |
Selling, general and administrative expenses | - | - | (41.7) | (24.5) | (1.8) | (68.0) |
Results from operating activities | - | - | 2.9 | 38.6 | 0.1 | 41.6 |
Net finance income | - | - | - | 0.1 | - | 0.1 |
Share of results of equity-accounted investees | - | - | - | 37.0 | - | 37.0 |
Income tax expense | - | - | (0.6) | (14.7) | - | (15.3) |
Net result on sale | 23.73 | (3.2)4 | (241.3)5 | 684.96 | - | 464.1 |
Profit / (loss) from discontinued operations, net of tax | 23.7 | (3.2) | (239.0) | 745.9 | 0.1 | 527.5 |
- N-7 LLC ceased its trading activities from March 2025 and is in the winding up process
- Relates to revenue earned by OCI Clean Ammonia M&O LLC and OCI Clean Ammonia CM LLC during the period, in exchange for employee services provided back to the Beaumont New Ammonia project
- Primarily relates to updates to the measurement of indemnities
- Relates to the final settlement on the sale of IFCo between parties in March 2025 and the settlement of transaction expenses
- Relates to changes in the measurement of the construction liabilities and the deferred consideration on the Clean Ammonia project. Please refer to note 20 Trade and other payables for details.
- Includes the settlement with Methanex in December 2025
2024
2024 | Fertiglobe | IFCo | Clean Ammonia | Methanol business | N-7 | Total |
|---|---|---|---|---|---|---|
Revenue | 1,489.7 | (3.0) | 9.0 | 860.3 | 752.7 | 3,108.7 |
Cost of sales | (904.2) | 224.71 | (2.2) | (693.1) | (723.7) | (2,098.5) |
Results from operating activities | 479.6 | 206.6 | (19.1) | 118.3 | 16.7 | 802.1 |
Income tax (expense) / income | (33.0) | (44.6) | 2.3 | (30.2) | (1.6) | (107.1) |
Net result on sale | 2,392.9 | 1,769.0 | 776.2 | - | - | 4,938.1 |
Profit / (loss) from discontinued operations, net of tax | 2,740.4 | 1,845.0 | 763.3 | (1.7) | 14.0 | 5,361.0 |
- Includes elimination of IFCo revenue with N-7
Impact of Pillar Two on Discontinued Operations
The following disclosure relates solely to the period prior to the divestment of Fertiglobe in 2024.
In 2024, the Group was at risk of a top-up tax for the activities held by the Fertiglobe group due to respective source jurisdictions having a potential effective tax rate below 15% as determined under the Pillar Two rules. As the Pillar Two rules allow for a levy by the source jurisdiction under the so-called Qualifying Domestic Minimum Top-up Tax as well as by an intermediate holding jurisdiction under the Partially Owned Parent Entity rules.
Fertiglobe was subject to top-up tax in Algeria, where Sorfert's export activities were exempt, and Egypt, where EBIC operated in a tax-free zone. The pro-rated top-up tax due by OCI N.V. in the Netherlands for 2024 was limited to the top-up tax related to indirect ownership of OCI in EBIC SAE for the period of 1 January 2024 up to the closing of the divestment of Fertiglobe on 15 October 2024. After which date, Fertiglobe was responsible in full for its Pillar Two position taking into consideration the tax position of its new majority shareholder ADNOC. The Group had accrued for USD 0.5 million as a Pillar Two tax expense for the period in 2024 before the sale of Fertiglobe.
Sale of the Ammonia distribution business
On 23 November 2025, OCI entered into an agreement with Agrofert, a.s. for the sale of 100% of its equity interests in OCI Ammonia Holding B.V., which includes OCI's Netherlands-based ammonia distribution business and the terminal in Rotterdam (together, the 'Ammonia distribution business'), for a total consideration of EUR 290 million (USD 340.3 million) before customary closing adjustments. The entities in scope of this sale agreement are classified as held for sale but do not meet the criteria for discontinued operations per IFRS 5. The transaction closed on 31 March 2026. Please refer to note 33 Subsequent events for further details.
Sale of the Methanol business
On 8 September 2024, the Group entered into an agreement to sell its 100% stake in its Methanol business to Methanex Corp for USD 2.05 billion, split as USD 1.19 billion in cash (before net working capital and net indebtedness adjustments) and 9.9 million Methanex shares. The sale of the Group's indirect 50% stake in the Natgasoline LLC was included as part of this transaction.
The transaction closed on 27 June 2025 for total cash proceeds of USD 1.29 billion and 9.9 million shares in Methanex. Refer to note 22.3 Sale of the Methanol business.
Sale of Circle Infra Partners by OCI Nitrogen
In March 2025, OCI Nitrogen B.V. ("OCIN"), together with other sellers, completed the sale of its stake in Circle Infra Partners B.V. (previously, Sitech Services B.V.), to Basalt Infrastructure Partners.
OCIN's investment in Circle Infra Partners B.V. was recorded as assets held for sale. The carrying value at the time of the sale was EUR 15.5 million (USD 16.1 million).
Sale of the IFCo business
On 29 August 2024, the Group closed on its of 100% of the equity interests in Iowa Fertilizer Company LLC (“IFCo”) to Koch Ag & Energy Solutions (“Koch”). In 2025, the results from the sale of IFCo are presented as part of the Discontinued Nitrogen segment. IFCo is presented as part of the Nitrogen US segment and classified as discontinued operations in the comparative period. In Q1 2025, OCI and Koch agreed on a final settlement related to the sale. The change in the gain on the sale of IFCo in 2025 relates to this final settlement between parties and the realization of transaction expenses.
In connection with the sale of IFCo, the Group provided certain tax-related indemnities to Koch. The sale agreement does not have a specified time limitation in respect of these indemnities. Based on the assessment of the underlying tax positions, management's best estimate of the maximum likely exposure is nil.
Sale of Fertiglobe
On 15 October 2024, the Group closed on its sale of its 50% + 1 share stake in Fertiglobe PLC to the Abu Dhabi National Oil Company P.J.S.C. (“ADNOC”). In 2025, the results from the sale of Fertiglobe are presented as part of the Discontinued Nitrogen segment. Fertiglobe is presented as its own reportable segment and classified as discontinued operations in the comparative period.
For a description of updates surrounding post-closing matters, including the consideration held in escrow, indemnifications, and the earn-out mechanism, see note 22.4 Estimate of Fertiglobe Indemnifications and Earn-Out Mechanism.
Sale of Clean Ammonia
On 30 September 2024, the Group closed on its sale of 100% of its equity interests in the Clean Ammonia project under construction in Beaumont, Texas (“OCI Clean Ammonia” to Woodside Energy Group Ltd (“Woodside”)).
OCI was acting as project administrator from the execution of the sale until 25 March 2026, when construction was completed. As part of the sale agreement, OCI has a financial obligation to pay for the remaining capex and costs to completion. Refer to note 20 Trade and other payables for more information on the contractual liabilities to fund the remaining costs of the project.
On 25 March 2026, 100% of the equity interests in OCI Clean Ammonia M&O LLC, the subsidiary acting as employer of the operations team on the project, transferred from OCI to Woodside under the terms of the sale agreement between parties. This entity is therefore reflected in discontinued operations / held for sale. Please refer to note 33 Subsequent events for further details.
Dissolution of N-7
In December 2024, OCI Iowa Inc. and Dakota Gasification Company, the shareholders of N-7 LLC, agreed to take action to dissolve N-7. N-7 was the marketing and trading entity responsible for selling the output of IFCo and ammonia volumes from OCI Beaumont, amongst other business. As of 31 December 2025, N-7 is in the winding up process and the entity is dormant.
The decision to dissolve N-7 in 2024 and the subsequent cessation of all business activity results in this entity meeting the criteria to be classified as discontinued operations. As N-7 is not being sold to a third party, the entity does not meet the criteria of IFRS 5 to be classified as held for sale. The remaining balance sheet items of N-7 are included in the consolidated statement of financial position.
Stranded costs
Stranded costs are presented as discontinuing operations if there is a legal agreement for the underlying contracts or activities to transfer to the respective buyer(s) after the sale(s). Therefore, stranded cost at the corporate level typically do not qualify as discontinued operations.
Management is evaluating opportunities to reduce or eliminate stranded costs after the above (anticipated) disposals.
22.2 Assets and liabilities held for sale
In the 31 December 2025 consolidated statement of financial position, the assets and liabilities of OCI Clean Ammonia M&O LLC and the entities within the scope of Ammonia distribution business have been classified as held for sale:
Assets held for sale - 31 December 2025
2025 | Ammonia distribution business | OCI Clean Ammonia M&O LLC | Total |
|---|---|---|---|
Property, plant and equipment | 57.3 | - | 57.3 |
Right of use assets | 14.8 | - | 14.8 |
Goodwill and other intangible assets | 18.4 | - | 18.4 |
Trade and other receivables | 17.5 | 9.3 | 26.8 |
Deferred tax assets | 8.8 | - | 8.8 |
Inventories | 12.9 | - | 12.9 |
Total assets of disposal group held for sale | 129.7 | 9.3 | 139.0 |
Liabilities held for sale - 31 December 2025
2025 | Ammonia distribution business | OCI Clean Ammonia M&O LLC | Total |
|---|---|---|---|
Loans and borrowings | 9.7 | - | 9.7 |
Lease obligations | 14.8 | - | 14.8 |
Trade and other payables | 22.0 | 6.3 | 28.3 |
Total liabilities of disposal group held for sale | 46.5 | 6.3 | 52.8 |
In the 31 December 2024 consolidated statement of financial position, the assets and liabilities of the Methanol business (including Natgas), OCI Clean Ammonia M&O LLC, and OCIN's investment in Circle Infra Partners B.V. were classified as held for sale:
Assets held for sale - 31 December 2024
2024 | Methanol business | Other | Total |
|---|---|---|---|
Property, plant and equipment | 313.5 | - | 313.5 |
Right of use assets | 13.7 | - | 13.7 |
Goodwill and other intangible assets | 29.1 | - | 29.1 |
Trade and other receivables | 180.8 | 3.81 | 184.6 |
Equity-accounted investees | 283.9 | 16.12 | 300.0 |
Deferred tax assets | 6.8 | - | 6.8 |
Inventories | 67.0 | - | 67.0 |
Cash and cash equivalents | 1.2 | - | 1.2 |
Total assets of disposal group held for sale | 896.0 | 19.9 | 915.9 |
- OCI Clean Ammonia M&O LLC
- Carrying value of Circle Infra Partners B.V.
Liabilities held for sale - 31 December 2024
2024 | Methanol business | Other | Total |
|---|---|---|---|
Lease obligations | 23.4 | - | 23.4 |
Trade and other payables | 201.2 | 2.51 | 203.7 |
Deferred tax liabilities | 34.5 | - | 34.5 |
Income tax payables | 2.4 | - | 2.4 |
Other liabilities | 3.8 | - | 3.8 |
Total liabilities of disposal group held for sale | 265.3 | 2.5 | 267.8 |
- OCI Clean Ammonia M&O LLC
22.3 Sale of the Methanol business
The sale of the Methanol business to Methanex Corporation (“Methanex”) was completed on 27 June 2025. The divestiture includes 100% of the equity interests in the fully-owned Methanol business in the EU and US, the 50% indirect ownership interest in Natgasoline LLC, and the respective holding companies. The assets and liabilities of the Methanol business, which have been reported as held for sale since September 2024, were derecognized from the consolidated statement of financial position on 27 June 2025.
The total consideration from the sale is the made up of cash consideration and consideration in the form of Methanex shares received at closing.
Cash consideration is measured as the net/sum of the actual cash received based on estimated Net Working Capital and Net Indebtedness of the businesses sold as at the date of closing, and the final settlement between the parties based on the actual balance sheet at closing. The final settlement was completed in December 2025.
OCI received at the time of the sale 9.9 million common shares in Methanex, representing 12.9% of total share ownership. The shares in Methanex represent an equity investment measured at FVOCI upon election by the Group. The fair value of share consideration received is evidenced by the quoted share price as at closing (i.e. level 1). Subsequent to year-end, a portion of this investment in Methanex was sold for cash proceeds. Please refer to note 33 Subsequent events.
In connection with the sale of the Methanol business, the Group provided certain tax-related indemnities to Methanex Corp. These indemnities remain in effect until June 2028. Based on the assessment of the relevant underlying tax positions and the information available at the reporting date, management's best estimate of the maximum likely exposure under these indemnification arrangements is nil.
Details of the sale of the Methanol business
$ millions | Methanol business |
|---|---|
Cash consideration | 1,289.8 |
Share consideration | 346.3 |
Total consideration | 1,636.1 |
Carrying amount of net assets sold | (827.8) |
Transaction expenses, and realization of net investment hedge and currency translation differences | (123.4) |
Gain on disposal | 684.9 |
Balance sheet at divestment date
27 June 2025 | Methanol business |
|---|---|
Assets sold | |
Property, plant and equipment | 389.3 |
Right of use assets | 12.8 |
Goodwill and other intangible assets | 29.2 |
Trade and other receivables | 151.1 |
Equity-accounted investees | 316.9 |
Deferred tax assets | 3.2 |
Inventories | 68.9 |
Cash and cash equivalents | 31.1 |
Other assets | 1.0 |
Total assets of disposal group sold | 1,003.5 |
27 June 2025 | Methanol business |
|---|---|
Liabilities associated with assets sold | |
Lease obligations | 20.9 |
Trade and other payables | 115.3 |
Deferred tax liabilities | 38.1 |
Income tax payables | 1.4 |
Total liabilities of disposal group sold | 175.7 |
22.4 Estimate of Fertiglobe Indemnifications and Earn-Out Mechanism
As part of the Fertiglobe divestiture, a range of indemnifications and warranties were established as components of the transaction. These include both "Non-Escrow Indemnifications" and specific indemnifications referred to as "Escrow Indemnifications."
With respect to the Escrow Indemnifications, USD 361.6 million of contingent consideration was placed in escrow at closing ("Escrow asset"). The receipt of any portion of this amount is contingent upon the expiration or settlement of a defined subset of indemnifications agreed within the transaction. Refer to note 3.11 Fertiglobe Escrow Indemnifications. Management's evaluation of possible outcomes and associated probabilities and the expected value of the Escrow Indemnifications ("Escrow liability") is that the Escrow asset will cover the Escrow liability. As such, Management does not expect to receive any proceeds from the Escrow asset. There is no change to this position since closing of the transaction.
In view of the contractual agreement and based on information currently available to us, management estimates the minimum settlement of the Escrow liability can be at least USD 100.0 million, and contractual maximum settlement is capped at USD 680.0 million (with higher amounts possible under very exceptional circumstances). At present, based on management's estimate of the potential range of outcomes and probability of scenarios occurring, and taking into account the latest information available, management's best estimate is that the Escrow Asset will cover the Escrow Liability. This assessment is periodically reviewed by Management and the Board.
The underlying indemnities and relevant circumstances are protected by strict confidentiality and non-disclosure clauses as stipulated by the contractual agreements. Further, public disclosure of the nature of the indemnities may harm the Group's position. Therefore, information surrounding the range of potential outcomes, and indications of uncertainties relating to the amount of potential future cashflows, are not disclosed. The Escrow Indemnifications remain effective until all contingencies are fully resolved, and therefore, the duration cannot be reliably determined at this time.
Regarding the remaining Non-Escrow Indemnifications, management's assessment as of the reporting date indicates that the likely exposure is nil. For these Non-Escrow Indemnifications, the applicable limitation period is the later of April 2032 or the statutory period, making it currently impossible to accurately estimate the timeframe.
Furthermore, management has assessed the impact of the earn-out mechanism for 2024 and 2025. Conditions for payment depend on commodity prices (Urea FOB Egypt to Europe) and Fertiglobe FCF were not met and therefore there is no income expected from the earn-out.
For a description of the legacy Fertiglobe indemnification related to transactions prior to 2024, see note 21:Provision for Legacy Fertiglobe indemnifications.
22.5 Other discontinued operations disclosures
Financial instruments
The following table presents the various categories of financial instruments for disposal groups classified as held for sale:
31 December 2025 | Loans and receivables / payables at amortized cost |
|---|---|
Assets | |
Trade and other receivables | 26.8 |
Total | 26.8 |
Liabilities | |
Loans and borrowings | 9.7 |
Trade and other payables | 28.3 |
Total | 38.0 |
Unrecognized deferred tax assets
There are no unrecognized deferred taxes at the entities classified as held for sale as of 31 December 2025.
23 Development of cost of sales and selling, general and administrative expenses
23.1 Expenses by nature
$ millions | 2025 | 2024 |
|---|---|---|
Raw materials and consumables and finished goods | 825.0 | 766.3 |
Maintenance and repair | 44.9 | 46.1 |
Employee benefit expenses | 170.3 | 200.2 |
Depreciation, amortization and impairment | 103.8 | 107.1 |
Consultancy expenses | 46.3 | 62.0 |
Other | 43.7 | 23.3 |
Total | 1,234.0 | 1,205.0 |
Cost of sales | 1,062.3 | 973.1 |
Selling, general and administrative expenses | 171.7 | 231.9 |
Total | 1,234.0 | 1,205.0 |
The increase in raw materials and consumables and finished goods is primarily driven by the relatively higher gas prices as well as Ammonia imports following the unplanned / planned outages to mitigate supply risks in 2025. The depreciation figures above only include the depreciation incurred by the disposal groups before they were classified as held for sale. Other expenses is made up of travel expenses, IT costs, administrative expenses, transaction costs, and other one off costs.
Management classifies costs between cost of sales and selling, general and administrative expenses based on their nature.
In 2025, USD 38.9 million was recognized in cost of sales related to the sale of excess EUAs. In 2024, this amount was nil.
In 2025, SG&A costs included USD 84.7 million transaction related costs for the ongoing strategic review including legal and consultancy fees, restructuring cost, and transaction bonuses. Similarly, in 2024, the costs (including optimization and restructuring costs) for the ongoing strategic review amounted to USD 81.8 million.
For more information see section on Alternative performance measures (APM).
23.2 Employee benefit expenses
$ millions | 2025 | 2024 |
|---|---|---|
Wages and salaries | 89.6 | 94.8 |
Social securities | 10.7 | 16.0 |
Employee incentive plans | 36.9 | 37.4 |
Pension cost | 13.2 | 12.6 |
Share-based compensation expenses | 2.0 | 10.6 |
Other employee expenses | 17.9 | 28.8 |
Total | 170.3 | 200.2 |
During the financial year ended 31 December 2025, the number of total staff employed by the Group amounted to 761 employees (2024: 1091 employees). The number of staff employed in
23.3 Share-based compensation arrangements
In 2025, the Group terminated all share-based incentive plans and settled all outstanding awards granted in prior years. As a result, no share-based payment arrangements remained outstanding as at 31 December 2025. The details of the awards settled in 2025 are below:
Executive Director Performance Share Units Plan
The Performance Share Unit ('PSU') plan provided for the conditional granting of shares in OCI to participants, vesting over a 3-year period. Each award came with vesting conditions dependent on relative TSR and additional performance measures, resulting in between 0% and 150% of this award being issued at the end of the 3-year performance period.
The last issuance of share units under this PSU plan was in 2024. In 2025, all outstanding share units were terminated by OCI.
Performance Share Units Plan | 2024 Grant | 2023 Grant | 2022 Grant |
|---|---|---|---|
Conditional shares granted | 238,154 | 210,873 | 170,650 |
Fair value at grant date (EUR) | 5,949,087 | 3,810,803 | 4,075,463 |
Weighted average fair value at grant date (EUR per share) | 24.98 | 18.07 | 23.88 |
Vesting period at issuance (years) | 3 | 3 | 3 |
Risk free interest rate | 3.140% | 3.230% | -0.171% |
Expected share price volatility | 40.3% | 38.8% | 44.3% |
Dividend yield | 0.0% | 0.0% | 0.0% |
Outstanding 31 December 2024 | 54,033 | 89,190 | 43,093 |
Vested in 2025 | - | - | (43,093)1 |
Cancelled in 20252 | (54,033) | (89,190) | - |
Outstanding 31 December 2025 | - | - | - |
- Vesting of 43,093 ED PSU shares (2022) was based on achievement of the performance targets at 138%.
- In 2025, OCI cancelled the awards granted under the 2023 and 2024 ED PSU plans. As a result, an accelerated share-based compensation expense of USD 0.3 million and USD 0.9 million, respectively, were recognized in the income statement.
Executive Director One-Off Share Award
One-Off Share Awards were granted to the CEO, CFO and CLHCO in 2022 based on 2021 performance. The One-Off Share Awards consisted of conditional stock units which each cover the value of one fully-paid OCI share. Vesting of the conditional stock units was not subject to forward-looking performance conditions, but otherwise the terms and conditions were in line with the Executive Performance Stock Unit Plan. The vesting of the One-Off Share Awards were subject to the Executive Directors’ continued engagement with the Company on the third anniversary of the grant date, and were subject to a two-year holding period.
In 2025, the outstanding share awards were canceled by OCI.
One Off Share Award | 2022 Grant |
|---|---|
Conditional shares granted | 49,519 |
Fair value at grant date (EUR) | 1,736,136 |
Fair value at grant date (EUR per share) | 35.06 |
Vesting period at issuance (years) | 3 |
Dividend yield | 0.0% |
Outstanding 31 December 2024 | 30,781 |
Cancelled in 20251 | (30,781) |
Outstanding 31 December 2025 | - |
- In 2025, OCI cancelled the one-off share awards. Accelerated share based compensation expense recorded as a result of the cancellation is immaterial.
Restricted Stock Units Plan
Restricted Stock Units Plan applied to the level below the Board. The Restricted Stock Units Plan comprised the conditional granting of shares in OCI. The total gross entitlement of an eligible employee under this plan was paid out partly in cash in accordance with the short-term incentive plan and partly in awards in accordance with this RSU plan. Subject to continued employment, the one third of the awards vested at the second anniversary of the grant date and two thirds on the third anniversary of the grant date. The last award under this plan was made in 2023.
In 2025, all outstanding awards were canceled in exchange for a deferred cash bonus to employees.
Restricted Stock Units Plan | 2023 Grant | 2022 Grant |
|---|---|---|
Conditional shares granted | 200,942 | 273,706 |
Fair value at grant date (EUR) | 5,895,419 | 7,762,302 |
Fair value at grant date (EUR per share) | 29.34 | 28.36 |
Vesting period at issuance (years) | 3 | 3 |
Dividend yield | 0.0% | 0.0% |
Outstanding 31 December 2024 | 152,247 | 152,630 |
Forfeited in 2025 | (9,421) | (2,436) |
Vested in 2025 | (37,274) | (90,045) |
Cancelled in 20251 | (105,552) | (60,149) |
Outstanding 31 December 2025 | - | - |
- In 2025, employees waived their rights to the awards granted under the 2022 and 2023 RSU plans in exchange for a deferred cash bonus. As a result, an accelerated share-based compensation expense of USD 0.2 million was recognized in the income statement. The share based payment reserves accumulated in equity is reduced proportionally over the term of the deferred cash bonus.
Employee Performance Share Units Plan
The Employee Performance Share Units Plan was similar to the Executive Director Performance Share Units Plan. Key employees were eligible. Vesting was dependent on relative TSR and additional performance measures.
The last award under this plan was in 2023. In 2025, all outstanding awards were canceled.
Employee Performance Share Units Plan | 2023 Grant |
|---|---|
Conditional shares granted | 38,422 |
Fair value at grant date (EUR) | 694,345 |
Weighted average fair value at grant date (EUR per share) | 18.07 |
Vesting period at issuance (years) | 3 |
Risk free interest rate | 3.230% |
Expected share price volatility | 38.8% |
Dividend yield | 0.0% |
Outstanding 31 December 2024 | 26,818 |
Forfeited in 2025 | (2,002) |
Cancelled in 20251 | (24,816) |
Outstanding 31 December 2025 | - |
- In 2025, OCI cancelled the awards granted under the 2023 Employee PSU plans. As a result, an accelerated share-based compensation expense of USD 0.1 million was recognized in the income statement.
24 Other income
$ millions | 2025 | 2024 |
|---|---|---|
Gain from sale of associates | 30.2 | - |
Other | 5.2 | 5.8 |
Total | 35.4 | 5.8 |
Gain from sale of associates primarily relates to the sale of Circle Infra Partners in 2025. Refer to 22 Discontinued operations and assets & liabilities held for sale for further details of the sale.
25 Other expenses
$ millions | 2025 | 2024 |
|---|---|---|
Other | 0.1 | 7.0 |
Total | 0.1 | 7.0 |
Other expenses of USD 7.0 million in 2024 is related to minimum dividend payments agreed with non controlling shareholders in the Methanol Group. OCI purchased the minority stake in the Methanol Group from these non-controlling shareholders in 2024. Reference is made to note 17 Non-controlling interests.
26 Net finance income / (cost)
$ millions | 2025 | 2024 |
|---|---|---|
Interest income and other financing income on loans and receivables | 54.7 | 54.3 |
Derivatives gain | - | 2.6 |
Finance income | 54.7 | 56.9 |
Interest expense and other financing costs on financial liabilities measured at amortized cost | (47.6) | (89.3) |
Modification loss on 2033 bonds tender | (72.5) | - |
Derivatives loss | (15.8) | (11.1) |
Finance cost | (135.9) | (100.4) |
Net foreign exchange (loss) / gain | (167.2) | 113.5 |
Net finance (cost) / income recognized in profit or loss | (248.4) | 70.0 |
Interest income and other financing income on loans and receivables primarily relate to interest earned on cash deposits generated from the disposal of the Fertiglobe, IFCo, Clean Ammonia and the Methanol business. Reference is made to note 22 Discontinued operations and assets & liabilities held for sale.
Interest expense and other financing costs on financial liabilities measured at amortized cost primarily consist of interest expense on third-party loans and borrowings. Furthermore, the group also recorded modification loss of USD 72.5 million as a result of tender of 2033 bonds. The cash outflow related to this tender is classified as financing activities in the consolidated statement of cash flows. For the interest expense related to lease obligations, reference is made to note 19 Lease obligations.
In 2025, the net foreign exchange loss of USD 167.2 million is driven by the impact of depreciation of the US Dollar against the Euro primarily on USD-denominated cash and bonds held in entities with a EUR functional currency. This compares to a net foreign exchange gain of USD 113.5 million in 2024 as a result of appreciation of the US Dollar appreciated against the Euro.
The losses on derivative instruments relates to derivatives where hedge accounting is not applied. These instruments are mandatorily measured at fair value through profit or loss.
27 Earnings per share
$ millions | 2025 | 2024 |
|---|---|---|
i. Basic | ||
Continuing Operations | ||
Net profit / (loss) attributable to shareholders | (343.7) | (163.5) |
Weighted average number of ordinary shares (basic) | 210,957,658 | 211,042,635 |
Basic earnings per ordinary share - continuing operations | (1.629) | (0.775) |
Discontinued Operations | ||
Net profit / (loss) attributable to shareholders | 527.4 | 5,142.3 |
Weighted average number of ordinary shares (basic) | 210,957,658 | 211,042,635 |
Basic earnings per ordinary share - discontinued operations | 2.500 | 24.366 |
Total operations | ||
Net profit / (loss) attributable to shareholders | 183.7 | 4,978.8 |
Weighted average number of ordinary shares (basic) | 210,957,658 | 211,042,635 |
Basic earnings per ordinary share - total operations | 0.871 | 23.591 |
ii. Diluted | ||
Continuing Operations | ||
Net profit / (loss) attributable to shareholders | (343.7) | (163.5) |
Weighted average number of ordinary shares (diluted) | 210,957,658 | 211,591,428 |
Diluted earnings per ordinary share - continuing operations | (1.629) | (0.775) |
Discontinued Operations | ||
Net profit / (loss) attributable to shareholders | 527.4 | 5,142.3 |
Weighted average number of ordinary shares (diluted) | 210,957,658 | 211,591,428 |
Diluted earnings per ordinary share - discontinued operations | 2.500 | 24.305 |
Total operations | ||
Net profit / (loss) attributable to shareholders | 183.7 | 4,978.8 |
Weighted average number of ordinary shares (diluted) | 210,957,658 | 211,591,428 |
Diluted earnings per ordinary share - total operations | 0.871 | 23.530 |
Weighted average number of ordinary shares calculation
Shares | 2025 | 2024 |
|---|---|---|
Issued ordinary shares at the beginning of the period | 211,357,989 | 210,997,647 |
Effect of treasury shares held | (400,331) | (272,034) |
Effect of shares issued during the period | - | 317,022 |
Weighted average number of ordinary shares outstanding as per 31 December | 210,957,658 | 211,042,635 |
Adjustment for assumed equity-settled share-based compensation | - | 548,793 |
Weighted average number of ordinary shares outstanding (diluted) as per 31 December | 210,957,658 | 211,591,428 |
28 Segment reporting
OCI’s reportable segments are consistent with how the Chief Operating Decision Maker (‘CODM‘) manages the business operations and views the markets he/she serves. The reportable segments are: Methanol US, Methanol Europe, and Nitrogen Europe. The organizational structure of the segments is based on a number of factors that the CODM uses to evaluate, view, and direct business operations.
Segment policy
The Company derives the results of the business segments directly from its internal management reporting system. All segments are managed separately because they require different operating strategies and use their own assets and employees. The entities grouped together in each segment have similar regulatory environments, macroeconomic conditions, banking, insurance and public utilities.
In 2025, the Group had two revenue streams from contracts with customers that relate to the sale of goods, namely, Nitrogen and Methanol.
Segment revenues includes revenues from sales to external customers and intersegment revenues. Intersegment transactions are included in the totals presented per reportable segment and are eliminated in the reconciliation of these balances to the financial statements.
EBITDA, Adjusted EBITDA and profit / (loss) are the primary performance measure used by our CODM to evaluate operating results and allocate capital resources among segments. These are also the profitability measures used to set management and executive incentive compensation goals. Included in the ‘Other’ segment is share-based compensation and certain corporate general and administrative expenses that are not allocated to the segments. Segment results, assets and liabilities include items directly attributable to a segment as well as those that can be reasonably and consistently re-allocated.
A summary description of each reportable segment is as follows:
Methanol US- presented as discontinued operations
This segment consists of OCI Beaumont (OCIB), Natgasoline LLC, the trading entity OCI Methanol Marketing LLC (OMM US) and OCI USA Inc., an entity that serves as the US corporate income tax payer for OCIB and OMM US.
OCI Beaumont is an integrated methanol and ammonia production facility that is strategically located on the Texas Gulf Coast near Beaumont. Natgasoline LLC is a world-scale methanol production complex in Beaumont, Texas. OCI and the other direct shareholder, Consolidated Energy Limited (CEL)/G2X (a subsidiary of the Proman Group), each owned 50% stakes prior to the MetCo transaction.
Natgasoline LLC is an equity-accounted investee of the Group, reference is made to note 10 Equity-accounted investees. Due to the similarities in regulatory environment, products and customer base, this equity-accounted investee has been included in the ‘Methanol US’ segment on a proportionally consolidated basis. The elimination column is used to eliminate the proportionally consolidated figures of Natgasoline LLC that are included in the US Methanol segment and to include the investment in, and results from, Natgasoline LLC (associate) and thereby reconcile to the Group's reported figures.
OCIB and Natgasoline LLC sell mainly domestically; primarily to industrial customers in and around the US Gulf Coast through pipeline connections to adjacent customers, port access with dedicated methanol and ammonia import / export jetties, and truck loading facilities for both methanol and ammonia. OMM US is a trading entity that sells products produced by OCIB and Natgasoline LLC.
Methanol Europe- presented as discontinued operations
This segment consists of BioMCN, located at Delfzijl in the Netherlands, OCI Fuels Ltd, OCI Fuels B.V. and OCI Methanol Marketing B.V. (OMM EU). BioMCN is one of Europe's largest methanol producing plants. BioMCN produces two types of methanol: bio-methanol and regular (also known as grey) methanol.
OCI Fuels is a trading entity that supplies biogas, which is processed into bio-methanol and bio-fuel, and sells the bio-methanol products produced by BioMCN. OMM EU is a trading entity that sells grey methanol products produced by BioMCN.
The Methanol business (comprising Methanol US and Methanol Europe) was sold to Methanex Corporation as part of the MetCo transaction, which closed on 27 June 2025. Refer to section 22 Discontinued operations and assets & liabilities held for sale. As part of the consideration, the Group received approximately 9.9 million shares in Methanex Corporation. The fair value of these shares is presented within total assets under the “Other” segment.
Nitrogen Europe
This segment consists of OCI Nitrogen (OCIN), OCI Terminal Europoort B.V and OCI Ammonia Distribution B.V. OCI Nitrogen is Europe's second-largest integrated nitrates fertilizer producer and the world's largest melamine producer with production site in Geleen, the Netherlands. OCI Terminal Europoort B.V. provides storage and shipment services of ammonia through at their location in Rotterdam, the Netherlands. OCI Ammonia Distribution B.V is OCI’s ammonia distribution platform, serving third party off-site European customers.
On 23 November 2025, OCI entered into an agreement for the sale of 100% of its equity interests in the OCI Ammonia Holding B.V, the parent entity of OCI Terminal Europoort B.V. and OCI Ammonia Distribution B.V., to AGROFERT, a.s. The entities included in this sale agreement do not meet the criteria for discontinued operations under IFRS 5 and are therefore presented within the Nitrogen Europe segment as part of continuing operations, however, their balance sheet figures are grouped in 'Discontinued Nitrogen' for segment reporting purposes as they qualify for held for sale classification.
Discontinued Nitrogen
This segment consists of the following -
Iowa Fertilizer Company LLC (IFCo), Iowa Intermediate Fertilizer Holding (IIFH) which serves as the US corporate income tax payer for IFCo, and N-7, the trading entity. IFCO and IIFH were both sold to Koch as part of the IFCO transaction which closed on 29 August 2024. Refer to section 22 Discontinued operations and assets & liabilities held for sale. Any income or expenses arising from finalization of settlement related to these entities are presented under "Discontinued Nitrogen" segment in 2025. During the comparative period 2024, these entities were presented under "Nitrogen US" segment.
Egyptian Fertilizers Company (EFC), Egypt Basic Industries Corporation (EBIC), Sorfert Algerie (Sorfert), Ruwais Fertilizer Industries LLC (Fertil), Fertiglobe Distribution (FD), Fertiglobe Fertilizer Trading (FFT, previously OCI Fertilizer Trading), OCI Fertilizer Trade and Supply (OFTS), Fertiglobe plc and OCI S.A.E. The divestiture of 50% + 1 share of the equity interests of Fertiglobe PLC to Abu Dhabi National Oil Company P.J.S.C. (“ADNOC”) was completed on October 15th 2024. Refer to section 22 Discontinued operations and assets & liabilities held for sale. Any income or expenses arising from remeasurement of indemnities and finalization of settlement related to these entities are presented under "Discontinued Nitrogen" segment in 2025. During the comparative period 2024, these entities were presented under "Fertiglobe" segment.
OCI and its partner, Dakota Gasification Company, agreed to the dissolution of N-7 in December 2024. N-7 is presented as part of discontinued operations in the statement of profit or loss. As N-7 is not being sold to a third party, it does not meet the criteria to be classified as held for sale in the statement of financial position. N-7 is in the winding up process. N-7's contribution to the profit and loss of the Group is included in the 'Discontinued Nitrogen' segment, however its balance sheet figures are grouped in 'Other - Continuing operations' for segment reporting purposes.
As noted above, the balance sheet figures of entities under the scope of Ammonia distribution business sale are grouped in "Discontinued Nitrogen" for segment reporting purposes.
Clean Ammonia - presented as discontinued operations
The Clean Ammonia segment consists of OCI Clean Ammonia LLC, sold to Woodside on 30 September 2024, OCI Clean Ammonia M&O LLC, transferred to Woodside on 25 March 2026, and OCI Clean Ammonia CM LLC, a wholly-owned subsidiary of OCI created to support OCI's responsibilities related to construction on the plant. Refer to section 22 Discontinued operations and assets & liabilities held for sale and 33 Subsequent events.
As OCI Clean Ammonia CM LLC is not being sold to a third party, it does not meet the criteria to be classified as held for sale in the statement of financial position. Its contribution to the profit and loss of the Group is included in the 'Clean Ammonia - discontinued' segment, however its balance sheet figures are grouped in 'Other - Continuing operations' for segment reporting purposes.
Other
This segment consists of all remaining entities of the Group, which are mainly holding companies. The balance sheet metrics for the 'Other - Continuing' segment include N-7 and OCI Clean Ammonia CM LLC as they are classified as discontinuing operations in the statement of profit or loss but do not meet the criteria to be classified as assets held for sale in the statement of financial position.
2025 | Nitrogen EU | Other1 | Group Elimination | Continuing operations | Discontinued Nitrogen2 | Methanol US3 | Methanol EU | Clean Ammonia | Group Elimination | Discontinued operations | Total for reporting |
|---|---|---|---|---|---|---|---|---|---|---|---|
Total revenues | 1,086.0 | - | - | 1,086.0 | 11.9 | 334.0 | 186.5 | 44.5 | (58.1) | 518.8 | 1,604.8 |
EBITDA4 | 94.3 | (103.2) | - | (8.9) | 0.9 | 126.2 | 0.2 | 2.7 | (87.7) | 42.3 | 33.4 |
Adjusted EBITDA4 | 87.3 | (40.9) | - | 46.4 | 1.2 | 73.3 | (5.0) | 2.7 | 3.0 | 75.2 | 121.6 |
Share of results of equity-accounted investees | 4.5 | - | - | 4.5 | - | - | - | - | 37.0 | 37.0 | 41.5 |
Gain on disposal of subsidiary | - | - | - | - | 20.5 | 684.9 | - | (241.3) | - | 464.1 | 464.1 |
Depreciation, amortization and impairment5 | (100.8) | (3.0) | - | (103.8) | (0.7) | (35.9) | - | - | 35.9 | (0.7) | (104.5) |
Finance income | 1.8 | 58.5 | (5.6) | 54.7 | 0.1 | 0.7 | 0.9 | - | (0.9) | 0.8 | 55.5 |
Finance expense | (15.3) | (126.2) | 5.6 | (135.9) | (0.2) | (2.0) | (1.9) | - | 0.7 | (3.4) | (139.3) |
Net foreign exchange gain / (loss) | (0.5) | (166.7) | - | (167.2) | - | - | 2.7 | - | - | 2.7 | (164.5) |
Income tax benefit / (expense) | 14.1 | (1.2) | - | 12.9 | - | (14.6) | (0.6) | (0.6) | 0.5 | (15.3) | (2.4) |
Net (loss) / profit | (1.9) | (341.8) | - | (343.7) | 20.6 | 759.3 | 1.3 | (239.2) | (14.5) | 527.5 | 183.8 |
Equity-accounted investees | 44.6 | - | - | 44.6 | - | - | - | - | - | - | 44.6 |
Capital expenditures non-current assets | 109.1 | 1.9 | - | 111.0 | - | 76.9 | 0.7 | - | (1.8) | 75.8 | 186.8 |
Total assets | 704.5 | 995.96 | - | 1,700.4 | 129.77 | - | - | 9.3 | - | 139.0 | 1,839.4 |
- "Other" includes corporate entities in the OCI group and holding companies previously included in OCI Methanol Group in relation to profit and loss.
- In relation to the P&L, "Discontinued Nitrogen" includes N-7, and movement in result from the sale of IFCo and Fertiglobe
- Natgasoline LLC has been included in the ‘Methanol US’ segment on a proportionally consolidated basis. The elimination column is used to eliminate the proportionally consolidated figures of Natgasoline LLC that are included in the US Methanol segment and to include the investment in, and results from, Natgasoline LLC (associate) and thereby reconcile to the Group’s reported figures.
- OCI N.V. uses Alternative Performance Measures (‘APM’) to provide a better understanding of the underlying developments of the performance of the business. The APMs are not defined in the IFRS Accounting Standards and should be used as supplementary information in conjunction with the most directly comparable IFRS measures. The definition of the APM and a detailed reconciliation between the APM and the most directly comparable IFRS measure can be found in section 'Other information'.
- Depreciation, amortization and impairment ceased from when the discontinued operations were classified as held for sale.
- Total assets for "Other" include corporate entities and holding companies in the OCI group, and N-7 and Clean Ammonia CM LLC which are presented as discontinued operations but do not meet the criteria for held for sale.
- Total assets for "Discontinued Nitrogen" include entities within the scope of Ammonia Distribution business sale which are classified as held for sale in the consolidated statement of financial position.
2024 | Nitrogen EU | Other1 | Group Elimination | Continuing operations | Nitrogen US | Fertiglobe | Methanol US2 | Methanol EU | Clean Ammonia | Group Elimination | Discontinued operations | Total for reporting |
|---|---|---|---|---|---|---|---|---|---|---|---|---|
Total revenues | 976.5 | - | (1.4) | 975.1 | 763.0 | 1,578.7 | 711.2 | 405.2 | 9.0 | (358.4) | 3,108.7 | 4,083.8 |
EBITDA3 | 58.2 | (183.7) | - | (125.5) | 234.9 | 476.9 | 205.4 | 19.4 | (18.5) | (42.0) | 876.1 | 750.6 |
Adjusted EBITDA3 | 54.9 | (86.8) | - | (31.9) | 201.9 | 495.9 | 133.9 | 19.8 | 0.4 | 5.8 | 857.7 | 825.8 |
Share of results of equity-accounted investees | 5.1 | - | - | 5.1 | - | - | - | - | - | (76.2) | (76.2) | (71.1) |
Gain on disposal of subsidiary | - | - | - | - | 1,769.0 | 2,392.9 | - | - | 776.2 | - | 4,938.1 | 4,938.1 |
Depreciation, amortization and impairment4 | (88.5) | (18.6) | - | (107.1) | (11.4) | - | (151.8) | (0.4) | (0.6) | 90.2 | (74.0) | (181.1) |
Finance income | 10.8 | 97.4 | (51.3) | 56.9 | 2.0 | 12.5 | 3.7 | 3.7 | - | (3.6) | 18.3 | 75.2 |
Finance expense | (13.3) | (138.5) | 51.4 | (100.4) | (89.0) | (109.1) | (18.0) | (2.5) | 4.1 | 3.5 | (211.0) | (311.4) |
Net foreign exchange gain / (loss) | (0.5) | 114.0 | - | 113.5 | - | (2.6) | - | (0.6) | - | - | (3.2) | 110.3 |
Income tax (expense) / income | 8.9 | (16.5) | - | (7.6) | (46.3) | (33.1) | (27.4) | (2.4) | 2.3 | (0.2) | (107.1) | (114.7) |
Net profit / (loss) | (19.3) | (145.9) | 0.1 | (165.1) | 1,859.2 | 2,737.5 | 11.9 | 17.2 | 763.5 | (28.3) | 5,361.0 | 5,195.9 |
Equity-accounted investees | 35.2 | - | - | 35.2 | - | - | - | - | - | 284.0 | 284.0 | 319.2 |
Capital expenditures non-current assets | 57.0 | 1.5 | - | 58.5 | 39.2 | 112.8 | 89.3 | 1.0 | 361.5 | (53.1) | 550.7 | 609.2 |
Total assets | 771.5 | 2,665.35 | - | 3,436.8 | - | - | 1,361.8 | 94.6 | 3.8 | (567.5) | 892.7 | 4,329.5 |
- "Other" includes corporate entities in the OCI group and holding companies for OCI Methanol Group in relation to profit and loss.
- Natgasoline LLC has been included in the ‘Methanol US’ segment on a proportionally consolidated basis. The elimination column is used to eliminate the proportionally consolidated figures of Natgasoline LLC that are included in the US Methanol segment and to include the investment in, and results from, Natgasoline LLC (associate) and thereby reconcile to the Group’s reported figures.
- OCI N.V. uses Alternative Performance Measures (‘APM’) to provide a better understanding of the underlying developments of the performance of the business. The APMs are not defined in the IFRS Accounting Standards and should be used as supplementary information in conjunction with the most directly comparable IFRS measures. The definition of the APM and a detailed reconciliation between the APM and the most directly comparable IFRS measure can be found in section 'Other information'.
- Depreciation, amortization and impairment ceased from when the discontinued operations were classified as held for sale.
- Total assets for "Other" include corporate entities and holding companies in the OCI group, and N-7 and Clean Ammonia CM LLC which are presented as discontinued operations but do not meet the criteria for held for sale.
Geographical information
The geographic information below analyses the Group's revenue (by destination of the goods) and non-current assets (by the Company where the activities are being operated). OCI has no single customer that represents 10% or more of revenues and therefore information about major customers is not provided.
Revenue - Continuing | Revenue - Discontinued | Non-current assets | ||||
|---|---|---|---|---|---|---|
$ million | 2025 | 2024 | 2025 | 2024 | 2025 | 2024 |
Europe | 1,057.2 | 909.1 | 176.5 | 984.8 | 540.1 | 539.6 |
Americas | 15.3 | 39.6 | 341.3 | 1,426.7 | 400.4 | 21.8 |
Africa & Middle East | 8.5 | 10.7 | - | 253.5 | 2.5 | - |
Asia & Oceania | 5.0 | 15.7 | 1.0 | 443.7 | - | - |
Total | 1,086.0 | 975.1 | 518.8 | 3,108.7 | 943.0 | 561.4 |
The key performance obligation of the OCI group is always the supply of products as specified in the contracts with customers. Possible additional performance obligations included are transportation and related cost of insurance, depending on the incoterms.
In 2025, the Group had two revenue streams from contracts with customers that relate to the supply of products i.e. Nitrogen and Methanol. Remeasurement of trade and other receivables resulted in reversal of allowance for trade receivables of USD 0.8 million, recognized in continuing operations in 2025. In 2024 an allowance for trade receivables of USD 1.5 million was recognized. (reference is made to note 6.1 Credit risk and note 9 Trade and other receivables).
Based on the IFRS 15 accounting policies adopted, the following modifications to the contracts are allowed: discounts and rebates. They are all taken into account when presenting the segment revenues. Time value of money is not considered to be relevant for the amendment of the revenue amount, as the payment terms are short.
Also, there are no non-cash considerations that would need to be disclosed separately. No information is provided about remaining performance obligations at current and comparative year end date that have an original expected duration of one year or less, as allowed by IFRS 15.
29 Contingencies
Letters of guarantee / letters of credit
OCI has a committed guarantee facility with Rabobank for a maximum guarantee amount of EUR 75.0 million (USD 88.0 million). The facility is used to issue guarantees on behalf of the subsidiaries, mainly for operational purposes. Under this guarantee facility, EUR 1.2 million (USD 1.4 million) has been utilized.
OCI has an uncommitted guarantee facility for the issuance of payment undertakings with BNP Paribas for an amount of USD 25.0 million. The facility is used to issue guarantees on behalf of the subsidiaries, mainly for operational purposes. As at 31 December 2025, less than USD 1 million of this guarantee facility has been utilized.
Litigations and claims
In the normal course of business, the Group entities and associates are involved in some arbitration, commercial disputes or court cases as defendants or claimants. These litigations and commercial disputes are carefully monitored by the entities’ and Group management and legal counsels, and are regularly assessed with due consideration for possible insurance coverage and recourse rights on third parties.
OCI does not expect these proceedings to result in liabilities that have a material effect on the Group's financial position.
In cases where it is probable that the outcome of the proceedings will be unfavorable, and the financial outcome can be measured reliably, a provision has been recognized in the financial statements which is disclosed in note 21 Provisions. It should be understood that, in light of possible future developments, such as (a) potential additional lawsuits, (b) possible future settlements, and (c) rulings or judgments in pending lawsuits, certain cases may result in additional liabilities and related costs.
Moreover, if and to the extent that the contingent liabilities materialize, they are typically paid over a number of years and the timing of such payments cannot be predicted with confidence.
While the outcome of said cases, claims and disputes cannot be predicted with certainty, we believe, based upon legal advice and information received, that the final outcome will not materially affect our consolidated financial position but could be material to our results of operations or cash flows in any one accounting period.
Indemnities from divestments
As a result of the divestments of IFCo, Fertiglobe, Clean Ammonia, and the Methanol business, the Group has provided indemnities to the respective buyers in relation to specific matters arising from the period prior to disposal.
At the reporting date, management has assessed for each of the indemnifications provided whether these arrangements give rise to a present obligation for which an outflow of resources is probable, given that their occurrence or non-occurrence is subject to one or more uncertain future events not wholly within the control of the Group.
In case an outflow is probable, management has recorded a provision under IAS 37 or other relevant standards. These exposures are subject to ongoing assessment by management.
For a description of the IFCo indemnities, see note 22 Discontinued operations and assets & liabilities held for sale.
For a description of the Fertiglobe indemnities, see note 21 Provisions and note 22.4 Estimate of Fertiglobe Indemnifications and Earn-Out Mechanism.
For a description of the Clean Ammonia indemnities, see note 20 Trade and other payables.
For a description of the Methanol indemnities, see note 22.3 Sale of the Methanol business.
Asset retirement obligations
OCIN entered into agreements with Royal DSM N.V. for the lease of the sites (land) on which it operates its plant. These agreements have an indefinite term and include an asset dismantling obligation and the obligation to clean up environmental pollution occurred after zero measurement. These obligations have not been accounted for, since the company has no plans to end its business activities in the foreseeable future. As such the net present value is assessed as not material by the Company's management.
30 Commitments
30.1 Capital commitments
Capital commitments relate to purchase commitments of property, plant and equipment.
$ millions | 2025 | 2024 |
|---|---|---|
OCIN | 52.8 | 12.8 |
Total | 52.8 | 12.8 |
31 Related party transactions
Transactions with related parties – normal course of business
Transactions with related parties occur when a relationship exists between the Company and their directors and key management personnel. The Company engages in the following types of related party transactions:
Those with NNS Luxembourg Sarl for occasional consultancy services and Residencia Europe Ltd for personnel recharges.
The Executive Chair’s travel as per his right to expense the OCI-related business travel.
The Company’s former construction arm which was divested on 7 March 2015 and incorporated as a separate legal entity, "Orascom Construction plc" (OC) in the United Arab Emirates. The Sawiris family, the majority shareholders of OCI, also owns the majority of the outstanding shares of OC, which qualifies OC and its subsidiaries to be classified as related parties.
Nassef Sawiris has also received his share in distributions by the Company in respect of his shareholding.
The following is an overview of the transactions and outstanding amounts as at 31 December 2025:
Related party | Relation | Recharges | AR at year end | Purchases | AP at year end | Interest expense |
|---|---|---|---|---|---|---|
Orascom Construction Limited | OC Group company | - | 3.1 | - | - | - |
NNS Capital Partners | Related via shareholder Sarl | 0.6 | 1.2 | - | - | - |
NNS Group RSC LTD | Related via shareholder Sarl | - | - | 1.7 | - | - |
Nassef Sawiris | Executive Chair | - | - | 0.9 | 0.4 | - |
Total | 0.6 | 4.3 | 2.6 | 0.4 | - |
The following is an overview of the transactions and outstanding amounts as at 31 December 2024:
Related party | Relation | Recharges | AR at year end | Purchases | AP at year end | Interest expense |
|---|---|---|---|---|---|---|
Residencia Europe Ltd | Related via shareholder Sarl | 1.8 | - | - | - | - |
Nassef Sawiris | Executive Chair | - | - | 0.4 | - | - |
Total | 1.8 | - | 0.4 | - | - |
Transactions with associates
OCI conducts transactions with its associates (as defined in note 3.2 Equity-accounted investees) in the ordinary course of business by buying and selling goods and services from and to various associates within the group. For more information we refer to note 10 Equity-accounted investees and 22 Discontinued operations and assets & liabilities held for sale.
The following is an overview of the transactions and outstanding amounts as at 31 December 2025:
Related party | Relation | Revenue | AR at year end | Purchases | AP at year end |
|---|---|---|---|---|---|
Natgasoline LLC1 | Related via associate | 6.4 | - | 144.1 | - |
Utility Support Group B.V. | Related via associate | 37.3 | 4.6 | 128.6 | 6.3 |
Integrated Inspection Association (IIA) Cooperatief U.A | Associate | - | - | 0.6 | - |
Total | 43.7 | 4.6 | 273.3 | 6.3 |
- Natgasoline LLC has been sold to Methanex Corporation as a part of the sale of the OCI Methanol business which was completed on 27 June 2025.
The following is an overview of the transactions and outstanding amounts as at 31 December 2024:
Related party | Relation | Revenue | AR at year end | Purchases | AP at year end |
|---|---|---|---|---|---|
Natgasoline LLC | Related via associate | 6.2 | 0.3 | 137.1 | 2.4 |
Utility Support Group B.V. | Related via associate | 30.7 | 3.4 | 117.1 | 8.7 |
Circle Infra Partners B.V. | Associate | - | - | 9.9 | 1.9 |
Sitech Manufacturing Services Beheer B.V. | Related via associate | - | - | 0.2 | - |
Chemelot Site Permit b.V. | Related via associate | - | - | 0.3 | - |
Integrated Inspection Association (IIA) Cooperatief U.A | Associate | - | - | 0.3 | - |
Total | 36.9 | 3.7 | 264.9 | 13.0 |
Transactions and balances with equity-accounted investees and related parties
As these are transactions with equity-accounted investees and related parties, the terms and conditions may not necessarily be the same as transactions negotiated between third parties. Management believes that the terms and conditions of all transactions and outstanding balances with our equity-accounted investees and related parties are generally no less favorable to either party than those that could have been negotiated with unaffiliated parties with respect to similar services.
32 Remuneration of the key management personnel
Total compensation for key management personnel expensed during the period amounted to USD 32.9 million (2024: USD 24.9 million). An amount of USD 13.1 million relates to short-term employee benefits (2024: USD 10.9 million); USD 1.8 million relates to share-based compensation (2024: USD 4.2 million); USD 17.5 million relates to other long-term incentives and termination of employment (2024: 9.8). An accrual for expected future costs in relation to the Dutch statutory tax on excessive severance pay was made to the amount of USD 0.5 million (2024: Nil). The group has no post contract benefits or other post contract compensation arrangements with key management personnel.
For more details on the remuneration of the individual members of the Executive Board and the Non-Executive Board, reference is made to the 2025 Directors' Remuneration report.
33 Subsequent events
Settlement of hedges
In Q1 2026, the Group settled all of its outstanding natural gas hedging contracts for a price of USD 5.7 million. These contracts were transferred to OCI N.V. prior to the sale of OCI Beaumont to Methanex. With the recovery of the deposit and margin calls, the net cash inflow was USD 26.7 million.
Partial sale of Methanex shares
Subsequent to year-end, the Group sold a portion of its equity investment in Methanex through a series of block sales.
On 13 March 2026, OCI Chemicals B.V. sold approximately 3.3 million Methanex shares. The shares were sold at a price of USD 51.80 per share, generating net proceeds of approximately USD 172.6 million, after customary fees and expenses.
Further, on 9 April 2026, OCI Chemicals B.V. sold 2.0 million Methanex shares. The shares were sold at a price of USD 57.65 per share, generating net proceeds of approximately USD 115.3 million, after customary fees and expenses.
As a result of the dispositions, OCI Chemicals B.V. now owns or exercises control or direction over an aggregate of approximately 4.6 million shares, representing approximately 6.0% of the issued and outstanding shares of Methanex.
Completion of Beaumont New Ammonia Project
In March 2026, the Beaumont New Ammonia Project successfully completed its performance test and on 25 March 2026, the project was formally handed over to Woodside, including the transfer of the operations team. As part of the divestment, OCI N.V. received on 25 March 2026 USD 470 million in deferred consideration, representing 20% of total proceeds, less amounts deducted for outstanding construction obligations, certain closing-related adjustments, and remaining estimated close-out costs. These items are reflected in the BNA construction liability as at 31 December 2025.
Woodside now has full operational management of the site. The Group retains the obligation to settle certain construction costs incurred prior to handover that are not yet invoiced or paid, and to settle out claims against the project. Remaining construction costs are subject to a customary post‑closing settlement mechanism, with final settlement expected in H2 2026.
Completion of Ammonia distribution business sale
On 31 March 2026, the Group successfully completed the sale of 100% of its equity interests in OCI Ammonia Holding B.V. to AGROFERT, a.s., a significant European nitrogen products manufacturer. The transaction was valued at EUR 290 million (USD 340.3 million). Net proceeds will be subject to customary closing adjustments. In connection with the sale, the Group provided certain indemnities and other contractual arrangements to AGROFERT. Based on management's assessment of the information available as at the reporting date, management does not expect any material financial impact in 2026 to result from the above protections. The terms and conditions related to the transaction other than what has been disclosed are protected by strict confidentiality and non-disclosure clauses as stipulated by the contractual agreements.
34 External independent auditor fee
The service fees recognized in the financial statements 2025 for the service of PricewaterhouseCoopers Accountants N.V. amounted to USD 1.5 million (2024: USD 5.8 million). Other audit services provided to the Group mainly include the ESG limited assurance engagement, review of interim financial statements, other audits and a number of locally required additional audit and assurance procedures.
The amounts per service category are shown in the following table:
Total service fee | of which The Netherlands | |||
|---|---|---|---|---|
$ millions | 2025 | 2024 | 2025 | 2024 |
Audit of group financial statements | 1.0 | 3.5 | 0.7 | 2.2 |
Other audit services | 0.5 | 2.3 | 0.5 | 1.1 |
Total assurance services | 1.5 | 5.8 | 1.2 | 3.3 |
Tax services | - | - | - | - |
Total | 1.5 | 5.8 | 1.2 | 3.3 |
35 List of principal subsidiaries as at 31 December 2025
Companies | Country | Percentage of interest | Consolidation method |
|---|---|---|---|
OCI Intermediate B.V. | The Netherlands | 100.00 | Full |
OCI Chemicals B.V. | The Netherlands | 100.00 | Full |
OCI Fertilizer B.V. | The Netherlands | 100.00 | Full |
OCI Nitrogen B.V. | The Netherlands | 100.00 | Full |
OCI Personnel B.V. | The Netherlands | 100.00 | Full |
OCI Holding Limited | UAE | 100.00 | Full |
OCI Clean Ammonia CM LLC1 | United States | 100.00 | Full |
OCI Clean Ammonia M&O LLC2 | United States | 100.00 | Full |
OCI Terminal Europoort B.V.3 | The Netherlands | 100.00 | Full |
OCI Ammonia Distribution B.V.3 | The Netherlands | 100.00 | Full |
- Included as part of discontinued operations.
- Included as part of asset/liability held for sale and discontinued operations.
- Included as part of asset/liability held for sale.
A full list of affiliated companies will be available for public inspection at the Commercial Registry in conformity with the provisions of Article 2:379 and 2:414 of the Dutch Civil Code.
Parent company financial statements
Parent company statement of financial position
After appropriation of the result, as at 31 December
$ millions | Note | 31 December 2025 | 31 December 2024 |
|---|---|---|---|
Assets | |||
Non-current assets | |||
Investment in subsidiaries | (42) | 1,200.5 | 2,207.5 |
Property, plant and equipment | 0.7 | 1.8 | |
Right-of-use assets | 0.7 | 1.3 | |
Other receivables | (43) | - | 0.1 |
Financial assets at fair value through other comprehensive income | (44) | 5.1 | 3.5 |
Deferred tax assets | (54) | 26.3 | 28.1 |
Total non-current assets | 1,233.3 | 2,242.3 | |
Current assets | |||
Other receivables | (43) | 333.0 | 445.5 |
Income tax receivable | - | 1.8 | |
Cash and cash equivalents | (45) | 16.7 | 2,022.2 |
Total current assets | 349.7 | 2,469.5 | |
Total assets | 1,583.0 | 4,711.8 | |
Equity | |||
Share capital | 5.6 | 5.6 | |
Share premium | 1,028.3 | 2,561.4 | |
Legal reserves | (46.2) | (1,823.5) | (2,248.3) |
Other reserves | (16) | (111.6) | (114.3) |
Retained earnings | 2,242.0 | 3,581.2 | |
Total equity | 1,340.8 | 3,785.6 | |
Liabilities | |||
Non-current liabilities | |||
Lease obligations | - | 0.8 | |
Trade and other payables | (48) | - | 1.0 |
Total non-current liabilities | - | 1.8 | |
Current liabilities | |||
Loans and borrowings | (47) | 160.0 | 801.7 |
Lease obligations | 0.4 | 0.7 | |
Trade and other payables | (48) | 81.8 | 122.0 |
Total current liabilities | 242.2 | 924.4 | |
Total liabilities | 242.2 | 926.2 | |
Total equity and liabilities | 1,583.0 | 4,711.8 |
The notes on pages to are an integral part of these parent company financial statements.
Parent company statement of profit or loss and other comprehensive income
For the year ended 31 December
$ millions | Note | 2025 | 2024 |
|---|---|---|---|
Revenue from dividend income from subsidiaries | (49) | 13.9 | 3,303.5 |
Other income | (51) | - | 0.6 |
General and administrative expenses | (50) | (71.7) | (120.0) |
Impairment of subsidiaries | (42) | (818.4) | (2,402.2) |
Other expenses | (52) | (31.9) | (115.2) |
Operating (loss) / profit | (908.1) | 666.7 | |
Finance income | (53) | 56.5 | 100.5 |
Finance cost | (53) | (126.3) | (128.0) |
Net foreign exchange (loss) / gain | (53) | (177.9) | 149.3 |
Net finance (cost) / income | (247.7) | 121.8 | |
(Loss) / Profit before income tax | (1,155.8) | 788.5 | |
Income tax expense | (54) | (8.3) | - |
Net (loss) / profit | (1,164.1) | 788.5 | |
Other comprehensive income / (expense), net of tax: | |||
Items that are or may be reclassified subsequently to profit or loss | |||
Currency translation differences | (46) | 423.6 | (303.3) |
Items that will not be reclassified to profit or loss | |||
Changes in the fair value of financial assets at fair value through other comprehensive income | 1.2 | 2.0 | |
Other comprehensive income, net of tax | 424.8 | (301.3) | |
Total comprehensive (loss) / income | (739.3) | 487.2 |
The notes on pages to are an integral part of these parent company financial statements.
Parent company statement of changes in equity
$ millions | Note | Share capital | Share premium | Fair value reserve | Currency translation | Other reserves | Retained earnings | Equity attributable to owners of the company |
|---|---|---|---|---|---|---|---|---|
Balance at 01 January 2024 | 5.6 | 4,473.9 | (2.5) | (1,944.5) | (111.1) | 4,198.7 | 6,620.1 | |
Net profit | (46.3) | - | - | - | - | - | 788.5 | 788.5 |
Other comprehensive income / (expense) | - | - | 2.0 | (303.3) | - | - | (301.3) | |
Total comprehensive income | - | - | 2.0 | (303.3) | - | 788.5 | 487.2 | |
Share capital increase | (15) | 1,923.1 | (1,923.1) | - | - | - | - | - |
Share capital decrease | (15) | (1,923.1) | - | - | - | - | - | (1,923.1) |
Issuing shares | (16) | - | 10.6 | - | - | (10.6) | - | - |
Dividend payment | (15) | - | - | - | - | - | (1,387.6) | (1,387.6) |
Treasury shares sold / delivered | (16) | - | - | - | - | 27.5 | (29.0) | (1.5) |
Treasury shares acquired | (16) | - | - | - | - | (20.1) | - | (20.1) |
Share-based payments | (23.3) | - | - | - | - | - | 10.6 | 10.6 |
Balance at 31 December 2024 | 5.6 | 2,561.4 | (0.5) | (2,247.8) | (114.3) | 3,581.2 | 3,785.6 | |
Net loss | (46.3) | (1,164.1) | (1,164.1) | |||||
Other comprehensive income / (expense) | - | - | 1.2 | 423.6 | - | - | 424.8 | |
Total comprehensive income | - | - | 1.2 | 423.6 | - | (1,164.1) | (739.3) | |
Share capital increase | (15) | 1,533.1 | (1,533.1) | - | - | - | - | - |
Share capital decrease | (15) | (1,533.1) | - | - | - | - | - | (1,533.1) |
Dividend payment | (15) | - | - | - | - | - | (165.0) | (165.0) |
Treasury shares sold / delivered | (16) | - | - | - | - | 3.7 | (3.7) | - |
Treasury shares acquired | (16) | - | - | - | - | (1.0) | (1.0) | |
Share-based payments | (23.3) | - | - | - | - | - | (6.4) | (6.4) |
Balance at 31 December 2025 | 5.6 | 1,028.3 | 0.7 | (1,824.2) | (111.6) | 2,242.0 | 1,340.8 |
The notes on pages to are an integral part of these parent company financial statements.
Parent company statement of cash flows
For the year ended 31 December
$ millions | Note | 2025 | 2024 |
|---|---|---|---|
Net (loss) / profit | (46.3) | (1,164.1) | 788.5 |
Adjustments for: | |||
Depreciation | (50) | 1.7 | 10.3 |
Interest income | (53) | (56.5) | (100.5) |
Interest expense | (53) | 126.3 | 128.0 |
Net foreign exchange loss / (gain) | (53) | 177.9 | (149.3) |
Revenue from dividend income from subsidiaries | (49) | (13.9) | (3,303.5) |
Impairment of subsidiaries | (42) | 818.4 | 2,402.2 |
Equity-settled share-based payment transactions | 2.0 | 10.6 | |
Income tax expense | (54) | 8.3 | - |
Changes in: | |||
Other receivables | (43) | 170.1 | 271.3 |
Trade and other payables | (48) | 11.7 | (72.4) |
Cash flows: | |||
Interest paid | (36.5) | (112.7) | |
Settlement interest / gas derivatives | (7.4) | (4.0) | |
Interest received | 54.3 | 50.0 | |
Income tax (received) / paid | 3.7 | (0.4) | |
Dividends received from subsidiaries | (49) | - | 3,135.8 |
Cash flow (used in) / from operating activities | 95.9 | 3,053.9 | |
Investments in intangible fixed assets | - | (0.7) | |
Capital repayment from subsidiaries | (42) | 1,037.8 | 5,072.2 |
Capital contributions | (42) | (601.0) | (1,511.0) |
Cash flow from investing activities | 436.8 | 3,560.5 | |
Purchase of treasury shares | (16) | (1.0) | (7.8) |
Proceeds from borrowings | (47) | - | 891.3 |
Proceeds from borrowings from subsidiaries | (47) | 76.9 | 89.9 |
Repayment of borrowings | (47) | (664.5) | (2,263.2) |
Repayment of borrowings from subsidiaries | (47) | (238.3) | (94.5) |
Distributions paid to owners of the Company | (1,673.5) | (3,212.9) | |
Witholding tax on dividends to owners the Company | (24.6) | (16.2) | |
Settlement FX derivatives | (53) | - | (1.6) |
Payment of lease obligations | (1.1) | (0.9) | |
Cash flows used in financing activities | (2,526.1) | (4,615.9) | |
Net cash flow | (1,993.4) | 1,998.5 | |
Net (decrease) / increase in cash and cash equivalents | (1,993.4) | 1,998.5 | |
Cash and cash equivalents at 1 January | 2,022.2 | 70.0 | |
Effect of exchange rate fluctuations on cash held | (12.1) | (46.3) | |
Cash and cash equivalents at 31 December | 16.7 | 2,022.2 | |
Cash and cash equivalents in statement of financial position | (45) | 16.7 | 2,022.2 |
Bank overdraft repayable on demand | (47) | - | (5.2) |
Cash and cash equivalents in statement of cash flows | 16.7 | 2,017.0 |
The notes on pages to are an integral part of these parent company financial statements.
Notes to the parent company financial statements
For the year ended 31 December
36 General
OCI N.V. (‘The Company’ or ‘OCI’) was established on 2 January 2013 as a public limited liability company incorporated under Dutch law, with its head office located at Honthorststraat 19, Amsterdam, the Netherlands. OCI is registered in the Dutch commercial register under no. 56821166 dated 2 January 2013. OCI is a holding company and is tax resident in the Netherlands.
37 Basis of preparation
The parent company financial statements have been prepared in accordance with International Financial Reporting Standards as endorsed by the European Union (IFRS-EU). The parent company financial statements have been prepared on the historical cost basis, except when otherwise indicated.
The financial year of OCI commences on 1 January and ends on 31 December. The Company's functional currency is the Euro (‘EUR’). Because the Company's major foreign operations that have the US dollar as their functional currency, the presentation currency of the Company is the US dollar (‘USD’). All values are rounded to the nearest tenth million (in millions of USD), except when stated otherwise.
The parent company financial statements have been authorized for issue by the Company's Board of Directors on 13 March 2025. The financial statements are subject to adoption of the Annual General Meeting of Shareholders.
38 Accounting principles applied
In the parent company financial statements, the same accounting policies have been applied as set out in the notes to the consolidated financial statements, except for the measurement of the subsidiaries as presented under ‘Investments in subsidiaries’ in the parent company financial statements. These policies have been consistently applied to all years presented.
For the amendments that became applicable and the new standards not yet applicable to OCI, reference is made to note 4.2 Standards, amendments, revisions and interpretations not yet effective for OCI of the consolidated financial statements.
39 Material accounting policies
Investments in subsidiaries
These policies have been consistently applied to all years presented.
In the parent company financial statements, investments in subsidiaries are recorded at cost less impairment. In the parent company statement of profit or loss and other comprehensive income, dividend received from investments in subsidiaries is recorded as dividend income. Capital repayments received from investments in subsidiaries are recorded as a reduction in the cost of investments. The carrying value of the investment is derecognized upon sale of the subsidiary. Foreign exchange gains or losses accumulated in the Currency Translation Reserve associated with the investment are recycled upon sale.
Due to this application, the parent company equity and net result are not equal to the consolidated equity and net result. A reconciliation for total equity attributable to owners of the company and for total comprehensive income are presented in note 46 Equity attributable to owners of the Parent Company to the parent company financial statements.
Capital repayments and dividend distribution
Capital repayments to the Company's shareholders are recognized as a liability in the parent company financial statements, in the period in which the distribution is approved by the Company's shareholders and the creditor opposition period has lapsed.
Dividend distributions to the Company's shareholders are recognized as a liability in the parent company financial statements, in the period in which the distribution is approved by the Company's shareholders.
Dividend income
Distributions from the Company's subsidiaries that represent a return on investment are classified as dividend income. Dividend income from the Company's subsidiaries is recognized when the right to receive payment is established. Dividend income is presented as revenue in the statement of profit or loss and comprehensive income and as operating activities in the statement of cash flows.
Repayment of invested capital
In the event that distributions from the Company's subsidiaries represent a return of investment, these distributions are classified as a repayment of invested capital. Repayments of invested capital are credited to investments in subsidiaries on the statement of financial position and classified as investing activities in the statement of cash flows.
40 Critical accounting judgment, estimates and assumptions
The preparation of the parent company financial statements requires management to exercise judgment and make estimates and assumptions that affect the application of the Company's accounting policies and the reported amounts of assets, liabilities, income and expenses. Actual results could differ from these estimates.
Estimates and underlying assumptions are reviewed on an ongoing basis. Revisions to accounting estimates are recognized in the period in which the estimates are revised and in any future periods affected.
The area involving a higher degree of judgment or complexity, or area where assumptions and estimates are significant to the parent company financial statements, is the impairment of the investments in subsidiaries.
Valuation of investments in subsidiaries
At each balance sheet date, the Company reviews whether there is an indication that its investments in subsidiaries might be impaired.
An indication for impairment of the investments in subsidiaries may include changes in the expected proceeds for subsidiaries as a result of the projected outcome of the strategic review and divestment process. Further indications for impairments of its investments may include other areas where observable data indicates that there is a measurable decrease in the estimated future cash flows or decline in the Company's market capitalization below the book value of its equity. These determinations require significant judgment. In making this judgment, management evaluates, among other factors, the financial performance of, and business outlook for, its investments, including factors such as industry and sector performance, changes in technology and operational and financing cash flow.
If any indication for impairment exists, the recoverable amount of the investment is estimated in order to determine the extent, if any, of the impairment loss. An investment is impaired if the recoverable amount is lower than the carrying amount. Any impairment loss is recognized immediately in the statement of profit or loss.
Impairment losses recognized in prior periods shall be reversed only if there has been a change in the estimates or external market information used to determine the investment's recoverable amount since the last impairment loss was recognized. The recoverable amount shall not exceed the carrying amount that would have been determined had no impairment loss been recognized in prior years.
41 Financial risk and capital management
Reference is made to note 6 Financial risk and capital management in the notes to the consolidated financial statements.
41.1 Credit risk
The maximum exposure to credit risk at the reporting date is as follows:
$ millions | Note | 2025 | 2024 |
|---|---|---|---|
Other receivables | (43) | 333.0 | 445.6 |
Financial assets at fair value through other comprehensive income | (44) | 5.1 | 3.5 |
Cash and cash equivalents | (45) | 16.7 | 2,022.2 |
Total | 354.8 | 2,471.3 |
The maximum exposure to credit risk for other receivables by geographic region is as follows:
$ millions | 2025 | 2024 |
|---|---|---|
Middle East and Africa | 9.3 | 0.8 |
Europe | 322.8 | 409.2 |
Asia | - | 1.9 |
Americas | 0.9 | 33.7 |
Total | 333.0 | 445.6 |
Reference is made to note 6.1 Credit risk in the notes to the consolidated financial statements.
41.2 Liquidity risk
The following are the contractual maturities of financial liabilities, including estimated interest payments and excluding the impact of netting agreements:
31 December 2025 | Note | Carrying amount | Contractual cash flow | Less than 1 year | Between 1 and 5 years | More than 5 years |
|---|---|---|---|---|---|---|
Financial liabilities | ||||||
Loans and borrowings | (47) | (2.1) | - | - | - | - |
Loans and borrowings from subsidiaries¹ | (47) | 162.1 | 162.1 | 162.1 | - | - |
Trade and other payables | (48) | 81.8 | 82.9 | 82.9 | - | - |
Total | 241.8 | 245.0 | 245.0 | - | - |
31 December 2024 | Note | Carrying amount | Contractual cash flow | Less than 1 year | Between 1 and 5 years | More than 5 years |
|---|---|---|---|---|---|---|
Financial liabilities | ||||||
Loans and borrowings | (47) | 595.9 | 941.7 | 40.2 | 201.0 | 700.5 |
Loans and borrowings from subsidiaries1 | (47) | 205.8 | 205.8 | 205.8 | - | - |
Trade and other payables | (48) | 122.0 | 122.0 | 122.0 | - | - |
Total | 923.7 | 1,269.5 | 368.0 | 201.0 | 700.5 |
- The contractual cash flows do not include interest cash flow for the loan received from OCI Overseas Holding since this loan is repayable on demand.
OCI N.V. leases office space. The office space lease at Honthorststraat was renewed in 2021 for a period of 5 years and ends on 1 December 2026.
Future minimum lease payments
$ millions | 2025 | 2024 |
|---|---|---|
Less than one year | 0.4 | 0.7 |
Between one and five years | - | 0.8 |
Total | 0.4 | 1.5 |
As part of the preparation of the financial statements, the Company has assessed its liquidity risk. Liquidity risk is the risk that the Company may encounter difficulty in meeting the obligations associated with its financial liabilities that are settled by delivering cash or another financial asset. The Company has made a number of assumptions in assessing its ability to meet its covenant requirements and satisfy obligations as they become due. Determining these assumptions requires significant judgment about future results and cash flows. Key assumptions include expected sales proceeds from the sale of Ammonia distribution business, the cost to complete the Clean Ammonia project and the collection of the deferred consideration thereafter, (potential) outflows related to indemnification liabilities, operational cash flows from OCI Nitrogen, and the ability to arrange financing and obtain waivers for anticipated covenant breaches. Refer to note 2.2 Going concern, note 6.2 Liquidity risk and note 18 Loans and borrowings of the notes to the consolidated financial statements for the Company's analyses of going concern, liquidity risk and debt covenants, respectively.
Furthermore, the Company's financial liabilities include loans and borrowings from subsidiaries. Although these loans and borrowings from subsidiaries are sometimes classified as short-term due to the contractual terms, the repayment date of these loans and borrowings can be controlled and determined by OCI and may be extended beyond one year.
41.3 Market risk
Foreign exchange risk
The summary of quantitative data on the Company's foreign exchange transaction exposure based on risk management policy for the main currencies was as follows:
$ millions | 2025 | 2024 |
|---|---|---|
Other receivables | 280.5 | 343.8 |
Trade and other payables | (22.4) | (70.3) |
Loans and borrowings | (90.5) | (623.1) |
Cash and cash equivalents | 0.9 | 2,020.5 |
The following tables demonstrate the sensitivity to a reasonably possible change in EUR-USD exchange rates, with all other variables held constant. During 2025, the average fluctuation of EUR vs. USD was 8%. As at 31 December 2025, if the US dollar had weakened / strengthened by 8% against the Euro with all other variables held constant, the translation of foreign currency receivables, payables, cash and cash equivalents and loans and borrowings would have resulted in an increase / decrease of USD (13.5) million of the profit of the year. The impact on the Company's profit before tax is due to changes in the fair value of monetary assets and liabilities, including inter-company positions.
31 December 2025 | Change in FX rate | Direct effect on profit before tax | Direct effect on equity |
|---|---|---|---|
EUR - USD | 8 percent | (13.5) | - |
(8) percent | 13.5 | - |
31 December 2024 | Change in FX rate | Direct effect on profit before tax | Direct effect on equity |
|---|---|---|---|
EUR - USD | 6 percent | (198.4) | - |
(6) percent | 198.4 | - |
The Company's exposure to foreign currency changes for all other currencies is not material.
Interest rate risk
As at 31 December 2025 and 2024, the carrying amount of third party financial liabilities with a variable rate interest is nil.
Commodity price risk
Natural gas is one of the primary raw materials used in OCI’s production processes. The Company is exposed to natural gas price commodity risk for those entities that buy natural gas at spot prices. Management monitors the development of gas prices and products’ selling prices on a daily basis using external historical and forecast market data provided by several data vendors. Management analyzes the potential profit margin per product based on these data in order to make operational and hedging decisions.
The Company enters into gas hedges on behalf of subsidiaries, in order to hedge future gas price levels over a certain period of time. The Company uses derivatives (Basis swaps, Index swaps and options) in order to do so and does not apply hedge accounting on these instruments, therefore all fair value changes related to these financial instruments are recognized in profit or loss. OCI N.V. is a participating entity in several hedge strategies of the Group. For the hedge strategies reference is made to note 6.3 Market risk. These hedges have been settled subsequent to the year-end. Please refer to note 59 Subsequent events for details.
European Emission Allowance
Several subsidiaries of OCI N.V. receive European Emission Allowances (“EUAs”) as a result of their industrial activities in the Netherlands. The EUAs are granted annually in advance by the Dutch Emission Authority. The amount of EUAs granted is based on an estimate of CO2 emissions in the Netherlands and the effective European emission legislation.
In arrears, the subsidiaries have to refund allowances to the Dutch Emission Authority based on actual CO2 emissions during the year. In the event that a deficit in EUAs is identified, the subsidiaries have to purchase additional EUAs on the commodity markets to settle their liability with the Dutch Emission Authority.
To manage the price exposure on the liability to the Dutch Emission Authority, OCI N.V. may enter into financial hedges to purchase EUAs. For further information reference is made to note 6.3 Market risk.
For the fair value of the commodity derivatives reference is made to note 43 Other receivables.
Financial instruments
The following table presents the various categories of financial instruments:
31 December 2025 | Note | Loans and receivables / payables at amortized cost | Assets / liabilities at fair value | Financial assets at fair value through other comprehensive income |
|---|---|---|---|---|
Assets | ||||
Other receivables | (43) | 333.0 | - | - |
Financial assets at fair value through other comprehensive income | (44) | - | - | 5.1 |
Cash and cash equivalents | (45) | 16.7 | - | - |
Total | 349.7 | - | 5.1 | |
Liabilities | ||||
Loans and borrowings from third parties | (47) | (2.1) | - | - |
Loans and borrowings from subsidiaries | (47) | 162.1 | - | - |
Other payables | (48) | 74.0 | 7.8 | - |
Total | 234.0 | 7.8 | - |
31 December 2024 | Note | Loans and receivables / payables at amortized cost | Assets / liabilities at fair value | Financial assets at fair value through other comprehensive income |
|---|---|---|---|---|
Assets | ||||
Other receivables | (43) | 444.7 | 0.9 | - |
Financial assets at fair value through other comprehensive income | (44) | - | - | 3.5 |
Cash and cash equivalents | (45) | 2,022.2 | - | - |
Total | 2,466.9 | 0.9 | 3.5 | |
Liabilities | ||||
Loans and borrowings from third parties | (47) | 595.9 | - | - |
Loans and borrowings from subsidiaries | (47) | 205.8 | - | - |
Trade and other payables | (48) | 102.2 | 20.8 | - |
Total | 903.9 | 20.8 | - |
The only financial instrument carried at fair value by the Company is the financial asset at fair value through other comprehensive income which is measured with hierarchy level 2 of the fair value hierarchy category.
42 Investment in subsidiaries
$ millions | 2025 | 2024 |
|---|---|---|
At 1 January | 2,207.5 | 8,439.4 |
Repayments of invested capital | (1,037.8) | (5,072.2) |
Capital contribution | 601.0 | 1,511.0 |
Impairment / revaluation | (818.4) | (2,402.2) |
Exchange rate differences | 248.2 | (268.5) |
At 31 December | 1,200.5 | 2,207.5 |
The carrying amount of investments in subsidiaries mainly relates to the investment in OCI Intermediate B.V. OCI Intermediate B.V. is an intermediate holding company that (indirectly) owns OCI’s operating subsidiaries. The value ascribed to the investment in OCI Intermediate B.V. is therefore based on historical contributions for OCI’s operating subsidiaries. As certain operating subsidiaries were disposed as part of the strategic reorientation, this resulted in significant movements in the investments in subsidiaries that are described in more detail below.
Repayments of capital
Upon the divestment of the Methanol business in 2025, a repayment of invested capital of USD 1,037.8 million was made through the collection of the associated transaction proceeds. The carrying amount of the investment in OCI Intermediate B.V. was reduced by this repayment of invested capital up to the level of historical contributions associated with the business sold.
Capital contributions
In 2025, capital contributions of USD 601.0 million (2024: USD 1,511.0 million), by settling loans and receivable balances related to the transactions, were made to OCI Intermediate B.V.
Remeasurement due to strategic reorientation
Impairment test in 2025
As per the reporting date 31 December 2025, the company identified certain indications of impairment on its investment in OCI Intermediate B.V. and its underlying businesses. These indicators relate to additional operating- and hedge losses in respect of the Methanol Business, increased funding requirements for the settlement of the Clean Ammonia construction, a decrease in the Methanex share price (compared to the assessment as per previous year-end) , and unfavorable currency movements affecting USD-denominated investments. As a result, the recoverable amount was assessed.
As of 31 December 2025, the recoverable amount was estimated at USD 1,200.5 million (2024: USD 2,207.5 million). This recoverable amount was determined using a combination of level 3 fair value less costs of disposal and value-in-use methods of the underlying components and CGUs, adjusted for net debt items, including intercompany loans and balances. Key assumptions included official communication regarding future sales transactions, forecasts for commodity prices, natural gas pricing data, plant utilization rates, details from project construction budgets including corresponding documentation with key contractors, and public stock market information. An average discount rate of 9.55% (2024: 8.67%) was used.
$ millions | Note | 2025 | 2024 |
|---|---|---|---|
Revenue from dividend income from subsidiaries | (49) | 13.9 | 3,135.8 |
Repayments of invested capital | 1,037.8 | 5,072.2 | |
Capital contribution | (601.0) | (1,511.0) | |
Net cash impact of transactions from investments | 450.7 | 6,697.0 | |
Impairment of subsidiaries | (818.4) | (2,402.2) | |
Net benefit of transactions from investments | (367.7) | 4,294.8 |
List of subsidiaries as at 31 December 2025:
Name | Country of incorporation | Ownership % |
|---|---|---|
OCI Intermediate B.V. | The Netherlands | 100.0 |
OCI UK Ltd. | United Kingdom | 100.0 |
43 Other receivables
$ millions | 2025 | 2024 |
|---|---|---|
Receivables from subsidiaries | 286.5 | 424.0 |
Commodity derivatives | 7.6 | 1.5 |
Foreign currency derivatives | - | 0.9 |
Other receivables | 38.9 | 19.2 |
Total | 333.0 | 445.6 |
Non-current | - | 0.1 |
Current | 333.0 | 445.5 |
At 31 December | 333.0 | 445.6 |
The carrying amount of receivables approximates their fair value.
Intercompany loan to OCI Intermediate B.V.
Receivables from subsidiaries includes an intercompany loan to OCI Intermediate B.V. to fund the Clean Ammonia Project. The loan is repayable on demand and thus it is presented as current. OCI Intermediate is a contracting party in the sale of OCI Clean Ammonia to Woodside and is therefore responsible for the cost to complete the Clean Ammonia Project. In 2025, the Company contributed receivables related to Clean Ammonia Project funding of USD 552.6 million to OCI Intermediate B.V.
For further information, please refer to note 42 Investment in subsidiaries.
The carrying amount of the loan as at 31 December 2025, together with the remaining costs to complete, is recoverable through the collection of the deferred consideration expected in H1 2026. The recoverable amount is monitored on a continuous basis and periodically reassessed.
44 Financial assets at fair value through other comprehensive income
$ millions | 2025 | 2024 |
|---|---|---|
Orascom Construction Limited (Abu Dhabi) | 5.1 | 3.5 |
Total | 5.1 | 3.5 |
Orascom Construction Limited is a related party.
45 Cash and cash equivalents
$ millions | 2025 | 2024 |
|---|---|---|
Bank balances | 5.0 | 2.8 |
Deposits | 11.7 | 2,019.4 |
Total | 16.7 | 2,022.2 |
46 Equity attributable to owners of the Parent Company
46.1 Reconciliation of consolidated income and equity attributable to shareholders to Parent Company income and equity attributable to owners
$ millions | 2025 Equity | 2025 Profit / Loss | 2024 Equity | 2024 Profit / Loss |
|---|---|---|---|---|
Consolidated equity attributable to owners of the Company | 1,074.5 | 539.9 | 2,242.6 | 4,968.1 |
Revaluation of subsidiaries | 4,303.1 | - | 4,300.6 | - |
Difference in profit or loss | (2,102.2) | (1,347.8) | (754.4) | (4,190.3) |
Other comprehensive income / (loss) | (1,934.6) | 68.6 | (2,003.2) | (290.6) |
Parent company equity attributable to owners | 1,340.8 | (739.3) | 3,785.6 | 487.2 |
The differences between total shareholders’ equity and total comprehensive income according to the consolidated financial statements and the parent company financial statements in general relate to the accounting of investments at cost minus impairment (fair value as deemed cost upon adoption of IFRS Accounting Standards) in the parent company financial statements and subsequent impairments.
The reconciling items for equity and income are further detailed below.
Revaluation of subsidiaries
The revaluation of subsidiaries of USD 4,303.1 million (2024: USD 4,300.6 million) relates to the step up in fair value at the date of transition to IFRS Accounting Standards on 1 January 2014. Further adjustments to investments in subsidiaries were made upon the demerger of OCI’s E&C Business and the Fertiglobe business combination. The revaluation reserve related to the deemed cost value step-up of the subsidiaries was subsequently converted into share capital and distributed as part of the demerger transaction of OCI’s E&C Business and the recent capital repayments. The remaining difference of USD 266.3 million is mainly attributable to the Ammonia Distribution business, which is recognized at cost in the consolidated financial statements and at fair value less costs to sell in the parent company financial statements.
Difference in profit or loss
The 2025 net result is USD 1,347.8 million lower in the parent company financial statements as the net loss for 2025 is USD 1,164.1 million, whereas the net gain attributable to owners of the company in the consolidated financial statements was USD 183.7 million. The 2024 net result is USD 4,190.3 million lower in the parent company financial statements as the net gain for 2024 is USD 788.5 million, whereas the net profit attributable to owners of the company in the consolidated financial statements was USD 4,978.8 million.
Other comprehensive income / (loss)
The reconciliation item ‘Other comprehensive income / (loss)’ represents hedge and currency translation differences which are recognized in the consolidated financial statements but not in the parent company financial statements as the investments are stated at cost. The 2025 difference in income of USD 68.6 million comprises USD 114.6 million of currency translation losses, USD 2.7 million of losses on cash flow hedges and USD 48.7 million gain on financial asset at fair value through other comprehensive income, which do not occur in the parent company financial statements. The 2024 difference in loss of USD 290.6 million comprises USD 294.0 million of currency translation gains and USD 3.4 million of gains on cash flow hedges, which do not occur in the parent company financial statements.
46.2 Legal reserves
OCI is a company incorporated under Dutch law. In accordance with the Dutch Civil Code, legal reserves have to be established in certain circumstances. The currency translation reserve and fair value reserve that limit distributions to shareholders to the extent that these reserves individually have a credit balance.
The reserve related to FVOCI instruments is used to record the cumulative change in fair value of financial assets measured at FVOCI.
The currency translation reserve is used to record the cumulative effect of the translation of the parent company financial statements from its functional currency, EUR, to its presentation currency, USD.
46.3 Appropriation of net profit
$ millions | 2025 | 2024 |
|---|---|---|
Added to retained earnings | (1,164.1) | 788.5 |
Net profit attributable to shareholders | (1,164.1) | 788.5 |
47 Loans and borrowings
$ millions | 2025 | 2024 |
|---|---|---|
Senior notes | - | 594.0 |
Term loan and revolving credit facility | (2.1) | (3.3) |
Bank overdraft facility | - | 5.2 |
Sub-total third-party | (2.1) | 595.9 |
OCI Nitrogen B.V. | 1.1 | 104.2 |
Iowa Holding B.V. | 0.1 | 0.1 |
OCI Personnel B.V. | 5.5 | 13.6 |
OCI Holding Ltd | 14.0 | - |
Nitrogen Holding B.V. | 79.3 | - |
OCI Clean Ammonia CM LLC | 0.1 | - |
OCI Chemicals B.V. | 49.8 | 79.9 |
OCI Intermediate B.V. | 0.4 | - |
OCI Fertilizer International B.V. | - | 0.3 |
OCI Iowa Inc | - | 6.0 |
OCI Fertilizers B.V. | 11.8 | 1.7 |
Sub-total subsidiaries | 162.1 | 205.8 |
Total | 160.0 | 801.7 |
Current | 160.0 | 801.7 |
At 31 December | 160.0 | 801.7 |
Reference is made to note 18 Loans and borrowings of the consolidated financial statements for detailed information on third-party loans and the undrawn bank facility.
The carrying amounts of loans and borrowings from subsidiaries approximates their fair values.
$ millions | 2025 | 2024 |
|---|---|---|
At 1 January | 801.7 | 2,416.7 |
Proceeds from borrowings | - | 891.3 |
Proceeds from bank overdraft facility | - | - |
Proceeds from borrowings subsidiaries | 76.9 | 89.9 |
Proceeds from borrowings subsidiaries in kind | 221.8 | 1.5 |
Redemptions of borrowings | (664.5) | (2,263.2) |
Redemptions of bank overdraft facility | (5.7) | (45.7) |
Redemptions of borrowings subsidiaries | (238.3) | (94.5) |
Redemptions of borrowings subsidiaries in kind | (129.6) | (170.8) |
Modification loss on 2033 bonds tender | 72.5 | - |
Amortization of transaction costs / (bond) premiums | 0.4 | 4.8 |
Effect of movement in exchange rates | 24.3 | (44.0) |
Accrued interest | 0.5 | 15.7 |
At 31 December | 160.0 | 801.7 |
Proceeds from third party borrowings
Proceeds from borrowings of Nil in 2025. (2024: USD 891.3 million). Reference is made to note 18 of the consolidated financial statements.
Redemptions of third party borrowings
Redemption of borrowings of USD 664.5 million in 2025 (2024: USD 2,263.2 million). Reference is made to note 18 of the consolidated financial statements.
The maturity dates of loans and borrowings from third-parties and related parties are as follows:
$ millions | 2025 | 2024 |
|---|---|---|
2025 | - | 5.2 |
2033 | - | 600.0 |
Sub-total | - | 605.2 |
Deducted transaction costs | (2.1) | (9.3) |
Total | (2.1) | 595.9 |
Specification of loans and borrowings from subsidiaries:
$ millions | Type | Interest % | 2025 | 2024 |
|---|---|---|---|---|
Iowa Holding B.V. | Unsecured | SOFR -0.25% | 0.1 | 0.1 |
OCI Nitrogen | Unsecured | EURIBOR -0.25% | 1.1 | 104.2 |
OCI Chemicals B.V. | Unsecured | SOFR -0.25% | 49.8 | 79.9 |
OCI Fertilizer International B.V. | Unsecured | SOFR -0.25% | - | 0.3 |
OCI Holding Ltd | Unsecured | SOFR -0.25% | 14.0 | - |
Nitrogen Holding B.V. | Unsecured | SONIA -0.25% | 79.3 | - |
OCI Clean Ammonia CM LLC | Unsecured | SOFR -0.25% | 0.1 | - |
OCI Intermediate B.V. | Unsecured | SOFR -0.25% | 0.4 | - |
OCI Iowa Inc | Unsecured | SOFR -0.25% | - | 6.0 |
OCI Fertilizers B.V. | Unsecured | SOFR -0.25% | 11.8 | 1.7 |
OCI Personnel B.V. | Unsecured | EURIBOR / SOFR -0.25% | 5.5 | 13.6 |
Total | 162.1 | 205.8 |
48 Trade and other payables
$ millions | 2025 | 2024 |
|---|---|---|
Payables due to subsidiaries | 39.5 | 38.6 |
Accrued interest | - | 11.6 |
Commodity derivative financial instruments | 7.8 | 20.8 |
Other current liabilities | 34.5 | 52.0 |
Total | 81.8 | 123.0 |
Non-current | - | 1.0 |
Current | 81.8 | 122.0 |
Total | 81.8 | 123.0 |
The carrying amount of ‘Other payables’ approximates its fair value.
49 Revenue from dividend income
Revenue from dividend income in 2025 of USD 13.9 million is dividend in kind from OCI UK Ltd.
50 General and administrative expenses
50.1 Expenses by nature
$ millions | 2025 | 2024 |
|---|---|---|
Employee benefit expenses | 16.3 | 34.9 |
Depreciation | 1.7 | 10.3 |
Consultancy expenses | 4.6 | 8.7 |
Transaction related consultancy expenses | 33.4 | 45.9 |
Other | 15.7 | 20.2 |
Total | 71.7 | 120.0 |
The expenses by nature comprise ‘general and administrative expenses’. Transaction related consultancy expenses are treated as an adjusted EBITDA item.
50.2 Employee benefit expenses
$ millions | 2025 | 2024 |
|---|---|---|
Wages and salaries | 8.9 | 12.2 |
Social securities | 0.4 | 0.8 |
Employee profit sharing | 4.1 | 9.7 |
Pension cost | 0.9 | 1.6 |
Share-based compensation expense | 2.0 | 10.6 |
Total | 16.3 | 34.9 |
51 Other income
$ millions | 2025 | 2024 |
|---|---|---|
Other | - | 0.6 |
Total | - | 0.6 |
52 Other expenses
$ millions | 2025 | 2024 |
|---|---|---|
Other | 31.9 | 115.2 |
Total | 31.9 | 115.2 |
In 2025, other expenses relate to recharges from subsidiaries, mainly OCI Personnel B.V. (UK branch) and OCI Holding Limited. In 2024, other expenses mainly relate to recharges from OCI UK Ltd amounting to USD 59.8 million. Additionally, costs are included related to the sale of investments which amounts to USD 45.1 million and gas derivative losses of USD 10.3 million.
53 Net finance income / (cost)
$ millions | 2025 | 2024 |
|---|---|---|
Interest income on loans and receivables third-party | 49.7 | 53.9 |
Interest income on loans and receivables subsidiaries | 6.8 | 46.6 |
Finance income | 56.5 | 100.5 |
Interest expense and other financing costs on financial liabilities measured at amortized cost third-party | (121.7) | (111.8) |
Interest expense and other financing costs on financial liabilities measured at amortized cost subsidiaries | (4.6) | (16.2) |
Finance cost | (126.3) | (128.0) |
Net foreign exchange (loss) / gain | (177.9) | 149.3 |
Net finance (cost) / income recognized in profit or loss | (247.7) | 121.8 |
Foreign exchange gain / loss include a net loss of USD 1.9 million (2024: USD 3.0 million) on foreign exchange derivatives which were settled during the year.
In 2025, the net foreign exchange loss of USD 177.9 million is driven by the impact of depreciation of the US Dollar against the Euro on USD-denominated cash and bonds held by the Company.
54 Income taxes
54.1 Income tax in the statement of profit or loss
$ millions | 2025 | 2024 |
|---|---|---|
Current tax | (2.8) | 1.4 |
Deferred tax | (5.5) | (1.4) |
Total income tax (expense) reported in profit or loss | (8.3) | - |
Current tax
$ millions | 2025 | 2024 |
|---|---|---|
Current year | (4.7) | (2.2) |
Changes in estimates relating to prior years | 1.9 | 3.6 |
Total income tax (expense) / benefit reported in profit or loss | (2.8) | 1.4 |
Deferred tax
$ millions | 2025 | 2024 |
|---|---|---|
Origination and reversal of temporary differences | (0.5) | 0.5 |
Changes in tax rates | - | (0.1) |
Current year loss carried forward | - | (1.8) |
Changes in estimates relating to prior years | (5.0) | - |
Total income tax (expense) reported in profit or loss | (5.5) | (1.4) |
54.2 Reconciliation of effective tax rate
Reconciliation of the statutory income tax rate in the Netherlands with the effective tax rate can be summarized as follows:
$ millions | 2025 | % | 2024 | % |
|---|---|---|---|---|
Profit before income tax | (1,155.8) | 788.5 | ||
Enacted income tax rate in the Netherlands | 25.8% | 25.8% | ||
Income tax expense calculated at the enacted Dutch tax rate | 298.2 | (25.8) | (203.4) | (25.8) |
Expenses non-deductible | (226.4) | 19.6 | (22.4) | (2.8) |
Income not subject to tax | - | - | 222.0 | 28.2 |
Unrecognized tax assets | (76.4) | 6.6 | - | - |
Recognition of previously unrecognized tax assets | - | - | 0.2 | - |
Changes in estimates relating to prior years | (3.7) | 0.2 | 3.6 | 0.4 |
Total income tax reported in profit or loss | (8.3) | 0.6 | - | - |
54.3 Deferred income tax assets and liabilities
Changes in deferred tax assets and liabilities:
$ millions | 2025 | 2024 |
|---|---|---|
At 1 January | 28.1 | 30.6 |
Profit or loss | (5.5) | (1.4) |
Effect of movement in exchange rates | 3.7 | (1.1) |
Current year tax losses from fiscal unity entities | - | - |
At 31 December | 26.3 | 28.1 |
Recognized deferred tax assets and liabilities:
Assets | Liabilities | Net | ||||
|---|---|---|---|---|---|---|
$ millions | 2025 | 2024 | 2025 | 2024 | 2025 | 2024 |
Trade and other receivables | - | - | - | - | - | - |
Operating losses carry forward and tax credits | 26.3 | 28.1 | - | - | 26.3 | 28.1 |
At 31 December | 26.3 | 28.1 | - | - | 26.3 | 28.1 |
Netting of fiscal positions | - | (0.1) | - | 0.1 | - | - |
Amounts recognized in the Statement of Financial Position | 26.3 | 28.0 | - | 0.1 | 26.3 | 28.1 |
Of the deferred tax liabilities at 31 December 2025, no amount is to be settled within 12 months.
Unrecognized deferred tax assets
The Company has unrecognized carryforward tax losses related to interest deduction limitations, which can be summarized as follows:
2025 | Less than 1 year | Between 1 and 5 years | Between 5 and 10 years | Between 10 and 15 years | Between 15 and 20 years | Unlimited | Total |
|---|---|---|---|---|---|---|---|
Carry forward lossses | - | - | - | - | - | 214.0 | 214.0 |
Interest carry forwards | - | - | - | - | - | 346.0 | 346.0 |
Unrecognized deferred tax assets | - | - | - | - | - | 560.0 | 560.0 |
2024 | Less than 1 year | Between 1 and 5 years | Between 5 and 10 years | Between 10 and 15 years | Between 15 and 20 years | Unlimited | Total |
|---|---|---|---|---|---|---|---|
Interest carry forwards | - | - | - | - | - | 209.0 | 209.0 |
Unrecognized deferred tax assets | - | - | - | - | - | 209.0 | 209.0 |
55 Related party transactions
For an overview of the related parties, reference is made to note 31 of the consolidated financial statements. The Company has the following current account related party balances as at 31 December 2025:
Related party | Relation | Revenue during the year | AR at year end | Purchases during the year | AP at year end |
|---|---|---|---|---|---|
Orascom Construction Ltd | OC Group company | - | 2.5 | - | - |
Nassef Sawiris | Executive chair | - | - | 0.9 | 0.4 |
Total | - | 2.5 | 0.9 | 0.4 |
The Company has the following current account related party balances as at 31 December 2024:
Related party | Relation | Revenue during the year | AR at year end | Purchases during the year | AP at year end |
|---|---|---|---|---|---|
Residencia Europe Ltd | Related via shareholder | - | - | - | - |
Nassef Sawiris | Executive chair | - | - | 0.4 | - |
Total | - | - | 0.4 | - |
The current accounts consist of management fees, transferred cost and other. Nassef Sawiris has also received his share in distributions by the Company in respect of his shareholding.
All outstanding related party balances are unsecured.
56 Employees
The total number of employees in 2025 was 16 (2024: 41 employees). All employees are employed in the Netherlands.
57 Contingencies
Guarantees
OCI N.V. has provided financial guarantees to certain subsidiaries. This includes a guarantee related to the inventory financing arrangement of OCIN and other parental guarantees in the normal course of business for its subsidiaries.
The Company has a committed guarantee facility with Rabobank for a maximum guarantee amount of EUR 75.0 million (USD 88.0 million). The facility is used to issue guarantees on behalf of the subsidiaries, mainly for operational purposes. Under this guarantee facility, EUR 1.2 million (USD 1.4 million) has been utilized.
The Company has an uncommitted guarantee facility for the issuance of payment undertakings with BNP Paribas for an amount of USD 25.0 million. The facility is used to issue guarantees on behalf of the subsidiaries, mainly for operational purposes. As at 31 December 2025, less than USD 1 million of this guarantee facility has been utilized.
58 Fiscal unity
OCI N.V. forms a fiscal unity with several Dutch entities for corporation tax purposes. In accordance with the standard conditions, a company and its subsidiaries that form the fiscal unity are jointly and severally liable for taxation payable by the fiscal unity. The following entities are included in the fiscal unity headed by OCI N.V.:
OCI N.V.
OCI Intermediate B.V.
Nitrogen Holding B.V.
OCI Nitrogen B.V.
OCI Personnel B.V.
OCI Fertilizers B.V.
OCI China Holding B.V.
59 Subsequent events
Please refer to note 33 Subsequent events.
The OCI N.V. Board of Directors
Amsterdam, the Netherlands, 10 April 2026
The OCI N.V. Board of Directors
David Welch
Dod Fraser
Gregory Heckman
Michael Bennett
Nadia Sawiris
Nassef Sawiris
Robert Jan van de Kraats
Reference is made to section Directors’ statement pursuant to article 5:25c of the Dutch Financial Supervision Act for the Board's approval of the financial statements.
Sustainability statement
1 General information
1.1 Basis for preparation
1.1.1 General basis for preparation of sustainability statement
1.1.1.1 Reporting criteria
For the sustainability information included in this sustainability statement, OCI has reported in accordance with the European Sustainability Reporting Standards (‘ESRS’), the applied supplemental reporting criteria as disclosed in Appendices, and the reporting requirements provided for in Article 8 of Regulation (EU) 2020/852.
With the CSRD (which requires the application of the ESRS) anticipated to be transposed into national law by 2026, we have opted to comply voluntarily for this year under review. Going forward, we are not committed to continuing voluntary reporting. We refer to the analyst's corners in this Annual Report.
1.1.1.2 Boundaries and scope
The scope of the sustainability information in this sustainability statement covers the OCI Group, including its subsidiaries and interests in associates and joint ventures, unless stated otherwise. We apply the financial control consolidation approach. The scope of consolidation is the same as for the financial statements. Unless stated otherwise, references to OCI should be read as referring to the OCI Group. The data in this report refers to OCI's performance and not to that of our contractors, unless stated otherwise. We do not make use of the options to omit specific pieces of information corresponding to intellectual property, know-how or results of innovation, and disclosure of impending developments or matters in course of negotiation.
Below is an overview of our value chain. This covers the extent of our own operations, upstream and downstream value chain that is covered in this sustainability statement. We assessed our key products, markets and customer groups in terms of sustainability impacts, e.g. by stress testing, which aligns with our risk management processes, also refer to Risk Management.
1.1.1.3 Effect of discontinued operations
As part of the ongoing strategic review, OCI completed the divestments of OCI Nitrogen Iowa to Koch Industries, Fertiglobe to ADNOC, and Beaumont New Ammonia to Woodside Energy in 2024. The Methanol business was divested to Methanex in June 2025. Further, on 23 November 2025, OCI entered into an agreement for the sale of its equity interests in OAH ('Ammonia distribution business'), which owns both OCI’s ammonia import and storage terminal in Rotterdam (OTE) and OCI’s ammonia distribution platform (OAD). The transaction closed on 31 March 2026. OAH was classified as held for sale following the announced divestment but does not meet the IFRS criteria to be classified as a discontinued operation and, as such its results continue to be presented within the European Nitrogen segment in the financial statements. In the sustainability statement and section Our products of the management report, the entities included in the OAH sale agreement are classified as discontinued operations. Reference is made to the CEO Letter and to section Discontinued operations and assets & liabilities held for sale and Segment reporting in the financial statements.
Discontinued operations are incorporated in this report until the completion of the sales transaction, or for ESRS E1 and other relevant disclosures when OCI loses operational control, which in above cases is equal to the date of sale. Our operations have a monthly sustainability closing process. When a sales transaction is completed during the month, an extrapolation is made based on yearly averages to estimate the remaining days. This applies to the OCI Methanol data in 2025, and Fertiglobe and OCI Nitrogen Iowa data in 2024.
Methanol Europe - presented as discontinued operations
This segment consists of BioMCN, and the trading entities OCI Fuels Ltd, OCI Fuels B.V. and OCI Methanol Marketing B.V.
Methanol US - presented as discontinued operations
This segment consists of OCI Beaumont, Natgasoline, and the trading entity OCI Methanol Marketing LLC.
Beaumont New Ammonia - presented as discontinued operations
The Beaumont New Ammonia segment consists of OCI Clean Ammonia M&O LLC and OCI Clean Ammonia CM LLC.
Nitrogen Europe (OTE and OAD) - presented as discontinued operations
This segment consists of OCI Terminal Europoort B.V. (OTE) and OCI Ammonia Distribution B.V. (OAD).
Nitrogen US - presented as discontinued operations (divested in 2024)
This segment consists of Iowa Fertilizer Company LLC, and N-7, the trading entity.
Fertiglobe - presented as discontinued operations (divested in 2024)
The Fertiglobe segment consists of the following entities: Egyptian Fertilizers Company (EFC), Egypt Basic Industries Corporation (EBIC), Sorfert Algerie (Sorfert), Ruwais Fertilizer Industries LLC (Fertil), Fertiglobe Distribution (FD), Fertiglobe Fertilizer Trading (FFT, previously OCI Fertilizer Trading), OCI Fertilizer Trade and Supply (OFTS), Fertiglobe plc and OCI S.A.E.
Nitrogen Europe (OCI Nitrogen B.V.) - presented as continuing operations
This segment consists of OCI Nitrogen B.V.
Other - presented as continuing operations
This segment consists of all remaining entities of the Group, which are mainly holding companies.
Due to divestments and OCI’s strategic reorientation, our sustainability approach is evolving. Throughout ownership, OCI remained committed to sustainability, enhancing data collection and reporting to support divested assets. The transition to new ownership enables continued progress, while OCI remains focused on effectively managing continuing operations. Given these changes, this report reflects OCI’s transition:
Sustainability and financial performance in 2025 is the primary focus, with limited forward-looking disclosures.
The double materiality assessment has been reassessed and updated to reflect the entities sold during 2025 and assets held for sale.
Policies, actions and targets are presented where relevant to continuing operations, but some future-oriented information is no longer applicable.
All sustainability data is presented for total, continuing and discontinued operations.
We classify OCIN and segment 'Other' as continuing operations, while Beaumont New Ammonia, OCI Methanol, OTE, and OAD are considered discontinued operations. Additionally, OCI Nitrogen Iowa and Fertiglobe are treated as discontinued operations in 2024 comparative information included in this Annual Report.
A revised sustainability strategy will depend on future developments.
We report on the performance of continuing operations for the full-year 2025; we include 2026 and long-term targets where applicable.
Certain indicators, such as the number of employees, are reported as of year-end 2025.
1.1.1.4 External assurance
PricewaterhouseCoopers Accountants N.V. is engaged as an independent assurance provider to perform an assurance engagement with the aim of obtaining limited assurance on the sustainability statement for the year ending 31 December 2025 of OCI N.V. Reference is made to the Limited assurance report of the independent auditor on the sustainability statement.
Other than the assurance provider, none of the performance metrics have been validated by any external body.
1.1.2 Disclosures in relation to specific circumstances
1.1.2.1 Time horizons
We do not deviate from the medium- or long-term time horizons defined by ESRS 1 section 6.4 Definition of short-, medium- and long-term for reporting purposes.
1.1.2.2 Value chain estimation
The following metric includes value chain data estimated using indirect sources:
1.1.2.3 Sources of estimation and outcome uncertainty
The following metric is subject to a significant level of measurement uncertainty:
1.1.2.4 Changes in preparation or presentation of sustainability information
Any changes or updates in the reported sustainability performance data due to the application of different reporting methodologies, a revised scope or developments in the organization, result in a full review and adjustment, when material, of prior year data to ensure comparability of information over time. If adjustments to the previous year's data cannot be made due to insufficient retrospective data, this is clarified in this Annual Report. During 2025, the preparation and presentation of the sustainability information changed compared with the previous reporting period due to divestment-related scope changes, which led to reclassifications between continuing and discontinued operations. If no restatement is indicated in the figures, there was no impact from reclassifications between continuing and discontinued operations.
Reference is made to 5.1 General basis for preparation for an explanation of the restatements during 2025.
1.1.2.5 Reporting errors in prior periods
We have not identified material prior period errors.
1.1.2.6 Disclosures stemming from other legislation or generally accepted sustainability reporting pronouncements
We do not include information stemming from other legislation which requires us to disclose sustainability information or from generally accepted sustainability reporting standards and frameworks in the sustainability statement, in addition to the information prescribed by ESRS.
1.1.2.7 Disclosures incorporated by reference
The following information is incorporated by reference to other parts of the management report:
Our products: Description of significant groups of products and (or) services offered (ESRS 2 SBM-1.40ai), description of significant markets and (or) customer groups served (ESRS 2 SBM-1.40aii), total revenue (ESRS 2 SBM-1.40b), undertaking is active in chemicals production (ESRS 2 SBM-1.40dii), revenue from chemicals production (ESRS 2 SBM-1.40dii), disclosure of elements of strategy that relate to or impact sustainability matters (ESRS 2 SBM-1.40g).
Our approach to Risk Management: Description of how sustainability-related risks relative to other types of risks have been prioritised (ESRS 2 IRO-1.53ciii), description of decision-making process and related internal control procedures (ESRS 2 IRO-1.53d), description of scope, main features and components of risk management and internal control processes and systems in relation to sustainability reporting (ESRS 2 GOV-5.36a), description of risk assessment approach followed (ESRS 2 GOV-5.36b), description of how findings of risk assessment and internal controls as regards sustainability reporting process have been integrated into relevant internal functions and processes (ESRS 2 GOV-5.36d), description of periodic reporting of findings of risk assessment and internal controls to administrative, management and supervisory bodies (ESRS 2 GOV-5.36e).
Strategic risks (second risk) & Operational risks (fifth risk): Description of main risks identified and their mitigation strategies (ESRS 2 GOV-5.36c).
Board profile: Information about identity of administrative, management and supervisory bodies or individual(s) within body responsible for oversight of impacts, risks and opportunities (ESRS 2 GOV-1.22a).
Board summary of skills and experience: Disclosure of expertise of administrative, management and supervisory bodies on business conduct matters (ESRS G1-GOV-1.5b).
2025 Board and Committee meetings: Disclosure of how bodies' (or individuals within a body) responsibilities for impacts, risks and opportunities are reflected in undertaking's terms of reference, board mandates and other related policies (ESRS 2 GOV-1.22b), disclosure of whether, by whom and how frequently administrative, management and supervisory bodies are informed about material impacts, risks and opportunities, implementation of due diligence, and results and effectiveness of policies, actions, metrics and targets adopted to address them (ESRS 2 GOV-2.26a).
Executive Directors' long-term variable compensation with the performance period ending in 2025: Incentive schemes and remuneration policies linked to sustainability matters for members of administrative, management and supervisory bodies exist (ESRS 2 GOV-3.29), disclosure of whether and how climate-related considerations are factored into remuneration of members of administrative, management and supervisory bodies (ESRS E1-GOV-3.13).
1.1.2.8 Transitional provisions
We have not included any entity-specific metrics and we have not made use of any transitional provisions related to value chain information or comparative information.
Phased-in disclosure requirements
The table shows the phase-in provisions for the Disclosure Requirements or data points of Disclosure Requirements in the ESRS that we omitted in the preparation of the sustainability statement under the ESRS.
ESRS | Disclosure Requirement | Full name of the Disclosure Requirement | Transitional provisions (Commission Delegated Regulation (EU) 2025/1416) |
|---|---|---|---|
ESRS 2 | SBM-3 | Material impacts, risks and opportunities and their interaction with strategy and business model | We omit the information prescribed by ESRS 2 SBM-3 paragraph 48(e) (anticipated financial effects) for the preparation of the 2025 sustainability statement. |
ESRS E1 | E1-9 | Anticipated financial effects from material physical and transition risks and potential climate-related opportunities | We omit the information prescribed by ESRS E1-9 for the preparation of the 2025 sustainability statement. |
ESRS E2 | E2-6 | Anticipated financial effects from pollution-related impacts, risks and opportunities | We omit the information prescribed by ESRS E2-6 for the preparation of the 2025 sustainability statement. |
ESRS E3 | E3-5 | Anticipated financial effects from water and marine resources-related impacts, risks and opportunities | We omit the information prescribed by ESRS E3-5 for the preparation of the 2025 sustainability statement. |
ESRS E4 | All | Biodiversity and ecosystems | We omit the information prescribed by ESRS E4 for the preparation of the 2025 sustainability statement. Please refer to E4 Biodiversity and ecosystems in "Safeguard" summaries. |
ESRS E5 | E5-6 | Anticipated financial effects from resource use and circular economy-related impacts, risks and opportunities | We omit the information prescribed by ESRS E5-6 for the preparation of the 2025 sustainability statement. |
ESRS S1 | S1-7 | Characteristics of non-employee workers in the undertaking’s own workforce | We omit reporting for all data points in this Disclosure Requirement for the preparation of the 2025 sustainability statement. Please refer to S1 Own workforce in "Safeguard" summaries. |
ESRS S1 | S1-8 | Collective bargaining coverage and social dialogue | We omit this Disclosure Requirement with regard to our own employees in non-EEA countries for the preparation of the 2025 sustainability statement. Please refer to S1 Own workforce in "Safeguard" summaries. |
ESRS S1 | S1-11 | Social protection | We omit the information prescribed by ESRS S1-11 for the preparation of the 2025 sustainability statement. Please refer to S1 Own workforce in "Safeguard" summaries. |
ESRS S1 | S1-12 | Percentage of employees with disabilities | We omit the information prescribed by ESRS S1-12 for the preparation of the 2025 sustainability statement. Please refer to S1 Own workforce in "Safeguard" summaries. |
ESRS S1 | S1-13 | Training and skills development | We omit the information prescribed by ESRS S1-13 for the preparation of the 2025 sustainability statement. Please refer to S1 Own workforce in "Safeguard" summaries. |
ESRS S1 | S1-14 | Health and safety | We omit the data points on cases of work-related ill-health and on number of days lost to injuries, accidents, fatalities and work-related ill health for the preparation of the 2025 sustainability statement. Please refer to S1 Own workforce in "Safeguard" summaries. |
ESRS S1 | S1-15 | Work-life balance | We omit the information prescribed by ESRS S1-15 for the preparation of the 2025 sustainability statement. Please refer to S1 Own workforce in "Safeguard" summaries. |
ESRS S2 | All | Workers in the value chain | We omit the information prescribed by ESRS S2 for the preparation of the 2025 sustainability statement. Please refer to S2 Workers in the value chain in "Safeguard" summaries. |
ESRS S3 | All | Affected communities | We omit the information prescribed by ESRS S3 for the preparation of the 2025 sustainability statement. Please refer to S3 Affected communities in "Safeguard" summaries. |
ESRS S4 | All | Consumers and end-users | We omit the information prescribed by ESRS S4 for the preparation of the 2025 sustainability statement. Please refer to S4 Consumers and end-users in "Safeguard" summaries. |
1.2 Governance
1.2.1 The role of the administrative, management and supervisory bodies
For the composition and experience of our Board and the role of the administrative, management, and supervisory bodies, reference is made to Governance framework and The Board of Directors and Executive Committee in the management report, and Sustainability governance framework in the sustainability statement.
1.2.2 Information provided to, and sustainability matters addressed by, the undertaking’s administrative, management and supervisory bodies
For the information provided to and sustainability matters addressed by our Board, reference is made to 2025 Board and Committee meetings in the management report, and Sustainability governance framework in the sustainability statement.
1.2.3 Integration of sustainability-related performance in incentive schemes
For our remuneration policies and incentive schemes for the Board, reference is made to 2025 Remuneration Report.
1.2.4 Statement on due diligence
At OCI, we seek to do business with customers, suppliers and third parties which uphold the same values as OCI. A key aspect of our third-party management is our Integrity Due Diligence Program. This program includes our Business Partner Code of Conduct, which outlines our expectations on compliance topics aligned with our internal Code of Conduct and provides our business partners with direct channels, including a whistleblowing hotline, to report any compliance concerns.
Through our Integrity Due Diligence Program, we screen our prospective third parties for issues related to bribery, corruption, sanctions violations, human rights, and other compliance concerns. Where necessary, we conduct additional in-depth due diligence to address risks, and if appropriate, decline or disengage from certain third parties. When a third party is included in our Integrity Due Diligence tool, it is subject to ongoing monitoring to alert us to potential new compliance issues.
Our sustainability due diligence process is a continuous process to identify, prevent, mitigate, and remediate the actual and potential material impacts, and the material risks and opportunities of our activities. For more information on the due diligence processes that we carried out in relation to sustainability topics, we refer to the Materiality assessment, Stakeholder engagement and Our approach to responsible business practices.
1.2.5 Risk management and internal controls over sustainability reporting
For our risk management and internal controls over sustainability reporting, reference is made to Enterprise risk management and internal controls.
1.3 Materiality assessment
Engagement with affected stakeholders is central to our materiality assessment process, ensuring their interests and views are understood and incorporated. Please refer to the section Stakeholder engagement for details of our stakeholder engagement approach. In 2025, we updated our double materiality assessment from the previous years, following the divestments of Fertiglobe, OCI Nitrogen Iowa, the methanol business, and OAH, which owns both OCI’s ammonia import and storage terminal in Rotterdam (OTE) and OCI’s ammonia distribution platform, serving third party off-site European customers (OAD). We directed our focus towards the continuing business operations in The Netherlands. This targeted approach enabled us to tailor our materiality assessment to the specific context of our remaining operations, ensuring relevance and effectiveness in driving sustainable value creation. The double materiality assessment was performed in accordance with the requirements outlined in the Corporate Sustainability Reporting Directive (CSRD), resulting in the evaluation of sustainability topics from both an impact and financial materiality perspective.
Impact materiality: our material actual or potential, positive or negative impacts on people or the environment over short-, medium- and long-term time horizons.
Financial materiality: risks and opportunities that trigger, or may trigger, material financial effects on our company.
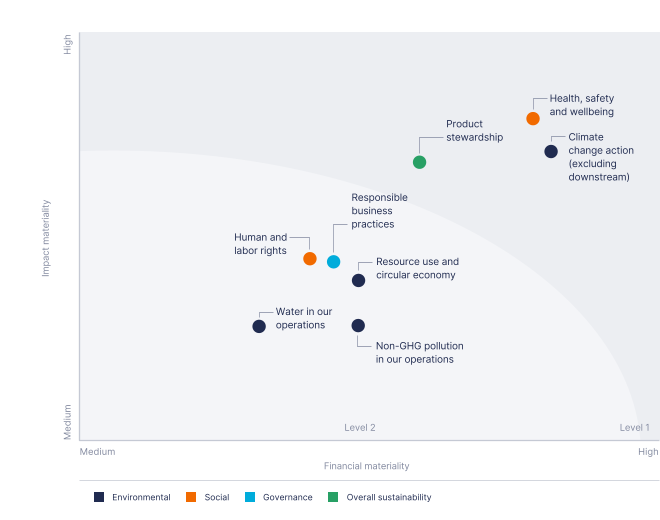
The results of the double materiality assessment are the basis for our strategy and sustainability reporting. While all topics in the materiality matrix are deemed material, we allocated the topics as level 1 and level 2:
Level 1: Level 1 topics are strategically important. These topics are reported through strategic KPIs, to the extent possible.
Level 2: Level 2 topics are materially important.
Our double materiality assessment process consisted of the steps as described on the next pages.
1. Determine sustainability landscape
Our methodology involved compiling a comprehensive long list of potentially material sustainability topics across our value chain. This draws on insights from peer benchmarks, our operating environment, our risk register and Enterprise Risk Management (ERM) principles, the regulatory landscape – including those outlined in the CSRD (such as, but not limited to, the sustainability matters in ESRS 1 AR16), desktop research as well as other sustainability reporting frameworks.
2. Perform assessment and grouping
A sustainability matter is material when it meets the criteria defined for impact materiality or financial materiality, or both. Please refer to the more detailed explanations on our scoring methodology for impact and financial materiality on the right and next page.
We screened our assets aiming to cover our entire value chain. We considered the nature of our activities, business relationships, and operational geographies for the topics of climate change, pollution, water and marine resources, biodiversity and ecosystems, resource use and circularity, own workforce, workers in the value chain, affected communities, consumers and end-users, and business conduct.
We recognize the connectivity and trade-offs involved in managing material, impacts, risks and opportunities - for instance, efforts to decarbonize operations may require significant capital investments, potentially diverting resources away from other material topics.
Each identified sustainability topic was included in our long list and evaluated in terms of its positive or negative impact, its actual or potential impact, whether it posed a risk or presented an opportunity, and its placement within our value chain – direct operations, upstream, or downstream.
Subsequently, we evaluated each sustainability topic against predefined thresholds within our ERM methodology for determining financial materiality, and used our own methodology for determining impact materiality. For both assessments, we used a five-point scale to ensure uniformity and alignment with the ERM framework. This exercise resulted in the formation of a concise shortlist. All topics which were deemed immaterial in our assessment, are not included in this Annual Report.
In summary, for the topics no longer covered, the following is applicable compared to the 2024 sustainability statement:
The scale and scope of the Human Capital (diversity and inclusion in our own workforce, employee engagement, talent & development of our own workforce, local community engagement, and secure employment) and payment practices topics is significantly lower due to the divestments of Fertiglobe, OCI Nitrogen Iowa and OCI Methanol. The gravity of the human capital topics was mainly in the MENA region and the US. Considering those sites are divested, we now consider the gravity to be minimal.
Local biodiversity and ecosystem services: none of our production facilities are located near protected areas or areas of high biodiversity.
Water pollution: is only reported for sites with own water discharge. As OCIN has third party water discharge and no own water discharge, water pollution is no longer considered a material topic.
Water scarcity risk, drought: based on assessment performed in 2024, only Fertiglobe sites are in water stressed regions. Due to the divestment of Fertiglobe, this topic is no longer material.
Substances of concern: we performed an analysis of substances of concern in 2025 and concluded only the substance of very high concern melamine is material (produced, sold and waste).
Impact materiality
A sustainability matter is material from an impact perspective when it pertains to our material impacts (actual or potential, positive or negative) on people or the environment over short-, medium- and long-term time horizons. Impacts include those caused (or contributed to) by us and those which are directly linked to our own operations and products through our business relationships. Business relationships include our upstream and downstream value chain and are not limited to direct contractual relationships. Impacts on people or the environment include impacts in relation to environmental, social and governance matters.
For actual negative impacts, materiality is based on the severity of the impact, while for potential negative impacts it is based on the severity and likelihood of the impact. Severity is based on:
the scale;
scope; and
irremediable character of the impact.
For potential negative human rights impacts, the severity of the impact takes precedence over its likelihood. Prioritizing the severity score over the likelihood score did not result in any changes to the materiality of the results.
For positive impacts, materiality is based on:
the scale and scope of the impact for actual impacts; and
the scale, scope and likelihood of the potential impact.
Scoring on impact materiality ranged from 1 (minimal) to 5 (critical). The final impact materiality score was calculated by taking an average of the actual and potential impact materiality scores. An impact materiality score above 2 is deemed as material. Only the lowest score (score of 1) is considered immaterial, as it concerns minimal impacts with a limited scope for actual impacts and with a remote likelihood to occur in the next 10 years for potential impacts.
Financial materiality
A sustainability matter is material from a financial perspective if it triggers, or may trigger, material financial effects on us. This is the case when it generates, or may generate, risks or opportunities that have a material influence (or are likely to have a material influence) on our cash flows, development, performance, position, cost of capital or access to finance in the short-, medium- and long-term time horizons. The financial materiality of a sustainability matter is not constrained to matters that are within our control but includes information on material risks and opportunities attributable to business relationships with other stakeholders beyond the scope of consolidation used in the preparation of financial statements. Dependencies from natural and social resources are sources of financial risks or opportunities.
Topics were assessed on three parameters:
Continuation of use of resource
Reliance on the relationship
Opportunities
The materiality of risks and opportunities is assessed based on a combination of the likelihood of occurrence and the magnitude of the potential financial effects.
Scoring on financial materiality ranged from 0 (minimal) to 4 (critical). During the assessment of each sustainability topic from a financial perspective, we applied predetermined thresholds established within our ERM methodology. A financial materiality score above 1 is deemed as material. Only the lowest score (a score of 0) is considered immaterial, as for current risks and opportunities, it concerns minimal financial impacts, and for anticipated risks and opportunities, it concerns minimal financial impacts with a remote likelihood to occur in the next 10 years. The financial materiality scoring took place in close collaboration with the Internal Audit & Risk team.
3. Validate and approve results
Our internal departments participated in workshops and interviews to validate the outcome of the double materiality assessment. External affected stakeholder groups were represented through regular engagements conducted by internal departments (also refer to Stakeholder engagement). We believe this approach adequately captures their interests and views, ensuring they are reflected in the assessment outcomes. Following the interviews, all internal participants received an email summarizing the key insights from the meeting, highlighting the points contributing to differences in the assessment outcomes.
The results, including the final impacts, risks and opportunities, and their respective scoring, were reviewed by the Audit Committee and approved by the OCI Nitrogen Europe Sustainability Steering Committee.
4. Determine strategic implications
Based on our double materiality assessment and the identified impacts, risks and opportunities, we selected the material disclosure requirements and material information to include in this Annual Report. For each material topic, comprising impacts, risks and opportunities, we report on the measures taken to manage our environmental, social and governance impact, including our actions plans, policies, indicators and targets, where applicable. We believe that our strategy and business model are resilient, enabling us to effectively manage the identified risks and impacts while seizing emerging opportunities. The outcomes of the materiality assessment are also included in our risk management processes, also refer to section Enterprise risk management and internal controls.
As part of the ongoing strategic review, OCI completed the divestments of OCI Nitrogen Iowa to Koch Industries, Fertiglobe to ADNOC, and Beaumont New Ammonia to Woodside in 2024. The Methanol business was divested to Methanex in June 2025. Further, on 23 November 2025, OCI entered into an agreement for the sale of its equity interests in the OAH ('Ammonia distribution business'), which owns both OCI’s ammonia import and storage terminal in Rotterdam (OTE) and OCI’s ammonia distribution platform (OAD). The sale was succesfully completed in March 2026. In 2025, we updated our double materiality assessment from the previous years, following these (announced) divestments. Our objective remains to effect a strategic transaction for the remaining OCI Nitrogen business. If these activities result in material changes to our strategic objectives, business model and/or operations, we will assess the impact on the double materiality assessment.
Subsequent to the reporting period, geopolitical developments in the Middle East have led to an immediate and significant increase in European natural gas prices, resulting in materially higher production costs for nitrogen producers, and heightened market volatility. We further note that the Enterprise Chamber introduced certain governance measures in January 2026, further extending the timeline for the evaluation of the potential sale of the remaining business to Orascom Construction or a similar transaction with Orascom Contruction. We assessed these developments for their impact on the double materiality assessment and the sustainability report and concluded there is no material impact. Should these events lead to material changes in our strategic objectives, business model, or operations, we will reassess the implications for the double materiality assessment.
Our material matters explained
Upstream | Direct | Downstream | Material topic | Related ESRS | Time horizons | Impact, Risk, Opportunity | Definition | Specific issues covered |
|---|---|---|---|---|---|---|---|---|
● | ● | E1 Climate Change | Short, medium, and long term |  | Impact on the environment through our production activities. We consider own operations (Scope 1), purchased energy (Scope 2) and upstream GHG emissions (Scope 3) emissions in this definition for climate change action and exclude downstream impacts. Fuels, electricity and steam used in own operations result in GHG emissions from our plants and upstream supply chain (e.g., natural gas extraction and transport), leading to long-term negative impacts on the Earth’s climate and biodiversity. While it is essential to reduce GHG emissions (Scope 1, 2 and upstream Scope 3) and energy use and mitigate our negative impact on the natural environment, climate change also presents significant transition risks, such as adaptation requirements to reduce transition and physical climate risks. These risks include rising sea levels, global temperatures, droughts, water stress, floods, and extreme weather events. However, climate change also provides opportunities for OCI. Considering our operations and the resources we consume, OCI can have a positive impact on the energy transition through the renewable ammonia and hydrogen market which will contribute to mitigating climate change. |
| ||
● | ● | S1 Own Workforce S2 Workers in the value chain S3 Affected communities | Short, medium, and long term |  | Impact on our employees (incl. contractors) through working at OCI. Having a positive impact through promoting a healthy and safe working environment that protects the physical and mental wellbeing of our employees (incl. contractors) while at work. This includes ensuring safe operations and keeping employees and contractors safe and access to safe, clean drinking water and sanitation to maintain sufficient standards of hygiene. However, risks exist if health and safety measures are insufficient, potentially leading to workplace injuries or (mental) health issues for employees and contractors. Additionally, the potential negative impact on the health and safety of community members surrounding our sites is an important consideration under this material topic. |
| ||
● | E1 Climate Change E2 Pollution E4 Biodiversity and ecosystems S4 Consumers and end-users | Short, medium, and long term | | Impact on the environment, consumers and end-users through the use of our products. The development and promotion of products with the aim to minimize the negative impacts and dependencies on the environment, including impacts on climate change, water and soil pollution, biodiversity and ecosystems and maximize the positive impacts on society, by taking measures to prevent health & safety issues. Supporting the health of the environment and people with our products throughout the lifecycle and its sustainable use through preventing deforestation and biodiversity decline while maximizing yields to ensure food security. However, there are risks associated with the use of our products, including air, water, and soil pollution, such as eutrophication, which can harm ecosystems and reduce biodiversity. We see opportunities with regards to nutrient recycling (focused on the end product), and support measures to improve nutrient use efficiency during the usage of fertilizers. |
| |||
● | ● | ● | S1 Own workforce S2 Workers in the value chain S4 Consumers and end-users G1 Business conduct | Short, medium, and long term | | Impact on people, including our employees, workers in the value chain, consumers and end-users through the provision of ethical business practices. Having a positive impact by implementing policies and practices to ensure business is based on values and principles that promote ethical behavior and decision-making. These measures protect data, mitigate financial risks, enable speaking up, contribute positively to the economy and meet stakeholder expectations. |
| |
● | ● | E3 Water and marine resources | Short, medium, and long term | | Impact on the environment through our production activities. This includes negative impacts and dependencies of our operations on water availability, quality and distribution. Actions we take to mitigate risks, minimize impacts and adapt to a changing environment: improving our water efficiency over time. |
| ||
● | ● | ● | S1 Own workforce S2 Workers in the value chain | Short, medium, and long term | | Impact on our employees and workers in the value chain. Having a positive impact by upholding and promoting the basic internationally recognized rights and freedoms of employees in our own workforce and all who work across the value chain. |
| |
● | ● | ● | E5 Resource use and circular economy | Short, medium, and long term | | Impact on the environment through our operations, from fossil fuel exploitation to waste management. This includes negative impacts, as we still rely on fossil fuels for most of our production. To improve our environmental impact, we search ways to use renewable and recycled feedstocks in our production at scale. We minimize waste and ensure compliance in our operations and safe disposal of hazardous waste. We support measures to improve nutrient use efficiency during usage of fertilizers, contributing to more sustainable agricultural practices. |
| |
● | E2 Pollution | Short, medium, and long term | | Impact on the environment through our manufacturing activities. This includes negative impacts from pollutants from manufacturing other than GHG emissions, such as NOx, N2O and NH3 emissions, and Substances of Very High Concern. We take measures to upgrade and invest in our production plants to limit these negative impacts on our neighbours and the environment. |
|
1.4 Stakeholder engagement
OCI identifies its stakeholders based on their potential to influence or be affected by its activities, as well as potential relevant knowledge of the industries in which we operate. The group of stakeholders we engage with is not static and can be adjusted depending on the topics of the dialogue and the developments thereof over time.
Our engagement with our stakeholders takes place on a continuous basis to ensure that the expectations, needs and interests of the relevant stakeholders are considered when defining OCI's strategy and operations. This can be through customer and investor meetings and calls, industry and investor conferences, customer service, employee meetings, surveys, portals and hotlines, community outreach programs, and governmental or regulatory interactions. Engagement with specific stakeholders may also take place on an ad hoc basis, due to the (legal and/or regulatory) position of these stakeholders and their specific interests and needs. The Stakeholder Engagement Policy on our website establishes a framework for an effective dialogue with our stakeholders.
The Board bears ultimate responsibility for fostering engagement that informs and guides our strategy and operations. To ensure our Board is fully informed of shareholders' areas of focus, concerns, and response, we provide an investor relations update at each Board meeting. We use advice from our key customers, suppliers and other business relationships, as well as our employees to develop our vision for long-term value creation. Our unified culture, values, and communications platform OneOCI promote transparency, alignment, and feedback. We provide comments and observations on proposed legislation that may impact our long-term strategy to governments in our countries of operation, as well as multinational regulatory bodies such as the European Commission. We keep up to date on latest developments within our industry by participating in various industry groups. We also actively engage in industrywide discussions on long-term strategy.
In 2026, we will re-assess our materiality assessment and stakeholder engagement processes to further align with the ongoing divestments. If there are further material changes to our strategic objectives, business model and/or operations, we will assess the impact on the stakeholder engagement process.
We define "workers in the value chain" as workers employed by a supplier contracted by OCI who work on the supplier’s premises using the supplier's work methods, workers employed by a ‘downstream’ entity (e.g., customers), who purchases goods or services from OCI, and workers employed by an equipment supplier to OCI who perform regular maintenance on the supplier’s equipment at one or more OCI workplaces as stipulated in the contract between the equipment supplier and OCI. For example, we consider people working at our discontinued operation Natgasoline to be workers in the value chain. We have not categorized specific types of value chain workers. Additionally, this definition excludes non-employees like self-employed external temporary workers or individuals employed via a third party as a contractor or through a Statement of Work (SOW).
The following table shows the type of engagement we have with each stakeholder group. We mapped the relevance of each stakeholder group to us based on our influence upon them and vice versa. We monitor and evaluate our engagement with stakeholders, including but not limited to frequency, quality, output and follow-up. We ensure the effectiveness of our engagement with stakeholders by having a publicly available Whistleblower hotline, also refer to Our whistleblowing framework, which outlines our approach to addressing concerns and implementing effective solutions. For specific examples of our engagement, please refer to the relevant sections of this sustainability statement, which are categorized per material topic.
Stakeholders | Our approach | Frequency of engagement | Our engagement in 2025 |
|---|---|---|---|
Employees | We engage employees in corporate matters through several channels. | Regular engagement, both formally and informally, to support employee development, performance, and inclusivity. |
|
Customers | We stay in regular contact with our customers. We maintain a Business Partner Code of Conduct, which outlines our expectations towards our customers with regards to the same compliance topics that are included in our Code of Conduct, which is shared prior to engagement and available on our website. | Regular engagement as part of business transactions, both virtually and face-to-face, to understand customer needs, strategy, and market perspectives. |
|
Investors | We interact with our investors on a regular basis through investor meetings, calls and conferences. | Regular engagement throughout the year, except during closed periods (as per Market Abuse Regulation), including bilateral meetings as needed. |
|
Communities | We maintain mutually beneficial relationships with the communities in which we operate. | Regular engagement throughout the year through tailored social development programs and contributions to local economies. |
|
Suppliers | We stay in regular contact with our suppliers. We maintain a Business Partner Code of Conduct which outlines our expectations towards our suppliers with regards to the same compliance topics that are included in our Code of Conduct. | Regular engagement with a focus on professional collaboration and adherence to procurement guidelines. |
|
Industry associations | We are an active member of several industry associations where we work with our peers to sustainably improve global standards in our industries and engage in dialogue on key global challenges related to our industries. | Regular engagement as an active member of several industry associations to collaborate on improving global standards and addressing key challenges relevant to our industries. |
|
Governments | We maintain relationships with state governments, authorities and agencies in the countries where we operate, to advance our business objectives and our decarbonization strategy. | Regular engagement to advance business objectives, contribute to legislative processes, and meet local regulatory requirements. |
|
New buyers of divested sites | We ensure the smooth transfer of assets and operations to new owners. | Ongoing engagement as needed. |
|
1.5 Sustainability governance framework
Sustainability is embedded across our organization, including in our strategic objectives, risk management, capital allocation and financial planning, operational and commercial activities, and other medium and long-term decision-making. The Board has overall responsibility for OCI’s strategy, business objectives, and risk management, including sustainability.
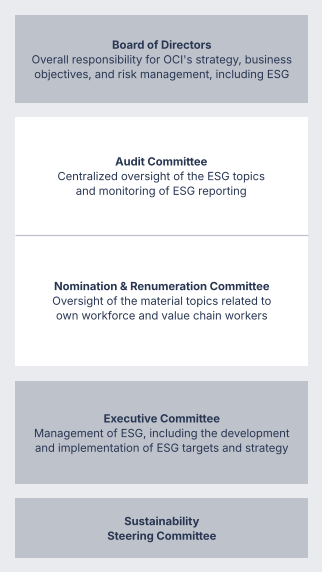
In 2025, the Board decided to further transform the company's governance structure to match the resized organization and prepare for the new strategic direction in 2026 and beyond. The number of Non-Executive Directors on the Board was reduced from nine to six. Also, the number of Committees was reduced from three to two, with the work of the now disbanded HSE&S Committee integrated into the work and remit of the Audit Commitee. Reference is made to The Board of Directors and Executive Committee for more information.
At Board level, the Audit Committee has oversight over all sustainability topics and the N&RC Committee monitors OCI’s material impacts and risks and opportunities of specific topics (see figure on the right), including OCI’s strategy, targets, action plans and performance measurement. This is described in the Terms of Reference of the Audit Committee, and N&RC Committee. The Board Committees monitor the progress made in the material sustainability areas and the current and emerging topics, technologies and trends relating to sustainability. These include new or emerging opportunities and projects that may affect the business, operations, performance or public image of OCI or are otherwise pertinent to OCI and its stakeholders. The Board Committees review and evaluate the sustainability performance indicators, and review OCI's sustainability disclosures, with a longer term view towards achieving announced targets.
The responsibilities and duties of the Audit Committee include monitoring the effectiveness of internal control and risk management systems and internal audit regarding sustainability reporting (including digital reporting). Without breaching its independence, the Audit Committee:
establishes that the information reported complies with the relevant sustainability reporting standards.
submits recommendations or proposals to ensure the integrity of sustainability information.
monitors the assurance of the annual and consolidated sustainability reporting.
During this process, the Audit Committee takes into account any findings and conclusions by the competent authority. When monitoring the disclosure of information, the Audit Committee oversees that users of OCI's sustainability statement are able to understand (i) the governance structure, and its internal control and risk management systems and (ii) strategy and approach, processes and procedures as well as its performance in respect of business conduct.
The Board has tasked the Executive Committee with the management of sustainability objectives, including developing and implementing our sustainability targets and strategy.
The production facility's leadership team is responsible for identifying and evaluating sustainability projects and opportunities, and reporting on their progress to the Executive Committee during the site's monthly business reviews. The Sustainability Steering Committee defines and oversees OCIN’s sustainability strategy, priorities, and targets. It ensures alignment with relevant regulations, frameworks, and reporting standards, and advises on material topics and key sustainability risks and opportunities. The Committee also reviews progress on sustainability KPIs and initiatives, supporting cross‑functional integration of sustainability into daily operations.
2 Environmental information
2.1 Climate change action
Our strategy, policies, actions, and targets
Our strategy
To limit global warming, the world needs to rapidly reduce annual greenhouse gas (GHG) emissions. Our nitrogen fertilizers are essential to achieving the crop yields necessary to meet global food demand. We believe that ammonia products are promising to enable the energy transition. Our sustainability-related goals are related to lower-carbon products.
Transition plan for climate change mitigation
For our divested facilities estimates of locked-in GHG emissions are the responsibility of the new owners. Once the strategic review is complete and a new strategy is established, we will update our targets, where applicable, to align with the revised direction for the remaining business.
Decarbonization roadmap
In 2021, we committed to reducing our Scope 1 and 2 GHG emission intensity (entity-specific indicator as reported in the Annual Report 2024: metric tonnes of CO2e / N-nutrient metric tonnes ammonia production and metric tonnes methanol production) by 20% by 2030 vs. 2019 level and aim to achieve carbon neutrality by 2050. We have developed a roadmap to achieve our targets for each OpCo, consisting of both sustainable short-to-medium-term and long-term value-enhancing initiatives offering sustained environmental and operational benefits. This transition plan was approved by the Board. This roadmap is still relevant for the remaining portfolio. Once our strategic review is completed and new strategy has been developed, we will update our targets, if applicable, in line with the revised direction for the remaining business.
Transition risks associated with navigating towards a lower carbon economy pose various challenges for OCI by 2030. At the forefront are shifts in carbon-related regulations, where carbon taxes and potentially ensuing environmental litigations pose risks. Stringent permitting processes can impede the timely construction of new infrastructure or the adoption of emissions-reducing technologies, resulting in escalated costs and missed market opportunities.
However, we also identify opportunities tied to certification and chain of custody regulations, green subsidies, fertilizer regulation and fuel subsidy programs. These incentives could help offset the financial burdens of adopting lower carbon technologies. Additionally, the implementation of a carbon border tax presents an opportunity for OCI, providing a competitive advantage and further impetus to expand our sustainable product offerings.
Our decarbonization roadmap has three pillars:
Operational excellence: Through a strong focus on energy efficiency and asset reliability, we expect to deliver approximately 5-7.5% of our target, which will be achieved through short-to-medium term wins at low capital expenditure requirements. This is further described on page .
Renewable energy sources: Switching our facilities to renewable energy sources (RES) through power purchase agreements and renewable energy certificates for our purchased electricity (Scope 2) will contribute approximately 4% of our target at relatively low economic cost and allow us to better hedge price volatility. This is further described on page .
Low carbon growth initiatives: We believe we can deliver approximately 10-12% of our target through new strategic, lower carbon initiatives that follow the transition pathway from conventional to lower carbon production, capitalizing on both new and established technologies such as waste gasification, carbon capture and storage (CCS) and purchased blue and green hydrogen.
Once the strategic review is complete and a new strategy is established, we will update our targets, where applicable, to align with the revised direction for the remaining business.
Operational excellence
We continuously look for ways to maximize our production efficiencies, minimize our emissions, and maintain our health and safety records. Operational excellence is integral to optimizing energy efficiency, which in turn is necessary to minimizing our Scope 1 GHG emissions, as the bulk of our Scope 1 GHG emissions occur when we consume natural gas to produce ammonia and methanol. The program is founded on three key pillars that are tightly interlinked: Process Safety, Reliability and Energy Efficiency. Process safety enables reliability, which in turn enables energy efficiency to achieve lower GHG emissions
Renewable energy sources
We are committed to source 100% renewable electricity for our operations from 2030 onwards.
Lower carbon products
We are committed to developing products and initiatives to provide cleaner and more sustainable solutions to our customers. We refer to Our actions for our progress during 2025 on the transition to more sustainable solutions in hard-to-abate industries such as agriculture, shipping and manufacturing.
Resilience analysis
We included below the resilience analysis we performed in 2023 and reviewed in 2024 and 2025 to focus on continuing operations. Following our strategic review and divestment of several facilities, our resilience analysis is under review as the material structure of our business has changed.
Climate change risks and opportunities
Our Enterprise Risk Management (ERM) framework equips us with the policies and procedures to facilitate the evaluation and management of risks across our organization. We assess and monitor the physical and transition risks presented by climate change as one of our risks (please refer to the Strategic risks section for further details), and believe we have adequate mitigation and sustainability strategies to maximize the opportunities to develop our business and help combat climate change.
We conducted an analysis of climate change risks and opportunities across different climate scenarios in line with the Task Force on Climate-Related Financial Disclosures (TCFD) framework. Upon reevaluation in 2025 and considering the announced divestments, we adjusted the identified risks and opportunities to align with our continuing operations. The analysis was grounded in three scenarios outlined by the Intergovernmental Panel on Climate Change (IPCC) Sixth Assessment Report, comprising a stringent mitigation scenario aimed at limiting warming to 2°C, an intermediate scenario targeting a warming limit of 3°C, and a high emissions scenario projecting warming exceeding 4°C. The analysis encompassed OCI's entire value chain, including direct operations, upstream and downstream activities.
For each risk, we evaluated both the likelihood and impact dimensions in line with the thresholds used in our OCI Enterprise Risk Management (ERM) methodology, rendering the results quantitative in nature. Our results were centered on the impacts expected by 2030 and 2050.
A detailed description of the assessment outcome is provided below, while the visual representation of each identified risk and opportunity, along with the time horizon and scenario, is found on page . This assessment has no impact on the Financial Statements. Please refer to the section Financial implications of climate change.
Transition risks
Transition risks associated with navigating towards a lower carbon economy pose various challenges for OCI. At the forefront are shifts in carbon-related regulations, where carbon taxes and potentially ensuing environmental litigations pose risks, especially under both stringent and intermediate climate scenarios, with their impact expected to be particularly pronounced by 2050. Stringent permitting processes can impede the timely construction of new infrastructure or the adoption of emissions-reducing technologies, resulting in escalated costs and missed market opportunities, which have a relatively high impact on OCI in all emission scenarios.
However, we also identify opportunities tied to certification and chain of custody regulations, green subsidies, fertilizer regulation and fuel subsidy programs, which are more likely to materialize in stringent mitigation scenarios, and by 2050 in the intermediate scenario. These incentives could help offset the financial burdens of adopting lower carbon technologies. Additionally, the implementation of a carbon border tax presents an opportunity for OCI, providing a competitive advantage and further impetus to expand our sustainable product offerings.
The need to demonstrate responsible management of supply chain emissions to maintain our market position is significant, particularly in the stringent mitigation scenario. The risk of negative public perception related to the stigmatization of the chemical sector escalates with higher emissions scenarios, indicating a need for proactive engagement with stakeholders and transparent sustainability reporting practices. Regarding our agricultural customers, inappropriate fertilization practices leading to biodiversity loss, highlighting the importance of our sustainable intensification promotion activities.
We recognize a sizeable opportunity in the successful deployment of decarbonization technologies, especially in the stringent mitigation scenario, and the intermediate one by 2050. However, the risk of technology failures and their impact remain high, indicating the need for robust technological strategies and diversification. This emphasizes OCI's continuing need for strategic partnerships with the most trusted names in technologies and project development. For our agricultural customers, climate optimization at farms is particularly relevant in the stringent mitigation scenario, and by 2050 in the intermediate scenario.
The emergence of new demand markets for renewable and lower carbon ammonia presents a considerable opportunity under the stringent mitigation scenario, requiring OCI to further align its product development with lower carbon pathways and expand its lower carbon product portfolio.
Physical risks
Changing global temperatures pose a number of physical risks, ranging from intensified extreme weather phenomena such as floods to shifting weather patterns, and heightened water scarcity. These environmental shifts can profoundly affect OCI's supply chain, unsettling planting cycles and agricultural conditions, thereby hindering farmers' capacity to effectively administer crop nutrients. Our analysis demonstrates consistent trends across the identified physical risk categories, with impacts starting relatively low in the stringent mitigation scenario and escalating to high levels in the high emission scenario.
The physical risk of production and supply chain disruptions due to extreme weather is notably high in scenarios with limited climate action, which will require robust contingency planning.
Water scarcity poses a dual threat to both OCI's production processes and our agricultural customers, particularly in the high emission scenario, warranting investment in water-efficient technologies and practices.
Company responses
By integrating climate considerations into various aspects of our operations, we not only mitigate the risks associated with climate change but also capitalize on opportunities to excel in a rapidly evolving business environment. For further details on our initiatives, please refer to Our strategy.
TCFD category | Risks and opportunities | 2030 | 2050 | 2030 | 2050 | 2030 | 2050 |
|---|---|---|---|---|---|---|---|
stringent mitigation | intermediate | very high emissions | |||||
Policy and legal | Carbon tax |  | |  | | | |
Carbon border tax |  | |  | | | | |
Fuels subsidies scheme | | |  | | | | |
Environmental litigations | | |  | | | | |
Environmental reporting regulations | | | | | | | |
Certification and chain of custody regulations | | | | | | | |
Green subsidies | | | | | | | |
Permitting and speed of infrastructure build-out | | | | | | | |
Fertilizer regulation and farmer subsidy schemes | | | | | | | |
Reputation | Stigmatization of sector | | | | | | |
Supply chain | | | | | | | |
Biodiversity loss from downstream fertilizer use | | | | | | | |
Technology / Market | Technology failures for decarbonization | | | | | | |
Successful decarbonization technologies | | | | | | | |
New demand markets don't materialize | | | | | | | |
New demand markets | | | | | | | |
New competitors on ammonia | | | | | | | |
Decarbonization of transport, marine, power | | | | | | | |
Access to green financing | | | | | | | |
Climate optimization at farms | | | | | | | |
Physical | Extreme weather - production | | | | | | |
Flooding leads to production disruptions | | | | | | | |
Extreme weather - supply chain | | | | | | | |
Extreme weather - farming | | | | | | | |
Change in weather patterns - farming | | | | | | | |
Water scarcity - farming | | | | | | | |
Our policies
This section contains the policies we have established to manage our material impacts, risks and opportunities.
Environmental Policy
Our Environmental Policy reflects our commitment to be an environmental steward for the topics of climate change, pollution, water, biodiversity, and resource use and circularity.
Our Environmental Policy serves as a guiding framework to ensure that our activities are conducted in a manner that protects and preserves the environment. To achieve this goal, we have aligned our strategy to the world’s collective objective to protect the planet, underpinned by the United Nations Sustainable Development Goals (SDGs). The policy is published on our company website and our intranet.
The policy applies to the OCI Group, which consists of OCI N.V. and its subsidiaries and partnerships over which we have operational control. However regional, business unit or topic-specific policies on the environment may apply instead of, or in addition to, the policy. We encourage our value chain partners to apply the environmental policy or its equivalence in their operations.
To evaluate the effectiveness of our policy, we set measurable goals and targets which underpin our strategic objectives. Our environmental performance, initiatives and targets are monitored and externally communicated at least on an annual basis, through our Annual Report. The Environmental Policy is ultimately governed by our Chief Executive Officer (CEO).
For the topic of climate change, our policy encompasses the management of climate-related dependencies, impacts, risks and opportunities. These include: GHG emissions reduction (focused on reducing emissions and enhancing energy efficiency across our operations); energy transition (investing in renewable energy to reduce reliance on fossil fuels and support sustainable energy growth); product innovation (expanding sustainable fuels, low-carbon products, and advancing nutrient use efficiency); resilience and risk management (assessing transition risks and embedding resilience into our business strategies); and environmental safeguarding (ensuring responsible handling, processing, and lifecycle management of products to protect the environment). Elements such as GHG emissions reduction, energy transition, and product innovation primarily address climate change mitigation, while resilience and risk management and environmental safeguarding focus on climate change adaptation.
Our actions
Key actions during the reporting year
During 2025 we have continued to produce lower-carbon versions of our core products methanol, ammonia and ammonia derivatives:
USD 52,219,726 or our revenue related to lower-carbon methanol, 12.7% of total methanol revenue
USD 8,318,109 of our revenue related to lower-carbon ammonia, 0.7% of total ammonia revenue
By working in partnership with customers to supply them with lower carbon methanol and ammonia, we have helped to support the decarbonisation of carbon-dense and hard-to-abate industries, including agriculture, shipping, logistics and manufacturing. We have continued to implement sustainability policy and practice in all operations managed by OCI, including during the transitional phase through which our divested operations have been transferred to new ownership.
We currently have no significant financial resources allocated to the action plan, and no new financial resources have been allocated in 2025, as a result of our ongoing strategic review.
During 2025, we have continued to support the transition to more sustainable solutions in the above-mentioned hard-to-abate industries by supplying lower-carbon products to our customers, including several industry milestones:
The continued administrative role on the Beaumont New Ammonia site as part of our responsibility to fund the remaining costs of the project. The facility is designed to produce lower-carbon ammonia, via carbon capture and sequestration, delivering a minimum 70% CO2 emission reduction on a life cycle basis compared to conventional ammonia production. The facility will have capacity to provide 1.1 million tonnes per year of ammonia in its first phase, and up to 2.2. million tonnes per year if a second phase of development is completed, providing a significant lower-carbon ammonia supply and helping to kick-start the lower-carbon ammonia market.
Production of lower-carbon methanol in our discontinued operations. When used as a fuel, green methanol provides at least a 60% reduction in greenhouse gas emissions versus conventional fossil fuels, which means it is an excellent hydrogen fuel to meet renewable fuel standards.
Continued production of AdBlue® from OCIN, which breaks down nitrogen oxide emissions into nitrogen gas and water vapor, thereby reducing environmentally harmful emissions from cars, trucks, buses and other heavy-duty vehicles, while also improving fuel efficiency.
Continued production of lower carbon ammonia and fertilizers from OCIN.
Launching OCI Ammonia Distribution B.V. (OAD), later included in the OAH sale agreement, a subsidiary dedicated to the distribution of ammonia for the last mile in Europe and to support the growing demand for ammonia from new sectors such as energy and bunkering.
Entering a strategic partnership with Raiffeisen Waren-Zentrale Rhein-Main AG (RWZ) to supply its lower carbon fertilizers for RWZ and BASF’s innovative “KlimaPartner Landwirtschaft” carbon farming initiative. The collaboration will enable RWZ and its agricultural partners to reduce the carbon footprint of crop production and advance more sustainable farming practices. We will supply lower carbon nitrogen fertilizers, including lower carbon calcium ammonium nitrate (CAN), Nutramon® Novo, and lower carbon nitrogen-sulfur fertilizer (CAN+S), Dynamon® Novo. Both fertilizers are produced using biogas instead of conventional natural gas in the Haber-Bosch process, resulting in up to 60% lower CO₂ emissions during production.
Expanding the collaboration with Dossche Mills, AGRAVIS to scale sustainable wheat cultivation.
Successfully conducting an ammonia bunkering pilot at the terminal in the Port of Rotterdam, facilitated by Port of Rotterdam, Trammo, and James Fisher Fendercare. The operation took place between two vessels alongside a newly developed quay, marking a significant step towards preparing the port for ammonia bunkering. The first ships capable of using ammonia as a bunker fuel are expected in 2026 or 2027. The ammonia bunker pilot is part of the European MAGPIE project.
Signing a Memorandum of Understanding (MoU) with VICTROL to jointly develop a safe, scalable and commercially viable supply chain for clean ammonia bunkering in the Netherlands and Belgium. This strategic collaboration marks an important step in accelerating the decarbonization of the maritime industry. OAD will lead the sourcing and import of clean ammonia from global production hubs in the US, Middle East, North Africa, and Asia. The molecules will be transported by sea-going vessels to the OTE (OTE) ammonia import terminal in the Port of Rotterdam, where they will be safely stored, distributed, and made available for use as marine fuel. VICTROL will design, build, and operate a liquid ammonia bunker barge.
Reference is made to 2.1.4 GHG Intensity and 2.1.5 Total GHG emissions disaggregated by Scopes 1 and 2 and significant Scope 3 for the achieved GHG emission reductions.
Key actions planned for the future
Once the strategic review is complete and a new strategy is established, we will update our actions, where applicable, to align with the revised direction for the remaining business. Specific deadlines for new undertakings have not been set due to the ongoing strategic review.
Internal carbon pricing schemes
OCI does not apply internal carbon pricing schemes.
Our targets
In 2021, we committed to reducing our Scope 1 and 2 greenhouse gas (GHG) emission intensity (entity-specific indicator as reported in the Annual Report 2024: metric tonnes of CO2e / N-nutrient metric tonnes ammonia production and metric tonnes methanol production) by 20% by 2030 vs. 2019 level and aim to achieve carbon neutrality by 2050. This roadmap is still relevant for the remaining portfolio. See our Sustainability Governance Framework for how we track policy and action effectiveness on material impacts, risks, and opportunities, including processes, ambition, and progress indicators.
Once our strategic review is completed and new strategy has been developed, we will update our targets, if applicable, in line with the revised direction for the remaining business.
Our previously set climate reduction target was set to reduce our Scope 1 and 2 greenhouse gas (GHG) emissions intensity (including 50% of the divested operation Natgasoline) by 20% by 2030, sourcing 100% renewable electricity for our operations from 2030 onwards, and aim to achieve carbon neutrality by 2050. This target brings us close to aligning with the 2°C Paris climate agreement pathway. The gross Scope 1 GHG emissions are calculated using the EU ETS methodology. This means that the CO2 used in the production of urea and other downstream processes, which is defined as Scope 3 as per the GHG Protocol, is included. By including the CO2 that goes into downstream processes, we eliminate the fluctuations that may occur when we make any changes or experience downtime in our downstream product mix and present a transparent view of the CO2 produced when making ammonia. The Scope 2 GHG emissions are calculated using the market-based method. 2019 was chosen as the base year as it was the first year following completion of our expansion program and includes a full year of emissions from the divested operations Fertil and 50% of Natgasoline.
2.1.1 Energy consumption and mix
The basis of preparation for the energy consumption and mix indicators can be found on page .
Indicator | Unit | Total | Continuing operations | Discontinued operations | |||
|---|---|---|---|---|---|---|---|
2025 | 2024 | 2025 | 2024 | 2025 | 2024 | ||
Fuel consumption from coal and coal products | MWh | 0 | 0 | 0 | 0 | 0 | 0 |
Fuel consumption from crude oil and petroleum products | MWh | 0 | 0 | 0 | 0 | 0 | 0 |
Fuel consumption from natural gas | MWh | 2,690,157 | 23,019,858 | 1,910,260 | 2,776,571 | 779,897 | 20,243,287 |
Fuel consumption from other fossil sources | MWh | 0 | 0 | 0 | 0 | 0 | 0 |
Consumption of purchased or acquired electricity, heat, steam, and cooling from fossil sources | MWh | 1,282,105 | 2,737,382 | 357,771 | 511,5181 | 924,334 | 2,225,8641 |
Total energy consumption from fossil sources | MWh | 3,972,261 | 25,757,241 | 2,268,031 | 3,288,0891 | 1,704,231 | 22,469,1511 |
Share of fossil sources in total energy consumption | % | 100.0% | 98.6% | 100.0% | 100.0% | 100.0% | 98.4% |
Total energy consumption from nuclear sources | MWh | 0 | 0 | 0 | 0 | 0 | 0 |
Share of consumption from nuclear sources in total energy consumption | % | 0.0% | 0.0% | 0.0% | 0.0% | 0.0% | 0.0% |
Fuel consumption from renewable sources | MWh | 0 | 0 | 0 | 0 | 0 | 0 |
Consumption of purchased or acquired electricity, heat, steam, and cooling from renewable sources | MWh | 0 | 356,610 | 0 | 0 | 0 | 356,610 |
Consumption of self-generated non-fuel renewable energy | MWh | 0 | 0 | 0 | 0 | 0 | 0 |
Total energy consumption from renewable sources | MWh | 0 | 356,610 | 0 | 0 | 0 | 356,610 |
Share of renewable sources in total energy consumption | % | 0.0% | 1.4% | 0.0% | 0.0% | 0.0% | 1.6% |
Non-renewable energy production | MWh | 0 | 0 | 0 | 0 | 0 | 0 |
Renewable energy production | MWh | 0 | 0 | 0 | 0 | 0 | 0 |
Total energy consumption | MWh | 3,972,261 | 26,113,850 | 2,268,031 | 3,288,0891 | 1,704,231 | 22,825,7611 |
- We classify OCIN and segment 'Other' as continuing operations, while Beaumont New Ammonia, OCI Methanol, OTE, and OAD are considered discontinued operations in FY 2025. We restated data as reported in the Annual Report 2024 by reclassifying OTE from continuing operations to discontinued operations. Reference is made to page for more information.
Total energy consumption decreased by 85% compared to prior year. This reduction was primarily attributable to the divestitures of Fertiglobe and OCI Nitrogen Iowa in 2024, and OCI Methanol in 2025 (87% of total energy consumption in 2024). For our continuing operations, total energy consumption declined from 3,288,089 MWh in 2024 to 2,268,031 MWh in 2025, largely due to lower production volumes. The decline was mainly driven by reduced utilisation rates resulting from planned maintenance activities and plant outages.
In 2024, we purchased renewable energy certificates in our divested sites in Egypt and the UAE.
2.1.2 Energy intensity
The basis of preparation for the energy intensity indicators can be found on page .
Indicator | Unit | Total | Continuing operations | Discontinued operations | |||
|---|---|---|---|---|---|---|---|
2025 | 2024 | 2025 | 2024 | 2025 | 2024 | ||
Energy intensity associated with activities in high climate impact sectors | MWh / USD net revenue | 0.004 | 0.027 | 0.002 | 0.003 | Not applicable | Not applicable |
Ammonia products generally have a higher energy intensity than methanol products. The energy intensity decreased from 0.027 to 0.004 in 2025, primarily driven by changes in the product mix following the 2024 divestitures of Fertiglobe and OCI Nitrogen Iowa. The energy intensity decreased from 0.003 to 0.002 for continuing operations in 2025, due to lower production volumes and supported by our actions. However, the achieved energy consumption reductions are not measured on an action by action basis.
2.1.3 Scope 1 and 2 GHG emissions
The basis of preparation for the Scope 1 and 2 GHG emissions indicators can be found on page .
Indicator | Unit | Total | Continuing operations | Discontinued operations | |||
|---|---|---|---|---|---|---|---|
2025 | 2024 | 2025 | 2024 | 2025 | 2024 | ||
Gross Scope 1 GHG emissions | metric tonnes of CO2e | 1,065,594 | 7,236,225 | 734,406 | 1,231,6641 | 331,188 | 6,004,5601 |
Gross Scope 1 GHG emissions - CO2 to downstream | metric tonnes of CO2e | 560,271 | 3,662,167 | 560,271 | 678,452 | 0 | 2,983,715 |
Total gross Scope 1 GHG emissions | metric tonnes of CO2e | 1,625,865 | 10,898,391 | 1,294,677 | 1,910,1161 | 331,188 | 8,988,2751 |
Total gross Scope 2 GHG emissions - Location-based | metric tonnes of CO2e | 128,899 | 510,626 | 102,920 | 139,3091 | 25,979 | 371,3171 |
Total gross Scope 2 GHG emissions - Market-based | metric tonnes of CO2e | 128,899 | 352,440 | 102,920 | 139,3091 | 25,979 | 213,1321 |
Scope 1 GHG emissions from regulated emission trading schemes | % | 80.1% | 17.6% | 100.0% | 100.0% | 2.3% | 0.1%1 |
- We classify OCIN and segment 'Other' as continuing operations, while Beaumont New Ammonia, OCI Methanol, OTE, and OAD are considered discontinued operations in FY 2025. We restated data as reported in the Annual Report 2024 by reclassifying OTE from continuing operations to discontinued operations. Reference is made to page for more information.
Total Scope 1 emissions decreased by 85% compared to prior year. This reduction was primarily attributable to the divestitures of Fertiglobe and OCI Nitrogen Iowa in 2024, and OCI Methanol in 2025 (82% of total energy consumption in 2024). For our continuing operations, total Scope 1 emissions declined from 1,910,116 metric tonnes of CO2e in 2024 to 1,294,677 metric tonnes of CO2e in 2025, largely due to lower production volumes. The decline was mainly driven by reduced utilisation rates resulting from planned maintenance activities and plant outages.
2.1.4 GHG Intensity
The basis of preparation for the GHG intensity indicators can be found on page .
Indicator | Unit | Total | Continuing operations | Discontinued operations | |||
|---|---|---|---|---|---|---|---|
2025 | 2024 | 2025 | 2024 | 2025 | 2024 | ||
GHG intensity (location-based) | metric tonnes of CO2e | 0.009 | 0.039 | 0.006 | 0.008 | Not applicable | Not applicable |
GHG intensity (market-based) | metric tonnes of CO2e | 0.009 | 0.038 | 0.006 | 0.008 | Not applicable | Not applicable |
Ammonia products generally have a higher GHG intensity than methanol products. The GHG intensity decreased from 0.039 (location-based) and 0.038 (market-based) to 0.009 in 2025, primarily driven by changes in the product mix following the 2024 divestitures of Fertiglobe and OCI Nitrogen Iowa. The GHG intensity decreased from 0.008 to 0.006 for continuing operations in 2025, supported by our actions. However, the achieved GHG emission reductions are not measured on an action by action basis.
2.1.5 Total GHG emissions disaggregated by Scopes 1 and 2 and significant Scope 3
The basis of preparation for the GHG emissions disaggregated by Scopes 1 and 2 and significant Scope 3 indicators can be found on page .
Retrospective | Milestones and target years | |||||||
|---|---|---|---|---|---|---|---|---|
Total | 2019 | 2024 | 2025 | % 2025 / 2024 | 2025 | 2030 | 2050 | Annual % target / Base year |
Scope 1 GHG emissions | ||||||||
Gross Scope 1 GHG emissions (tCO2eq) | 13,585,377 | 10,898,391 | 1,625,865 | 15% | 0 | 3.2% | ||
Percentage of Scope 1 GHG emissions from regulated emission trading schemes (%) | 17.5% | 17.6% | 80.1% | 455% | 0 | 3.2% | ||
Scope 2 GHG emissions | ||||||||
Gross location-based Scope 2 GHG emissions (tCO2eq) | 606,926 | 510,626 | 128,899 | 25% | 0 | 3.2% | ||
Gross market-based Scope 2 GHG emissions (tCO2eq) | 606,926 | 352,440 | 128,899 | 37% | 0 | 3.2% | ||
Significant Scope 3 GHG emissions | ||||||||
Total Gross indirect (Scope 3) GHG emissions (tCO2eq) | 30,292,415 | 26,268,987 | 7,827,080 | 30% | 0 | 3.2% | ||
1 Purchased goods and services | 4,355,554 | 4,040,135 | 1,610,335 | 40% | 0 | 3.2% | ||
2 Capital goods | 196,264 | 136,465 | 26,078 | 19% | 0 | 3.2% | ||
3 Fuel and energy-related activities (not included in Scope 1 or Scope 2) | 1,925,536 | 1,347,778 | 204,789 | 15% | 0 | 3.2% | ||
4 Upstream transportation and distribution | 291,226 | 352,225 | 97,387 | 28% | 0 | 3.2% | ||
5 Waste generated in operations | 918 | 3,435 | 850 | 25% | 0 | 3.2% | ||
6 Business travelling | 4,396 | 6,822 | 5,652 | 83% | 0 | 3.2% | ||
7 Employee commuting | 2,093 | 2,570 | 416 | 16% | 0 | 3.2% | ||
8 Upstream leased assets | 1,734 | 3,219 | 623 | 19% | 0 | 3.2% | ||
9 Downstream transportation | 688,178 | 1,039,189 | 138,936 | 13% | 0 | 3.2% | ||
11 Use of sold products | 20,613,442 | 17,342,381 | 4,881,285 | 28% | 0 | 3.2% | ||
12 End-of-life treatment of sold products | 1,889,960 | 1,722,207 | 633,197 | 37% | 0 | 3.2% | ||
15 Investments | 323,114 | 272,562 | 227,531 | 83% | 0 | 3.2% | ||
Total GHG emissions | ||||||||
Total GHG emissions (location-based) (tCO2eq) | 44,484,717 | 37,678,005 | 9,581,844 | 25% | 0 | 3.2% | ||
Total GHG emissions (market-based) (tCO2eq) | 44,484,717 | 37,519,819 | 9,581,844 | 26% | 0 | 3.2% | ||
Retrospective | Milestones and target years | |||||||
|---|---|---|---|---|---|---|---|---|
Continuing operations | 2019 | 2024 | 2025 | % 2025 / 2024 | 2025 | 2030 | 2050 | Annual % target / Base year |
Scope 1 GHG emissions | ||||||||
Gross Scope 1 GHG emissions (tCO2eq) | 1,958,786 | 1,910,1161 | 1,294,677 | 68% | 0 | 3.2% | ||
Percentage of Scope 1 GHG emissions from regulated emission trading schemes (%) | 100.0% | 100.0% | 100.0% | 100% | 0 | 3.2% | ||
Scope 2 GHG emissions | ||||||||
Gross location-based Scope 2 GHG emissions (tCO2eq) | 172,336 | 139,3091 | 102,920 | 74% | 0 | 3.2% | ||
Gross market-based Scope 2 GHG emissions (tCO2eq) | 172,336 | 139,3091 | 102,920 | 74% | 0 | 3.2% | ||
Significant Scope 3 GHG emissions | ||||||||
Total Gross indirect (Scope 3) GHG emissions (tCO2eq) | 6,675,610 | 5,625,7122 | 5,589,197 | 99% | 0 | 3.2% | ||
1 Purchased goods and services | 1,163,467 | 734,735 | 783,641 | 107% | 0 | 3.2% | ||
2 Capital goods | 159,275 | 12,1692 | 24,999 | 205% | 0 | 3.2% | ||
3 Fuel and energy-related activities (not included in Scope 1 or Scope 2) | 119,906 | 166,0542 | 121,720 | 73% | 0 | 3.2% | ||
4 Upstream transportation and distribution | 181,016 | 172,775 | 84,909 | 49% | 0 | 3.2% | ||
5 Waste generated in operations | 204 | 2652 | 547 | 206% | 0 | 3.2% | ||
6 Business travelling | 2,309 | 3,2532 | 5,543 | 170% | 0 | 3.2% | ||
7 Employee commuting | 256 | 2622 | 245 | 94% | 0 | 3.2% | ||
8 Upstream leased assets | 1,600 | 1,571 | 582 | 37% | 0 | 3.2% | ||
9 Downstream transportation | 92,109 | 66,917 | 48,097 | 72% | 0 | 3.2% | ||
11 Use of sold products | 4,722,052 | 4,223,471 | 4,346,727 | 103% | 0 | 3.2% | ||
12 End-of-life treatment of sold products | 233,417 | 244,240 | 172,188 | 70% | 0 | 3.2% | ||
15 Investments | 0 | 0 | 0 | 0% | 0 | 3.2% | ||
Total GHG emissions | ||||||||
Total GHG emissions (location-based) (tCO2eq) | 8,806,732 | 7,675,1373 | 6,986,795 | 91% | 0 | 3.2% | ||
Total GHG emissions (market-based) (tCO2eq) | 8,806,732 | 7,675,1373 | 6,986,795 | 91% | 0 | 3.2% | ||
- We classify OCIN and segment 'Other' as continuing operations, while Beaumont New Ammonia, OCI Methanol, OTE, and OAD are considered discontinued operations in FY 2025. We restated data as reported in the Annual Report 2024 by reclassifying OTE from continuing operations to discontinued operations. Reference is made to page for more information.
- We classify OCIN and segment 'Other' as continuing operations, while Beaumont New Ammonia, OCI Methanol, OTE, and OAD are considered discontinued operations in FY 2025. We restated data as reported in the Annual Report 2024 by reclassifying OTE from continuing operations to discontinued operations. Reference is made to page for more information.
- We classify OCIN and segment 'Other' as continuing operations, while Beaumont New Ammonia, OCI Methanol, OTE, and OAD are considered discontinued operations in FY 2025. We restated data as reported in the Annual Report 2024 by reclassifying OTE from continuing operations to discontinued operations. Reference is made to page for more information.
Retrospective | Milestones and target years | |||||||
|---|---|---|---|---|---|---|---|---|
Discontinued operations | 2019 | 2024 | 2025 | % 2025 / 2024 | 2025 | 2030 | 2050 | Annual % target / Base year |
Scope 1 GHG emissions | ||||||||
Gross Scope 1 GHG emissions (tCO2eq) | 11,626,590 | 8,988,2751 | 331,188 | 4% | 0 | 3.2% | ||
Percentage of Scope 1 GHG emissions from regulated emission trading schemes (%) | 3.5% | 0.1%1 | 2.3% | 3217% | 0 | 3.2% | ||
Scope 2 GHG emissions | ||||||||
Gross location-based Scope 2 GHG emissions (tCO2eq) | 434,590 | 371,3171 | 25,979 | 7% | 0 | 3.2% | ||
Gross market-based Scope 2 GHG emissions (tCO2eq) | 434,590 | 213,1321 | 25,979 | 12% | 0 | 3.2% | ||
Significant Scope 3 GHG emissions | ||||||||
Total Gross indirect (Scope 3) GHG emissions (tCO2eq) | 23,616,805 | 20,643,2762 | 2,237,883 | 11% | 0 | 3.2% | ||
1 Purchased goods and services | 3,192,088 | 3,305,400 | 826,693 | 25% | 0 | 3.2% | ||
2 Capital goods | 36,989 | 124,2962 | 1,079 | 1% | 0 | 3.2% | ||
3 Fuel and energy-related activities (not included in Scope 1 or Scope 2) | 1,805,630 | 1,181,7242 | 83,069 | 7% | 0 | 3.2% | ||
4 Upstream transportation and distribution | 110,210 | 179,450 | 12,478 | 7% | 0 | 3.2% | ||
5 Waste generated in operations | 714 | 3,1702 | 303 | 10% | 0 | 3.2% | ||
6 Business travelling | 2,087 | 3,5692 | 110 | 3% | 0 | 3.2% | ||
7 Employee commuting | 1,837 | 2,3092 | 171 | 7% | 0 | 3.2% | ||
8 Upstream leased assets | 134 | 1,648 | 41 | 2% | 0 | 3.2% | ||
9 Downstream transportation | 596,069 | 972,272 | 90,839 | 9% | 0 | 3.2% | ||
11 Use of sold products | 15,891,389 | 13,118,910 | 534,558 | 4% | 0 | 3.2% | ||
12 End-of-life treatment of sold products | 1,656,543 | 1,477,967 | 461,009 | 31% | 0 | 3.2% | ||
15 Investments | 323,114 | 272,562 | 227,531 | 83% | 0 | 3.2% | ||
Total GHG emissions | ||||||||
Total GHG emissions (location-based) (tCO2eq) | 35,677,985 | 30,002,8683 | 2,595,050 | 9% | 0 | 3.2% | ||
Total GHG emissions (market-based) (tCO2eq) | 35,677,985 | 29,844,6823 | 2,595,050 | 9% | 0 | 3.2% | ||
- We classify OCIN and segment 'Other' as continuing operations, while Beaumont New Ammonia, OCI Methanol, OTE, and OAD are considered discontinued operations in FY 2025. We restated data as reported in the Annual Report 2024 by reclassifying OTE from continuing operations to discontinued operations. Reference is made to page for more information.
- We classify OCIN and segment 'Other' as continuing operations, while Beaumont New Ammonia, OCI Methanol, OTE, and OAD are considered discontinued operations in FY 2025. We restated data as reported in the Annual Report 2024 by reclassifying OTE from continuing operations to discontinued operations. Reference is made to page for more information.
- We classify OCIN and segment 'Other' as continuing operations, while Beaumont New Ammonia, OCI Methanol, OTE, and OAD are considered discontinued operations in FY 2025. We restated data as reported in the Annual Report 2024 by reclassifying OTE from continuing operations to discontinued operations. Reference is made to page for more information.
2.1.6 GHG removals and GHG mitigation projects financed through carbon credits
The basis of preparation for the GHG removals and GHG mitigation projects financed through carbon credits indicators can be found on page .
OCI does not remove and store any GHG emissions and does not purchase carbon credits.
2.2 Product stewardship
Our approach to product stewardship
Due to divestments and OCI’s strategic reorientation, our sustainability approach is evolving. The transition to new ownership enables continued progress, while OCI remains focused on effectively managing continuing operations. In our continuing operations, we continue to promote products and services to minimize negative impacts and dependencies on the environment (e.g., climate change, air, water and soil pollution, biodiversity and ecosystems) and maximize positive impacts on society (e.g., food security, land use changes, health and safety).
Our nitrogen fertilizers provide key nutrients for crops, and in our continuing operations we remain committed to producing these in more sustainable ways, as well as supporting sustainable and regenerative farming techniques.
Our policies, actions, and targets
Our policies
This section contains the policies we have established to manage our material impacts, risks and opportunities.
Code of Conduct, Environmental Policy, Business Partner Code of Conduct, Stakeholder Engagement Policy
Our Code of Conduct highlights our commitment to supporting the economic and social well-being of stakeholders and host communities by adhering to the principles of the Universal Declaration of Human Rights (see section Our policies). We strive to uphold environmental stewardship by developing and promoting products and services that minimize negative impacts and dependencies on the environment (see section Our policies and our Environmental Policy). For example, we provide low carbon and renewable products to help decarbonize our downstream customers and innovate in enhancing nutrient use efficiency. Additionally, our Business Partner Code of Conduct (see section Our policies) encourages business partners across our value chain to act responsibly by, for instance, reducing their environmental impact on local communities, promoting process safety, and managing waste effectively. Finally, our Stakeholder Engagement Policy outlines our commitment to engaging with customers and communities, ensuring their interests and needs are met while maximizing positive societal impact (see section Our policies).
Our actions
Key actions during the reporting year
During 2025, we worked on solutions to address environmental impacts and improve yield across the value chain. Our strategy was three-fold:
Reducing the embedded carbon footprint of nitrogen fertilizers by using alternative feedstocks (e.g., green, bio-based and recycled hydrogen) and carbon capture and storage.
Developing products that will enhance nutrient use efficiency, hence reducing losses and increasing yield.
Collaborating across the value chain to promote sustainable intensification.
We developed fertilizers with urease and/or nitrification inhibitors, which are among the most credible pathways to reduce N₂O emission during field applications, which contributes to over 50% of GHG emissions in the nitrogen fertilizer value chain.
Nitrogen fertilizers are the key nutrient for crop growth and development. High-quality soil maximizes farm yields and ensures healthy crops, which in turn naturally sequester carbon dioxide to help fight climate change.
Efficient farming through correct fertilizer application helps farmers maximize the use of existing farmland and reduces land sequestration. Our fertilizer products help achieve sustainable agriculture by providing an effective and environmentally sound source of nitrogen. By using nitrogen fertilizers effectively, farmers can:
Grow more food on their land.
Reduce soil nutrient loss and improve soil quality.
Reduce the need for new farmland to be sequestered, which therefore reduces GHG emissions by limiting deforestation.
Without annual application of nitrogen fertilizers to replenish soil nutrients, soil health is eroded resulting in lower yields and biodiversity loss amongst many other issues.
Inappropriate fertilization practices can lead to the loss of nutrients to the environment. If those nutrients are not replaced, soil health declines and eventually leads to soil degradation. In order to prevent the expansion of agricultural production onto uncultivated land, and thus avoid further loss of biodiversity and the release of sequestered carbon, it is crucial to supply existing agricultural land with a sufficient amount of nutrients. The importance of healthy soil for agricultural production is particularly crucial in the current geopolitical situation. We are confronted by a serious food security threat resulting from an abrupt reduction in fertilizer production which has had consequences across the whole agri-food supply chain. By applying sustainable intensification practices, farmers will be able to maximise the use and efficiency of existing farmland while minimising the environmental impact on the same land area. Sustainable intensification can therefore represent an effective and valid approach to the sustainability of the agri-food supply chain, while contributing to food security and, including measures such as:
The use of harmonized standards and indicators such as the Nitrogen Use Efficiency (NUE) Indicator, for example, developed by the EU Nitrogen Expert Panel, which is able to provide information about resource use efficiency.
The use of precision farming tools and techniques that can help farmers to effectively assess crop nutrients requirements.
An increase in the replacement of conventional mineral fertilizers with Enhanced Efficiency Fertilizers (EEF’s) which improve fertilizer use efficiency, mitigate climate change and significantly reduce nitrogen losses to the environment.
The adoption of “4R” principles: using the right fertilizer source at the right rate, at the right time and in the right place.
The use of targeted fertigation techniques.
The use of lower carbon and renewable ammonia in fertilizer production, helping to reduce overall Scope 1 GHG emissions.
We worked with industry associations to educate farmers on fertilizer application, storage, provide digital resources, and to encourage sustainable farming.
We currently have no significant financial resources allocated to the action plan, and no new financial resources have been allocated in 2025, as a result of our ongoing strategic review.
Key actions planned for the future
Once the strategic review is complete and a new strategy is established, we will update our actions, where applicable, to align with the revised direction for the remaining business. Specific deadlines for new undertakings have not been set due to the ongoing strategic review.
Our targets
We have not set targets for product stewardship due to the strategic review of our business and divestment of several facilities, which has changed the material structure of our business. Once our strategic review is completed and new strategy has been developed, we will update our targets, if applicable, in line with the revised direction for the remaining business. Although we have not set targets, refer to our Sustainability Governance Framework for how we still track policy and action effectiveness on material impacts, risks, and opportunities, using defined processes, ambition, and progress indicators.
2.2.1 Scope 3 GHG emissions
The basis of preparation for the Scope 3 GHG emissions indicators can be found on page .
Indicator | Unit | Total | Continuing operations | Discontinued operations | |||
|---|---|---|---|---|---|---|---|
2025 | 2024 | 2025 | 2024 | 2025 | 2024 | ||
Total GHG emissions (Scope 3) | metric tonnes of CO2e | 7,827,080 | 26,268,987 | 5,589,197 | 5,625,7121 | 2,237,883 | 20,643,2761 |
1 Purchased goods and services | metric tonnes of CO2e | 1,610,335 | 4,040,135 | 783,641 | 734,735 | 826,693 | 3,305,400 |
2 Capital goods | metric tonnes of CO2e | 26,078 | 136,465 | 24,999 | 12,1691 | 1,079 | 124,2961 |
3 Fuel and energy-related activities (not included in Scope 1 or Scope 2) | metric tonnes of CO2e | 204,789 | 1,347,778 | 121,720 | 166,0541 | 83,069 | 1,181,7241 |
4 Upstream transportation and distribution | metric tonnes of CO2e | 97,387 | 352,225 | 84,909 | 172,775 | 12,478 | 179,450 |
5 Waste generated in operations | metric tonnes of CO2e | 850 | 3,435 | 547 | 2651 | 303 | 3,1701 |
6 Business travelling | metric tonnes of CO2e | 5,652 | 6,822 | 5,543 | 3,2531 | 110 | 3,5691 |
7 Employee commuting | metric tonnes of CO2e | 416 | 2,570 | 245 | 2621 | 171 | 2,3091 |
8 Upstream leased assets | metric tonnes of CO2e | 623 | 3,219 | 582 | 1,571 | 41 | 1,648 |
9 Downstream transportation | metric tonnes of CO2e | 138,936 | 1,039,189 | 48,097 | 66,917 | 90,839 | 972,272 |
11 Use of sold products | metric tonnes of CO2e | 4,881,285 | 17,342,381 | 4,346,727 | 4,223,471 | 534,558 | 13,118,910 |
12 End-of-life treatment of sold products | metric tonnes of CO2e | 633,197 | 1,722,207 | 172,188 | 244,240 | 461,009 | 1,477,967 |
15 Investments | metric tonnes of CO2e | 227,531 | 272,562 | 0 | 0 | 227,531 | 272,562 |
- We classify OCIN and segment 'Other' as continuing operations, while Beaumont New Ammonia, OCI Methanol, OTE, and OAD are considered discontinued operations in FY 2025. We restated data as reported in the Annual Report 2024 by reclassifying OTE from continuing operations to discontinued operations. Reference is made to page for more information.
The major categories for Scope 3 are emissions from use of product sold. For example: N2O emissions in the field where nitrogen fertilizers are applied, CO2 emissions when methanol is combusted as fuel, and cradle-to-gate emissions of traded products.
Overall, Scope 3 emissions from use of sold products decreased by 72% compared to prior year. This reduction was primarily attributable to the divestitures of Fertiglobe and OCI Nitrogen Iowa in 2024, and OCI Methanol in 2025 (76% of total cat. 11 emissions in 2024). For our continuing operations, Scope 3 emission from use of sold products increased from 4,223,471 metric tonnes of CO2e in 2024 to 4,346,727 metric tonnes of CO2e in 2025, largely due to lower emissions from own nitrogen products sold, offset by increased emissions from third party traded nitrogen products.
2.3 Water in our operations
Our approach to water in our operations
After the divestment of Fertiglobe in 2024, we do not have sites in water stressed areas and therefore the focus of our water strategy is on ensuring compliance with local regulations on water withdrawal and discharge, optimizing water use where possible and ensuring Water, Sanitation and Hygiene (WASH) access to all our employees.
As water is an essential but finite resource, we work diligently to maximize our water efficiency and are focused on reducing our water use. We primarily use water in our production processes for cooling, steam generation, or in our downstream aqueous products.
We closely monitor our water withdrawals and discharges and ensure any discharged water is treated to meet applicable environmental requirements and safely discharged.
Our policies, actions, and targets
Our policies
This section contains the policies we have established to manage our material impacts, risks and opportunities.
Environmental Policy
Our Environmental Policy reflects our commitment to be an environmental steward. For more specific information on our Environmental Policy, such as its scope of application, evaluation of its effectiveness, and related accountabilities, please refer to section Our policies.
For the topic of water, our policy encompasses management of water-related dependencies, impacts, risks, and opportunities, such as: water footprint reduction (minimising water use and promoting responsible sourcing and treatment practices by closely monitoring water withdrawals and discharge); efficiency optimisation (enhancing water consumption and usage efficiency across operations, products, and services within the value chain); control measures (e.g., systematically preventing spills, leaks, and incidents that may cause water contamination and pollution); and employee welfare (ensuring access to WASH facilities for all employees and contractors).
Our actions
Key actions during the reporting year
We continued environmental efficiencies at all facilities under OCI’s management, including those now divested, up until the point when ownership formally transferred to new owners. We currently have no significant financial resources allocated to the action plan, and no new financial resources have been allocated in 2025, as a result of our ongoing strategic review.
Key actions planned for the future
Once the strategic review is complete and a new strategy is established, we will update our actions, where applicable, to align with the revised direction for the remaining business. Specific deadlines for new undertakings have not been set due to the ongoing strategic review.
Our targets
In 2023, we reached our target of zero freshwater withdrawal in our water stressed sites. We have not set new targets due to the strategic review of our business and divestment of several facilities, which has changed the material structure of our business. Once our strategic review is completed and new strategy has been developed, we will update our targets, if applicable, in line with the revised direction for the remaining business.
2.3.1 Water consumption
The basis of preparation for the water consumption indicators can be found on page .
Indicator | Unit | Total | Continuing operations | Discontinued operations | |||
|---|---|---|---|---|---|---|---|
2025 | 2024 | 2025 | 2024 | 2025 | 2024 | ||
Water intensity | m3 consumed / USD net revenue | 0.007 | 0.037 | 0.007 | 0.009 | Not applicable | Not applicable |
Total water consumed | cubic meters | 7,675,761 | 35,779,086 | 7,090,000 | 8,700,000 | 585,761 | 27,079,086 |
The water consumption decreased by 79% compared to prior year. This reduction was primarily attributable to the divestitures of Fertiglobe and OCI Nitrogen Iowa in 2024, and OCI Methanol in 2025 (76% of total water consumption in 2024). For our continuing operations, water consumption decreased from 8,700,000 cubic meters in 2024 to 7,090,000 cubic meters in 2025, largely due to reduced utilisation rates resulting from planned maintenance activities and plant outages.
2.4 Resource use and circular economy
Our approach to resource use and circular economy
Our production processes in our continuing and discontinued facilities for nitrogen and methanol products produce limited by-products and are not waste intensive. Our distribution processes are primarily bulk shipments with minimal packaging required. The waste we produce primarily results from maintenance activities. Through active waste management programs, hazardous and non-hazardous waste are monitored and minimized. The primary source of hazardous waste is spent catalyst, which is disposed of safely as per local regulations. We continue to minimize potential waste leakage, effluents, or spills through primary and secondary containment systems that are regularly inspected.
Dependence on traditional feedstocks is subject to regulatory scrutiny and market shifts toward renewable alternatives, as renewable natural gas (RNG) and green hydrogen. We actively explored opportunities to replace traditional feedstocks with renewable alternatives, such as RNG and green hydrogen. Consequently, our divested operation in Texas is one of the largest biomethane (used in bio-methanol production) buyers in North America. The biomethane comes from waste sources such as landfills and waste water treatment plants. We acquired the rights to develop RNG capture and processing at the landfill of the city of Beaumont, Texas. This was our first upstream investment in RNG production.
While RNG production presents opportunities, it also involves material risks related to its capital-intensive nature, potential operational challenges and technology failures, regulatory barriers, and supply chain dependencies that could affect cost efficiency and feasibility.
Our policies, actions, and targets
Our policies
This section contains the policies we have established to manage our material impacts, risks and opportunities.
Environmental Policy
Our Environmental Policy reflects our commitment to be an environmental steward. For more specific information on our Environmental Policy, such as its scope of application, evaluation of its effectiveness, and related accountabilities, refer to section Our policies.
For the topic of resource use and circularity, our policy encompasses management of resource-related dependencies, impacts, risks, and opportunities, such as: resource efficiency (optimizing resource use across the value chain through innovative and sustainable practices); sustainable product innovation (expanding offerings like biofuels and chemicals derived from waste and by-products); process improvement (reducing consumption of energy, water, and raw materials); and circular economy principles (promoting recyclability and processes like waste-to-syngas to close resource loops and minimize waste).
Our actions
Key actions during the reporting year
We refer to Our approach to resource use and circular economy and Our actions for our actions to reduce waste, natural gas consumption and produce bio-methanol (bio-methanol activities divested). Due to the strategic review, we have not set any additional specific actions related to waste. We currently have no significant financial resources allocated to the action plan, and no new financial resources have been allocated in 2025, as a result of our ongoing strategic review.
Key actions planned for the future
Once the strategic review is complete and a new strategy is established, we will update our actions, where applicable, to align with the revised direction for the remaining business. Specific deadlines for new undertakings have not been set due to the ongoing strategic review.
Our targets
We have not set targets for resource use and circularity due to the strategic review of our business and divestment of several facilities, which has changed the material structure of our business. Once our strategic review is completed and new strategy has been developed, we will update our targets, if applicable, in line with the revised direction for the remaining business. Although we have not set targets, refer to our Sustainability Governance Framework for how we still track policy and action effectiveness on material impacts, risks, and opportunities, using defined processes, ambition, and progress indicators.
2.4.1 Products and materials
The basis of preparation for the products and materials indicator can be found on page .
Indicator | Unit | Total | Continuing operations | Discontinued operations | |||
|---|---|---|---|---|---|---|---|
2025 | 2024 | 2025 | 2024 | 2025 | 2024 | ||
The overall total weight of natural gas used | metric tonnes | 802,662 | 4,938,325 | 535,373 | 792,493 | 267,290 | 4,145,832 |
Our material resource inflow is natural gas, used as feedstock for the production of our nitrogen and methanol products in our discontinued operations.
The overall total weight of natural gas used decreased by 84% compared to prior year. This reduction was primarily attributable to the divestitures of Fertiglobe and OCI Nitrogen Iowa in 2024, and OCI Methanol in 2025. For our continuing operations, the overall total weight of natural gas used declined from 792,493 metric tonnes in 2024 to 535,373 metric tonnes in 2025, largely due to lower production volumes. The decline was mainly driven by reduced utilisation rates resulting from planned maintenance activities and plant outages.
2.4.2 Waste
The basis of preparation for the waste indicators can be found on page .
Indicator | Unit | Total | Continuing operations | Discontinued operations | |||
|---|---|---|---|---|---|---|---|
2025 | 2024 | 2025 | 2024 | 2025 | 2024 | ||
The total amount of waste generated | metric tonnes | 3,786 | 8,695 | 2,896 | 2,4081 | 890 | 6,2871 |
The total amount by weight diverted from disposal | metric tonnes | 1,210 | 3,093 | 577 | 1561 | 633 | 2,9371 |
Total hazardous waste diverted from disposal - preparation for reuse | metric tonnes | 41 | 13 | 41 | 10 | 0 | 2 |
Total non-hazardous waste diverted from disposal - preparation for reuse | metric tonnes | 0 | 4 | 0 | 0 | 0 | 4 |
Total hazardous waste diverted from disposal - recycling | metric tonnes | 214 | 273 | 2 | 0 | 212 | 273 |
Total non-hazardous waste diverted from disposal - recycling | metric tonnes | 446 | 1,235 | 90 | 691 | 355 | 1,1661 |
Total hazardous waste diverted from disposal - other recovery operations | metric tonnes | 266 | 1,423 | 201 | 3 | 65 | 1,420 |
Total non-hazardous waste diverted from disposal - other recovery operations | metric tonnes | 244 | 145 | 244 | 74 | 0 | 71 |
Total waste directed to disposal | metric tonnes | 2,576 | 5,602 | 2,318 | 2,252 | 258 | 3,351 |
Total hazardous waste directed to disposal - incineration | metric tonnes | 1,388 | 2,385 | 1,388 | 1,894 | 1 | 491 |
Total non-hazardous waste directed to disposal - incineration | metric tonnes | 194 | 126 | 194 | 123 | 0 | 3 |
Total hazardous waste directed to disposal - landfill | metric tonnes | 270 | 91 | 270 | 0 | 0 | 91 |
Total non-hazardous waste directed to disposal - landfill | metric tonnes | 325 | 2,791 | 68 | 24 | 257 | 2,766 |
Total hazardous waste directed to disposal - other disposal operations | metric tonnes | 252 | 43 | 252 | 43 | 0 | 0 |
Total non-hazardous waste directed to disposal - other disposal operations | metric tonnes | 147 | 166 | 147 | 166 | 0 | 0 |
Total hazardous waste | metric tonnes | 2,431 | 4,228 | 2,153 | 1,951 | 278 | 2,277 |
Total radioactive waste | metric tonnes | 0 | 0 | 0 | 0 | 0 | 0 |
Total non-hazardous waste | metric tonnes | 1,355 | 4,467 | 743 | 4561 | 612 | 4,0111 |
Total non-recycled waste | metric tonnes | 2,576 | 5,602 | 2,318 | 2,252 | 258 | 3,351 |
Total non-recycled waste | % | 68.0% | 64.4% | 80.1% | 93.5%1 | 28.9% | 53.3%1 |
- We classify OCIN and segment 'Other' as continuing operations, while Beaumont New Ammonia, OCI Methanol, OTE, and OAD are considered discontinued operations in FY 2025. We restated data as reported in the Annual Report 2024 by reclassifying OTE from continuing operations to discontinued operations. Reference is made to page for more information.
Our production processes for nitrogen and methanol products produce limited by-products and are not waste intensive. Our distribution processes are primarily bulk shipments with minimal packaging required. The waste we produce primarily results from maintenance activities. The primary source of hazardous waste is spent catalyst, which is disposed of safely as per local regulations.
For our continuing operations, total waste increased from 2,408 metric tonnes in 2024 to 2,896 metric tonnes in 2025, largely due to planned maintenance activities.
2.5 Non-GHG pollution in our operations
Our approach to non-GHG pollution in our operations
Our production processes result in non-GHG pollution including NOx, N2O, NH3, and substances of very high concern. These pollutants are regulated by the local governments where we operate. We remain committed in our continuing operations to, at minimum, comply with local regulations by implementing the best available technologies for pollution controls in our processes.
The European Commission concluded that unprocessed melamine is a Substance of Very High Concern (SVHC) for inclusion in the REACH Candidate List due to scientific evidence of probable serious effects to human health and the environment which gives rise to an equivalent level of concern to PMT (Persistent, Mobile, Toxic) properties in the environment. The inclusion in the Candidate List brings immediate obligations. These obligations, which are effective from the date of inclusion, refer not only to the listed substances on their own or in mixtures, but also to their presence in products. As a producer of melamine, we provide our customers and partners with an updated safety data sheet (SDS) with Section 15 updated to reflect the identification of the substance as an SVHC.
Our policies, actions, and targets
Our policies
This section contains the policies we have established to manage our material impacts, risks and opportunities.
Environmental Policy
Our Environmental Policy reflects our commitment to be an environmental steward. For more specific information on our Environmental Policy, such as its scope of application, evaluation of its effectiveness, and related accountabilities, please refer to section Our policies.
For the topic of pollution in our operations, the policy encompasses management of pollution-related dependencies, impacts, risks, and opportunities, such as pollutant reduction (eliminating NOx and other harmful emissions and pollutants), control measures (preventing spills and leakages), regulatory compliance, continuous improvement (enhancing plant reliability to reduce emissions and contamination), and resource efficiency (promoting renewable energy and reducing waste associated with resource extraction).
In line with our commitment to leadership in product and HSE stewardship, during 2020 the Board formally ratified our policy to not produce, sell or trade solid ammonium nitrate (AN) given the product’s public safety concerns. This also allows us to ensure that our business trajectory is in line with global insurance and directors’ liability advice, which is increasingly stringent around AN. With ever-increasing concerns surrounding AN, the product could be substituted by much safer urea or other nitrates going forward.
Our actions
Key actions during the reporting year
Reference is made to Our approach to non-GHG pollution in our operations for our actions during 2025. We currently have no significant financial resources allocated to the action plan, and no new financial resources have been allocated in 2025 as a result of our ongoing strategic review.
Key actions planned for the future
Once the strategic review is complete and a new strategy is established, we will update our actions, where applicable, to align with the revised direction for the remaining business. Specific deadlines for new undertakings have not been set due to the ongoing strategic review.
Our targets
We have not set targets for non-GHG pollution in our operations due to the strategic review of our business and divestment of several facilities, which has changed the material structure of our business. Once our strategic review is completed and new strategy has been developed, we will update our targets, if applicable, in line with the revised direction for the remaining business. Although we have not set targets, please refer to our Sustainability Governance Framework to see how we still track policy and action effectiveness on material impacts, risks, and opportunities, using defined processes, ambition, and progress indicators.
2.5.1 Air pollution
The basis of preparation for the air pollution indicators can be found on page .
Indicator | Unit | Total | Continuing operations | Discontinued operations | |||
|---|---|---|---|---|---|---|---|
2025 | 2024 | 2025 | 2024 | 2025 | 2024 | ||
NOx | metric tonnes | 360 | 2,231 | 360 | 639 | 0 | 1,591 |
N2O | metric tonnes | 37 | 27 | 37 | 27 | 0 | 0 |
NH3 | metric tonnes | 79 | 1,144 | 79 | 94 | 0 | 1,050 |
Total NOx emissions decreased by 84% and total NH3 emissions decreased by 93% compared to prior year. These reductions were primarily attributable to the divestitures of Fertiglobe and OCI Nitrogen Iowa in 2024, and OCI Methanol in 2025. For our continuing operations, NOx emissions declined from 639 metric tonnes in 2024 to 360 metric tonnes in 2025, and NH3 emissions declined from 94 metric tonnes to 79 metric tonnes over the same period, largely due to lower production volumes. The increase in N2O emissions within continuing operations was mainly the result of reduced efficiency on an annual basis.
2.5.2 Substances of very high concern
The basis of preparation for the substances of very high concern (SVHC) indicators can be found on page .
Indicator | Unit | Total | Continuing operations | Discontinued operations | |||
|---|---|---|---|---|---|---|---|
2025 | 2024 | 2025 | 2024 | 2025 | 2024 | ||
Substances of very high concern that are generated during the production | metric tonnes | 51,870 | 95,584 | 51,870 | 95,584 | 0 | 0 |
Substances of very high concern that left the facilities as emissions | metric tonnes | 237 | 316 | 237 | 316 | 0 | 0 |
Substances of very high concern that left the facilities as products | metric tonnes | 60,140 | 88,039 | 60,140 | 88,039 | 0 | 0 |
Total | Carcinogenic | |
|---|---|---|
2025 | ||
Substances of very high concern that are generated during the production | 51,870 | 51,870 |
Substances of very high concern that left the facilities as emissions | 237 | 237 |
Substances of very high concern that left the facilities as products | 60,140 | 60,140 |
The decrease in production, emissions and sales volumes related to melamine is largely due to lower production volumes. The decline was mainly driven by reduced utilisation rates resulting from planned maintenance activities and plant outages.
2.6 EU Taxonomy
The European Commission has established the EU Taxonomy as an enabler to scale up sustainable investments and make the EU carbon neutral by 2050. To define what is ‘sustainable’, the European Commission has developed a catalog of economic activities, each with criteria to determine if they substantially contribute towards a sustainable economy – known as the EU Taxonomy. Companies across diverse sectors, supply chains, and asset classes must use this classification system to assess if their business activities are sustainable according to the Taxonomy.
For FY 2025, we have disclosed eligibility and alignment on the six environmental objectives (climate change mitigation; climate change adaptation; sustainable use and protection of water and marine resources; transition to a circular economy; pollution prevention and control; and protection and restoration of biodiversity and ecosystems), in our total turnover, capital expenditures (CapEx) and operating expenditures (OpEx). An economic activity is Taxonomy-eligible if it fits the description of an activity detailed in the Climate Delegated Act (Annex I and Annex II) and in the Environmental Delegated Act (Annex I to Annex V) supplementing the EU Taxonomy Regulation. If an economic activity is not described in the Delegated Acts, it is not Taxonomy-eligible. An economic activity is Taxonomy-aligned when the activity is eligible and complies with all technical screening criteria and minimum safeguards.
The current available definitions as included in the EU Taxonomy are broadly formulated, which leads to companies having to interpret how this applies to its business activities and the impact thereof on eligibility and alignment. To our knowledge and understanding, we have applied judgement, interpretations and assumptions based on current available information to date. Future guidance could result in more accurate definitions and other decision-making in meeting reporting obligations that may come into force, which could impact future EU Taxonomy reporting.
Accounting principles
We have followed the same accounting principles as in our Financial statements, unless stated otherwise.
Turnover
Turnover eligibility and alignment is calculated in accordance with the definition in Article 8 of the EU Taxonomy: the proportion of turnover from eligible and aligned activities (numerator) of total turnover (denominator). The turnover line (USD 1,086 million), as included in the Consolidated statement of profit or loss and other comprehensive income, is the equivalent of turnover under the EU Taxonomy (continuing operations). See also Note 28 to the Consolidated statement of profit or loss and other comprehensive income.
OCI also reports “Other income”. This income is presented as a separate line in the Consolidated statement of profit or loss and other comprehensive income and as such is not considered to meet the definition of turnover under the EU Taxonomy. Other income includes gain from sale of associates, as well as other income.
Discontinued operations
Revenue from discontinued operations is presented separately from continuing operations (IFRS 5.33). Therefore, revenue from discontinued operations cannot be included in the revenue line item as required by IAS 1.82(a) and is not included in the Turnover KPI.
CapEx
CapEx eligibility and alignment is calculated in accordance with the definition in Article 8 of the EU Taxonomy: the proportion of CapEx related to EU Taxonomy eligible and aligned economic activities (numerator) of total CapEx (denominator). CapEx includes additions to tangible, intangible and right of use assets during the financial year. A reconciliation of the additions included in the financial statements (Note 7 Property, plant and equipment and right-of-use assets, and Note 8 Goodwill and other intangible assets of the Consolidated financial statements) to the total CapEx under the EU Taxonomy is included below:
$ millions | Total |
|---|---|
Additions to property, plant and equipment (continuing & discontinued operations) (Note 7) | 110.3 |
Additions to intangible assets (continuing & discontinued operations) (Note 8) | 0.0 |
Additions to right-of-use assets (continuing & discontinued operations) (Note 7) | 9.3 |
CapEx used for EU Taxonomy purposes | 119.6 |
Discontinued operations
The assets that are part of non-current assets or disposal groups classified as held for sale, or a discontinued operation, are reclassified according to IFRS 5 and reported together in a separate balance sheet item. Until the date of IFRS 5 classification – or in the case of non-current assets or disposal groups classified as held for sale, also after this date – additions to the balance sheet that generally meet the CapEx definition can be made within the financial year. In the case of non-current assets, or disposal groups classified as held for sale and discontinued operation, all additions that meet the CapEx definition are taken into account in the calculation of the CapEx KPI.
Assumptions
At sites where both Taxonomy-eligible and Taxonomy-non-eligible economic activities are carried out (mixed sites), the Taxonomy-eligible portion of CapEx is determined on the basis of actual production of products related to the Taxonomy-eligible economic activities to appropriately reflect our production process.
In order to avoid double counting in the CapEx KPI, we counted the CapEx related to Nitric Acid that we already considered under CCM 3.15 – Manufacture of anhydrous ammonia; only once, as this is solely intercompany.
OpEx
OpEx eligibility and alignment is calculated in accordance with the definition in Article 8 of the EU Taxonomy: the proportion of OpEx related to EU Taxonomy eligible and aligned economic activities (numerator) of total direct non-capitalised costs that relate to research and development; building renovation measures; short-term lease; maintenance and repair; and any other direct expenditures relating to the day-to-day servicing of assets of property, plant and equipment by OCI or third parties to whom activities are outsourced that are necessary to ensure the continued and effective functioning of such assets (denominator). This definition is narrower than the accounting definition of operating expenses. This includes the following:
The volume of non-capitalised leases was determined in accordance with IFRS 16 and includes expenses for short-term leases (Note 7 Property, plant and equipment and right-of-use assets).
Maintenance and repair and other direct expenditures relating to the day-to-day servicing of assets of property, plant and equipment were determined based on the maintenance and repair costs allocated to the Taxonomy-eligible economic activities. The related cost items can be found in various line items in the Consolidated statement of profit or loss and other comprehensive income ('Cost of sales' and 'Selling, general and administrative expenses').
Discontinued operations
The OpEx of the discontinued operations were taken into account in the calculation of the OpEx KPI, in line with the calculation of the CapEx KPI.
Assumptions
At sites where both Taxonomy-eligible and Taxonomy-non-eligible economic activities are carried out, the Taxonomy-eligible portion of OpEx is determined on the basis of actual production of products related to the Taxonomy-eligible economic activities to appropriately reflect our production process.
In order to avoid double counting in the OpEx KPI, we counted the OpEx related to Nitric Acid that we already considered under CCM 3.15 – Manufacture of anhydrous ammonia; only once, as this is solely intercompany.
Taxonomy eligibility
To determine taxonomy eligibility, we first identified the activities relevant to OCI as defined by the Regulation (EU) 2020/852 as supplemented with Commission Delegated Regulation (EU) 2021/2139, Commission Delegated Regulation (EU) 2021/2178, Commission Delegated Regulation (EU) 2023/2485 and Commission Delegated Regulation (EU) 2023/2486), by conducting a review of all products, facilities, and investments. We determined that our eligible activities are categorized under activity 3.15 – Manufacture of anhydrous ammonia (NACE code C20.15) for the turnover KPI, and 3.15 – Manufacture of anhydrous ammonia (NACE code C20.15) and 7.1 – Construction of new buildings (NACE code CF41.2) for the CapEx and OpEx KPIs in 2024, and activity 3.15 – Manufacture of anhydrous ammonia (NACE code C20.15) for the turnover, CapEx and OpEx KPIs in 2025 due to the divestment of Beaumont New Ammonia. These activities could be placed under multiple objectives. The multi-objective tables have been added, as well as turnover, CapEx and OpEx tables. The activities are labelled with the eligible objectives, to avoid double counting.
The following activities were considered as part of the Taxonomy-eligibility assessment:
Economic activity | % of turnover per 31/12/25 | Activity |
|---|---|---|
Manufacture of anhydrous ammonia | 30% | CCM & CCA 3.15 Manufacture of anhydrous ammonia |
Manufacture of urea / urea ammonium nitrate | 17% | Not in scope of the EU Taxonomy |
Manufacture of diesel exhaust fluid (DEF) | 3% | Not in scope of the EU Taxonomy |
Manufacture of calcium ammonium nitrate (CAN) | 37% | Not in scope of the EU Taxonomy |
Manufacture of melamine | 11% | Not in scope of the EU Taxonomy |
Manufacture of ammonium sulfate | 2% | Not in scope of the EU Taxonomy |
The manufacture of methanol, urea and other downstream products was assessed and does not fall under the EU Taxonomy’s description of activities and has therefore been deemed taxonomy non-eligible.
Categories considered, but not eligible for OCI include the following:
CE 2.4 Treatment of hazardous waste: OCI activities do not meet the description of the activity.
Turnover
Please note that we produce Nitric Acid. As this is only for intercompany purposes (no external turnover), Nitric Acid was not taken into account in the Turnover KPI.
The proportion of Taxonomy-eligible turnover (30%) slightly decreased compared to 2024 (36%), reflecting the lower share of revenues generated from ammonia products.
CapEx
The proportion of Taxonomy-eligible CapEx (57%) significantly decreased compared to 2024 (82%). This is mainly due to the divestment of Beaumont New Ammonia in 2024 (capital expenditure for Beaumont New Ammonia was categorized under activity 7.1 – Construction of new buildings).
OpEx
The proportion of Taxonomy-eligible OpEx (30%) slightly increased compared to 2024 (27%), in line with the higher share of revenues generated from ammonia products.
Taxonomy alignment
Eligible activities are taxonomy aligned if they meet the following criteria:
Substantially contribute to one or more of the environmental objectives of the EU Taxonomy
Do No Significant Harm (DNSH) to any of the other environmental objectives
Comply with minimum social safeguards (MS)
We have evaluated the eligible activities in relation to the substantial contribution, the DNSH and MS criteria. For FY 2025, we do not report Taxonomy-aligned activities as we do not yet meet all substantial contribution, DNSH and MS criteria. We refer to Our strategy in this Annual Report for our low carbon growth initiatives.
Alignment assessment for the economic activities CCM & CCA 3.15 – Manufacture of anhydrous ammonia
We assessed the substantial contribution criteria for the economic activities. If passed, we assessed the DNSH criteria. If it did not pass, the economic activity is not aligned.
Substantial contribution assessment for the economic activity CCM & CCA 3.15 – Manufacture of anhydrous ammonia
CCM 3.15: We assessed greenhouse gas (GHG) emissions within the EU Taxonomy threshold. We concluded, that for our current ammonia production, we do not yet meet all the substantial contribution criteria as our current production relates mainly to conventional grey ammonia. We expect to increase our sustainable product portfolio for our continuing operations. Please refer to Our strategy in this Annual Report for our low carbon growth initiatives.
CCA 3.15: We have not identified physical adaptation solutions yet as part of a climate risk and vulnerability assessment yet. Therefore, the economic activity is not aligned.
Substantial contribution assessment for the economic activity CE 7.2, CCM & CCA 3.2 – Renovation of existing buildings
CE 7.2: We assessed the substantial contribution criteria for circular economy and concluded that we do not yet meet all requirements. At this stage, we have not demonstrated that the renovation activities meet all substantial contribution criteria for activity CE 7.2. As a result, the economic activity is not aligned.
CCM 3.2: We assessed the substantial contribution criteria for climate change mitigation and concluded that we do not yet meet all requirements. At this stage, we have not demonstrated that renovation activities achieve a minimum 30% reduction in primary energy demand (PED) or comply with national requirements for major renovations. As a result, the economic activity is not aligned.
CCA 3.2: We have not identified physical adaptation solutions yet as part of a climate risk and vulnerability assessment yet. Therefore, the economic activity is not aligned.
Do No Significant Harm for the economic activity CCM & CCA 3.15 – Manufacture of anhydrous ammonia
Climate change mitigation: We assessed the do no significant harm criteria for climate change mitigation and concluded we do not yet meet all criteria, as we have not yet identified physical adaptation solutions as part of a climate risk and vulnerability assessment.
Climate change adaptation: We assessed the do no significant harm criteria for climate change adaptation and concluded we do not yet meet the criteria, as we have not yet performed a climate risk and vulnerability assessment as required by appendix A: Generic criteria for DNSH to climate change adaptation.
The sustainable use and protection of water and marine resources: We assessed the do no significant harm criteria for sustainable use and protection of water and marine resources and concluded we do not yet meet all criteria, as we have not yet performed an environmental impact assessment as required by appendix E: Generic criteria for DNSH to sustainable use and protection of water and marine resources.
The transition to a circular economy: We assessed the do no significant harm criteria for the transition to a circular economy and concluded we do not yet meet all the criteria, as not all emissions are within, or lower than, the emission levels associated with the best available techniques (BAT-AEL) ranges, as set out in the latest relevant best available techniques (BAT) conclusions.
Pollution prevention and control: We assessed the do no significant harm criteria for pollution prevention and control and concluded we do not yet meet all criteria, as not all emissions are within or lower than the emission levels associated with the best available techniques (BAT-AEL) ranges, as set out in the latest relevant best available techniques (BAT) conclusions.
The protection and restoration of biodiversity and ecosystems: We assessed the do no significant harm criteria for the protection and restoration of biodiversity and ecosystems and concluded we do not yet meet all the criteria, as we have not yet performed an environmental impact assessment as required by appendix D: Generic criteria for DNSH to protection and restoration of biodiversity and ecosystems.
Do No Significant Harm for the economic activity CE 7.2, CCM & CCA 3.2 – Renovation of existing buildings
Climate change mitigation: We assessed the do no significant harm criteria for climate change mitigation and concluded we meet the criteria, as the building is not dedicated to extraction, storage, transport or manufacture of fossil fuels.
Climate change adaptation: We assessed the do no significant harm criteria for climate change adaptation and concluded we do not yet meet the criteria, as we have not yet performed a climate risk and vulnerability assessment as required by appendix A: Generic criteria for DNSH to climate change adaptation.
The sustainable use and protection of water and marine resources: We assessed the do no significant harm criteria for sustainable use and protection of water and marine resources and concluded we do not yet meet all criteria, as we have not yet performed an environmental impact assessment as required by appendix E: Generic criteria for DNSH to sustainable use and protection of water and marine resources.
The transition to a circular economy: We assessed the do no significant harm criteria for the transition to a circular economy and concluded we do not yet meet the criteria, as we have not demonstrated that at least 70% (by weight) of non‑hazardous construction and demolition waste will be prepared for reuse, recycling, or other material recovery.
Pollution prevention and control: We assessed the do no significant harm criteria for pollution prevention and control and concluded we do not yet meet all criteria, as we have not confirmed that construction materials used in the renovation comply with the criteria set out in appendix C: Generic criteria for DNSH to pollution prevention and control regarding use and presence of chemicals.
Minimum social safeguards
Human Rights: Our compliance framework ensures responsible business conduct in alignment with key international principles, including the International Bill of Human Rights, OECD Guidelines for Multinational Enterprises, the ILO’s Declaration on Fundamental Principles and Rights at Work, the UN Guiding Principles on Business and Human Rights, and UNICEF’s guidelines. Our policies and procedures are designed to uphold compliance with all applicable laws and regulations. These include our Code of Conduct, Business Partner Code of Conduct, Whistleblower Policy, Whistleblower Protection Policy, Data Privacy and Data Protection Policy, Sanctions Policy, and Human Rights Policy. As of 2025, no serious human rights violations or incidents related to our workforce or our upstream and downstream value chain were reported.
Corruption: Our policies on corruption and bribery are embedded in our Code of Conduct, Business Partner Code of Conduct, and Anti-Bribery and Anti-Corruption Policy. Additionally, we reinforce awareness and compliance through mandatory annual e-learning training for all employees. In 2025, no convictions for violations of anti-corruption or anti-bribery laws were reported.
Taxation: We are deeply committed to the communities in which we operate and strive to be a responsible corporate citizen, acting with transparency, integrity, and accountability in all our dealings. We foster strong relationships with key internal and external stakeholders, including tax authorities, and manage our tax affairs in a way that aligns with OCI’s CARE values. A fundamental principle is that all tax-related activities must fully comply with both the letter and spirit of applicable tax laws and regulations. This commitment is outlined in our Tax Management Policy.
Fair Competition: We conduct our business in full compliance with all relevant competition laws and regulations, considering the legal frameworks of jurisdictions where our activities could have competitive implications. This commitment is outlined in our Competition Policy.
Reference is made to Our approach to responsible business practices for our commitments and performance.
Discontinued operations
In 2024, we closed transactions to divest three of our operations. The Methanol business was divested to Methanex in June 2025.
At the end of 2025, OCI further announced the divestment of OCI Ammonia Holding B.V., which owns both OCI’s ammonia import and storage terminal in Rotterdam (OTE) and OCI’s ammonia distribution platform, serving third party off-site European customers (OAD). We refer to Strategic reorientation for more information.
The EU Taxonomy reporting is impacted by these transactions as they are classified as discontinued operations. Please refer to Accounting principles for more information.
CapEx plans
A project at a production asset is included in our CapEx plan if there is current year economic activity to either expand our Taxonomy-aligned economic activities or to upgrade Taxonomy-eligible economic activities to Taxonomy-aligned within five years. Currently, we do not have any CapEx plans to either expand our Taxonomy-aligned economic activities or to upgrade Taxonomy-eligible economic activities to Taxonomy-aligned within five years.
Turnover
Financial year 2025 | 2025 | Substantial contribution criteria | DNSH criteria ('Does Not Significantly Harm’) | ||||||||||||||||
|---|---|---|---|---|---|---|---|---|---|---|---|---|---|---|---|---|---|---|---|
Economic activities (1) | Code(s) (2) | Turnover (3) | Proportion of turnover 2025 (4) | Climate change mitigation (5) | Climate change adaptation (6) | Water and marine resources (7) | Circular economy (8) | Pollution (9) | Biodiversity and ecosystems (10) | Climate change mitigation (11) | Climate change adaptation (12) | Water and marine resources (13) | Circular economy (14) | Pollution (15) | Biodiversity and ecosystems (16) | Minimum safeguards (17) | Proportion of Taxonomy-aligned | Category enabling activity (19) | Category transitional activity (20) |
$M | % | Y; N; | Y; N; | Y; N; | Y; N; | Y; N; | Y; N; | Y/N | Y/N | Y/N | Y/N | Y/N | Y/N | Y/N | % | E | T | ||
A. TAXONOMY-ELIGIBLE ACTIVITIES | |||||||||||||||||||
A.1. Environmentally sustainable activities (Taxonomy-aligned) | |||||||||||||||||||
No activities | 0 | 0% | 0% | ||||||||||||||||
Turnover of environmentally sustainable activities (Taxonomy-aligned) (A.1) | 0 | 0% | 0% | ||||||||||||||||
A.2. Taxonomy-eligible but not environmentally sustainable activities (not Taxonomy-aligned activities) | |||||||||||||||||||
EL; | EL; | EL; | EL; | EL; | EL; | ||||||||||||||
Manufacture of anhydrous ammonia | CCA3.15 | 321 | 30% | EL | EL | N/EL | N/EL | N/EL | N/EL | 36% | |||||||||
Turnover of Taxonomy-eligible but not environmentally sustainable activities (not Taxonomy-aligned activities) (A.2) | 321 | 30% | 36% | ||||||||||||||||
Total (A.1 + A.2) | 321 | 30% | 36% | ||||||||||||||||
B. TAXONOMY-NON-ELIGIBLE ACTIVITIES | |||||||||||||||||||
Turnover of Taxonomy-non-eligible activities | 765 | 70% | |||||||||||||||||
Total (A + B) | 1,086 | 100% | |||||||||||||||||
- Y – Yes, Taxonomy-eligible and Taxonomy-aligned activity with the relevant environmental objective
N – No, Taxonomy-eligible but not Taxonomy-aligned activity with the relevant environmental objective
N/EL – Not eligible, Taxonomy-non-eligible activity for the relevant environmental objective - EL – Taxonomy-eligible activity for the relevant objective
N/EL – Not eligible, Taxonomy-non-eligible activity for the relevant environmental objective
CapEx
Financial year 2025 | 2025 | Substantial contribution criteria | DNSH criteria ('Does Not Significantly Harm’) | ||||||||||||||||
|---|---|---|---|---|---|---|---|---|---|---|---|---|---|---|---|---|---|---|---|
Economic activities (1) | Code(s) (2) | Absolute CapEx (3) | Proportion of turnover 2025 (4) | Climate change mitigation (5) | Climate change adaptation (6) | Water and marine resources (7) | Circular economy (8) | Pollution (9) | Biodiversity and ecosystems (10) | Climate change mitigation (11) | Climate change adaptation (12) | Water and marine resources (13) | Circular economy (14) | Pollution (15) | Biodiversity and ecosystems (16) | Minimum safeguards (17) | Proportion of Taxonomy-aligned | Category enabling activity (19) | Category transitional activity (20) |
$M | % | Y; N; | Y; N; | Y; N; | Y; N; | Y; N; | Y; N; | Y/N | Y/N | Y/N | Y/N | Y/N | Y/N | Y/N | % | E | T | ||
A. TAXONOMY-ELIGIBLE ACTIVITIES | |||||||||||||||||||
A.1. Environmentally sustainable activities (Taxonomy-aligned) | |||||||||||||||||||
No activities | 0 | 0% | 0% | ||||||||||||||||
CapEx of environmentally sustainable activities (Taxonomy-aligned) (A.1) | 0 | 0% | 0% | ||||||||||||||||
A.2. Taxonomy-eligible but not environmentally sustainable activities (not Taxonomy-aligned activities) | |||||||||||||||||||
EL; | EL; | EL; | EL; | EL; | EL; | ||||||||||||||
Manufacture of anhydrous ammonia | CCA3.15 | 67 | 56% | EL | EL | N/EL | N/EL | N/EL | N/EL | 7% | |||||||||
Renovation of existing buildings | CE7.2 | 1 | 1% | EL | EL | N/EL | EL | N/EL | N/EL | 0% | |||||||||
Construction of new buildings | CE3.1 | 0 | 0% | 75% | |||||||||||||||
CapEx of Taxonomy-eligible but not environmentally sustainable activities (not Taxonomy-aligned activities) (A.2) | 68 | 57% | 82% | ||||||||||||||||
A. CapEx of Taxonomy-eligible activities (A.1+A.2) | 68 | 57% | 82% | ||||||||||||||||
B. TAXONOMY-NON-ELIGIBLE ACTIVITIES | |||||||||||||||||||
CapEx of Taxonomy-non-eligible activities | 51 | 43% | |||||||||||||||||
Total (A + B) | 120 | 100% | |||||||||||||||||
- Y – Yes, Taxonomy-eligible and Taxonomy-aligned activity with the relevant environmental objective
N – No, Taxonomy-eligible but not Taxonomy-aligned activity with the relevant environmental objective
N/EL – Not eligible, Taxonomy-non-eligible activity for the relevant environmental objective - EL – Taxonomy-eligible activity for the relevant objective
N/EL – Not eligible, Taxonomy-non-eligible activity for the relevant environmental objective
OpEx
Financial year 2025 | 2025 | Substantial contribution criteria | DNSH criteria ('Does Not Significantly Harm’) | ||||||||||||||||
|---|---|---|---|---|---|---|---|---|---|---|---|---|---|---|---|---|---|---|---|
Economic activities (1) | Code(s) (2) | Absolute OpEx (3) | Proportion of turnover 2025 (4) | Climate change mitigation (5) | Climate change adaptation (6) | Water and marine resources (7) | Circular economy (8) | Pollution (9) | Biodiversity and ecosystems (10) | Climate change mitigation (11) | Climate change adaptation (12) | Water and marine resources (13) | Circular economy (14) | Pollution (15) | Biodiversity and ecosystems (16) | Minimum safeguards (17) | Proportion of Taxonomy-aligned | Category enabling activity (19) | Category transitional activity (20) |
$M | % | Y; N; | Y; N; | Y; N; | Y; N; | Y; N; | Y; N; | Y/N | Y/N | Y/N | Y/N | Y/N | Y/N | Y/N | % | E | T | ||
A. TAXONOMY-ELIGIBLE ACTIVITIES | |||||||||||||||||||
A.1. Environmentally sustainable activities (Taxonomy-aligned) | |||||||||||||||||||
No activities | 0 | 0% | 0% | ||||||||||||||||
OpEx of environmentally sustainable activities (Taxonomy-aligned) (A.1) | 0 | 0% | 0% | ||||||||||||||||
A.2. Taxonomy-eligible but not environmentally sustainable activities (not Taxonomy-aligned activities) | |||||||||||||||||||
EL; | EL; | EL; | EL; | EL; | EL; | ||||||||||||||
Manufacture of anhydrous ammonia | CCA3.15 | 14 | 30% | EL | EL | N/EL | N/EL | N/EL | N/EL | 27% | |||||||||
OpEx of Taxonomy-eligible but not environmentally sustainable activities (not Taxonomy-aligned activities) (A.2) | 14 | 30% | 27% | ||||||||||||||||
A. OpEx of Taxonomy eligible activities (A.1+A.2) | 14 | 30% | 27% | ||||||||||||||||
B. TAXONOMY-NON-ELIGIBLE ACTIVITIES | |||||||||||||||||||
OpEx of Taxonomy-non-eligible activities | 33 | 70% | |||||||||||||||||
Total (A + B) | 47 | 100% | |||||||||||||||||
- Y – Yes, Taxonomy-eligible and Taxonomy-aligned activity with the relevant environmental objective
N – No, Taxonomy-eligible but not Taxonomy-aligned activity with the relevant environmental objective
N/EL – Not eligible, Taxonomy-non-eligible activity for the relevant environmental objective - EL – Taxonomy-eligible activity for the relevant objective
N/EL – Not eligible, Taxonomy-non-eligible activity for the relevant environmental objective
Taxonomy-aligned turnover per objective | Turnover of Taxonomy-eligible but not environmentally sustainable activities per objective | |
|---|---|---|
CCM | 0% | 30% |
CCA | 0% | 30% |
WTR | 0% | 0% |
PPC | 0% | 0% |
CE | 0% | 0% |
BIO | 0% | 0% |
Taxonomy-aligned CapEx per objective | CapEx of Taxonomy-eligible but not environmentally sustainable activities per objective | |
|---|---|---|
CCM | 0% | 57% |
CCA | 0% | 57% |
WTR | 0% | 0% |
PPC | 0% | 0% |
CE | 0% | 1% |
BIO | 0% | 0% |
Taxonomy-aligned OpEx per objective | OpEx of Taxonomy-eligible but not environmentally sustainable activities per objective | |
|---|---|---|
CCM | 0% | 30% |
CCA | 0% | 30% |
WTR | 0% | 0% |
PPC | 0% | 0% |
CE | 0% | 0% |
BIO | 0% | 0% |
Nuclear and fossil gas related activities | Yes/No | |
|---|---|---|
Nuclear energy-related activities | ||
1 | The undertaking carries out, funds or has exposures to research, development, demonstration and deployment of innovative electricity generation facilities that produce energy from nuclear processes with minimal waste from the fuel cycle. | No |
2 | The undertaking carries out, funds or has exposures to construction and safe operation of new nuclear installations to produce electricity or process heat, including for the purposes of district heating or industrial processes such as hydrogen production, as well as their safety upgrades, using best available technologies. | No |
3 | The undertaking carries out, funds or has exposures to safe operation of existing nuclear installations that produce electricity or process heat, including for the purposes of district heating or industrial processes such as hydrogen production from nuclear energy, as well as their safety upgrades. | No |
Fossil gas-related activities | ||
4 | The undertaking carries out, funds or has exposures to construction or operation of electricity generation facilities that produce electricity using fossil gaseous fuels. | No |
5 | The undertaking carries out, funds or has exposures to construction, refurbishment, and operation of combined heat/cool and power generation facilities using fossil gaseous fuels. | No |
6 | The undertaking carries out, funds or has exposures to construction, refurbishment and operation of heat generation facilities that produce heat/cool using fossil gaseous fuels. | No |
3 Social information
3.1 Health, safety and wellbeing
Our approach to health, safety & wellbeing
As described on page , our Operational Excellence Program is founded on three key pillars that are tightly interlinked: Process Safety, Reliability and Energy Efficiency. Process safety enables reliability, which in turn enables energy efficiency to achieve lower GHG emissions.
Our approach focuses on the following health, safety and environment (HSE) priorities:
Commitment to zero injuries.
Focus on operational excellence.
Continuous improvement of our processes.
Health and wellness of all employees.
The HSE Framework provides our continuing and discontinued sites, employees, and contractors with a set of standards and procedures based on industry standards and global best practices. Our HSE policies and standards apply to all employees and contractors, regardless of employment type.
Each facility additionally implements tailored initiatives and supplemental procedures to enhance their HSE standards depending on their specific needs and technologies.
The Board, which is also responsible for supervising the Group's overall HSE performance, receives quarterly updates. The HSE organization comprises local teams which are responsible for HSE compliance, monitoring, and reporting.
The Executive Committee reviews each site's monthly HSE performance and trends with local site leadership during the monthly business review. In addition, HSE audits periodically assess the implementation of OCI’s HSE policy.
Commitment to zero injuries
Safety is a core focus in every aspect of our operations. Our goal is to achieve leadership in safety and occupational health standards by fostering a culture of zero injuries, and continuously improving health, safety and environmental monitoring, prevention and reporting.
We have integrated this goal into our corporate values, and into the programs and policies. Safety is an integral part of plant operation, quality control, cost reduction and efficiency, and we are committed to providing resources to enable this.
We take every incident seriously and conduct a full investigation with an internal incident report for each case. We are committed to enforcing a culture of zero injuries, where every person is safe at all times. We are proud of every employee's and contractor's diligence and attention to safety. Accordingly, we maintain awareness activities for all employees and contractors as part of our training program. We will continue to promote a strong safety culture and focus on targeting zero injuries across our organization, both with our own employees and with contractors.
Focus on operational excellence
We promote excellence in every aspect of our operations to ensure a safe and healthy work environment, protect our communities, and optimize operational costs – see our operational excellence graph in section Our strategy for further details. We continuously train all employees to maintain our focus on operational excellence.
The process safety management framework which we implement across our sites was developed based on international industry best practices and standards including the U.S. OSHA Process Safety Management regulations and AIChE Technology Alliance – Center for Chemical Process Safety (CCPS) information. Our Process Safety Management (PSM) is further enhanced by case studies on industry incidents and lessons learned and is based on learnings from underlying leading KPIs.
We track Process Safety Incidents (PSI’s) according to the API classification and take all incidents very seriously. All PSIs are reviewed with a root-cause analysis. We continue to work diligently to reduce the number of PSIs every year.
Continuous improvement of our processes
We regularly assess our HSE management systems to ensure our processes enable operational excellence. We do so through internal and external HSE audits, insurance reviews, performance reviews, and incident analysis.
Health and wellbeing of all employees
Occupational health and general wellbeing are part of our overall HSE management, and we implement organization-wide wellness programs to support the physical and mental health of everyone working at OCI.
Our policies, actions, and targets
Our policies
This section contains the policies we have established to manage our material impacts, risks and opportunities.
Health and Safety Policy
We maintain a set of Health & Safety standards covering various topics, including but not limited to: Working at Height, Learning from Incidents, Self-Assessment of the Site’s HSE Management System, and Personal Protective Equipment. These standards are designed to ensure that all work is carried out safely, efficiently, and in compliance with regulatory and organisational requirements.
The Standards cover all OCI facilities and joint ventures where OCI has managerial control, or where it has been agreed that OCI Standards will be applied. The scope includes all activities through the operational chain, from purchasing of materials to manufacturing and distribution of products.
These standards are internal and readily accessible to our employees via the intranet or as printed copies available on-site. The ultimate responsibility for the oversight and implementation of these standards lies with the CEO.
Human Rights Policy
Our Human Rights Policy reflects our commitment to respecting and promoting human rights and safe working conditions, aligning with international standards and codified in our Code of Conduct as part of our Compliance Framework. Our human rights principles are informed by global human rights standards, including the International Bill of Human Rights, the International Labor Organization’s Declaration on Fundamental Principles and Rights at Work, the United Nations Guiding Principles on Business and Human Rights, and the United Nations International Children’s Emergency Fund (UNICEF).
We are committed to conducting business responsibly, efficiently, transparently, and with integrity and respect, promoting labor rights and equal treatment for all employees. Our employees are treated equally regardless of race, gender, or personal beliefs, ensuring fairness in recruitment, retention, training, and promotion.
We maintain open lines of communication and respect employees' rights to associate freely with lawful organisations or unions without fear of reprisal, intimidation or harassment. Suspected misconduct, including discrimination, or human rights issues can be reported through an independent helpline, ensuring protection from retaliation and fostering accountability.
We prohibit forced labor, human trafficking, slavery, and child labor in accordance with international laws and standards. We ensure a safe and healthy workplace by implementing international safety standards and fostering a zero-injury culture across all production facilities. We do not tolerate harassment, discrimination, or bullying, and are committed to creating a respectful and positive working environment for all. We are committed to diversity and inclusion by providing equal employment opportunities and fair compensation regardless of personal beliefs or characteristics. We enforce and support our policies to prevent, mitigate, and address discrimination through specific actions, including our e-learning programs on the Code of Conduct, Diversity & Inclusion, Conflict of Interest, and Anti-Bribery and Anti-Corruption, as well as providing a channel for raising concerns via EthicsPoint.
The Human Rights Policy applies to all employees and stakeholders and extends expectations to suppliers and business partners, and is published on our company website and our intranet. The policy considers stakeholders' interests by fostering a culture of respect, non-discrimination, and fairness, and ensuring employee and stakeholder health and safety through adherence to international standards and continuous improvement in monitoring and prevention. It is ultimately governed by our Board.
Stakeholder Engagement Policy
Our Stakeholder Engagement Policy sets out guiding principles of our engagement with our stakeholders. For more specific information on our Stakeholder Engagement Policy, such as its scope of application, evaluation of its effectiveness, and related accountabilities, please refer to section Our policies.
The scope of the Policy extends to all relevant stakeholders as identified by OCI, including customers, investors, governmental bodies, regulators, suppliers, employees, and communities, thus covering both upstream and downstream engagement across the value chain. OCI monitors and evaluates stakeholder engagement based on key factors such as frequency, quality, outcomes, and follow-up.
Our actions
Key actions during the reporting year
Reference is made to Our approach to health, safety & wellbeing for our HSE framework and the related actions. We currently have no significant financial resources allocated to the action plan, and no new financial resources have been allocated in 2025 as a result of our ongoing strategic review.
Safe product handling
We publish Safety Data Sheets (SDS) on our website for all our products and substances. We monitor and evaluate the environmental, health and safety data continuously and update the information published in the SDS section of our website regularly. SDSs provide safe handling, storage, disposal, and personal protection equipment (PPE) information and disclosure on potential health and safety effects due to exposure or mishandling. All SDSs and product labels comply with applicable laws and regulations, including but not limited to REACH, US EPA, CEPA, and CLP. The safety data sheets are translated into several languages to make them more accessible for our global customers. Through our participation in farmer education programs, we promote the safe use of such products in our supply chain.
Key actions planned for the future
Once the strategic review is complete and a new strategy is established, we will update our actions, where applicable, to align with the revised direction for the remaining business. Specific deadlines for new undertakings have not been set due to the ongoing strategic review.
Our targets
To ensure that all work is carried out safely, efficiently, and in compliance with regulatory and organizational requirements, we have set a yearly target for zero injuries. Based on our remaining portfolio, this target is still relevant. See our Sustainability Governance Framework for how we track policy and action effectiveness on material impacts, risks, and opportunities, including processes, ambition, and progress indicators.
3.1.1 Health and safety
The basis of preparation for the health and safety indicators can be found on page .
Indicator | Unit | Total | Continuing operations | Discontinued operations | |||
|---|---|---|---|---|---|---|---|
2025 | 2024 | 2025 | 2024 | 2025 | 2024 | ||
Total Recordable Injury (TRI) - employees | # | 2 | 7 | 2 | 2 | 0 | 5 |
Total Recordable Injury Rate (TRIR) - employees | per 200,000 hours worked | 0.28 | 0.24 | 0.33 | 0.341 | 0.00 | 0.211 |
Fatalities - employees | # | 0 | 0 | 0 | 0 | 0 | 0 |
Fatalities - contractors | # | 0 | 0 | 0 | 0 | 0 | 0 |
The percentage of all employees, who are covered by the occupational health and safety management system | % (headcount) | 100% | 100% | 100% | 100% | 100% | 100% |
- We classify OCIN and segment 'Other' as continuing operations, while Beaumont New Ammonia, OCI Methanol, OTE, and OAD are considered discontinued operations in FY 2025. We restated data as reported in the Annual Report 2024 by reclassifying OTE from continuing operations to discontinued operations. Reference is made to page for more information.
The total number of recordable injuries among employees decreased from 7 in the prior year to 2, primarily due to the divestitures of Fertiglobe and OCI Nitrogen Iowa in 2024, and OCI Methanol in 2025. For our continuing operations, the number of recordable injuries remained stable at 2.
3.2 Human and labor rights
Our approach to human and labor rights
Our Human Rights Policy aims to ensure any salient human rights issues potentially arising through our supply chain, if any, are tackled effectively.
OCI’s human rights principles are informed by global human rights standards, including the International Bill of Human Rights, the International Labor Organization’s Declaration on Fundamental Principles and Rights at Work, the United Nations Guiding Principles on Business and Human Rights, and the United Nations International Children’s Emergency Fund (UNICEF). Our guiding principles are as follows:
Forced and child labor: We prohibit the use of involuntary or forced labor, human trafficking, slavery, and child labor in accordance with international laws and standards.
Non-discrimination and harassment: We are committed to ensuring all people are treated with respect, tolerance, dignity and without prejudice to create a mutually respectful and positive working environment. We do not tolerate any form of harassment, discrimination, or bullying.
Equal employment and development: We are committed to providing equal employment opportunities where employees are recruited, employed, compensated, retained, trained, and promoted based on their qualifications and experience regardless of race, gender, or personal beliefs.
Freedom of association and collective bargaining: We are committed to maintaining an open line of communication across OCI Global and respecting the right of employees to associate with any lawful employee organization, union, works council, or other such association without fear of reprisal, intimidation, or harassment.
Safe and healthy workplace: We are committed to providing a safe and healthy workplace for all employees and stakeholders.
Fair compensation and living wage: We are committed to ensuring all employees are fairly remunerated whereby general accepted Global Living Wages standards serve as a minimum.
We have a Whistleblower policy in place which advises what people can do if they suspect or observe any behavior from employees, officers and directors of OCI, contract staff and others engaged through an agreement (“Employees”) in contradiction of our human rights principles.
All OCI employees are bound by our Code of Conduct, which they sign on commencement of employment. This includes an agreement to "Treat all individuals with respect, tolerance, dignity and without prejudice to create a mutually respectful and positive working environment". In addition, all employees complete mandatory annual training on the Code of Conduct, covering key compliance topics such as anti-bribery, anti-corruption, human rights, and workplace behavior. We do not tolerate any form of harassment or bullying.
Throughout our supply chain, all suppliers and third parties with whom we do business are required to adhere to our Business Partner Code of Conduct, which sets clear expectations regarding ethical behavior, anti-bribery and anti-corruption, anti-money laundering (AML), and respect for human rights. We conduct comprehensive screening of all suppliers and third parties against international sanctions lists and for any adverse findings. This due diligence process is performed prior to engagement and is regularly updated to ensure ongoing compliance.
Unions and works councils
Our employees can join a union, works council, employee association, trade union, or similar labor organization in line with local regulations. We strive to maintain productive relationships with the labor organizations representing our employees and engage with them regularly.
In 2025, OCI did not identify or record any incidents or violations related to human rights within our operations or supply chain. We remain committed to continuous monitoring and improvement to ensure the highest standards of ethical conduct are reached.
Our policies, actions, and targets
Our policies
This section contains the policies we have established to manage our material impacts, risks and opportunities.
Human Rights Policy
Our Human Rights Policy ensures that all business activities, including those within our value chain, are conducted responsibly, transparently, and in alignment with our Business Partner Code of Conduct. For more specific information on our Human Rights Policy, such as its scope of application, evaluation of its effectiveness, and related accountabilities, refer to section Our policies. Through our Human Rights Policy, OCI commits to respecting and promoting human rights and safe working conditions, prohibits forced and child labor, ensures non-discrimination, promotes equal employment opportunities, provides a safe and healthy workplace, guarantees fair compensation, and upholds freedom of association and collective bargaining, in line with international laws and standards.
Code of Conduct
Our Code of Conduct (CoC) outlines OCI's commitment to responsible, efficient, and transparent business practices, on topics such as ethical behavior, compliance with laws, respect for human rights, environmental sustainability, and fair competition. It establishes the standards for employees in their interactions with all stakeholders, communities, and business partners while promoting the principles of honesty, integrity, and fairness.
The CoC endorses the Universal Declaration of Human Rights (UDHR) principles, and applies to all employees, officers and directors of OCI, contract staff and others engaged through an agreement. It is published on our company website and our intranet, and ultimately governed by our CEO.
Business Partner Code of Conduct
We promote ethical business practices and uphold internationally recognized human rights standards across our value chain, requiring business partners, including suppliers, to adopt and promote similar principles as set out in our Business Partner Code of Conduct. Business partners are expected to respect human rights, prevent forced labor and discrimination, and foster diversity and inclusion in their operations, as set out in our Business Partner Code of Conduct, in line with international standards such as those set by the International Labor Organization (ILO) and the United Nations International Children’s Emergency Fund (UNICEF).
The Business Partner Code of Conduct promotes ethical business practices, compliance with laws, environmental sustainability, social responsibility, human rights, and working conditions. It applies to OCI's business partners, including suppliers, distributors, agents, resellers, and other third parties in the supply chain. It is published on our company website and our intranet.
Our commitment to ethical business practices ensures that consumers and end-users benefit from responsible conduct throughout the value chain, including compliance with environmental laws, promotion of sustainable practices, and the adoption of environmentally friendly technologies and products through our own operations and our business partners.
Our independent EthicsPoint helpline allows value chain workers to report workplace concerns or breaches of the Code of Conduct, ensuring anonymous reporting, fair investigation, and remediation without retaliation. We have not disclosed specific cases but have implemented mechanisms to monitor and report any potential breaches of these internationally recognized principles through transparent reporting channels.
Stakeholder Engagement Policy
Our Stakeholder Engagement Policy sets out guiding principles of our engagement with our stakeholders. For more specific information on our Stakeholder Engagement Policy, such as its scope of application, evaluation of its effectiveness, and related accountabilities, refer to section Our policies.
The scope of the Policy extends to all relevant stakeholders as identified by OCI, including customers, investors, governmental bodies, regulators, suppliers, employees, and communities, thus covering both upstream and downstream engagement across the value chain. OCI monitors and evaluates stakeholder engagement based on key factors such as frequency, quality, outcomes, and follow-up.
Our actions
Key actions during the reporting year
In 2025, we assigned a mandatory, annual e-learning on our Code to all our employees, with a completion rate of 92%. The annual e-learning was rolled out in all our entities (excluding OCI Methanol group, due to the closing of the transaction). Topics include ethical decisions, anti-bribery and anti-corruption, anti-money laundering, conflict of interest, gifts, entertainment and hospitality, workplace harassment, human trafficking & modern slavery statements, reporting and non-retaliation.
Additionally, we provided risk-based training to relevant audiences on specific compliance topics. For example, throughout 2025, we conducted compliance onboarding training sessions for OCI new joiners, introducing our compliance framework and emphasizing the importance of speaking up.
As a result of our ongoing strategic review, we have needed to consider the security of OCI employees at facilities that are being transferred to a new owner. We have sought to, and to date have been successful in, agreeing with the new facility owner the transfer of our employees and protections of their employment status and remuneration. This has gone above and beyond legal requirements and has been done in collaboration with new owners, as part of the sale agreements. We keep employees well informed about the changes affecting them, hosting explanatory sessions and offering Q&A opportunities.
We currently have no significant financial resources allocated to the action plan, and no new financial resources have been allocated in 2025 as a result of our ongoing strategic review.
Key actions planned for the future
Once the strategic review is complete and a new strategy is established, we will update our actions, where applicable, to align with the revised direction for the remaining business. Specific deadlines for new undertakings have not been set due to the ongoing strategic review.
Our targets
We have not set targets for human and labor rights due to the strategic review of our business and divestment of several facilities, which has changed the material structure of our business. Once our strategic review is completed and new strategy has been developed, we will update our targets, if applicable, in line with the revised direction for the remaining business. Although we have not set targets, refer to our Sustainability Governance Framework for how we still track policy and action effectiveness on material impacts, risks, and opportunities, using defined processes, ambition, and progress indicators.
3.2.1 Collective bargaining and social dialogue
The basis of preparation for the collective bargaining and social dialogue indicators can be found on page .
Indicator | Unit | Total | Continuing operations | Discontinued operations | |||
|---|---|---|---|---|---|---|---|
2025 | 2024 | 2025 | 2024 | 2025 | 2024 | ||
Total employees | headcount | 761 | 1091 | 610 | 6541 | 151 | 4371 |
Employees covered by collective bargaining agreements | % (headcount) | 65.7% | 46.7% | 82.0% | 75.1%1 | 0.0% | 4.3%1 |
Employees covered by collective bargaining agreements in the Netherlands | % (headcount) | 81.6% | 77.0% | 87.6% | 83.1%1 | 0.0% | 26.8%1 |
Employees covered by workers' representatives in the Netherlands | % (headcount) | 81.6% | 77.0% | 87.6% | 83.1%1 | 0.0% | 26.8%1 |
- We classify OCIN and segment 'Other' as continuing operations, while Beaumont New Ammonia, OCI Methanol, OTE, and OAD are considered discontinued operations in FY 2025. We restated data as reported in the Annual Report 2024 by reclassifying OTE and N-7 from continuing operations to discontinued operations. Reference is made to page for more information.
The total number of employees decreased by 30% compared to prior year. This reduction was primarily attributable to the divestiture of OCI Methanol in 2025. For our continuing operations, the total number of employees declined, reflecting the organizational downsizing following the divestments. The percentage of employees covered by collective bargaining agreements increased following the 2025 divestiture of OCI Methanol, whose workforce was not covered by such agreements.
Collective bargaining coverage | Social dialogue | ||
|---|---|---|---|
Coverage rate (headcount) | Employees – EEA | Own workforce – Non-EEA | Workplace representation (EEA only) |
0-19% | Phased in | ||
20-39% | Phased in | ||
40-59% | Phased in | ||
60-79% | The Netherlands | Phased in | The Netherlands |
80-100% | Phased in | ||
3.2.2 Other human and labor rights
The basis of preparation for other human and labor rights indicators can be found on page .
Indicator | Unit | Total | Continuing operations | Discontinued operations | |||
|---|---|---|---|---|---|---|---|
2025 | 2024 | 2025 | 2024 | 2025 | 2024 | ||
Number of severe human rights issues and incidents related to own workforce | # | 0 | 0 | 0 | 0 | 0 | 0 |
Total fines, penalties, and compensation for damages as a result of violations regarding severe human rights incidents | USD | 0 | 0 | 0 | 0 | 0 | 0 |
Total number of incidents of discrimination, including harassment, reported in the reporting period | # | 2 | 3 | 0 | 0 | 2 | 3 |
Number of complaints other than discrimination and harassment filed through channels for own workers to raise concerns (and to the National Contact Points for OECD Multinational Enterprises) | # | 5 | 14 | 2 | 2 | 3 | 12 |
Total fines, penalties, and compensation for damages as a result of the incidents and complaints of discrimination and harassments | USD | 0 | 0 | 0 | 0 | 0 | 0 |
No severe human rights issues and incidents connected to own workforce, affected communities, and upstream and downstream value chain were reported.
4 Governance information
OCI corporate culture
We acknowledge the continued importance of our group culture to be a cohesive and united global organization. We launched the OneOCI platform in 2020 to bring together the best of OCI under one unified culture, a shared set of values, and a platform to encourage dialogue across our locations. OneOCI provides a central hub for employee dialogue across all functions. It facilitates information sharing and collaboration, and recognizes employee development by highlighting personal and professional achievements.
We CARE
At OCI, our culture is built around our core values of Collaboration, Agility, Resourcefulness, and Excellence (CARE). As part of our CARE values, 'Excellence' emphasizes the requirement to act with integrity towards all our employees during all of our business activities.
Our approach to responsible business practices
Our Code of Conduct and Compliance Framework
Our Code of Conduct highlights our commitment to creating a positive workplace environment where there is mutual trust and respect towards and amongst employees, free from harassment or bullying. Employees are required to act responsibly and transparently and to treat all individuals with respect, tolerance, dignity, and without prejudice to create a mutually respectful, collaborative, and positive working environment.
Our compliance framework guides our responsible business conduct, aligning with principles such as the International Bill of Human Rights, OECD Guidelines for Multinational Enterprises, the ILO’s Declaration on Fundamental Principles and Rights at Work, the UN Guiding Principles on Business and Human Rights, and UNICEF’s guidelines.
Our policies and procedures are designed to ensure compliance with all relevant laws and regulations. These include our Code of Conduct, Business Partner Code of Conduct, Whistleblower Policy, Whistleblower Protection Policy, Data Privacy and Data Protection Policy, Sanctions Policy, Human Rights Policy, Competition Policy, and Anti-Bribery and Anti-Corruption Policy. The Chief Legal and Human Capital Officer (CLHCO) at OCI holds the highest level of accountability for implementing these policies, which apply to all employees, officers, and directors of OCI and its subsidiaries, as well as contract staff and others engaged through an agreement.
These policies are easily accessible to employees and members of administrative, supervisory and management bodies via OCI Intranet. Additionally, The Code of Conduct, Business Partner Code of Conduct, Whistleblower Policy, Anti-bribery and Anti-corruption Policy, and Human Rights Policy are publicly available on our website.
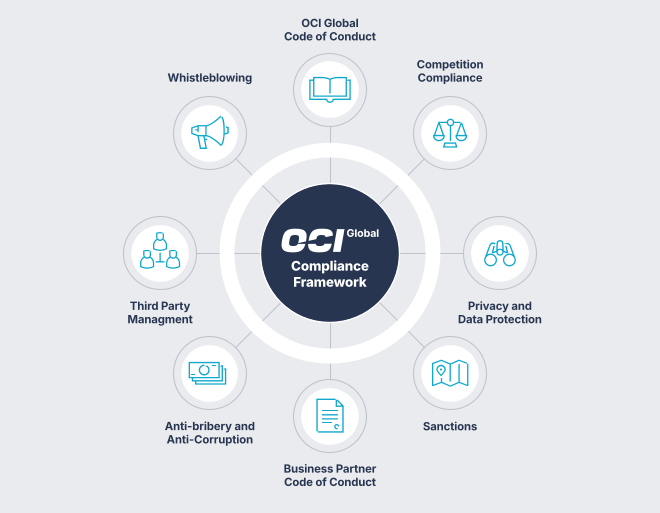
Annual Compliance Training
Reference is made to Our actions for information about our mandatory annual e-learning on our Code and risk-based training on specific compliance topics.
Business Partner Code of Conduct
At OCI, we seek to do business with customers, suppliers and third parties who uphold the same values as OCI. A key aspect of our third-party management is our Integrity Due Diligence Program. This program includes our Business Partner Code of Conduct, which outlines our expectations on compliance topics aligned with our internal Code of Conduct and provides our business partners with direct channels, including a whistleblowing hotline, to report any compliance concerns.
Through our Integrity Due Diligence Program, we screen our prospective third parties for issues related to bribery, corruption, sanctions violations, human rights, and other compliance concerns. Where necessary, we conduct additional in-depth due diligence to address risks, and if appropriate, decline or disengage from certain third parties. When a third party is included in our Integrity Due Diligence tool, it is subject to ongoing monitoring to alert us to potential new compliance issues.
We continuously monitor relevant sanctions developments and communicate these updates to relevant stakeholders. In 2025, we continued our focus on sanctions screening, particularly concerning Russia-related sanctions. We conduct screenings against sanctions lists through our integrity due diligence tool and our vessel sanctions screening tool.
Bribery and Corruption
OCI Global has an Anti-bribery and Anti-corruption policy in compliance with all applicable and relevant laws and regulations. The policy is included in our annual compliance e-learning program, where assignees are required to confirm they have read the policy. Employees, as well as members of administrative, supervisory, management bodies, and externals can report concerns about corruption or bribery through our Whistleblower channels (see below).
Our Whistleblowing Framework
We encourage our employees to speak up about compliance concerns, meaning a (potential) violation of our Code of Conduct. This proactive reporting approach provides us with the opportunity to thoroughly investigate and, if necessary, remediate the identified issues.
At OCI Global, our Whistleblowing Framework, grounded in our Whistleblower Policy and Whistleblower Protection Policy, aligns with the European Whistleblower Directive. This framework also allows external parties (workers in the value chain, affected communities, consumers and end-users), including business partners, to report (potential) misconduct.
Employees can report (potential) misconduct through multiple channels: their immediate manager, the next level of management, their Local Compliance Officer, Global Compliance, or the Whistleblower Hotline. The Whistleblower Hotline, accessible online and by phone, offers a secure and confidential reporting option for both employees and external stakeholders, allowing anonymous reporting if preferred.
To ensure effective handling of concerns, all the reports are treated confidentially. Investigations are executed in line with our procedures which ensure prompt, independent, and objective investigations. In addition, all reports are logged in OCI's case management system and assigned to the appropriate case manager, ensuring timely investigation and follow-up. We do not tolerate retaliation. Our Whistleblower Protection Policy reinforces protection against retaliation, with any such incidents treated as disciplinary matters.
In 2023, we conducted our last employee engagement survey, achieving a participation rate of 66%, exceeding our target of 60%. The survey provider's assessment indicated that our organization is generally healthy, with employees expressing satisfaction in their roles and demonstrating strong collaboration with colleagues.
We were pleased with the response rate and how closely our results aligned with benchmark scores in our global employee engagement survey. Among the safety and culture-related questions, we asked employees about their confidence in appropriate action being taken if they report inappropriate behavior, unsafe situations, or unethical issues. Notably, 75% of participants expressed confidence that such reports would be appropriately addressed.
Looking ahead, based on future developments, we plan to conduct the survey again to build on these insights. In the interim, awareness of our Whistleblowing Framework is continually reinforced through OCI intranet, compliance communications, and compliance trainings.
On a quarterly basis, Global Compliance provides a compliance report to the Audit Committee, which includes relevant updates regarding the Whistleblowing Framework and cases.
Results 2025
In 2025, we reported zero severe human rights issues or incidents within our value chain, nor did we receive complaints of such issues or incidents through our grievance mechanism. In addition, all investigators who handled the compliance concerns in 2025 were independent from the chain of management involved in the matters.
OCI has determined that it has no specific functions that qualify as being most at risk in respect of bribery and corruption. We launched our mandatory, annual compliance e-learning for all OCI Global employees, which included a dedicated chapter on anti-bribery and anti-corruption explaining our Anti-Bribery and Anti-Corruption Policy. This e-learning was assigned to all OCI Global employees, achieving a completion rate of 92%.
4.1 Responsible business practices
Our policies, actions, and targets
Our policies
This section contains the policies we have established to manage our material impacts, risks and opportunities.
Stakeholder Engagement Policy
Our Stakeholder Engagement Policy sets out the guiding principles for our engagement with our stakeholders. For more specific information on our Stakeholder Engagement Policy, such as its scope of application, evaluation of its effectiveness, and related accountabilities, refer to section Our policies.
The scope of the Policy extends to all relevant stakeholders as identified by OCI, including customers, investors, governmental bodies, regulators, suppliers, employees, and communities, thus covering both upstream and downstream engagement across the value chain. OCI monitors and evaluates stakeholder engagement based on key factors such as frequency, quality, outcomes, and follow-up.
Code of Conduct
Our Code of Conduct outlines OCI's commitment to responsible, efficient, and transparent business practices, on topics such as ethical behavior, compliance with laws, respect for human rights, environmental sustainability, and fair competition. Our Code of Conduct ensures that material negative impacts on affected stakeholders are addressed through reporting mechanisms like the Whistleblower hotline, supported by transparent and fair remediation processes and through our stakeholder engagement practices. For more specific information on our Human Rights Policy, such as its scope of application, evaluation of its effectiveness, and related accountabilities, refer to section Our policies.
Business Partner Code of Conduct
We encourage our business partners through our Business Partner Code of Conduct to uphold similar standards, ensuring compliance with international human rights and environmental laws to prevent and mitigate such impacts. For more specific information on our Business Partner Code of Conduct, such as its scope of application, evaluation of its effectiveness, and related accountabilities, refer to section Our policies.
Animal welfare
OCI does not have specific policies on animal welfare, as our operations do not involve activities such as animal testing or practices that directly impact animal welfare.
Our actions
Key actions during the reporting year
Reference is made to Our actions for information about our mandatory annual e-learning on our Code and risk-based training on specific compliance topics.
We have not terminated any business relationships in 2025, as our supplier base has remained relatively steady. However, if termination were necessary, we would evaluate actual and potential impacts on value chain workers and implement measures to mitigate any negative consequences, consistent with our commitment to ethical practices and human rights principles.
We currently have no significant financial resources to the action plan allocated, and no new financial resources have been allocated in 2025 as a result of our ongoing strategic review.
Key actions planned for the future
Once the strategic review is complete and a new strategy is established, we will update our actions, where applicable, to align with the revised direction for the remaining business. Specific deadlines for new undertakings have not been set due to the ongoing strategic review.
Our targets
We have not set targets related to the topic of responsible business practices due to the strategic review of our business and divestment of several facilities, which has changed the material structure of our business. Once our strategic review is completed and new strategy has been developed, we will update our targets, if applicable, in line with the revised direction for the remaining business. Although we have not set targets, refer to our Sustainability Governance Framework to see how we still track policy and action effectiveness on material impacts, risks, and opportunities, using defined processes, ambition, and progress indicators.
4.1.1 Anti-bribery and anti-corruption
The basis of preparation for the anti-bribery and anti-corruption indicators can be found on page .
Indicator | Unit | Total | Continuing operations | Discontinued operations | |||
|---|---|---|---|---|---|---|---|
2025 | 2024 | 2025 | 2024 | 2025 | 2024 | ||
Percentage of functions-at-risk covered by training programs | % (headcount) | 100% | 100% | 100% | 100% | 100% | 100% |
The number of convictions for violation of anti-corruption and anti-bribery laws | # | 0 | 0 | 0 | 0 | 0 | 0 |
The amount of fines for violation of anti-corruption and anti-bribery laws | USD | 0 | 0 | 0 | 0 | 0 | 0 |
4.1.2 Political influence and lobbying activities
The basis of preparation for the political influence and lobbying activities indicators can be found on page .
Indicator | Unit | Total | Continuing operations | Discontinued operations | |||
|---|---|---|---|---|---|---|---|
2025 | 2024 | 2025 | 2024 | 2025 | 2024 | ||
Financial and in-kind political contributions | USD | 0 | 25,000 | 0 | 0 | 0 | 25,000 |
In 2025, we did not make any financial or in‑kind political contributions, compared to a contribution of USD 25,000 made by one of our divested operations in 2024.
The Chief Legal and Human Capital Officer (CLHCO) at OCI holds the highest level of accountability for the political engagement and lobbying activities. OCI is not registered in the transparency register, and no members of the OCI N.V. Board and Executive Committee held a comparable position in public administration (including regulators) in the two years preceding such appointment in the current reporting period.
In 2025, we continued our work with state governments, politicians and authorities across our regions to advance our business objectives and the energy transition, in particular with regard to decarbonization projects. In the Netherlands, we continue to have conversations with the Dutch Government and discuss tailored government support related to regulatory hurdles and funding gaps.
The table below shows the key issues we advocated for during the year:
Region | Issue | Our position | Partners |
|---|---|---|---|
Global | International Maritime Organization (IMO) target and standards | Until the divestment of OCI Methanol in 2025, we advocated for establishing ambitious and binding targets for maritime decarbonization; robust regulatory frameworks for low-carbon shipping fuels; developing standards for the safe design, operation, and bunkering of sustainable fuels such as ammonia and methanol; and creating market-based measures to support the introduction of low carbon and renewable fuels. |  |
Certification standards for renewable and low carbon ammonia and methanol | We participated in three industry-lead initiatives to develop certification standards for renewable and low carbon ammonia. We were active in industry initiatives to develop certification standards for renewable and low‑carbon ammonia. Following the divestments of OCI Nitrogen Iowa in 2024, and OCI Methanol in 2025, participation in The Fertilizer Institute and Ammonia Energy Association has stopped. |  | |
Europe | Implementation of European Union Database (UDB) | Until the divestment of OCI Methanol in 2025, we advocated for the inclusion of biomethane‑based fuels produced outside Europe in the UDB. Our efforts focused on engagement with the European Commission and governments of countries that have business interests in exporting biomethane fuels to the EU such as the US, UK and Ukraine, alongside developing a solution for integrating third‑country volumes into the UDB. |  |
Implementation of Renewable Energy Directive (RED3) at Member state level | We advocate for the practical implementation of RED3 42% RFNBO use in industry targets so that it would not put European producers at a disadvantage. | ||
Implementation of CBAM | We advocate for the expansion of CBAM scope to cover more downstream products of ammonia to prevent carbon leakage and disadvantage for European producers. | ||
Increase in Russian fertilizer import into Europe | Increase of Russian fertilizer import into Europe at low prices has put a lot stress on European producers especially when gas prices remained elevated compared to historical levels. We successfully advocated for the introduction of measures to prevent European consumers from unwittingly buying Russian products. Tariffs were implemented in 2025. | ||
Dutch Tailor-Made agreement | We continue to have conversations with the Dutch Government to discuss tailored government support related to regulatory hurdles and funding gaps. |
5 Appendices
5.1 General basis for preparation
5.1.1 Climate change action
5.1.1.1 Energy consumption and mix
The energy consumption and mix performance statements can be found on page .
Methodology
All quantitative energy-related information is reported in Megawatt-hours (MWh) based on Lower Heating Value (LHV).
We use the following conversion factors:
Factors from the International Energy Agency (IEA) (2023), an autonomous body in the framework of the Organisation for Economic Co-operation and Development (OECD), to convert electricity usage to CO2/KWh.
TJ to GWh: 0.278 (source: Annex II of the Fifth Assessment IPCC report)
Restatements
We classify OCIN and segment 'Other' as continuing operations, while Beaumont New Ammonia, OCI Methanol, OTE, and OAD are considered discontinued operations in FY 2025. We restated data as reported in the Annual Report 2024 by reclassifying OTE from continuing operations to discontinued operations.
Indicator | Unit | Scope | Year | As reported in the Annual Report 2024 | 1) Change in scope: divestments | Restated |
|---|---|---|---|---|---|---|
Consumption of purchased or acquired electricity, heat, steam, and cooling from fossil sources | MWh | Continuing operations | 2024 | 546,766 | -35,248 | 511,518 |
Consumption of purchased or acquired electricity, heat, steam, and cooling from fossil sources | MWh | Discontinued operations | 2024 | 2,190,617 | 35,248 | 2,225,864 |
Total energy consumption from fossil sources | MWh | Continuing operations | 2024 | 3,323,337 | -35,248 | 3,288,089 |
Total energy consumption from fossil sources | MWh | Discontinued operations | 2024 | 22,433,903 | 35,248 | 22,469,151 |
Total energy consumption | MWh | Continuing operations | 2024 | 3,323,337 | -35,248 | 3,288,089 |
Total energy consumption | MWh | Discontinued operations | 2024 | 22,790,513 | 35,248 | 22,825,761 |
5.1.1.2 Energy intensity
The energy intensity performance statements can be found on page .
Methodology
High climate impact sectors used to determine Energy intensity associated with activities in high climate impact sectors are the manufacturing of methanol (NACE C20.14) and the manufacturing of ammonia (NACE C20.15) products.
The denominator of energy intensity associated with activities in high climate impact sectors (MWh / USD net revenue) consist of the turnover (USD 1,086 million), as included in Consolidated statement of profit or loss and other comprehensive income (continuing operations). See also Note 28 to the Consolidated statement of profit or loss and other comprehensive income.
5.1.1.3 Scope 1 and 2 GHG emissions
The Scope 1 and 2 GHG emissions performance statements can be found on page .
Methodology
The gross Scope 1 greenhouse gas emissions are calculated for all types of products produced and stated in carbon dioxide equivalent terms, calculated using the EU ETS methodology. This means that the CO2 used in the production of urea and other downstream processes, which is defined as Scope 3 as per the GHG Protocol, is included. By including the CO2 that goes into downstream processes, we eliminate the fluctuations that may occur when we make any changes or experience downtime in our downstream product mix and present a transparent view of the CO2 produced when making ammonia.
We use the following emission factors:
We use the factor steam reforming for GHG emissions from the prospective scenarios for the Chemical and Petrochemical Industry from JRC 2017.
Global Warming Potential (GWP) values from the IPCC AR 4 report to convert N2O and CH4 data to CO2e.
We use standard publicly available Dutch conversion factors from NIE/emissiemonitoring: jaarlijkse vaststelling CO2-emissiefactor aardgas from December 2019, to convert energy consumption to Terra Joules (TJ).
Emission factors for steam: 0.175 tons CO2/metric tonnes steam and 2.8 GJ/metric tonnes of steam (based on 4 bar steam).
For the conversion of electricity to CO2e, IEA 2019 factors are utilized for data for 2019, while IEA 2023 factors are employed for the conversion of electricity to CO2e specifically for the 2024 and 2025 data.
Restatements
We classify OCIN and segment 'Other' as continuing operations, while Beaumont New Ammonia, OCI Methanol, OTE, and OAD are considered discontinued operations in FY 2025. We restated data as reported in the Annual Report 2024 by reclassifying OTE from continuing operations to discontinued operations.
Indicator | Unit | Scope | Year | As reported in the Annual Report 2024 | 1) Change in scope: divestments | Restated |
|---|---|---|---|---|---|---|
Gross Scope 1 GHG emissions | metric tonnes of CO2e | Continuing operations | 2024 | 1,238,078 | -6,413 | 1,231,664 |
Gross Scope 1 GHG emissions | metric tonnes of CO2e | Discontinued operations | 2024 | 5,998,147 | 6,413 | 6,004,560 |
Total gross Scope 1 GHG emissions | metric tonnes of CO2e | Continuing operations | 2024 | 1,916,530 | -6,413 | 1,910,116 |
Total gross Scope 1 GHG emissions | metric tonnes of CO2e | Discontinued operations | 2024 | 8,981,862 | 6,413 | 8,988,275 |
Total gross Scope 2 GHG emissions - Location-based | metric tonnes of CO2e | Continuing operations | 2024 | 140,465 | -1,156 | 139,309 |
Total gross Scope 2 GHG emissions - Location-based | metric tonnes of CO2e | Discontinued operations | 2024 | 370,161 | 1,156 | 371,317 |
Total gross Scope 2 GHG emissions - Market-based | metric tonnes of CO2e | Continuing operations | 2024 | 140,465 | -1,156 | 139,309 |
Total gross Scope 2 GHG emissions - Market-based | metric tonnes of CO2e | Discontinued operations | 2024 | 211,975 | 1,156 | 213,132 |
Scope 1 GHG emissions from regulated emission trading schemes | % | Discontinued operations | 2024 | 0.0% | 0.1% | 0.1% |
5.1.1.4 GHG Intensity
The GHG Intensity performance statements can be found on page .
Methodology
Emissions boundaries
Refer to 5.1.1.3 Scope 1 and 2 GHG emissions for the emissions boundaries.
We have purchased solar i-RECs for 100% of electricity purchased in our discontinued operations in the UAE and Egypt in 2024.
Conversions are based on the listing in the Scope 1 and 2 GHG emissions section.
Revenue
The denominator of GHG intensity (metric tonnes of CO2e / USD net revenue) consist of the turnover (USD 1,086 million), as included in Consolidated statement of profit or loss and other comprehensive income (continuing operations). See also Note 28 to the Consolidated statement of profit or loss and other comprehensive income.
5.1.1.5 Total GHG emissions disaggregated by Scopes 1 and 2 and significant Scope 3
The GHG emissions disaggregated by Scopes 1 and 2 and significant Scope 3 performance statements can be found on page .
Methodology
For the methodology of Scope 1, 2 and 3 GHG emissions, we refer to Scope 1 and 2 GHG emissions and Scope 3 GHG emissions.
Restatements
We classify OCIN and segment 'Other' as continuing operations, while Beaumont New Ammonia, OCI Methanol, OTE, and OAD are considered discontinued operations in FY 2025. We restated data as reported in the Annual Report 2024 by reclassifying OTE from continuing operations to discontinued operations.
Indicator | Unit | Scope | Year | As reported in the Annual Report 2024 | 1) Change in scope: divestments | Restated |
|---|---|---|---|---|---|---|
Total GHG emissions (location-based) | metric tonnes of CO2e | Continuing operations | 2024 | 7,687,901 | -12,764 | 7,675,137 |
Total GHG emissions (location-based) | metric tonnes of CO2e | Discontinued operations | 2024 | 29,990,104 | 12,764 | 30,002,868 |
Total GHG emissions (market-based) | metric tonnes of CO2e | Continuing operations | 2024 | 7,687,901 | -12,764 | 7,675,137 |
Total GHG emissions (market-based) | metric tonnes of CO2e | Discontinued operations | 2024 | 29,831,918 | 12,764 | 29,844,682 |
5.1.1.6 GHG removals and GHG mitigation projects financed through carbon credits
The GHG removals and GHG mitigation projects financed through carbon credits performance statements can be found on page .
OCI does not remove and store any GHG emissions and does not purchase carbon credits.
5.1.2 Product stewardship
5.1.2.1 Scope 3 GHG emissions
The Scope 3 GHG emissions performance statements can be found on page .
Methodology
1: Purchased goods and services
In this category we include all cradle-to-gate upstream emissions associated with OCI's natural gas and purchased hydrogen. This category also considers upstream emissions associated with finished methanol and nitrogen products purchased by OCI for processing and trade. Emissions for smaller inputs (e.g. chemicals, catalysts) are not included as we deem these not material.
In this category, the focus is on the main purchased products by OCI:
Natural gas as a feedstock for methanol and fertilizers [MJ] (main expenditure and most material);
3rd party traded goods (e.g. ammonia or methanol) [metric tonnes];
Hydrogen [metric tonnes].
Emissions associated with the production and transport of natural gas used as feedstock are mainly related to CH4 leakage along the supply chain. Emission factors based on leakage for the specific natural gas mix of each site are derived from public sources like the US GREET model 2023 rev1 and Ecoinvent database 3.10 [kgCO2e/ton] or [kgCO2e/MJ].
Emission factors for the production of ammonia, fertilizers and methanol are used to determine GHG emissions for the production of these goods [kgCO2eq/tonnes product]. These emission factors are multiplied by the total amount of purchased product by OCI [tonnes]. The calculated impact of third party purchased goods is then expressed in kgCO2e. Emission factors are derived from Ecoinvent database 3.10.
This category covers 20.57% of total Scope 3 GHG emissions.
2: Capital goods
Category 2 includes all upstream emissions associated with the production of capital goods that have been purchased within the reporting period. Capital goods are those that are treated as fixed assets or as property, plant and equipment. The GHG emissions are calculated using the average spend-based method, using emission factors from Supply Chain Greenhouse Gas Emission Factors v1.3 by NAICS-6.
This category covers 0.33% of total Scope 3 GHG emissions.
3: Fuel and energy related activities
Category 3 includes upstream emissions associated with the production transport, and distribution of electricity and natural gas used as fuel by OCI.
For natural gas, these emissions are mainly related to CH4 leakage along the supply chain. Emission factors are based on leakage for the specific natural gas mix of each OCI site. These emissions are obtained from public sources such as the US GREET model 2022 and Ecoinvent database 3.9.1.
Electricity includes emissions from fuel extraction, electricity generation and transport and distribution losses, emissions not included in Scope 2.
Emissions associated with the production and transport of natural gas used as fuel by OCI are calculated multiplying an emission factor by the total natural gas consumed in the year by the different entities in scope of OCI’s GHG reporting. Emission factors were obtained for the specific national natural gas mix of each OCI site. These emissions are obtained from public sources such as the US GREET model 2023 rev1 and Ecoinvent database 3.10.
For electricity, region specific emission factors for well to tank (WTT) are derived from the UK Government GHG Conversion Factors for Company Reporting available for each country grid in kgCO2e/kWh (DEFRA BEIS 2021). The impact of transmission and distribution of electricity for each national grid [kgCO2e/kWh] is derived from the International Energy Agency (IEA) 2024 emission factor database and is based on 2022 data. The sum of both emission factors is multiplied by the total electricity consumption [kWh] in each OCI plant expressing emissions on kgCO2e for the consumed electricity.
This category covers 2.62% of total Scope 3 GHG emissions.
4: Upstream transportation and distribution
Considers emissions associated with the fuel use for inbound logistics of supplied products to OCI. This category would normally also include emissions from outbound logistics where OCI pays transportation. In this model we had no visibility of outbound logistics paid and not paid by OCI, therefore, to ensure completeness, all outbound logistics are covered in Scope 3 category 9.
For the relevant OCI entities, 2019 data was provided on inbound logistics detailing the weight of goods being transported, the mode of transport, the number of trips in the reporting year and the origin and destination of transport, and extrapolated to 2024 by adjusting to the annual production volume. For some of the data the distance of the trip was also provided. Where distances were not provided, distances were calculated based on origin and destination, and when destination unknown, the distance was taken as the average of the rest of transport from a particular location.
Based on the above data BEIS 2019 emission factors on kgCO2e/ton.km were applied based on the mode of transport to calculate associated emissions.
This category covers 1.24% of total Scope 3 GHG emissions.
5: Waste generated in operations
Includes all emissions from third-party disposal and treatment of waste generated by OCI’s owned or controlled operations. The volume of waste by tonnage for hazardous and non-hazardous waste is multiplied by the appropriate 2024 BEIS emission factor, based on disposal method and waste type.
This category covers 0.01% of total Scope 3 GHG emissions.
6: Business travel
Emissions from travel and accommodation of OCI employees for business-related activities. For business travel data, the spend-based method is used to calculate GHG emissions, using Exiobase 3.4 and BEIS 2024 emission factors.
This category covers 0.07% of total Scope 3 GHG emissions.
7: Employee commuting
Emissions arising from the transportation of OCI employees between their homes and their worksites. These include emissions from: automotive travel, bus travel, rail travel, air travel and other modes including subway, bicycling and walking. The average commuting emissions per country classification (low income, lower middle income, upper middle income, high income – as derived from the World Bank 2024 country classification) and by average commute distance in kilometers calculated using BEIS 2024 emission factors. These are multiplied by the total number of employees within each country. Based on the type of commute, average return trip per country classification, number of working days a year (which we assumed to be 230), the average emissions per person per year have been calculated in kgCO2e. The resulting average commuting emissions per person were multiplied by the headcount data for total number of employees within each country.
This category covers 0.01% of total Scope 3 GHG emissions.
8: Upstream leased assets
Emissions associated with the operation of assets leased by OCI in the reporting year. The GHG emissions are calculated using the average spend-based method, using emission factors from Supply Chain Greenhouse Gas Emission Factors v1.3 by NAICS-6.
This category covers 0.01% of total Scope 3 GHG emissions.
9: Downstream transportation and distribution
Emissions associated with the use of fuel in the distribution of all OCI sold products. Emissions determined by the type of transport mode (truck, train, barge, ship), the cargo load (metric tonnes) and the distance to consumer (km). Information is derived from sales and logistics data.
Emission factors [kgCO2e/tonnes.km] were derived for different transport modes from Ecoinvent 3.10.
This category covers 1.78% of total Scope 3 GHG emissions.
10: Processing of sold products
Excluded. Emissions associated with the processing of sold products are related to the processing of OCI products sold as intermediate industrial products. As the GHG emissions related to processing of sold products are not material, we do not report on Scope 3 Category 10 GHG emissions.
11: Use of sold products (Direct)
Emissions associated with the direct use of products sold by OCI. For methanol and bio-methanol (operation divested), these are CO2 emissions associated with combustion as fuel. For nitrogen products, these are direct and indirect N2O emissions associated to the application of fertilizers on the soil.
For nitrogen products, the final application is separated into fertilizer and industrial. For methanol products, the final application is divided into industrial or fuel.
If end use is unknown, a weighted average of the known application share is assumed to estimate the use emissions of product with unknown use.
N2O emission modelling is performed following IPCC 2021 guidance for the GHG emissions of managed soils.
For methanol and bio-methanol (operation divested), combustion emissions are based on the carbon content of methanol (1375 kgCO2/metric tonnes methanol) which is assumed fully released when combusted.
Similarly, combustion emissions from other traded products as MTBE, Ethanol, and Fuel Cell mix are calculated based on the carbon content of each product, assuming it would be fully released on combustion.
This category covers 62.36% of total Scope 3 GHG emissions.
12: End-of-life treatment of sold products
End-of-life emissions are calculated for methanol products used in industrial applications. Emissions are linked to the management practice (landfilling, incineration, recycling or mismanagement), in the country of use. The data used for the calculation of these emissions is the amount of products sold to industrial applications and the country of destination. As no better information available, we assume the sales destination country will also be the country where the product will be disposed at end of life. The use country is connected to the member and non-member list Organization for Economic Co-operation and Development OECD. The OECD published annual data on the end of life fate for plastics (used as proxy) for all member and non-member countries.
Emission factors are obtained for each management practice in Ecoinvent 3.10.
The weighted average emission factor for each country [kgCO2e/metric tonnes waste managed] is multiplied by the total amount of product sold to each country for industrial applications [metric tonnes], resulting in the associated emissions for waste management in kgCO2e.
For cases where the sales country is unknown, the average global fate calculated by OECD is used.
When the exact use of a product is unknown, the weighted average of the emission factors calculated for products with known countries is used.
This category covers 8.09% of total Scope 3 GHG emissions.
13: Downstream leased assets
Excluded. This category is not applicable to OCI, as no assets are leased in the reporting year and therefore there are no associated emissions.
14: Franchises
Excluded. This category is not applicable to OCI, as franchises are not part of OCI’s business and therefore there are no associated emissions.
15: Investments
This category contains the proportional Scope 1 and Scope 2 emissions of the investments that occur in the reporting year. We allocate the proportional emissions from the discontinued Natgasoline equity investment based on the proportional share of equity in Natgasoline (50%), using the investment-specific method and the emission factors as described in Scope 1 and 2 GHG emissions.
This category covers 2.91% of total Scope 3 GHG emissions.
Restatements
We classify OCIN and segment 'Other' as continuing operations, while Beaumont New Ammonia, OCI Methanol, OTE, and OAD are considered discontinued operations in FY 2025. We restated data as reported in the Annual Report 2024 by reclassifying OTE from continuing operations to discontinued operations.
Indicator | Unit | Scope | Year | As reported in the Annual Report 2024 | 1) Change in scope: divestments | Restated |
|---|---|---|---|---|---|---|
Total GHG emissions (Scope 3) | metric tonnes of CO2e | Continuing operations | 2024 | 5,630,907 | -5,195 | 5,625,712 |
Total GHG emissions (Scope 3) | metric tonnes of CO2e | Discontinued operations | 2024 | 20,638,081 | 5,195 | 20,643,276 |
2 Capital goods | metric tonnes of CO2e | Continuing operations | 2024 | 13,623 | -1,453 | 12,169 |
2 Capital goods | metric tonnes of CO2e | Discontinued operations | 2024 | 122,842 | 1,453 | 124,296 |
3 Fuel and energy-related activities (not included in Scope 1 or Scope 2) | metric tonnes of CO2e | Continuing operations | 2024 | 169,779 | -3,725 | 166,054 |
3 Fuel and energy-related activities (not included in Scope 1 or Scope 2) | metric tonnes of CO2e | Discontinued operations | 2024 | 1,178,000 | 3,725 | 1,181,724 |
5 Waste generated in operations | metric tonnes of CO2e | Continuing operations | 2024 | 265 | -1 | 265 |
5 Waste generated in operations | metric tonnes of CO2e | Discontinued operations | 2024 | 3,170 | 1 | 3,170 |
6 Business travelling | metric tonnes of CO2e | Continuing operations | 2024 | 3,256 | -3 | 3,253 |
6 Business travelling | metric tonnes of CO2e | Discontinued operations | 2024 | 3,566 | 3 | 3,569 |
7 Employee commuting | metric tonnes of CO2e | Continuing operations | 2024 | 275 | -14 | 262 |
7 Employee commuting | metric tonnes of CO2e | Discontinued operations | 2024 | 2,295 | 14 | 2,309 |
5.1.3 Water in our operations
5.1.3.1 Water consumption
The water consumption performance statements can be found on page .
Methodology
Water consumption is the amount of water drawn into the boundaries of the sites and not discharged back to the water environment or a third party.
Water withdrawal is the sum of all water drawn into the boundaries of the site from all sources for any use over the course of the reporting period.
Water discharge is the sum of effluents and other water leaving the boundaries of the site and released to surface water, groundwater, seawater, or third parties.
Water withdrawals and discharges are measured based on volumes on invoices, or, if not available, volumes based on meters, which are calibrated regularly per required frequencies.
Run-off storm water is excluded from reporting.
Evaporation ponds: Water evaporated into the air is considered as consumption and is therefore not included as discharge.
In 2024, water withdrawal and discharges exclude seawater used for cooling at our discontinued Fertil plant in the UAE (520.44 million cubic meters). It is a ‘once-through’ system, where seawater intake volumes flow through heat exchangers, and the same volumes are safely discharged uncontaminated back to the sea. We consider this not to constitute a substantial portion, especially given that the volume withdrawn is equivalent to the amount safely discharged back into the sea without contamination.
The denominator of water intensity (m3 consumed / USD net revenue) consists of the turnover (USD 1,086 million), as included in Consolidated statement of profit or loss and other comprehensive income (continuing operations). See also Note 28 to the Consolidated statement of profit or loss and other comprehensive income.
5.1.4 Resource use and circular economy
5.1.4.1 Products and materials
The products and materials performance statements can be found on page .
Methodology
The overall total weight of natural gas used is calculated based on the total amount of natural gas for fuel and feedstock purchased, based on direct measurement, converted from GJ to metric tonnes (0.024, source: Centraal Bureau voor Statistiek CBS and Gasunie).
5.1.4.2 Waste
The waste performance statements can be found on page .
Methodology
Waste reported is waste that leaves the sites based on direct measurement.
Hazardous waste refers to waste which displays one or more of the hazardous properties listed in Annex III of Directive 2008/98/EC of the European Parliament and of the Council on waste, such as batteries and fluorescent bulbs containing mercury.
Waste diverted from disposal:
Preparation for reuse: Any operation by which products and components that are not waste are used again for the same purpose for which they were conceived. This may involve cleaning or small adjustments so they are ready for the next use without significant modification.
Recycling: Any recovery operation by which waste materials are reprocessed into products, materials or substances whether for the original or other purposes. This includes the reprocessing of organic material but does not include energy recovery and reprocessing into materials to be used as fuels or for backfilling operations.
Other recovery operations:
Composting: Recycling/reclamation of organic substances which are not used as solvents (including composting and other biological transformation processes).
Recovery: Any operation the principal result of which is waste serving a useful purpose by replacing other materials which would otherwise have been used to fulfill a particular function, or waste being prepared to fulfill that function, in the plant or in the wider economy.
Waste directed to disposal:
Incineration: The controlled burning of waste at high temperatures with or without energy recovery.
Landfill: A waste disposal site for the deposit of the waste onto or into land.
Other disposal operations: Any other disposal operation not specified.
Restatements
We classify OCIN and segment 'Other' as continuing operations, while Beaumont New Ammonia, OCI Methanol, OTE, and OAD are considered discontinued operations in FY 2025. We restated data as reported in the Annual Report 2024 by reclassifying OTE from continuing operations to discontinued operations.
Indicator | Unit | Scope | Year | As reported in the Annual Report 2024 | 1) Change in scope: divestments | Restated |
|---|---|---|---|---|---|---|
The total amount of waste generated | metric tonnes | Continuing operations | 2024 | 2,488 | -81 | 2,408 |
The total amount of waste generated | metric tonnes | Discontinued operations | 2024 | 6,207 | 81 | 6,287 |
The total amount by weight diverted from disposal | metric tonnes | Continuing operations | 2024 | 236 | -81 | 156 |
The total amount by weight diverted from disposal | metric tonnes | Discontinued operations | 2024 | 2,856 | 81 | 2,937 |
Total non-hazardous waste diverted from disposal - recycling | metric tonnes | Continuing operations | 2024 | 149 | -81 | 69 |
Total non-hazardous waste diverted from disposal - recycling | metric tonnes | Discontinued operations | 2024 | 1,086 | 81 | 1,166 |
Total non-hazardous waste | metric tonnes | Continuing operations | 2024 | 537 | -81 | 456 |
Total non-hazardous waste | metric tonnes | Discontinued operations | 2024 | 3,930 | 81 | 4,011 |
Total non-recycled waste | % | Continuing operations | 2024 | 90.5% | 3.0% | 93.5% |
Total non-recycled waste | % | Discontinued operations | 2024 | 54.0% | -0.7% | 53.3% |
5.1.5 Non-GHG pollution in our operations
5.1.5.1 Pollution of air
The air pollution performance statements can be found on page .
Methodology
Material air emissions concern NOx, N2O, and NH3, and are measured the following ways:
If available, via direct measurement devices, which are calibrated regularly per required frequencies (NOx: 100%, N2O: 100%, NH3: 63%).
If available, regular calibrated stack testing results.
If not available, calculated via standard emission factors based on site-specific factors or published emission factors (EPA AP-42) (NOx: 0%, N2O: 0%, NH3: 37%).
5.1.5.2 Substances of very high concern
The substances of very high concern (SVHC) performance statements can be found on page .
Methodology
All quantities of substances of very high concern that are generated, or left the site during the reporting year are related to melamine and reported based on the CAS numbers, the substance infocards on the ECHA (European Chemicals Agency).
When substances are expected to have a property of concern, or if the substance is under assessment for a property of concern, this is also considered as a property of concern.
5.1.6 Health, safety and wellbeing
5.1.6.1 Health and safety
The health and safety performance statements can be found on page .
Methodology
The health and safety indicators cover own employees, except any fatalities that cover both own employees and contractors.
The classification of occupational incidents follow the US Occupational Safety and Health Administration (OSHA - the US government agency responsible for setting and enforcing workplace safety and health standards) definitions.
A recordable work-related injury or ill health is a work-related injury or ill health that results in any of the following:
death, days away from work, restricted work or transfer to another job, medical treatment beyond first aid, or loss of consciousness; or
significant injury or ill health diagnosed by a physician or other licensed healthcare professional, even if it does not result in death, days away from work, restricted work or job transfer, medical treatment beyond first aid, or loss of consciousness.
Restatements
We classify OCIN and segment 'Other' as continuing operations, while Beaumont New Ammonia, OCI Methanol, OTE, and OAD are considered discontinued operations in FY 2025. We restated data as reported in the Annual Report 2024 by reclassifying OTE from continuing operations to discontinued operations.
Indicator | Unit | Scope | Year | As reported in the Annual Report 2024 | 1) Change in scope: divestments | Restated |
|---|---|---|---|---|---|---|
Total Recordable Injury Rate (TRIR) - employees | per 200,000 hours worked | Continuing operations | 2024 | 0.32 | 0.02 | 0.34 |
Total Recordable Injury Rate (TRIR) - employees | per 200,000 hours worked | Discontinued operations | 2024 | 0.22 | 0.00 | 0.21 |
5.1.7 Human and labor rights
5.1.7.1 Collective bargaining and social dialogue
The collective bargaining and social dialogue performance statements can be found on page .
Methodology
An employee is an individual who is in an employment relationship with OCI Global according to national law or practice.
Unless stated otherwise, employees numbers are reported in head count.
The employee numbers are reported at the end of the reporting period.
Collective bargaining refers to all negotiations which take place between an employer, a group of employers or one or more employers' organisations, on the one hand, and one or more trade unions or, in their absence, the representatives of the workers duly elected and authorised by them in accordance with national laws and regulations, on the other, for:
determining working conditions and terms of employment; and/or
regulating relations between employers and workers; and/or
regulating relations between employers or their organisations and a workers' organisation or workers' organisations.
Restatements
We classify OCIN and segment 'Other' as continuing operations, while Beaumont New Ammonia, OCI Methanol, OTE, and OAD are considered discontinued operations in FY 2025. We restated data as reported in the Annual Report 2024 by reclassifying OTE from continuing operations to discontinued operations.
Indicator | Unit | Scope | Year | As reported in the Annual Report 2024 | 1) Change in scope: divestments | Restated |
|---|---|---|---|---|---|---|
Total employees | headcount | Continuing operations | 2024 | 776 | -122 | 654 |
Total employees | headcount | Discontinued operations | 2024 | 315 | 122 | 437 |
Employees covered by collective bargaining agreements | % (headcount) | Continuing operations | 2024 | 41.5% | 33.6% | 75.1% |
Employees covered by collective bargaining agreements | % (headcount) | Discontinued operations | 2024 | 2.3% | 2.0% | 4.3% |
Employees covered by collective bargaining agreements in the Netherlands | % (headcount) | Continuing operations | 2024 | 72.4% | 10.7% | 83.1% |
Employees covered by collective bargaining agreements in the Netherlands | % (headcount) | Discontinued operations | 2024 | 50.0% | -23.2% | 26.8% |
Employees covered by workers' representatives in the Netherlands | % (headcount) | Continuing operations | 2024 | 72.4% | 10.7% | 83.1% |
Employees covered by workers' representatives in the Netherlands | % (headcount) | Discontinued operations | 2024 | 50.0% | -23.2% | 26.8% |
5.1.7.2 Other human and labor rights
The other human and labor rights performance statements can be found on page .
Methodology
Discrimination can occur directly or indirectly. Direct discrimination occurs when an individual is treated less favourably by comparison to how others, who are in a similar situation, have been or would be treated, and the reason for this is a particular characteristic they hold, which falls under a ‘protected ground’. Indirect discrimination occurs when an apparently neutral rule disadvantages a person or a group sharing the same characteristics. It must be shown that a group is disadvantaged by a decision when compared to a comparator group.
An incident is a legal action or complaint registered through a formal process, or an instance of non-compliance identified through OCI's established procedures.
5.1.8 Responsible business practices
5.1.8.1 Anti-bribery and anti-corruption
The anti-bribery and anti-corruption performance statements can be found on page .
Methodology
Bribery is defined as dishonestly persuading someone to act in your favour by giving them a gift of money or another inducement.
A confirmed incident of corruption or bribery is an incident of corruption or bribery that has been found to be substantiated. Confirmed incidents of corruption or bribery do not include incidents of corruption or bribery that are still under investigation at the end of the reporting period.
Corruption is abuse of entrusted power for private gain, which can be instigated by individuals or organisations.
5.1.8.2 Political influence and lobbying activities
The political influence and lobbying activities performance statements can be found on page .
Methodology
Political contribution means financial or in-kind support provided directly to political parties, their elected representatives or persons seeking political office. Financial contributions can include donations, loans, sponsorships, advance payments for services, or the purchase of tickets for fundraising events and other similar practices. In-kind contributions can include advertising, use of facilities, design and printing, donation of equipment, provision of Board membership, employment or consultancy work for elected politicians or candidates for office.
Indirect political contributions refer to political contributions made through an intermediary organisation such as a lobbyist or charity, or support given to an organisation such as a think tank or trade association linked to or supporting particular political parties or causes.
Lobbying activities are carried out with the objective of influencing the formulation or implementation of policy or legislation, or the decision-making processes of governments, governmental institutions, regulators, European Union institutions, bodies, offices and agencies or standard setters.
5.2 "Safeguard" summaries
Under Commission Delegated Regulation (EU) 2025/1416, we apply a phased‑in approach to the datapoints included in Transitional provisions when preparing the sustainability statement in accordance with the ESRS. This appendix presents the material matters identified through our materiality assessment, explains how these matters are reflected in our strategy and business model, and provides a concise overview of the related targets, policies, and actions.
5.2.1 E4 Biodiversity and ecosystems
The matters related to E4 Biodiversity and ecosystems which have been assessed to be material as a result of our double materiality assessment, and phased-in under the Quick Fix Delegated Act, are:
Land use change related to products
Biodiversity and ecosystem services affected by product use
5.2.1.1 Strategy
Due to divestments and OCI’s strategic reorientation, our sustainability approach is evolving.
The transition to new ownership enables continued progress, while OCI remains focused on effectively managing continuing operations. In our continuing operations, we promote products and services to minimize negative impacts and dependencies on the environment (e.g., biodiversity and ecosystems) and maximize positive impacts on society (land use changes).
Our nitrogen fertilizers provide key nutrients for crops, and in our continuing operations we remain committed to producing these in more sustainable ways, as well as supporting sustainable and regenerative farming techniques.
5.2.1.2 Policies
Environmental Policy
Our Environmental Policy reflects our commitment to be an environmental steward. For more specific information on our Environmental Policy, such as its scope of application, evaluation of its effectiveness, and related accountabilities, refer to the section Our policies.
For the topic of biodiversity, the policy encompasses identification and management of nature-related impacts, risks, dependencies and opportunities (assessing physical and transition risks in operations); ecosystem impact minimization (reducing impacts and promoting biodiversity through sustainable land use); biodiversity promotion (mitigating impacts in line with international frameworks, such as Post-2020 Global Biodiversity Framework, Taskforce on Nature-related Financial Disclosures, the EU Biodiversity Strategy for 2030 and COP25 Montreal-Kunming biodiversity targets); sustainable intensification (fostering biodiversity in the agri-food supply chain); and sustainable sourcing (ensuring transparent practices to avoid deforestation).
5.2.1.3 Actions
Reference is made to Our actions for a description of the actions during 2025.
5.2.1.4 Targets
We have not set targets due to the strategic review of our business and divestment of several facilities, which has changed the material structure of our business. Once our strategic review is completed and new strategy has been developed, we will update our targets, if applicable, in line with the revised direction for the remaining business. Although we have not set targets, refer to our Sustainability Governance Framework to see how we still track policy and action effectiveness on material impacts, risks, and opportunities, using defined processes, ambition, and progress indicators.
5.2.2 S1 Own workforce
The matters related to S1 Own workforce which have been assessed to be material as a result of our double materiality assessment, and phased-in under the Quick Fix Delegated Act, are:
Collective bargaining (S1-8.60)
Social protection (S1-11)
Health & safety metrics (S1-14.88d-e)
Work-life balance (S1-15)
5.2.2.1 Strategy
Our health, safety and environment (HSE) approach focuses on the following priorities:
Commitment to zero injuries.
Focus on operational excellence.
Continuous improvement of our processes.
Health and wellness of all employees.
We refer to 3.1 Health, safety and wellbeing for more information.
Our employees can join a union, works council, employee association, trade union, or similar labor organization in line with local regulations. We strive to maintain productive relationships with the labor organizations representing our employees and engage with them regularly.
We refer to 3.2 Human and labor rights for information on our approach to human and labor rights.
We refer to Our approach to responsible business practices for information on our approach to responsible business practices.
5.2.2.2 Policies
Stakeholder Engagement Policy
Our Stakeholder Engagement Policy sets out the guiding principles of our engagement with our stakeholders. For more specific information on our Stakeholder Engagement Policy, such as its scope of application, evaluation of its effectiveness, and related accountabilities, refer to section Our policies.
The scope of the Policy extends to all relevant stakeholders as identified by OCI, including customers, investors, governmental bodies, regulators, suppliers, employees, and communities, thus covering both upstream and downstream engagement across the value chain. OCI monitors and evaluates stakeholder engagement based on key factors such as frequency, quality, outcomes, and follow-up.
Code of Conduct
Our Code of Conduct outlines OCI's commitment to responsible, efficient, and transparent business practices, on topics such as ethical behavior, compliance with laws, respect for human rights, environmental sustainability, and fair competition. Our Code of Conduct ensures that material negative impacts on affected stakeholders are addressed through reporting mechanisms like the Whistleblower hotline, supported by transparent and fair remediation processes and through our stakeholder engagement practices. For more specific information on our Human Rights Policy, such as its scope of application, evaluation of its effectiveness, and related accountabilities, refer to section Our policies.
Business Partner Code of Conduct
We encourage our business partners through our Business Partner Code of Conduct to uphold similar standards, ensuring compliance with international human rights and environmental laws to prevent and mitigate such impacts. For more specific information on our Business Partner Code of Conduct, such as its scope of application, evaluation of its effectiveness, and related accountabilities, refer to section Our policies.
Health and Safety Policy
We maintain a set of Health & Safety standards covering various topics, including but not limited to: Working at Height, Learning from Incidents, Self-Assessment of the Site’s HSE Management System, and Personal Protective Equipment. These standards are designed to ensure that all work is carried out safely, efficiently, and in compliance with regulatory and organisational requirements. For more specific information on our Business Partner Code of Conduct, such as its scope of application, evaluation of its effectiveness, and related accountabilities, refer to section Our policies.
5.2.2.3 Actions
Reference is made to Our actions and Our actions for a description of the actions taken during 2025.
5.2.2.4 Targets
We have not set targets due to the strategic review of our business and divestment of several facilities, which has changed the material structure of our business. Once our strategic review is completed and new strategy has been developed, we will update our targets, if applicable, in line with the revised direction for the remaining business. Although we have not set targets, refer to our Sustainability Governance Framework for how we still track policy and action effectiveness on material impacts, risks, and opportunities, using defined processes, ambition, and progress indicators.
5.2.3 S2 Workers in the value chain
The matters related to S2 Workers in the value chain which have been assessed to be material as a result of our double materiality assessment, and phased-in under the Quick Fix Delegated Act, are:
Health & safety of contractors
Minimum social safeguards set out in the (Business Partner) Code of Conduct
Freedom of association
Other human rights (child labor, forced labor, trade union rights)
5.2.3.1 Strategy
Our health, safety and environment (HSE) approach focuses on the following priorities:
Commitment to zero injuries.
Focus on operational excellence.
Continuous improvement of our processes.
Health and wellness of all employees.
We refer to 3.1 Health, safety and wellbeing for more information.
Our employees can join a union, works council, employee association, trade union, or similar labor organization in line with local regulations. We strive to maintain productive relationships with the labor organizations representing our employees and engage with them regularly.
We refer to 3.2 Human and labor rights for information on our approach to human and labor rights.
We refer to Our approach to responsible business practices for information on our approach to responsible business practices.
5.2.3.2 Policies
Stakeholder Engagement Policy
Our Stakeholder Engagement Policy sets out guiding principles of our engagement with our stakeholders. For more specific information on our Stakeholder Engagement Policy, such as its scope of application, evaluation of its effectiveness, and related accountabilities, refer to section Our policies.
The scope of the Policy extends to all relevant stakeholders as identified by OCI, including customers, investors, governmental bodies, regulators, suppliers, employees, and communities, thus covering both upstream and downstream engagement across the value chain. OCI monitors and evaluates stakeholder engagement based on key factors such as frequency, quality, outcomes, and follow-up.
Code of Conduct
Our Code of Conduct outlines OCI's commitment to responsible, efficient, and transparent business practices, on topics such as ethical behavior, compliance with laws, respect for human rights, environmental sustainability, and fair competition. Our Code of Conduct ensures that material negative impacts on affected stakeholders are addressed through reporting mechanisms like the Whistleblower hotline, supported by transparent and fair remediation processes and through our stakeholder engagement practices. For more specific information on our Human Rights Policy, such as its scope of application, evaluation of its effectiveness, and related accountabilities, refer to section Our policies.
Business Partner Code of Conduct
We encourage our business partners through our Business Partner Code of Conduct to uphold similar standards, ensuring compliance with international human rights and environmental laws to prevent and mitigate such impacts. For more specific information on our Business Partner Code of Conduct, such as its scope of application, evaluation of its effectiveness, and related accountabilities, refer to section Our policies.
Health and Safety Policy
We maintain a set of Health & Safety standards covering various topics, including but not limited to: Working at Height, Learning from Incidents, Self-Assessment of the Site’s HSE Management System, and Personal Protective Equipment. These standards are designed to ensure that all work is carried out safely, efficiently, and in compliance with regulatory and organisational requirements. For more specific information on our Business Partner Code of Conduct, such as its scope of application, evaluation of its effectiveness, and related accountabilities, refer to section Our policies.
5.2.3.3 Actions
Reference is made to Our actions , Our actions and Our actions for a description of the actions taken during 2025.
5.2.3.4 Targets
We have not set targets due to the strategic review of our business and divestment of several facilities, which has changed the material structure of our business. Once our strategic review is completed and new strategy has been developed, we will update our targets, if applicable, in line with the revised direction for the remaining business. Although we have not set targets, refer to our Sustainability Governance Framework to see how we still track policy and action effectiveness on material impacts, risks, and opportunities, using defined processes, ambition, and progress indicators.
5.2.4 S3 Affected communities
The matters related to S3 Affected communities which have been assessed to be material as a result of our double materiality assessment, and phased-in under the Quick Fix Delegated Act, are:
Health and safety of the community
5.2.4.1 Strategy
Our health, safety and environment (HSE) approach focuses on the following priorities:
Commitment to zero injuries.
Focus on operational excellence.
Continuous improvement of our processes.
Health and wellness of all employees.
We refer to 3.1 Health, safety and wellbeing for more information.
5.2.4.2 Policies
Stakeholder Engagement Policy
Our Stakeholder Engagement Policy sets out guiding principles of our engagement with our stakeholders. For more specific information on our Stakeholder Engagement Policy, such as its scope of application, evaluation of its effectiveness, and related accountabilities, refer to section Our policies.
The scope of the Policy extends to all relevant stakeholders as identified by OCI, including customers, investors, governmental bodies, regulators, suppliers, employees, and communities, thus covering both upstream and downstream engagement across the value chain. OCI monitors and evaluates stakeholder engagement based on key factors such as frequency, quality, outcomes, and follow-up.
Code of Conduct
Our Code of Conduct outlines OCI's commitment to responsible, efficient, and transparent business practices, on topics such as ethical behavior, compliance with laws, respect for human rights, environmental sustainability, and fair competition. Our Code of Conduct ensures that material negative impacts on affected stakeholders are addressed through reporting mechanisms like the Whistleblower hotline, supported by transparent and fair remediation processes and through our stakeholder engagement practices. For more specific information on our Human Rights Policy, such as its scope of application, evaluation of its effectiveness, and related accountabilities, refer to section Our policies.
Business Partner Code of Conduct
We encourage our business partners through our Business Partner Code of Conduct to uphold similar standards, ensuring compliance with international human rights and environmental laws to prevent and mitigate such impacts. For more specific information on our Business Partner Code of Conduct, such as its scope of application, evaluation of its effectiveness, and related accountabilities, refer to section Our policies.
Health and Safety Policy
We maintain a set of Health & Safety standards covering various topics, including but not limited to: Working at Height, Learning from Incidents, Self-Assessment of the Site’s HSE Management System, and Personal Protective Equipment. These standards are designed to ensure that all work is carried out safely, efficiently, and in compliance with regulatory and organisational requirements. For more specific information on our Business Partner Code of Conduct, such as its scope of application, evaluation of its effectiveness, and related accountabilities, refer to section Our policies.
5.2.4.3 Actions
Reference is made to Our actions for a description of the actions taken during 2025.
5.2.4.4 Targets
We have not set targets due to the strategic review of our business and divestment of several facilities, which has changed the material structure of our business. Once our strategic review is completed and new strategy has been developed, we will update our targets, if applicable, in line with the revised direction for the remaining business. Although we have not set targets, refer to our Sustainability Governance Framework to see how we still track policy and action effectiveness on material impacts, risks, and opportunities, using defined processes, ambition, and progress indicators.
5.2.5 S4 Consumers and end-users
The matters related to S4 Consumers and end-users which have been assessed to be material as a result of our double materiality assessment, and phased-in under the Quick Fix Delegated Act, are:
Health & safety of the consumer/end-user affected by product use
Food production/food security
Application education (4R)
Distribution and commercialization of Substances of Very High Concern
Minimum social safeguards set out in the Code of Conduct
5.2.5.1 Strategy
Due to divestments and OCI’s strategic reorientation, our sustainability approach is evolving.
The transition to new ownership enables continued progress, while OCI remains focused on effectively managing continuing operations. In our continuing operations, we promote products and services to minimize negative impacts and dependencies on the environment (e.g., climate change, air, water and soil pollution, biodiversity and ecosystems) and maximize positive impacts on society (e.g., food security, land use changes, health and safety).
Our nitrogen fertilizers provide key nutrients for crops, and in our continuing operations we remain committed to producing these in more sustainable ways, as well as supporting sustainable and regenerative farming techniques.
We refer to Our approach to responsible business practices for information on our approach to responsible business practices.
5.2.5.2 Policies
Stakeholder Engagement Policy
Our Stakeholder Engagement Policy sets out guiding principles of our engagement with our stakeholders. For more specific information on our Stakeholder Engagement Policy, such as its scope of application, evaluation of its effectiveness, and related accountabilities, refer to the section Our policies.
The scope of the Policy extends to all relevant stakeholders as identified by OCI, including customers, investors, governmental bodies, regulators, suppliers, employees, and communities, thus covering both upstream and downstream engagement across the value chain. OCI monitors and evaluates stakeholder engagement based on key factors such as frequency, quality, outcomes, and follow-up.
Code of Conduct
Our Code of Conduct outlines OCI's commitment to responsible, efficient, and transparent business practices, on topics such as ethical behavior, compliance with laws, respect for human rights, environmental sustainability, and fair competition. Our Code of Conduct ensures that material negative impacts on affected stakeholders are addressed through reporting mechanisms like the Whistleblower hotline, supported by transparent and fair remediation processes and through our stakeholder engagement practices. For more specific information on our Human Rights Policy, such as its scope of application, evaluation of its effectiveness, and related accountabilities, refer to the section Our policies.
Business Partner Code of Conduct
We encourage our business partners through our Business Partner Code of Conduct to uphold similar standards, ensuring compliance with international human rights and environmental laws to prevent and mitigate such impacts. For more specific information on our Business Partner Code of Conduct, such as its scope of application, evaluation of its effectiveness, and related accountabilities, refer to the section Our policies.
Health and Safety Policy
We maintain a set of Health & Safety standards covering various topics, including but not limited to: Working at Height, Learning from Incidents, Self-Assessment of the Site’s HSE Management System, and Personal Protective Equipment. These standards are designed to ensure that all work is carried out safely, efficiently, and in compliance with regulatory and organisational requirements. For more specific information on our Business Partner Code of Conduct, such as its scope of application, evaluation of its effectiveness, and related accountabilities, refer to the section Our policies.
Environmental Policy
Our Environmental Policy reflects our commitment to be an environmental steward. For more specific information on our Environmental Policy, such as its scope of application, evaluation of its effectiveness, and related accountabilities, refer to the section Our policies.
5.2.5.3 Actions
Reference is made to Our actions and Our actions for a description of the actions taken during 2025.
5.2.5.4 Targets
We have not set targets due to the strategic review of our business and divestment of several facilities, which has changed the material structure of our business. Once our strategic review is completed and new strategy has been developed, we will update our targets, if applicable, in line with the revised direction for the remaining business. Although we have not set targets, refer to our Sustainability Governance Framework to see how we still track policy and action effectiveness on material impacts, risks, and opportunities, using defined processes, ambition, and progress indicators.
5.3 ESRS index
Disclosure requirement | Reference |
|---|---|
ESRS 2 General disclosures | |
BP-1 General basis for preparation of sustainability statements | 1.1.1 General basis for preparation of sustainability statement |
BP-2 Disclosures in relation to specific circumstances | |
GOV-1 The role of the administrative, management and supervisory bodies | 1.2.1 The role of the administrative, management and supervisory bodies |
GOV-2 Information provided to and sustainability matters addressed by the undertaking’s administrative, management and supervisory bodies | |
GOV-3 Integration of sustainability-related performance in incentive schemes | 1.2.3 Integration of sustainability-related performance in incentive schemes |
GOV-4 Statement on due diligence | |
GOV-5 Risk management and internal controls over sustainability reporting | 1.2.5 Risk management and internal controls over sustainability reporting |
SBM-1 Strategy, business model and value chain | |
SBM-2 Interests and views of stakeholders | |
SBM-3 Material impacts, risks and opportunities and their interaction with strategy and business model | |
IRO-2 Disclosure requirements in ESRS covered by the undertaking’s sustainability statement | 1.3 Materiality assessment , 5.3 ESRS index , 5.4 Data points that derive from other EU legislation |
MDR-P Policies adopted to manage material sustainability matters | Our policies , Our policies , Our policies , Our policies , Our policies , Our policies , Our policies , Our policies |
MDR-A Actions and resources in relation to material sustainability matters | Our actions , Our actions , Our actions , Our actions , Our actions , Our actions , Our actions |
MDR-M Metrics in relation to material sustainability matters | 2.1 Climate change action , 2.2 Product stewardship , 2.3 Water in our operations , 2.4 Resource use and circular economy , 2.5 Non-GHG pollution in our operations , 3.1 Health, safety and wellbeing ,3.2 Human and labor rights , 4.1 Responsible business practices |
MDR-T Tracking effectiveness of policies and actions through targets | Our targets , Our targets , Our targets , Our targets , Our targets , Our targets , Our targets , Our targets |
ESRS E1 Climate change | |
GOV-3 Integration of sustainability related performance in incentive schemes | 1.2.3 Integration of sustainability-related performance in incentive schemes |
E1-1 Transition plan for climate change mitigation | |
SBM-3 Material impacts, risks and opportunities and their interaction with strategy and business model | |
E1-2 Policies related to climate change mitigation and adaptation | |
E1-3 Actions and resources in relation to climate change policies | |
E1-4 Targets related to climate change mitigation and adaptation | |
E1-5 Energy consumption and mix | |
E1-6 Gross Scopes 1, 2, 3 and Total GHG emissions | 2.1.5 Total GHG emissions disaggregated by Scopes 1 and 2 and significant Scope 3 |
E1-7 GHG removals and GHG mitigation projects financed through carbon credits | 2.1.6 GHG removals and GHG mitigation projects financed through carbon credits |
E1-9 Anticipated financial effects from material physical and transition risks and potential climate-related opportunities | Phased-in |
EU Taxonomy | |
ESRS E2 Pollution | |
IRO-1 Description of the processes to identify and assess material pollution-related impacts, risks and opportunities | |
E2-1 Policies related to pollution | |
E2-2 Actions and resources related to pollution | |
E2-3 Targets related to pollution | |
E2-4 Pollution of air, water and soil | |
E2-5 Substances of concern and substances of very high concern | |
E2-6 Anticipated financial effects from pollution-related impacts, risks and opportunities | Phased-in |
ESRS E3 Water and marine resources | |
IRO-1 Description of the processes to identify and assess material water and marine resources-related impacts, risks and opportunities | |
E3-1 Policies related to water and marine resources | |
E3-2 Actions and resources related to water and marine resources | |
E3-3 Targets related to water and marine resources | |
E3-4 Water consumption | |
E3-5 Anticipated financial effects from water and marine resources-related impacts, risks and opportunities | Phased-in |
ESRS E4 Biodiversity and ecosystems | |
"Safeguard" summaries | |
ESRS E5 Resource use and circular economy | |
IRO-1 Description of the processes to identify and assess material resource use and circular economy-related impacts, risks and opportunities | |
E5-1 Policies related to resource use and circular economy | |
E5-2 Actions and resources related to resource use and circular economy | |
E5-3 Targets related to resource use and circular economy | |
E5-4 Resource inflows | |
E5-5 Resource outflows | |
E5-6 Anticipated financial effects from resource use and circular economy-related impacts, risks and opportunities | Phased-in |
ESRS S1 Own workforce | |
SBM-2 Interests and views of stakeholders | |
SBM-3 Material impacts, risks and opportunities and their interaction with strategy and business model | |
S1-1 Policies related to own workforce | |
S1-3 Processes to remediate negative impacts and channels for own workers to raise concerns | |
S1-4 Taking action on material impacts on own workforce, and approaches to mitigating material risks and pursuing material opportunities related to own workforce, and effectiveness of those actions | |
S1-5 Targets related to managing material negative impacts, advancing positive impacts, and managing material risks and opportunities | |
S1-8 Collective bargaining coverage and social dialogue | |
S1-11 Social protection | Phased-in |
S1-14 Health and safety metrics | |
S1-15 Work-life balance metrics | Phased-in |
S1-17 Incidents, complaints and severe human rights impacts | |
ESRS S2 Workers in the value chain | |
"Safeguard" summaries | |
ESRS S3 Affected communities | |
"Safeguard" summaries | |
ESRS S4 Consumers and end-users | |
"Safeguard" summaries | |
ESRS G1 Business conduct | |
GOV-1 The role of the administrative, supervisory and management bodies | Board profile , Board summary of skills and experience , 1.5 Sustainability governance framework |
IRO-1 Description of the processes to identify and assess material impacts, risks and opportunities | |
G1-1 Corporate culture and business conduct policies | OCI corporate culture , Our Code of Conduct and Compliance Framework , Our policies |
G1-3 Prevention and detection of corruption and bribery | |
G1-4 Confirmed incidents of corruption or bribery | |
G1-5 Political influence and lobbying activities | |
Other data points, which are not included in the table above, are considered either not material or not relevant for OCI.
5.4 Data points that derive from other EU legislation
Disclosure Requirement and related datapoint that derives from other EU legislation | Reference |
|---|---|
ESRS 2 GOV-4 Statement on due diligence paragraph 30 | |
ESRS 2 SBM-1 Involvement in activities related to chemical production paragraph 40 (d) ii | |
ESRS E1-1 Transition plan to reach climate neutrality by 2050 paragraph 14 | |
ESRS E1-4 GHG emission reduction targets paragraph 34 | |
ESRS E1-5 Energy consumption from fossil sources disaggregated by sources (only high climate impact sectors) paragraph 38 | |
ESRS E1-5 Energy intensity associated with activities in high climate impact sectors paragraphs 40 to 43 | 2.1.2 Energy intensity , 2.1.1 Energy consumption and mix , 5.1.1.2 Energy intensity |
ESRS E1-6 Gross Scope 1, 2, 3 and Total GHG emissions paragraph 44 | 2.1.5 Total GHG emissions disaggregated by Scopes 1 and 2 and significant Scope 3 |
ESRS E1-6 Gross GHG emissions intensity paragraphs 53 to 55 | 2.1.5 Total GHG emissions disaggregated by Scopes 1 and 2 and significant Scope 3 , 2.1.4 GHG Intensity , 5.1.1.4 GHG Intensity |
ESRS E2-4 Amount of each pollutant listed in Annex II of the EPRTR Regulation (European Pollutant Release and Transfer Register) emitted to air, water and soil, paragraph 28 | |
ESRS E3-1 Water and marine resources paragraph 9 | |
ESRS E3-4 Total water consumption in m3 per net revenue on own operations paragraph 29 | |
ESRS E5-5 Non-recycled waste paragraph 37 (d) | |
ESRS 2- SBM 3 - S1 Risk of incidents of forced labor paragraph 14 (f) | |
ESRS S1-1 Human rights policy commitments paragraph 20 | |
ESRS S1-1 Processes and measures for preventing trafficking in human beings paragraph 22 | |
ESRS S1-1 Workplace accident prevention policy or management system paragraph 23 | |
ESRS S1-3 Grievance/complaints handling mechanisms paragraph 32 (c) | |
ESRS S1-14 Number of fatalities and number and rate of work-related accidents paragraph 88 (b) and (c) | |
ESRS S1-17 Incidents of discrimination paragraph 103 (a) | |
ESRS 2 SBM3 S2 Significant risk of child labor or forced labor in the value chain paragraph 11 (b) | |
ESRS G1-1 Protection of whistleblowers paragraph 10 (d) | |
ESRS G1-4 Fines for violation of anti-corruption and anti-bribery laws paragraph 24 (a) | |
ESRS G1-4 Standards of anti-corruption and anti-bribery paragraph 24 (b) |
Other data points listed in ESRS 2 Appendix B, which are not included in the table above, are considered not material, not relevant, or phased-in for OCI.
7 Other Information
Extract from the articles of association relating to net profit/(loss) appropriation
Article 26. ‘Profits and Distributions’.
26.1 The Board may decide that the profits realized during a financial year will fully or partially be appropriated to increase and/or from reserves.
26.2 The profits remaining after application of Article 26.1 shall be put at the disposal of the General Meeting. The Board shall make a proposal for that purpose. A proposal to pay a dividend shall be dealt with as a separate agenda item at the General Meeting of Shareholders.
26.3 Distributions from the Company’s distributable reserves are made pursuant to a resolution of the General Meeting at the proposal of the Board.
26.4 Provided it appears from an interim statement of assets signed by the Board that the requirement mentioned in Article 26.8 concerning the position of the Company’s assets has been fulfilled, the Board may make one or more interim distributions to the holders of Shares.
26.5 The Board may decide that a distribution on Shares shall not take place as a cash payment but as a payment in Shares, or decide that holders of Shares shall have the option to receive a distribution as a cash payment and / or as a payment in Shares, out of the profit and / or at the expense of reserves, provided that the Board is designated by the General Meeting pursuant to Articles 6.2. The Board shall determine the conditions applicable to the aforementioned choices.
26.6 The Company’s policy on reserves and dividends shall be determined and can be amended by the Board. The adoption and thereafter each amendment of the policy on reserves and dividends shall be discussed and accounted for at the General Meeting of Shareholders under a separate agenda item.
26.7 The Company may further have a policy with respect to profit participation for employees which policy will be established by the Board.
26.8 Distributions may be made only insofar as the Company’s equity exceeds the amount of the paid in and called up part of the issued capital, increased by the reserves which must be kept by virtue of the law or these Articles of Association.
Independent auditor's report
To: the general meeting and the board of directors of OCI N.V.
Report on the audit of the financial statements 2025
Our opinion
In our opinion, the financial statements of OCI N.V. ('the Company') give a true and fair view of the financial position of the Company and the Group (the Company together with its subsidiaries) as at 31 December 2025, and of its result and its cash flows for the year then ended in accordance with IFRS Accounting Standards as adopted by the European Union ('EU') and with Part 9 of Book 2 of the Dutch Civil Code.
What we have audited
We have audited the accompanying financial statements 2025 of OCI N.V., Amsterdam, the Netherlands. The financial statements comprise the consolidated financial statements of the Group and the Company financial statements.
The financial statements comprise:
the consolidated and parent company statement of financial position as at 31 December 2025;
the following consolidated and parent company statements for 2025: the statement of profit or loss and other comprehensive income, statement of changes in equity and statement of cash flows; and
the notes to the consolidated and parent company financial statements, including material accounting policy information and other explanatory information.
The financial reporting framework applied in the preparation of the financial statements is IFRS Accounting Standards as adopted by the EU and the relevant provisions of Part 9 of Book 2 of the Dutch Civil Code.
The basis for our opinion
We conducted our audit in accordance with Dutch law, including the Dutch Standards on Auditing. We have further described our responsibilities under those standards in the section 'Our responsibilities for the audit of the financial statements' of our report.
We believe that the audit evidence we have obtained is sufficient and appropriate to provide a basis for our opinion.
Independence
We are independent of OCI N.V. in accordance with the European Union Regulation on specific requirements regarding statutory audit of public-interest entities, the 'Wet toezicht accountantsorganisaties' (Wta, Audit firms supervision act), the 'Verordening inzake de onathankelijkheid van accountants bij assuranceopdrachten' (ViO, Code of Ethics for Professional Accountants, a regulation with respect to independence) and other relevant independence regulations in the Netherlands. Furthermore, we have complied with the 'Verordening gedrags- en beroepsregels accountants' (VGBA, Dutch Code of Ethics).
Our audit approach
We designed our audit procedures with respect to the key audit matters, fraud and going concern, and the matters resulting from that, in the context of our audit of the financial statements as a whole and in forming our opinion thereon. Therefore, we do not provide separate opinions or conclusions on information in support of our opinion, such as our findings and observations related to individual key audit matters and the audit approach to address fraud risk and going concern.
Overview and context
OCI N.V. is a producer and distributor of hydrogen products providing fertilisers, fuels and feedstock to agricultural, transportation and industrial customers around the world. The Group is comprised of several components and therefore we considered our group audit scope and approach as set out in the section 'The scope of our group audit'.
As stated in the CEO letter, the financial year 2025 saw management continue to execute major strategic transactions, including the sale of OCI Global Methanol and the announced divestiture of the Ammonia distribution and terminal business, resulting in significant balance sheet deleveraging and substantial cash returns to shareholders. Additionally, prior strategic transactions required ongoing management oversight of post-close matters such as contingent considerations, indemnifications, and construction management at the Beaumont New Ammonia (BNA) facility.
Accordingly, in preparing the financial statements the board of directors made important judgments, for example, in assessing IFRS compliance of accounting policies applied and disclosures included in the financial statements, and making significant accounting estimates in measuring contingent considerations, indemnifications and other contractual liabilities, and estimating the indirect impact that the 2025 and prior divestments may have on the recognition, measurement and presentation of the continuing operations. In Note 5 of the consolidated financial statements, the Company describes the areas of judgment in applying accounting policies and the key sources of estimation uncertainty.
We considered the valuation of the financial liabilities for Clean Ammonia, the impairment assessment of the OCI Nitrogen Cash Generating Unit (CGU) and the valuation of Indemnifications for Fertiglobe to be key audit matters as set out in the section " Key audit matters" of this report, given the significant estimation uncertainty, the judgemental nature, the magnitude of the balances involved and the related higher inherent risk of material misstatement.
Other areas of focus that we do not consider to be key audit matters were the sale of the Methanol business, the sale of the Ammonia distribution and terminal business, the proposed transaction with Orascom Construction and the impairment assessment of the Company's investment in OCI Intermediate B.V. as included in the parent company financial statements.
OCI N .V. assessed the financial implications of climate change and the carrying values of the assets and liabilities that are presented as continuing operations. As disclosed within Note 5 of the consolidated financial statements, due to the absence of any new potential material financial effects of climate change impacting the carrying values of assets and liabilities of the continuing operations, we did not consider this a key audit matter.
We ensured that the audit teams at both group and component level included the appropriate skills and competences which are needed for the audit of the group. We therefore included experts and specialists in the areas of IT, tax, treasury, remuneration and valuations in our team.
The outline of our audit approach was as follows:
Materiality |
|
Audit scope |
We conducted audit work covering 9 components in 2 countries locations.
|
Key audit matters |
|
Materiality
The scope of our audit was influenced by the application of materiality, which is further explained in the section 'Our responsibilities for the audit of the financial statements'.
Based on our professional judgement we determined certain quantitative thresholds for materiality, including the overall materiality for the financial statements as a whole as set out in the table below. These, together with qualitative considerations, helped us to determine the nature, timing and extent of our audit procedures on the individual financial statement line items and disclosures and to evaluate the effect of identified misstatements, both individually and in aggregate, on the financial statements as a whole and on our opinion.
Overall group materiality | USD 18.1 million (2024: USD 52.0 million). |
Basis for determining materiality | We used our professional judgement to determine overall materiality. As a basis for our judgement, we used 5% of net profit adjusted for the net foreign exchange loss of USD 177.9 million. |
Rationale for benchmark applied | We used net profit as the primary benchmark, a generally accepted auditing practice, based on our analysis of the common information needs of the users of the financial statements. We made the adjustment for the net foreign exchange loss as this relates to the non cash currency depreciation of the USD impacting large cash and bond balances, held in an EUR functional currency entity and therefore revaluated to USD for group reporting purposes. We believe that the revaluation does not reflect the actual performance of the business. On this basis, we believe that net profit adjusted for the net foreign exchange loss is the most relevant metric for the financial performance of the Company. |
Component materiality | Based on our judgement, we allocate materiality to each component in our audit scope that is less than our overall group materiality. The range of materiality allocated across components was between USD 5 million and USD 18 million. |
We also take misstatements and/or possible misstatements into account that, in our judgement, are material for qualitative reasons.
We agreed with the board of directors that we would report to them any misstatement identified during our audit above USD 1 million (2024: USD 2 million) as well as misstatements below that amount that, in our view, warranted reporting for qualitative reasons.
The scope of our group audit
OCI N.V. is the parent company of a group of entities. The financial information of this group is included in the consolidated financial statements of OCI N.V.
We are responsible for the identification and assessment of the risks of material misstatement of the financial statements of the group, including those with respect to the consolidation process. Based on our risk assessment, we tailored the scope of our audit to ensure that we, in aggregate, performed sufficient work on the financial statements to enable us to provide an opinion on the financial statements as a whole.
In setting the scope of our group audit we determined what audit work needed to be performed at group level or component level and whether involvement of component auditors was necessary. Based on this outcome, we subjected 2 components to audits of their complete financial information, as those components are considered significant due to risk or size. We further subjected 6 components to specific risk-focussed audit procedures due to their relative financial significance and in order to obtain sufficient appropriate audit evidence for the reported profit from discontinued operations and related disclosures. In addition, we subjected 1 component to specific audit procedures to achieve appropriate coverage on financial statement line items in the consolidated financial statements.
In total, in performing these procedures, we achieved the following coverage on the financial line items:
Revenue | 98% |
Total assets | 93% |
Net profit | 100% |
None of the remaining components represented more than 1% of total group revenue or total group assets. For those remaining components we performed, among other things, analytical procedures to corroborate our assessment that there were no significant risks of material misstatements within those components.
For all components in scope of the group audit, except for the parent company, we used component auditors who are familiar with the local laws and regulations to perform the audit work.
Where component auditors performed the work, we determined the nature, timing and extent of direction and supervision of the component auditors and review of their work. We furthermore:
Issued group audit instructions to component auditors to set expectations for the component auditor's work and facilitate our direction and supervision of the component auditor and review of their work.
Participated in discussions with component auditors as part of planning the engagement, including when we as the group auditor assigned tasks or procedures such as the performance of risk assessment procedures or determining the nature, timing and extent of audit responses to identified and assessed risks of material misstatement to component auditors.
Communicated with component auditors throughout the course of the group audit, either virtually by leveraging technology solutions, in-person meetings (e.g., as part of a site visit to the component location), or through a combination of these, in order to monitor the progress of the component auditor's work. These ongoing communications included matters affecting the execution, completion and reporting of the group audit.
Reviewed relevant parts of the component auditor's work including the component auditor's communication of matters relevant to our conclusion with regard to the group audit. Our review of the component auditor's work took place throughout the engagement. This included virtual reviews, including the review of component auditor's working papers.
Reviewed formal written communications prepared by the component auditor for management of the component.
Attended certain key client meetings (e.g. the closing meeting) between the component auditor and component management.
The group engagement team performed the audit work on the group consolidation, financial statement disclosures and a number of more complex items. This included, among others, management's significant estimates stemming from the strategic transactions, impairment testing, share-based payments, obtaining an understanding of the IT general controls of the SAP S/4 Hana system and the assessment of the impact of whistle-blower allegations monitored at the corporate headquarters.
By performing the procedures outlined above at the components, combined with additional procedures exercised at group level, we have been able to obtain sufficient and appropriate audit evidence on the Group's financial information, to provide a basis for our opinion on the financial statements.
Audit approach fraud risks
We identified and assessed the risks of material misstatements in the financial statements due to fraud. During our audit we obtained an understanding of OCI N.V. and its environment and the components of the internal control system. This included the board of directors' risk assessment process, the board of directors' process for responding to the risks of fraud and monitoring the internal control system. We refer to Chapter 4 'Risk management' of the annual report where the board of directors describes its procedures in respect of the risk of fraud and non-compliance with laws and regulations.
We evaluated the design and implementation of relevant aspects of the internal control system with respect to the risks of material misstatements due to fraud and in particular the fraud risk assessment, as well as the company's compliance framework which incudes, among other things, obtaining an understanding of the Company's code of conduct, whistleblower procedures, anti-bribery and anti-corruption policy, competition policy, privacy and data protection policy, business partner code of conduct, sanctions policy and its procedures to investigate indications of possible fraud and non-compliance. We also evaluated the impact of the company's strategic reorientation on the control environment, if any, as significant transformations generally can create risks, also in relation to fraud.
We asked members of the board of directors and the executive committee as well as the internal audit, legal, compliance, group finance departments and local component management whether they are aware of any actual or suspected fraud. This did not result in signals of actual or suspected fraud that may lead to a material misstatement.
As part of our process of identifying fraud risks, we evaluated fraud risk factors with respect to financial reporting fraud, misappropriation of assets and bribery and corruption. We evaluated whether these factors indicate that a risk of material misstatement due to fraud is present.
We identified the following fraud risks and performed the following specific procedures:
Identified fraud risks | Our audit work and observations |
|---|---|
Management override of controls Management is in a unique position to perpetrate fraud because of Management's ability to manipulate accounting records and prepare fraudulent financial statements by overriding controls that otherwise appear to be operating effectively. That is why, in all our audits, we pay attention to the risk of management override of controls in relation to:
| We evaluated the design and implementation of internal controls covering the generation and processing of journal entries and making estimates. We performed journal entry testing by selecting journal entries based on risk criteria such as unexpected account combinations and the recording of journal entries by unexpected users. In addition, we tested consolidation journal entries, focusing on testing entries that affect results in the relevant fiscal year. These procedures include, among other things, inspection of the entries to source documentation and verifying the business nature of the entries recorded. We performed substantive audit procedures on significant transactions outside the normal course of business for the Group, including but not limited to the accounting and presentation of the sales that occurred during the year and the announced disposal of the Ammonia distribution business. We also performed audit procedures to evaluate areas of significant judgement for bias by the Company's management, including but not limited to making significant accounting estimates in measuring contingent considerations, indemnifications and other contractual liabilities, and estimating the indirect impact that these transactions may have on the recognition, measurement and presentation of the continuing operations. We refer to the Key Audit Matter section for more details on our procedures performed. Our audit procedures did not lead to any indications of fraud or suspicions of fraud with respect to management override of controls. |
Fraud in revenue recognition As part of our risk assessment, we evaluated which types of revenue give rise to the risk of fraud in revenue recognition. Management receives bonuses, of which the size partly depends on the financial results achieved. This could lead to pressure on management to overstate revenue by recognising revenue too early for shipments through vessels and barges or entering fictitious revenue transactions. | We evaluated the design and implementation of internal controls covering the initiation and processing of revenue transactions. We performed specific audit procedures at the end of the year related to cut-off procedures to identify potential shifts in revenue from products delivered in the next financial year to the revenue reported in the current financial year. In addition, we performed audit procedures to determine whether credit invoices were registered in the next financial year that indicate incorrectly registered revenue in the current financial year. We performed data analyses to identify potential notable revenue entries in the fiscal year where the revenue is accounted for with an offset account other than receivables. We performed specific substantive audit procedures on any entries identified, including determining whether these entries are based on deliveries that actually took place in the financial year. In addition, we tested, on a sample basis, the delivered performance and transaction prices of the revenue transactions in the year based on sales agreements, delivery documents, sales invoices and cash receipts. Our audit procedures did not lead to indications of fraud or suspicions of fraud with respect to revenue recognition. |
The risk of improper payments, unauthorised journal entries and fictitious revenue transactions The IT General Controls for the SAP S4/Hana system used by the Methanol business were designed on a high level, but not (yet) operating effectively. As such, it was not possible, among other things, to rely on the operational effectiveness of the IT general controls covering access management and segregation of duties. Due to our findings relating to IT general controls, in our risk assessment procedures we have identified a heightened risk of fraud for improper outgoing payments, unauthorised journal entries with no clear business purpose and fictious revenue transactions for the entities that were part of the Methanol business up to 27 June 2025, the closing date for the divestment. Based on this finding, management initiated remedial actions to identify whether or not improper outgoing payments, unauthorised journal entries and fictious revenue transactions were recognised by users with broad access rights or profiles with unwanted system activity combinations. | We have evaluated management’s remedial activity by testing their assessment as follows: With the assistance of our proprietary IT audit tooling, we have assessed management’s complete identification of:
We have subsequently tested, on a sample basis, management’s follow up on identified system entries that meet the above mentioned fraud risk criteria to confirm their assessment of an existing business rationale for these entries. Furthermore, the company’s processes ‘Procure to pay’, ‘Order to cash’ and ‘Period end financial reporting’, are covered by our regular audit procedures, which includes substantive testing procedures on payments, journal entries and revenue transactions. In context of the fraud risks identified for management override of controls and revenue recognition, we also performed certain audit procedures in relation to journal entries and revenue transactions. For more details around these audit procedures, we refer to the two fraud risks in this table above. Our audit procedures did not lead to specific indications of fraud or suspicions of fraud with respect to improper payments, unauthorised journal entries with no clear business purpose or fictitious revenue transactions. |
We incorporated an element of unpredictability in our audit. During the audit, we remained alert to indications of fraud. Furthermore, we considered the outcome of our other audit procedures and evaluated whether any findings were indicative of fraud or non-compliance with laws and regulations.
Audit approach going concern
As disclosed in section Note 2.2 'Going concern' of the consolidated financial statements the board of directors performed its assessment of the Company’s ability to continue as a going concern for at least 12 months from the date of preparation of the financial statements and has not identified events or conditions that may cast significant doubt on the Company’s ability to continue as a going concern (hereafter: going-concern risks).
Our procedures to evaluate the board of directors’ going-concern assessment included, amongst others:
Inquiring with the board of directors regarding the most important assumptions underlying its going-concern assessment including but not limited to: the intended disposal of the Ammonia distribution business, the operations of OCI Nitrogen business, the funding of the remaining construction cost required to complete the construction of the Beaumont New Ammonia ("BNA") project together with the receipt of the deferred consideration from completing the project, the sale of the Methanex shares subsequent to year-end, ongoing corporate and transaction costs, as well as the timing of these. Material aspects of the ongoing strategic review have been considered insofar as strategic developments are approved by the board and their realisation is considered probable;
Considering whether the board of directors’ going-concern assessment included all relevant information of which we were aware as a result of our audit;
Evaluating the board of directors’ current budget including cash flows for at least 12 months from the date of preparation of the financial statements taken into account current developments in the industry such as price development for gas, ammonia, and fertilizer and the continued compliance with financing indentures, including financial covenants and all relevant information of which we were aware as a result of our audit;
Analysing whether the current and the required financing has been secured to enable the continuation of the entirety of the entity’s operations, including compliance with relevant covenants;
Performing inquiries of the board of directors as to its knowledge of going-concern risks beyond the period of the board of directors’ assessment.
Our procedures did not result in outcomes contrary to the board of directors’ assumptions and judgements used in the application of the going-concern assumption.
Key audit matters
Key audit matters are those matters that, in our professional judgement, were of most significance in the audit of the financial statements. We have communicated the key audit matters to the board of directors. The key audit matters are not a comprehensive reflection of all matters identified by our audit and that we discussed. In this section, we described the key audit matters and included a summary of the audit procedures we performed on those matters.
Key audit matter | Our audit work and observations |
|---|---|
1. Valuation of indemnifications for Fertiglobe - Note 5 and 22 As part of the Fertiglobe sale in 2024 a contingent consideration of USD 361.6 million was held in escrow upon closing. As disclosed in Note 22, receipt of any part of this cash held in escrow continues to be dependent on the expiration or settlement of certain indemnification liabilities agreed as part of the transaction ('Escrow Indemnifications'). The contingent consideration and management's estimate of the Escrow Indemnifications are presented on a net basis in the financial statements. We considered the valuation of the Escrow Indemnifications to be a key audit matter given, amongst others, the significant management judgment required, the magnitude of the amounts indemnified and the complexity and inherent uncertainty of the estimate given the dependency on future negotiation outcomes to which the Company is not a party. | We have read the relevant executed transaction agreements and correspondence between buyer and seller and inquired with management, to understand all aspects that could have a material impact on estimating the value of the Escrow Indemnifications. We subsequently verified that management has considered these relevant aspects in their estimate. With support from our valuation specialist, we have tested management's estimate of the Escrow Indemnifications, including verifying the reasonableness and accuracy of the inputs used and assumptions made. We verified the reasonableness of management's scenario and probability assessments for the relevant indemnities, resulting in management's estimate of the future settlement of the Escrow indemnifications. Based on our procedures performed, we considered management’s valuation of the Escrow Indemnifications to be reasonable. Furthermore, we considered the related disclosure in Note 5 and 22 to be adequate. |
2. Valuation of financial liabilities for OCI Clean Ammonia - Note 5, 20 and 22 In 2024, the Group completed the sale of 100% of its equity interests in the Clean Ammonia project under construction in Beaumont, Texas. As part of the agreement OCI assumed a financial liability to pay for the remaining construction cost to complete the project and therefore acts as project administrator until the facility becomes operational. The estimated cost to complete is recorded as financial liability and amounts to USD 221 million per 31 December 2025 as disclosed in Note 20. We considered the valuation of this financial liability to be a key audit matter given, amongst others, the significant management judgement required to estimate (i) the remaining construction costs to complete the project, (ii) the cost associated with liquidated damages for certain delays that do not qualify as a force majeure, subcontractor and insurance claims, and the timing of these cash flows. | We have read the relevant executed transaction agreements and relevant correspondence between buyer and seller to understand all aspects that could have a material impact on estimating the remaining financial liability assumed by the Group. We have visited the project site in September 2025 to inspect the project and evaluate construction progress. We met with the construction management team to further inquire into construction progress and changes in project related risks and the construction budget. We reconciled project spending in 2025 to relevant administrative records such as bank statements, invoices from contractors and other accounting records to corroborate these payment transactions. We performed lookback procedures by tracing payments made in 2026, including the final payment as per the settlement agreement, to the financial liability as at 31 December 2025 to determine the complete recognition of all construction related liabilities. We inspected contractual clauses, legal advice and close out correspondence and designed procedures to test management's estimate of unpaid contractor claims. Based on our procedures performed, we considered management’s valuation of the contractual liability to be reasonable. Furthermore, we considered the related disclosure in Note 5, 20 and 22 to be adequate. |
3. Impairment assessment of the OCI Nitrogen Cash Generating Unit - Note 5 and 7 Management has identified the carve-out of the profitable Ammonia distribution business, the announced closure of one of its major on-site customers and macroeconomic trends as potential indicators of impairment for OCI Nitrogen, in accordance with IAS 36 – Impairment of Assets. An impairment test was subsequently conducted by management at year-end to estimate the recoverable amount and compare it to the carrying value of the cash-generating unit (CGU), OCI Nitrogen. As dislosed in Note 7, the analysis did not result in any impairment being recognised. This impairment assessment is significant to our audit due to its possible material impact on the Group financial statements, the complexity of the calculations involved and the high degree of estimation uncertainty and judgment required. Key assumptions used by management in its impairment test include the discount rate, terminal value growth rate, product selling price forecasts, natural gas prices, and anticipated operating days per plant. | We have reconciled management’s estimated recoverable amount for OCI Nitrogen to the discounted cash flow model and reviewed the accompanying valuation report prepared by management’s expert. With support from our valuation specialists, we have tested the mathematical accuracy of the model and evaluated whether the methodology used complies with IAS 36 requirements for determining value in use. We have challenged management’s future cash flow projections and underlying assumptions, by comparing them against historical performance data, decarbonisation strategies, stakeholder communications, publicly available market information regarding ammonia and natural gas prices, the impact of the sale of the Ammonia distribution business, local developments at the plant site, and minutes from management meetings. We also verified that the forecast aligns with the most recent budget as approved by the board of directors. Based on the procedures performed, we consider management's estimation of the recoverable amount and the determination of the carrying value for OCI Nitrogen to be reasonable. Furthermore, we considered the disclosures in Note 5 and 7 to be adequate. |
Report on the other information included in the annual report
The annual report contains other information. This includes all information in the annual report in addition to the financial statements and our auditor’s report thereon.
Based on the procedures performed as set out below, we conclude that the other information:
is consistent with the financial statements and does not contain material misstatements; and
contains all the information regarding the boards' report, excluding the sustainability statement, and the other information that is required by Part 9 of Book 2 and regarding the remuneration report required by the sections 2:135b and 2:145 subsection 2 of the Dutch Civil Code.
We have read the other information. Based on our knowledge and the understanding obtained in our audit of the financial statements or otherwise, we have considered whether the other information contains material misstatements.
By performing our procedures, we comply with the requirements of Part 9 of Book 2 and section 2:135b subsection 7 of the Dutch Civil Code and the Dutch Standard 720. The scope of such procedures was substantially less than the scope of those procedures performed in our audit of the financial statements.
The board of directors is responsible for the preparation of the other information, including the boards’ report and the other information in accordance with Part 9 of Book 2 of the Dutch Civil Code. The board of directors is responsible for ensuring that the remuneration report is drawn up and published in accordance with sections 2:135b and 2:145 subsection 2 of the Dutch Civil Code.
Report on other legal and regulatory requirements and ESEF
Our appointment
We were appointed as auditors of OCI N.V. This followed the passing of a resolution by the shareholders at the annual general meeting held on 24 May 2022. Our appointment has been renewed annually by shareholders and now represents a total period of uninterrupted engagement of 3 years.
European Single Electronic Format (ESEF)
OCI N.V. has prepared the annual report in ESEF. The requirements for this are set out in the Delegated Regulation (EU) 2019/815 with regard to regulatory technical standards on the specification of a single electronic reporting format (hereinafter: the RTS on ESEF).
In our opinion, the annual report prepared in XHTML format, including the marked-up consolidated financial statements, as included in the reporting package by OCI N.V., complies in all material respects with the RTS on ESEF.
The board of directors is responsible for preparing the annual report, including the financial statements in accordance with the RTS on ESEF, whereby the board of directors combines the various components into a single reporting package.
Our responsibility is to obtain reasonable assurance for our opinion whether the annual report in this reporting package complies with the RTS on ESEF.
We performed our examination in accordance with Dutch law, including Dutch Standard 3950N ‘Assuranceopdrachten inzake het voldoen aan de criteria voor het opstellen van een digitaal verantwoordingsdocument’ (assurance engagements relating to compliance with criteria for digital reporting).
Our examination included amongst others:
Obtaining an understanding of the entity’s financial reporting process, including the preparation of the reporting package.
Identifying and assessing the risks that the annual report does not comply in all material respects with the RTS on ESEF and designing and performing further assurance procedures responsive to those risks to provide a basis for our opinion, including:
obtaining the reporting package and performing validations to determine whether the reporting package containing the Inline XBRL instance document and the XBRL extension taxonomy files have been prepared in accordance with the technical specifications as included in the RTS on ESEF;
examining the information related to the consolidated financial statements in the reporting package to determine whether all required mark-ups have been applied and whether these are in accordance with the RTS on ESEF.
No prohibited non-audit services
To the best of our knowledge and belief, we have not provided prohibited non-audit services as referred to in article 5(1) of the European Regulation on specific requirements regarding statutory audit of public-interest entities.
Services rendered
The services, in addition to the audit, that we have provided to the Group, for the period to which our statutory audit relates, are disclosed in note 34 to the financial statements.
Responsibilities for the financial statements and the audit
Responsibilities of the board of directors
The board of directors is responsible for:
the preparation and fair presentation of the financial statements in accordance with IFRS Accounting Standards as adopted by the EU and Part 9 of Book 2 of the Dutch Civil Code; and for
such internal control as the board of directors determines is necessary to enable the preparation of the financial statements that are free from material misstatement, whether due to fraud or error.
In preparing the financial statements, the board of directors is responsible for assessing the Company’s ability to continue as a going concern. Based on the financial reporting frameworks mentioned, the board of directors should prepare the financial statements using the going-concern basis of accounting unless the board of directors either intends to liquidate the Company or to cease operations or has no realistic alternative but to do so. The board of directors should disclose in the financial statements any event and circumstances that may cast significant doubt on the Company’s ability to continue as a going concern.
Our responsibilities for the audit of the financial statements
Our responsibility is to plan and perform an audit engagement in a manner that allows us to obtain sufficient and appropriate audit evidence to provide a basis for our opinion. Our objectives are to obtain reasonable assurance about whether the financial statements as a whole are free from material misstatement, whether due to fraud or error and to issue an auditor’s report that includes our opinion. Reasonable assurance is a high but not absolute level of assurance and is not a guarantee that an audit conducted in accordance with the Dutch Standards on Auditing will always detect a material misstatement when it exists. Misstatements may arise due to fraud or error. They are considered material if, individually or in the aggregate, they could reasonably be expected to influence the economic decisions of users taken on the basis of the financial statements.
Materiality affects the nature, timing and extent of our audit procedures and the evaluation of the effect of identified misstatements on our opinion.
We have exercised professional judgement and have maintained professional scepticism throughout the audit in accordance with Dutch Standards on Auditing, ethical requirements and independence requirements. Our audit consisted, among other things of the following:
Identifying and assessing the risks of material misstatement of the financial statements, whether due to fraud or error, designing and performing audit procedures responsive to those risks, and obtaining audit evidence that is sufficient and appropriate to provide a basis for our opinion. The risk of not detecting a material misstatement resulting from fraud is higher than for one resulting from error, as fraud may involve collusion, forgery, intentional omissions, misrepresentations, or intentional override of internal control.
Obtaining an understanding of internal control relevant to the audit in order to design audit procedures that are appropriate in the circumstances, but not for the purpose of expressing an opinion on the effectiveness of the Company’s internal control.
Evaluating the appropriateness of accounting policies used and the reasonableness of accounting estimates and related disclosures made by the board of directors.
Concluding on the appropriateness of the board of directors’ use of the going-concern basis of accounting, and based on the audit evidence obtained, concluding whether a material uncertainty exists related to events and/or conditions that may cast significant doubt on the Company’s ability to continue as a going concern. If we conclude that a material uncertainty exists, we are required to draw attention in our auditor’s report to the related disclosures in the financial statements or, if such disclosures are inadequate, to modify our opinion. Our conclusions are based on the audit evidence obtained up to the date of our auditor’s report and are made in the context of our opinion on the financial statements as a whole. However, future events or conditions may cause the Company to cease to continue as a going concern.
Evaluating the overall presentation, structure and content of the financial statements, including the disclosures, and evaluating whether the financial statements represent the underlying transactions and events in a manner that achieves fair presentation.
We are responsible for planning and performing the group audit to obtain sufficient appropriate audit evidence regarding the financial information of the entities or business units within the group as a basis for forming an opinion on the financial statements. We are also responsible for the direction, supervision and review of the audit work performed for purposes of the group audit. We remain solely responsible for our audit opinion.
We communicate with the board of directors regarding, among other matters, the planned scope and timing of the audit and significant audit findings, including any significant deficiencies in internal control that we identify during our audit. In this respect, we also issue an additional report to the audit committee in accordance with article 11 of the EU Regulation on specific requirements regarding statutory audit of public-interest entities. The information included in this additional report is consistent with our audit opinion in this auditor’s report.
We provide the board of directors with a statement that we have complied with relevant ethical requirements regarding independence, and to communicate with them all relationships and other matters that may reasonably be thought to bear on our independence, and where applicable, related actions taken to eliminate threats or safeguards applied.
From the matters communicated with the the board of directors, we determine those matters that were of most significance in the audit of the financial statements of the current period and are therefore the key audit matters. We describe these matters in our auditor’s report unless law or regulation precludes public disclosure about the matter or when, in extremely rare circumstances, we determine that a matter should not be communicated in our report because the adverse consequences of doing so would reasonably be expected to outweigh the public interest benefits of such communication.
Amsterdam, 10 April 2026
PricewaterhouseCoopers Accountants N.V.
D. van Ameijden RA
Limited assurance report of the independent auditor on the sustainability statement
To: The Annual General Meeting and the board of directors of OCI N.V.
Our limited assurance conclusion
Based on the procedures we have performed and the assurance evidence we have obtained, nothing has come to our attention that causes us to believe that the sustainability statement of OCI N.V. (‘the Company’) for 2025 is not, in all material respects,
prepared in accordance with the European Sustainability Reporting Standards (ESRS) as adopted by the European Commission and in accordance with the process, carried out by the Company, to identify the information to be reported pursuant to the ESRS; and
compliant with the reporting requirements provided for in Article 8 of Regulation (EU) 2020/852 (‘the Taxonomy Regulation’).
The subject matter of our limited assurance procedures
We have conducted a limited assurance engagement on the sustainability statement of OCI N.V., Amsterdam, the Netherlands for 2025, included in section performance statements in the annual report, including the information incorporated in the sustainability statement by reference (hereafter: the sustainability statement).
In the sustainability statement, references are made to external sources or websites. The information on these external sources or websites is not subject to our limited assurance procedures for the sustainability statement. We therefore do not provide assurance on this information.
The basis for our conclusion
We conducted our limited assurance engagement in accordance with Dutch law, including the Dutch Standard 3810N ‘Assuranceopdrachten inzake duurzaamheidsverslaggeving’ (assurance engagements relating to sustainability reporting), which is a specific Dutch Standard that is based on the International Standard on Assurance Engagements (ISAE) 3000 (Revised) ‘Assurance engagements other than audits or reviews of historical financial information’.
Our responsibilities under this standard are further described in the section ‘Our responsibilities for the limited assurance engagement on the sustainability statement’ of our report. We believe that the assurance evidence we have obtained is sufficient and appropriate to provide a basis for our conclusion.
Our independence and quality management
We are independent of OCI N.V. in accordance with the ‘Verordening inzake de onafhankelijkheid van accountants bij assuranceopdrachten’ (ViO, Code of ethics for professional accountants, a regulation with respect to independence) and other relevant independence regulations in the Netherlands. Furthermore, we have complied with the ‘Verordening gedrags- en beroepsregels accountants’ (VGBA, Dutch Code of ethics for professional accountants).
PwC applies the applicable quality management requirements pursuant to the ‘Nadere voorschriften kwaliteitsmanagement’ (NVKM, regulations for quality management) and the International Standard on Quality Management (ISQM) 1 and accordingly maintains a comprehensive system of quality management including documented policies and procedures regarding compliance with ethical requirements, professional standards and other relevant legal and regulatory requirements.
Emphasis of matter
Emphasis on the impact of the strategic reorientation process
We draw attention to the sub-section 'Strategic reorientation' of section 'Our company' of chapter '2 About us' of the annual report. This disclosure explains the impact of the strategic reorientation of the Company and the associated divestment of businesses on the sustainability approach, double materiality assessment and the presentation of information in the sustainability statement.
Our conclusion is not modified in respect of this matter.
Inherent limitations in preparing the sustainability statement
In reporting forward-looking information in accordance with the ESRS, the board of directors of the Company is required to prepare the forward-looking information based on disclosed assumptions about events that may occur in the future and possible future actions by the Company. The actual outcome is likely to be different since anticipated events frequently do not occur as expected. Forward-looking information relates to events and actions that have not yet occurred and may never occur.
The comparability of sustainability information between entities and over time may be affected by the lack of historical sustainability information in accordance with the ESRS and by the absence of a uniform practice on which to draw, to evaluate and measure this information. This allows for the application of different, but acceptable, measurement techniques, especially in the initial years.
The quantification of greenhouse gas emissions is subject to inherent limitations because of evolving methods and knowledge, underlying emissions factors and other assumptions, including those sourced from third parties.
Responsibilities for the sustainability statement and for the limited assurance procedures thereon
Responsibilities of the board of directors for the sustainability statement
The board of directors of OCI N.V. is responsible for the preparation of the sustainability statement in accordance with ESRS, including the development and implementation of the double materiality process, which is a process to identify the information reported in the sustainability statement in accordance with the ESRS and for disclosing this process in the sustainability statement.
This responsibility includes:
understanding the context in which OCI N.V.’s activities and business relationships take place and developing an understanding of its affected stakeholders;
the identification of the actual and potential impacts (both negative and positive) related to sustainability matters, as well as risks and opportunities that affect, or could reasonably be expected to affect, the Company’s financial position, financial performance, cash flows, access to finance or cost of capital over the short-, medium-, or long-term;
the assessment of the materiality of the identified impacts, risks and opportunities related to sustainability matters by selecting and applying appropriate thresholds; and
making assumptions and estimates that are reasonable in the circumstances.
The board of directors is also responsible for preparing the disclosures in compliance with the reporting requirements provided in the Taxonomy Regulation.
The board of directors is also responsible for selecting and applying additional entity-specific disclosures to enable users to understand the Company’s sustainability-related impacts, risks or opportunities and for determining that these additional entity-specific disclosures are suitable in the circumstances and in accordance with the ESRS.
Furthermore, the board of directors is responsible for such internal control as the board of directors determines is necessary to enable the preparation of the sustainability statement that is free from material misstatement, whether due to fraud or error.
The board of directors is responsible for overseeing the Company’s sustainability reporting process including the double materiality process carried out by the Company.
Our responsibilities for the limited assurance engagement on the sustainability statement
Our responsibility is to plan and perform the limited assurance engagement in a manner that allows us to obtain sufficient appropriate assurance evidence to provide a basis for our conclusion.
Our objectives are to obtain a limited level of assurance, as appropriate, about whether the sustainability statement is free from material misstatements, and to issue a limited assurance conclusion in our report.
Misstatements can arise from fraud or error and are considered material if, individually or in the aggregate, they could reasonably be expected to influence decisions of users taken on the basis of the sustainability statement. The procedures vary in nature and timing from, and are less in extent than for, a reasonable assurance engagement. The level of assurance obtained in a limited assurance engagement is therefore substantially lower than the assurance obtained in a reasonable assurance engagement.
Our responsibilities in respect of the sustainability statement, in relation to the process to identify the information to be reported in the sustainability statement (‘the process’) include:
Obtaining an understanding of the process, but not for the purpose of providing a conclusion on the effectiveness of the process, including the outcome of the process;
Considering whether the information identified addresses the applicable disclosure requirements of the ESRS; and
Designing and performing procedures to evaluate whether the process is consistent with the Company’s description of its process set out in the sustainability statement.
Our other responsibilities in respect of the limited assurance engagement on the sustainability statement include:
Performing risk assessment procedures, including obtaining an understanding of internal control relevant to the engagement, to identify where material misstatements are likely to arise, whether due to fraud or error; and
Designing and performing procedures responsive to where material misstatements are likely to arise in the sustainability statement. The risk of not detecting a material misstatement resulting from fraud is higher than for one resulting from error, as fraud may involve collusion, forgery, intentional omissions, misrepresentations, or the override of internal control.
Summary of procedures performed
The nature, timing and extent of procedures selected depend on professional judgement, including the identification of disclosures where material misstatements are likely to arise in the sustainability statement, whether due to fraud or error.
We have exercised professional judgement and have maintained professional scepticism throughout the assurance engagement, in accordance with the Dutch Standard 3810N, ethical requirements and independence requirements. Our procedures included, amongst others, the following:
Performing inquiries and an analysis of the external environment and obtaining an understanding of relevant sustainability themes and issues, the characteristics of the Company, its activities and the value chain and its key intangible resources to assess the process to identify the information to be reported carried out by the Company as the basis for the sustainability statement and disclosure of all material sustainability-related impacts, risks and opportunities in accordance with ESRS.
Obtaining through inquiries a general understanding of the internal control environment, the Company’s processes for gathering and reporting entity-related and value chain information, the information systems and the Company’s risk assessment process relevant to the preparation of the sustainability statement and for identifying the Company’s activities, determining eligible and aligned activities and preparation of the disclosures provided for in the Taxonomy Regulation, without testing the operating effectiveness of controls.
Assessing the double materiality process carried out by the Company and identifying and assessing areas of the sustainability statement, including the disclosures provided for in the Taxonomy Regulation where misleading or unbalanced information or material misstatements, whether due to fraud or error, are likely to arise. We designed and performed further assurance procedures responsive to these areas.
Considering whether the description of the process to identify the information to be reported in the sustainability statement made by the board of directors appears consistent with the process carried out by the Company.
Evaluating the methods, assumptions and data for developing estimates and forward-looking information. Assessing whether the Company’s methods for developing estimates are appropriate and have been consistently applied for selected disclosures. Our procedures did not include testing the data on which the estimates are based or separately developing our own estimates against which to evaluate the Company’s estimates. We do not provide assurance on the achievability of this forward-looking information.
Analysing, on a limited sample basis, relevant internal and external documentation at the level of the Company (including other entities or value chain from which the information may stem) for selected disclosures.
Reconciling the relevant financial information to the financial statements.
Determining the nature and extent of the procedures to be performed for the group components and locations. We have performed our assurance procedures centrally.
Considering whether the disclosures provided to address the reporting requirements provided for in the Taxonomy Regulation for each of the environmental objectives, reconcile with the underlying records of the Company and are consistent or coherent with the sustainability statement, appear reasonable, in particular whether anything came to our attention that would cause us to believe that the key performance indicators disclosures have not been defined and calculated in accordance with the Taxonomy reference framework, and do not comply with the reporting requirements provided for in the Taxonomy Regulation, including the format in which the activities are presented.
Considering the overall presentation, structure and the balanced content of the sustainability statement, including the reporting requirements provided for in the Taxonomy Regulation.
Considering, based on our limited assurance procedures and evaluation of the assurance evidence obtained, whether anything came to our attention that would cause us to believe that the sustainability statement as a whole, including the sustainability matters and disclosures, is not clearly and adequately disclosed in accordance with ESRS.
Reading the other information in the annual report to identify material inconsistencies, if any, with the sustainability statement.
Calculations to determine information as included in the sustainability statement could be based on assumptions and sources from third parties that include information about, among others, value chain and information collected from actors in the value chain, when appropriate. We have not performed procedures on the content of these assumptions and these external sources, other than evaluating the suitability and plausibility of these assumptions and sources from third parties used.
We communicate with the board of directors regarding, among other matters, the planned scope and timing of the limited assurance engagement and significant findings that we identify during our limited assurance engagement.
Amsterdam, 10 April 2026
PricewaterhouseCoopers Accountants N.V.
D. van Ameijden RA
Alternative performance measures (APM)
OCI presents certain financial measures when discussing OCI’s performance, that are not measures of financial performance under IFRS. These non-IFRS measures of financial performance (also known as non-GAAP or alternative performance measures) are presented because management considers them important supplemental measures of OCI’s performance and believes that similar measures are widely used in the industry in which OCI operates. OCI believes that an understanding of its financial performance is enhanced by reporting the following APMs:
EBITDA
Adjusted EBITDA
Adjusted net profit
Free cash flow
EBITDA, adjusted EBITDA, adjusted net profit, free cash flow and adjusted balance sheet are supplemental measures of financial performance that are not required by, or presented in accordance with, IFRS. Therefore, EBITDA, adjusted EBITDA, adjusted net profit and free cash flow should be viewed as supplemental but not as a substitute for measures presented in the Consolidated Statement of Profit or Loss and Other Comprehensive Income, which are determined in accordance with IFRS.
External stakeholders should not consider EBITDA, adjusted EBITDA, adjusted net profit, free cash flow and adjusted balance sheet(a) as an alternative to operating profit or profit before taxation (as determined in accordance with IFRS) as a measure of our operating performance, and (b) as an alternative to any other measure of performance under IFRS. Because not all companies define adjusted EBITDA, EBITDA, adjusted net profit and free cash flow in the same way, these measures may not be comparable to similarly titled measures used by other companies.
Definitions and explanations of the use of the APMs are described below. Reconciliations of the APMs to the most directly reconcilable line item are presented on the following pages.
EBITDA
EBITDA is defined as the total net profit before interest, income tax expenses, depreciation, amortization and impairment, foreign exchange gains and losses and income from equity accounted investees.
Adjusted EBITDA
Adjusted EBITDA is defined as EBITDA, adjusted for additional items and costs that management considers not reflective of our core operations.
Adjusted net profit
Adjusted net profit is the total net profit, adjusted for additional items and costs that management considers not reflective of our core operations.
Free cash flow
Free cash flow (FCF) reflects an additional way of viewing our liquidity that we believe is useful to our investors and is defined as cash flow reflecting the EBITDA for the year, change in working capital, maintenance capital expenditure, taxes paid, cash interest paid, lease payments, dividends from equity accounted investees, dividends paid to non-controlling interests and adjustment for other non-cash items.
Reconciliation of operating profit to adjusted EBITDA
31 December 2025 | 31 December 2024 | |||||
|---|---|---|---|---|---|---|
$ millions | Continuing | Discontinued | Total | Continuing | Discontinued | Total |
Operating (loss) / profit | (112.7) | 41.6 | (71.1) | (232.6) | 802.1 | 569.5 |
Depreciation, amortization and impairment | 103.8 | 0.7 | 104.5 | 107.1 | 74.0 | 181.1 |
EBITDA | (8.9) | 42.3 | 33.4 | (125.5) | 876.1 | 750.6 |
APM adjustments | 55.3 | 32.9 | 88.2 | 93.6 | (18.4) | 75.2 |
Adjusted EBITDA | 46.4 | 75.2 | 121.6 | (31.9) | 857.7 | 825.8 |
APM adjustments at EBITDA level:
31 December 2025 | 31 December 2024 | |||||
|---|---|---|---|---|---|---|
$ millions | Continuing | Discontinued | Total | Continuing | Discontinued | Total |
Natgasoline | - | 57.6 | 57.6 | - | 41.7 | 41.7 |
Unrealized result natural gas hedging | (0.2) | (25.5) | (25.7) | (7.2) | (95.9) | (103.1) |
Cost for strategic review and other corporate one-off costs | 82.3 | 5.2 | 87.5 | 81.8 | 4.0 | 85.8 |
Realized result on natural gas hedging - discontinued operations related | - | - | - | 9.5 | (9.5) | - |
Unrealized result on virtual PPA derivative | - | 0.3 | 0.3 | - | (4.5) | (4.5) |
Provisions and other | (26.8) | (4.7) | (31.5) | 9.5 | 45.8 | 55.3 |
Total APM adjustments at EBITDA level | 55.3 | 32.9 | 88.2 | 93.6 | (18.4) | 75.2 |
The main APM adjustments at EBITDA level relate to:
Natgasoline is not consolidated and an adjustment of USD 57.6 million was made for OCI’s 50% share in the plant’s EBITDA in 2025. Natgasoline’s contribution to adjusted EBITDA in 2024 was USD 41.7 million.
The unrealized results on natural gas hedge derivatives of USD (25.7) million in 2025 (2024: USD (103.1) million) relate to hedging activities at OCIB, and in the Netherlands.
Cost for strategic review and one-off corporate costs of USD 87.5 million in 2025 and USD 85.8 million in 2024.
Realized results on natural gas hedging reclassification from continuing to discontinued operations amounted to USD 9.5 million in 2024.
Unrealized results on virtual PPA derivative of USD 0.3 million in 2025 (2024: USD (4.5) million).
In 2025, provisions and other primarily reflect result from sale of associate.
Reconciliation of reported net profit to adjusted net profit
31 December 2025 | 31 December 2024 | |||||
|---|---|---|---|---|---|---|
$ millions | Continuing | Discontinued | Total | Continuing | Discontinued | Total |
Reported net profit / (loss) attributable to owners of the Company | (343.7) | 527.4 | 183.7 | (163.5) | 5,142.3 | 4,978.8 |
Adjustments at EBITDA level | 55.3 | 32.9 | 88.2 | 93.6 | (18.4) | 75.2 |
Add back: Natgasoline EBITDA adjustment | - | (57.6) | (57.6) | - | (41.7) | (41.7) |
Result from associate | - | (32.3) | (32.3) | - | (6.1) | (6.1) |
Forex (gain) / loss on USD exposure | 171.3 | - | 171.3 | (116.1) | 1.5 | (114.6) |
Accelerated depreciation and impairments of PP&E | - | - | - | 10.5 | 13.5 | 24.0 |
Result on MetCo sale | - | (684.9) | (684.9) | - | - | - |
Result on IFCo sale | - | 3.2 | 3.2 | - | (1,769.0) | (1,769.0) |
Result on Clean Ammonia Sale | - | 241.3 | 241.3 | - | (776.2) | (776.2) |
Result on Fertiglobe sale | - | (23.7) | (23.7) | - | (2,392.9) | (2,392.9) |
Non-controlling interests adjustment | - | (0.2) | (0.2) | - | (2.9) | (2.9) |
Other adjustments | 72.5 | 5.4 | 77.9 | - | (7.4) | (7.4) |
Tax effect of adjustments | (6.6) | 6.2 | (0.4) | 9.2 | 11.8 | 21.0 |
Total APM adjustments at net profit / (loss) level | 292.5 | (509.7) | (217.2) | (2.8) | (4,987.8) | (4,990.6) |
Adjusted net profit / (loss) attributable to owners of the Company | (51.2) | 17.7 | (33.5) | (166.3) | 154.5 | (11.8) |
The main APM adjustments at net profit level relate to:
The adjustment on result from associate of USD (32.3) million in 2025 and USD (6.1) million in 2024 mainly relate to insurance recovery and unrealized results on natural gas hedge derivatives at Natgas.
FX impact of USD 171.3 million in 2025 and USD (114.6) million in 2024 relate to the foreign exchange gains or losses on deposits, loans and borrowings and related instruments on USD exposure carried at entities which do not have USD as functional currency.
Accelerated depreciation and impairments of PP&E of USD 24.0 million in 2024 mainly relate to write off of assets at OCI Fuels USA and corporate entities.
Result on sale of subsidiaries comprises the initial gain recognized upon disposal of subsidiaries, subsequent adjustments arising from final settlement, and movement in liabilities and provisions associated with the disposal. These amounts relate to the sale of the Methanol business (2025: USD (684.9) million), IFCo (2025: USD 3.2 million; 2024: USD (1,769.0) million), Beaumont New Ammonia (2025: USD 241.3 million; 2024: USD (776.2) million) and Fertiglobe (2025: USD (23.7) million; 2024: USD (2,392.9) million).
Non-controlling interests adjustment of USD (0.2) million in 2025 and USD (2.9) million in 2024 are related to the calculated profit attributable to non-controlling interests on all APM adjustments.
Other adjustments of USD 77.9 million in 2025 is primarily related to the USD 72.5 million modification loss related to the tender process on the 2033 bonds.
Tax effect of adjustments of USD (0.4) million in 2025 and USD 21.0 million in 2024 are related to the calculated tax effect of all APM adjustments.
Free cash flow
31 December 2025 | 31 December 2024 | |||||
|---|---|---|---|---|---|---|
$ millions | Continuing | Discontinued | Total | Continuing | Discontinued | Total |
Cash flow (used in) / from operating activities | (77.4) | (4.8) | (82.2) | (332.7) | 556.1 | 223.4 |
Maintenance capital expenditure | (113.8) | (86.0) | (199.8) | (60.6) | (208.3) | (268.9) |
Lease payments | (25.3) | (2.9) | (28.2) | (15.2) | (37.7) | (52.9) |
Dividends paid to non-controlling interests | - | (4.0) | (4.0) | (139.9) | (318.8) | (458.7) |
OCIB Hedge Settlement | 25.0 | 29.3 | 54.3 | - | - | - |
Other non-operating and non-cash items1 | 39.1 | (11.3) | 27.8 | 88.8 | 31.7 | 120.5 |
Free cash flow | (152.4) | (79.7) | (232.1) | (459.6) | 23.0 | (436.6) |
- Includes payment of transaction related expenses and dividend from investments.
Shareholder information
Share listing
OCI N.V.’s shares have been listed on the Euronext in Amsterdam as of 25 January 2013.
Share capital
The authorized capital of the Company amounts to EUR 12 million. The authorized capital is divided into 600 million shares, with a nominal value of EUR 0.02 each. OCI’s issued share capital consists of 211,357,989 ordinary shares as at 31 December 2025. The shares are registered shares. No share certificates are issued.
Shareholder engagement
We place great importance on maintaining active dialogue with existing and potential shareholders, banks, and analysts. We are committed to providing relevant, high-quality and timely information to all stakeholders, and to giving current and potential shareholders, analysts and the financial press broad insight into the Company and the industries in which we operate. We ensure that relevant information is provided equally and simultaneously to all interested parties as governed by our shareholder communications policy.
As per our by-laws, we observe a ‘black-out’ period during which analysts’ meetings and presentations to and/or direct discussions with current or potential shareholders do not take place shortly before the publication of financial information. We regularly schedule conference calls and meetings with potential and current equity and debt investors through roadshow days, conferences and in-house meetings. In addition to the Vice President Investor Relations and Communications, meetings are conducted by our Executive Chair, CEO and CFO. We hold results conference calls hosted by our CEO and CFO on the day results are published, during which investors and analysts are invited to ask questions. A replay option is made available on our website.
In order to ensure our Board of Directors is fully apprised of shareholders’ areas of focus, concerns, and feedback, an investor relations update is provided at each Board meeting.
Dividend policy
OCI has suspended its semi-annual cash distribution in light of recent strategic activity during the period and given extraordinary distributions of capital to shareholders expected to be made from transaction proceeds.
Information in 2025 | |
|---|---|
Number of outstanding ordinary shares as at 31 December 2025 | 211,357,989 |
Highest share price (EUR/share) | 11.68 |
Average share price (EUR/share) | 7.12 |
Lowest share price (EUR/share) | 2.65 |
Share price at 31 December 2025 (EUR/share) | 3.06 |
Market capitalization at 31 December 2025 (EUR million) | 647 |
Shareholders
According to the Dutch Financial Supervision Act, shareholders of 3% or more must disclose their holdings to the Dutch Authority for the Financial Markets (AFM). These disclosures are made available on the AFM’s public register, which can be found at www.afm.nl. According to the AFM’s register, the following shareholders possessed an interest of 3% or more as at 31 December 2025:
Name | % of shares | Number of shares |
|---|---|---|
Nassef Sawiris | 49.21% | 104,003,478 |
Other Sawiris family members | 9.07% | 19,167,618 |
Morgan Stanley | 5.21% | 11,021,864 |
Verition Fund Management LLC | 3.13% | 6,615,279 |
Millennium International Management LP | 3.09% | 6,525,279 |
Remaining shares | 17.24% | 36,435,001 |
The number of shares held by family holdings other than Nassef Sawiris are based on information provided by the family to the Company, and differs from disclosures in the AFM register. The discrepancy results from the existence of family holdings below AFM reporting thresholds. Although the members of the Sawiris family have not entered into any formal shareholders agreement, they have historically coordinated their voting on the OCI shares and should therefore be regarded as parties acting in concert (personen die in onderling overleg handelen) as defined in section 1:1 of the Dutch Financial Supervision Act (Wet op het financieel toezicht).
Contact us
This Annual Report is available online at www.oci-global.com.
OCI N.V.
Honthorststraat 19
1071 DC Amsterdam
The Netherlands
OCI N.V. stock symbols: OCI / OCI.NA / OCI.AS
Investor relations contact
Sarah Rajani CFA
Vice President Investor Relations and Communications
E-mail: sarah.rajani@oci-global.com
investor.relations@oci-global.com
Appendices
1 Abbreviations
Abbreviations
AC | Audit Committee |
ADNOC | Abu Dhabi National Oil Company |
AGM | Annual General Meeting of Shareholders |
API | American Petroleum Institute |
APM | Alternative Performance Measures |
AN | Ammonium nitrate |
AS | Ammonium sulfate |
BNA | Beaumont New Ammonia / Clean Ammonia |
BioMCN | Branded as OCI Methanol Europe |
CAN | Calcium ammonium nitrate |
CapEx | Capital expenditure |
CBAM | EU's Carbon Border Adjustment Mechanism |
CCS | Carbon capture and storage |
CSRD | EU’s Corporate Sustainability Reporting Directive |
CLHCO | Chief Legal and Human Capital Officer |
CO2 | Carbon dioxide |
CO2e | Carbon dioxide equivalent |
COSO | Committee of Sponsoring Organizations of the Treadway Commission |
DEF | Diesel exhaust fluid |
EBIC | Egypt Basic Industries Corporation |
EBITDA | Earnings Before Interest, Taxes, Depreciation and Amortization |
EFC | Egyptian Fertilizers Company |
EGM | Extraordinary General Meeting |
EPS | Earnings per share |
ESG | Environmental, Social, Governance |
FCF | Free cash flow |
Fertil | Ruwais Fertilizer Industries |
GHG | Greenhouse gas |
GJ | Gigajoule |
GMOs | Genetically Modified Organisms |
HSE | Health, Safety and Environment |
HSE&SC | Health, Safety, Environment and Sustainability Committee |
ICF | Internal Control Framework |
IEA | International Energy Agency |
IFA | International Fertilizer Association |
IFCo | Iowa Fertilizer Company, branded as OCI Nitrogen Iowa or OCI Nitrogen North America |
IFRS | International Financial Reporting Standards |
IIA | Institute of Internal Auditors |
IMO | International Maritime Organization |
IPCC | Intergovernmental Panel on Climate Change |
IRA | Inflation Reduction Act |
ISCC | International Sustainability & Carbon Certification |
LHV | Lower Heating Value |
LTI | Long-term incentives |
M | Million |
MENA | Middle East and North Africa |
MetCo | OCI Methanol / Methanol business |
MNEs | Multinational enterprises |
MWh | Megawatt-hours |
N2O | Nitrous oxide |
NCI | Non-controlling interests |
NOx | Nitrogen oxide |
N&RC | Nomination and Remuneration Committee |
OAD | OCI Ammonia Distribution B.V. |
OAH | OCI Ammonia Holding B.V. |
OECD BEPS | OECD/G20 Inclusive Framework on Base Erosion and Profit Shifting |
OCIB | OCI Beaumont, branded as OCI Methanol Texas or OCI Methanol North America |
OCIN | OCI Nitrogen B.V. |
OpEx | Operational expenditures |
OSHA | Occupational Safety and Health Administration |
OTE | OCI Terminal Europoort B.V. |
PMT | Persistent, Mobile, Toxic |
PPAs | Power Purchase Agreements |
PPE | Personal protection equipment |
PwC | PricewaterhouseCoopers Accountants N.V. |
REACH | Registration, Evaluation, Authorization and Restriction of Chemicals |
RED | EU’s Renewable Energy Directive |
RES | Renewable Energy Sources |
RFNBO | EU’s Renewable Fuels of Non-biological Origin |
RNG | Renewable Natural Gas |
SDS | Safety data sheet |
SO² | Sulfur dioxide |
STI | Short-term incentives |
SVHC | Substance of Very High Concern |
TCFD | Task Force on Climate-related Financial Disclosures |
TJ | Terajoule |
TRIR | Total recordable injury rate |
UAE | United Arab Emirates |
UAN | Urea ammonium nitrate |
UNICEF | United Nations International Children’s Emergency Fund |
WASH | Water, Sanitation and Hygiene |
YoY | Year-on-year |