

Performance and operations
Company profile
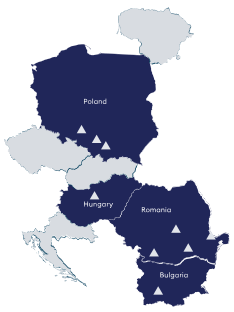
NEPI Rockcastle is the premier owner and operator of shopping centres in Central and Eastern Europe (CEE), with a presence in eight countries and an investment portfolio of €8.2 billion.
The Group benefits from a highly-skilled internal management team which combines asset management, development, investment, leasing and financial expertise. Geographically diverse management skills allow NEPI Rockcastle to pursue CEE property opportunities efficiently, benefiting from a strategic advantage in the acquisition, development and management of properties.
NEPI Rockcastle owns and operates 57 retail properties which attracted more than 354 million visits in 2025.
With Group level management of tenant relationships and a focus on cross-country collaboration, the Group is the leading strategic partner for major retailers in the CEE countries.
The Group's financial strategy includes maintaining a profile of adequate liquidity, conservative loan-to-value (LTV), and a diverse debt structure, which combines secured and unsecured bank debt with unsecured bonds listed on the Irish Stock Exchange. The Group is currently assigned a long-term corporate credit rating of BBB (positive outlook) from Standard & Poor’s Rating Services and BBB+ (stable outlook) from Fitch Ratings.
The Company’s shares are listed on the Main Board of the JSE Limited (JSE), Euronext Amsterdam and A2X. NEPI Rockcastle uses distribution per share as its key performance measure for trading statement purposes, in accordance with the JSE Listings Requirements.


Property portfolio by country



CEO's statement
I am pleased to report that 2025 was another outstanding year for NEPI Rockcastle. We achieved record distributable earnings of €441 million, up 6.7% on the prior year, and net operating income (NOI) of €618 million, an 11.2% increase. These results were driven by the acquisitions made at the end of 2024, reduced vacancy, indexation, rental uplifts and higher basket spend all while keeping a firm control of costs. These results were at the top end of our revised guidance provided in August and demonstrate the fundamental strength of our business model. Our portfolio reached a valuation of €8.2 billion, reinforcing our standing as one of Europe’s fastest growing retail real estate platforms and the largest owner, operator and developer of shopping centres across CEE markets.
Consumer spending across our malls kept climbing, reinforcing just how resilient the CEE shopper continues to be. Tenant turnover grew 3.6% on a like-for-like basis, and average spend per visit rose again. Retailer demand for space in our properties stayed strong, pushing overall occupancy to 98.8%. These results speak to the strength of our business model, the quality of our retail destinations across the region, and the lasting attractiveness of well-managed, dominant shopping centres in Central and Eastern Europe.
Financial discipline remains central to how we run the business, and our balance sheet is in strong shape. We closed the year with total liquidity exceeding €1 billion, having successfully issued a €500 million green bond in September to proactively manage upcoming debt maturities, while also expanding our revolving credit facilities to €740 million. With a loan-to-value ratio (LTV) of 32.8%, we have good capacity to pursue growth while keeping leverage at prudent levels.
Looking ahead, we have over €840 million development projects in the pipeline, including extensions, refurbishments and other value-enhancing work, that will strengthen our position further. On the sustainability front, our renewable energy programme continues to grow. Photovoltaic installations now cover 6% of our electricity needs, and our greenfield solar projects in Romania are on track to start generating power in 2026 and 2027. The first greenfield photovoltaic plant of the Group, in Chisineu-Cris (54 MW), went already online and will increase the energy self-production to 18% of the estimated needs.
On a personal note, this is my final commentary as CEO of NEPI Rockcastle. Over the past four years, I’ve had the privilege of leading a company that has gone from strength to strength. We’ve stayed disciplined in executing our growth strategy – actively recycling capital through acquisitions and disposals, optimising our assets, delivering developments at scale, unlocking new income streams through our renewable energy programme and taking care of our strong balance sheet.
This strategy has delivered substantial value for shareholders and business partners as the CEE region continues to record higher rates of economic growth and gains in household disposable income than Western Europe. I’m confident the Company is in excellent hands going forward. My colleague Marek Noetzel takes over as CEO on 1 April 2026, and his deep knowledge of the business and relentless focus on operational excellence make him the right person to lead NEPI Rockcastle into its next chapter.
I extend my gratitude to our shareholders, partners and colleagues for their support and look forward to watching
the Company’s future progress.
17 March 2026
RÜDIGER DANY
Chief Executive Officer

Chairman's statement
NEPI Rockcastle delivered another year of excellent performance in 2025. Distributable earnings per share increased to an all-time high, in line with revised guidance and demonstrating the resilience of our business model in what proved to be a year of considerable macroeconomic uncertainty in some of our markets. The Board declared a dividend of 27.88 euro cents per share for the second half of the year, maintaining our consistent 90% distribution payout ratio.
Our portfolio now stands at a valuation of €8.2 billion, underpinned by a fair value gain of €162 million driven by the operational performance of our properties. A significant share of this uplift came from recently acquired properties - a validation of the disciplined acquisition strategy we have pursued in recent years. Net operating income grew by 11.2% to €618 million, benefiting from the full-year contribution of properties acquired in 2024, reduced vacancy and improved cost recovery.
Perhaps no single metric captures the quality of our portfolio better than our retail vacancy rate, which has fallen to a record low of 1.0%. This is not an accident — it is the product of years of focused asset management, deep retailer relationships and an unwavering commitment to owning the best properties in the markets we serve. It is an achievement of which every member of our team should be proud.
Financial strength is the platform upon which all else rests. In 2025, that platform was reinforced considerably. Our €500 million green bond issuance attracted more than 190 investors and was oversubscribed more than eight times — a powerful expression of the capital markets' confidence in NEPI Rockcastle's credit quality and long-term direction. With substantial undrawn revolving facilities complementing this access, the Group has the firepower to pursue value-accretive opportunities decisively. The affirmation of our investment-grade ratings by both Standard & Poor's and Fitch reflects the conservative capital discipline that has always distinguished us.
Sustainability continues to be a key focus. The Group has made substantial progress and is on track to achieve its science-based target for 2030. Our expanding green energy programme is transforming the Group's energy profile – our installed photovoltaic capacity reached 92 MW (including the landmark Chisineu-Cris greenfield plant in Romania), enough to cover 18% of portfolio electricity needs. Recognition from multiple environmental standard setters confirms that NEPI Rockcastle is regarded as a leader in responsible real estate investment.
NEPI Rockcastle's admission to the FTSE EPRA NAREIT Global Emerging Index in June 2025 was a further milestone — independent recognition of our standing as a leading real estate investment platform and a signal to international investors of the quality and ambition of this organisation.
This year also marked a defining moment in our leadership journey, through the completion of our CEO succession process. On behalf of the Board, I extend our sincere gratitude to Rüdiger Dany for his outstanding contribution to the Group's development. The appointment of Marek Noetzel as Chief Executive Officer with effect from 1 April 2026 reflects the strength of our leadership development programme and provides continuity of strategic vision. The subsequent appointment of Marius Barbu as Chief Operating Officer demonstrates the depth of talent within the organisation and our commitment to internal succession planning.
The Group is well positioned for continued growth. A substantial development pipeline of approximately €840 million, which includes our green energy expansion programme, provides clear pathways to future value creation. The economic fundamentals in Central and Eastern Europe continue to support retail consumption, and the Board remains confident in our ability to capitalise on attractive investment opportunities as they arise. The strategic priorities we have pursued—asset quality, financial discipline, sustainability leadership and talent development—will continue to deliver superior returns for shareholders over the long-term.
On behalf of the Board, I congratulate NEPI Rockcastle's management and employees for their exceptional achievements in 2025 and thank our shareholders for their continued support. We look forward to building upon this success in the years ahead.
17 March 2026
GEORGE AASE
Chairman

Directors' report
Highlights
Distributable earnings per share (DEPS) for the second half (H2) of 2025 was 30.98 euro cents, which, when combined with the interim DEPS of 31.05 euro cents, results in annual DEPS of 62.03 euro cents, a 3.1% growth relative to 2024 (60.17 euro cents). DEPS growth came in at the higher end of the guidance we issued in August 2025. Distributable earnings for the period amounted to €441 million, up 6.7% from 2024.
The Board has declared a dividend of 27.88 euro cents per share for H2 2025, corresponding to a 90% dividend pay-out ratio. This will be settled as capital repayment (default option) or NEPI Rockcastle shareholders can elect for the settlement of the same dividend amount as an ordinary cash dividend out of distributable profits.
NOI was €618 million in 2025, 11.2% higher than in previous year. Like-for-like (LFL) NOI growth was 4.4% (excluding the impact from acquisitions completed in 2024).
Green energy activity contributed €9.6 million to 2025’s NOI, up 6.5% from 2024.
Property operating expenses increased by 9.2% year on year, largely due to the additional costs associated with assets acquired in 2024. The cost recovery rate improved to 94.8%.
Tenant turnover increased by 3.6% (excluding hypermarkets) compared to 2024 on a LFL basis, above inflation.
Footfall was marginally lower by 0.5% on a LFL basis, compared to 2024.
The continuing trend of increased spend per visitor was evidenced by average basket size growing by 4.4% LFL and by 8% overall (including the impact of acquisitions completed in 2024).
The occupancy cost ratio (OCR) was 12.4% in 2025 (excluding hypermarkets), slightly up from 12.2% in 2024. The OCR has held steady since 2022, demonstrating the Group’s ability to capture income growth from improved tenant performance while maintaining mutually beneficial partnerships with its retailers.
The collection rate was 99.5% of 2025 reported revenues as of mid-February 2026, indicating the high level of operational discipline and the quality of NEPI Rockcastle’s tenants.
Investment property as of 31 December 2025 amounted to €8.2 billion, compared to €7.9 billion at the end of 2024. The increase is due to positive fair value adjustments of €162 million and capital expenditure.
The revaluation uplift was driven by higher NOI, supported by the superior performance of the assets. Valuation yields remained stable with no significant changes compared to prior year.
European Public Real Estate Association (EPRA) vacancy decreased to 1.2%, from 1.7% in 2024. For retail properties, which represent 97.3% of total gross lettable area (GLA), the EPRA vacancy rate was 1.0% (down from 1.4% in the previous year). The Group continued to reduce vacancy from already low levels, a testament to the expertise of its leasing team and the premium quality of its assets that remain highly sought after by retailers.
EPRA Net Reinstatement Value (NRV) per share was €7.68 as of 31 December 2025, a 4.1% increase compared to €7.38 as of 31 December 2024.
The Group’s development pipeline totals over €840 million in new developments, extensions, refurbishments and green energy programme over the coming years, in line with its strategy to enhance the quality and attractiveness of its portfolio.
Key projects under construction include the extension of Promenada Bucharest, the redevelopment of Bonarka City Center and the refurbishment of Arena Mall Budapest. The extension of Pogoria Shopping Centre opened on 5 February 2026.
Projects under permitting include the development of a large shopping centre in Plovdiv (Bulgaria), a retail park in Galati (Romania) and an extension to the Karolinka Shopping Centre in Poland.
The second phase of the green energy programme is progressing well, with 22 on-site plants outside Romania in different stages of installation.
The third phase of the green energy programme, comprising off-site plants development, is advancing, with the Chisineu-Cris greenfield photovoltaic plant (54 MW) expected to commence commercial operations soon, and the Aricestii Rahtivani plant (60 MW) expected to start commercial operations by the end of 2026.
The Group’s liquidity position as of 31 December 2025 was over €1 billion, including €314 million in cash and €740 million in undrawn committed credit facilities.
LTV was 32.8% as of 31 December 2025, comfortably below the 35% long-term strategic threshold.
In September 2025, the Group issued a €500 million unsecured eight-year green bond at a 3.875% coupon maturing in September 2033. Proceeds were used to manage the upcoming maturities in October 2026 and July 2027, with €250 million of each tranche refinanced.
In December 2025, the Group signed a new green unsecured facility with Raiffeisen Bank dedicated to refinancing photovoltaic solar plants in Romania, with a total commitment of €45 million and a 10-year tenure. The first tranche of €21 million was disbursed in December 2025.
In December 2025, the Group increased one of its existing secured loans in Romania by €32 million to further strengthen its liquidity position, with proceeds being disbursed in December 2025.
The Group’s weighted average effective interest rate on outstanding debt for the period was 3.75% (2024: 3.55%). Including the commitment fees incurred on the undrawn revolving credit facility, the all-in cost of maintaining the Group’s total committed debt facilities was 3.2% on a blended basis (2024: 3%). Interest rate risk is hedged for 84% of outstanding debt.
The Group is currently assigned a long-term corporate credit rating of BBB (positive outlook) from Standard & Poor’s Rating Services and BBB+ (stable outlook) from Fitch Ratings.
Operating performance
The Group delivered a solid performance across its portfolio in 2025, demonstrating resilience despite macroeconomic headwinds in certain markets. Consumer spending held up well, with tenant sales rising by 3.6% on a LFL basis. Occupancy reached 98.8%, reflecting continued retailer demand for space in our properties. The leasing market remained supportive across all our geographies.
On a LFL basis, footfall was marginally lower by 0.5% compared to 2024. However, customers continued to spend more per visit, with the average basket size increasing by 4.4% on a LFL basis.
Tenant sales performance varied by country, with strong results in Poland (+5.0%), Bulgaria (+6.2%), and Hungary (+5.1%). Romania achieved moderate growth of 2.1% despite new taxes introduced in September.
The OCR has remained consistent over the past four years. In 2025, it stood at 12.4% (excluding hypermarkets), marginally higher than 12.2% in 2024 and broadly in line with 2022 and 2023 levels. This consistent and relatively low level reflects the alignment of interests between the Group and its retail partners, ensuring that the benefits of improved trading performance are shared.
Tenant sales increased across most retail categories. The fastest growing were Health & Beauty (+9.5%), Fashion Complements (+8.8%), Entertainment (+7.8%) and Services (+7.0%), in line with the trends of previous years. Fashion, the largest segment, increased by 1.5%. Electronics (-2.3%) and Sporting Goods (-4.7%) declined due to changes in tenant mix.
Property operating expenses increased by 9.2% year on year, largely driven by incremental costs from assets acquired in 2024. Efficient cost management measures contributed to a higher recovery rate of 94.8%.
The Group achieved a market leading EPRA retail vacancy rate of 1.0% on 31 December 2025, lower than the 1.4% at 31 December 2024, due to very strong tenant demand for space in the Group’s properties. Overall EPRA vacancy was 1.2% at the end of 2025 (down from 1.7% on 31 December 2024).
NEPI Rockcastle signed 500 new leases (for 113,000m2, representing 4.7% of total GLA) in 2025, with international tenants accounting for 63% of the total. Another 951 leases were renewed during the year. The blended rental uplift in 2025 was 4.6% above indexation for new leases and renewals, the result of active leasing management.
The Group’s properties continue to be the preferred choice for tenants expanding into new markets. Examples of debut store openings in the country included: Notino in Arena Centar (Croatia), Rituals in Mammut Shopping Centre (Hungary), TOUS in Paradise Center (Bulgaria), BIPA in Mega Mall (Romania), and Tatuum in Mega Mall (Romania). Other notable openings in 2025 include flagship stores for Half Price in Magnolia Park (Poland), Zara and Nike in Arena Centar (Croatia), Zara and Reserved in Arena Mall (Hungary), Sports Direct in Promenada Craiova (Romania).
NEPI Rockcastle is growing its partnerships with top global brands, resulting in multiple store openings in various locations across the portfolio, such as Popeyes (six locations signed in 2025), dm drogerie markt (five stores opened), Adidas (five locations signed), Rituals (four new stores opened), and Skechers (four new stores opened). The Group’s prime locations continue to attract unique concepts, such as the Influcenter in Bonarka City Center (Poland), combining digital and physical experiences run by popular internet influencers. The scale of our offering for key tenants looking to grow quickly in the region is unrivalled.
Development update
The Group invested approximately €200 million in developments, photovoltaic plants and capex in 2025. Projects currently under construction include the extension of Promenada Bucharest, the redevelopment of Bonarka City Center and the refurbishment of Arena Mall Budapest. The extension of Pogoria Shopping Centre was successfully opened on 5 February 2026, with the extension fully leased.
Projects under permitting include the development of a large shopping centre in Plovdiv (Bulgaria) with expected opening in H1 2028, a retail park in Galati (Romania) with expected opening in Q1 2027, and the Karolinka Shopping Centre extension in Opole (Poland).
Each development project currently underway continues to progress according to its planned construction timeline.
In 2025, NEPI Rockcastle’s photovoltaic energy production covered 6% of the Group’s electricity consumption needs. The second phase of the renewable energy programme is progressing with 22 new plants outside Romania in different stages of installation. The third phase, involving greenfield photovoltaic plants in Romania, is advancing well: the Chisineu-Cris plant (54 MW) is expected to commence commercial operations in Q1 2026, and the Aricestii Rahtivani plant (60 MW) is expected to start commercial operations by the end of 2026.
The total cost of projects under construction or permitting is approximately €840 million, of which €326 million has already been invested as at 31 December 2025.
Acquisitions and disposals
In 2025, the Group focused on organic growth through its development pipeline and green energy investments, with no major acquisitions completed during the year. The Group continues to monitor opportunities for acquisitions and maintains a watchlist of potential targets.
Sustainability focus
The Group remains on track to achieve its sustainability commitments, including its SBTi‑validated net‑zero target for 2030.
The Group’s installed photovoltaic capacity reached 92MW across 31 installations (annualised, including the 54MW Chisineu-Cris greenfield plant). The 2026-2027 outlook includes an additional 15MW of rooftop capacity, targeting 47% coverage from own generation and a 37% reduction in emissions (relative to a context in which the Group would use only non-renewable energy sources).
The entire eligible portfolio is BREEAM-certified, with 95% rated “Very Good” or above. The Group received strong external ESG recognition in 2025, including EPRA Gold, GRESB 5-star ratings for both operational and development portfolios, MSCI AAA rating, and CDP B ratings for climate and water.
Corporate Governance
The Board concluded its CEO succession process and appointed Marek Noetzel as Chief Executive Officer with effect from 1 April 2026 succeeding Rüdiger Dany, whose mandate as CEO concludes on 31 March 2026. Mr Noetzel has served as the Group’s Chief Operating Officer since June 2022, with responsibility for operations across 60 properties in eight countries. He joined Rockcastle Global Real Estate in 2016 and has held positions as Board Member and Director of Retail in Poland before becoming COO. On 17 December 2025, the Board appointed Marius Barbu as Chief Operating Officer with effect from 1 April 2026, to succeed Mr Noetzel.
Mr Barbu has been nominated as a director and will stand for election at the annual general meeting in May 2026. He is currently the Group’s Asset Management Director, a position he has held since June 2022, and has over 25 years of experience in asset management, real estate and retail. Mr Barbu joined the Group in 2012 and has progressively expanded his oversight from the country level in Romania to eight geographies across Central and Eastern Europe.
These appointments demonstrate the effectiveness of the Company’s talent management and leadership development strategy.
NEPI Rockcastle was included in the FTSE EPRA NAREIT Global Emerging Index, effective 23 June 2025. The FTSE EPRA NAREIT Index Series is the leading global benchmark for listed real estate investments, and inclusion recognises the Company’s scale, liquidity and adherence to best practices in the sector. This milestone is expected to enhance visibility among global investors, improve share liquidity through eligibility for index-tracking investors, and provide external validation of the Company’s operational transparency and governance standards.
Independent auditor's report
The review report on the Group’s condensed consolidated financial statements published on 24 February 2026 has been issued by Ernst & Young Inc. (EY South Africa), who expressed an unmodified review report thereon.
The audit report on the consolidated and separate financial statements for the year ended 31 December 2025, included in this annual report, is issued by Ernst & Young Inc. (EY South Africa) and EY Accountants B.V. (EY Netherlands).
Accounting and valuation matters
NEPI Rockcastle fair values its portfolio twice a year. Fair value is determined by external, independent professional valuers, with appropriate and recognised qualifications and recent experience in the geography and category of properties being assessed.
Appraiser | Locations | Percentage of portfolio |
|---|---|---|
Colliers International | Romania and Bulgaria | 44% |
Jones Lang LaSalle (JLL) | Poland and Lithuania | 36% |
Cushman & Wakefield (CW) | Croatia, Czech Republic, Hungary and Slovakia | 20% |
For the year ended 31 December 2025, the Group recognised a fair value gain in relation to investment property portfolio of €162 million.
EPRA indicators
EPRA indicators1 | 31 December 2025 | 31 December 2024 |
|---|---|---|
EPRA Earnings (€ thousand) | 441,995 | 405,972 |
EPRA Earnings per share (€ cents per share) | 62.19 | 59.18 |
EPRA Net Initial Yield (NIY)2 | 6.98% | 6.98% |
EPRA topped-up NIY2 | 7.00% | 7.00% |
EPRA vacancy rate | 1.2% | 1.7% |
EPRA Net Reinstatement Value (NRV) (€ per share) | 7.68 | 7.38 |
EPRA Net Tangible Assets (NTA) (€ per share) | 7.64 | 7.35 |
EPRA Net Disposal Value (NDV) (€ per share) | 6.96 | 6.83 |
EPRA Cost ratio (including direct vacancy cost) | 9.8% | 9.6% |
EPRA Cost ratio (excluding direct vacancy cost) | 9.7% | 9.5% |
EPRA Loan-to-value (LTV) | 34% | 33% |
- Certain of these EPRA indicators are considered to be pro forma financial information in terms of the JSE Listings Requirements. Please refer to chapter EPRA Performance measures.
- Does not include investment property held for sale.
Cash management and debt
The Group had very strong liquidity as of 31 December 2025, with €314 million in cash and €740 million in undrawn committed credit facilities.
NEPI Rockcastle’s LTV ratio (interest bearing debt less cash, divided by investment property plus cost incurred for photovoltaic plants) was 32.8% as of 31 December 2025, below the long-term strategic threshold of 35% and comfortably within debt covenants.
Ratios for unsecured loans and bonds showed ample headroom compared to covenant thresholds as of 31 December 2025, as follows:
Solvency Ratio: 0.38 actual, compared to maximum 0.6 requirement;
Consolidated Coverage Ratio: 5.04 actual, compared to minimum 2 requirement; and
Unencumbered consolidated total assets/unsecured consolidated total debt: 266% actual compared to a minimum 150% requirement.
NEPI Rockcastle extended the contractual maturities related to its unsecured committed revolving credit facilities in 2025, as follows:
ING Bank’s facility was extended to a maturity of three years, with two additional one-year extension options, currently expiring in July 2028, with the maximum principal available maintained at €100 million;
The facility from a three-bank syndicate (BRD-Groupe Société Générale, Garanti Bank and Unicredit Bank) was extended to a maturity of three years, with two additional one-year extension options, currently expiring in July 2028, with the maximum principal available increased from €170 million to €190 million;
A four-bank syndicate facility led by Deutsche Bank AG as arranger was extended for one year, until January 2029, with the maximum principal available increased to €250 million from €200 million, with JP Morgan joining the syndicate; and
The facility from Raiffeisen Bank International was extended for one year, until January 2029, with the maximum principal available maintained at €200 million.
Consequently, the revolving credit facilities’ capacity amounts to €740 million (31 December 2024: €670 million) which was available and undrawn as at 31 December 2025.
In September 2025, the Group issued a €500 million green unsecured Eurobond, having an eight-year tenor and maturing in September 2033. The bond carries a 3.875% coupon, with an issue price of 99.353%. Proceeds were used to manage the upcoming maturities in October 2026 and July 2027, with €250 million of each tranche refinanced. The allocation of the proceeds will be aligned to the Group’s Green Finance Framework.
The Group increased one of its existing secured loans in Romania by €32 million in December 2025, to strengthen its liquidity position further. The maturity of the loan remains unchanged.
The Group signed a new green unsecured facility with Raiffeisen Bank in December 2025, dedicated to refinancing the photovoltaic solar plants being developed in Romania. The facility has a 10-year tenor and a total commitment of €45 million. The first tranche of €21 million was disbursed in December 2025, while the second tranche is expected to be drawn in 2026.
In total, 88% of the Group’s funding has green or sustainability-linked features as at 31 December 2025.
The Company repurchased 1,640,511 own shares in April 2025, (representing 0.23% of outstanding ordinary shares in issue) on the market for a total consideration of €10 million. The cost of repurchased shares was recognised in the treasury shares reserve.
In February 2026, the Group signed a €225 million green term facility agreement with a five-year maturity, arranged with a consortium of three banks — ING, SMBC, and Intesa. The facility strengthens the Group’s liquidity position and is in line with the Group’s Green Finance Framework.
The Company evaluates its financing options constantly, including debt and equity capital raising alternatives, to support its future growth and assesses market opportunities as they arise, while keeping in mind the strategic objective to broaden its shareholder base and maintain an optimal capital structure.
The Group’s weighted average effective interest rate on outstanding debt for the period was 3.75% (2024: 3.55%). Including the commitment fees incurred on the undrawn revolving credit facility, the all-in cost of maintaining the Group’s total committed debt facilities was 3.2% on a blended basis (2024: 3%). Management considers the all-in cost to be a relevant measure as it reflects the full cost of securing and maintaining the Group’s available financing capacity.
Unsecured debt represented 87% of NEPI Rockcastle’s outstanding debt as of 31 December 2025. The unhedged balance represents 16% of the total outstanding debt and corresponds mainly to the IFC loan balance.
Earnings distribution 2025
The Board has declared a dividend of 27.88 euro cents per share for H2 2025, corresponding to a 90% dividend pay-out ratio, to be settled as capital repayment (default option). NEPI Rockcastle shareholders can also elect for the settlement of the same dividend amount as an ordinary cash dividend out of distributable profits.
In line with Dutch legislation, the capital repayment will be paid to shareholders unless they elect to receive the ordinary cash distribution option.
A circular containing full details of the dividend settlement, accompanied by announcements on the Stock Exchange News Service (SENS) of the JSE, A2X and Euronext Amsterdam has been issued on 27 February 2026, with the dividend settlement scheduled for 17 April 2026.
Prospects and earnings guidance
Distributable earnings per share for 2026 is expected to be approximately 3% higher than the 2025 distributable earnings per share of 62.03 euro cents, with no change in the Company’s current 90% dividend payout ratio. This guidance does not consider the impact of potential further political instability in the region, or systemic macroeconomic disruptions, which are outside the influence of the Board of Directors, and assumes a continuation of the trading trends observed to date. This guidance can be modified or withdrawn in the future if material changes unfold.
This guidance which has been prepared in accordance with IFRS and is consistent with the Company’s accounting policies, has not been reviewed or reported on by NEPI Rockcastle’s auditors and is the responsibility of the Board of Directors.
17 March 2026
Strong strategic positioning
Pillar 1 – Growth | Pillar 2 – Sustainability | ||
 | Preserve a high-quality portfolio of dominant assets |  | Foster a strong financial discipline, including adequate liquidity, conservative LTV and a diverse debt structure, to support growth directions |
 | Delivering on development pipeline, positively contributing to the property portfolio and income generation |  | Focus on ESG, to deliver on sustainable |
 | Identify new income streams - green energy | ||
 | Value enhancing asset rotation | ||
Preserve a high-quality portfolio of dominant assets
Active property management of the Group assets creates significant growth opportunities. Capitalising on its comprehensive in-house expertise in the CEE retail markets, the Group delivers year on year best-in-class results, such as high collection and occupancy rates, reasonable tenant occupancy cost, growing tenant sales and footfall. Preventive maintenance decreases long-term capital expenditure, service charge levels, non-recoverable expenses and maintains the portfolio in good shape. With a broad platform across eight CEE countries, the Group manages to adapt its business to the changing consumer preferences and to build strong, trust-based relationships with leading retailers.
Delivering on the development pipeline
NEPI Rockcastle pursues low-risk development, redevelopment and extension opportunities, in a non-speculative, phased manner. Construction costs are committed to on a gradual basis, in line with leasing milestones, but at the same time secured to mitigate the inflationary trends and the supply chains challenges. Delivering on its strategy, the Group has 194,000m2 retail GLA and 33,000m2 residential GSA (gross sellable area) under construction or permitting, translating to €718 million investments (excluding in green energy projects) under permitting and construction to be delivered during 2026-2028.
Identify new income streams - green energy
In 2025, NEPI Rockcastle produced solar power energy from 38 MW of power-generating capacity installed on 27 properties in Romania and one in Lithuania, leading to €9.6 million net operating income. The second phase of this renewable energy programme will add another 15 MW accross 22 plants outside Romania in different stages of installation. The third phase of the green energy programme, comprising off-site greenfield photovoltaic plants in Romania is advancing, with the Chisineu-Cris plant (54 MW) expected to commence commercial operations in first quarter of 2026, and the Aricestii Rahtivani plant (60 MW) expected to start commercial operations by the end of 2026. These projects are expected to significantly expand the Group’s green energy generating capacity, and increase the coverage of electricity consumption needs of its tenants, enhancing the revenues from green energy production.
Value enhancing asset rotation
The Group is committed to invest selectively in assets that meet its rigorous investment criteria. Pursued retail assets must already be or have the potential to become dominant. Size is critical to achieve a comprehensive offering and an optimum tenant mix, including a large proportion of food and fashion anchors and substantial leisure and entertainment area.
Good location, access, visibility, design and technical specifications, as well as a potential for extension, reduce the threat of significant competition and enable the asset’s dominance in its catchment area. Delivering on its strategic focus, the Group added €57.8 million Net Operating Income in 2025 through its acquisitions completed in late 2024 in Poland (2024: €8 million).
Financial stability
The Group's financing strategy relies on maintaining a strong financial discipline, revolving around an adequate liquidity, prudent LTV, and a diverse debt and equity structure, to support business growth. Growth is funded through a combination of secured and unsecured debt (including bonds) and equity.
The Group prioritises its investment grade credit rating and its green portfolio profile, to maintain diversity and optionality in its financing sources, and optimise the cost of debt. Delivering on its financing strategy during 2025, the Group kept an LTV level of 32.8%, below the long-term strategic threshold of 35% and comfortably within debt covenants, while ensuring an adequate maturity profile.
ESG focus
NEPI Rockcastle makes a commitment to invest into initiatives that will not only enable it to meet sustainability and ESG targets, but will also generate a positive bottom-line impact, recognising the synergies between responsible citizenship and profitability. The Group formulated its sustainability strategy on four pillars: investing in healthy and sustainable buildings, being a trusted partner for stakeholders, pursuing energy leadership, creating an attractive, professional and ethical work environment.
In line with its strategic directions, the Group continued its commitment to maintain a BREEAM-certified retail and office portfolio and planned significant investment in on-site and off-site renewable electricity production that started in 2022 and will be delivered by 2028.
Value creation through the six capitals




Portfolio at a glance
Geographical property portfolio profile
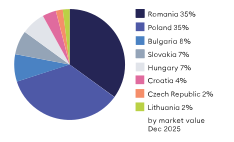
Geographical property portfolio profile by passing rent: Romania - 36%, Poland - 34%, Bulgaria - 8%, Slovakia - 7%, Hungary - 6%, Croatia - 4%, Lithuania - 3%, Czech Republic - 2%. |
Geographical property portfolio profile by rentable area: Romania - 40%, Poland - 33%, Bulgaria - 8%, Slovakia - 5%, Hungary - 5%, Croatia - 3%, Czech Republic - 3%, Lithuania - 3%. |
Sectorial property portfolio profile
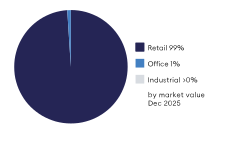
Sectoral property portfolio profile by passing rent: |
Sectoral property portfolio profile by rentable area: |
Key property information
Group 31 Dec 2025 | Group 31 Dec 2024 | |
|---|---|---|
Total number of properties | 63 | 63 |
Income producing properties | 59 | 60 |
Held for sale properties | 2 | 1 |
Greenfield developments | 2 | 2 |
Extentions to existing properties | 5 | 4 |
Fair value of properties (€ million)1 | 8,242 | 7,927 |
Lettable area (thousand GLA) | 2,580 | 2,576 |
Income producing properties and held for sale properties | 2,386 | 2,388 |
Greenfield developments and extensions (estimated) | 1942 | 1882 |
Weighted average unexpired lease term (years) up to maturity | 4.5 | 4.5 |
Weighted average unexpired lease term (years) up to first break | 3.6 | 3.5 |
Weighted average rent (€/m2) | 20.4 | 19.9 |
Annualised property yield (by net operating income)3 | 7.6% | 7.6% |
EPRA Net Initial Yiled (NIY)3 | 6.98% | 6.98% |
- Including right-of-use assets of €91.3 million for 2025 (2024: €85.9 million) representing long-term land concessions associated to part of the Group’s properties located in Poland. Including held for sale properties
- Including residential project with 21,500m2 GSA
- The two indicators differ in their methodology: the Annualised Property Yield includes variable rental income, while the EPRA NIY reflects only passing rent at year end. Estimated purchaser's costs are factored into the EPRA NIY but are excluded from the Annualised Property Yield
Detailed property schedule is included in this report at pages |
Overview of valuation yields
Appraiser | Country | Segment | Number of | Prime Yield | Capitalisation rate |
|---|---|---|---|---|---|
Colliers International | Romania | Retail | 28 | 7.25% | 7.50% |
Colliers International | Romania | Industrial | 1 | 7.75% | 9.75% |
Jones Lang LaSalle (JLL) | Poland | Retail | 16 | 6.50% | 7.00% |
Colliers International | Bulgaria | Retail | 2 | 7.75% | 7.75% |
Colliers International | Bulgaria | Office | 1 | 7.75% | 7.75% |
Cushman & Wakefield | Slovakia | Retail | 5 | 6.50% | 7.25% |
Cushman & Wakefield | Slovakia | Office | 1 | 6.25% | 9.00% |
Cushman & Wakefield | Hungary3 | Retail | 2 | 7.25% | 7.05% |
Cushman & Wakefield | Croatia | Retail | 1 | 7.25% | 7.75% |
Cushman & Wakefield | Czech Republic | Retail | 2 | 5.75% | 7.00% |
Jones Lang LaSalle (JLL) | Lithuania | Retail | 1 | 7.40% | 8.25% |
- Source: Colliers International, Cushman & Wakefield, and Jones Lang LaSalle (JLL) Q4 2025
- Percentages represent averages weighted by Market Values and rounded to the closest 25 bps
- Prime yield in Hungary is based on market sentiment considering there have been no transactions of prime shopping centres in recent years in the country. The Group’s properties’ capitalisation rates are impacted by their performance and retail properties transactions in the wider CEE region
Rental escalations
Out of the total operational GLA as at the year-end, the weighted average rental escalation (related to 2026 indexation) by rentable area is presented below:
Total | 2.1% |
|---|---|
Retail | 2.1% |
Office | 1.7% |
Industrial | 2.5% |
The majority of the leases are subject to indexation based on 12-month average rate of change of the European Consumer Price Index (EU CPI).
Vacancy profile
EPRA vacancy rate is calculated by dividing the estimated rental value of vacant space (€/annum) by estimated rental value of the property (€/annum).
The EPRA vacancy rate for income-producing properties at the end of 2025 was 1.2% (excluding one non-core retail property and one industrial property held for sale), split as follows: retail 1.0% and office 15.4%.
Future minimum lease payments
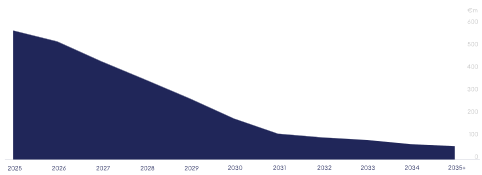
- Figures computed based
on contractual lease maturity date
Expiry profile1
Year | % of expiry by gross rentals | % of expiry by rentable area |
|---|---|---|
2026 | 8.5% | 6.7% |
2027 | 15.4% | 12.1% |
2028 | 14.1% | 13.3% |
2029 | 14.6% | 13.6% |
2030 | 15.5% | 13.2% |
2031 | 11.7% | 10.5% |
2032 | 2.9% | 3.8% |
2033 | 2.1% | 2.7% |
2034 | 3.2% | 3.6% |
>=2035 | 12.0% | 20.5% |
Total | 100% | 100% |
Tenant profile
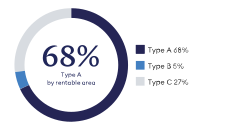
Type A: Large international and national tenants, large listed tenants, government and major franchises (companies with assets and/or turnovers in excess of €200 million).
Type B: Smaller international and national tenants, smaller listed tenants and medium to large professional firms (companies with assets and/or turnovers ranging
from €100 to €200 million).
Type C: Smaller regional tenants that do not meet the criteria for categorisation as Type A or Type B.
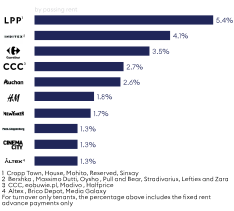
Top 10 retail tenants
The top 10 retail tenants accounted for 25.7% of the annualised passing rent of the Group as at 31 December 2025. Tenant concentration risk is very low, as shown by the graph below:
Romania


With a total of 28 regional malls and community centres, the Group is the largest owner of retail space in the country.
In 2025, significant progress was made on the Promenada Bucharest extension, including an enlargement and refurbishment of the food court area, with new brands openings such as Taco Bell, Wendy's and Hesburger.
2025 marked also the signing of the first agreement with Primark for the Group's Romanian portfolio, the new store being planned to open in Shopping City Sibiu in 2026. Given its vast portfolio, the Group secured and opened a few notable market entries such as Sports Direct in Promenada Craiova and Tatuum in Mega Mall.

 | Mega Mall
|
 | City Park
|
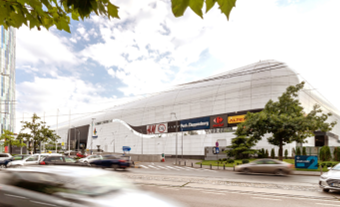 | Promenada Bucharest
|
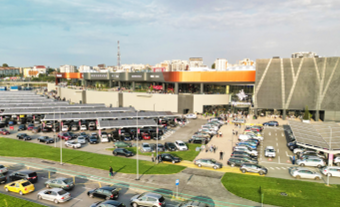 | Promenada Craiova
|
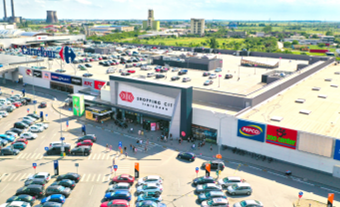 | Shopping City Timisoara
|
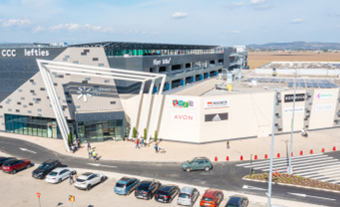 | Shopping City Ploiesti
|
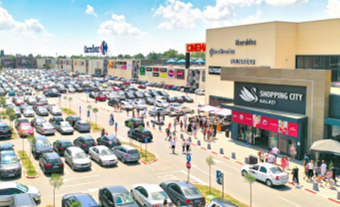 | Shopping City Galati
|
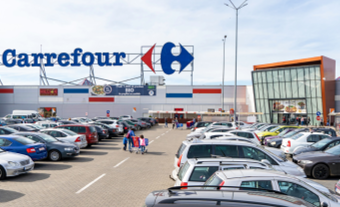 | Shopping City Sibiu
|
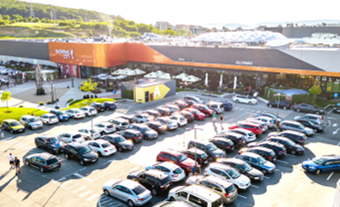 | Shopping City Targu Mures
|
 | Promenada Sibiu
|
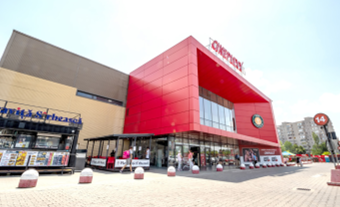 | Iris Titan Shopping Center
|
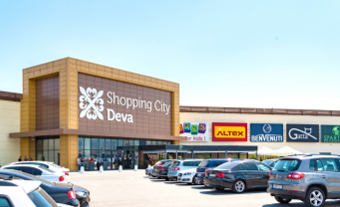 | Shopping City Deva
|
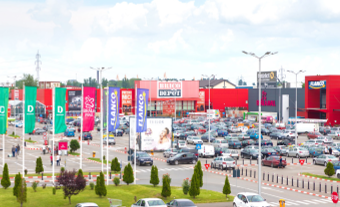 | Braila Mall
|
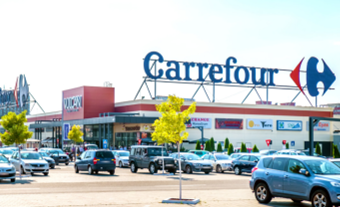 | Vulcan Value Centre
|
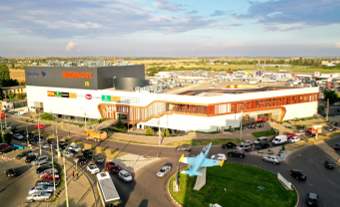 | Shopping City Buzau
|
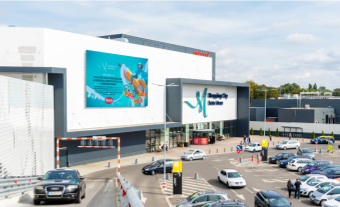 | Shopping City Satu Mare
|
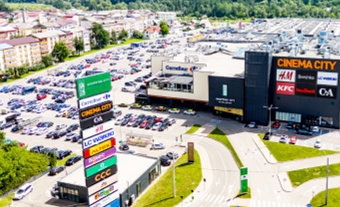 | Shopping City Piatra Neamt
|
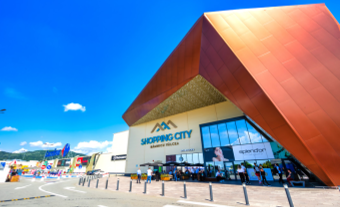 | Shopping City Ramnicu Valcea
|
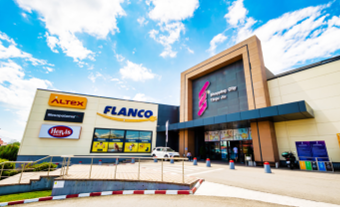 | Shopping City Targu Jiu
|
 | Severin Shopping Center
|
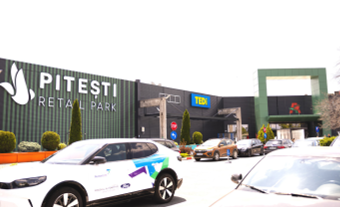 | Pitesti Retail Park
|
 | Regional strip centres
|
Poland


In 2025, Poland has strengthened its position as one of the two principal markets in NEPI Rockcastle portfolio. The full-year contribution of Magnolia Park and Silesia City Center, acquired in late 2024, combined with strong like-for-like tenant sales growth of 5%, drove an impressive uplift in portfolio value across the country.
The tenant mix was enriched with new functions, including the Just Gym fitness club and the Fikolki children’s activity centre,
as well as new fashion brands such as Medicine, Worldbox, and Verona.
The multi-stage refurbishment of Bonarka City Center reached significant milestones in 2025, including a complete redesign of the food court and common areas to integrate more natural light and greenery, ensuring it remains the dominant retail destination in southern Poland.

 | Silesia City Center
|
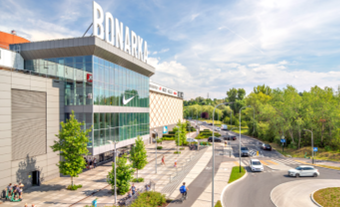 | Bonarka City Center
|
 | Magnolia Park
|
 | Forum Gdansk Shopping Center
|
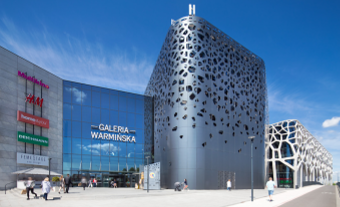 | Galeria Warminska
|
 | Focus Mall Zielona Gora
|
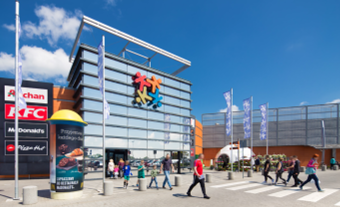 | Karolinka Shopping Centre
|
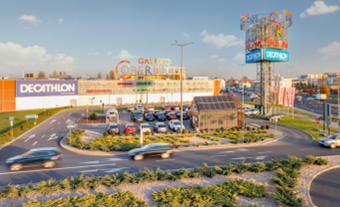 | Copernicus Shopping Centre
|
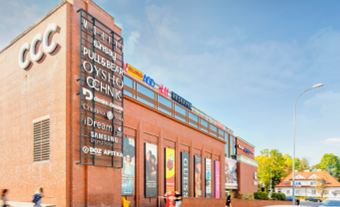 | Alfa Centrum Bialystok
|
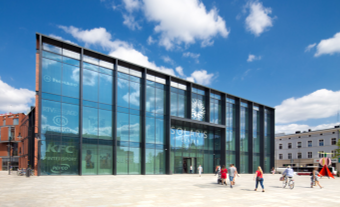 | Solaris Shopping Centre
|
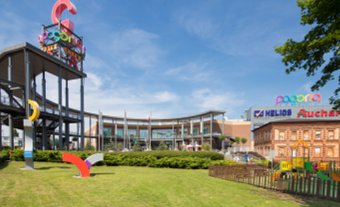 | Pogoria Shopping Centre
|
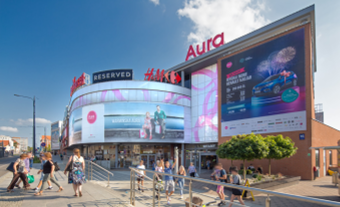 | Aura Centrum
|
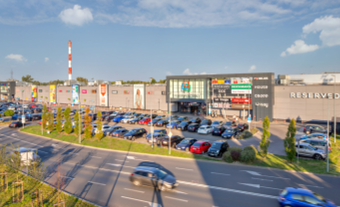 | Galeria Wolomin
|
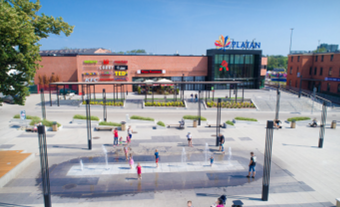 | Platan Shopping Centre
|
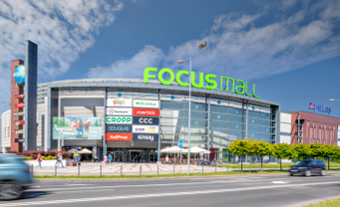 | Focus Mall Piotrkow Trybunalski
|
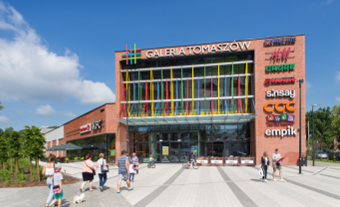 | Galeria Tomaszow
|
Bulgaria


The Group owns Paradise Center, the largest retail centre in the country and Serdika Center, a modern shopping centre benefiting from an excellent location in Sofia together with Serdika Office, a Class A office situated atop the shopping centre.
In 2025 the centres went through major renovations of the food courts, delivering to the customer an elevated dining experience.
The tenant mix of the centers was further improved by adding key fashion names like Weekend by Max Mara and Marc Cain in Paradise Center, Mohito and Celio in Serdika Center. Reconfiguration and extension of retail space in both centres have started, so that increased market demand can be met and newest flagship concepts of international brands can be opened.
 | Paradise Center
|
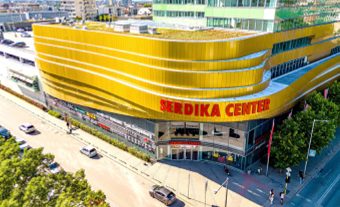 | Serdika Center
|
Hungary


The Group's Budapest portfolio comprises Arena Mall, the second largest shopping centre in the city, and Mammut Shopping Centre, giving NEPI Rockcastle an unrivalled retail presence in the Hungarian capital.
The refurbishment of Arena Mall Budapest reached major milestones in 2025 with 90% of the refurbished GLA
already pre-leased, ensuring the asset retains its status as Hungary’s premier retail destination.
Hungary remained a key target for retailers' expansion, highlighted by the debut of Rituals in Mammut Shopping Centre. Additionally, Arena Mall strengthened its fashion leadership with the opening of high-profile flagship stores for Zara and Reserved.
 | Arena Mall
|
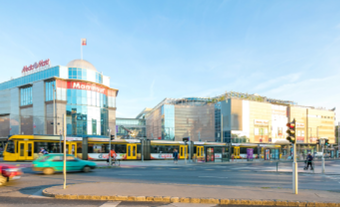 | Mammut Shopping Centre
|
Slovakia


In Slovakia, the Group operates five regional malls alongside an office building in Kosice, the country's second largest city, forming one of the most extensive retail networks in the market.
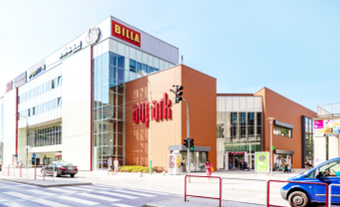
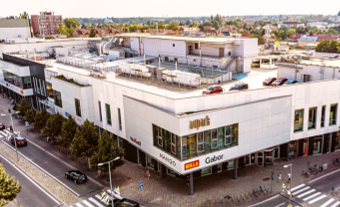
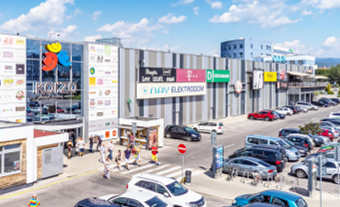
The signing of Victoria's Secret at Aupark Kosice Mall, Rituals at Aupark Zilina and Galeria Mlyny in Nitra is a clear signal that well-known international brands increasingly recognise the appeal and strategic value of Slovakia's regional cities.

 | Aupark Kosice Mall
|
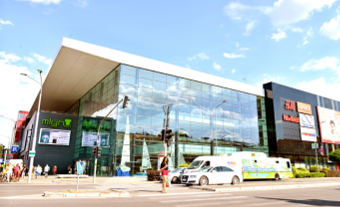 | Galeria Mlyny
|
 | Aupark Zilina
|
 | Aupark Shopping Center Piestany
|
 | Korzo Shopping Centrum
|
Croatia


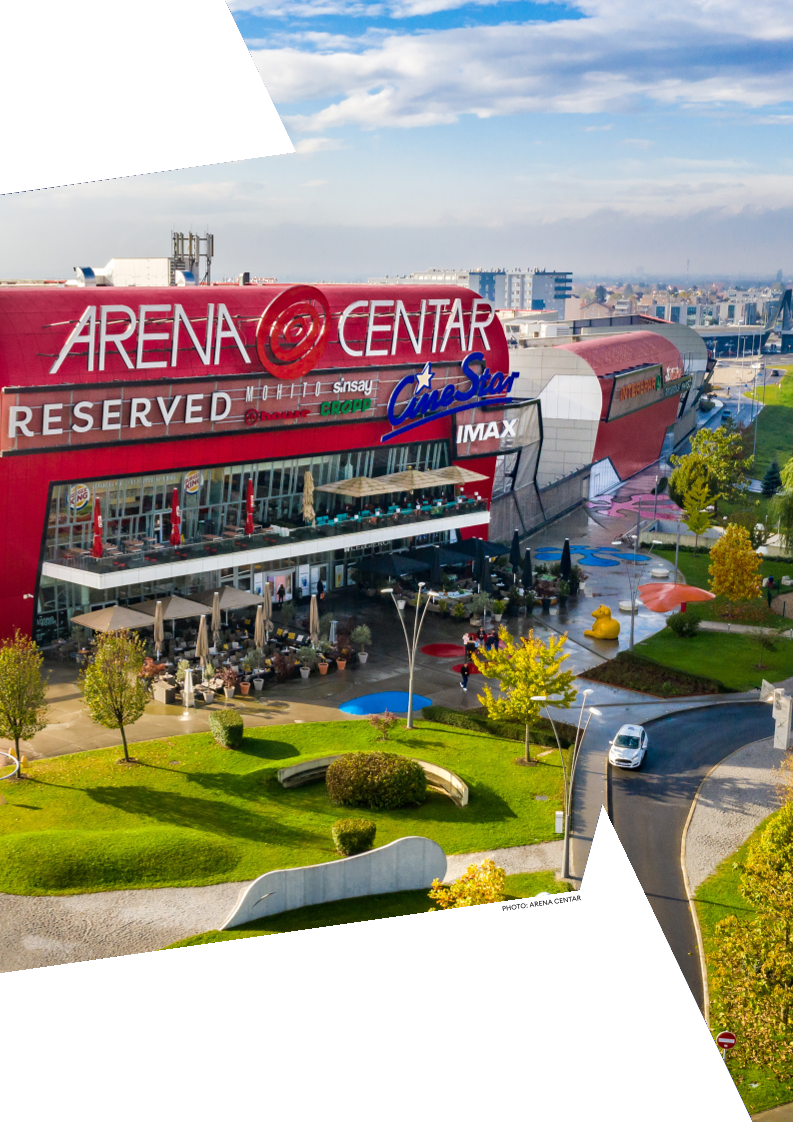
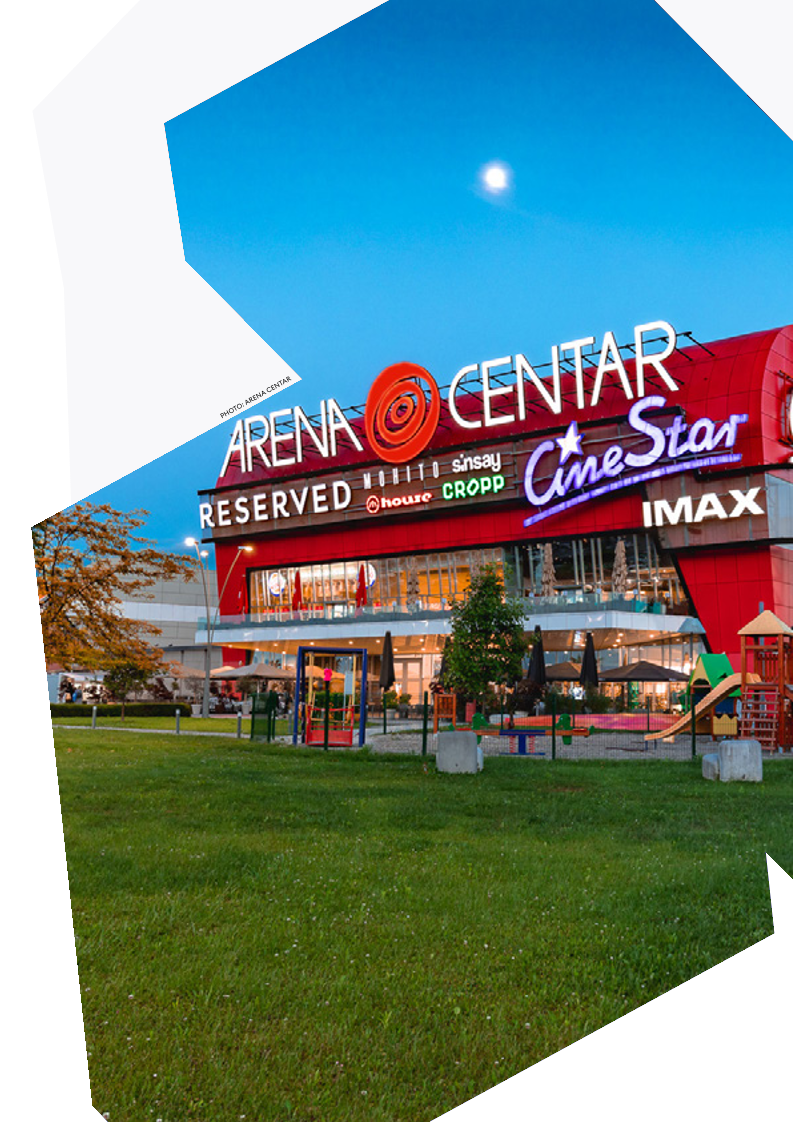
The Group owns the largest shopping destination in Zagreb, Arena Centar and Retail Park, comprising a shopping mall of 67,300m2 and an adjacent retail park of 8,000m2.
An extensive refurbishment programme launched in 2025 is transforming the mall's offer, with works including the relocation of the food court, a redesigned sports cluster, and the enlargement and full refurbishment of Zara.
The relocation of Bershka further elevates the tenant mix. At the Retail Park, a new KFC drive-thru has been developed and opened, adding GLA to the asset.
Czech Republic


The Group owns two dominant malls in the Czech Republic: Forum Usti nad Labem and Forum Liberec Shopping Centre, both situated in the northern part of the country.
After the complete refurbishment of Forum Liberec Shopping Centre, the tenant mix stays strong which is translated into the record lowest vacancy.
The opening of WorldBox and Tatuum further confirms the attractivity of Forum Liberec Shopping Centre for international brands. Forum Usti nad Labem enjoyed solid performance, attracting interest of well-known international brands and opening stores such as Sinsay and JD Sports.
 | Forum Liberec Shopping Centre
|
 | Forum Usti nad Labem
|
Lithuania


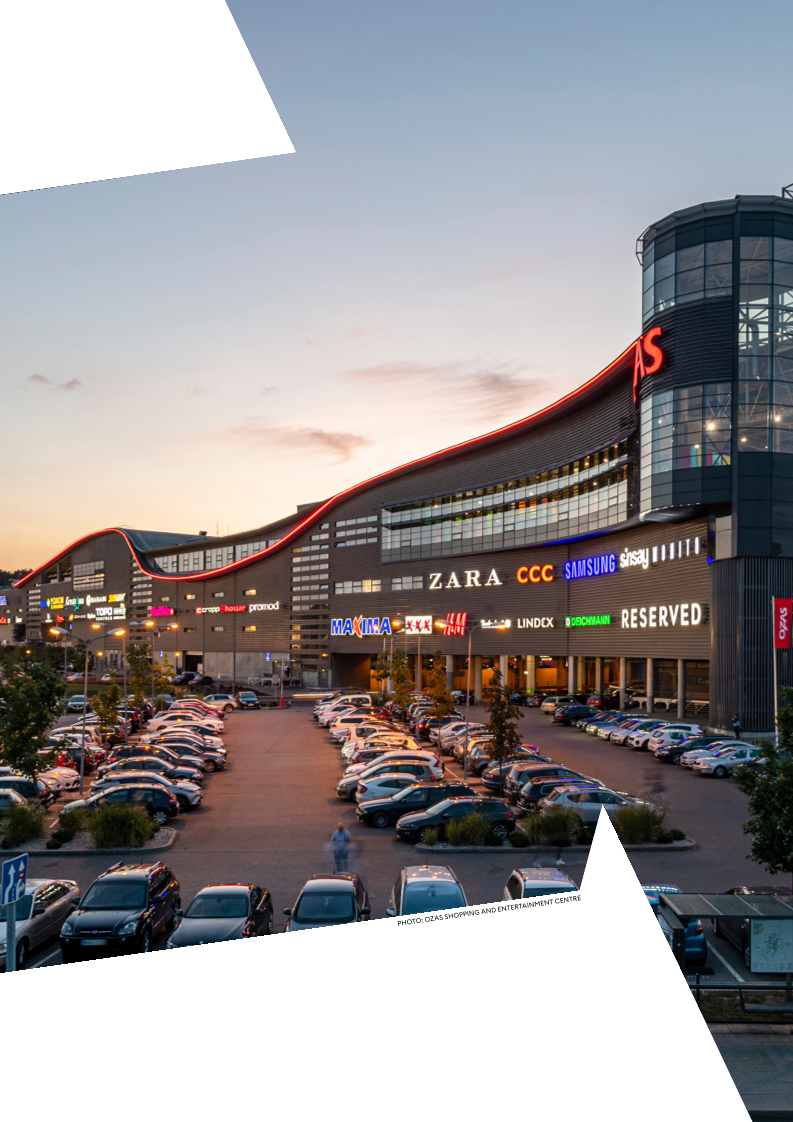
The Group owns Ozas Shopping and Entertainment Centre, one of Vilnius’ leading retail and entertainment assets, distinguished by its prime location and a well‑balanced portfolio of international tenants.
Ozas retains a strong competitive position through a distinctive mix of fashion and lifestyle brands, including the only Peek & Cloppenburg store in Vilnius,
alongside new-concept stores from all LPP Group brands, CCC, JD Sports and Douglas.
The centre is equally recognised as one of the city's leading entertainment destinations, home to Adventica, Action! by Apollo, Multikino, the Plaukimo Šeima swimming and education pool and fitness club GYM+ — one of the broadest leisure propositions in Vilnius.
Office


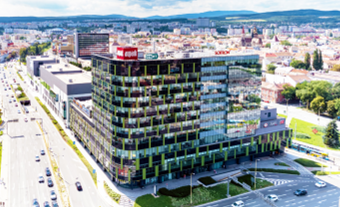
Serdika Office and Aupark Kosice Tower are the two office properties owned by the Group, both integrated with the shopping malls creating synergies with the retail component.

Serdika Office
Sofia, Bulgaria
GLA | 28,500m2 |
Valuation | €47.6 million |
Passing rent | €3.0 million |
EPRA Occupancy | 81.5% |
Aupark Kosice Tower
Kosice, Slovakia
GLA | 12,800m2 |
Valuation | €21.5 million |
Passing rent | €1.6 million |
EPRA Occupancy | 92.3% |
Industrial


The Group owns one industrial property, Rasnov Industrial Facility in Brasov county, Romania. As at 31 December 2025 this property was reclassified as held for sale.
Development and extensions pipeline
NEPI Rockcastle will continue to invest in developments contributing to growth and improving long-term portfolio prospects, proactively monitoring and revising the development pipeline in line with its evolving objectives and constraints. The total investment value of projects under construction or permitting is approximately
€845 million, of which €326 million was spent by 31 December 2025. During 2026, the Group estimates to invest €338 million in development and capital expenditure related to its ongoing projects and will consider new development opportunities depending on how market circumstances evolve.
GLA/GSA1 of development (m2) | |
|---|---|
Developments under construction | 64,900 |
Promenada Bucharest | 55,400 |
Bonarka City Center2 | 4,700 |
Pogoria Shopping Centre3 | 4,800 |
Arena Mall2 | N/A |
Photovoltaic projects | N/A |
Developments under permitting | 129,100 |
Promenada Plovdiv | 60,500 |
Galati Retail Park4 | 59,800 |
Karolinka Shopping Centre | 8,800 |
Battery Energy Storage Systems | N/A |
Total developments under construction, | 194,000 |
Developments under permitting | 33,000 |
Craiova Residential | 11,800 |
Brasov Residential | 21,200 |
- GSA - Gross sellable area
- Refurbishment and extension costs are allocated on the existing assets. The properties (including the refurbishment costs) are subject to fair valuation at half year and year-end
- Opened in February 2026
- Including residential project with 21,500m2 GSA

 | Promenada Bucharest - extension The extension will add 55,400m2 GLA of retail, office and hotel space to the existing shopping centre. Opening of the retail part is estimated for the first quarter of 2027.
|
 | Bonarka City Center - refurbishment A refurbishment which includes the extension by 4,700m2 of GLA. The estimated completion date is in the first quarter of 2027.
|
 | Pogoria Shopping Centre - extension A refurbishment which includes the extension by 4,800m2 of GLA that was completed in February 2026.
|
 | Arena Mall - refurbishment Refurbishment of the actual space to be completed by second quarter of 2028.
|
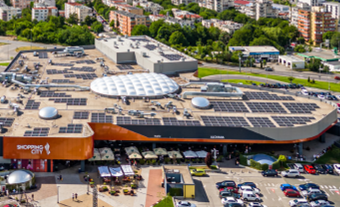 | Photovoltaic installations (PV) The second phase of the Group's renewable energy programme will add another 15 MW in 21 of NEPI Rockcastle’s properties outside Romania (22 installations). Individual projects are under various stages of installation, completion estimated by the end of 2026.
|
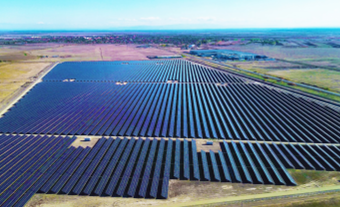 | Greenfield developments of Photovoltaic projects The third phase of the Group's renewable energy programme involves investment in greenfield photovoltaic plants in Romania with a combined capacity of 159 MW. The first plant in Chisineu-Cris (54 MW) was completed in 2025 and is expected to commence commercial operations in Q1 2026, with the second plant in Aricestii Rahtivani expected to be operational by the end of 2026.
|
EPRA Performance measures
EPRA Performance measures
European Public Real Estate Association (EPRA), the representative organisation of the publicly listed real estate industry in Europe, has established a set of Best Practice Recommendation Guidelines (EPRA BPR), which focus on the key measures of the most relevance to investors. These recommendations aim to give financial statements of public real estate companies more clarity, more transparency and comparability across European peers.
The Group has been awarded for the last six years with Gold Award for BPR for financial reporting, the highest standard for transparency of financial performance measures.
Certain of these EPRA performance measures are considered to be pro forma financial information in terms of the JSE Listings Requirements. These include EPRA earnings (euro thousand), EPRA earnings per share (euro cents per share), EPRA net reinstatement value (NRV) (euro per share), EPRA net tangible assets (NTA) (euro per share) and EPRA net disposal value (NDV) (euro per share). These measures have been extracted, without adjustment, from the Group’s consolidated financial statements for the year ended 31 December 2025 and are the same as presented in the appendix titled EPRA Performance Measures as included in the reviewed condensed consolidated financial results of the Group for the year ended 31 December 2025, issued on 23 February 2026 and opined on by Ernst & Young Inc.
EPRA performance measures reported by NEPI Rockcastle are set out below:
EPRA indicators | 31 December 2025 | 31 December 2024 |
|---|---|---|
EPRA Earnings (€ thousand) | 441,995 | 405,972 |
EPRA Earnings per share (€ cents per share) | 62.19 | 59.18 |
EPRA Net Initial Yield (NIY)1 | 6.98% | 6.98% |
EPRA topped-up NIY1 | 7.00% | 7.00% |
EPRA vacancy rate | 1.2% | 1.7% |
EPRA Net Reinstatement Value (NRV) (€ per share) | 7.68 | 7.38 |
EPRA Net Tangible Assets (NTA) (€ per share) | 7.64 | 7.35 |
EPRA Net Disposal Value (NDV) (€ per share) | 6.96 | 6.83 |
EPRA Cost ratio (including direct vacancy cost) | 9.8% | 9.6% |
EPRA Cost ratio (excluding direct vacancy cost) | 9.7% | 9.5% |
EPRA Loan-to-value (LTV) | 34% | 33% |
- Does not include investment property held for sale.
EPRA Earnings
EPRA Earnings presents the underlying operating performance of a real estate company excluding fair value gains or losses on investment property, profit or loss on disposals, deferred tax, and other non-recurring items, that are not considered to be part of the core activity of the Group.
EPRA Earnings | 31 December 2025 | 31 December 2024 |
|---|---|---|
Earnings in IFRS Consolidated Statement of comprehensive income | 498,839 | 587,565 |
Fair value adjustments of investment property | (162,252) | (195,380) |
Gain on disposal of assets held for sale | - | (25,934) |
Profit from inventory property sale | (1,803) | (4,569) |
Fair value adjustment of derivatives and losses of extinguishment of financial instruments | 9,949 | 12,818 |
Deferred tax expense | 97,262 | 31,472 |
EPRA Earnings (interim) | 221,113 | 199,964 |
EPRA Earnings (final) | 220,882 | 206,008 |
EPRA Earnings (total) | 441,995 | 405,972 |
Number of shares for interim distribution | 710,716,7981 | 660,826,020 |
Number of shares for final distribution | 710,716,7981 | 712,357,309 |
EPRA Earnings per Share (EPS interim) | 31.11 | 30.26 |
EPRA Earnings per Share (EPS final) | 31.08 | 28.92 |
EPRA Earnings per Share (EPS) | 62.19 | 59.18 |
Company specific adjustments: | ||
Amortisation of financial assets | (2,619) | (3,593) |
Depreciation expense for property, plant and equipment | 1,584 | 1,607 |
Add back unrealised foreign exchange losses | 224 | - |
Antecedent earnings | (283) | 9,107 |
Distributable Earnings (interim) | 220,695 | 199,044 |
Distributable Earnings (final) | 220,206 | 214,049 |
Distributable Earnings (total) | 440,901 | 413,093 |
Distributable Earnings per Share (interim) (euro cents) | 31.05 | 30.12 |
Distributable Earnings per Share (final) (euro cents) | 30.98 | 30.05 |
Distributable Earnings per Share (total) (euro cents) | 62.03 | 60.17 |
- Excludes 1,640,511 treasury shares as at 30 June 2025 and as at 31 December 2025.
EPRA Net Asset Value metrics (NAV)
The EPRA NAV set of metrics make adjustments to the NAV per the IFRS financial statements to provide stakeholders with the most relevant information on the fair value of the assets and liabilities of a real estate investment company, under different scenarios.
EPRA Net Reinstatement Value (NRV)
The objective of the EPRA Net Reinstatement Value measure is to highlight the value of net assets on a long-term basis. Assets and liabilities that are not expected to crystallise in normal circumstances such as the fair value movements on financial derivatives and deferred taxes on property valuation surpluses are therefore excluded. Since the aim of the metric is to also reflect what would be needed to recreate the company through the investment markets based on its current capital and financing structure, related costs such as real estate transfer taxes should be included.
EPRA Net Tangible Assets (NTA)
The underlying assumption behind the EPRA Net Tangible Assets calculation assumes entities buy and sell assets, thereby crystallising certain levels of deferred tax liability.
EPRA Net Disposal Value (NDV)
The EPRA Net Disposal Value provides the reader with a scenario where deferred tax, financial instruments, and certain other adjustments are calculated as to the full extent of their liability, including tax exposure not reflected in the Balance Sheet, net of any resulting tax. This measure should not be viewed as a “liquidation NAV” because, in many cases, fair values do not represent liquidation values.
For more detailed explanations of EPRA adjustments and requirements please refer to the EPRA Best Practices Recommendations (EPRA_BPR_Guidelines)
EPRA Net Asset Values as of 31 December 2025
EPRA NRV | EPRA NTA | EPRA NDV | |
|---|---|---|---|
IFRS Equity attributable to shareholders | 5,006,336 | 5,006,336 | 5,006,336 |
Exclude: | |||
Net deferred tax liabilities | 535,108 | 508,3531 | - |
Derivative financial assets at fair value through profit or loss | (4,544) | (4,544) | - |
Goodwill | (76,804) | (76,804) | (76,804) |
Include: | |||
Difference between the secondary market price and accounting value of fixed interest rate debt2 | - | - | 13,645 |
NAV | 5,460,096 | 5,433,341 | 4,943,177 |
Number of shares3 | 710,716,798 | 710,716,798 | 710,716,798 |
NAV per share | 7.68 | 7.64 | 6.96 |
- The net deferred tax liability has been adjusted to account for the crystallization effect. This adjustment is based on management's estimation and reflects the anticipated future tax implications.
- Calculated using publicly available quoted prices.
- Excludes 1,640,511 treasury shares as at 31 December 2025.
EPRA Net Asset Values as of 31 December 2024
EPRA NRV | EPRA NTA | EPRA NDV | |
|---|---|---|---|
IFRS Equity attributable to shareholders | 4,908,482 | 4,908,482 | 4,908,482 |
Exclude: | |||
Net deferred tax liabilities | 437,846 | 415,9541 | - |
Derivative financial assets at fair value through profit or loss | (9,662) | (9,662) | - |
Goodwill | (76,804) | (76,804) | (76,804) |
Include: | |||
Difference between the secondary market price and accounting value of fixed interest rate debt2 | - | - | 33,973 |
NAV | 5,259,862 | 5,237,970 | 4,865,651 |
Number of shares | 712,357,309 | 712,357,309 | 712,357,309 |
NAV per share | 7.38 | 7.35 | 6.83 |
- The net deferred tax liability has been adjusted to account for the crystallization effect. This adjustment is based on management's estimation and reflects the anticipated future tax implications.
- Calculated using publicly available quoted prices.
EPRA NIY and “topped-up” NIY
The EPRA Net Initial Yield (NIY) is calculated as the annualised rental income based on passing cash rents, less non-recoverable property operating expenses, divided by the gross market value of the property.
In EPRA “topped-up” NIY, the net rental income is “topped-up” to reflect rent after the expiry of lease incentives such as rent-free periods and rental discounts.
EPRA NIY and “topped-up” NIY | 31 December 2025 | 31 December 2024 |
|---|---|---|
Investment property as per Condensed Consolidated Financial Statements | 8,232,702 | 7,926,595 |
Investment property held for sale | 9,567 | 559 |
Less investment property under development | (285,273) | (231,797) |
Total investment property in use | 7,956,996 | 7,695,357 |
Estimated purchasers costs | 39,785 | 38,477 |
Gross up value of the investment property in use | 7,996,781 | 7,733,834 |
Annualised cash passing rental income1 | 574,900 | 558,750 |
Non-recoverable property operating expenses | (16,573)2 | (19,178) |
Annualised net rents | 558,327 | 539,572 |
Notional rent expiration of rent-free periods or other lease incentives3 | 1,793 | 2,177 |
Topped-up net annualised rent | 560,120 | 541,749 |
EPRA Net Initial Yield (EPRA NIY) | 6.98% | 6.98% |
EPRA “topped-up” NIY | 7.00% | 7.00% |
- Annualised passing rent computed based on the contractual rental amounts effective as at that date.
- Exclude the impact of one-off or non-recurring effects on service charges incurred in the period.
- Adjustment for unexpired lease incentives such as rent-free periods, discounted rent periods and step rents. The adjustment includes the annualised cash rent that will apply at the expiry of the lease incentive.
EPRA Vacancy Rate
The EPRA Vacancy Rate estimates the percentage of the total potential rental income not received due to vacancy.
The EPRA Vacancy Rate is calculated by dividing the estimated rental value of vacant premises by the estimated rental value of the entire property portfolio if all premises were fully leased. The EPRA vacancy rate is calculated using valuation reports performed by independent experts.
EPRA Vacancy Rate | 31 December 2025 | 31 December 2024 |
|---|---|---|
Estimated rental value of vacant space (euro) | 7,466,513 | 10,220,447 |
Estimated rental value of the whole portfolio (euro) | 627,885,457 | 607,513,837 |
EPRA Vacancy Rate1 | 1.2% | 1.7% |
- Excludes non-core properties.
Country | EPRA Vacancy Rate December 2025 | EPRA Vacancy Rate December 2024 |
|---|---|---|
Romania | 0.6% | 0.7% |
Poland | 0.7% | 1.3% |
Hungary | 3.7% | 4.0% |
Slovakia | 3.9% | 2.8% |
Bulgaria | 1.8% | 2.9% |
Croatia | 1.4% | 7.4% |
Czech Republic | 1.8% | 2.3% |
Lithuania | 0.0% | 0.3% |
EPRA Cost ratio
EPRA Cost ratios reflect the relevant administrative and operating costs of the business and provide a recognised and understood reference point for analysis of a company’s costs.
The EPRA Cost ratio (including direct vacancy costs) includes all administrative and operating expenses in the IFRS statements (net of any service fees).
The EPRA Cost ratio (excluding direct vacancy costs) is calculated as above, but with an adjustment to exclude vacancy costs.
EPRA Cost Ratios | 31 December 2025 | 31 December 2024 |
|---|---|---|
Administrative expenses (line per IFRS Consolidated Financial Statements) | 45,042 | 35,193 |
Net service charge costs | 15,873 | 19,178 |
EPRA Costs (including direct vacancy costs) | 60,915 | 54,371 |
Direct vacancy costs | 236 | 430 |
EPRA Costs (excluding direct vacancy costs) | 60,679 | 53,941 |
Gross rental income | 624,348 | 566,069 |
EPRA Cost ratio (including direct vacancy costs) | 9.8% | 9.6% |
EPRA Cost ratio (excluding direct vacancy costs) | 9.7% | 9.5% |
EPRA loan-to-value (EPRA LTV)
The LTV ratio is an important metric that assesses the lending risk a lender bears by providing a loan as per the borrower's requirement and it shows the relation of debt to the fair value of the assets. NEPI Rockcastle has chosen to disclose, among other indicators, the EPRA LTV ratio, calculated in accordance with EPRA Best Practices Recommendations.
There are a few changes compared to existing LTVs. One of the main changes is that the current net receivables/payables amount is included in the calculation of EPRA LTV. Another company-specific change is that Group LTV considers property, plant and equipment related to its energy producing assets (photovoltaic installations) in the calculation.
EPRA LTV Metric | 31 December 2025 | 31 December 2024 |
|---|---|---|
Include: | ||
Borrowings from Financial Institutions | 998,349 | 962,945 |
Bond loans | 2,016,331 | 2,001,423 |
Net payables | 65,756 | 71,138 |
Exclude: | ||
Cash and cash equivalents | (313,994) | (448,498) |
Net Debt (a) | 2,766,442 | 2,587,008 |
Include: | ||
Investment properties at fair value | 7,856,172 | 7,608,849 |
Assets held for sale | 9,567 | 559 |
Properties under development | 285,273 | 231,797 |
Total Property Value (b) | 8,151,012 | 7,841,205 |
LTV (a/b) | 34% | 33% |


Corporate insights
Executive Directors
 | RÜDIGER DANY (63) BSc | |
Rüdiger Dany has extensive professional experience in international environments across Europe for some of the largest international retail and real estate companies including ECE, Atrium and Multi Corporation. During his tenure with Multi Corporation (affiliated with Blackstone), Mr Dany played an important role in optimising and expanding their property management portfolio for institutional investors. As a Board Member and COO of Multi, his major achievement was the value enhancement of Blackstone’s property portfolio and the successful opening of new shopping centres, developments and extensions of existing shopping centres. Mr Dany has also driven the creation of an innovation group within Multi to elaborate business opportunities by using modern PropTech tools, both B2B and B2C. Mr Rüdiger Dany was appointed as an Executive Director and Chief Operating Officer on 18 August 2021, and as Interim Chief Executive Officer on 1 February 2022. He was confirmed as CEO on a permanent basis on 1 June 2022. Mr Dany holds German nationality. Mr Dany's mandate concludes on 31 March 2026. He will be succeeded by Mr Marek Noetzel as Chief Executive Officer, effective 1 April 2026. |
 | ELIZA PREDOIU (41) BCom, ACCA | |
Eliza Predoiu has diverse finance and real estate expertise, including eleven years in the Company. She has proven expertise in multi-million funding projects, complex business transactions and integration processes of mergers, systems and controls. Prior to joining NEPI, she was Deputy Manager at PricewaterhouseCoopers, where she spent six years handling local and cross-border audit assignments and advisory projects in the Romanian and Cypriot offices. Mrs Predoiu joined the Company in 2014 and was promoted as Deputy Chief Financial Officer in 2018. She was appointed as Interim Chief Financial Officer on 1 February 2022 and from 1 June 2022 she was confirmed in her role on a permanent basis. Mrs Predoiu holds Romanian nationality. |
 | MAREK NOETZEL (47) MSc, MRICS | |
Marek Noetzel has been active on the Polish retail real estate market since 2002, gaining his professional experience at Cushman & Wakefield. As Head of the Retail department, he was responsible for commercialisation, development, asset management, investment and financial consultancy services, working for multiple international and national clients. Mr Noetzel joined Rockcastle in 2016 and played an important role in establishing the office in Poland and expanding operations abroad. He was appointed as an Executive Director of NEPI Rockcastle on 15 May 2017, responsible for the asset management of Company’s properties in Poland, Hungary, Slovakia, Czech Republic and Lithuania. He was appointed as Chief Operating Officer effective from 1 June 2022. Mr Noetzel holds Polish nationality. Mr Noetzel has been appointed as Chief Executive Officer, effective 1 April 2026. Mr Marius Barbu was appointed as Chief Operating Officer with effect from 1 April 2026, to succeed Mr Noetzel. |
Corporate governance
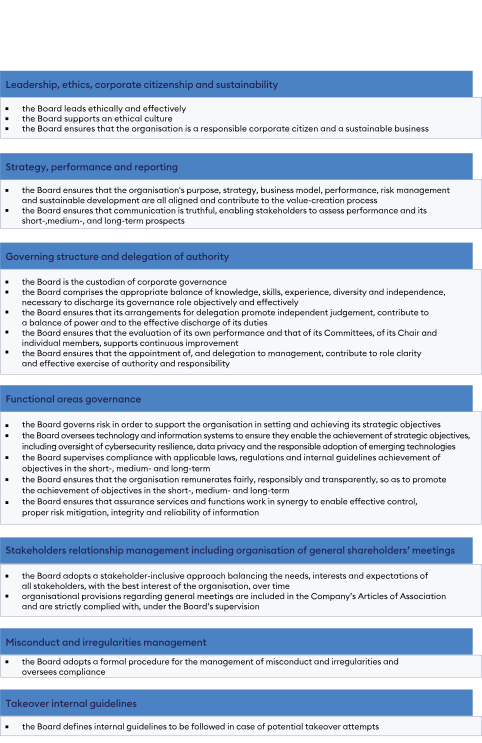
Corporate Governance Framework
Based on King IV and Dutch governance codes, the Group governance framework comprehensively covers key governance areas and core principles:
leadership, ethics, corporate citizenship and sustainability
strategy, performance and reporting
governing structure and delegation of authority
functional areas governance
stakeholders relationship management, including organisation of general shareholders' meetings
misconduct and irregularities management
takeover guidelines
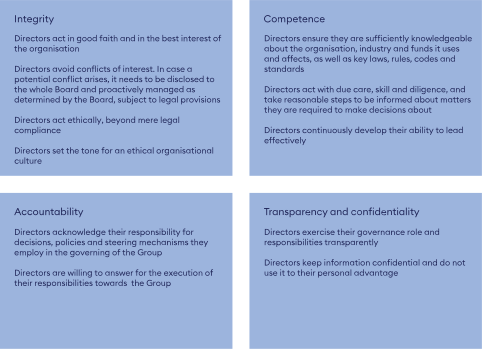
Core leadership principles at Board level
The Board adopts best practice governance policies designed to align the interests of the Company, Board and management with those of the stakeholders, and promote the highest standards of ethical behaviour and risk management. The members of the Board individually and collectively cultivate a strong set of values, setting the company culture and leading by example.
Company’s culture
NEPI Rockcastle's culture is foundational to achieving its strategic objectives and delivering sustainable long-term value for all stakeholders. The Board recognises that a strong, ethical and purpose-driven culture underpins sound governance, operational excellence and stakeholder trust.
Purpose and values
The Group's purpose is to create vibrant retail destinations that enrich communities, support tenant success and generate sustainable returns for shareholders.
NEPI Rockcastle's core values guide decision-making at all levels and shape the Group's approach to business. These include:

Embedding culture throughout the organisation
The Board sets the tone from the top by demonstrating ethical leadership and holding management accountable for embedding the desired culture throughout the organisation. Key mechanisms for promoting and sustaining the Group's culture include:
Code of Ethics: The Group's Code of Ethics sets clear expectations for behaviour and conduct across all levels of the organisation, covering matters such as integrity, conflicts of interest, fair dealing, confidentiality and compliance with laws and regulations. All employees and Directors are required to acknowledge and adhere to the Code, and regular training is provided to reinforce its principles
Whistleblowing and speak-up culture: The Group maintains a confidential whistleblowing channel enabling employees, contractors and external parties to report concerns about unethical conduct, fraud, corruption or breaches of policy without fear of retaliation. The Audit Committee oversees the whistleblowing management process, ensuring that all reports are appropriately addressed
Employee engagement and wellbeing: NEPI Rockcastle is committed to creating a positive working environment where employees feel valued, respected and empowered to contribute to the Group's success. Regular employee engagement surveys are conducted to gather feedback and identify areas for improvement. The Group invests in training and professional development to support employee growth, and promotes work-life balance
Diversity and inclusion: The Group is committed to building a diverse and inclusive workforce. The Diversity Policy applies to the Board and management, promoting diversity across dimensions including gender, age, nationality, education and background. The Group has set measurable targets and monitors progress
Performance and recognition: The remuneration framework is designed to align individual and team performance with the Group's strategic objectives and cultural values. Both financial and non-financial performance metrics are considered, including adherence to ethical standards and contribution to sustainability goals
Monitoring and assessing culture
The Board monitors the health of the organisation's culture through a range of indicators and reporting mechanisms, including employee engagement survey results, staff turnover and retention rates, whistleblowing reports and their resolution, compliance with the Code of Ethics, conflicts of interests review and monitoring risk reports. Management reports to the Board include various cultural aspects, and the Board considers culture as part of its annual evaluation of the effectiveness of governance arrangements.
The Board is satisfied that the Group's culture is aligned with its purpose, values and strategy, and that appropriate mechanisms are in place to embed, promote and monitor the desired culture across the organisation. The Board remains committed to fostering a culture of ethical conduct, accountability and continuous improvement as the foundation for long-term sustainable success.
Strategic oversight
In carrying out their oversight role, the Board actively engages in setting the long-term strategic goals of the organisation, ensures sustainable value creation, reviews and approves business strategy, corporate financial objectives, financial and funding plans (ensuring consistency with strategic goals) and monitors the Group's performance.
The Group has a robust strategic framework for long-term value creation, that has been reviewed and endorsed by the Board.
When approving the strategy, the Board considered:
the Group’s impact on sustainability, including impact on the people and planet
making a fair contribution to the countries in which the Group operates
the impact of new technology and changing business models
The Board is essential in helping the Company articulate and pursue its purpose, with a focus on addressing issues increasingly important to investors, communities it operates in, clients and consumers.
The Board strongly believes that the Company's ability to design a strong long-term strategy and to manage environmental, social and governance matters, demonstrates the good governance ultimately required to achieve sustainable growth in the long-term. In this regard, the Board ensures that the organisation's strategy, risk management and sustainability considerations are integrated, recognising that sustainable business practices contribute to long-term value creation for all stakeholders.
The Group's strategy is designed and proposed by the management team and adopted by the Board. It is structured around major strategic directions, with each of the directions further developing into more granular objectives.
The Board takes an active role in monitoring how the Company is achieving its strategic objectives, based on regular management reports.
Role of the Board
The Board assumes collective responsibility for directing and governing the Group, ensuring effective corporate governance, promoting an ethical culture and overseeing that the organisation is a responsible corporate citizen. In line with King IV's stakeholder-inclusive approach, the Board ensures that the legitimate and reasonable needs, interests and expectations of all material stakeholders are balanced in the best interests of the organisation over time. This includes consideration of the interests of shareholders, funding partners, employees, tenants, visitors, suppliers, the community, the broader environment. Furthermore, the Board acts as a link between key stakeholders and the Group, by overseeing that transparent and effective communication mechanisms are in place.
A clear division of responsibilities at Board level is in place to ensure a balance of power and authority, including between the roles of Chairman, Lead Independent Director and Chief Executive Officer, roles which are clearly defined and segregated. This was designed to ensure that, either at Board or management level, no individual can hold single and unlimited control over the significant decision-making process. The Board delegates to management the authority and responsibility for day-to-day affairs through an Operational Mandate, while monitoring performance and overseeing compliance. This ensures that delegation to management contributes to role clarity and to the effective exercise of authority and responsibility.
In line with the governance framework, the Board meets regularly, at least four times a year.
No external advisors attend Board meetings on a regular basis, but they may be invited on a need basis to address various topics, as the Chairman deems necessary.
The Board holds two fundamental roles:
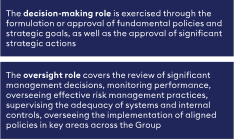
In line with the Articles of Association and the adopted Corporate Governance Framework, the Board:
adopts the Group's strategy and budget based on management's proposal
establishes a framework for the delegation of authority to Executive Directors and subsequent lines of management
steers the Group in achieving its core targets including the execution of the investment and development strategy and monitors performance
makes strategic decisions regarding significant financing transactions, following CFO’s recommendation
oversees equity management
monitors the financial performance of the business, including its going concern and viability, reviews the financial and operational results and approves the financial statements and the Group Annual Report
facilitates effective communication and engagement with key stakeholders
ensures that the Group's IT systems are integrated and support the delivering of the business strategy and internal processes
oversees the enterprise risk management framework and approves the Group's Risk Policy and Risk Appetite
oversees business conduct and ethical culture, by:
defining and approving key policies such as the Group Code of Ethics, Compliance Policy and Whistleblowing Policy
monitoring that management fosters a culture of ethical conduct and overseeing that it has implemented proper policies and procedures in line with the governance framework, the Board approved policies and the Company’s risk appetite
oversees the overall effectiveness of the internal controls framework, designed to ensure that assets are safeguarded, operations are run efficiently, effectively and economically, proper accounting records are maintained, the published financial information is reliable, laws and regulations are complied with
ensures an effective, risk-based, independent internal audit function
oversees that the combined assurance model covers effectively the organisation's significant risks and material matters, through a combination of:
line functions that own and manage risks on a daily basis
specialist functions that facilitate and oversee risk management and compliance
internal auditors
independent external assurance service providers, such as external auditors
other external assurance providers, such as sustainability and credit rating agencies
Some of the duties above are delegated to specialised Committees, while the Board collectively retains accountability.
The Chairman of the Board is an Independent non-Executive Director who acts as a link between the Board and the Executive Management. According to the Group's Corporate Governance Framework, the Chairman:
cannot be appointed as member or Chair of the Audit Committee or of the Risk and Compliance Committee
cannot chair the Remuneration Committee
must be a member of the Nomination Committee and can chair it
cannot be appointed Chief Executive Officer or an Executive Director
The Chairman has the following main responsibilities:
sets the ethical tone
fosters corporate governance
oversees the formal succession plan for Board members
oversees the performance evaluation process, the onboarding of new Directors and the continuous development of Board members
takes a lead role in removing non-performing Directors
ensures that any material misconduct amongst the members of the Board is investigated and properly responded to
ensures that Directors are mindful of their duties and responsibilities and foster proper functioning of the Board and Committees
ensures that the Board's agenda reserves sufficient time for strategic discussions, including long-term value creation, sustainability, stakeholder relations and emerging risks
sees that a Lead Independent Director is nominated
ensures that amicable relationships are maintained with major shareholders and other key stakeholders
Supporting the Chairman, the Lead Independent Director has the following responsibilities:
leads in the absence of the Chairman
serves as a trusted advisor of the Chairman
acts as a mediator between the Chairman and other members of the Board, if necessary
chairs discussions and decision-making by the Board on matters where the Chairman may have a conflict of interest
leads the performance appraisal of the Chairman
Group governance structure
The Group's governance structure establishes the fundamental relationships among the Board, Committees and Management. The Group is steered by the one tier Board, comprising both non-Executive and Executive Directors. |
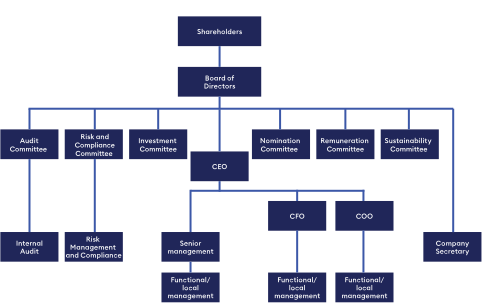
The Executive Directors on the Board are the Chief Executive Officer (CEO), the Chief Financial Officer (CFO), the Chief Operating Officer (COO), and they are responsible for:
CEO
ensures that a long-term strategy, in line with the Group's mission, is developed, advanced to the Board for approval and deployed
establishes performance goals and allocates resources to ensure growth, achievement of strategic objectives, compliance with applicable laws and regulations and responsible citizenship, as well as ensures that the strategy supports sustainable long-term value creation
ensures that a positive and ethical work environment exists and that the policies approved by the Board are implemented
acts as a chief spokesman for the Group
fosters communication between the Executive Directors, Management and non-Executive Directors
maintains investor relations
The CEO is not a member of governing bodies outside the Group, except for private companies managing personal investments.
CFO
manages the financial function of the Group, including the implementation of effective accounting, financial and fiscal policies
takes responsibility for financial and fiscal compliance, as well as general reporting of business performance
oversees the compilation of realistic budgets and their execution, including the analysis of variations
identifies funding needs and ensures these can be met in a cost-effective manner
supervises fiscal research, projections, analysis and optimisation
interacts and maintains relationships with external auditors, regulators, analysts, rating agencies
maintains investor relations together with the CEO
The CFO is not a member of governing bodies outside the Group, except for private companies managing personal investments.
COO
drives strategy setting for the Group’s portfolio and ensures implementation, monitoring and performance reporting
drives opportunity analysis for each asset and proposes potential shifts in assets management strategy
contributes to the capital allocation decisions
assesses the Group’s operations, profitability and sustainability, coordinates improvement proposals and the implementation of core initiatives in the Group’s assets and operations
coordinates tenants engagement strategy, optimising returns and monitoring tenants performance and occupancy cost
ensures swift, efficient and integrated processes and drives necessary performance improvement initiatives across the Group
drives the setting of a customer-centric culture
The COO is not a member of governing bodies outside the Group, except for private companies managing personal investments.
Employees representatives are not appointed in the Board, nor participate in Board meetings. While employees are not formally represented on the Board, the Board ensures that mechanisms are in place to enable employee engagement and to receive employee feedback.
Board appointments
In accordance with the Articles of Association, Directors are appointed, suspended or removed by the shareholders. Appointment is made based on the Board’s binding nomination, which can be deprived of its binding character by the shareholders decision. The Board can suspend Executive Directors, while the suspension can be lifted by the shareholders.
To facilitate the Board’s regular refreshing, the Group has a retiring-by-rotation policy, which means that each year, at least one third of the Directors retire by rotation and may stand for re-appointment by the shareholders. Therefore, within a three-year period, all Directors retire at least once.
The Board appointments are conducted in a formal and transparent manner following recommendations made by the Nomination Committee to the Board. Candidates’ profiles are carefully analysed and the Board considers whether they have the necessary background, experience, competencies, independence and diversity, as set out in the Board Profile Paper and in the Group Diversity Policy. High-profile and experienced recruitment agencies may be used to identify and assess new Director candidates, based on the decision of the Nomination Committee. The candidates’ background and references are analysed, and multiple information sources are used for the assessment.
The independence of newly proposed Directors is evaluated by the Nomination Committee and presented to the Board, as well as reassessed annually, based on clear criteria defined in the Corporate Governance Framework, formalised and approved by the Board.
A formal onboarding programme is in place when new Directors join the Company, under the close coordination of the Chairman of the Board, with support from the CEO and the Company Secretary. The onboarding programme is designed to help the new Director become familiar with the Group’s business, strategy, policies and structure, as well as the operational approach in the Board and Committees activity. The programme covers general financial, social, legal affairs and financial reporting, as well as aspects that are specific to the Group and its business.
Board profile, diversity and independence assessment
Non-Executive Directors are key advisors to management, counselling on the strategic direction, while considering business opportunities and the Group’s risk appetite.
In order to ensure that the Directors’ varied backgrounds and experience provide NEPI Rockcastle with an appropriate combination of knowledge and expertise that is necessary to manage the business effectively, the Group developed a Board Profile. The profile sets the competencies, expertise and background expected from the Directors. It also sets out principles of diversity, independence, and representation of Executive versus non-Executive Directors.
When selecting members of the Board, the following factors will be relevant:
responsible performance of the duties attributed to the Board by legislation, the Dutch Corporate Governance Code, JSE regulations, the Company’s Articles of Association and other regulations and code of conduct
balance between nationalities, gender, age, education, experience and background of each of the members of the Board
experience and affinity with the nature and culture of the business of the NEPI Rockcastle Group
political landscape understanding and cultural knowledge of the countries where the NEPI Rockcastle Group operates
international knowledge of and experience in financial, legal, economic, commercial, social and marketing areas
The Group Diversity Policy was formalised in 2022 to align to Dutch legislation. It applies to the Board and to management, and strives to ensure that no team, business function or management level comprises more than 70% of the same gender or age group.
When examining Board composition, the Group approaches diversity in a broad sense, covering factors such as nationality, gender, age, education and work background.
During 2025, 33% of the Executive Directors and 22% of the non-Executive Directors were female.
In order to close the gap to the Diversity Policy, new appointments of non-Executive Directors will continue to be made considering the required diversity quota.
Management Board (i.e. Executive Directors) composition is in line with the Diversity Policy provisions, therefore no additional short-term measures are envisaged by the Group.
Senior management composition, i.e. function leads, is in line with the Diversity Policy provisions (with 38% female – 62% male), therefore no additional short-term measures are planned by the Group. Middle management and subject-matter employees composition is also in line with the Diversity Policy (with 69% female – 31% male), with no additional initiatives planned by the Group.
On 31 December 2025, the Board, based on an annual self-assessment of the Group’s current set-up and needs, was satisfied with the skill set, mix of knowledge and diversity of culture and background of its Directors.
Age 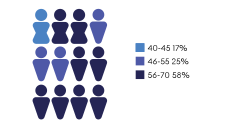 | Executive / non-Executive 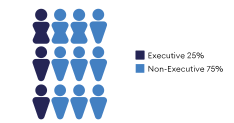 |
Experience 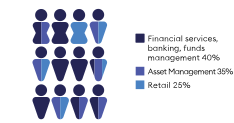 | Independence of non-Executive Directors 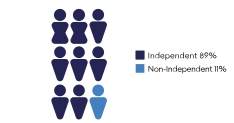 |
Gender 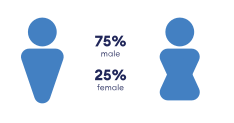 | Country of nationality 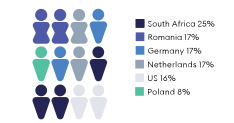 |
Independent non-Executive Directors play a crucial role in acting as a sounding panel to the Executives and the non-Independent, non-Executive Directors, ensuring Board discussions and decisions are conducted in an objective manner and in the best interest of the Group.
Specific guidance provided by King IV and the Dutch Corporate Governance Code has been followed by the Group in establishing, in its Corporate Governance Framework, the criteria for evaluating the Directors’ independence on an annual basis.
The following criteria have been used by the Nomination Committee to assess the independence of the Board’s non-Executive Directors in 2025. The Director or close family members:
have not been an employee or Executive Director of NEPI Rockcastle (including associated companies, in the five years prior to the appointment) or have temporarily performed management duties during the previous twelve months in the absence or incapacity of any Executive Director
have not received personal financial compensation from NEPI Rockcastle or a company associated with it (including by participating in the Group’s share incentive scheme), contingent on Group performance and in so far as this is not in the normal course of the business, other than the fixed compensation received for the work performed as a board member
have not had an important business relationship with NEPI Rockcastle or a company associated with it in the year prior to the appointment (note: this includes in any event the case where the board member, or the firm of which he/she is a shareholder, partner, associate or advisor, has acted as advisor to NEPI Rockcastle - consultant, civil notary or lawyer - and the case where the board member is a management board member or an employee of a bank with which NEPI Rockcastle has a lasting and significant relationship)
are not a member of the management board of a company in which an Executive Director of NEPI Rockcastle is a supervisory board member
do not have a shareholding in NEPI Rockcastle or have not provided financing, material to his/her wealth, taking into account the shareholding of natural persons or legal entities cooperating with him or her on the basis of an express or tacit, verbal or written agreement
are not an employee, member of the management board (or executive director) or Board of Directors (or supervisory board) – or is not a representative in some other way – of a legal entity that is a significant funding provider (equity or debt), unless the entity is a NEPI Rockcastle Group company
have not been an external auditor of the Group or a key member of the external audit engagement team during the preceding 3 financial years
Non-Executive Directors independence assessment for 2025 | ||||||||
|---|---|---|---|---|---|---|---|---|
Director | Criteria 1 | Criteria 2 | Criteria 3 | Criteria 4 | Criteria 5 | Criteria 6 | Criteria 7 | Independence assessment |
George Aase | √ | √ | √ | √ | √ | √ | √ | Independent |
Andre van der Veer | √ | √ | √ | √ | √ | √ | √ | Independent |
Antoine Dijkstra | √ | √ | √ | √ | √ | √ | √ | Independent |
Andreas Klingen | √ | √ | √ | √ | √ | √ | √ | Independent |
Ana Maria Mihaescu | √ | √ | √ | √ | √ | √ | √ | Independent |
Jonathan Lurie | √ | √ | √ | √ | √ | √ | √ | Independent |
Andries de Lange | √ | √ | √ | √ | √ | √ | √ | Independent |
Jeanine Holscher | √ | √ | √ | √ | √ | √ | √ | Independent |
Steven Brown | √ | √ | √ | √ | x | x | √ | Non-Independent |
The Board members are independent from one another and are able to operate critically vis-a-vis one another. The independence assessment criteria was applied to all non-Executive Directors and only one in nine Directors did not meet all independence criteria. The Director considered a non-Independent non-Executive Director (Mr Steven Brown, who is also the CEO of Fortress Real Estate Investments Limited) was nominated by one of the shareholders representing more than 10% in the Company’s shares and voting rights.
The Board confirms that the independence provisions required by the Dutch Corporate Governance Code and King IV were complied with during the non-Executive Directors independence assessment. In accordance with the Dutch Corporate Governance Code, the Board is mindful that extended tenure beyond eight years warrants heightened scrutiny regarding continued independence. Non-Executive Directors who have served beyond eight years have been subject to enhanced assessment by the Nomination Committee and the Board, confirming that their independence of mind and judgement remains unimpaired. During the independence assessment process, substantive independence factors were considered. The Nomination Committee and the Board assessed whether the Directors:
meet all other independence criteria under the corporate governance requirements
have been involved in any confirmed conflict‑of‑interest situation during their service
have exercised objective judgment, with no interest, position, association, or relationship that could unduly influence or bias decision‑making or oversight responsibilities
hold direct or indirect participations in the Group and if the director declared those were immaterial to the overall net wealth
have served in different board committees along the years, mitigating the risk of entrenchment associated with long continuous service
have limited overlap with current executives - the period of service alongside the present management team has not been extensive, reducing the risk of close alignment over time
maintain personal ties with management or controlling shareholders - no relationships exist that could compromise objective judgment or create perceived dependence
receive remuneration that is not material relative to their personal finances and hold a limited number of committee roles—reducing financial dependence and entrenchment risk
maintain a reputation and external standing that are not overly tied to the company, supporting independence of mind and perception
demonstrate openness and remain up to date with evolving governance practices
encourage contributions from newer or younger directors, supporting diversity of viewpoints and constructive challenge to management
apply active oversight and rigorous challenge by preparing thoroughly, asking probing questions, and verifying information, thereby demonstrating independence in practice
The Board will continue to monitor long-tenured directors closely and ensure appropriate succession planning to maintain Board refreshment.
The Directors tenure in NEPI Rockcastle, as of the end of 2025, is depicted below.
Director | Years of service as Director in NEPI Rockcastle |
|---|---|
Andre van der Veer | 8.6 |
Marek Noetzel | 8.6 |
Antoine Dijkstra | 8.6 |
George Aase | 7.3 |
Andreas Klingen | 6.7 |
Steven Brown | 5.7 |
Andries de Lange | 5.6 |
Ana Maria Mihaescu | 4.3 |
Jonathan Lurie | 4.3 |
Jeanine Holscher | 1.6 |
Rüdiger Dany | 4.3 |
Eliza Predoiu | 3.9 |
The Board of Directors continued to have a stable structure in 2025. In accordance with the Company's Articles of Association, at least one-third of the Directors retire by rotation at each annual General Meeting and, if willing, may stand for re-election; whilst this rotation mechanism operates
within the four-year maximum appointment term prescribed by best practice provision the Dutch Corporate Governance Code, it ensures that Directors are reconfirmed by shareholders more frequently.
Details of the non-Executive Directors background and expertise as of December 2025
 | George Aase (63) |
Career George Aase is an experienced Chief Financial Officer, with expertise gained in publicly traded real estate firms, technology companies and Fortune 100 US multinational industrial firms. He is a highly strategic and business-oriented senior finance executive with extensive experience in leadership roles. His core specialties include corporate finance, capital markets, IPO transactions, debt financing, international financial operations, international finance and controlling and investor relations, with over 12 years’ experience in the real estate sector. He led three major initial public offerings in London, Zurich and Frankfurt. Mr Aase also possesses extensive financing and debt restructuring experience and has managed various portfolios connected with major acquisitions and underwriting. Mr Aase holds dual citizenship in the United States and Switzerland. Mr Aase was appointed as Independent non-Executive Director on 28 August 2018 and as Chairman of the Board effective 18 August 2021. Mr Aase was re-appointed by the shareholders as an Independent non-Executive Director upon Company migration to the Netherlands in 2022. | |
Appointments as of 31 December 2025 NEPI Rockcastle
Other listed companies
| |
 | Andreas Klingen (61) |
Career Mr Klingen has more than 30 years of experience in the financial services sector, most of which is in Banking in Central Eastern Europe and Commonwealth of Independent States (CIS). He held various senior positions within Investment Banking at Lazard, Frankfurt and JP Morgan, London. Thereafter, he became Head of Group Development of Erste Group, Vienna, and Deputy CEO of Erste Bank, Kiev. He has been working as an independent advisor since 2013. Since 2005, Mr Klingen served as a Supervisory Board member or a non-Executive Director in 14 institutions in 11 countries, including listed and regulated entities. Mr Klingen holds German citizenship. He was appointed as an Independent non-Executive Director of NEPI Rockcastle on 17 April 2019 and as Lead Independent Director effective 28 September 2020. Mr Klingen was re-appointed by the shareholders as an Independent non-Executive Director upon Company's migration to the Netherlands in 2022. | |
Appointments as of 31 December 2025 NEPI Rockcastle
Other listed companies
| |
 | Antoine Dijkstra (62) |
Career Antoine Dijkstra started his career at Credit Agricole in Rotterdam, Paris and Frankfurt. Mr Dijkstra has extensive experience in banking and investment management, with a focus on public sector related entities and financial institutions. He held various board and managing roles within AIG, NIBC (Netherlands), Harcourt Investment Management (Zurich), JP Morgan/Bear Stearns (UK) and Gulf International Bank (Bahrain). Currently he is a senior advisor to several companies, member of the Board of Trustees of SMU University and member of the Executive Committee of Cox School of business in Texas, USA. Mr Dijkstra holds Dutch citizenship. Mr Dijkstra was appointed as Independent non-Executive Director of NEPI in 2016 and Independent non-Executive Director of NEPI Rockcastle on 15 May 2017. Mr Dijkstra was re-appointed by the shareholders as an Independent non-Executive Director upon Company's migration to the Netherlands in 2022. | |
Appointments as of 31 December 2025 NEPI Rockcastle
Other listed companies
| |
 | André van der Veer (57) |
Career After completing a Masters’ degree in Banking and Economics in 1991, Andre van der Veer joined Rand Merchant Bank (RMB) where he founded the agricultural commodities and derivatives trading group in 1995. He headed the trading, derivatives structuring and proprietary trading teams and in 2003 joined the RMB Equity Global Markets team. He became Head of RMB Equity Proprietary Trading desk in 2009, with a mandate to invest in debt and equity instruments globally. Mr van der Veer founded Foxhole Capital during 2012 as a family office specialising in global real estate securities in listed and private equity markets. He was a non-Executive Director of Rockcastle from 2014 to 2017, and also the Chair of Rockcastle’s Investment Committee. Mr van der Veer holds South-African citizenship. Mr van der Veer was appointed as Independent non-Executive Director of NEPI Rockcastle on 15 May 2017. Mr van der Veer was re-appointed by the shareholders as an Independent non-Executive Director upon Company's migration to the Netherlands in 2022. | |
Appointments as of 31 December 2025 NEPI Rockcastle
Other listed companies
| |
 | Andries de Lange (52) |
Career After qualifying as a chartered accountant, Mr Andries de Lange joined the Industrial Development Corporation of South Africa Limited and then Nedbank Limited where he gained experience in debt finance, debt and equity restructurings and private equity. He joined Resilient REIT Limited, a South African based property focused company which listed on the JSE in 2004, holding several positions including Financial Director between 2006 and 2011, and thereafter Chief Operating Officer from 2011 until 2020. Mr de Lange holds South-African citizenship. Starting May 2020, Mr De Lange was appointed non-Independent non-Executive Director in NEPI Rockcastle. Mr de Lange was re-appointed by the shareholders as an Independent non-Executive Director upon Company's migration to the Netherlands in 2022. | |
Appointments as of 31 December 2025 NEPI Rockcastle
Other listed companies
| |
 | Steven Brown (45) |
Career Mr Brown has a strong background in the property industry, commencing as a listed property analyst in 2008 for Corovest. Following this, he joined Standard Bank’s Global Markets division in the equity derivatives finance team and thereafter joined the South African real estate division focusing on structured lending and equity transactions. Since 2013, Mr Brown has been involved with a number of listed real estate companies focusing on deal origination and structuring. Mr Brown is currently the Chief Executive Officer and Managing Director of Fortress Real Estate Investments Limited, a company that he joined in December 2015, following the acquisition by Fortress Real Estate Investments Limited of Capital Property Fund. Mr Brown holds dual citizenship in the South-Africa and UK. He was appointed as non-Independent non-Executive Director of NEPI Rockcastle on 28 April 2020. Mr Brown was re-appointed by the shareholders as a non-Independent non-Executive Director upon Company's migration to the Netherlands in 2022. | |
Appointments as of 31 December 2025 NEPI Rockcastle
Other listed companies
| |
 | Ana Maria Mihaescu (70) |
Career Ana Maria Mihaescu has 30 years of banking and finance experience. Ms Mihaescu worked for the International Finance Corporation (IFC) for 20 years, most recently as IFC’s Regional Manager for Central and Eastern Europe. She also represented the IFC on the boards of investee companies, banks, leasing companies and private equity funds. Ms Mihaescu was the first Country Manager for IFC in Romania. She is an alumna of the Bucharest Academy of Economic Studies and received a certificate for the International Directors Program from INSEAD. Ms Mihaescu holds Romanian citizenship. Ms Mihaescu was appointed as an Independent non-Executive Director effective 18 August 2021. Ms Mihaescu was re-appointed by the shareholders as an Independent non-Executive Director upon Company's migration to the Netherlands in 2022. | |
Appointments as of 31 December 2025 NEPI Rockcastle
Other listed companies
| |
 | Jonathan Lurie (49) |
Career Jonathan Lurie has 25 years of investment and management experience in the European shopping centre industry. Mr Lurie is the Managing Partner of Realty Corporation Ltd, a real estate and PropTech investment and advisory firm, and a senior advisor to McKinsey & Co, where he provides strategic advice on real estate transactions, financing, capital allocation, management, and operations, to leading institutional investors and developers globally. Mr Lurie previously held various senior executive positions at Blackstone and was Executive Director and Head of Real Estate Investment Management – Europe for Goldman Sachs. Mr Lurie has held management and supervisory board positions in several large-scale European property companies such as OfficeFirst AG (IVG), Multi Corporation, Anticipa, Logicor, Blackstone Property Management, GSW AG, Songbird Estates plc (owner of Canary Whart Group plc) and TLG Immobilien. Mr Lurie serves as an independent member of the Standards and Regulations Board of the Royal Institution of Chartered Surveyors (RICS). Mr Lurie graduated as an Economics Major with Highest Honors from Princeton University and has an MBA from the Wharton School, University of Pennsylvania. He is a member of the International Council of Shopping Centers (ICSC). Mr Lurie was appointed as an Independent non-Executive Director effective 18 August 2021. Mr Lurie was re-appointed by the shareholders as an Independent non-Executive Director upon Company's migration to the Netherlands in 2022. | |
Appointments as of 31 December 2025 NEPI Rockcastle
Other listed companies
| |
 | Jeanine Holscher (60) |
Career Jeanine Holscher possesses over 25 years of leadership experience spanning retail, travel, services industries, and international strategy consulting. Ms Holscher brings a wealth of leadership experience, having served in various high-profile roles within the retail and service sectors. Notably, Ms Holscher has held the positions of CEO at Blokker (Dutch household chain with over 400 stores), where she orchestrated a significant turnaround strategy, and COO of Mirage Retail Group (holding company for Blokker, Intertoys and Miniso retail chains in the Netherlands), managing a portfolio that generated turnover in excess of €1 billion. Her career is marked by a series of strategic leadership roles that have contributed to her deep understanding of the retail industry and its operational, financial, and digital transformation challenges. In addition to her executive roles, Ms Holscher has demonstrated her commitment to corporate governance through her involvement on supervisory boards, where she has provided invaluable oversight and strategic direction. Ms Holscher is an alumnus of the Nyenrode Business Universiteit in the Netherlands, and her extensive experience is complemented by a solid educational foundation in business and leadership. Ms Holscher holds Dutch citizenship. Ms Holscher was appointed as an Independent non-Executive Director effective 14 May 2024. | |
Appointments as of 31 December 2025 NEPI Rockcastle
Other listed companies
| |
The Board and Committees 2025 calendar and attendance information
Date | Board meeting | Investment Committee | Audit Committee | Risk and Compliance Committee | Remuneration Committee | Nomination Committee | Sustainability Committee |
|---|---|---|---|---|---|---|---|
15 January | X | ||||||
12 February | X | ||||||
21 February | X | X | |||||
24 February | X | X | |||||
11 March | X | ||||||
18 March | X | ||||||
08 April | X | ||||||
30 April | X | X | |||||
09 May | X | ||||||
14 May | X | X | |||||
15 May | X | ||||||
16 May | X | ||||||
14 August | X | X | |||||
18 August | X | X | |||||
03 September | X | ||||||
30 October | X | ||||||
14 November | X | X | |||||
17 November | X | X | |||||
18 November | X | ||||||
24 November | X | ||||||
09 December | X |
Note: Considering the CEO succession process, the Nomination Committee organised three additional meetings to interview suitable candidates for the position, and all members participated.
Director | Board of Directors | Investment Committee | Audit Committee | Risk and Compliance Committee | Remuneration Committee | Nomination Committee | Sustainability Committee |
|---|---|---|---|---|---|---|---|
Rüdiger Dany | 100% | 100% | |||||
Eliza Predoiu | 100% | 100% | |||||
Marek Noetzel | 100% | 100% | |||||
George Aase | 100% | 100% | 67% | 100% | |||
Antoine Dijkstra | 100% | 100% | 100% | 100% | 100% | ||
Andreas Klingen | 100% | 100% | 100% | 100% | |||
Andre Van Der Veer | 100% | 100% | 100% | 100% | 67% | ||
Steven Brown1 | 100% | 100% | 75% | 100% | 100% | ||
Andries De Lange | 100% | 100% | 100% | ||||
Ana Maria Mihaescu | 100% | 100% | 67% | 100% | |||
Jonathan Lurie | 100% | 100% | 100% | ||||
Jeanine Holscher | 100% | 100% | 100% |
- Mr Steven Brown was appointed a member in the Nomination Committee effective 7 July 2025. Presence records are counted after this date
Development, evaluation and succession planning
In accordance with the Corporate Governance Framework, the Board is responsible to ensure that its performance, profile, composition, competences and expertise, and those of its Committees, support continued improvement.
Overview of the 2025 evaluation process:
Independent evaluation: Korn Ferry facilitated a comprehensive board review in late 2025, agreed in advance with the Chair to align with the Board’s calendar and focus on priority areas. The objective was to assess board effectiveness, composition, processes, and alignment with governance best practices
Survey and interviews: All directors (executive and non-executive) participated in a confidential online questionnaire. This was followed by two one-on-one interviews with the Chair and the newly appointed non-Executive Director in 2024, to probe deeper insights and context behind the survey answers
Confidentiality: All feedback was anonymised and handled with strict confidentiality, encouraging directors to provide candid input. Neither individual survey responses nor interview comments were attributed in the report, fostering an environment of trust throughout the process
Reporting: Korn Ferry adapted the questionnaire and interview findings into a forward-looking report with actionable recommendations. A draft was first discussed with the Chair and Company Secretary, then the final findings were presented to the full Board in January 2026. The report highlighted the Board’s strengths and development areas, forming the basis for an agreed action plan to enhance board effectiveness going forward
As part of this process, the Board reflected on its role in strategy oversight, succession planning, Board composition, decision making processes, and the functioning of Committees. The review confirmed that the Board is operating effectively, while also identifying opportunities to further strengthen strategic ownership, long-term stewardship, and succession readiness.
Key areas covered during the evaluation included:
the structure, composition, and effectiveness of the Board and its Committees, including diversity, expertise, and mix of skills
the quality of Board processes, decision making, dynamics, teamwork, and collaboration, as well as the display of ethical values, independence, and objectivity
the Board’s contribution to strategy, performance monitoring, risk management, succession planning, remuneration, and corporate governance
Based on the outcomes of the review, the Board agreed a set of forward-looking priorities aimed at further enhancing its effectiveness, with particular focus on strategy ownership, succession planning, Board renewal, and the prioritisation of Board and Committee agendas. Progress against these priorities will be monitored.
The key findings of the 2025 evaluation revealed:
a well-functioning Board, effective oversight processes and governance fundamentals
continuous focus areas: strategy oversight, succession planning, optimization of topics coverage between the Board and its Committees
The findings of the evaluation process were discussed at committees level and within the Board, and specific action plans have been agreed.
Keeping abreast of developments in governance practices, regulatory requirements, market and industry trends, sustainability, digital and technological topics, and broader economic and social considerations remains a priority for the Board. The Directors’ development program includes dedicated sessions addressing these areas to support informed and effective oversight.
A formal succession process is in place to ensure continuity for the critical executive and board positions and that changes compliment the knowledge and experience at Board level. Succession planning includes:
identifying the knowledge, skills and experience the Board should collectively possess to effectively fulfil its roles and responsibilities
ensuring an appropriate balance in terms of diversity, expertise and knowledge among the Directors, in accordance with the targeted Board Profile
identifying in due time qualified individuals suitable for nomination and recommending them to the shareholders at the Annual General Meeting (AGM)
achieving continuity through a smooth succession of Directors (including Board and Committees leadership) that balances perspective and independence with experience and knowledge
satisfying compliance within the legal and regulatory framework applicable to the Group
Succession plans and the results of the succession management process were timely communicated during 2025: effective 1 April 2026, Mr Marek Noetzel, Group COO, was appointed Group CEO, replacing Rüdiger Dany, the current Group CEO. Mr Marius Barbu, currently Group Asset Director, was appointed Group COO, effective the same date.
Directors’ dealings and related party transactions
Dealing in Company’s securities by Directors, their associates and key Group employees, is regulated and monitored in accordance with the applicable stock exchange listing requirements, guidelines, legislation, regulations and directives.
To prevent the risk of insider trading and to ensure that none of the restricted persons abuse, and do not place themselves under suspicion of abusing inside privileged information, the Group has adopted a formal Dealing Code, available and communicated to all employees and Directors.
The Dealing Code sets out obligations for the Group’s Directors, managers, staff and persons closely associated with them, under the Market Abuse Regulation and stock exchange listing requirements and guidelines, regarding clearance to deal and notification of transactions in the Group’s securities. The Group prohibits all Directors and employees from using confidential information, not generally known or available to the public, for personal benefit.
NEPI Rockcastle maintains a closed period from the end of a financial period until publication of the financial results for that period and a prohibited period when sensitive information not yet publicly available is known by the Company’s employees or Directors. The Group announces closed and other prohibited periods to its employees and the Company’s Directors, and, during such periods, all those with insider knowledge are banned from dealing.
In compliance with JSE Listings Requirements, the Company announces publicly all its Directors’ dealings in the Company’s securities, through SENS.
Directors and Directors’ associates interests are disclosed in line with the Declaration of Interests Policy. Directors’ direct and indirect holdings as of year-end are published in the Annual Report. Moreover, the Group formalised its related party transactions policy, in line with JSE Listings Requirements and applicable international accounting standards.
According to the Group Code of Ethics, Board members must be alert to conflicts of interest and uphold ethical conduct. They should refrain from the following:
engaging in personal business that may compete with the Group
demanding or accepting substantial gifts from the Group or from any of its employees or partners, for themselves or their spouse, registered partner or other life companion, foster child or relative by blood or marriage up to the second degree
providing unjustified advantages to third parties at the Group’s expense
taking advantage of business opportunities that the Group would be entitled to
allowing in any other way the influence of third parties to compromise or override independent judgement
using confidential information related to the Group for their own personal benefit
making use of inside information to make a profitable investment
taking advantage of their position as Directors to earn profit for him/her-self
making personal use or advantage of an opportunity obtained through the Group
Potential conflicts of interest related to topics on the agenda are checked at each Board and Committee meeting. Any potential conflict of interest would be declared and discussed in the Board meeting. The Board needs to decide on the measures to be implemented and the degree of further involvement of the respective Director in the matter at hand.
Any actual conflict of interest deemed significant by the Board during the year would be disclosed in the Annual Report. Such information considers, but is not limited to, related party transactions and cross-shareholdings.
Related party transactions will be entered into, only if beneficial to the Group entities and on the customary market terms that they would have been concluded with an independent party (arm’s length principle). The Group ensures that identification, negotiation, conclusion of related party transactions by Group entities are governed by:
fairness
objectivity
arm's length
proper record keeping
No actual conflicts of interest have been identified in 2025 and no related party transactions, as defined in the internal policy, have been carried out by the Group entities, besides those detailed in the Related Party Transactions note and/or the Remuneration Report.
Company Secretary
The Company Secretary assists the Board in overseeing that the Group complies with statutory and regulatory requirements and ensures that the Board members are informed of their legal responsibilities. More specifically, the Company Secretary is tasked with the following:
ensures that the procedures for the appointment of Directors are observed and that the process is traceable
ensures that Board matters such as onboarding of new members, development programmes, training and evaluation are properly organised and any activity or information related to the Board is properly stored
supports the Chairman in making the Board members aware of significant relevant laws, regulations and codes, as well as circulating emerging information to Group entities
sees that agenda and materials are distributed in time, that detailed minutes of Board meetings are kept and that Board decisions are distributed, tracked and reported upon in collaboration with the Executive Directors
ensures that proper procedures are followed at Board level and that the statutory obligations and obligations under the Articles of Association are complied with
oversees compliance with the conflict of interest rules applicable to the Board under the Declaration of Interests Policy and Code of Ethics, and maintains records as evidence thereof
provides corporate governance advice to the Board members
generally supports the Chairman of the Board in the organisation of the affairs of the Board
coordinates and guides the activity of other persons appointed as Secretary of Board Committees
The Board is satisfied with the competence, qualifications, experience and support provided by the Company Secretary in 2025.
Delegation to Committees
Without abdicating accountability, the Board delegates certain functions to certain committees. The following requirements are considered when appointing committee roles, in line with the governance framework:
the Chairman of the Audit and the Remuneration Committees must be an Independent Director
the Nomination and Remuneration Committee should only consist of non-Executive Directors, and the majority should be independent
directors who are not members of a Committee may attend based on invitation meetings to gain/offer information, but will not vote
the CEO cannot be a member of the Remuneration, Audit or Nomination Committees, but may attend by invitation their meetings
The Board considers the allocation of roles and responsibilities and the composition of membership across committees holistically, to achieve the following:
effective collaboration through cross-membership between Committees where required, coordinated timing of meetings and avoidance of duplication or fragmented functioning in so far as possible
where more than one committee has jurisdiction to deal with a specific matter, the role and positioning of each committee in relation to such matter are defined, to ensure complementary rather than competing approaches
a balanced distribution of power in respect to membership across committees, so that no individual would dominate the decision-making process and no undue reliance would be placed on a single individual
The role of each Committee, together with responsibilities, accountability and operating guidelines, are documented in the Committees Charters, available, together with the Corporate Governance Framework document on the corporate website.
The Committees Charters are approved by the Board and are reviewed periodically, considering regulatory guidance and industry best practices, to ensure the Board and its Committees are adaptive and responsive to new requirements and continue to practice strong oversight.
The Committee members are appointed by the Board, and any of the members may be removed by the Board, except for the Audit Committee, for which membership is voted in the AGM. The Committees activity is reviewed by the Board, to ensure effective discharge of their duties and oversight through an appropriate mix of knowledge, background and independence.
Overview of the Committees’ mandate and activity in 2025 |
|---|
Audit Committee/4 meetings/100% attendance rate |
Independent non-Executive Directors |
Andreas Klingen (Chairman) |
|
Risk and Compliance Committee/4 meetings/94% attendance rate |
Independent non-Executive Directors |
Antoine Dijkstra (Chairman) |
Non-Independent non-Executive Directors |
Steven Brown |
|
Sustainability Committee/2 meetings/100% attendance rate |
Independent non-Executive Directors |
Ana Maria Mihaescu (Chairwoman) |
Non-Independent non-Executive Directors |
Steven Brown |
Executive Directors |
Eliza Predoiu |
|
Remuneration Committee/3 meetings/75% attendance rate |
Independent non-Executive Directors |
Andries de Lange (Chairman) |
|
Nomination Committee/7 meetings/100% attendance rate |
Independent non-Executive Directors |
George Aase (Chairman) |
Non-Independent non-Executive Directors |
Steven Brown |
|
Investment Committee/4 meetings/100% attendance rate |
Independent non-Executive Directors |
Andre van der Veer (Chairman) |
Non-Independent non-Executive Directors |
Steven Brown |
Executive Directors |
Rüdiger Dany |
|
Audit Committee
According to the corporate governance requirements and in full alignment with best practices, the Audit Committee:
consists of at least three Independent non-Executive Directors
is chaired by an Independent non-Executive Director who is not the Chairman of the Board
consists of members fully conversant with finance and accounting principles, and who are knowledgeable about the affairs of the Company
consists of members who must have a fair understanding of International Financial Reporting Standards, internal controls, external and internal audit processes, corporate law, sustainability issues and information technology
The Chairman of the Board may attend meetings by invitation but cannot be nominated as member or Chair.
According to its charter, the Audit Committee is responsible to:
A. In relation to external audit:
nominate for appointment the external auditors
review the auditors' fees and terms of engagement, and ensure that the appointment complies with relevant legislation
assess the external auditors' independence and objectivity
review external audit reports to ensure that prompt action is taken by management in all relevant areas
review any significant disagreement between management and the external auditors
evaluate the performance of the external auditors and the quality and effectiveness of the audit process
develop a process to ensure that the Audit Committee receives notice of any irregularities reported to the Independent Regulatory Board for Auditors
B. With respect to financial reporting:
evaluate the Group Annual Report for reasonability, completeness, consistency and accuracy prior to approval by the Board
evaluate significant management decisions affecting the financial statements, including changes in accounting policy, resolutions requiring a major element of judgement and the clarity and completeness of proposed disclosures
oversee compliance with tax regulations, ensure that the Company has implemented a transparent taxation policy and that this is appropriately disclosed, as well as advise management on various decisions related to taxation matters
in consultation with external and internal auditors, review the integrity of the Group's financial reporting processes
consider the quality and appropriateness of the Company's accounting policies
determine whether and how the external auditors should be involved in the review of the content of financial reports published, other than the financial statements
review complex and/or unusual transactions
recommend to the Board whether it should issue a going concern statement, based on the assessment provided by the CFO
C. With respect to internal controls:
gain an understanding of the Group's key risk areas and the internal controls structure
evaluate whether management is setting the appropriate control culture
monitor the effectiveness and efficiency of the internal controls and risk management system, considering the Company’s Risk Appetite, the key company risks as identified in the risk management process overseen by the Risk and Compliance Committee and management’s reports
review the substantiation process based on management’s reports and the appropriateness of the statement on internal controls and risk management (including alignment to Dutch Corporate Governance Code requirements)
consider how management is held accountable for the security of computer systems, applications and networks, and for setting contingency plans in the event of a disaster, systems breakdown, fraud or misuse
gain an understanding of whether internal control recommendations made by internal and external auditors have been implemented by management
prioritise and direct the audit effort to high-risk areas of the business
D. In relation to internal audit:
review and approve the Internal Audit Charter
review the effectiveness of the Internal Audit function, its staffing and resources and its capacity to carry out the Annual Audit Plan
review the activities and organisational structure of the Internal Audit function and ensure no unjustified restrictions or limitations exist and that the Internal Audit function remains independent
ensure that internal audit activities comply with relevant standards and regulations
review and approve the risk assessment results and the Annual Audit Plan
review internal audit reports, including management's action plans to address risk and control deficiencies noted by the Internal Audit function
monitor the implementation of action plans based on reports provided by the Internal Audit function
escalate to the Board, if necessary, significant audit findings and control deficiencies which require Board attention and prioritisation
E. With respect to ethical and legal compliance:
oversee controls implemented to address compliance with applicable laws, regulations and policies
oversee whistleblowing process and investigation results
review internal audit reports concerning compliance reviews and investigations
review management's monitoring of compliance with the Board's guidelines
F. With respect to information technology management:
ensure that a technology architecture that enables the achievement of strategic and operational objectives has been defined
oversee that information technology management processes are formalised and that an effective control environment for managing key risks and achieving objectives, as well as preserving information privacy and security, has been designed and implemented
ensure that proper policies and processes have been implemented to enable ethical and responsible use and disposal of technology and information, both hardware and software
oversee information security risk, status of mitigating measures, information on attacks and vulnerabilities, based on reports provided by management periodically, but at least twice a year
oversee that effective mechanisms have been implemented to identify and respond to security incidents
oversee that monitoring of advancements in technology is in place, including the capturing of potential opportunities and the management of disruptive effects on the organisation and its business model
ensure that proper value assessments are performed before investing in information and technology
The Board supports and endorses the Audit Committee, which operates independently of management and is free from any organisational impairment.
The Audit Committee assists the Board in fulfilling its responsibilities and has unrestricted access to information, including records, property and personnel of the Group.
The Audit Committee has considered and found:
the expertise and experience of the Chief Financial Officer are appropriate for the position, and the arrangements for the Finance function are adequate, for the size and complexity of the Group
the expertise and experience of the Internal Audit Director are appropriate for the position, and the arrangements for the Internal Audit function are adequate given the size and complexity of the Group
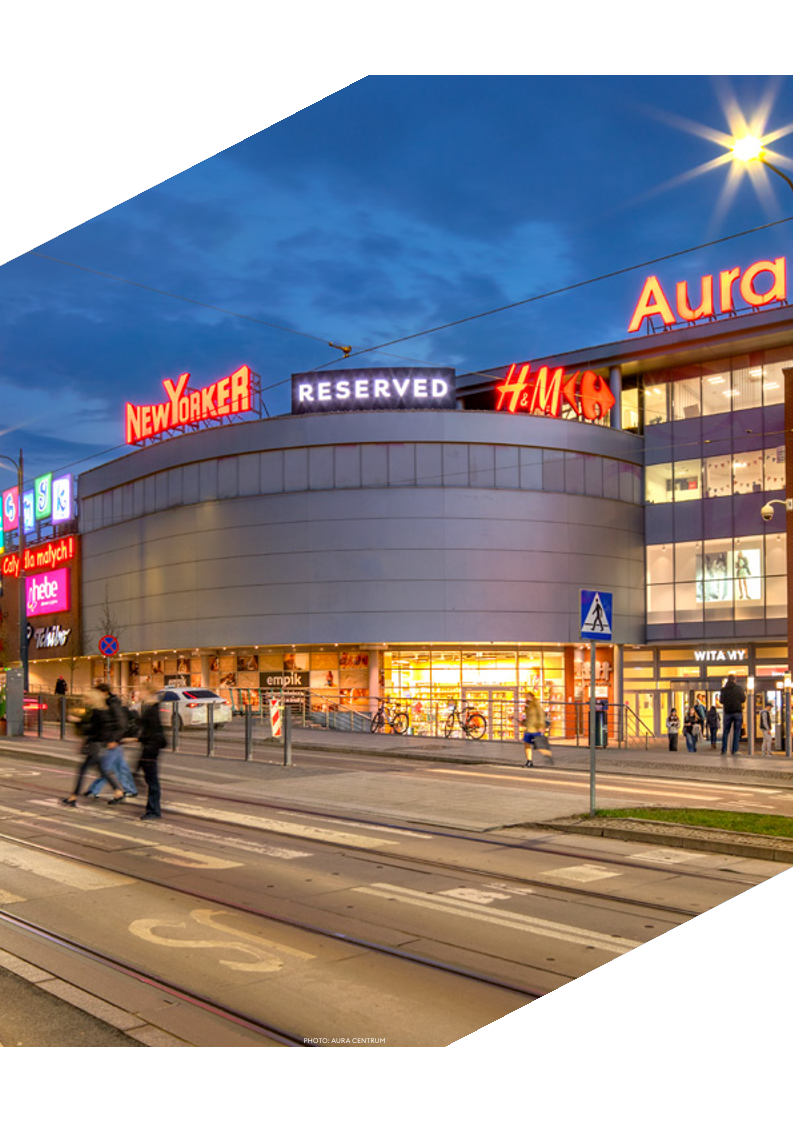
The Audit Committee, following the mandate received at the AGM, approved the 2025 external auditors' terms of engagement, fees and scope of work at Group level. Based on interactions with the external auditors and the quality of the external auditors' reports, the Audit Committee considered the expertise and independence of the external auditors, including the Partner Rotation Policy, and concluded they are satisfactory.
In order to fulfil its responsibility to monitor the integrity of financial reports issued, the Audit Committee has reviewed the accounting principles, policies and practices adopted during the preparation of financial statements and examined relevant documentation related to the Annual Report. The Committee is comfortable that appropriate financial reporting procedures have been established.
The Audit Committee reviewed:
the clarity of the disclosures included in the Financial Statements
the basis for significant estimates and judgements
The Audit Committee complied with its Charter, as well as its legal and regulatory responsibilities.
Risk and Compliance Committee
The Risk and Compliance Committee takes a forward-looking view regarding the risks that the Group may face and aims to enable the effective implementation of mitigating measures and overall enterprise risk management.
The Risk and Compliance Committee:
consists of at least three Directors
is chaired by an Independent non-Executive Director, who is not the Chairman of the Board
includes members with sufficient knowledge about the affairs of the Group, qualifications and experience to fulfil their duties effectively
The Risk and Compliance Committee assumed the following responsibilities during 2025:
With respect to risk management framework:
oversee the annual review of the risk management policies, and recommend them for Board’s approval
monitor application of the Risk Management Policy, processes and organisation
make recommendations to the Board concerning the Group risk appetite and risk profile and monitor that risks are managed within those levels, as approved by the Board
oversee that the risk management plan is widely disseminated throughout the Group and integrated into day-to-day activities
acknowledge risk response and implementation status for major risks at Group level
review the Risk management and compliance section included in the Annual Report
assess compliance with relevant legislation and regulations, including regulations concerning risk reporting
With respect to the compliance management system:
oversee the compliance management framework, the review of the compliance policies, and recommend updates for Board’s approval
supervise implementation of the compliance policy, processes and organisation, including rules and mechanisms to ensure compliance with laws, prevention of fraud and corruption and avoidance of conflict of interest
Sustainability Committee
The Sustainability Committee oversees and reports on the Group’s organisational ethics, responsible corporate citizenship (including the environment, health and safety, the impact of the Group’s activities and of its products and services), sustainable development and stakeholder relationship management. The members of the Committee are knowledgeable and mindful of economic, social and governance matters and the Group’s material issues.
The Committee oversees how the consequences of the Group’s activities and outputs affect its status as a responsible corporate citizen, covering the following areas:
environment, i.e. minimise the effects of the Group through responsible use of resources, controlled pollution and waste disposal, controlled carbon footprint, green buildings, protection of biodiversity
economy, including the communities support and contribution to creating new jobs
workplace, including employment equity, diversity and inclusion, fair remuneration, health and safety
society, including public health and safety, consumer protection, community development and protection of human rights
governance, including how the Board is steering the Company based on an ethical foundation
The Sustainability Committee endorses the ESG strategy, verifies progress towards the implementation of such strategy and reviews the Group’s Sustainability Report. The CFO, as the Executive Director part of the Sustainability Committee, is the executive manager overseeing the overall ESG agenda in the Group, while the CEO is ultimately responsible to plan the ESG strategy and monitor implementation.
Remuneration Committee
The Remuneration Committee:
consists of at least three Directors, the majority of whom must be Independent non-Executive Directors
is chaired by an Independent non-Executive Director, who is not the Chairman of the Board
The Remuneration Committee is responsible according to its charter, to:
oversee the review of the Remuneration Policy and principles
monitor implementation and administration of the Remuneration Policy
determine remuneration for Executive Directors, in alignment with the Remuneration Policy and targets achievement
monitor remuneration principles implemented to ensure that employees are properly incentivised based on individual and Group performance
ensure that the Group’s remuneration principles are aligned with the strategy, in order to create long-term value
recommend the fees to be paid to non-Executive Directors
When determining the Remuneration Policy and practices, the Remuneration Committee is guided by the following principles: clarity, simplicity, risk, predictability, proportionality and alignment to Group culture.
Nomination Committee
The Nomination Committee:
consists of at least three Directors, the majority of whom must be Independent non-Executive Directors
is chaired by an Independent non-Executive Director, who may also be the Chairman of the Board
The Nomination Committee is tasked with the following:
periodically assess the skill set required to competently discharge the Board’s duties, considering the Group’s strategic direction
review and make recommendations regarding Board composition, competencies, structure, size and diversity, to ensure that vacancies are filled with suitable candidates, in line with criteria defined in the Board Profile Paper
develop strategies to address Board diversity
develop and review Board succession plans, Director induction programmes and continuing development programmes, aiming to maintain an appropriate mix of skills, experience, expertise and diversity
identify Directors due for retirement by rotation on an annual basis
arrange the performance evaluation for Board members
review and make recommendations regarding Board appointments, re-elections and terminations
prepare a description of the role and skill set required for appointments
identify suitable candidates to fill Board vacancies
propose extension of Board appointments
ensure that, upon appointment, all Directors receive a formal letter of appointment that sets out the duration and responsibilities of the appointment
review disclosures made by the Group regarding Board appointments, re-elections and terminations
Investment Committee
Members of the Investment Committee must have significant property investment, retail and relevant market knowledge. The Investment Committee Chair must be a non-Executive Director with adequate financial and investment experience.
The senior management of the Group is responsible for identifying new investment opportunities, optimising the performance of existing assets (for example, through refurbishments, extensions and re-tenanting), and, where necessary, proposing the disposal of assets which no longer contribute to the Group’s income growth strategy. The CEO will coordinate and monitor all acquisitions, capital expenditures and disposals, and will recommend those which exceed his mandate to the Investment Committee.
The Committee formulates the overall investment strategy of the Group and establishes investment guidelines. The Committee’s activity complies with all applicable fiduciary, prudence and due diligence requirements, which experienced investment professionals would utilise, and with all applicable laws, rules and regulations issued by relevant local and international bodies.
The Investment Committee:
considers management recommendations for mergers, acquisitions, investments, capital expenditure and disposals, and makes proposals to the Board for approval
authorises transactions that fall within its mandate, analyses and recommends to the Board those that fall outside its mandate
evaluates and monitors investments performance over time
The Board and the Committees considered their activity during 2025 and confirm that they are satisfied that they have fulfilled their responsibilities in accordance with their charters and the Corporate Governance Framework.
Stakeholder engagement and relationship management
The Board oversees stakeholder relationship management, while responsibility for the day-to-day execution has been delegated to the Executive Directors and, further on, to line management.
NEPI Rockcastle has a transparent information communication policy, enabling stakeholders to assess the Group’s economic value and prospects. The Company encourages proactive engagement with shareholders, including during the Company’s semi-annual results presentations and AGMs, where Directors are available to respond to shareholders’ inquiries on how the Board has executed its governance duties.
The Executive Directors have regular discussions on operational trends and financial performance with relevant stakeholders, where they believe this to be in the Group’s best interest. The Chairman of the Board meets with all major shareholders every second year to gather direct feedback on their questions and concerns. No information is shared preferentially only to some shareholders.
The Group’s Directors ensure that all shareholders are treated equally and equitably, and that management recognises, protects and facilitates the exercise of all shareholders’ rights through constant, open and timely communication. The Board seeks to protect the interests of minority shareholders while the Dealing Code and the Related Party Transactions Policy are designed to ensure such protection.
The Group actively manages its relationship with stakeholders and communicates formally in a number of ways:
news, announcements, press releases were issued under routine reporting obligations or to communicate ad-hoc events
SENS announcements were made to disclose changes in Board and Committees structure, Directors’ and associates’ dealings, major acquisitions and disposals
business updates were published regularly, depicting Company’s performance
various events such as property tours (with investors), capital market day (with representatives of capital markets), retail day (with representatives of tenants) were organised
the Reviewed Interim Condensed Consolidated Financial report was published in August, outlining six-month performance. The Interim Condensed Consolidated Financial Statements included in the report were reviewed by a South African auditor (EY South Africa) and were not reviewed by a Dutch auditor. The results announcement was followed by Results Presentations and investor calls. The presentation and the reports are posted on the Group’s website, open to and accessible to any interested stakeholder
the Reviewed Condensed Consolidated Financial Statements for the year ended 31 December 2025, including detailed management commentary, were published in February. These were followed by Results Presentations announced publicly on the corporate website, open and accessible to any interested stakeholder
the Annual Report, including audited consolidated financial statements of the Group and separate financial statements of the Company, is published in March each year, comprising reporting on all relevant matters
The Board is required through the applicable governance codes to provide a fair, balanced and understandable assessment of the Group’s position and prospects in its external reporting. The Board considers that this Annual Report and the Audited Consolidated Financial Statements of the Group and Separate Financial Statements of the Company, taken as a whole, meet all requirements and provide the information necessary for shareholders to assess the Directors’ governance of the Group.
General meetings of shareholders
Meetings
The Company is required to hold an Annual General Meeting no later than the end of June each year. Other General Meetings may be held at the discretion of the Board or to comply with Applicable Listing Requirements.
The Board is responsible for giving notice of General Meetings, ensuring that it is given to all Shareholders entitled to vote and that it complies with the statutory notice period of 42 calendar days and Applicable Listing Requirements. The notice must include the subjects to be discussed, venue and time of the meeting, the requirements for admittance, and the Company's website address. Additional communications can be made in a separate document deposited at the Company's office for inspection, with a reference made in the notice.
General Meetings can be held in Amsterdam or Haarlemmermeer, as chosen by the Board. The Chairman of the Board will chair the general meeting, unless otherwise decided by the Board. Minutes of the meeting will be kept.
The record date for each General Meeting will be determined in accordance with the law and Applicable Listing Requirements to identify voting rights and eligible attendees, and instructions on how to register and exercise rights will be included in the meeting notice.
To attend a General Meeting, a person or their proxy must notify the Company in writing at the specified address and by the deadline indicated in the meeting notice, and the proxy must provide written evidence of their authorisation.
Shareholders and/or other persons entitled to attend the General Meeting, who, alone or jointly, meet the requirements set forth in section 2:114a subsection 2 of the Dutch Civil Code will have the right to request the Board to place items on the agenda of the General Meeting, provided the reasons for the request are being stated therein and the request is received by the Chairman or the Chief Executive Officer in writing at least sixty (60) calendar days before the date of the General Meeting.
Share capital
The authorised capital of the Company amounts to twenty six million euro (€26,000,000) and is divided into two billion six hundred million (2,600,000,000) shares, having a nominal value of one euro cent (€0.01) each. On 31 December 2025 the issued share capital amounted to €7,123,573 divided into 712,357,309 shares. All shares are fully paid. There are currently no limitations either under the Dutch law or the Articles of Association to the transfer of the shares.
In April 2025, the Company repurchased 1,640,511 own shares (representing 0.23% of outstanding ordinary shares in issue). Treasury shares do not carry the right to vote at general meetings, to distribution and to the surplus assets of the Group on winding-up.
During the 2025 Annual General Meeting, the shareholders resolved to authorise the Board to issue shares for cash up to 10% of the issued shares, to repurchase shares up to 10% of the issued shares and to cancel repurchased shares.
Main powers of the General Meeting of Shareholders
The main powers of the General Meeting of Shareholders include:
discussion of the board report
discussion and adoption of the annual financial statements
dividend proposal (if applicable)
appointment of Directors (if applicable)
appointment of an Independent Auditor (if applicable)
adoption of amendments to the Articles of Association
other subjects presented for discussion or voting by the Board, such as the release of Directors from liability, discussion of the policy on reserves and dividends, authorisation of the Board to issue shares, authorisation of the Board to decide that the Company should acquire own shares
At the General Meeting, each share carries one vote and resolutions must be adopted by an absolute majority, unless a greater majority is required. A quorum of at least three shareholders with 25% voting rights is required, and votes can be cast by electronic means or by mail. If a quorum is not present at a General Meeting, the Board is authorised to call for a new General Meeting where resolutions can be passed regardless of the capital represented in the meeting.
The structure of the Company's capital has been presented in this Report, each share carrying a right to vote in accordance with the Articles of Association of the Company and the applicable law. There are no classes of shares; no special restrictions on transfers; no special control rights; no agreements between shareholders which are known to the Company and may result in restrictions on the transfer of securities and/or voting rights; no significant agreements to which the Company is a party and which take effect, alter or terminate upon a change of control of the Company following a takeover bid, and the effects thereof; no agreements between the Company and its board members or employees providing for compensation if they resign or are made redundant without valid reason or if their employment ceases because of a takeover bid.
Internal controls and risk management statement
In line with its charter, the Audit Committee monitors the effectiveness of the internal controls system, addressing risks and control objectives in the financial reporting, sustainability reporting, operations and compliance.
NEPI Rockcastle Group applies the three lines of defence approach, with a view to further strengthen the system of internal controls and track compliance with relevant laws and regulations:
the first line of defence, line management (senior management, local management), is the function that owns risk and is responsible for operational processes within the Group. Line management is in charge of defining guidelines, implementing and executing internal controls, embedding risk management in the day-to-day operations, comparing performance against targets, monitoring achievement, ensuring compliance and sufficient security
the second line of defence has an advice and monitoring role, and consists of functions such as Compliance, Risk Management and Data Privacy. These functions are primarily involved in monitoring laws, regulations and emerging risks, and providing support and advice to management in ensuring compliance. They monitor and facilitate the implementation of effective risk and compliance management practices and assist the risk owners in identifying, assessing and reporting adequate risk information. In the consideration of their monitoring role, they recommend new controls or risk mitigating measures to be embedded in current processes and practices
the third line of defence, the Internal Audit function, is in charge of providing independent assurance on the effectiveness of the internal controls and risk management, including on how the first two lines discharge their duties
A risk-based approach, the proportionality principle and key controls such as segregation of duties and four eyes principle are considered when developing the policies, procedures and control activities at Group level, covering:
efficiency, effectiveness and economy of operations
safeguarding of assets
reliability of financial reporting
compliance with laws and regulations
In substantiating and formalising its internal controls system, the Group used the COSO for Internal Controls framework, following the key steps described below:
list all its processes and sub-processes and prioritise processes in scope based on pre-defined criteria
perform risk assessment for the in-scope processes
based on the risks and control objectives identified, perform evaluation and documentation of the control activities
information and communication with process owners, management, second and third line of defence functions
mapping of testing and control monitoring activities performed throughout 2025
The Group documented and assessed its control activities over a wide range of topics, and categorises its internal controls, in line with COSO framework, as follows:
entity level controls - set the tone for integrity, ethics, and accountability and are the foundation for all other components
process level controls - key controls designed to address key business objectives (including fraud mitigation and financial reporting assertions)
compliance level controls - additional key controls (not embedded in the core business processes) managed generally by Compliance, Risk management, Data protection, meant to address specific compliance control objectives or to monitor compliance thereto
IT general computer and cyber controls - embedded in the IT management processes to ensure proper use of technology and cyber-resilience
The testing and monitoring activities performed in 2025 comprised of: (i) confirmation of control design and operating effectiveness by process owners through management self-assessments; (ii) verification of key compliance areas by the Risk and Compliance function; and (iii) independent audits by Internal Audit addressing design and effectiveness of key controls in core operations (asset management, development and leasing), payroll and remuneration, selected IT computer controls.
Part of its monitoring activities, the Group performs under the coordination of the Risk and Compliance Officer a dedicated fraud risk assessment on an annual basis, with the results described in more detail in the Risk management and compliance section of this Annual Report, page .
Based on the above-described assessment activities, the Group affirms that:
this Annual Report provides sufficient insights, including the potential for any failings in the effectiveness of the internal risk management and the control systems with regard to internal and external material risks that the Group may face. Strategic, operational, compliance and reporting risk areas are identified and presented together with uncertainties, to the extent that they are relevant to the expectation of the Group’s continuity for the period of twelve months after the preparation of the report. Details are included in the Risk management and compliance section, page
risks have been managed considering the approved Group risk appetite limits (presented in more detail in the Risk management and compliance section, page ). The occurrence and criticality of monitored risks have been reassessed quarterly and reported to the Risk and Compliance Committee, with the most important risk areas disclosed in the Risk management and compliance section, page
considering the set of controls in place as well as the external assurance process, the internal controls system provides reasonable assurance that the financial reporting does not contain material inaccuracies
considering the set of controls in place as well as the external assurance process, the internal controls system provides limited assurance that the sustainability reporting, compiled in line with the EU Corporate Sustainability Reporting Directive and the EU Taxonomy Regulation is free from material misstatements
in light of the control framework in place and the monitoring activities carried out throughout 2025, management has obtained a sufficient level of comfort over the effective management of operational and compliance risks. A significant number of key controls are formalised in policies and procedures which were in place throughout the year, and some were supported in the IT platforms, while all staff was reminded of these through the annual Risk and Compliance awareness campaign.
Management acknowledges however, that certain external risks—such as geopolitical, macroeconomic, fiscal policy risks, remain outside the Company’s full control and that the effectiveness of compliance measures also depends on the conduct and judgement of employees across a geographically diverse portfolio. These risks are described in detail in the Risk management and compliance section, page .
Sufficient comfort is defined as the level of assurance derived from management’s assessment of the design and operating effectiveness of its internal risk management and control systems, considering the comprehensiveness of the control framework, the results of monitoring activities, and the Group's risk appetite. While management does not have absolute assurance that no failures will occur, it can state that its internal risk management and control systems are designed and operating effectively to manage material operational and compliance risks
having considered the potential impact of the geopolitical conflictual context and the overall macroeconomic environment on the Group revenues, profits, cash flows, operations, liquidity position and debt, as well as in the consideration of the above mentioned risk categories and approved Group risk appetite, management concludes that there are no material uncertainties relating to the Group’s ability to continue its activities and prepared its financial statements on a going concern basis.
No major deficiencies in the Group’s internal control system or risk management approach were identified in 2025, that could result in material financial loss, misstatement, fraud, or corruption. While certain operational control gaps and opportunities for enhancement were noted at the transaction level, Management has implemented compensating controls with broader coverage, operating on a monthly or a quarterly basis, designed to detect and correct material issues.
Management intends to continue the Company’s digital transformation initiatives in 2026, including the further strengthening of some transaction level controls and the enhancement of testing and monitoring activities. These measures are expected to support the Group’s progress from a moderate to a higher level of certainty regarding the effectiveness of its operational and compliance controls. The key areas for improvement were presented in detail in the internal management’s report towards the Audit Committee.
Internal audit
The Group has an in-house Internal Audit function. The activity of Internal Audit, its mandate, responsibilities and access are regulated through the Internal Audit Charter, endorsed by the Audit Committee and approved by the Board. In accordance with its Audit Charter, Internal Audit reports functionally to the Audit Committee.
Internal Audit is centralised at Group level and has unrestricted access to Company's resources, information and people, to effectively discharge its responsibilities, with no restrictions placed upon the scope of work.
The function carries out independent risk-based audits, under the oversight of the Audit Committee.
The Audit Committee therefore:
defines the Internal Audit mandate and ensures no unjustified restrictions or limitations exist
reviews the performance and effectiveness of the Internal Audit function and its capacity to carry out the Annual Audit Plan
safeguards the independence of the Internal Audit function, through the functional reporting line and the direct unrestricted access
Internal Audit reviews aim to assess the effectiveness of the Group's governance and internal controls, and if they are properly designed to ensure safeguarding of assets, efficiency, economy and effectiveness of operations, adherence to applicable laws and regulations, reliability of financial and operational reporting.
External audit
EY Accountants B.V. (EY Netherlands) and Ernst & Young Incorporated (EY South Africa) were appointed as Group independent external auditors in 2022 under the endorsement of the shareholders, for a period of three consecutive financial years, with the possibility of automatic yearly extensions until a replacement is approved. The Group's audit rotation policy is to organise tenders for audit services regularly, to ensure auditors' independence, as well as verify that audit fees are in line with the market.
The external auditors' scope of work include:
review by EY South Africa of Interim Condensed Consolidated Financial Statements of the Group as at 30 June
audit by EY South Africa of the Annual Consolidated Financial Statements of the Group and the standalone financial statements of the Company, prepared in accordance with IFRS as issued by the International Accounting Standards Board (IASB), the SAICA Financial Reporting Guides as issued by the Accounting Practices Committee, Financial Pronouncements as issued by the Financial Reporting Standards Council, the JSE Listings Requirements
audit by EY Netherlands of the annual consolidated financial statements of the Group and the standalone financial statements of the Company, prepared in accordance with IFRS as adopted by the European Union and with Title 9 of Book 2 of the Dutch Civil Code
audit of the financial statements of selected NEPI Rockcastle entities, prepared in accordance with local accounting principles
The fees incurred for audit services are disclosed in the notes to the financial statements. No non-assurance services have been performed.
The Audit Committee and the external auditors have communicated on all matters required by Dutch Standard 260 / International Standard on Auditing No. 260 (Revised) 'Communication of audit matters with those in charge with governance'.
In addition, the external auditor has communicated that in respect of JSE Listings Requirements paragraph 5.7(h):
the audit firm has met all the criteria stipulated in the requirements, including that the audit regulator has completed a firm-wide independent quality control inspection of the audit firm (Ernst & Young Inc.) and on the designated individual auditor during its previous inspection cycle
the auditors have provided to the Audit Committee the required inspection decision letters, findings report and the proposed remedial action to address the findings at audit firm and individual auditor levels, and have confirmed that there have been no legal or disciplinary proceedings brought against either of the two within the past 7 years
the audit firm and the individual auditor understand their roles and have the competence, expertise, experience and skills required to discharge their specific audit and financial reporting responsibilities
In accordance with best practice and the principle of direct, independent communication between the Audit Committee and the external auditors, the Audit Committee was provided with the auditors' report including significant auditing matters and observations related to the internal control environment and management's response. The Audit Committee reviewed the report and discussed the findings directly with the external auditor. The external auditors had private meetings with the Audit Committee, without the management team present and had unrestricted access to communicate privately to the Audit Committee any issue they may have considered necessary.
The external auditors confirmed their independence to the Audit Committee in respect of: relationships between EY Accountants B.V., Ernst & Young Inc. and the Group; relationships and investments of individuals employed by EY Accountants B.V. and Ernst & Young Inc. in the Group; employment of EY Accountants B.V. and Ernst & Young Inc. staff by the Group; business relationships; other services provided by EY Accountants B.V. and Ernst & Young Inc. to the Group. The external auditors also confirmed there has been no contingent fees, no services granted by EY Accountants B.V. and Ernst & Young Inc. to Directors and/or senior management of the Group and no gifts or hospitality.
The auditors have additionally confirmed compliance of the firm and individual audit partners with all internal EY Accountants B.V. and Ernst & Young Inc. independence requirements and rotation policies, as well as relevant regulatory and professional requirements, and have affirmed that their integrity, objectivity and independence have not been compromised.
The Audit Committee is satisfied with the information received based on which it concluded that EY Accountants B.V. and Ernst & Young Inc. and the audit partners in charge, are independent of the Group.
Risk management and compliance
Risk Management and Compliance Overview
NEPI Rockcastle recognises the importance of enterprise risk management and considers risk in both the strategy-setting process and in driving and controlling performance. The Group further acknowledges that risk management is an increasingly important business driver and, together with compliance management, is embedded in all business processes, and is the responsibility of every employee.
Under the Group’s three lines of defence approach, described in the Corporate Governance section of this report, the Risk Management and Compliance functions share the second line of defence, a symbiosis supporting and strengthening the internal control system by capitalising on alignment and synergies. The Risk Management and Compliance function is primarily charged with oversight of the risk and compliance management frameworks and processes, while encouraging risk owners to report relevant risk-related information, highlight new risk triggers and monitor emerging risks. The Risk Management and Compliance function works in collaboration with risk owners for identifying and implementing new mitigating measures in business processes or mitigating threats, all facilitating effective risk management. Risk Management and Compliance partners (the "Risk and Compliance Partners") have been assigned at the level of each business area, aiming to embed risk management and compliance in business processes, to promote risk management and compliance culture among Group personnel, as well as to facilitate collaboration with the Group’s Risk Management and Compliance Officer.
Governance and Oversight
The Group developed a comprehensive framework for the management of risks, aiming to increase overall awareness among personnel and enable the management functions responsible for managing risks to better identify, assess and control risks within their areas.
The risk management and compliance framework has been designed and implemented to:
align and integrate risk management with strategy and business objective setting
create a culture of risk management, supported by recurring awareness and training programmes
ensure all current and potential material risk exposures are identified, assessed, quantified and appropriately managed
enable compliance with relevant laws, regulations and best practices
enable financial stability and sustainable business growth
foster an educated approach towards risks and provide a Group-level risk assessment methodology and tools
integrate the best practice principles set forth under the Committee of Sponsoring Organizations (COSO) framework and International Organization for Standardization (ISO) 31000
The Group integrates Enterprise Risk Management (ERM) with strategy and performance to identify, assess and manage risks in pursuit of creating, preserving, and realising value. This approach strengthens risk‑aware culture and governance, while embedding risk considerations into all levels of decision‑making. This approach is underpinned by the following core principles that shape the Group’s ERM framework:
strengthen governance and strategic alignment: Anchor ERM in board oversight and leadership tone, define the Group’s risk appetite, and embed it into strategic planning, resource allocation, performance management, and all core business processes
manage risks through a portfolio perspective: Maintain a comprehensive, enterprise‑wide view of risks with clear ownership, consistent assessment criteria, and explicit links to strategic objectives, KPIs, and business outcomes; engage stakeholders throughout the entire lifecycle
apply an iterative, end‑to‑end risk management process: Define scope, context, and criteria; identify, analyse, and evaluate risks; determine and implement treatment options; monitor and review performance; record and report outputs; support consistent, evidence‑based assessment and decision‑making, selecting techniques aligned to the complexity and nature of the risk
enhance risk information and reporting: Establish robust data flows and reporting mechanisms that support timely, informed, and risk‑aware decisions, while ensuring transparency for internal and external stakeholders
continuously enhance ERM: Regularly reassess the ERM approach as strategy, operating context, and performance evolve, ensuring the framework remains relevant, effective, and aligned with value creation
Framework and Policy Foundations
The Group’s operations are subject to various statutory regulations and standards throughout different jurisdictions. Across the entire Group, NEPI Rockcastle promotes integrity and compliance with the legal and ethical frameworks.
A comprehensive compliance framework has been implemented, defining uniform rules and practices applicable to all Group entities which are therefore focused on conducting business activities lawfully and consistent with the Group's compliance obligations.
In line with its Risk Appetite Statement approved by the Board, the Group is committed to identifying, preventing and managing risks, for which purpose relevant controls have been embedded in both business and support processes. To uphold this commitment, the Group has embedded controls across business and support processes addressing key risk areas, including:
potential conflicts of interest
related party transactions which may not be transparent or at arm’s length
breach of confidentiality and professional secrecy
non-transparent and incomplete financial reporting or communications
non-compliance with fiscal regulations within a complex tax environment
use of privileged information and insider trading
money-laundering and the financing of terrorism
inadequate adherence to anticorruption, anti-fraud and competition rules
inefficient delegation of authority required to maintain the correct balance between flexibility, speed and span of control
The Group’s policies and procedures are periodically reviewed and revised to ensure permanent alignment to the applicable legal and regulatory framework as well as a practice to promote a continuously evolving business environment.
Risk Management Strategy and Risk Governance
To ensure the efficient implementation of risk management principles and increase the overall risk-aware culture, the Group focuses its efforts on:
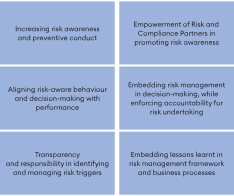
Information is essential for effective and sound risk management, and the Group ensures that relevant risk‑related information is shared and escalated transparently across the business. To support this, management provides the Risk Management and Compliance Officer, the Risk Management and Compliance Committee ('the Committee'), and the Board of Directors with the appropriate level of timely, relevant, and reliable information needed to oversee risk management practices and evaluate their effectiveness.
The Group considers it a priority to ensure that risk management is properly overseen and embedded within the strategy and objective‑setting process. The risk mapping exercise enables the identification of risks and their alignment to one or more strategic goals. This mapping is reviewed annually, in parallel with the development of the following year’s strategy, to support an efficient assessment of risks and to enable early evaluation of their potential impact.
The Committee was established to support the Board in exercising oversight over Enterprise Risk Management and Compliance processes, ensuring that the Group has implemented an effective approach that will enhance its ability to achieve strategic and business objectives.
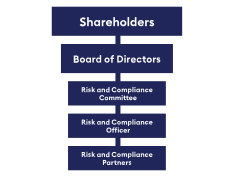
The risk management oversight role of the Board and of the Committee is enhanced by the Directors’ independence and mix of skills, expertise, experience and business knowledge. Board oversight (directly or through the Committee) covers scrutinising key management decisions, presenting alternative views, offering sound judgement, challenging potential organisational biases, determining the appropriate course of action in the event of a breach of Group policies or procedures. The Board advises and challenges management without assuming the operational role of management.
The detailed responsibilities and duties of the Board and Committee are defined in their respective charters and the Group’s Corporate Governance Framework and are presented in the Corporate Governance section of this Annual Report, page .
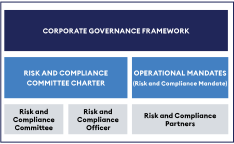
A Risk Management and Compliance Officer, reporting to the Committee, is mandated by the Board of Directors with overseeing compliance and enterprise risk management as a second line of accountability. The Risk Management and Compliance Officer's detailed responsibilities are set forth in its mandate granted by the Board of Directors.
The Board ensures that risk management policies and procedures, as well as the Compliance Risk Framework, designed and implemented by the Risk Management and Compliance Officer with the endorsement of the Committee, are:
consistent with the Group’s strategy and Risk Appetite
rely on an enterprise-wide culture that supports appropriate risk awareness, behaviours and decisions
The Board will also provide oversight of the implementation of the General Compliance Policy, Code of Ethics, Whistleblowing Policy and overall Risk Management and Compliance system, based on regular reports provided by management, the Risk Management and Compliance Officer and Internal Audit Director.
Management embeds risk management practices into day-to-day operations and ensures that these practices are applied consistently, seeking to (i) build a risk-aware culture, (ii) agree risk management performance targets, (iii) ensure implementation of risk management recommendations and (iv) identify and report incidents, changed circumstances or emerging risks. Within the risk appetite approved by the Board, management also decides whether to proceed with mitigation strategies and implement contingencies, while the Board directly, and through the Committee, exercises oversight.
When it comes to Risk Management, every employee has a responsibility to:
understand and implement risk management processes
report inefficient, unnecessary or unworkable risk management measures
report loss events and near-miss incidents
cooperate with management on incident investigation
Risk and Compliance Partners have been designated for each area of expertise within the Group to support the Risk Management and Compliance Officer in identifying, assessing, and addressing risk triggers. Acting as ambassadors for risk and compliance, they provide frontline support in detecting and escalating potential risks across the organisation. Drawing on their knowledge and functional expertise, the Risk and Compliance Partners contribute to evaluating the impact and probability of identified risk triggers and recommend appropriate mitigation measures. Their role as the first point of contact within their respective areas helps ensure that emerging risks are recognised early and managed effectively.
As the Group operates in multiple jurisdictions and has a complex structure comprising a holding and financing entity, operational and management company subsidiaries, the Risk Management and Compliance Officer, in consultation with both management and the Committee has defined a structure of roles and responsibilities at management level, to ensure an effective framework for managing risks for each entity and local jurisdictions it operates in.
In consideration of its power to challenge management on the Risk Management system and based on the reports it receives directly and/or through the Committee, the Board may decide to request independent assurance on the effectiveness of Risk Management processes from external parties (consultants, auditors etc.).
Risk management effectiveness is supported by the framework design, operation, monitoring and reporting. Appropriate measures have been implemented to ensure such effectiveness:
the risks associated with the strategy and activities of the Group are identified and regularly assessed, covering strategic, operational, compliance and reporting matters
the risk appetite has been defined and approved by the Board, necessary risk mitigants have been implemented and are regularly reviewed
the risk and compliance management function, as well as the overall internal controls system are in place and operating effectively in circumstances where no significant changes or breaches of policy or procedure have occurred in the previous financial year
the material changes in external factors and their impact on the Group’s activities have been considered, assessed and monitored, while tailored action plans have been defined with the support of the management, monitored regularly and reported
the Risk Management and Compliance Officer provides quarterly reports to the Risk and Compliance Committee on the progress of monitored risks and highlights any emerging risks. Additionally, the Officer reports on the overall performance of the Risk Management and Compliance function and may raise any significant issues that could impact Group operations or the broader internal control environment
Operational and compliance risks are managed effectively in line with the Group’s risk appetite and the design of its internal risk management and control systems. While many internal risks fall within the Group’s ability to influence and control, certain risks - by their nature - cannot be fully mitigated or managed directly. As such, they remain only partially within the control of Group management, including:
employees acting in breach of internal policies or applicable laws: The Group implemented policies and procedures describing processes, flows, responsibilities, embedded controls, a Code of Ethics describing the rules for ethical business conduct and adequate management of the conflict of interest situations, training and awareness campaigns are organised to ensure employees are up to date about new internal regulations or updates to existing ones. However, the Group is partly dependent on the behaviour of its employees whose behaviour cannot reasonably be continuously controlled or fully embedded in procedures
legislative and regulatory volatility: Amid a shifting geopolitical landscape and global economic uncertainty, the Group is exposed to increasing legislative volatility across its jurisdictions. This includes the emergence of inconsistent or rapidly evolving legal initiatives that may significantly impact operations. Aiming to ensure mitigation and timely reaction, the Group undertakes advocacy activities through the business associations of which NEPI Rockcastle is a member and promotes the interests of the real estate industry, leverages synergies with other impacted business sectors, ensures the monitoring of legislative proposals at all levels of national lawmakers etc.
market risk: Strategic/Systemic risk resulting from changes in an asset losing attractiveness (due to tenant mix and reduction of the overall appeal), increase of competition, degrading market conditions, fiscal changes likely to impact customers‘ purchasing power, potentially affecting the performance of the Group's shopping centres. To mitigate these risks, the Group carries out regular market analysis to identify shifts in consumer behaviour and competitive activity, tailors its tenant mix to local demand and emerging categories, and cultivates synergies between anchor and smaller tenants to drive footfall and extend visit duration. The Group also invests in placemaking initiatives — including events, green spaces and cultural exhibitions — and upgrades amenities and common areas to enhance the overall visitor experience
reputational risk: This risk can be classified as both an internal and an external risk, because the Group’s reputation can be affected by factors originating inside the company as well as by events or influences from outside. Elements like negative media coverage or social media backlash, customer complaints and public dissatisfaction, security incidents caused by external attackers, misconduct by third-party vendors or partners, industry wide events impacting public perception are external risk triggers that could harm the organization’s public image and market credibility, however not under full direct control of the Group. To mitigate such factors, the Group engages reputable specialised consultants, maintains an experienced public relations team on standby to manage crisis communication, implemented crisis communication policies and cultivates good relations with relevant media
geopolitical and economic factors: Political instability, international tensions, regulatory changes, or macroeconomic fluctuations on the retail property market, shifting trade policies that affect consumer goods supply, economic downturns that reduce consumer spending, sanctions or tariffs that disrupt tenant operations, inflation that increases development or maintenance costs, and political unrest that may deter investment or affect property values are risk factors that can influence tenant demand, occupancy rates, rental income, long-term asset performance, thus affecting Group operations, however not under full direct control of the Group. To mitigate such factors, the Group defined a resilient investment strategy and asset appraisal process, monitors macroeconomic and property market trends, monitors country specific credit ratings, creates emergency response plans, maintains a diversified risk profile from particular country risk perspective, ensures sustained monitoring of market data for Group's publicly traded securities, interest rate position, liquidity, availability of cash resources and counterparty exposure and performs periodical business continuity testing
Risk Appetite
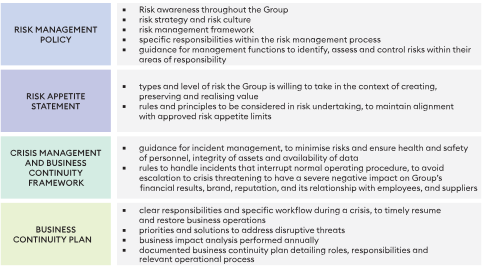
The Group seeks to embed risk appetite in its processes, thus ensuring alignment with strategic objectives and external risks, which improves consistency and traceability in decision‑making:
strategic alignment. Appetite and tolerances define acceptable risk‑return trade‑offs, translated into adequate approval limits and control points
transparent and traceable decision-making. Clear, pre‑agreed limits reduce uncertainty and escalation
consistent resource allocation. Adequately operationalised risk appetite (e.g. loss limits, downtime tolerances, compliance thresholds) enables efficient budget and resource allocation
early detection and course correction. Tolerance limits are monitored and timely addressed
regulatory credibility and assurance. Ensuring a demonstrable link from board‑approved appetite to operational limits, monitoring, and responses
bias reduction and transparency. Structured thresholds and exceptions management are aimed to reduce bias, improving transparency in decision-making
The Group closely monitors risks with a potential impact on strategic goals, assessed in accordance with the risk evaluation methodology. The Group considers in its periodic assessment risk triggers such as fluctuations in the Group’s financial results, changes in political, social, legal, regulatory or economic conditions, inflation, interest rates, fluctuation in exchange rates, deflation, the Group’s ability to successfully implement business strategies, future investments, acquisitions and competition.
The Group has developed and approved criteria defining its risk appetite regarding critical activities creating, preserving and realising value. Such critical activities, processes and topics include asset management, leasing, investments, tax structure management, treasury operations, tenant relationship, data privacy, human resources, and Group Know-Your-Counterparty Procedure.
The Group has set the following financing-related targets to ensure risks are managed properly:
a weighted average debt maturity of at least three years at any given time
at least 70% of property portfolio should be unencumbered
LTV ratio below 35% (maximum 40% in the short-term)
The Group has zero tolerance towards risks related to:
health and safety (for example structural integrity of properties, fire security and serious pollution)
fraud and corruption
doing business with clients/partners not carrying out legal and legitimate activities or rejecting transparency
money laundering and terrorism financing
non-compliance with international sanctions
serious violation of the Code of Ethics by employees or Directors
damage to the Group's reputation materially affecting its ability to attract funding, personnel or relationships with business partners
non-compliance with material regulatory requirements (for example competition, data privacy)
exposing the Group and its employees, collaborators or Directors to any criminal liability
market abuse practices as defined by the rules and regulations of the markets where the Group's debt or equity instruments are trading
The Group defines its Risk Appetite for each material area as follows:
Data privacy. The Group has zero tolerance towards (i) material regulatory non-compliance, significantly affecting data subjects’ rights and liberties; (ii) intrusive, disproportionate or unlawful data processing; (iii) personnel misconduct leading to material reputational and/or financial consequences for the Group.
Taxation. The Group has a low risk tolerance towards matters which may trigger in the future a risk of interpretation by the tax authorities as being non-compliant with applicable laws. In this respect, the Group (i) is continuously monitoring the tax legislative developments as well as the European Court of Justice cases on the abuse of EU law, (ii) has a prudent approach on its tax structure and ensures that the Group companies are economically embedded within the structure and are equipped with sufficient functions and activities.
Treasury operations. The Group has a very limited appetite for investments in listed securities and any actions in respect of listed securities portfolio are taken based on the decision of the Investment Committee.
Acquisitions. The Group does not invest in properties that do not fulfil cumulatively specific pre-set criteria, such as country risk, positioning, demographics, GLA, quality, profile of tenants, etc.
Construction works. The Group has (i) zero tolerance to any risk that would compromise safety on the construction site and later on during the exploitation of the property; (ii) zero tolerance to using construction materials, installations and equipment that are not fully compliant with applicable laws and regulations and/or that are dangerous for the workers, staff or visitors; (iii) very limited tolerance towards making savings in the development budget if by doing so it creates a risk of compromising the quality of the property, while at all times and in any circumstances the safety of property and people should not be at risk; (iv) zero tolerance to starting development works based on non-compliant or incomplete planning or permitting approvals to works that require additional costs in absence of appropriate approvals.
Tenants. The Group has a low appetite towards (i) making compromises to the overall tenants mix quality, accepted only on a short-term basis and in exceptional situations, determined by the social-economic environment, usually triggered by emergency episodes (such as pandemic, calamities etc.) or local/regional particular context; (ii) tenants with a track record of not paying their debts; (iii) accepting tenants that cannot provide adequate creditworthiness documentation. To this end, thorough creditworthiness assessments are conducted prior to signing lease agreements, whereas the Group may also require rental deposits, bank or corporate guarantees, and other similar instruments, as appropriate, to mitigate counterparty risk. Such measures consider the tenant's financial condition and the Group's overall exposure, ensuring adequate coverage of operating costs based on the level of exposure.
Political environment. The Group has (i) a low appetite towards extending its portfolio in jurisdictions that could determine uncertainty and/or delays in executing the Group’s strategy; (ii) zero tolerance towards any request or initiative of financial support (sponsorship, donation, any other in-kind benefits, etc.) to any political party and/or politically exposed person, as well as to involvement in political issues of the countries where it is present.
IT infrastructure. The Group does not tolerate (i) operating without business operations back-up and disaster recovery of critical IT infrastructure; (ii) risks that would materially impair the reliability of the Group’s IT infrastructure; (iii) operating without having in place measures and processes designed to deter or pro-actively prevent any form of cyber-attacks such as spam, phishing, malware, ransomware campaigns.
Management of the Group’s assets. The Group (i) does not accept impairing the state and condition of its properties for the sake of short-term income increase or cost savings; (ii) has a very low appetite towards compromising the long-term prospects and the sustainability of the property for short-terms gains; (iii) accepts the risk of failure in respect of innovative initiatives such as PropTech, retail transformation, etc. as long as the financial impact is within budget and there is no other material impact such as on reputation, non-compliance or health and safety.
Know-Your-Counterparty. The Group's policy is to work only with clients/partners who carry out legal and legitimate activities and maintain business transparency. The Know-Your-Counterparty process focuses on the assessment of the identity of clients/partners, as well as of their potential involvement in acts of corruption, fraud, terrorism financing, money laundering. The Group’s risk assessment methodology is supported by a risk-based approach, which involves the use of evidence-based decision-making to target the risks of money laundering and terrorism financing.
The end-to-end Know-Your-Counterparty process has been automated, based on the eligibility criteria and risk matrix as defined in the Group Know-Your-Counterparty Procedure. Also, the Group developed a Sanctions Policy, seeking to ensure the Group’s compliance with all applicable sanctions laws and regulations, whereas relevant controls are embedded in the business processes.
Competition. The Group has zero-tolerance towards risks related to non-compliance with material regulatory requirements concerning competition. Therefore, the Group is committed to high standards of ethical, moral and legal business conduct, as well as to observing antitrust laws promoting free and open competition in the marketplace. Anticompetitive practices are, as a rule, prohibited. An anticompetitive practice is a conduct which severely prevents, restricts, distorts or otherwise affects the competition on the market.
The Group deploys periodical training and awareness campaigns, therefore a dedicated competition compliance program has been implemented at Group level to help employees identify such sensitive aspects in their activity. The competition compliance training sessions focused on general legal requirements in competition area, accepted and unaccepted competitive practices, examples of behaviours that might occur in the daily activities, rules to be observed during potential competition authorities’ investigations.
Also, as part of Group’s ongoing efforts (i) to enable a unitary approach and common practices at Group level, (ii) to obtain the comfort that tenders follow an ethical, anti-money laundering, anti-corruption and anti-collusion wise process, as well as (iii) to ensure a fair competition between the participants to the tender process and to keep Group entities safe from litigation risk, sanction and/or reputational risks and financial losses, a standard tender process and specific documentation have been implemented and are periodically reviewed.
Employees/collaborators of the Group have an obligation and responsibility to ensure that their actions do not infringe competition compliance rules and requirements.
When determining the risk appetite for a particular risk that does not fall into the zero-tolerance category, the capacity of the Group to absorb the risk in the pursuit of its strategy and business objectives shall be considered, as well as the Group’s tolerance. Tolerance represents the acceptable variation in performance in relation to the targets, as they are defined by the Group strategy and further on cascaded based on specific performance indicators per area of activity and per individuals.
Exceptions to risk appetite are extremely rare and always follow the escalation process, while risk undertaking is transparently embedded in the business processes.
Risk Management Process and Responsibilities
The Risk Management Policy approved by the Board provides a framework for the management of risks, to increase overall risk awareness and to enable the management functions responsible for managing the encountered risks in pursuing approved strategy and business objectives, to better identify, assess and control risks within their areas.
In line with Group risk assessment methodology, every identified risk is mapped to one or more of the Company’s strategic goals. This mapping is reviewed annually - after the strategy for the upcoming year is approved to ensure continued relevance and alignment. The mapping strengthens the Group’s ability to assess risks by highlighting which risks could hinder the achievement of specific strategic goals. It also supports a more sophisticated view of interdependence, enabling analysis of stochastic correlations between risks and improving the overall understanding of the aggregated risk profile.
Before implementing adequate mitigation measures, the Group undertakes a detailed assessment as to the probability and impact of each major risk category.
For significant risks, detailed contingency plans are formulated and regularly updated by the Group for each risk that may materialise. Such plans detail a series of actions to be carried out either prior to or during the event, and have a double purpose:
mitigation: Contingency plans help manage risks by providing a structured approach to addressing them. They outline specific actions to minimise the impact of adverse events
monitoring and evaluation: Properly executed contingency plans allow for ongoing monitoring of risk treatment progress. They also facilitate the evaluation of residual risk, ensuring that any remaining risk is within acceptable limits
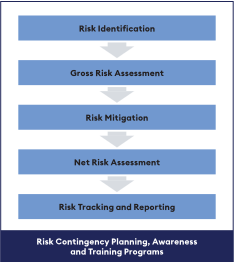
Risk awareness is important for all employees, as it helps identify threats as well as actual risks that could impact on the Group’s operations. Additionally, management plays a key role in bringing emerging risk factors to the attention of the Risk Management and Compliance Officer, the Committee, and the Board, when necessary.
To ensure a risk-aware culture in the Group, the management is responsible for: |
Responsibility | Description | Actions taken |
Maintaining strong leadership | Executive management is responsible for establishing and promoting a strong risk‑aware culture across the Group, ensuring that cultural and risk‑awareness expectations are defined and communicated throughout the Group |
|
Employing a participative management style | Management is responsible for fostering an environment where employees feel encouraged to openly discuss risks that may impact on the achievement of strategic and operational objectives |
|
Enforcing accountability for all actions | Management is responsible for defining and documenting accountability policies and ensuring they are applied consistently across the Group |
|
Aligning risk-aware behaviours and decision-making with performance | Management is responsible for designing remuneration and incentive programs that reinforce expected behaviours, adherence to the Code of Ethics, and accountability for risk‑aware decision‑making |
|
Embedding risk management in decision-making | Management is responsible for ensuring that relevant risk scenarios are systematically considered in all key business decisions |
|
Having open and honest discussions about risks that the entity faces | Management is responsible for recognising that risk includes both threats and opportunities and is essential to achieving the organisation’s strategy and objectives |
|
Encouraging risk awareness across the Group | Management is responsible for ensuring personnel understand that managing risk is an integral part of their everyday responsibilities |
|
In the process of identifying, assessing, responding to and reporting on risks, the Group uses dedicated tools:
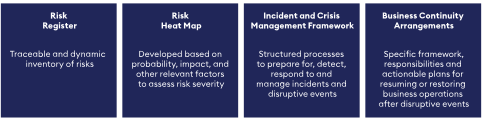
Crisis Management
Under the wider umbrella of the Group Business Continuity arrangements, the Group implemented a Crisis Communication Procedure that defines the Group’s crisis‑communication framework, detailing the processes that enable rapid detection, escalation, decision‑making, and coordinated response to crisis events. It also sets out the standards for crafting and delivering key messages and provides a uniform, Group‑wide protocol outlining how all personnel must communicate and act during a crisis.
Employees are trained to report incidents of malfunction, suspicious activities, threats or weaknesses potentially affecting health and safety, information security, physical security, information systems continuity, privacy or other relevant areas. If a crisis occurs, the crisis management team will respond according to the rules set forth by the Incident and Crisis Management Policy, in line with the following key principles:
highest priority on people’s safety: employees, clients, visitors, partners, emergency responders and community members, as best practice proves that personnel are more likely to co-operate with the extra demands during a disruptive incident, if their welfare needs are met
preserve landlord’s and tenants’ assets: ensure the integrity and safety of property goods and tenants’ products for sale
operational resilience: protect assets and ensure continuity of business processes
integrity and reputation: ensure the preservation of the Group’s brand reputation by consistently acting and making decisions in accordance with the Group’s core values
regulatory compliance: comply with all applicable national and international laws, rules and regulations
transparency and disclosure: make public disclosures that are fair, accurate, timely and understandable, regarding the impact of the crisis on the Group’s facilities, associates, customers, operations and communities
communication: share pertinent information with relevant stakeholders, in a timely manner
Senior management is responsible for the design and implementation of effective crisis management strategy, plans, processes and organisation. The Group sets up a Crisis Management Team (CMT), to manage major events and those categorised as crisis. The composition of the CMT and response depend on the scope, nature and (potential) impact. The CMT is authorised to mobilise all internal and external resources that it deems necessary to manage a crisis, such as law firms, technicians, consultants, public relations companies, third-party logistics, employee assistance providers, etc.
The CMT is accountable for the Group’s response to a crisis and for addressing the concerns of staff and key stakeholders, for example the Group’s leadership, investors, key customers, suppliers and government officials.
Compliance and Risk Management in 2025
a. Internal regulatory framework
During 2025, the Group conducted the periodic internal review of the Enterprise Risk Management and Compliance Management system, considering observed weaknesses, instances of misconduct and irregularities, indications from whistleblowers, lessons learned and findings from the internal audit function and the external auditor, as the case may be. As part of this review, the Risk Management and Compliance Framework underwent amendments to ensure a tailored approach to risk assessment and mitigation. These amendments and overall efforts focused on the review and enhancement of the operation of the internal risk management and control systems, particularly on the following areas:
overall corporate governance framework has been revised following the yearly review exercise
the new Operational Incidents and Management Procedure brings clear rules for the efficient handling of operational incidents in commercial centres, defines specific roles and responsibilities based on where an event occurs, and sets mandatory communication requirements, detailing who must be informed, including authorities and media, and the appropriate channels to be used
the updated Group Sustainability framework is part of the Group’s wider efforts to enhance internal compliance with the overall ESG regulatory framework (e.g. Environmental Policy, Utility Consumption Data Collection, Climate Change Policy, Sustainable Development Policy)
in line with the Corporate Sustainability Reporting Directive (CSRD), the European Sustainability Reporting Standards (ESRS) and the EU Taxonomy Regulation, the new Sustainability Reporting Procedure governs the preparation and disclosure of sustainability information in accordance with applicable mandatory or voluntary reporting frameworks
the revised Guide on Anti-harassment in the workplace seeks to enhance compliance with relevant legal requirements deriving from the provisions of two European Directives regulating anti-harassment in the workplace (moral and sexual harassment)
the new Human Rights Due Diligence Policy reflects Group’s commitment to ethical and responsible business conduct, in line with the relevant Minimum Safeguard requirements from EU Taxonomy, aims to meet international standards and regulatory expectations, and to embed human rights considerations across Group operations and value chain
the updates to the Group Whistleblowing Policy bring additional clarifications regarding the overall reporting and investigation processes
in response to the growing trend of international sanctions, a Sanctions Policy has been implemented, aiming to ensure proper handling and compliance, raising awareness and embedding relevant controls that prevent violations and exposure to risks
the updates to the Sponsorship and Donations Procedure bring clarifications regarding the handling of potential conflict-of-interest situations that risk impacting transparency in decision-making process
the Watchlist Procedure has been revised to include enhanced process transparency, as well as additional listing criteria to support an efficient due diligence process
a new Payments Policy defines standardised, enforceable, and auditable payment terms and workflows that ensure compliance with legal and contractual obligations, predictable cash flow and working capital management and enhanced supplier relationship management
the annual business impact assessment has been performed, and the business continuity arrangements have been tested to confirm resilience of critical processes, systems, as well as identify and address potential gaps impacting recovering within required timeframes
in line with Group Risk Appetite and in response to an increasingly challenging and volatile geopolitical environment, the Know-Your-Counterparty process has been optimised to ensure enhanced due diligence, screening and portfolio monitoring, aiming to prevent legal, financial, and reputational risks and avoid partnerships with untrustworthy and non-compliant counterparties
the Group procurement procedures have been revised to ensure more clarity on process steps, approval and signing matrix and rules
definition of specific controls and segregation of duties rules to be embedded in business processes and supporting technology (e.g. optimised leasing process, redesigned Group procurement processes)
increasing efficiency of the partnership between Risk Management, Compliance Officer and Risk and Compliance Partners to optimise risk triggers collection and mitigation
embedding compliance and risk management in key Group projects, especially in the digital transformation and process automation initiatives
training and awareness programs for all staff, focusing mainly on prevention of corruption, gifts policy, whistleblowing rules and channels, competition law requirements, Know-Your-Counterparty process rules and eligibility criteria, conflict of interest
in line with the Policy Framework Procedure, the Compliance and Risk Management function coordinates the methodological process at group level and is in charge with appropriate communication among group employees whenever existing policies and procedures change or new ones are approved, aiming to ensure proper and timely implementation; all policies, procedures and guidelines are uploaded in a dedicated location on SharePoint and made available to employees on Group’s SPOT platform
b. Business continuity framework
The Group business impact assessment methodology and the business continuity arrangements followed the usual annual review process.
The analysis covered all processes and subprocess, especially new ones, interdependencies between areas and departments, resources, people, assets and suppliers’ availability, critical systems and flows. Processes and subprocesses are aligned to top risks, while hypothetical disruptions in critical processes are assessed based on a risk matrix, designed to consider the potential financial impact, as well as the impact on partners, operations, legal/regulatory obligations and reputation exposure of the Group.
Dedicated training and awareness programs are periodically developed for senior management, Risk and Compliance Partners and all staff, aiming to increase crisis risk culture, responsiveness and adaptability to incidents and crisis management.
As part of its ongoing monitoring and enhancement efforts in the area of internal risk management operation and internal controls efficiency, the Group focused in 2025 on the following areas:
improvement and update of the internal regulatory framework to ensure alignment with legal requirements and internal optimisation and automation initiatives
optimisation and digitalisation of business and support processes, while embedding adequate controls
review of the business impact assessment and testing of the business continuity arrangements and framework
training and awareness programs in compliance and risk management areas
intensifying collaboration with risk and compliance partners
ongoing consultation and collaboration between the 2nd and 3rd levels of internal control system
As part of Group Compliance landscape, the Risk and Compliance function, with the support of Internal Audit, performs periodically a dedicated risk assessment covering in detail areas mostly exposed to fraud risk, such as ethics in business conduct, controls in processes, financial statements and reporting fraud, employment- and employee - associated risks, sponsorships and donations, supplier and tenant fraud risk, M&A and disposals, information assets, outsourced services. Such assessment is based on most relevant fraud risk scenarios and a risk-based approach, where probability and impact are assessed both as gross and net values, i.e., before and after mitigation, according to the risk assessment methodology defined in the Group Risk Management Policy.
The risk assessment refers to the overall internal regulatory framework, processes and systems, aiming:
to detect potential risk triggers for the risk areas identified as relevant
to recommend implementation of proper procedures, delegation of authority, job descriptions
to develop fraud risk awareness and training programs
Following this review, further mitigation measures have been planned for 2026:
optimise controls and monitoring in business and support processes, in the context of wider digitalization and automation process
internal audits consider fraud risk as part of each audit program
roll out Microsoft Dynamics implementation, to ensure processes automation, embedment of needed controls and segregation of duties, less fraud risk exposure
annual training and awareness program for areas in scope for this risk assessment (e.g. ethics, fraud risk)
roll out Data Governance project (data cleansing, storage/archiving rules, data ownership)
align all policies and procedures to the new process defined under digitalization and automation projects and other platforms supporting business processes
identify not regulated processes and flows and document them adequately in internal procedures
continue recurrent meetings between internal control functions so that to ensure alignment, timely information sharing, and coordinated responses
digitalization initiatives aiming to address supplier- and fraud-risks, and payment fraud
Following such assessment, the Group derives the priorities for the following year in terms of key risk areas and expected mitigation effort. General measures, such as increased awareness and training, policy development and periodic updates are derived and prioritised. The status of action plan is reported to the Risk and Compliance Committee on a quarterly basis.
The Risk Management and Compliance Officer sets general priorities and key focus areas for the following year, which are included in the Compliance Program, and progress is also reported quarterly to the Risk and Compliance Committee.
In addition to ad-hoc meetings that are held whenever needed to consider special matters, to enhance the effectiveness of the risk management process, the Risk Management and Compliance Committee is convening on a quarterly basis. Any incidents and matters which are relevant in determining the level of effectiveness of the Group’s risk management are raised by management, through the Risk and Compliance Officer, to the Committee. Ultimately, the Internal Audit function, as the third line of defence in the internal controls system, assesses the effectiveness of risk management carried out by the first two lines of defence, i.e., Risk Management and Compliance, and business management.
Any significant incidents, misalignments between the decision, actions and activities of the Group and its risk appetite or ineffective processes or controls were addressed through appropriate measures, such as revision of existing or implementation of additional policies or procedures.
Training and awareness programs have been organised for new joiners and all staff during 2025, supporting implementation of the new policies and procedures, reminding of Risk Management and Compliance essentials, aiming to raise risk awareness and develop a proactive risk awareness culture among Group personnel. Regular posts on internal communication platform covered ethical conduct, gifts policy, whistleblowing values and available channels, and encouraged the tone at the top and speak-up culture. Also, awareness campaigns on ethics and anti-corruption practices were organised to cover Group partners, clients and suppliers, raising awareness about Group ethical commitments and inviting to speak up in case they suspect any misalignment between such commitments and Group personnel business conduct.
To maintain transparent communication as part of an efficient Risk Management process, regular alignment workshops continued in 2025 between functions responsible for the second line of defence (Risk Management and Compliance) and the third line of defence (Internal Audit), aiming to foster a unified Group-wide approach to preventing risk exposure and enhancing the efficiency of overall Risk Management practices.
Additionally, to ensure that strategy and business goals were considered when setting and adjusting the Risk Management system, as well as to enhance the tone at the top culture, the Risk Management and Compliance Officer, Chief Executive Officer, Chief Financial Officer, Internal Audit Director and Group Legal Counsel, all permanent guests in the Risk and Compliance Committee, continued periodical consultations focusing on projects and initiatives, process optimisation, potential risks and mitigation factors, especially in the context of a changeable socio-economic environment requiring fast strategic decisions and an adaptable risk management approach.
The Business Continuity Plan has been successfully tested in 2025, followed by a regular review of the business continuity internal framework. Awareness and training, tone from the top promoting a risk culture, timely communication, remain key success factors for an efficient business continuity system management, especially in the current political and economic context. Learning from recent crisis episodes (e.g., pandemics, regional conflicts and energy crisis) where timely reaction proved to be crucial, the Group continued to closely monitor the overall geo-political and economic landscape, while preserving business continuity and agility to react where immediate action is needed. Throughout the difficult and complex geo-political and economic context that extended to 2025, the Group’s focus has always been on preserving people safety, assets protection, processes continuity, functional partnerships with clients and suppliers, successful and transparent internal and external communication.
The Group corporate governance framework has been reviewed and adjusted to align to the evolving and demanding legal and regulatory environment, as well as to support the dynamic of internal business optimisation projects and initiatives.
Risk management, Compliance and Internal Audit are involved in Group optimisation and digital transformation projects so that they may recommend the most efficient control approach. Furthermore, Compliance validates all policies and procedures, and ensures coordination of the wider internal methodological process, enabling it to recommend needed controls and raise potential concerns in a timely manner.
The Risk Management and Compliance Officer ensures (i) all policies and procedures are available to all employees on the Group’s SPOT platform and are regularly consulted, (ii) relevant changes are shared by the means of internal communication channels, so that all Group existing personnel as well as new joiners may easily become familiar with the internal regulatory framework updates, (iii) guidance and advice to all staff regarding their roles and responsibilities, with the aim to maintain full compliance with internal regulatory framework.
Management assesses the risks of material misstatements in the financial statements due to fraud, by continuous evaluation of the design and relevant aspects of the system of internal controls, as well as among others the code of ethics and whistleblowing procedure. Mitigation of the risk of material misstatements in the financial statements is achieved through:
implementation of a financial reporting calendar, as well as relevant internal controls, routines, checks and balances in the reporting process
ensuring an appropriately sized and experienced finance and reporting team
reconciling monthly, budget and forecast numbers to actuals, with quarterly review performed by the Audit Committee
Audit Committee’s review of significant management estimates and accounting policies
development of a single integrated, secure and performant IT architecture for ERP, Budget and Forecasting, Leasing, Procure-to-Pay, Master Data Management and Group Financial and Operational Reporting, delivering digital capability for end-to-end business management
periodic internal and external auditors’ review
The Group implemented comprehensive Procurement Policies and a supplier due diligence process, to ensure that responsible purchasing is conducted and that procurement decisions are in the best interest of the Group. Responsible purchasing is aimed at Group level through:
implementation of sound policies, promoting objectivity and transparency throughout the procurement processes, including during pre-tender phase, and monitoring of compliance thereto
implementation of aligned requirements and controls in property management/project management contracts, to ensure that the same principles are applied by outsourced property and project managers
design of a detailed supplier risk assessment and due diligence, including suppliers’ green assessment
win-win partnerships with some Group suppliers, based on sustainable business practices, where the Group and its suppliers may thrive and grow
The Group rolled out a Leasing Policy, to ensure that tenant relationships are managed with professionalism and at high standards across the Group, and that internal controls are implemented, fostering transparency and enabling the achievement of the Group’s objectives. A risk assessment and due diligence process are applied when onboarding new clients and periodical revisions are performed thereafter.
The Board is responsible for the governance and ongoing oversight of internal controls, including information and technology. The Board confirms that processes exist ensuring timely, relevant, accurate and accessible reporting, communication and data storage. To this end, the Board ensures that the Group’s IT processes and systems are integrated with the overall business strategy and objectives, monitoring that:
processes, people and information technology are integrated seamlessly across the Group
hard and soft infrastructure supports the achievement of the Group’s strategy
proper arrangements are implemented for business continuity and disaster recovery
proper security measures have been implemented to ensure that confidential data is safeguarded and easily accessible, while complying with the relevant cybersecurity, data protection or other applicable laws and regulations
proper investments in information technology are made with a view to enabling the above
The Board has delegated the responsibility for IT and security to the CEO through the Operational Mandate and the CEO has further cascaded these to the Group Technology Director. Where IT processes are outsourced to third-party service providers, these are governed by service level agreements, with compliance monitored by management.
Appropriate IT security and business continuity management policies have been developed and implemented across the Group.
The Group demonstrates a strong commitment to cybersecurity. By implementing extensive measures, they aim to safeguard against material data breaches, information leakage, and the loss of critical data. A Data Governance project has been launched at Group level seeking to ensure implementation of adequate organisational and security measures meant to enhance information assets protection and security.
The Group continued in 2025 its Cybersecurity Program, focused on awareness, prevention (through regular training programmes for all employees at least on an annual basis) and security by design. The Group implemented and communicated a clear escalation mechanism where any suspected attack can be reported and analysed. The 2025 awareness and prevention programme focused on training programmes for all employees meant to raise awareness of emerging security threats, key vulnerabilities, Group’s policies, procedures and support functions. The Group was the target of cybersecurity attacks during the year, while none had serious consequences due to the safeguards implemented – close monitoring and tracking are in place. No attack led to either a significant leakage, loss of personal data and business secrets, or to the unavailability of technology and business interruptions in the three years preceding this report date.
With a focus to enhance internal controls, increase efficiency, transparency and traceability, and to operate in a paperless environment (to the extent possible and within current legal constraints in various jurisdictions), the Group continued its journey of digitalisation and process automation across various areas and processes, as a medium-term strategic priority.
The Group implemented and periodically reviews the General Compliance Policy aiming to guide compliance by: (i) setting a clear compliance framework; (ii) promoting consistent, rigorous and comprehensive practices throughout the Group; and (iii) stimulating a culture of compliance, including ethics and integrity.
The Compliance and Risk Management function covers the following responsibilities at Group level:
advisory: counsels all management levels and personnel on compliance with laws, rules and standards, including keeping them informed on legislative developments and emerging exposure
education: assists senior management in educating staff on compliance issues
identification, measurement and assessment of compliance risks: evaluates the compliance risks associated with business activities, including the development of new business practices and new partnerships
monitoring, testing and reporting: periodically assesses compliance and monitors risks in all jurisdictions and emerging legislation
The Board and the Risk and Compliance Committee monitor the compliance management system structured on three pillars: (i) build awareness and enable prevention; (ii) deploy sufficient detection and investigation mechanisms; and (iii) implement appropriate response, mitigation and consequence management.
The Group Risk and Compliance Officer has the following responsibilities:
assist the Board of Directors, Risk and Compliance Committee and management in fulfilling their respective risk and compliance responsibilities
establish and maintain ongoing enterprise risk and compliance management practices
build and maintain relationships with those responsible for managing risks throughout the Group
report on incidents and significant risks to the CEO and Risk and Compliance Committee
propose, based on the relevant input from management, changes to the Group's risk appetite
develop and periodically review the Compliance and Risk Management Framework, methodology and operational processes at Group level, seeking to prevent Group exposure to excessive risks
establish the annual Compliance Program and report periodically to the Risk and Compliance Committee, on the risk and compliance management status
advise on the impact of legal and regulatory changes, as well as on emerging best practices and legislative trends
ensure deployment of training and awareness programs for Group personnel, on a risk-based approach, aiming to develop the risk management culture
perform periodical compliance checks seeking to ensure that the implemented processes are aligned to the internal and legal framework, as well as that the appropriate controls are in place to prevent compliance risk from materialising
The Group implemented privacy policies and procedures across the Group, based on a zero tolerance to major information loss or leakage, and these are deployed and monitored by an experienced Data Protection Officer. The Group's approach to privacy includes:
embedding privacy-by-design principle in core processes
embedding data privacy clauses in supplier and customer contracts
providing clear and relevant information to all data subjects regarding their rights and the coordination of processing
making sure that data is processed only for the purpose it has been collected
following the data minimisation principle, as well as the applicable data retention periods
properly protecting personal data from loss or unauthorised access
No breach resulting in a major leakage, loss or unavailability of personal data occurred in 2025.
The Group's policies and procedures are available to all employees in a shared location, promoted on internal communication channels and periodically acknowledged by the Group personnel. Training and awareness programs are regularly organised, at least on an annual basis.
Operational compliance is monitored for all companies in the Group and reported to the Risk and Compliance Committee on a quarterly basis. The Group would disclose in the Annual Report if it were to incur material or repeated regulatory penalties, sanctions or fines for breaches of, or non-compliance with, statutory obligations. On the date of this report, there were no material regulatory penalties, sanctions or fines for breach or non-compliance with statutory obligations imposed on Group companies or any of their Directors or officers.
Considering that the Group operates in many countries, through its activities or commercial campaigns and projects it carries out, and in line with the intention to bring more transparency to business processes and clarity on the split of responsibility, the sponsorship and donations process is formalised in a dedicated policy and the needed controls are adequately embedded. It is part of the Group’s commitment to responsible corporate behaviour to exercise social responsibility through donations and sponsorships wherever it operates. The Group aims to ensure any donation, sponsorship and related funding fully comply with applicable laws, its business ethics principles and conflict of interest avoidance rules, as stated in its Code of Ethics, and cannot be perceived by a third party to be for the purpose of corruption.
To efficiently manage operational risk, fraud risk and financial losses, the Group assesses periodically the way existing and optimised activities, processes and flows are documented, and relevant controls are embedded therein. Where the need, process steps, rules and responsibilities are mapped and documented in detail in dedicated internal policies and procedures which are further on implemented and supported by training and awareness campaigns in focus groups.
As regards ESG material impacts, they maintain an important place in Group risk assessment landscape. According to its approved Risk Appetite Statement, the Group has zero tolerance against the following topics and areas of concern, of relevance also from sustainability perspective: health and safety of Group staff and visitors such as but not limited to risks related to structural integrity of the properties, fire security, serious pollution, fraud and corruption, non-compliance with material regulatory requirements, any failure in being fully compliant with financial reporting standards. Group Risk Appetite and tolerance limits are considered in all risk reviews, partners due diligence, as well as all business decisional processes. Additionally, the Group performs double materiality assessment, aiming to identify the ESG challenges that need to be prioritised, especially in the light of recent developments in reporting requirements and in the consideration of Group strategic objectives. The Group Head of Sustainability acts also as Risk Management and Compliance Partner and supports the Group Risk Management and Compliance Officer in periodical risks review exercises. Detailed double materiality assessment impacts, risks and opportunities are monitored on a granular level by the Group Head of Sustainability, and they have been clustered under several topics for the Group Risk Management umbrella. Among the most relevant risks that have been identified in the sustainability area, and which are monitored and reported to the Risk and Compliance Committee on a quarterly basis, we note the following:
risk of non-compliance with sustainability related legislation and regulations, considering the breach of relevant environmental legislation might trigger financial and reputation loss, sanctions, negative media, damages to third parties
greenwashing risk, considering the risk of not ensuring transparent and correct disclosure, thus causing reputational damage, regulatory and legal repercussions, misleading of investors, financial losses, as well as diverting resources from genuinely sustainable initiatives, hindering real environmental progress
superimposed taxation, considering the risk of non-compliance with relevant environmental legislation, best practices and operations, thus potentially leading to financial and reputation loss, sanctions, negative media, damages to third parties
transition to EPC level A, alignment with the EU Taxonomy, and compliance with EU Directives, considering the risk of not ensuring timely compliance, thus triggering financial and reputation loss, sanctions and higher insurance/credit premiums, or inadequate investment decisions that may also trigger financial loss and penalties
climate change physical risks, where a lack of climate adaptation plans for the Group’s assets may trigger financial and reputational loss, potentially decreasing valuation of the assets, as well as insurance premium increase
Planned Areas of Future Focus for 2026 and onward
Annually, the Risk Management and Compliance Officer performs a risk assessment, to determine the focus areas for the following year and whether there is a need to update the Group internal regulatory framework and refine the Annual Compliance Program.
Considering the instability of the broader geopolitical environment, rising inflation and price pressures across goods and services, ongoing unpredictability in key areas, and the growing need for digitalization and automation to reduce overall risk exposure, the Group will focus on the following priority areas in 2026: strengthening process controls and monitoring, embedding fraud‑risk considerations into audit programs, advancing digitalization initiatives, and enhancing training and awareness activities.
Embedding risk management in strategy and business objectives setting as well as in the execution process, is key to successful and effective enterprise risk management, so this goal remains a top priority for the Group in 2026 and onward. As such, the digitalisation and automation of core processes, accommodating internal controls, segregated roles and action rules, as well as documentation of relevant processes and flows in internal policies and procedures will remain a priority in 2026.
Enhancing information assets governance continues to be a priority also in 2026, aiming to improve overall data management: ownership responsibilities, electronical storage and physical archiving rules, adequate labelling and access controls embedded in business processes, monitoring and continuous improvement, partnership with specialised companies in physical storage management in order to safeguard integrity, security and confidentiality of data and information.
Information technology and cybersecurity have continued to undergo material mitigation in 2025 and will remain a focus in 2026, especially in the following directions: (i) the redesign of shopping centres’ network infrastructure, given the associated risk exposure to financial and reputational losses triggered by potential incidents, data breaches, impact on Group confidential information and individuals’ data, (ii) the implementation of additional tools and features meant to enhance access management policy and to harden existing security defensive environment, as well as (iii) the training and awareness programs intended to increase knowledge and develop detection skills for Group personnel enabling easy identification of unusual conduct targeting to compromise data and information security or integrity.
Increasing risk awareness and encouraging a more proactive instead of reactive risk management culture among Group personnel are always part of the agenda of the Risk Management and Compliance Officer, the Risk and Compliance Committee, and the management team for the next years, as a critical success factor in achieving Group’s strategic and business objectives. Also, resilience and crisis oriented management culture is of particular interest, and employees will be trained to react appropriately when facing a crisis, as this might not only save lives but also increase the efficiency of remedial actions.
Training and awareness programs also remain a priority for Group personnel, with a particular emphasis on areas with higher exposure to risks. In addition, regular awareness campaigns will continue to be carried out for third party partners, including suppliers and clients, to encourage them to raise any legitimate concerns regarding the conduct and interactions of Group personnel. These concerns can be reported confidentially through the Group’s whistleblowing channels.
Key Risk Areas
Unexpected significant developments in the political, economic, financial, regulatory, geopolitical, social or health environments in the jurisdictions where the Group operates, may have an impact on Group’s assets, financial results, distribution policy, development and extension initiatives and investment/divestment approach.
Therefore, Key strategic directions are periodically reassessed, ensuring identified risks are aligned to moving business objectives, while adequately and efficiently addressing potential negative impact on Group’s activities or correctly weighing the potential opportunities.
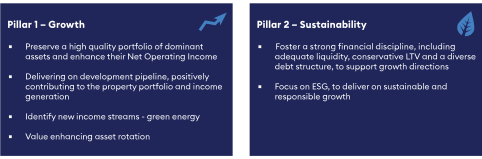
The Group expresses its openness to disclosing relevant information on significant events that could challenge its risk management framework and/or the key mitigating actions, while reasonably preserving information sensitivity and observing confidentiality.
In the risk assessments performed in 2025, the Group focused on the following risk triggers:
macroeconomic pressures. Gas/oil crisis, utilities cost increases, inflation, pricing, unemployment, and shifts in consumer preferences, potentially causing rise in operating costs, squeeze margins, changes in cost structures and strategic planning to maintain profitability and competitiveness
supply chain disruption. Global disruptions affecting resilience, business continuity, and pricing
utilities unavailability. Potential outages leading to business and supply-chain interruption or disruption, financial losses, while challenging resilience and customers’ trust
geopolitical escalation. Heightened and escalating geopolitical tensions can create supply‑chain instability, increase operational and financial risks, and force businesses to manage uncertainty through higher costs, disrupted markets, and the need for rapid strategic adjustments
fraud risk. Elevated exposure to fraud scenarios that may cause increased financial losses, operational disruptions, and reputational damage, while forcing business to strengthen controls, allocating more resources to risk management, and absorbing higher compliance and remediation costs
expansion of international sanctions regimes. The increasing scope and frequency of international sanctions heighten compliance and operational risks, require enhanced due diligence processes, may necessitate supply chain adjustments, and increase exposure to legal, financial, and reputational risks
human rights impacts. Embedding the Human Rights Due Diligence Policy and EU Taxonomy Minimum Safeguards across operations and the value chain strengthens compliance and stakeholder trust, while requiring enhanced oversight and monitoring, processes and governance adjustments
KYC/counterparty integrity (AML/CFT). Enhanced Know‑Your‑Counterparty due diligence, automated risk scoring, and sanctions compliance embedded in processes
operational compliance and regulatory change. Ongoing monitoring of operational compliance, evolving regulatory requirements, and enforcement risk across jurisdictions
Dedicated action planning followed risk assessment initiatives and relevant measures were implemented to mitigate identified risks.
The key risk areas outlined below represent the most significant risk triggers identified and monitored by the Group, together with their associated business impacts, mitigating actions, and expected future trends. This list is not intended to be exhaustive but rather reflects the risks most relevant to the Group’s operating environment. Additional risk factors, while continuously monitored, are not included here either because their likelihood of occurrence is low or their potential impact across the portfolio is not considered material.
Risk description | Business impact | Key mitigating actions | Main stakeholders impacted |
|---|---|---|---|
STRATEGY CLUSTER | |||
Strategic risks arise primarily from the critical decisions taken by executive management in the course of implementing the Group’s business strategy. These decisions must be made within an environment characterised by continuous political, economic, and social change. As such, strategic risks can compromise the Group’s ability to deliver on its business plan and core corporate objectives, and in severe cases may even challenge the Group’s ability to remain a going concern. The Group may encounter challenges in executing its investment and divestment strategy at times when market conditions are most favourable. Unexpected fluctuations in real estate markets, financial markets, or capital markets may disrupt planned transactions. Adverse market movements can negatively affect the value of the Group’s portfolio, its financial position, liquidity levels, operating income, and broader outlook. | |||
Delays in execution of assets rotation strategy | Adverse market conditions, including increased asset supply and constrained capital availability in the investment market, may reduce liquidity and make it more difficult to divest assets at expected values. |
| Shareholders Financing partners |
Macroeconomic risks impacting the operations of the Group | All macroeconomic risks, including those arising from global economic developments and their impact on the Group, remain relevant. Local and regional market conditions continue to be uncertain, which may lead to decreases in demand and collectability issues. |
| Shareholders Financing partners Employees Tenants Suppliers |
Political climate negatively affecting operations/valuations | Political climate risks in the various jurisdictions may lead to uncertainty, and potential delays in executing the Group’s strategy. |
| Shareholders Financing partners Employees Tenants Suppliers |
Comprehensive market risk | Strategic/Systemic risk resulting from:
|
| Shareholders Tenants Local authorities Financing partners |
FINANCE CLUSTER | |||
The Group constantly monitors its exposure to various financial risks, including interest rate volatility, liquidity, foreign exchange rates, and equity markets. Applicable management policies guide these risk management efforts. The Group pays close attention to managing the inherent financial risks of its activity and to the financial instruments it uses. The Group’s policy on credit, liquidity, and market risks, including currency and interest rate, as well as the management of those risks, are disclosed in notes 3 and 5 to the financial statements. The Group is subject to various tax regimes in the countries where it operates. In some jurisdictions, there is an increasing burden from compliance and regulatory requirements, as well as a certain degree of unpredictability, which can lead to lower performance. | |||
Liquidity risk | The Group may not be able to fund its debt maturities, operations, development, and acquisitions pipeline due to: (i) limited access to capital and volatility, resulting in shortage of financing or re-financing at acceptable cost (ii) withdrawing a publicly launched capital raise project, signalling to the investor market and the credit rating agencies that the company has impeded access to capital (iii) significant adverse changes in geopolitical context and macroeconomics, or the Group's performance, leading to rating downgrade, increased cost of finance (iv) negative sentiment in the real estate markets leading to distressed asset transactions that could drive valuations downwards putting pressure on NAV and bank covenants. | (i) Managing access to capital:
(ii) Managing execution risk in capital raise projects, with reputable external advisors (investment banks, legal counsels):
(iii)-(iv) Largely exogeneous root causes, addressed through the risk appetite and the strategic actions taken at point (i) and (ii). | Shareholders Tenants Suppliers Employees Local authorities Financing partners |
Transfer pricing adjustments due to complex cross-border intercompany transactions | Uncertainty arises where two or more governments adopt different interpretations in relation to transfer pricing arrangements and the tax treatment of intragroup, cross border transactions. Complex cross-border structure and business model, with entities located in various jurisdictions, places the Group in an inherent risk situation and increased scrutiny from various local tax authorities. Complex, continuously changing international transfer pricing legislation, without proper transposition in the local laws, resulting in different and subjective interpretations. | Managing the Group structure:
Monitoring the legal framework and the relationship with local tax authorities:
| Shareholders Tenants Suppliers Employees Local authorities Financing partners |
Financial markets volatility | Risk of financial losses due to volatility and adverse developments within the financial markets:
|
| Shareholders Financing partners |
OPERATIONAL CLUSTER | |||
Property development and management activities can entail typical risks, such as insufficient building maintenance leading to a degradation of portfolio, health and safety risks, business continuity improperly managed, budgets overrun, improper tenant relationship management, overreliance on a single third party. | |||
Operational compliance risk | Risk of noncompliance with permits and authorizations legislation (lack of permits/authorizations for commercial centres and/or tenants), inadequate monitoring. Expected increasing regulatory requirements throughout the portfolio. Financial losses, reputational exposure. Risk of closure of commercial centres and/or individual tenants. |
| Shareholders Tenants Local authorities |
Errors in design or construction | Risk of delays or suspension of the construction process. Reputational risk, financial losses. Potential errors in design or construction. |
| Shareholders Tenants Employees Visitors Financing partners Local authorities |
Information security/cybersecurity risk in shopping centres | Risk of decentralised equipment management, old operating systems or no operating system/apps patch management process. Risk arising from exposed or unprotected internet connections that may create open gateways into the Group’s network, potentially enabling data theft or unauthorised encryption, and resulting in financial, reputational, and operational impacts. |
| Shareholders Tenants Suppliers Visitors Employees |
LEGAL, REGULATORY AND COMPLIANCE CLUSTER | |||
As an owner and manager of real estate assets, the Group must comply with relevant laws and regulations in all countries where it operates. Areas such as corporate law, health and safety, environment, building construction and urban planning, commercial licensing, leases and commercial laws, personal data protection are highly regulated across the Group’s portfolio. | |||
Climate change risk and compliance with emerging sustainability regulations, including external reporting requirements | Potential breaches of relevant environmental legislation might trigger financial and reputation loss, sanctions, negative media, damage to third parties. Potential failure to assess climate‑related vulnerabilities and to plan the necessary assets improvement may affect insurance policies and result in assets devaluation. Non-compliance with EU CSRD and EU Taxonomy may result in reputation risk. |
| Shareholders Tenants Suppliers Insurance partners Visitors Local authorities |
Non-compliance with laws and regulations and non-adherence to good governance practices | The Group operates a multi-jurisdictional business model with insourced functions, which results in an increasingly complex legal and regulatory landscape to navigate. This complexity is further heightened by the expansion into the energy sector, a highly regulated industry with specific and evolving compliance requirements. Volatile and adverse legislative changes in the markets where NEPI Rockcastle operates. These combined factors demand heightened focus on regulatory compliance and good governance practices across the organization. |
| Shareholders Financing partners Employees Tenants Suppliers Local authorities |
Non-compliance with EU General Data Protection Regulation, within complex jurisdictions and local specificities | Non-compliance with regulatory requirements could lead to fines, penalties, censures, and reputational damage. |
| Tenants Shareholders Employees Local authorities |
Reputational Risk | Reputation is key to the Group, as a reputation crisis may have a rolling effect on other key risks, such as the ability of the Group to raise capital, the volatility of its share price, the trust of the investors, the rating and consequently its cost of debt. |
| Shareholders Financing partners Employees Tenants Suppliers Local authorities |
The Group declares zero tolerance on most of the risk areas described above, as defined by the Group Risk Appetite Statement, approved by the Board. However, for other specific areas, risk tolerance is set at a very limited or low level.
In 2025, the overall net level of the above mentioned risks is in line with Group Risk Appetite Statement, while continuous and adequate monitoring of relevant trends and associated mitigation measures is ensured under the wider risk management system.
The Group has not faced unexpected or unusual material risks and did not undertake any material risk outside its risk appetite and tolerance levels during 2025.
Remuneration report
The Remuneration report is divided in the following three chapters:
|
Chapter 1: Chairman's background statement
The Remuneration Committee operates under its charter and assists the Board in fulfilling its responsibilities regarding the Group's Remuneration Policy.
The Committee confirms that the 2025 Remuneration Report has been approved and prepared in line with the King Code of Corporate Governance, the JSE Listings Requirements, Dutch law, and the Dutch Corporate Governance Code.
The Report sets out how NEPI Rockcastle's remuneration strategy, policies, and performance indicators align with the Board's vision, the Group's core values, and its business objectives.
Content:
Key principles of remuneration
Internal and external factors influencing remuneration related decisions
Engagement with stakeholders and implementing feedback
Non-Executive Directors Remuneration
Remuneration Committee priorities
Key decisions in 2025
Remuneration Policy review process and the Advisory Vote on Remuneration Policy and Implementation Report
1. Key principles of remuneration
The Group believes that remuneration underpins sustainable growth and reinforces its culture, values, and long-term strategy. It is also a key tool for attracting and retaining high-calibre employees in a competitive global market.
The Remuneration Committee and management ensure that the remuneration strategy:
supports corporate and people strategy and motivates employees to deliver results
is clear, flexible, transparent, fair and consistently applied
is market competitive, balancing pay elements, role requirements, performance and stability
The Group’s Remuneration Policy is:
strategically designed to inspire Executive Directors and employees to strive for the Group’s growth and success. It is applicable to all staff categories, from the Group’s executive, senior and middle management to subject matter experts and non-managerial staff members
structured to support a performance-driven culture in a rapidly changing market – characterised by high turnover, low unemployment, expertise scarcity and increased workforce mobility
built to ensure fair differentiation in reward packages for all staff members, based on role complexity, professional experience, competence and performance achieved
The following key remuneration principles outlined by the Group remain constant, as they competitively position the Group’s policy in the market and serve the business strategy:
Performance-driven pay – The Group’s remuneration framework is shaped by both the employee’s role and performance, as well as the overall performance of the Group. NEPI Rockcastle has established a transparent process for defining measurable short‑ and long‑term objectives through the Objectives and Key Results (OKRs) methodology. This approach reinforces focus on the key business priorities and outcomes that directly impact operational performance and shareholder value.
The implementation of the OKRs methodology involves setting clear, measurable goals (Objectives) and defining specific, quantifiable outcomes (Key Results) to track progress.
The process of setting objectives for the individual Executive Directors and employees is structured around two significant pillars, which guarantee that business targets, together with professional conduct and values are the key elements of robust performance:
Business Objectives: Key Performance Indicators (KPIs) and strategic priorities (with associated OKRs)
Personal Development Objectives: these are set to enhance skills and competencies that can lead to career progression, consolidation of stronger leadership competency at Group level, improvement of productivity and identification of new strengths and abilities
Objectives established at the beginning of the year are monitored progressively, with a mid-year check-in recommended to ensure proper tracking. Although not mandatory, the interim review is valuable for maintaining alignment on targets and ensuring progress towards the business plan. At the end of the calendar year, objectives are assessed against the achieved results.
Competitive pay – The Group is committed to offering competitive remuneration packages to its employees and Executive Directors, and it observes relevant market benchmarks and reward insights. NEPI Rockcastle ensures that remuneration components are market-aligned, between the median and the maximum of the market for top performers.
Total annual pay – Remuneration is defined as a total annual pay package and consists of three main components:
Fixed Pay
Variable Pay: Short-and long-term incentive plans, which can be delivered in both cash and share awards, as per the Group’s incentive plan. The rules of this plan were last approved by shareholders in 2022 (‘the New Incentive Plan Rules’)
Individual and Collective Benefits
Variable pay as a differentiator – The Group’s Remuneration Policy emphasises variable pay structures as enhancers of differentiated total pay in line with performance, seniority and complexity of the role, predetermined objectives, and expected impact on the business. This is measured in terms of results delivered and managerial capabilities to develop, lead and motivate people.
Fair pay – When setting pay levels and packages, the Group aims to achieve internal equality (similar pay for similar roles, levels of complexity and experience) and external fairness (pay determined considering the market levels and dynamics). NEPI Rockcastle is committed to providing fair pay to all employees and pay-related decisions are free from any discriminatory factors such as age, gender, nationality, social status, social, political or religious convictions or any other such elements.
Annual pay review process – Remuneration reviews are conducted each year alongside performance evaluations. Their purpose is to ensure that the remuneration framework supports the business objectives and remains aligned with the performance management approach. The annual review takes into account business results, strategic priorities, individual development and achievements, as well as external factors such as market conditions, remuneration benchmarks, and workforce dynamics.
2. Internal and external factors influencing remuneration related decisions
The Group constantly monitors both internal and external factors that impact its markets, industry and overall business. This vigilance allows the Group to adapt effectively to the changing context and maintain competitiveness.
The NEPI Rockcastle Group operates in highly competitive markets shaped by a wide range of factors.
Macroeconomic volatility
Persistent fluctuations in macroeconomic conditions across CEE continue to shape remuneration frameworks, requiring agile adjustment to maintain competitiveness and sustainabilityAccelerated digitalisation and AI adoption
Rapid technological transformation, particularly the integration of AI, is reshaping workforce capabilities, role design, and performance expectations. Organisations must continuously evolve reward strategies to align with emerging skill needs, support upskilling, and ensure remuneration remains relevant in a technology‑driven environmentChanging workforce turnover patterns
Shifts in employee turnover influence organisational stability, succession planning, and the design of reward packages aligned with retention prioritiesEvolving work models
The rebalancing of hybrid and on‑site work models continues to affect workforce deployment, organisational design, and compensation philosophy. The increased emphasis on physical presence within CEE is reshaping employee expectations and could lead to adjustments in financial and non‑financial reward elementsLabour market competitiveness
Sustained competition for talent requires organisations to strategically position their remuneration offering to attract and retain critical capabilitiesSkill availability constraints
Limited availability of specialised skills across the region continues to drive differentiation in hiring strategies, reward packages, and long‑term workforce planningTransparency and pay equity
Growing expectations around fairness and openness in remuneration practices are accelerating the need for robust governance. The phased rollout of EU Pay Transparency requirements from 2026 is expected to influence pay‑setting practices and decision‑making across the CEE regionGeographical diversity and regulatory complexity
Operating across multiple jurisdictions requires navigating varied cultural, economic, and regulatory frameworks, each affecting labour market behaviour, workforce expectations, and remuneration structures
Geopolitical and political instability
Impact of the Ukraine-Russia conflict
The military conflict continues to create a persistent backdrop of unpredictability across CEE. Several of the Group’s operating countries share borders with Ukraine or Russia, intensifying pressure on workforce stability, employee engagement, and organisational focus. The Group has maintained a strong commitment to employee safety through continuous communication and support initiativesPolitical instability and 2025 election cycles in CEE
Political uncertainty associated with the 2025 elections in Romania and Poland continues to weigh heavily on labour market sentiment. Additional electoral activity in Czechia, Croatia, Hungary and Bulgaria further contributes to regional volatility. The dense electoral calendar limits regulatory predictability and reinforces labour market instability across CEE
Migration-driven workforce pressures
Rising outward migration and talent shortages
The increased migration of both skilled professionals and broader workforce segments to Western Europe and non‑European destinations is driven by stronger job prospects abroad and heightened regional insecurity linked to the Ukraine-Russia conflict. Political volatility in Romania and Poland during the 2025 election cycle further amplifies uncertainty for workers considering long-term prospects, contributing to deeper talent shortages
This trend intensifies pressure on labour costs, recruitment strategies, and workforce planning across the region.
Inflationary dynamics in 2025
Inflation across CEE
Across the EU, inflation continued to ease throughout 2025, although several CEE markets experienced higher and more volatile price pressures than the broader EU trend. Romania, one of the Group’s key geographies, remained among the countries with the highest inflation levels (8.6%) and continued to face elevated price growth during the year. Other operating markets—including Hungary, Slovakia, Lithuania, Croatia, and Poland—also maintained inflation rates above the EU average over the course of 2025
This cross‑market variability reinforces the extent to which inflation remains deeply interlinked with broader regional and macroeconomic dynamics, influencing remuneration decisions, workforce expectations, and the Group’s overall reward strategy.
Through continuous monitoring of reward trends across all its operating markets and systematic benchmarking against external data, NEPI Rockcastle ensures clear visibility over evolving labour market dynamics. This disciplined approach enables the Group to adapt its remuneration practices responsibly and competitively, ensuring alignment with changing economic conditions, regulatory developments, and workforce expectations across the CEE region.
Resource planning and talent scarcity
Workforce availability remains a central internal challenge, driven by tight labour‑market conditions across CEE. Although Group‑level turnover decreased to 11.6% in 2025 (from 14% in 2024), continuous monitoring remains essential. The reduced turnover reflects strong organisational stability and employee satisfaction with the Group’s value proposition and internal environmentEmployee wellbeing
Safeguarding employee wellbeing remained a priority for HR and senior leadership, particularly in the context of continued uncertainty linked to the Ukraine–Russia conflict. A focus on crisis readiness, resilience, and proactive communication supported employee confidence and organisational continuityBusiness continuity, security, health and safety
Throughout 2025, the Group maintained a strong emphasis on operational continuity and the safety of its employees, with reinforced security protocols and health‑and‑safety measures across all locationsPost‑acquisition integration efforts
The integration of the Silesia and Magnolia shopping centres, acquired at the end of 2024, was rolled out across all functions during 2025. This process focused on aligning organisational structures, operational standards and internal procedures to ensure consistency, efficiency, and full adherence to NEPI Rockcastle’s operating modelStrengthening specialist capabilities
In line with the Group’s strategic growth priorities, NEPI Rockcastle continued to build specialised internal capabilities through targeted training programmes, professional conferences, and strategic internal initiatives. This supported the development of expert competencies in areas such as systems and data analytics, renewable energy, asset management, investments, and sustainabilityCEO succession and leadership transition
In 2025, the Group entered a pivotal leadership transition phase following the announcement of the CEO’s end‑of‑mandate. A comprehensive and structured succession process was conducted to ensure continuity, strategic alignment, and organisational stability. Throughout the year, the organisation balanced the successful delivery of business objectives with extensive preparation for leadership handover, change‑management activities, and ongoing engagement with internal and external stakeholders to secure a seamless transition
Despite the challenging external environment and the direct impact of these factors on the Group’s operations, NEPI Rockcastle successfully mitigated their effects and delivered strong performance outcomes.
The Group exceeded its Key Performance Indicator (KPI) targets for the year, reflecting sustained operational resilience and disciplined execution. This solid performance is also mirrored in the outcomes of the Annual Performance Management process.
3. Engagement with stakeholders and implementing feedback
Executive and non-Executive Directors directly engage with investors, discussing economic context, market factors, challenges, the Group’s achievements, results, strategic priorities and remuneration matters. Although not all stakeholders can be reached individually, Directors meet with major shareholders to solicit feedback.
The Chairman of the Board had interactions with shareholders in South Africa in February 2026. This provided an additional opportunity for direct engagement regarding remuneration matters.
As a result of the shareholders’ engagement, alongside the management team's response to shareholders’ feedback on the remuneration report at the May 2025 Annual General Meeting (AGM), 94.34% of shareholders voted positively on the Remuneration Implementation Report and 88.43% on the Remuneration Policy. Considering the positive voting, no formal engagement with shareholders took place post the May 2025 AGM.
The Remuneration Committee actively collaborates with external advisors and reward consultants to stay informed on critical aspects:
NEPI Rockcastle consistently analyses reports issued by external advisors related to the Group's remuneration practices
When necessary, adjustments are implemented based on these insights
Consulting advice is sought for Remuneration Policy presentation and transparency
These engagements provide valuable intelligence on market trends, best practices, and emerging developments
The goal of the Remuneration Committee is to align communication and disclosure practices with market best practice, governance frameworks, and shareholder expectations. This proactive approach ensures that the Group remains well-informed and responsive in its remuneration strategies.
4. Non-Executive Directors remuneration
The most recent adjustment to the remuneration of the non‑Executive Directors (NEDs) became effective on 1 January 2024. The current fee levels reflect the market‑median positioning established through the 2023 benchmarking exercise and took into account the increased complexity and responsibilities associated with the Company’s continued growth and strategic developments.
As part of the 2025 benchmarking review, the Remuneration Committee reassessed NEDs fee competitiveness against a refreshed peer group comprising relevant companies of comparable market capitalisation, ensuring that NEPI Rockcastle is positioned at the market median. Based on the outcomes of this analysis, further evaluations will be conducted during 2026 to determine the needed adjustments to NEDs remuneration.
Any proposed changes will be submitted for shareholder approval at the Annual General Meeting in May 2026, and — subject to a favourable vote — will be reflected in the 2026 Implementation Report.
5. Remuneration Committee priorities
The Remuneration Committee’s ongoing objectives, processes and plans remain attuned to business needs, addressing internal and external factors and meeting stakeholder expectations, including those of employees.
The Remuneration Committee is dedicated to ensuring that NEPI Rockcastle adheres to best practice in remuneration, aligned with sound corporate governance. To achieve this, the Committee focuses its actions and priorities on:
Stability: continuously assess business stability, geopolitical factors (especially the Ukraine-Russia conflict’s impact on the global economy), industry trends, market dynamics, and stakeholder expectations
Competitive plans: maintain competitive Remuneration Policies and Incentive plans that drive strategy implementation and results delivery
Value-driven measures: define performance metrics that enhance stakeholder value
Transparent engagement: engage with stakeholders transparently
Benchmarking: on a need basis, benchmark pay against relevant markets
These efforts ensure NEPI Rockcastle’s commitment to excellence in remuneration practices.
During 2025, the Remuneration Committee focused on several key priorities:
Ensuring fair and competitive compensation for non‑Executive Directors and the top management team, with remuneration levels aligned to their responsibilities, contribution, and the overall performance of the Group
Supporting the management team throughout a challenging market environment, while maintaining adherence to the Group’s established remuneration principles and ensuring consistency, transparency, and alignment with long‑term organisational objectives
Overseeing the effective implementation of the Remuneration Policy and Long‑Term Incentive Plan, ensuring full compliance with Dutch legislation and Corporate Governance requirements, including the review and adoption of the newly issued King V principles, to strengthen governance alignment and remuneration integrity
Managing the CEO succession process and preparing for a seamless leadership transition, including ensuring rigorous execution of the succession roadmap, readiness for the onboarding of the incoming CEO, and the design of a competitive, motivational, and market‑aligned remuneration package to attract and retain top leadership talent
Remuneration Committee's priorities | Approach | 2025 process |
|---|---|---|
1. Group's Remuneration related priorities | ||
Ensure remuneration motivates people for performance while managing the challenging and unstable business environment of 2025 | The Group reviews variable and fixed remuneration annually. Performance of the business and individual professionals is being assessed. Variable pay is linked to KPIs and overall annual individual performance, while the fixed pay is linked to the complexity of the role. | In the context of the strong performance delivered by the Group, budgets have been distributed in line with business results, set at business function level. Allocation of bonuses is agreed based on competencies, meritocracy, complexity of projects and strategic decisions managed within a specific business function. Emphasis is placed on determining performance fairly throughout the performance management process, as this links into variable pay. Decisions about the specific level of bonuses for management levels are taken at top management level (i.e., Directors of business functions), while team leaders are encouraged to assess performance and make relevant recommendations to reflect the contribution of individual team members. Variable remuneration for Executive Directors is determined in line with the Remuneration Policy, KPIs and computation algorithm. |
Ensure the Group's remuneration is aligned to the relevant market and provides internal fairness | The Group frequently consults international independent remuneration consulting firms to ensure a proper understanding of the benchmarks and determine actions to be implemented during the annual remuneration review processes. | The Group is committed to run benchmark analysis bi-annually or annually, should the labour market or the international environment be dynamic or rapidly changing. For staff members, the Group consulted general market reward reports and trends on expected salary growth at industry/country/seniority levels. This is a process undertaken as part of the reward and compensation review, depending on the business and personnel immediate needs and decision-making. |
Ensure transparency of the Group's Remuneration Policy, pay levels, objectives and establish an adequate link between pay and business performance | The principles and details of the Group's Remuneration Policy, including any changes made or anticipated are publicly presented in the Annual Report. Meetings with management teams are held annually within the remuneration and performance review process to outline, explain and clarify decisions and rationale. | The 2025 Annual Report presents an overview of remuneration for both Executive and non-Executive Directors, as well as principles of remuneration across all staff members. Allocation of staff cost budgets was done at business function level, allowing the managers to take more responsibility over the reward review process. Individual discussions with team leaders were held by the HR Director and HR team to clarify:
|
2. Alignment and ethics of pay | ||
Ensure alignment of all staff remuneration principles and pay structures across all countries in which the Group operates | The same remuneration review process is conducted at Group level and in all countries where NEPI Rockcastle is present. The HR Director ensures the roll out of the process is aligned and the same principles are applied across all countries. The Remuneration Committee is informed about the performance and reward review approach. | The HR function is a centralised function which provides HR services across the Group. Determination of specific remuneration at the level of a team is done upon consultation with an HR reward specialist who provides, for each position within the Group, an analysis of the job level, benchmarking against specific functions and geographies and makes recommendations in respect of appropriate pay levels. This process ensures that the same principles of pay are consistently applied across all grades, functions and countries. |
Ensure remuneration is determined without discrimination | The HR Director, as mandated by the executive management and Remuneration Committee ensures through detailed reviews of the reward processes that pay levels are set free from any discrimination based on: gender, age, race, religion, nationality, social status, social, political or religious convictions, or any other such elements. | Fixed remuneration is determined based on role, responsibilities, level of competence and experience, while variable remuneration is determined based on performance, impact and contribution. No consideration is given during the hiring, or reward review process, to any other factor that could lead to discrimination, such as gender, age, race, religion, nationality, social status, social, political or religious convictions, or any other such elements. The Remuneration Committee is also reviewing the principles, mechanisms and implementation of rewards, to ensure that only role and performance elements are considered in reward determining decisions. The HR department monitors relative pay of staff to ensure fairness and ethical pay principles are observed. |
3. Shareholders' engagement and Corporate Governance | ||
Ensure shareholders' feedback is considered and discussed | Regular meetings are held with shareholders upon presentation of financial results, where questions are addressed by Executive and non-Executive Directors that cover the entire range of topics, including remuneration. The Remuneration Committee maintains contact with shareholders and discusses feedback with the Board after voting at the Annual General Meeting of Shareholders. The Chairman of the Board also engaged in discussions and feedback on remuneration related matters with major shareholders during February 2026. | |
Comply with King Code of Corporate Governance requirements, Dutch Corporate Governance Code and other relevant corporate governance frameworks | The Board is actively promoting and encouraging management to continuously improve Corporate Governance and alignment with relevant corporate governance frameworks. | |
6. Key decisions in 2025
Area | Group’s decision |
|---|---|
Staff remuneration | |
Fixed pay | The 2025 pay review has been finalised. The salaries adjustments are applied on a selected basis, based on a need and opportunity analysis, and have been determined to:
|
Salary and bonus pool | Staff cost budgets were set at business function level, derived from the Group level budget – to allow for more flexibility and accountability over remuneration-related decisions. The HR reward function, heads of functions and CEO supervise the consistent application of remuneration principles across the business. Variable pay decisions are calibrated at Group level with the functional leaders, CEO and HR Director, ensuring consistent application of reward principles. |
Executive Directors' Remuneration | |
Fixed pay | 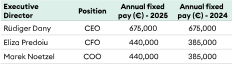 |
Variable pay – | The KPI structure, composition and weighting spread the performance measurement over various aspects of the business and are aimed to reward and reflect role’s specificity by:
The percentage allocated for strategic priorities was maintained at 15% as in the previous year. |
Area | Group’s decision |
|---|---|
Variable pay – Short-Term Incentive Weights and structure 2025 - 2024 | 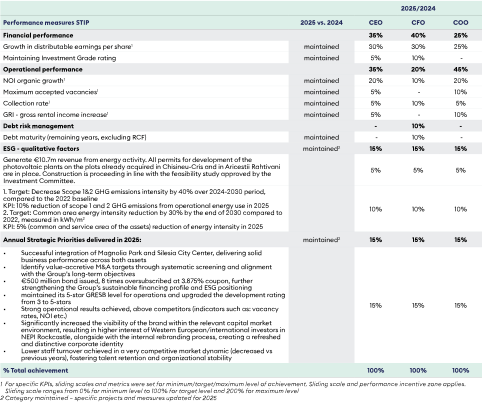 |
Variable Pay – Long-Term incentive (LTIP) Determination of quantum of LTIP | The LTIP determination was based on the calculation of 3-years Compound Annual Growth Rate (CAGR), with no adjustment being made to the existing mechanism. The peer group is disclosed under quantum of LTIP Report section - this has been reviewed and approved by the Remuneration Committee. No loans were granted to either Executive Directors or staff members. |
7. Remuneration Policy review process and the Advisory Vote on Remuneration Policy and Implementation Report
The Remuneration Policy received a 95.95% binding positive vote during the November 2022 Extraordinary General Meeting. As per Dutch legislation, the Remuneration Policy will undergo a review and the Company will seek shareholders’ approval in 2026 (every four years).
At the Annual General Meeting, the Remuneration Policy will be presented for a binding vote according to Dutch law and the Remuneration Implementation Report will be presented for an advisory (non-binding) vote, in line with the JSE Listings Requirements.
NEPI Rockcastle extends an invitation to shareholders to engage with executive management and the Remuneration Committee before the upcoming Annual General Meeting. Any concerns regarding the Implementation Report or the need for clarification on remuneration practices can be addressed during this engagement. Directors remain committed to addressing legitimate objections and concerns.
The Remuneration Committee carefully reviews and ensures that the Remuneration Policy is aligned with the business strategy and supports the creation of sustainable value while balancing the interests of shareholders and other stakeholders.
Andries de Lange
Remuneration Committee Chairman
Chapter 2: Remuneration Policy
Scope
The Remuneration Policy is centered on the Group’s mission, long-term value creation and business continuity, with a keen focus on stakeholder interests.
Key principles drive NEPI Rockcastle’s remuneration strategy:
Value creation by teams:
Acknowledging individual and collective achievements
Developing top professionals, fostering innovation, and acquiring new skills
Ensuring team stability by retaining skilled key professionals
Principles guiding the policy:
Performance-driven pay: rewarding results and contributions
Competitive pay: aligning pay with market standards, business complexity and relative size
Total annual package: considering all components of compensation
Variable pay: tying incentives to performance
Fair pay: ensuring equity and transparency
Annual pay review: regularly assessing and adjusting compensation
To evaluate the effectiveness and ensure sustainability of both the remuneration strategy and underlying principles, the Group adheres to specific fundamentals of implementation:
Clarity - the Group’s Remuneration Policy, frameworks, and mechanics prioritise transparency and clarity through effective communication with shareholders and human capital
Simplicity - the remuneration structure rests on straightforward pillars: fixed pay, benefits, and variable short-and long-term compensation. Determination of variable pay is linked to individual performance (via annual performance reviews) and Group performance (publicly disclosed, with detailed shareholder discussions)
Risk Management - the Remuneration Policy and associated processes proactively address risks of excessive pay or underpay through key controls that include:
Validation and equity: The Remuneration Policy undergoes validation during review or hiring, considering internal equity, market data, and social consensus
Executive Directors’ pay: market benchmarking ensures alignment with market standards. Stakeholder involvement is also considered
Internal pay ratios: Ongoing analysis monitors pay progression and any identified anomalies are discussed internally
Variable pay and performance: Variable pay is performance‑driven and remuneration reviews follow performance evaluations to ensure consistency
Group-level calibration: Performance results are calibrated at the Group level for consistency across roles, impact, and seniority
Annual reward reviews: Variable pay awards are discussed annually within the Remuneration Committee, involving the HR Director and CEO
Strategic alignment: Individual KPIs and objectives align with business KPIs and strategic direction
Ethical considerations: Performance reviews include 360-degree feedback, emphasising behaviours, values, and ethics. Unethical behaviour is addressed before awarding variable pay
ESG integration: Environmental, Social and Governance (ESG) components are embedded in performance reviews for Executive Directors and senior management
Predictability - the Group’s Remuneration Policy and implementation mechanisms prioritise predictability. Total awards are influenced by market trends, internal pay decisions and the link to individual performance and roles and the Group’s performance. Sliding scales for Executive Directors’ core KPIs enhance predictability of maximum variable payouts
Proportionality - the Remuneration Policy emphasises linking individual awards to strategy delivery and long-term Company performance
Avoiding poor performance rewards - specific elements prevent rewarding poor performance:
Bonus pools activate at specific achievement rates, subject to the Group’s management and Remuneration Committee approval
Policy rules exclude rewards for below-expectations performance and enforce consequence management
Alignment to culture - The Group’s core values shape behaviour and drive performance. The remuneration philosophy aligns with these values:
Integrity: fair and transparent pay
Excellence: linking pay to performance
Innovation: adapting to market dynamics
Collaboration: engaging stakeholders in remuneration practices
Philosophy | The Group’s Remuneration Policy is designed to achieve several key objectives:
| ||||
|---|---|---|---|---|---|
Principles | Pay for performance | Total annual package approach | Annual remuneration reviews | Competitive and fair pay | Differentiated variable pay |
Details | Remuneration is driven by the employees' role and performance review, and the overall performance of the Group. Clear, measurable goals are set for the Group, teams and individual employees. | Remuneration is defined as a total annual package, consisting of fixed pay, variable pay (which can be delivered in cash and/or shares), and individual and collective benefits. | Remuneration reviews are held annually, with the purpose of assessing performance for the past year and defining remuneration packages (performance bonuses, new levels of fixed pay and benefits). | The Group is committed to paying fixed salaries at market level (compared to companies of similar size and complexity), and variable components above market level for high-performing employees. Annual inflation reviews ensure salary levels remain competitive. | The Group has a differentiated variable pay method, based on role, seniority and performance levels. |
Values | | ||||
Implementation and governance
In accordance with the formal corporate structure, the Remuneration Committee assumes a critical role in overseeing the Remuneration Policy and its implementation and plays a critical role in ensuring equitable compensation practices and transparency within the organisation.
Committee responsibility: the Remuneration Committee is entrusted with ensuring that the Remuneration Policy aligns with legal requirements. Their duty extends to proposing the establishment or modification of the policy, which is subsequently presented for approval at the Annual General Meeting
Director compensation: The Remuneration Committee manages the pay of all Directors (Executive and non‑Executive) and submits proposed packages to the Board for approval
Voting mechanisms:
Mandatory vote: as stipulated by Dutch law, the Remuneration Policy undergoes a mandatory vote at least once every four years. The next such vote is scheduled for 2026
Advisory vote: The Remuneration Implementation Report is subject to a non-binding advisory vote annually during the Annual General Meeting in accordance with the JSE Listings Requirements. The upcoming vote will occur in 2026
Transparency: The Remuneration Report, an integral part of the Group’s Annual Report, provides full disclosure of the compensation for both Executive and non-Executive Directors. This encompasses all awards, whether directly paid to the executives or to service companies under their control, as well as fees paid to non-Executive Directors
Remuneration design
Pillar | Description | Purpose and link to strategy |
|---|---|---|
Fixed pay All staff including Executive Directors | Fixed pay is determined by role and responsibilities, complexity, experience, competence, qualifications and expertise. The median of the relevant market is used as a reference point for determining the level of fixed pay. Adjustments can be made for specific circumstances, achievements, promotions and responsibilities. Reviewed annually to ensure internal and external equity, correlation to role and responsibilities (especially in case of role change or competence/ qualifications uplift). | The Group aims to remain the dominant commercial real estate investor and operator in Central and Eastern Europe. Hence, its teams should comprise top professionals: qualified, experienced, competent, and motivated. The Group's target is to attract, motivate and reward specific skillsets needed, especially considering a competitive labour market with high scarcity of property and commercial real estate skills and qualifications. |
Short-term incentive plan (STIP) All staff including Executive Directors | Variable pay delivered for achievements against short–term objectives set in advance. Variable pay relates to the employees' role. The more senior an employee is, the more they can impact the Group's results; hence the higher proportion of variable pay in their annual package. Under-delivering against objectives leads to no variable pay. Categories of seniority used for staff STIP are: non-managerial, middle/senior management, subject matter experts and Executive Directors. STIP total variable pay is subject to achievement of business targets and budgets, ensuring that employees are rewarded according to the Company’s success and financial performance. | NEPI Rockcastle aims to remain among the best performing retail real estate companies in CEE. Variable pay is designed to incentivise individual contribution to business results. The stronger the performance, the higher the variable pay. |
Long-term incentive plan (LTIP) Executive Directors and key staff Share awards | Annual share awards made to participants based on the Group's performance over a three-year internal KPI (CAGR) and the relative performance of the Group (external, TSR). Quantum of allocation is determined as a percentage of annual fixed pay. Vesting period of three years for Executive Directors (cliff vesting at the end of the 3-year period) and for key staff (tranche vesting over 3 years). For Executive Directors there is a mandatory lock-up period (sales restriction) for an extra 2-year period after vesting, resulting in a total lock-up for 5 years from the date the award is allocated. Although the LTIP is primarily settled through shares as per the above, the NEPI Rockcastle Incentive Plan can allow for LTIP to be settled in cash. For further details please refer to the ‘Rules of the NEPI Rockcastle N.V. Incentive Plan’ as approved and published by the Group. | NEPI Rockcastle aims to drive achievement of strategic priorities and keep senior management and Executive Directors focused on long-term value creation. The Group's long-term interests should be aligned with those of senior management and Executive Directors. A medium- to long-term retention of key professionals is essential to the business. |
Benefits All staff | Medical services based on subscription or medical insurance, the cost of which is partially or fully covered by the Group. Meal allowance/vouchers as per local legislation. Access to sports facilities – cost of subscription partially covered by the Group. Other wellbeing benefits, including work flexibility and hybrid work. | Healthy and motivated employees are more efficient and deliver stronger results. Ensuring team stability is crucial, and the Group plays a key role in promoting lifestyle-related habits to support overall wellbeing. By fostering a healthy work environment, the Group can enhance employee performance and contribute to long-term success. |
Each element of remuneration is described in more detail below. All Executive Directors are entitled to participate in the Group's long-term and short-term incentive plan.
Ratio between fixed and variable pay for Executive Directors
The remuneration structure for Executive Directors is carefully designed to cultivate alignment between management and shareholders in both the short- and long-term. It emphasises performance-driven outcomes and its balanced approach ensures a dynamic and motivating compensation framework.
For performance delivered in line with internally set targets, the fixed pay accounts for approximately 30% of the total compensation at target level, while variable pay (STIP and LTIP) accounts for approximately 70% of the total compensation at target level.
Fixed pay
The Group’s approach to fixed pay balances market alignment, performance, internal and external equity considerations.
The strategic approach is to align the fixed pay for both employees and Executive Directors with the market median. Additionally, for specific critical roles, the aim is to position compensation above the median, reaching up to the 75th percentile. These specific roles are identified by assessing factors such as impact on the NEPI Rockcastle’s business and operations, market scarcity, turnover trends, and the unique nature of the roles.
Benchmarking
To determine appropriate and market-competitive remuneration levels, the Group conducts benchmarks against relevant markets. The Group is committed to consulting market benchmarks on a need basis to ensure external equity. For this purpose, NEPI Rockcastle engages international reward consultants with expertise in relevant industries and markets.
Annual Review:
Remuneration is reviewed annually to validate both internal and external equity. Any necessary adjustments are made based on this assessment
The Group’s policy emphasises the significance of achievements and performance in determining competitive pay. Consequently, salary increases are considered in specific scenarios:
Change of role and responsibilities (e.g. promotions)
External equity: addressing significant gaps compared to relevant market benchmarks
Internal equity: ensuring similar pay for similar roles in comparable geographies
Labour and pay market dynamics: responding to significant shifts in the market
Variable pay – Short-Term Incentive Plan (STIP), awarded in accordance with the NEPI Rockcastle’s Incentive Plan.
The STIP also considers the Company’s performance relative to the bonus pool level and availability:
Financial performance: metrics such as growth in distributable earnings per share and investment grade rating
Operational performance: factors such as growth in Net Operating Income (NOI), accepted vacancies, collection rate, and gross rental income increase
Debt risk management: considerations related to debt maturity
Qualitative factors: these include ESG (Environmental, Social, and Governance) strategy-related measures and successful execution of energy-photovoltaic projects
Annual strategic priorities: alignment with the organisation’s strategic directions
STIP for employees - for employees, the STIP is determined as a proportion of their annual fixed pay. Several factors are considered:
Role: the employee’s role influences the target bonus rate - this varies based on whether they hold non-managerial, middle management/subject matter expert, or senior management positions
Individual performance: each employee receives an individual performance rating during the annual evaluation process, typically on a scale of 1 to 5
STIP for Executive Directors - the STIP is determined through a clear, measurable algorithm. This algorithm leads to a coefficient that is applied to the individual annual fixed pay. The algorithm incorporates measures aligned with business KPIs, categorised as follows:
Weight distribution performance measures (KPIs) Executive Directors:
Performance measures STIP | Weight | ||
|---|---|---|---|
CEO | CFO | COO | |
Financial performance | 35% | 40% | 25% |
Operational performance | 35% | 20% | 45% |
Debt risk management | - | 10% | - |
ESG - Qualitative factors | 15% | 15% | 15% |
Annual Strategic Priorities | 15% | 15% | 15% |
Total | 100% | 100% | 100% |
Correlation of Performance and STIP
The performance measures (KPIs) are established for a 12-month financial period. The achievement rate of the performance measures is calculated based on the specific weights agreed upon for each individual performance measure.
The financial and operational KPIs are set in alignment with published guidance and internal budgets. A sliding scale is applicable for the financial and operational performance measures (KPIs) that have the potential to significantly impact distributable earnings and the Group’s overall performance, such as growth in distributable earnings per share, net operating income, maximum accepted vacancies, collection rate and gross rental income increase. This sliding scale ranges from 50% of the allocated weight for achieving the minimum performance level to 100% of the allocated weight for achieving the target performance level and 200% of the allocated weight for achieving the maximum performance level.
The Remuneration Committee assesses the completion of the Annual Strategic Priorities on a discretionary basis, considering the specific market and economical circumstances and in light of the impact of those projects over the business on short and long-term. This approach also allows the Remuneration Committee to incentivise executive management to focus on specific projects or initiatives when external or internal factors impact financial and operational results, necessitating counterbalancing actions.
STIP payout level for the Executive Directors varies from 100% of the annual fixed pay at target level performance to a maximum of 170% of the annual fixed pay for extraordinary performance as determined by the Remuneration Committee based on business circumstances.
Threshold level for STIP payout - If the cumulative achievement of STIP KPIs falls below the 75% threshold level, the STIP award is capped at the equivalent of the Annual Strategic Priorities percentage, as specified in the STIP KPIs table.
In summary, the STIP ensures that both employees and Executive Directors are incentivised based on performance, strategic priorities and business success.
Review and Adaptation - Specific KPIs within the above performance categories and their weights are reviewed annually. Adjustments may be made to better reflect the unique roles of Executive Directors or the business key focus areas.
Variable pay – Long-Term Incentive Plan (LTIP) awards are granted to Executive Directors and key staff in accordance with the NEPI Rockcastle’s Incentive Plan. Eligible employees and Executive Directors receive an allocation of restricted shares, which vest as follows:
Vesting for the key employees: the shares vest in tranches over a three-year period
Vesting for Executive Directors: the shares fully vest at the end of a three-year period, with the vested shares remaining subject to a lock-up period of two additional years, resulting in a total of five years from allocation before the shares can be freely traded
The LTIP Award determination
For key staff, the award allocation amount is determined based on a combination of the employee’s fixed pay and STIP, considering individual overall annual performance, the complexity of the role and the business impact.
Executive Directors’ LTIP award allocation depends on the achievement of both internal and external performance measures:
The internal performance measure is determined by assessing the Compound Annual Growth Rate (CAGR) over a three-year period of distributable earnings per share relative to an indexation-linked benchmark. The resulting percentage is then multiplied by an internal hurdle factor of 20
Threshold level for vesting: the CAGR over a three-year period, must exceed indexation + 1%. Failure to meet this criterion results in no award for this KPI
The external performance measure is determined by comparing the Total Shareholder Return (TSR) to a relevant peer group approved by the Remuneration Committee. The relative TSR performance is calculated as follows:
If the Group’s TSR performance falls within the top quartile of the peer group, the TSR component of the LTIP award is equal to 50% of the annual fixed pay
If the Group’s TSR performance falls within the second quartile of the peer group, the TSR component of the LTIP award is equal to 25% of the annual fixed pay
If the Group’s TSR performance falls within the bottom two quartiles of the peer group, the TSR component of the LTIP award is zero
As part of the framework, a maximum remuneration is designed for extraordinary performance. The Remuneration Committee determines this based on business circumstances.
For LTIP awards, the maximum award allocation is capped at 270% of the annual fixed pay.
The LTIP determination for Executive Directors’ performance is approved by the Remuneration Committee and is settled through share awards without any attached loans.
The LTIP allocation process is finalised between February and March each year, following the completion of the performance review for the previous financial year. Additionally, other LTIP allocations may occur based on factors such as employment, promotion, or retention as part of a remuneration package.
Clawback provisions
According to the Remuneration Policy and the NEPI Rockcastle’s Incentive Plan approved and published by the Group, clawback provisions apply to STIP and LTIP awards granted to key staff and Executive Directors. These provisions allow for the recoupment of all or part of any awards under the STIP or LTIP (or their value), including distributions received on award shares, in specific circumstances:
Gross misconduct, gross negligence, or material error: if any of these events occur or are discovered within 2 years of the allocation of an STIP award or the vesting of LTIP award shares, the clawback provisions apply
Decision-making authority:
Executive awards: the Board decides on clawbacks for Executive awards
Key staff: Executives are responsible for clawbacks related to Key staff
Clawback event identification:
Unvested LTIP shares: if a participant’s contract ends, unvested LTIP shares will be forfeited and lapse immediately
Shares or cash repayment: participants must return to the Company a number of shares equivalent to the total allocated award, including corresponding amounts received as distributions, either in cash or equivalent shares
Method combination: the Board or Executives may use a mix of these methods as deemed suitable
External factors: new laws, regulations, or social developments may impact the eligibility for awards
These provisions ensure accountability and align with responsible corporate governance practices.
Change of controls policy
In line with the principles of King Code of Corporate Governance, the Group maintains a transparent approach to governance and executive remuneration. NEPI Rockcastle does not operate a specific Change of Control policy and does not have predefined processes or automatic triggers linked to a potential change in ownership or control. Any such event would be assessed by the Board on a case‑by‑case basis, ensuring decisions are made responsibly, in the best interests of shareholders, and consistent with the Group’s broader governance framework.
Internal pay ratio
When determining the remuneration of Executive Directors, in accordance with the Dutch Corporate Governance Code, the Remuneration Committee takes into account the progression of the internal pay ratio between the pay of the CEO and the average employee pay computed as total personnel costs reported in the financial statements as 'Staff cost' divided by the average headcount.
The Company aims to ensure alignment with the principles outlined in the Remuneration Policy.
This involves reasonably weighing the position and responsibilities of managing a listed company against reward levels. The goal is to achieve a reasonable remuneration and employment conditions.
Pay ratios in relevant markets where the Group has teams and operates business and asset portfolios are reviewed. The methodology and the relevant ratios are transparently reported annually in the Implementation Report.
Loans and guarantees
The Group does not provide loans or guarantees to Executive Directors other than loans granted under the historical share purchase schemes.
Termination of employment
Section | Provision |
|---|---|
Notice period |
|
Change of control payments |
|
Termination of employment guidelines | The employment contract may be terminated as follows:
Payments: Fixed Pay and Benefits:
Short-Term Incentive Plan (STIP):
Long-Term Incentive Plan:
Severance Pay:
|
Executive Directors’ agreements
The remuneration of the Executive Directors is determined by the terms outlined in their services or employment agreements with the Group or its subsidiaries. These agreements are typically indefinite and comply with applicable laws.
The service agreement also includes terms related to an agreement between the Group or a subsidiary and the service company controlled by the Executive Director.
These terms are intended to be consistent with the Remuneration Policy. In case of any inconsistency between the services or employment agreement and the Remuneration Policy, the terms of the agreement will prevail.
The Executive Directors’ service or employment agreements do not include provisions for pensions or other benefits beyond what is specified in this Remuneration Policy. The Remuneration Committee has the authority to provide any additional pensions or benefits to the Executive Directors and will disclose any such decision in the Implementation Report on an annual basis.
Non-Executive remuneration
The non-Executive Directors receive an annual fee in their capacity as members of the Board of Directors and committees, as approved by shareholders at the Annual General Meeting. Any increases in the non-Executive Directors' fees are proposed by the Board to be approved by shareholders at the Annual General Meeting.
In addition to the annual fees, the Group covers or reimburses travel, accommodation, and logistics costs incurred by the non-Executive Directors in relation to the performance of their duties.
The non-Executive Directors are not eligible to participate in the STIP and/or LTIP nor does the Group provide loans or guarantees to non-Executive Directors.
In order to determine appropriate fee levels for the non-Executive Directors, the Group conducts a benchmark with an industry specific peer group. The Group is committed to consulting market benchmarks to ensure external equity. For this purpose, NEPI Rockcastle engages top-tier reward consultants with expertise in relevant industries and markets.
The strategic approach is to align the fixed annual fees for the non-Executive Directors with the market median.
Chapter 3: Implementation report
Executive Directors' remuneration
Fixed pay
The Chief Executive Officer's annual fixed salary remained unchanged compared to the previous year. The Chief Financial Officer and Chief Operating Officer each were subject to a salary adjustment in 2025, reflecting market alignment and role contribution. The overall compensation structure remains unchanged, reflecting the Company’s commitment to stability and alignment with its long‑term business objectives.
Variable Pay
The variable pay components linked to the 2025 results (STIP and LTIP) were determined based on performance criteria that are closely aligned with the Group’s strategic priorities and have a direct impact on the Group’s financial and operational performance.
The Remuneration Committee reviewed these criteria, considering the preliminary assessed performance. After calculating the final results, the Committee validated the variable pay components during the Remuneration Committee meeting held on 11 February 2026, based on the actual performance for the year.
1. 2025 STIP AWARD DETERMINATION The 2025 STIP KPIs have been structured in three main categories: |

Quantitative KPIs (Financial and Operational performance and Debt Management)
The quantitative KPIs are designed to link performance within operations (such as NOI Organic Growth, Vacancy, Collection rate and Gross Rental Income) and financing (including Liquidity and Debt Risk Profile) to the investment profile and distributable earnings for shareholders. The sliding scales apply to specific KPIs that have the potential to significantly impact distributable earnings and the Group’s overall performance
The financial and operational KPIs have been set in alignment with published guidance and internal budgets. The chosen levels for financial metrics reflect the ambition to maximise growth potential, building on the growth achieved during 2025
The 2025 targets represent a normalised growth pace. These targets reflect a stabilised business, returning to solid operational and financial results
Qualitative KPIs
The decision to introduce ESG qualitative KPIs in remuneration aims to focus the executive management on several critical aspects:
Defining a robust Sustainability Strategy that aligns with the Group’s long-term goals
Monitoring progress against Sustainability Agencies’ ratings and adopting relevant methodologies
Continue implementing strategic ESG projects, such as the successful installation of photovoltaic plants across the Romanian portfolio
Driving the development of the Renewable Energy business as a key driver of further growth and further efficiencies across the Group's assets portfolio
Annual Strategic Priorities
The Annual Strategic Priorities play a crucial role in the performance delivered each year and in the long-term achievement of goals and alignment with stakeholders’ interest. These priorities focus on critical projects related to the overall Group’s performance and strategy implementation. The 15% allocation for Strategic Priorities provides flexibility and it allows the Remuneration Committee to incentivise the executive management to focus on specific projects or initiatives when external or internal factors impact financial and operational results, necessitating counterbalancing actions.
In 2025, the strategic priorities covered:
Business strategy and growth
Successful integration of Magnolia Park and Silesia City Center, delivering solid business performance across both assets. The successful integration of Magnolia Park and Silesia City Center has strengthened the Group’s operational platform, with both assets delivering solid business performance following their transition. The alignment of processes, teams, and commercial strategies has supported stable operations and contributed positively to overall portfolio results
Identify value-accretive M&A targets through systematic screening and alignment with the Group’s long-term objectives
A €500 million bond was successfully issued, achieving eight‑times oversubscription at 3.875% coupon for 8 years maturity, further strengthening the Group’s sustainable financing profile and ESG positioning
The Group maintained its 5-star GRESB level for operations and upgraded the development rating from 3 to 5-stars. This indicates strong commitment to sustainability, responsible management practices and a continuous improvement approach, while positioning the Group among the top performers in the sector
The Group delivered very good operational results, outperforming competitors across key indicators such as vacancy rates, NOI, and other operational KPIs. This solid performance has significantly enhanced the Group’s market visibility and reinforced its positioning as a leading operator in its sector
NEPI Rockcastle's profile in capital markets strengthened considerably during the year, attracting growing interest from international investors. This was supported by positive external recognition and active engagement at investor meetings and major conferences and events across Europe. In parallel, the Group completed an internal rebranding exercise, delivering a refreshed corporate identity that enhances market recognition across all communication channels. Collectively, these efforts deepened the Company's engagement with the global investor community
The Company achieved a lower staff turnover rate despite operating in an increasingly competitive labour market, where attracting and retaining skilled talent continues to be a challenge for many employers. This improvement - marking a clear decrease compared to previous years - reflects the effectiveness of the Group’s ongoing focus on talent retention, employee engagement and the creation of a supportive and stable work environment. By strengthening development opportunities, enhancing internal communication and reinforcing organisational culture, the Company has fostered greater employee commitment and continuity. As a result, organisational stability has been strengthened, enabling stronger collaboration, improved knowledge retention and sustained performance across teams
For 2025, the Remuneration Committee has confirmed that the respective 15% allocated to Strategic Priorities is awarded in full.
The overview of STIP measures, targets and results for 2025 are included in the below table illustrating the detailed calculation and outcome of the STIP 2025 for Executive Directors:
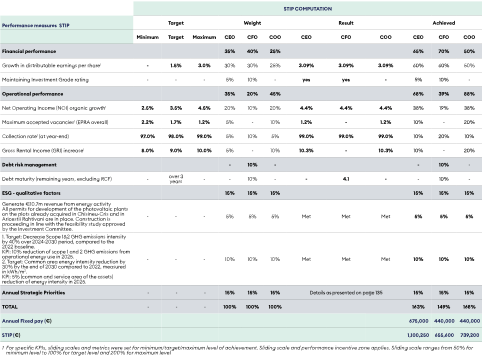
Payout - KPIs with a sliding scale applied | Minimum | Target | Maximum |
|---|---|---|---|
Growth in distributable earnings per share | 50% | 100% | 200% |
NOI organic growth | 50% | 100% | 200% |
Maximum accepted vacancies | 50% | 100% | 200% |
Collection rate | 50% | 100% | 200% |
GRI - gross rental income increase | 50% | 100% | 200% |
Assessment of the STIP KPIs resulted in an overall achievement rate for the individual Executive Directors between 149%-168% of a maximum of 170%.
The majority of the KPIs have been achieved at target up to maximum levels and sliding scales have been applied.
2. 2025 LTIP AWARD DETERMINATION |
The LTIP award determination is based on two measures: an external performance measure, and an internal performance measure, as described below:
External performance measure – Total Shareholder Return (TSR) comparison to a peer group
The TSR is a significant and relevant benchmark for assessing shareholders’ performance in relation to the market. While TSR is not directly tied to the individual performance of Executive Directors and the management team, it is heavily influenced by various market conditions. By incorporating TSR as an LTIP target, the Remuneration Committee aims to align award levels with the performance achieved compared to the peer group.
LTIP award on the TSR performance is based on the following principles:
No award derived from the TSR component of LTIP if the Group’s relative TSR performance falls within the bottom two quartiles of the peer group
25% of fixed pay award derived from the TSR component if the Group’s relative TSR performance falls within the second quartile of the peer group
50% of fixed pay award derived from the TSR component if the relative TSR performance falls within the top quartile of the peer group
The external measure is assessed based on the TSR of NEPI Rockcastle in comparison to relevant peers.
The list of peers included for the TSR comparison under the LTIP external performance measure, has been reviewed and approved by the Remuneration Committee. The Remuneration Committee periodically reviews the composition of the peer group to ensure it remains appropriate and reflective of relevant market comparators. In particular, the Committee seeks to ensure that the peer group is free from major distortions or anomalous share price movements that could skew relative TSR comparisons and undermine the integrity of the benchmarking exercise. At the same time, the Committee continuously assesses whether other companies have become eligible or suitable for inclusion in the peer group, having regard to factors such as growth trajectory, regional positioning, sector alignment, geographic focus and portfolio composition.
Following this review, two changes were made to the peer group composition for 2025:
Removal of Citycon: During the review period, Citycon's TSR was materially impacted by a corporate event, namely the launch of a mandatory bid by its majority shareholder to acquire its shares. The Remuneration Committee determined that the distortive effect of this corporate event on Citycon's TSR rendered it an unsuitable comparator for the purposes of the relative TSR assessment
Addition of GTC: a Central and Eastern Europe focused real estate company with a diversified portfolio, making it a relevant and comparable peer given NEPI Rockcastle's strategic positioning as the dominant commercial real estate investor and operator in the CEE region
The updated industry-specific peer group, as approved by the Remuneration Committee, alongside the positioning within Quartiles is presented in the table below:
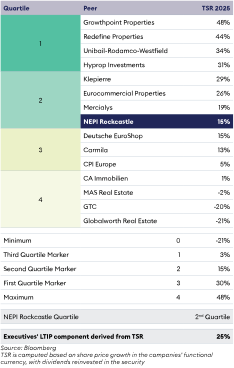
The internal performance measure is the Compound Annual Growth Rate (CAGR) of distributable earnings per share relative to an indexation-linked benchmark. The CAGR over a three-year period, must exceed indexation + 1%. The result, as a percentage, is multiplied by an internal hurdle factor of 20. This results in the following calculation:
[CAGR in distribution per share – (Indexation+1%)] * internal hurdle of 20
3-year CAGR in distribution per share (period 2022 - 2025): 5.95%
Indexation: 2.2%+ 1%=3.2%
Internal hurdle factor is 20
Overall achievement: 80.1%
The CAGR plays a pivotal role in determining the LTIP award. It directly considers the growth rate over consecutive years, aligning the interests of Executive Directors with shareholders and the Company's performance.
LTIP Computation | |
Assuming CAGR relative to 2022 | |
Indicator | 2025 |
|---|---|
CAGR | 5.95% |
Indexation + 1% | 3.2% |
2.75% | |
Internal hurdle | 20 |
TSR 2 | 25% |
Total LTIP | 80.1% |
The LTIP award for 2025, based on the above calculation, has reached 80.1% as per the Group’s Incentive scheme. This result was calculated by assuming CAGR relative to 2022.
The LTIP outcome corresponding to the 2025 performance:
Executive | LTIP (number of granted shares) | LTIP (€ thousand equivalent)1 |
|---|---|---|
Eliza Predoiu | 45,713 | 352,319 |
Marek Noetzel | 45,713 | 352,319 |
- The LTIP has been approved on 11 February 2026 (date of the Remuneration Committee meeting and the award determination date)
No LTIP is allocated for the Chief Executive Director. Upon the conclusion of the CEO's mandate on 31 March 2026, the Remuneration Committee approved a one-off reward of €700,000 supplementary to the performance-related remuneration for the year 2025, as recognition of his significant contribution to the Group's strategic and operational performance.
LTIP award price determination
The share price for the LTIP awards related to 2025 performance is €7.70722 and has been determined as 30-days Volume Weighted Average Price (VWAP) to 11 February 2026 (date of the award approval by the Remuneration Committee).
Executive Directors' shareholding
Executive Directors or entities in which they have an indirect beneficial interest held the following numbers of NEPI Rockcastle shares at 31 December 2025.
Shares held under the Share Purchase Schemes:
Executive | 31 Dec 2025 | 31 Dec 2024 |
|---|---|---|
Marek Noetzel | 88,358 | 88,358 |
- Shares presented in the table above are pledged as security for the loan under Share Purchase Scheme
Shares held under the debt free Long-Term Share Incentive Plan (LTIP):
Executive | 31 Dec 2025 | 31 Dec 2024 |
|---|---|---|
Rüdiger Dany | 635,144 | 471,720 |
Eliza Predoiu | 437,803 | 293,258 |
Marek Noetzel | 567,842 | 423,297 |
Total | 1,640,789 | 1,188,275 |
Shares unvested under the LTIP:
Executive Directors | 31 Dec 2025 | 31 Dec 2024 |
|---|---|---|
Rüdiger Dany | - | 399,740 |
Eliza Predoiu | 396,405 | 256,194 |
Marek Noetzel | 404,467 | 275,256 |
Total | 800,872 | 931,190 |
Single figure remuneration The total remuneration of Executive Directors for 2025, relative to the previous year, is presented in the table below: |
All amounts in € thousand | |||||||
Executive Director | Year | Directors' fees | Additional payment on CEO end of mandate | STIP | LTIP (number of shares) | LTIP (€ thousand equivalent) | Total single figure of remuneration |
|---|---|---|---|---|---|---|---|
Rüdiger Dany | 2025 | 675 | 700 | 1,100 | - | - | 2,475 |
2024 | 675 | - | 1,067 | 253,423 | 1,822 | 3,564 | |
Eliza Predoiu | 2025 | 440 | - | 656 | 45,713 | 352 | 1,448 |
2024 | 385 | - | 554 | 144,545 | 1,040 | 1,979 | |
Marek Noetzel | 2025 | 440 | - | 739 | 45,713 | 352 | 1,531 |
2024 | 385 | - | 628 | 144,545 | 1,040 | 2,053 | |
All figures represent total cost to Company. There are no other payments granted to the Directors other than the ones disclosed above.
Conclusion of the CEO mandate – treatment of the Long-Term Incentive Awards and one-off reward
For 2025, no LTIP was awarded to the CEO, whose mandate will terminate on 31 March 2026.
Over his almost five-year tenure, Rüdiger Dany was granted 708,341 shares under the Company's Long-Term Incentive Plan, in accordance with the shareholder-approved Remuneration Policy.
Upon the conclusion of his mandate, 244,394 shares had vested under their original schedules. The remaining 463,947 shares vested on an accelerated basis in accordance with the good leaver provisions of the incentive plan rules.
This treatment reflects both Mr Dany's contributions to the Company's strategic and operational development and his role in building the leadership team now assuming responsibility. Marek Noetzel, his successor as Chief Executive Officer from 1 April 2026, and Marius Barbu, the incoming Chief Operating Officer, to whose development Mr Dany's contribution was instrumental. The resulting continuity of strategy and culture represents a central achievement of his tenure.
Several strategic initiatives that commenced under Mr Dany's leadership remain in progress, including ongoing developments and the Company's green energy programme. Out of Mr Dany's total shareholding, 218,179 shares remain subject to a two-year lock-up, ensuring his continued alignment with these outcomes. All malus and clawback provisions continue to apply.
The CEO structure of variable package for 2025 includes a one-off reward of €700,000, approved by the Remuneration Committee as payment related to the successful completion of the mandate and delivering on specific succession-related and new CEO onboarding objectives.
The weight between the various components of reward for the Executive Directors is as follows: |
CEO 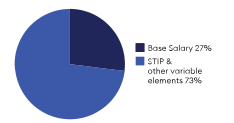 | CFO 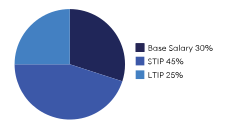 | COO 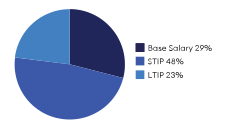 |
Internal Pay ratio and comparative information In line with the guidance provided under the Dutch Corporate Governance Code and the Dutch Civil Code, the CEO pay ratio and five-year average employee compensation are disclosed below. In line with the Dutch regulatory provisions, the average employee compensation is computed as total personnel costs reported in the financial statements as 'Staff costs' divided by the average headcount. |
CEO Pay ratio |
2025 | 2024 | 2023 | 2022 | 2021 | |
|---|---|---|---|---|---|
a. CEO compensation - LTIP included (€ thousand) | 2,475 | 3,564 | 2,628 | 2,519 | 600 |
b. Average number of employees1 | 669 | 626 | 538 | 454 | 436 |
c. Average employee compensation, as per financial statements (€ thousand)2 | 21.3 | 20.6 | 22.1 | 23.5 | 18.7 |
d. Average employee compensation, excluding the effect of the property management fee income related to staff costs recovery3 (€ thousand) | 57.7 | 53.8 | 54.3 | 52.9 | 40.3 |
e. CEO Pay ratio relative to average employee compensation, as per financial statements (line a divided by line c) | 116 | 173 | 119 | 107 | 32 |
f. CEO Pay ratio relative to average employee compensation, excluding the effect of the property management fee income related to staff costs recovery3(line a divided by line d) | 43 | 66 | 48 | 48 | 15 |
g. CEO compensation - LTIP excluded (€ thousand) | 2,475 | 1,742 | 1,684 | 1,583 | 600 |
h. CEO Pay ratio relative to average employee compensation, as per financial statements (line g divided by line c) | 116 | 84 | 76 | 67 | 32 |
i. CEO Pay ratio relative to average employee compensation, excluding the effect of the property management fee income related to staff costs recovery3(line g divided by line d) | 43 | 32 | 31 | 30 | 15 |
- Average number of employees calculated as average between total number of employees at the beginning and at the end of the calendar year
- Average employee compensation progression reflects the effects of several factors, primarily the internalisation and the pay level of the newly acquired staff at YE 2024. Staff costs do not include any LTIP awards, training, personal development or wellbeing related costs
- Part of the staff costs of the Group is recovered from its tenants through the property management fee re-charges (mainly costs associated with property management function). Staff costs disclosed in note 27 of the financial statements are presented net of these recoveries
CEO to Management pay ratio The pay ratio (LTIP included and LTIP excluded) between the CEO and Executive and Senior Management, as well as middle management and subject matter experts is displayed below: |
2025 | 2024 | |
|---|---|---|
CEO Pay Ratio (LTIP included) | ||
Ratio to Executive and Senior Management | 2.9 | 3.5 |
Ratio to Middle Management (including subject matter experts roles) | 21.5 | 31.7 |
CEO Pay Ratio (LTIP excluded) | ||
Ratio to Executive and Senior Management | 4.5 | 3.4 |
Ratio to Middle Management (including subject matter experts roles) | 23.5 | 17 |
For 2025, the CEO’s remuneration does not include an LTIP allocation. |
Comparison table of remuneration and Group’s performance |
In line with guidance provided under the Dutch Corporate Governance Code and the Dutch Civil Code, the table below presents the comparison between the performance of the Company, the CEO and the average employee compensation (excluding directors) from the 2021 to 2025 financial years.
Group performance | 2025 | 2024 | 2023 | 2022 | 2021 |
|---|---|---|---|---|---|
Distributable earnings per share (euro cents) | 62.03 | 60.17 | 56.98 | 52.15 | 34.42 |
Net Operating Income (€ thousand) | 618,110 | 555,939 | 491,209 | 404,565 | 346,891 |
CEO total compensation – LTIP included | 2,475 | 3,564 | 2,628 | 2,519 | 600 |
Average employee compensation1 (€ thousand) | 21.3 | 20.6 | 22.1 | 23.5 | 18.7 |
Average gross personnel costs2 (€ thousand) | 57.7 | 53.8 | 54.3 | 52.9 | 40.3 |
- Calculated based on personnel costs as per the financial statements
- Excludes the netting effect of the property management income generated by the Group
Non-Executive Directors' fees |
There were no changes to the fees of the non‑Executive Directors (NEDs) during the 2025 financial year, with the existing fee structure retained in line with the Group’s established remuneration principles. A benchmarking exercise was undertaken in November 2025 to evaluate the continued competitiveness of the Group’s remuneration framework.
As part of this review, the Remuneration Committee updated the peer group used for benchmarking to ensure alignment with companies of comparable market capitalisation, positioning NEPI Rockcastle at the market median.
In accordance with the Group’s Remuneration Policy - which aims to position NEDs fee levels at the median of the relevant market and peer set - the Remuneration Committee, together with the Board of Directors, will evaluate and propose any appropriate adjustments. Any proposed changes would be designed to remain consistent with market developments and the Company’s strategic priorities and would be submitted for shareholder approval at the Annual General Meeting in May 2026.
Non-Executive Directors' fees by roles – Chairman and members of Board and Committees:
Actual | Member/Chairman | 2025 Annual remuneration | 2024 Annual remuneration |
|---|---|---|---|
Board of Directors | Member | 57,000 | 57,000 |
Board of Directors | Chairman of the Board | 157,000 | 157,000 |
Board of Directors | Lead Independent Director | 7,000 | 7,000 |
Audit Committee | Member | 12,000 | 12,000 |
Audit Committee | Chairman | 20,000 | 20,000 |
Risk and Compliance Committee | Member | 10,000 | 10,000 |
Risk and Compliance Committee | Chairman | 17,000 | 17,000 |
Investment Committee | Member | 12,000 | 12,000 |
Investment Committee | Chairman | 20,000 | 20,000 |
Remuneration Committee | Member | 9,000 | 9,000 |
Remuneration Committee | Chairman | 13,000 | 13,000 |
Nomination Committee | Member | 8,000 | 8,000 |
Nomination Committee | Chairman | 12,000 | 12,000 |
Sustainability Committee | Member | 8,000 | 8,000 |
Sustainability Committee | Chairman | 12,000 | 12,000 |
The non-Executive Directors' annual fees are set out below. Actual payments during 2025 are presented in a separate table further down in this section and in note 36 of the financial statements. |
Actual | Member/ Chairman/Chairwoman | Annual remuneration | Andre van der Veer | Andries de Lange | Antoine Dijkstra | Steven Brown | George Aase1 | Andreas Klingen2 | Ana Maria Mihaescu | Jonathan Lurie | Jeanine Holscher | Total |
|---|---|---|---|---|---|---|---|---|---|---|---|---|
Board of Directors | Chairman | 157,000 | - | - | - | - | 157,000 | - | - | - | - | 157,000 |
Board of Directors | Member | 57,000 | 57,000 | 57,000 | 57,000 | 57,000 | - | 64,000 | 57,000 | 57,000 | 57,000 | 463,000 |
Audit Committee | Member | 12,000 | 12,000 | - | 12,000 | - | - | - | 12,000 | - | - | 36,000 |
Audit Committee | Chairman | 20,000 | - | - | - | - | - | 20,000 | - | - | - | 20,000 |
Risk and Compliance Committee | Member | 10,000 | 10,000 | - | - | 10,000 | - | - | - | 10,000 | - | 30,000 |
Risk and Compliance Committee | Chairman | 17,000 | - | - | 17,000 | - | - | - | - | - | - | 17,000 |
Investment Committee | Member | 12,000 | - | - | - | 12,000 | - | - | - | 12,000 | - | 24,000 |
Investment Committee | Chairman | 20,000 | 20,000 | - | - | - | - | - | - | - | - | 20,000 |
Remuneration Committee | Member | 9,000 | 9,000 | - | - | - | - | - | 9,000 | - | - | 18,000 |
Remuneration Committee | Chairman | 13,000 | - | 13,000 | - | - | - | - | - | - | - | 13,000 |
Nomination Committee | Member | 8,000 | - | 8,000 | 8,000 | - | - | 8,000 | - | - | 8,000 | 32,000 |
Nomination Committee | Chairman | 12,000 | - | - | - | - | - | - | - | - | - | - |
Sustainability Committee | Member | 8,000 | - | - | 8,000 | 8,000 | - | 8,000 | - | - | 8,000 | 32,000 |
Sustainability Committee | Chairwoman | 12,000 | - | - | - | - | - | - | 12,000 | - | - | 12,000 |
Annual fee | 108,000 | 78,000 | 102,000 | 87,000 | 157,000 | 100,000 | 90,000 | 79,000 | 73,000 | 874,000 |
- Chairman of the Board receives an all-in fee and no further additional fees for Committee membership or for Chairman of Committees
- Mr Andreas Klingen acts as a Lead Independent Director and this respective role is remunerated additionally
Single figure remuneration: The total remuneration of Executive and non-Executive Directors for 2025, relative to previous years is presented in the table below. Total figure remuneration reflects the payments in line with the Committees’ membership. |
All amounts in € thousand | ||||||
Director | Position | 2025 | 2024 | 2023 | 2022 | 2021 |
|---|---|---|---|---|---|---|
Rüdiger Dany | Chief Executive Officer | 2.475 | 3,564 | 2,628 | 2,519 | - |
Rüdiger Dany | Former Chief Operating Officer | - | - | - | - | 1,400 |
Eliza Predoiu | Chief Financial Officer | 1.448 | 1,979 | 1,467 | 1,826 | - |
Marek Noetzel | Chief Operating Officer | 1.531 | 2,053 | 1,524 | 1,785 | - |
Marek Noetzel | Former Executive Director | - | - | - | - | 600 |
Alex Morar | Former Chief Executive Officer | - | - | - | 188 | 600 |
Mirela Covasa | Former Chief Financial Officer | - | - | - | 147 | 400 |
George Aase | Chairman | 157 | 157 | 102 | 102 | 112 |
Antoine Dijkstra | Non-Executive Director | 102 | 102 | 88 | 88 | 104 |
Andre van der Veer1 | Non-Executive Director | 108 | 108 | 98 | 98 | 116 |
Andreas Klingen2 | Non-Executive Director | 100 | 100 | 89 | 89 | 103 |
Steven Brown | Non-Executive Director | 87 | 87 | 75 | 75 | 84 |
Andries de Lange3 | Non-Executive Director | 78 | 78 | 63 | 63 | 74 |
Jonathan Lurie | Non-Executive Director | 79 | 79 | 68 | 68 | 25 |
Ana Maria Mihaescu4 | Non-Executive Director | 90 | 90 | 74 | 74 | 27 |
Jeanine Holscher5 | Non-Executive Director | 73 | 56 | - | - | - |
Robert Emslie | Former non-Executive Director/ Former Chairman | - | - | - | - | 78 |
- Mr Andre van der Veer's membership in the Remuneration Committee changed from Chairman to Member as of 14 May 2024
- Mr Andreas Klingen's membership in the Sustainability Committee changed from Chairman to Member as of 14 May 2024
- Mr Andries de Lange was appointed Chairman of the Remuneration Committee effective as of 14 May 2024
- Ms Ana Maria Mihaescu was appointed Chairwoman of the Sustainability Committee effective as of 14 May 2024
- Ms Jeanine Holscher was appointed as a Board Member and Member of the Nomination Committee and the Sustainability Committee effective as of 14 May 2024
Non-Binding Advisory Vote on the Implementation Report The Remuneration Implementation Report will be presented for an advisory (non-binding) vote, in line with the JSE Listings Requirements at the Annual General Meeting of Shareholders to be held in 2026. |
Analysis of shareholders and share trading
Shareholder spread in terms of the | Number of | Number of | Holding |
|---|---|---|---|
Public | 13,246 | 505,470,004 | 70.96 |
Non-public | 2 | 196,862,882 | 27.64 |
Directors and employees | 43 | 4,156,178 | 0.58 |
Treasury shares | - | 1,640,511 | 0.23 |
Other | - | 4,227,734 | 0.59 |
Total | 13,291 | 712,357,309 | 100 |
Size of holding | Number of | Number of | Holding |
|---|---|---|---|
1 to 2 500 shares | 10,543 | 4,844,907 | 0.68 |
2 501 to 10 000 shares | 1,135 | 5,664,901 | 0.80 |
10 001 to 100 000 shares | 1,031 | 36,294,259 | 5.09 |
100 001 to 1 000 000 shares | 467 | 153,467,491 | 21.54 |
1 000 001 to 3 500 000 shares | 75 | 126,064,332 | 17.70 |
More than 3 500 000 shares | 40 | 380,153,174 | 53.37 |
Treasury shares | - | 1,640,511 | 0.23 |
Other | - | 4,227,734 | 0.59 |
Total | 13,291 | 712,357,309 | 100 |
Registered shareholders owning 3% or more of issued shares | Number of | Holding |
|---|---|---|
2025 | ||
Public Investment Corporation | 95,878,707 | 13.46 |
Fortress Real Estate Investments Limited | 100,984,175 | 14.18 |
State Street Bank and Trust Company (Custodian) | 49,974,439 | 7.02 |
JP Morgan (Custodian) | 44,568,186 | 6.26 |
Coronation Fund Managers | 25,142,074 | 3.53 |
Total | 316,547,581 | 44.45 |
2024 | ||
Public Investment Corporation | 129,386,872 | 18.16 |
Fortress Real Estate Investments Limited | 115,827,114 | 16.26 |
State Street Bank and Trust Company (Custodian) | 53,478,680 | 7.51 |
JP Morgan (Custodian) | 42,728,943 | 6.00 |
Total | 341,421,609 | 47.93 |
Beneficial shareholding of 3% or more of issued shares | Number of | Holding |
|---|---|---|
2025 | ||
Public Investment Corporation | 95,878,707 | 13.46 |
Fortress Real Estate Investments Limited | 100,984,175 | 14.18 |
Coronation Fund Managers | 25,142,074 | 3.53 |
Total | 222,004,956 | 31.17 |
2024 | ||
Public Investment Corporation | 129,386,872 | 18.16 |
Fortress Real Estate Investments Limited | 115,827,114 | 16.26 |
Total | 245,213,986 | 34.42 |
Beneficial shareholding of Directors
At 31 December 2025 | Direct | Indirect | Associates | Total | Holdings |
|---|---|---|---|---|---|
Rüdiger Dany | 96,559 | 538,585 | - | 635,144 | 0.09 |
Eliza Predoiu | 437,803 | - | - | 437,803 | 0.06 |
Marek Noetzel | 673,277 | - | - | 673,277 | 0.10 |
George Aase | 25,000 | - | - | 25,000 | - |
Antoine Dijkstra | 5,123 | 4,152 | - | 9,275 | - |
Andreas Klingen | - | - | - | - | - |
Andre van der Veer | 81,750 | - | 10,294 | 92,044 | 0.01 |
Steven Brown | 240,707 | - | - | 240,707 | 0.04 |
Andries de Lange | - | 277,959 | 35 | 277,994 | 0.04 |
Ana Maria Mihaescu | - | - | - | - | - |
Jonathan Lurie | - | - | - | - | - |
Jeanine Holscher | - | - | - | - | - |
Total | 1,560,219 | 820,696 | 10,329 | 2,391,244 | 0.34 |
At 31 December 2024 | Direct | Indirect | Associates | Total | Holdings |
|---|---|---|---|---|---|
Rüdiger Dany | 161,217 | 310,503 | - | 471,720 | 0.07 |
Eliza Predoiu | 293,258 | - | - | 293,258 | 0.04 |
Marek Noetzel | 528,732 | - | - | 528,732 | 0.07 |
George Aase | 20,653 | - | - | 20,653 | - |
Antoine Dijkstra | 5,123 | 4,152 | - | 9,275 | - |
Andreas Klingen | - | - | - | - | - |
Andre van der Veer | 71,000 | - | 10,062 | 81,062 | 0.01 |
Steven Brown | 185,589 | - | - | 185,589 | 0.03 |
Andries de Lange | - | 264,279 | - | 264,279 | 0.04 |
Ana Maria Mihaescu | - | - | - | - | - |
Jonathan Lurie | - | - | - | - | - |
Jeanine Holscher | - | - | - | - | - |
Total | 1,265,572 | 578,934 | 10,062 | 1,854,568 | 0.26 |
Since the publication of the reviewed condensed consolidated financial results for the year ended 31 December 2025 and until the publication of this Annual Report, 91,426 shares have been allocated to the Executive Directors, as follows: 45,713 shares to Eliza Predoiu and Marek Noetzel respectively. For further details on the share based incentive plan and their allocation subsequent to the year-end, please refer to the Remuneration report section. In addition, during the same period, 9,000 shares have been purchased by Andre van der Veer, a non-Executive Director.
None of the shares held by the Executive and non-Executive Directors are subject to security, guarantee, collateral and they are not encumbered in any way, except for 88,358 shares held by Marek Noetzel, which are pledged as security for the loan under Share Purchase Scheme.
For the Executive Directors shareholdings resulting from the share-based incentive programme as at 31 December 2025, please refer to Note 36 of the Financial Statements.
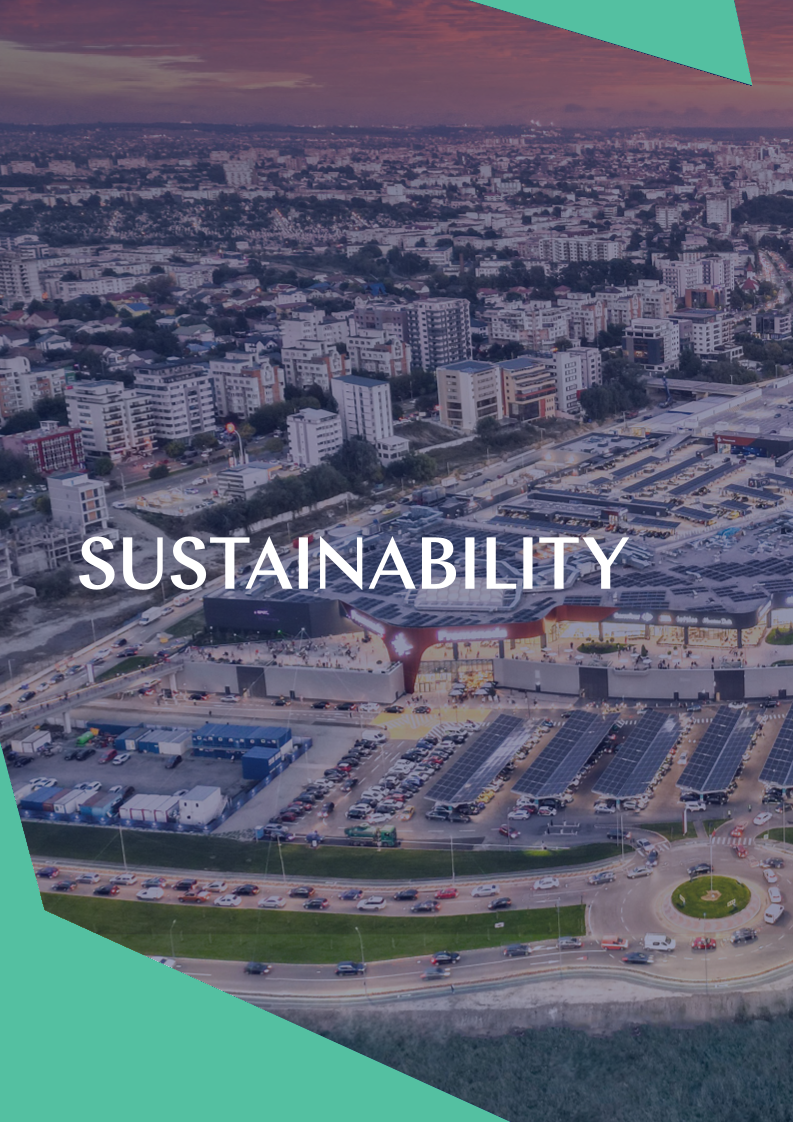
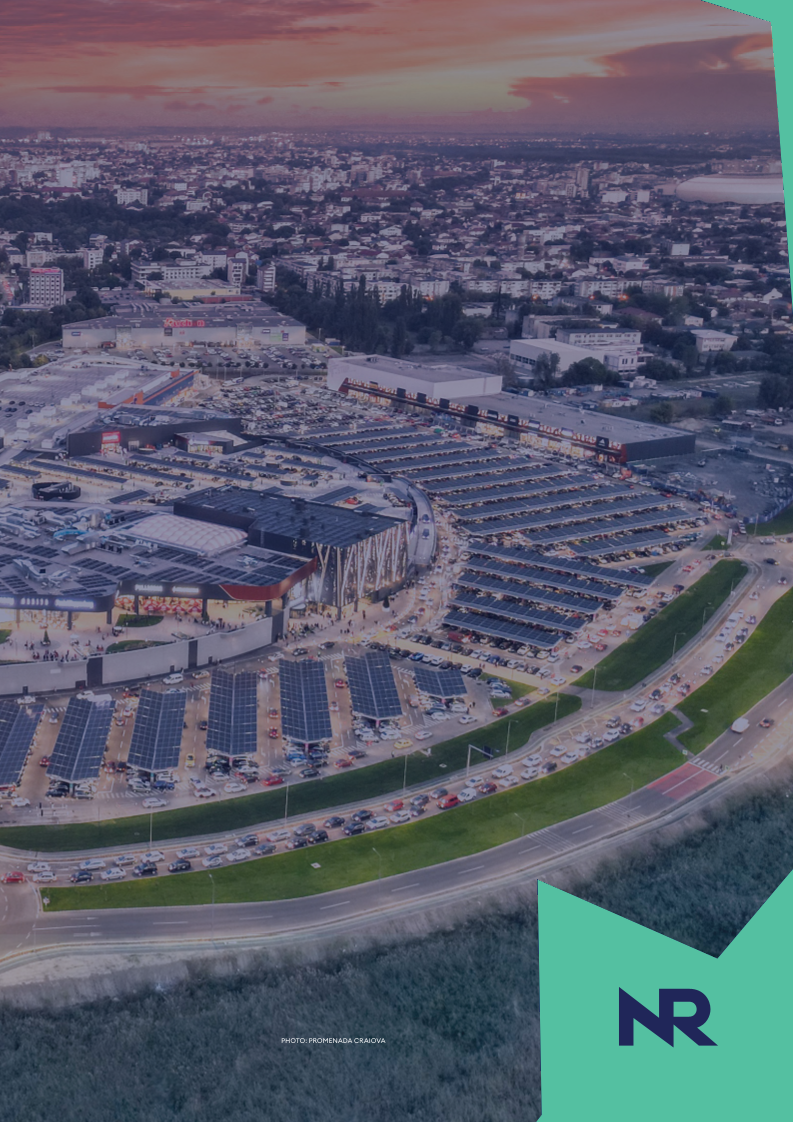
Sustainability
Sustainable growth is not a separate agenda at NEPI Rockcastle — it is central to how we operate, invest, and serve the communities across Central and Eastern Europe. We believe that responsible business practices, transparent governance, and a genuine commitment to people and the environment are the foundations of lasting value. This report marks our second year of reporting under the Corporate Sustainability Reporting Directive (CSRD), reflecting our continued progress and our ongoing commitment to transparency and accountability in ESG performance.
Focus and Performance | |
Sustainability Statement | |
EPRA Appendix |
Focus and performance
Message from the CEO
At NEPI Rockcastle, our purpose has always been to create places that genuinely matter to people. That belief shapes every decision we make, from the investments we pursue to the communities we serve across Central and Eastern Europe.
This year, we focused on consolidation and disciplined execution — not as an end in itself, but because strong foundations are what allow us to be bold. Efficiency, integrity and transparency are not just values we aspire to; they are how our 680 professionals show up every day across every market where we operate.
I am particularly proud of how we are redefining what a shopping centre can be. Our properties are becoming community hubs — places where people access healthcare, participate in educational programmes, enjoy cultural experiences and connect with one another. Around 354 million visits across our 57 retail properties in 2025 tell us that people feel that difference. This is what drives us forward.
None of this happens in isolation. We are grateful for the constructive relationships we have built with local and national authorities across our markets — their openness to dialogue and partnership is what enables us to develop our assets responsibly and deliver benefits that extend well beyond our properties to the wider communities we serve.
This year we also introduced our first Social Story — a milestone I consider truly significant. It gives us a consistent, honest way to document what our community initiatives actually achieve. Measuring impact matters, but so does telling the stories behind the numbers.
On the environmental side, we are backing our ambitions with real capital. Our multi-year renewable energy programme represents a total investment of approximately €160 million. In 2025 alone, we deployed €46 million - including €30 million to complete 54 MW capacity in our first green photovoltaic plant, Chisineu-Cris. Once fully operational, renewable energy is expected to cover 18% of the Group's electricity needs. This is not just good for the environment — it will contribute to net operating income, strengthening our energy independence and helping our tenants meet their own ESG commitments.
The external recognition we received this year — retaining our 'Negligible' Sustainalytics rating for a third consecutive year, the EPRA Gold Award, a 5-star GRESB rating for both Operational and Development performance, and a CDP score of B for both climate and water — reflects the dedication of our people. It is a testament of our commitment and hard work.
But recognition is a moment, responsibility is ongoing. Looking ahead, I believe NEPI Rockcastle has a genuine opportunity — and obligation — to set the standard for responsible retail real estate in the CEE region. We will continue raising that bar, in partnership with our tenants, communities, local and national authorities, and investors, because lasting value is only created together.
17 March 2026
RÜDIGER DANY
Chief Executive Officer
ESG strategy at a glance
NEPI Rockcastle's approach to sustainability is built on four pillars: sustainable buildings, stakeholder trust, renewable energy leadership, and a strong workplace culture. These pillars are embedded in how the Group operates and makes decisions.
Over the years, the Group has systematically upgraded its portfolio to meet high environmental standards, improved resource management practices, and published transparent performance reports. The results are measurable: reduced greenhouse gas emissions, lower energy consumption, and stronger engagement with tenants, investors, employees and the communities in which the Group operates.
Progress is tracked against clear KPIs, supported by continued investment in assets and people. Looking ahead, the Group's priorities are to expand renewable electricity capacity, achieve higher certification scores across the portfolio, and further reduce emissions.
In 2025, NEPI Rockcastle made meaningful progress across all four pillars. The sections that follow set out the key actions taken and the results achieved.
Investing in healthy and sustainable buildings | |
|---|---|
 |
|
Fostering trust with stakeholders | |
 |
|
Renewable energy leadership | |
 |
|
Cultivating an attractive, professional and ethical work environment | |
 |
|
2025 Achievements and insights
NEPI Rockcastle’s sustainability strategy is monitored through comprehensive targets aligned with the material ESG risks and opportunities.
These targets reflect the foundation of the Group’s commitment to reducing its environmental footprint and driving sustainable progress.
ESG Topic | Target | Measurement | Progress in 2025 | Aspiration for 2030 |
|---|---|---|---|---|
Climate change | Reduce energy intensity in common areas by 30% by 2030, compared to 2022 baseline1 | kWh/m² | 5% reduction in 2025 compared to 2024 9% reduction in 2025 compared to 2022 baseline | Operate an energy efficient portfolio |
Reduce scope 1 and 2 GHG emissions intensity per m2 by 40% over 2024-2030, compared to 2022 baseline1 | tCO2eq/m² | 74% reduction compared to 2022 baseline | Act for a low-carbon future | |
Reduce scope 1 and 2 GHG emissions intensity per m² by 80% by 2030, compared to 2019 baseline2 | tCO2eq/m² | 42% reduction in 2025 compared to 2024 88% reduction compared to 2019 baseline | Act for a low-carbon future | |
Reduce absolute scope 3 GHG emissions from operations (within Category 3 and 13)3 by 25% by 2030, compared to 2022 baseline2 | tCO2eq | 1% reduction compared to 2024 17% reduction compared to 2022 baseline | Stakeholder engagement for a low-carbon future | |
Produce renewable electricity for own consumption by 2030 | Renewable production capacity | Produced renewable electricity covers 6% of Group's electricity needs | Path to net zero | |
All new constructions and extensions over 5,000m² will meet upfront embodied carbon limits in line with the UK NZCBS | Upfront embodied carbon intensity kgCO2e/m² | Progress to be reported starting 2026 | Contribute to net zero construction | |
Circular economy | Reach a waste recycling rate of 60% from operations by 2030 | % waste recycled/ total waste in operations | 51% of waste was segregated and diverted from landfil in 2025 out of which 48% recycled | Operate a zero-end waste business |
Governance | Continue BREEAM In-Use buildings certification, with a minimum rating of ‘Very Good’ | Certified assets | 100% certified portfolio out of which 95% certified ‘Very Good’ and above (by GLA) | Be a recognised leader in building environmental performance |
Biodiversity | 100% of the new acquisitions subject to a biodiversity assessment | % of ESG due diligence processes that include a biodiversity assessment | Target set end of 2025. Progress to be reported starting 2026 | Minimise biodiversity loss and enhance natural value across the assets |
By the end of 2030, ensure that 50% of assets have a biodiversity improvement plan prepared and implemented | % of assets with a biodiversity improvement plan prepared and implemented | Target set end of 2025. Progress to be reported starting 2026 | Minimise biodiversity loss and enhance natural value across the assets | |
By the end of 2030, all staff across property, asset, and development departments trained on biodiversity-related industry topics | % of staff trained on biodiversity-related industry topics | Target set end of 2025. Progress to be reported starting 2026 | Enhance the Group’s knowledge and awareness on biodiversity |
- Sustainability Linked Finance Framework target
- SBTi approved target
- Category 3 and 13 emissions are measured within scope 3 classifications. Category 3 includes emissions from production of fuels and energy purchased and consumed by the Company not included in scope 1 and 2. Category 13 emissions are emissions from downstream leased assets
In 2025, the Group reviewed its sustainability agenda and optimised its key objectives. This process ensured that the targets remain ambitious, actionable and aligned with strategic priorities. Accordingly:
The waste to landfill target has been discontinued as it was considered a direct result of the segregation process, but with strong dependency on national regulations and local waste removal capacity. The Group maintains the overarching segregation target, which inherently supports landfill reduction objectives
The water intensity target was discontinued, as not reflecting the most material impacts of the Group. Considering the company’s industry and operating model, used water is mostly returned to the network, therefore water consumption does not have a material impact in the Group operations
The embodied emissions reduction target was refined in order to align with industry best practice standards (UK NZCBS)
The initial target to Implement a Biodiversity Action Plan for all properties was refined into 3 more granular targets, better reflecting the Group's material topics
Complementing the KPIs presented on the previous page, starting 2024, NEPI Rockcastle calculates and monitors also intensity KPIs in line with ESRS standards defined under CSRD.
The table below presents the intensity data calculated based on these standards, linking operational performance to annual NOI.
Topic | Target | Measurement | 2025 intensity against NOI | 2024 intensity against NOI | Progress in 2025 |
|---|---|---|---|---|---|
Climate change | Reduce energy intensity in common areas by 30% by 2030, compared to 2022 baseline | MWh/€ thousand | 0.339 | 0.407 | 17% reduction |
Reduce scope 1 and 2 GHG emissions per m2 from operational energy use by 80% by 2030, compared to 2019 baseline | tCO2eq/€ thousand | 0.021 | 0.041 | 49% reduction | |
Reduce absolute scope 3 GHG emissions from operations (within Category 3 and 13) by 25% by 2030, compared to 2022 baseline | tCO2eq/€ thousand | 0.341 | 0.384 | 11% reduction |
The Group is committed to integrating financial performance with environmental responsibility, ensuring that growth aligns with sustainability goals. To achieve this, the NOI-based intensity metrics show how efficiently the Group manages energy consumption, and greenhouse gas emissions in relation to its business growth.
By monitoring sustainability indicators alongside the financial performance, the Group also ensures that expansion and business growth do not lead to increased environmental impact.
Moving forward, the NOI-based intensity metrics will continue to guide decision-making, ensuring that financial success is achieved alongside sustainability leadership.
Moreover, the Group is using NOI-based intensity metrics as a bridge and calibrator between its environmental performance (monitored using the operational KPIs above), its financial performance and the CSRD statement.
(% of total electricity consumption)
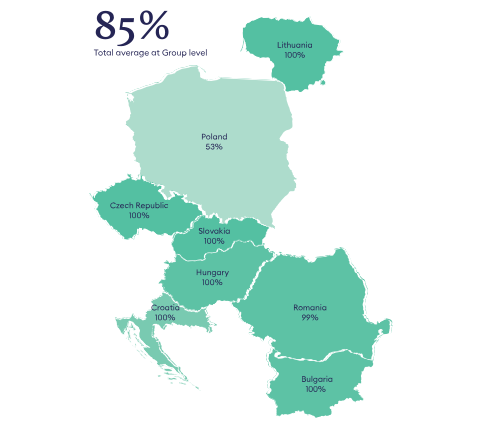
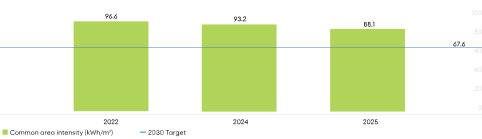
Scope 1 and 2 emissions intensity (tCO2eq/m2)
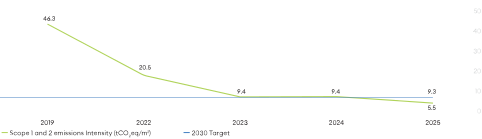
Scope 3 emissions from operations (Categories 3 and 13) (tCO2eq)
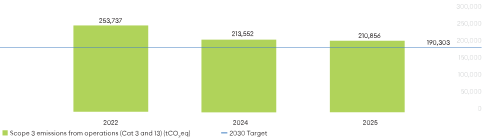
Environmental impact and climate strategy. Energy management
Climate strategy
As a leading player in the real estate sector, NEPI Rockcastle acknowledges its responsibility in addressing climate change, particularly given the sector’s substantial environmental footprint. With its high energy and material demands, the shopping centres segment plays a critical role in supporting the transition to a more sustainable, low-carbon future.
As part of the Group’s Climate Transition Plan, a targeted approach has been established to identify and prioritise actions for decarbonization and energy demand reduction. In 2026, the focus will shift to evaluating implementation options and the financial implications of these measures, with the goal of enhancing asset resilience and supporting long-term sustainability. The Climate Transition Plan details the key options and milestones to meet decarbonization goals, while the necessary investments addressing renewable energy integration and energy efficiency are to be assessed starting 2026.
In 2023, the Group completed its first comprehensive evaluation of climate‑related risks and opportunities, aligned with the Task Force on Climate-related Financial Disclosures (TCFD) recommendations and the IFRS S2 Climate‑related Disclosure Standard. Building on this foundation, NEPI Rockcastle has integrated climate‑risk reporting into its 2025 Sustainability Report and continues to strengthen its assessment of climate impacts, reaffirming its long‑term commitment to meaningful climate actions.
A key element of this commitment is the development of a robust climate change adaptation strategy that addresses growing risks from extreme weather events and long-term climate shifts. This strategy supports the Group’s ambition to create long-term value by strengthening the climate resilience of its assets throughout their lifecycle. Beyond physical climate risks, transitional risks linked to decarbonization also remain a central priority for the Company. NEPI Rockcastle is committed to reducing its reliance on external energy sources and lowering emissions by increasing its self-generated renewable energy capacity.
The targets set by the Company are achieved through a combination of energy efficiency measures, investment in renewable energy production, and the purchase of additional renewable electricity certified by Guarantees of Origin.
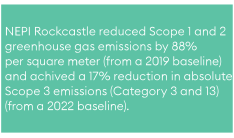
Leveraging substantial roof space on its properties, the Company started producing renewable energy, turning climate transition risks into opportunities. The first phase of the Company’s green energy journey, launched in 2022, was completed in 2024. The Group invested €34 million to install photovoltaic panels in 27 locations in Romania and one in Lithuania, with a total capacity of 38 MW. The installed capacity covered 6% of the electricity needs in 2025, resulting in 5% avoided carbon emissions.
The second phase, the rollout of the program in the Group’s shopping centres outside Romania, is well underway. The concept design has been completed for additionally 22 locations, planning to deliver up to 15 MW of total installed capacity by the end of 2026.
The third phase, aiming to add 159 MW of new capacity in greenfield plants in Romania commenced in 2024. The Group has acquired two project companies that hold land rights, building permits, and grid connection approvals for photovoltaic projects. The first photovoltaic plant was commissioned in 2025. The total investment plan for the greenfield projects reached approx. €160 million (including substantial investment in batteries, approved by the Board during 2025).
Following completion, the Group expects to achieve an installed capacity of 212 MW and a storage capacity of 100 MW, covering 47% of its electricity needs and resulting in 37% avoided emissions.
Self-produced renewable electricity coverage planned evolution |
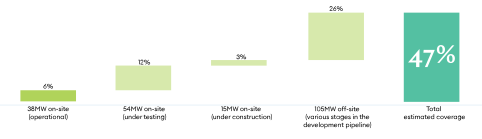
Energy management
Energy efficiency continues to be a cornerstone of reducing operational impact and driving long‑term sustainability performance. Across the portfolio, numerous initiatives were implemented in 2025 to enhance building performance, reduce consumption, and modernise technical systems. These included modernization of Building Management Systems (BMSs), together with upgrades to major HVAC components such as chillers, cooling towers, rooftop units, and air‑handling units. Additional initiatives such as sun‑protection foils for skylights, installation of air curtains, elevator automation upgrades, energy‑saving hand dryers—further contributed to optimising day‑to‑day operational efficiency.
In parallel, the Company advanced its digital transformation by collaborating with external providers to improve real‑time monitoring and optimise system performance across assets. These efforts were complemented by the launch of a smart energy‑management technology programme, aimed at automating the collection and analysis of utility data, enabling more accurate benchmarking and faster intervention where inefficiencies are identified. By reducing overall energy demand and improving the performance of common areas and technical systems, these initiatives collectively help lower emissions, enhance asset resilience, and deliver operational cost savings.
Case study: energy optimisation and efficiency
AI-driven optimization is part of NEPI Rockcastle’s strategy to enhance energy efficiency across its portfolio. In 2024 and throughout 2025, the Group tested AI-powered controls to optimise BMSs operation by piloting the technology in one Lithuanian and four Polish assets. Through comprehensive asset assessments, real-time data collection, and rigorous validation tests, the AI system identifies and addresses inefficiencies without compromising indoor comfort.
This approach is meant to create a replicable model for broader rollout in the future (depending on specific conditions in each asset).
Beyond piloting AI integration, the Group is systematically upgrading BMSs across its assets, as well as HVAC and ventilation systems. Targeted HVAC equipment improvements include replacing units with high energy efficiency models or upgrading components, which enabled the implementation of variable speed control to adjust the capacity and operating times of air handling units to actual occupancy levels. These HVAC optimizations, informed by real-time monitoring, have delivered energy savings and efficiency gains.
Sustainable development
NEPI Rockcastle recognises that sustainable development is essential to its long-term success as a leading real estate owner and operator of shopping malls. The Group’s commitment extends beyond operational efficiency, embracing the entire lifecycle of its assets to ensure alignment with best practices in sustainability, carbon reduction, and responsible resource management.
The Company established a Sustainable Development Policy, effective January 2025, outlining its strategic approach to optimising resource efficiency, integrating measures to reduce water and energy consumption, and embracing circular economy principles to minimise waste.
NEPI Rockcastle has been tracking embodied carbon across its development projects since 2021. In 2025, the Group completed Whole Life Carbon Assessments for all projects developed since that date, enabling a more precise calculation of embodied emissions and the establishment of a clear benchmark as target, namely the UK Net Zero Carbon Buildings Standard (NZCBS Pilot Version rev. 2, April 2025). From 2026, all new construction and extension projects exceeding 5,000 square metres will be required to meet the upfront embodied carbon limits set by this standard.
To achieve this KPI, the Group plans to use low-carbon construction methods, such as prefabrication, innovative building technologies, and increase the use of recycled materials.
This benchmark was specifically chosen to ensure that NEPI Rockcastle’s developments not only meet decarbonisation goals, but also demonstrate leadership in sustainable construction practices. The UK NZCBS provides a robust, science-based framework, widely recognised across the property sector, setting clear thresholds for upfront embodied carbon in new projects. By adopting this standard, NEPI Rockcastle is ensuring its construction activities are compatible with global net zero objectives and can be credibly benchmarked against the best practices in the industry. Furthermore, the Group’s choice aligns with the evolving European Union Taxonomy for sustainable activities. By adhering to the UK NZCBS, NEPI Rockcastle ensures that its developments are not only industry-leading, but also compliant with emerging European-wide regulations.
UK NZCBS alignment at this point is particularly important as the Group advances major developments, such as Promenada Bucharest. The project is being designed and built with strong emphasis on minimising embodied carbon and will serve as a flagship example of NEPI Rockcastle’s commitment to roll innovative practices across all construction projects.
Sustainable transportation
Recognising the need for broader decarbonisation initiatives, particularly those that target emissions beyond the Group’s direct operational control, in 2025 NEPI Rockcastle continued to implement measures designed to promote low-emissions mobility. These efforts form a key part of the Group’s wider strategy to address indirect greenhouse gas emissions, including those generated by tenants and visitors. By facilitating sustainable transportation options, investing in electric vehicle infrastructure, and promoting access via public transport, NEPI Rockcastle is actively working to reduce its overall environmental footprint.
Proximity to public transportation is a standard criterion in all acquisition and development decisions, ensuring that 93% of the Group’s assets (by number, excluding industrial properties) are accessible via public transport. The Group is also enhancing on-site facilities to accommodate alternative mobility options. Investments in bike stands and repair stations, special parking areas for car-sharing solutions, and integration of electric bike charging infrastructure, reflect NEPI Rockcastle’s approach to evolving mobility trends.
Enhancing biodiversity and ecosystem resilience
In 2025, NEPI Rockcastle finalised its Biodiversity Strategy, following comprehensive assessments of nature-related risks, impacts, and dependencies across the portfolio. The strategy provides guidance on incorporating biodiversity considerations into investment and asset management activities. Recognising the close relationship between climate and biodiversity challenges, NEPI Rockcastle has sought to develop a holistic strategy that complements its existing climate objectives with new commitments focused on land use, resource management, and ecological restoration. This integrated approach ensures that the Company addresses its most significant impacts on natural ecosystems and living organisms. The targets were formally validated by NEPI Rockcastle’s Sustainability Committee and their progress will be reported starting 2026.
The strategy focuses on two complementary principles. The first one aims to minimise negative impacts on biodiversity while supporting the restoration and long-term resilience of local urban ecosystems. This involves assessing both new acquisitions and existing assets and implementing nature-positive measures throughout the asset lifecycle.
The second one is dedicated to strengthening internal knowledge and awareness. NEPI Rockcastle will invest in developing employee awareness—particularly in property, asset, and development teams—through targeted training and capacity-building initiatives, ensuring staff is well-equipped to manage biodiversity responsibly.
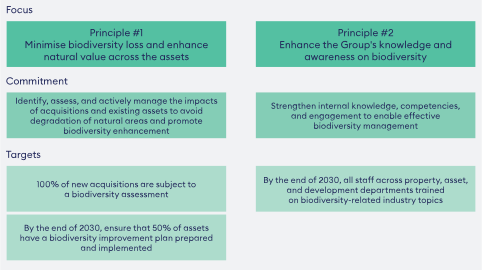
Embedding circular economy principles across operations
The central principle of NEPI Rockcastle’s waste management strategy is the circular economy model, designed to minimise waste by extending the lifecycle of resources through reuse, repurposing, and regeneration. The Group seeks to reduce its environmental impact by considering circular economy principles into the design, development, management of its assets and the broader value chain.
NEPI Rockcastle has taken decisive steps to improve recycling ratio in its operations. The implementation of waste sorting and recycling programs has led to an increase in the waste segregation and diversion from landfill, reaching 51% in 2025 (out of which 48% is recycled). Recognising the need for robust data collection and transparency, the Group pilots a digital platform to streamline waste data collection and share waste management responsibilities with tenants. This initiative is particularly important given the complex legal and regulatory landscape across jurisdictions; for instance, full segregation of waste is not feasible in Romania due to local regulatory constraints and a shortage of qualified waste removal companies.
These challenges underscore NEPI Rockcastle's strong dependency on the availability of recycling markets and the diligence of its tenants to ensure effective waste management. The pilot program for waste tracking is designed to address these complexities, with results scheduled for analysis in 2026/2027 to guide future decision-making. In light of these factors, the Group will maintain the segregation target at 60% until 2030, as achieving this rate implicitly supports the Group's broader landfill reduction goals and reflects a pragmatic response to the operational realities faced in different countries.
Waste Recycled Rate |
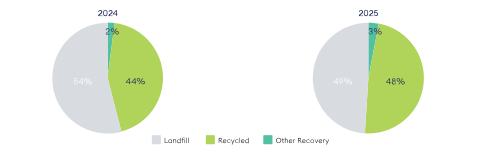
Social impact. Supporting Communities and creating meaningful connections
By operating an efficient and modern retail platform, the Group generates growth and shares it across the stakeholder ecosystem - contributing to urban regeneration, supporting jobs and local suppliers, enabling regional retailers to expand across the CEE.
A shopping mall is more than a retail destination, it is a ‘third place’, a welcoming space where people can connect, unwind, and experience a sense of belonging. It bridges the gap between work and home, offering a vibrant hub for social interaction, entertainment, and relaxation. By creating inclusive, engaging environments, shopping malls contribute to the social fabric of the community, making them places to live, connect, and belong.
Beyond environmental performance, NEPI Rockcastle recognises the importance its shopping centres have in the social and economies of their communities. They serve as hubs for work and leisure, generating financial value and enabling communities to interact and engage. NEPI Rockcastle creates and maintains assets that foster and grow community spirit by engaging, supporting and uplifting local communities.
NEPI Rockcastle values constructive, long-term collaboration with local authorities across all countries in which it operates, recognising that regular dialogue, clear guidance and true partnership are essential to responsible asset development and stewardship. This engagement spans the full lifecycle of projects-from planning and permitting through construction, operation and refurbishment. At all stages, the Group ensures compliance with local regulations, alignment with territorial planning and urban regeneration objectives, and the integration of best-practice standards in safety, accessibility and environmental performance.
Empowering employees and creating an inclusive workplace
NEPI Rockcastle builds a positive, inclusive, and empowering workplace for its employees, creating strong engagement at all levels.
Open communication channels, including the SPOT platform and regular feedback initiatives such as engagement surveys and focus groups, encourage transparency and mutual respect.
Health and safety remains a priority, with robust protocols, training programs, and ongoing assessments to ensure a secure working environment and legal compliance.
Guided by a comprehensive set of policies, the Group actively promotes an inclusive and respectful workplace where all employees feel valued, empowered, and treated with fairness and dignity.
NEPI Rockcastle believes that a business as geographically and culturally diverse as its own can only thrive when every employee feels respected, valued, and empowered to contribute authentically. The Workplace Gender Equity EDGE Certification obtained in 2024 reflects the Group’s approach to building a fair, inclusive, and equitable workplace across all markets in which it operates. The Group embeds equality, diversity, and inclusion principles into the way it manages its teams, engages with partners, and operates its properties. Guided by Group‑wide Human Rights and Equality policies, the Group works to eliminate discrimination, strengthen pay equity, ensure transparent talent processes, and create equal opportunities for career development. Operating in multiple countries across CEE, the Group aims for teams and leadership structures that mirror the diversity of the communities it serves, promoting gender balance and cultural representation at every level of the organisation. The commitment to inclusion extends beyond its own workforce to the millions of people who visit its centres each day; by integrating inclusive design principles and removing accessibility barriers, the Group ensures that its destinations remain welcoming, safe, and enjoyable for everyone.
Creating positive impact across communities
The Group’s shopping centres are far more than places to shop—they offer a wide variety of tenants, extensive amenities, and top-quality services, all thoughtfully tailored to meet the NEPI Rockcastle’s sustainability strategy. Operating across 60 properties (59 investment property and one held for sale) with 354 million visits in 2025, the Group extends far beyond providing shopping destinations - its centres actively foster meaningful employment opportunities, contribute to local economies, and enhance the vibrancy and wellbeing of the communities they serve. To better measure the full scope of this impact, the Group has developed a Social Story that considers the economic, social, and community contributions—not only for the organisation as a whole, but also at the country and individual asset level. The current community engagement strategy is structured to deliver lasting, positive outcomes for local communities and society at large, built around two priorities:
1 - Education
Raising awareness on pressing issues and engaging in projects with cultural and educational value, NEPI Rockcastle embraces a 360° approach to education extending beyond formal learning. The Group approaches education through awareness campaigns, informing and inspiring action on key social, health and environmental issues, cultural and creative education, supporting art, design and projects that stimulate dialogue and innovation.
As one of the most effective paths to empowerment, education lies at the heart of NEPI Rockcastle’s mission. Its approach reaches beyond the classrooms to involve students, teachers, artists and the communities around them.
2 - Community
Through local dialogue and actions, the Group engages stakeholders in continuous collaboration to address pressing local needs and co-create solutions. NEPI Rockcastle believes that understanding society’s needs starts with listening. Shopping centres are an essential part of everyday life in the communities where the Group operates, giving the Company a distinctive opportunity and duty: to build meaningful, ongoing people connections. The Group’s ambition is to make community a platform for co-creating solutions that foster trust, resilience, and shared value for society.
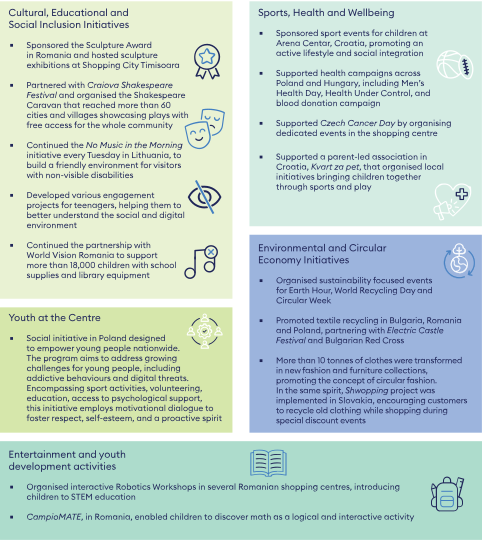
In 2025 the Group actively supported initiatives aimed at enhancing community engagement, promoting education, and addressing environmental sustainability. NEPI Rockcastle believes that every development contributes to the regeneration of life within its spaces. Wherever the Company operates, it does not simply construct buildings; it creates connections, opportunities, and sustainable growth, while revitalising urban areas. |
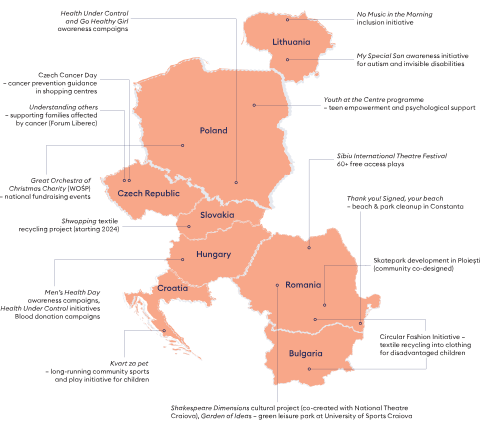
Urban regeneration – transformation of the communities for the future
NEPI Rockcastle takes a deliberate approach to urban regeneration — transforming underutilised and outdated urban areas into vibrant, functional spaces that serve communities today and are built to last. The Group's projects are guided by a consistent set of principles: improving connectivity, promoting accessibility, supporting wellbeing, encouraging diversity, and integrating green initiatives. These are not add-ons - they define how the Group develops and what it expects every project to deliver.
Regeneration goes beyond bricks and mortar. By revitalising infrastructure and enhancing public spaces, the Group's developments stimulate local economic growth and create new employment opportunities, while ensuring that environmental sustainability and social inclusivity remain central to every decision.
A significant share of the Group's assets are developed on brownfield sites, in line with core urban regeneration principles. Where appropriate, the Group also develops and donates access roads to municipalities, improving connectivity and accessibility for the wider community.
City-Level Regeneration and Community Impact
In 2025, NEPI Rockcastle introduced its first Social Story, documenting the urban regeneration initiatives delivered across its portfolio. The report illustrates how the Group's development activity has positively shaped local communities — and helps sharpen the Group's focus on where it can add the most meaningful value.
The Social Story captures the tangible outcomes of these projects: infrastructure improvements, enhanced public spaces, economic stimulation, and stronger community wellbeing. It reflects the Group's conviction that city-level regeneration, done in a proper manner, is one of the most powerful contributions a responsible developer can make.
Tenants engagement and sustainability integration
NEPI Rockcastle promotes open and positive channels of engagement with its tenants. The Company further strengthened two-way communication channels to ensure tenant feedback and concerns are received.
The Group progressed with implementing green clauses in the lease agreements in all countries where it operates.
Some core environmental clauses were already covered in the lease agreements, while for others the Group has initiated discussions with key tenants to identify common grounds for sustainability efforts. Currently, around 94% of the approximately 8,342 lease agreements across the Group include green clauses, either incorporated in the house rules or directly in the contract.
Sustainability in the supply chain
NEPI Rockcastle is embracing its role as an agent of positive change within its upstream value chain. The Group strives to drive responsible business practices and foster environmental stewardship, social responsibility, ethical behaviour throughout its extensive supplier network. The Company recognises the influence it can have on suppliers and aims to contribute to raising awareness on sustainability matters in its geographies. NEPI Rockcastle has embedded sustainability requirements into supplier contracts, which are currently incorporating clauses that mandate adherence to its Sustainability Commitment and the Supplier Code of Conduct. Key suppliers in operations are screened using the internally developed Green Assessment tool, to evaluate performance in key sustainability areas.
The Group Supplier Code of Conduct, launched in February 2025, marks another milestone in ensuring that its suppliers align with the Group’s standards, environmental responsibility, and social integrity. The Code complements the Group’s existing policies: the Sustainable Procurement Policy, the Partner Sustainability Commitment, the Code of Ethics, the International Labour Organisation (ILO)- aligned Policy, the Human Rights Due Diligence Policy, all reflecting NEPI Rockcastle’s focus to create partnerships built on trust, transparency, and shared values.
As part of its broader strategy to promote fair competition, support local sourcing and local suppliers, reinforce social sustainability, NEPI Rockcastle introduced its Payment Policy in 2025. Payment terms are fair and proportionate, with Days Payable Outstanding indicator monitored to maintain both liquidity and supplier health. NEPI Rockcastle treats its suppliers equally, fostering diversity and supporting local economies.
The Group is dedicated to enhancing supplier evaluations by utilising advanced technology, with plans to broaden assessment coverage in 2026. A comprehensive annual performance assessment framework will be implemented for key operations suppliers, complemented by in-depth Business Reviews with the top 20% of operational suppliers by spend.
Governance: Promoting ethical leadership and transparency
The Group operates with a strong commitment to ethical leadership, sustainability, and stakeholder engagement. The Board of Directors upholds the highest standards of governance, aligning the interests of the Group’s leadership with those of its stakeholders.
The Group’s governance practices prioritise transparency, accountability, and competence, ensuring that ethical behaviour and risk management are central to decision- making. These principles are further reinforced by comprehensive policies that govern operations, driving consistent and sustainable growth.
The Group has established a clear governance structure to ensure that ESG responsibilities and targets are cascaded across all levels of the organisation.
Oversight of sustainability begins with the Board of Directors, supported by the dedicated Sustainability Committee, and is operationally anchored through the CEO and senior management. The Group Head of Sustainability steers the company-wide agenda, working closely with all relevant teams and reporting results to the senior management. Specific responsibilities and KPIs were defined for each department, therefore ensuring that environmental, social, and governance considerations are integrated into day‑to‑day operations, risk management, investment decisions, and performance tracking.
Commitment to ESG and external recognition NEPI Rockcastle demonstrates its commitment to sustainability through participation in external benchmarks and initiatives. The Group’s dedication to transparent and consistent reporting is showcased by affiliation with leading rating agencies and international organisations. NEPI Rockcastle’s performance has been recognised by reputable organisations: |
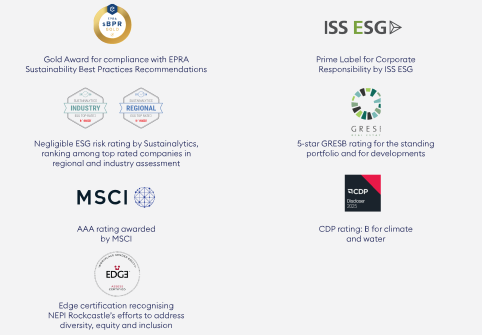
Sustainable finance: linking ESG performance to Group financing |
NEPI Rockcastle continued its commitment to sustainable finance in 2025 by expanding its green and sustainability- linked funding initiatives, further aligning the debt structure with its strategic priority of investing in healthy and sustainable buildings.
Following the launch of the Sustainability-Linked Financing Framework (SLFF) in October 2023, the Group continued to enhance its financing agreements through the extension and expansion of its sustainability-linked revolving credit facilities. In the first half of the year, the revolving credit facility from ING Bank was extended to a maturity of three years, with two additional one-year extension options, now expiring in July 2028, with the maximum principal maintained at €100 million. The revolving credit facility from a three-bank syndicate (BRD-Groupe Société Générale, Garanti Bank, and Unicredit Bank) was also extended to a maturity of three years, with two additional one-year extension options, currently expiring in July 2028, with the maximum principal available increased from €170 million to €190 million.
In December 2025, NEPI Rockcastle further extended the contractual maturity for two additional unsecured committed revolving credit facilities. The revolving credit facility from a four-bank syndicate led by Deutsche Bank as arranger was extended for one year, until January 2029, with the maximum principal available increased by €50 million to €250 million, with JP Morgan joining the syndicate. The revolving credit facility from a two-bank syndicate led by Raiffeisen Bank International as arranger was also extended for one year, until January 2029 the maximum principal available maintained at €200 million. As a result, the total revolving credit facility capacity as at year-end 2025 stands at €740 million (31 December 2024: €670 million), all currently undrawn. All revolving financing agreements have embedded sustainability-linked features, with sustainability-linked KPIs in line with the Group's Sustainability-Linked Financing Framework.
In June 2025, the Group published its first annual report under the Sustainability-Linked Financing Framework, disclosing
performance against the sustainability-linked KPIs embedded in its financing agreements.
Further reinforcing its position as a leader in sustainable finance, NEPI Rockcastle successfully issued its fourth green unsecured Eurobond in September 2025. The €500 million unsecured green bond carries a 3.875% fixed coupon, having an 8-year tenor and maturing in September 2033. The net proceeds will be allocated to finance and/or refinance eligible green projects within the Group’s portfolio, in line with the updated Green Finance Framework. With this recent green Eurobond issuance, the total green bonds issued under the Green Finance Framework has reached €2 billion.
Towards the end of 2025, one of the secured green loan arrangements within Romania was successfully renegotiated, resulting in a top-up of €32 million (bringing the outstanding total loan amount to €84 million). Furthermore, the Group signed a new green unsecured facility with Raiffeisen Bank dedicated to refinancing the PV plants developed in Romania, with a 10-year term and a total commitment of €45 million; the first tranche of €21 million was disbursed by year-end 2025, with the second tranche expected to be drawn in 2026.
In February 2026, the Group signed a €225 million green term facility agreement with a five-year maturity, arranged with a consortium of three banks — ING, SMBC, and Intesa. The facility strengthens the Group's liquidity position and is in line with the Group's Green Finance Framework.
Further in March 2026, one of the secured green portfolio loan facilities in Romania was successfully renegotiated, resulting in a €74 million top‑up, bringing the total outstanding loan amount to €255 million. The loan is provided by a consortium of Erste, BCR and Raiffeisen.
As of 31 December 2025, 88% of the Group’s funding incorporates green and sustainability-linked debt (including undrawn RCFs), underscoring NEPI Rockcastle’s continued leadership in sustainable financing in the CEE region.
% of Green financing out of total financing |
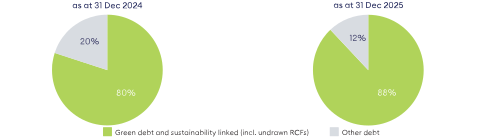
In 2025, NEPI Rockcastle continued to assess the environmental sustainability of its economic activities under the EU Taxonomy Regulation (EU) 2020/852, with substantially all of its reported activities falling within the scope of eligible categories defined in the Taxonomy Delegated Acts. The Group's EU Taxonomy alignment against the climate change mitigation objective was 41% of turnover, 62% of capital expenditure — reflecting significant investment in the Group's renewable energy programme and new construction projects — and 35% of operating expenses.
These results underscore the tangible link between the Group's sustainable finance strategy and its underlying asset base, with EU Taxonomy-aligned activities spanning the acquisition and ownership of buildings, construction of new buildings, and the installation and generation of solar photovoltaic electricity.
This overview is part of management report and has not been reviewed by the auditor.
Sustainability Statement
ESRS 2 General Disclosures
Introduction
The European Sustainability Reporting Standards (ESRS) serve as a framework for organisations to demonstrate transparency and accountability in their sustainability disclosures. ESRS outlines principles and guidelines for reporting on governance, strategy, and material sustainability impacts, risks, and opportunities (IROs) in a structured manner. It is designed to help organisations comply with regulatory requirements whilst meeting stakeholders’ expectations, including those of investors, employees, customers, and communities. In its second year of reporting under ESRS, NEPI Rockcastle continues to strengthen its transparent approach to sustainability disclosures, comprehensively addressing organisational needs, stakeholder interests, and applicable regulatory obligations.
This report details the Group's alignment with the standards, describing its governance structure, stakeholder engagement processes, and the methodology for identifying, assessing, and managing material sustainability-related IROs. As a leader in the commercial real estate sector in Central and Eastern Europe, NEPI Rockcastle recognises its responsibility to address significant environmental, social, and governance (ESG) challenges. In its second year of reporting under ESRS, NEPI Rockcastle continues to adhere to the standards, ensuring compliance with the European Union's Corporate Sustainability Reporting Directive (CSRD). ESRS 2 underpins NEPI Rockcastle’s governance and strategic approach, reflected in the Double Materiality Assessment (DMA), which helps the Group identify and manage its material sustainability issues. This assessment has allowed NEPI Rockcastle to integrate sustainability-related impacts, risks and opportunities into its business model, enhance transparency in stakeholder engagement, and strengthen internal controls and reporting mechanisms to keep up with regulatory changes.
Reference Codes within this Report The ESRS standards are organised into sections, each following a standardised identification system for clarity and ease of reference. Sections and subsections are uniquely identified to align with the detailed disclosure requirements. This structured approach ensures alignment with European Financial Reporting Advisory Group (EFRAG) guidelines, ensuring consistency and comparability in sustainability reporting across organisations. For example, category BP-1 refers to the General Basis for the Preparation of the Sustainability Statement. Within this category, specific requirements are further broken down into detailed identification references, such as BP-1_01 to BP-1_05, each addressing a distinct aspect of the reporting requirement. |
A full list of the ESRS datapoints is presented in Appendix 1 of this Sustainability Statement.
BP-1 – General basis for preparation of the sustainability statement
// ESRS BP-1_01 to BP-1_05
NEPI Rockcastle has prepared the sustainability statement on a consolidated basis at Group level. This report was compiled in accordance with the Directive (EU) 2022/2464 (The Corporate Sustainability Reporting Directive), the ESRS, as published in the Official Journal of the European Union in December 2023, as well as the EU Taxonomy Regulation (EU) 2020/852.
The ESG data in the Sustainability Statement covers the properties under the Group’s operational and financial control, with all relevant activities included. The current report includes consolidated data for 60 properties, consisting of 57 retail centres, 2 office buildings, and 1 industrial park which was reclassified as held for sale at year end.
The scope of the sustainability statement is equivalent to that of the Group's financial statements, capturing all properties under operational and financial control. This alignment provides stakeholders with a unified and reliable representation of the Group’s performance. Any exclusions from the reporting scope are specified in the description of each data point.
The sustainability statement focuses on properties and activities under the Group's direct financial and operational control, whilst also addressing material upstream and downstream value chain impacts, risks and opportunities. Although challenges remain in collecting data from the value chain, NEPI Rockcastle will continue enhancing its reporting by gathering more granular data in the future and, where necessary, using estimates derived from industry benchmarks or proxy data.
NEPI Rockcastle confirms that it has not exercised the option to omit any information related to intellectual property, know-how, or the results of innovation, ensuring the integrity and completeness of its sustainability disclosures.
BP-2 – Disclosures in relation to specific circumstances
Determination of Reporting Time Horizons
// ESRS BP-2_01 to BP-2_02
NEPI Rockcastle applies a uniform short-term time horizon of one year across all sustainability topics, in line with the reporting period used in its financial statements and the requirements of ESRS 1.
The time horizons used in the current report, unless specifically stated otherwise, are defined as per the ESRS1, with a short-term time horizon of one year (in line with the reporting period used in its financial statements), medium-term time horizon of five years after the end of the short-term, long-term time horizon of over five years.
The Group has deviated from the ESRS 1 default definitions for the medium- and long-term time horizons for E1 – Climate change. For this topic, the medium-term horizon is defined as the period from 2031 to 2040, and the long-term horizon as the period from 2041 to 2050.
Additionally, to ensure coherence between narrative disclosures under E1 and the underlying planning assumptions, in the context of ESRS E1 and E1-SBM 3 a near term period of 2025 to 2030 is used when referring to targets, actions and plans. These definitions have been applied to reflect the nature of climate-related impacts, risks and opportunities, which materialise over longer timeframes, and to ensure alignment with the Company’s climate-related risk analyses based on scenario frameworks as well as with its Climate Transition Plan, which is currently under development, as presented in E1-1.
Accuracy of Estimated Value Chain Data
// ESRS BP-2_03 to BP-2_06
NEPI Rockcastle integrates value chain data (focusing on tenants-managed utilities), however in some limited cases, the Group does not have access to full tenant records and therefore does not take into consideration its consumption.
Such cases account for the following percentages of total area: 6% for electricity, 4% for fuel, and 1% for district heating. For instance, in 2025, emissions from downstream leasing activities contributed to 80% of the Group's calculated emissions (Scope 1, 2 and 3 category 13), equating to 66,991 tCO2eq, considering the market-based approach. The increase in Scope 3 contribution is due to the acquisition of Magnolia Park and Silesia City Centre.
Estimations are used for providing a more comprehensive picture of NEPI Rockcastle's environmental footprint, where tenant data is unavailable. As such, the Group has implemented several initiatives, including the introduction of green clauses in lease agreements and the development of collaborative programmes with tenants. These efforts are designed to enhance tenant cooperation in data sharing and align operational objectives.
Metrics that include value chain data are derived from a blend of internal data collection, tenant information collected from meters, contractual terms, and estimations. Acknowledging the variability inherent in using indirect data sources, NEPI Rockcastle is continually refining its utility data collection approach. The Group leverages historical utility data to estimate gaps and, through the adoption of green clauses and ongoing tenant engagement, is steadily improving data coverage. Despite current obstacles, such as inconsistent tenant utility data collection, NEPI Rockcastle is dedicated to reducing estimation errors in its sustainability metrics by prioritising direct data collection. The Company continues to strengthen its data collection capabilities through technology. The Deepki platform is now deployed across the entire portfolio to streamline ESG data collection and management. In parallel, the Group is expanding the use of its Green Assessment Form (GAF) to gather supply chain data and improve the evaluation of supplier sustainability practices.
The metrics reported for the year 2024 have been updated to reflect the updates in methodology or the inclusion of Magnolia Park and Silesia City Centre assets acquired in Poland during 2024. At the time of the previous report publication, data for these properties was unavailable due to their acquisition date falling late in the reporting period. Currently, the comprehensive data collection for 2024 has been completed, ensuring that the figures now fully capture the performance of both Magnolia and Silesia. All updated figures are clearly marked within the disclosure requirements under the relevant topical standards. Quantitative differences for metrics previously disclosed for 2024 can be found in the EPRA Appendix - Changes to Last Year’s Report. This approach ensures transparency for stakeholders and supports the Group’s focus on accurate and comprehensive reporting. Where necessary, explanatory footnotes have been added to highlight which metrics have been revised and to indicate the use of estimates for periods prior to acquisition.

Estimation Uncertainty and Assumptions // ESRS BP-2_07 to BP-2_15 |
Below, the Group sets out metrics related to material approximations and judgements. |
Disclosure of quantitative metrics and monetary amounts that are subject to high level of measurement uncertainty | The Group provides quantitative metrics and financial disclosures where applicable. The Group ensures transparency by detailing the methodologies used and acknowledging potential variances. |
Disclosure of sources of measurement uncertainty | Measurement uncertainty results from limitations in data availability and the use of estimates. The Group implements mitigators to address this uncertainty, ensuring reporting data is relevant, accurate and providing a complete picture. Sources of uncertainty (none of them material for the Group):
|
Disclosure of assumptions, approximations and judgements made in measurement | The Group applies professional judgment in cases where direct data is incomplete or unavailable.
The Group does not consider these estimates material. |
Explanation of changes in preparation and presentation of sustainability information and reasons for them | This report includes updates to sustainability disclosures relevant to 2025 operations, aligned with ESRS reporting standard. The report includes new information identified in relation to certain estimated figures from the previous reporting period, ensuring greater accuracy and compliance with the new requirements. |
Adjustment of comparative information for one or more prior periods is impracticable | Not applicable |
Disclosure of difference between figures disclosed in preceding period and revised comparative figures | Where figures from prior periods have been adjusted due to improved data accuracy or methodological refinements, the Group discloses these differences and provides explanations for the revisions in the report. |
Disclosure of nature of prior period material errors | Not applicable |
Disclosure of corrections for prior periods included in sustainability statement | Not applicable |
Disclosure of why correction of prior period errors is not practicable | Not applicable |
Other Standards and Incorporation by Reference
// ESRS BP-2_16 to BP-2_17, BP-2_20
NEPI Rockcastle also reports its 2025 sustainability related activities in accordance with EPRA sBPR. The detailed disclosure is not part of the CSRD compliant Sustainability Statement and is included as a separate section in the Annual Report. The information is included in the ESRS table in Appendix 1, setting out the Group’s full data mapping, cross-referencing sustainability disclosures and incorporating, by reference, other sections of the management report.
Use of Phase-In Provisions
// ESRS BP-2_21 to BP-2_27
NEPI Rockcastle has applied the phase-in option permitted by the CSRD for its material topics from ESRS E4, ESRS S2, ESRS S3, and ESRS S4, in accordance with the provisions in Appendix C of ESRS 1. In line with the phase-in approach, the Company is gradually implementing the relevant requirements for these standards, allowing for the structured introduction of actions, metrics, policy mapping, and targets as permitted by the CSRD framework.
ESRS E4: Biodiversity and Ecosystems
Through its Double Materiality Assessment (DMA), NEPI Rockcastle identified ESRS E4 as a material topic. Building on prior efforts, the Group advanced its sustainability agenda in 2025 by developing a biodiversity strategy, which will be implemented starting in 2026. Currently, there is no widely accepted consensus or standardised guidance regarding biodiversity indicators for buildings. As such, in November 2025, the Company set preliminary targets based on an analysis of prevailing standards, industry benchmarking, and consultation with internal teams. These targets, metrics, and progress reporting will commence from 2026, as part of the phased approach. The strategy aims to establish a framework for assessing and managing biodiversity and ecosystem-related IROs, enhancing resilience in natural systems. Policy mapping in this area includes ongoing monitoring of the regulatory landscape and readiness to adopt common standards once established. Specific time-bound targets and metrics are scheduled for future disclosure.
ESRS S2: Workers in the Value Chain
NEPI Rockcastle has identified ESRS S2 as material through its DMA. The Group maintains over 8,300 lease contracts and a broad supplier base, applying due diligence measures such as supplier assessments and compliance monitoring to ensure safe and ethical working conditions. Policy mapping is demonstrated through the Sustainable Procurement Policy, Partner Sustainability Commitment, Supplier Code of Conduct, and Human Rights Due Diligence Policy, which collectively extend ethical labour commitments throughout the value chain. Engagement actions include grievance mechanisms and a Sustainability Communication Policy, enabling workers to raise concerns via whistleblowing platforms and direct channels. Whilst the Group has set objectives to increase supplier sustainability diligence and promote ethical practices, it has not yet established measurable, outcome-oriented targets or formalised metrics in line with ESRS phase-in provisions. Progress on setting these targets and metrics will be disclosed as the phase-in continues.
ESRS S3: Affected Communities
ESRS S3 is recognised as material, with NEPI Rockcastle prioritising the inclusion of all impacted communities in ESG reporting. Actions to address community impacts include promoting economic development, employment, and urban revitalisation. Policy mapping is reflected in the Corporate Social Responsibility (CSR) programme, which supports health, education, and social initiatives through partnerships with charities and NGOs. The DMA has identified risks such as adverse land use impacts and construction delays due to local opposition; to mitigate these, the Group engages early and maintains ongoing dialogue with communities. Open communication is facilitated by the Sustainability Communication Channel and Policy. To date, no significant human rights issues have been reported. Specific time-bound targets, metrics, and formal progress reporting for community impacts are yet to be established, as part of the ongoing phase-in process.
ESRS S4: Consumers and End-Users
Through its DMA, NEPI Rockcastle has determined ESRS S4 as material, ensuring that consumers and end-users are comprehensively considered. Actions to safeguard consumer interests include maintaining safety, accessibility, and sustainability standards across shopping centres, and enforcing a Data Protection Policy compliant with GDPR. Policy mapping also includes regular stakeholder engagement via tenant meetings, surveys, digital platforms, and collaboration with NGOs and public authorities. On-site staff receive periodic training to uphold safety standards, and the Sustainability Communication Channel provides direct avenues for feedback and complaints. Whilst no material adverse impacts have been identified, and positive impacts are fostered through tenant satisfaction initiatives and Net Promoter Score (NPS) assessments, specific time-bound targets, performance metrics, and formal progress reporting for consumers and end-users have not yet been established. These will be addressed as the Group advances through the phase-in period.
Summary of Phase-In Actions
Policies, engagement mechanisms, preliminary target-setting, and ongoing monitoring have been initiated for all material topics
Metrics are in development, with reporting to commence starting 2026 for biodiversity and in subsequent years for other topics as phase-in continues
Existing policies and commitments are mapped to ESRS requirements, with further alignment and formalisation planned as standards evolve
Preliminary targets have been established for biodiversity; measurable, outcome-oriented targets for other topics remain in development and will be disclosed in future reporting cycles as permitted by the phase-in provisions
This phased approach ensures NEPI Rockcastle's compliance with CSRD and ESRS requirements, providing transparency on current actions, policy mapping, and the status of metrics and targets, with clear plans for progressive implementation and disclosure.
GOV-1 – The role of the administrative, management and supervisory bodies
Board Composition and Governance Responsibilities
// ESRS GOV-1_01 to GOV-1_13
Please refer to the Corporate Governance (Board profile, diversity and independence assessment chapter - page , Details of the non-Executive Directors background and expertise as of December 2025 chapter - page 87, Delegation to Committees chapter - page , Group governance structure chapter - page ) and the Compliance and Risk Management section (Monitoring the effectiveness of risk management and internal controls system chapter - page 118).
Governance of Sustainability Targets
// ESRS GOV-1_14
The Group’s senior executive management, business function representatives and dedicated sustainability team collaborate to set targets, integrate them into the Company’s strategy, and monitor the progress, under the Sustainability Committee and Board of Directors oversight. This framework reflects NEPI Rockcastle’s focus on aligning its operations with sustainability priorities, whilst maintaining its competitive position in the CEE real estate market.
The Sustainability Committee, a sub-committee of the Board of Directors, comprising Executive and non-Executive Directors, oversees the development and execution of the Group’s sustainability strategy. The Committee ensures that policies and initiatives align with strategic objectives, including but not limited to, climate change mitigation, energy efficiency, and social responsibility. Executive Directors regularly engage with the Board to present updates on sustainability priorities, risks, and opportunities, ensuring the strategy adapts to evolving market trends and stakeholder expectations. This approach facilitates the integration of sustainability goals into the broader business strategy.
Implementation of the sustainability strategy is driven by the Group Head of Sustainability, reporting to the CEO and the Sustainability Committee, working closely with all business functions. This role involves coordinating sustainability initiatives, prioritising actions across the portfolio, and collaborating with internal and external stakeholders to advance the ESG agenda.
Utilities consumption data is collected from individual assets and consolidated within the Deepki data management platform, which supports effective monitoring and analytics for the Group. The data collection process, handled by the Group Lead Sustainability Data Analyst, and supervised by the Group Sustainability Data Analytics Manager is overseen by the Head of Sustainabilty.
Operational oversight is embedded throughout the organisation. The Group Head of Sustainability, supported by Property Managers, leads environmental initiatives at asset level, including energy efficiency programmes and BREEAM certification efforts. Portfolio asset management teams and local centre management teams implement action plans, propose investments, and report the utility data. Additionally, the Group Head of Energy focuses on reducing NEPI Rockcastle’s dependency on non-renewable energy sources and optimising returns from renewable electricity production.
To reinforce accountability, NEPI Rockcastle has linked specific sustainability KPIs, particularly those tied to environmental and climate performance, to the annual performance of key management roles. This ensures alignment between personal performance, remuneration, and the Group’s sustainability objectives.
The Group’s governance mechanisms ensure that IROs are effectively identified, addressed, and managed, promoting accountability and fostering a culture of innovation and responsibility at all organisational levels.
Board Competence in Sustainability Governance
// ESRS GOV-1_15 to GOV-1_17
The Board of Directors and the relevant committees receive ongoing updates on significant IROs, the progress and the impact of the Group’s sustainability efforts. The Sustainability Committee plays a key role in overseeing these matters, holding regular meetings, at least twice a year but also on an ad-hoc basis, as required, to review progress, address challenges, and align actions with the Group’s sustainability goals. Updates include detailed reporting on the implementation and outcomes of policies, together with progress on sustainability targets. Executive Directors, such as the CEO and CFO, provide regular updates to the Board, to ensure that sustainability considerations are embedded into strategic decision-making. The Group Head of Sustainability further supports this process by monitoring progress and delivering periodic reports to ensure alignment and timely response to emerging risks or opportunities. As a result, the Board is able to consider material IROs into its oversight of strategy, decision-making on significant transactions, and risk management processes.
The Group ensures that its administrative, management, and supervisory bodies possess the necessary skills and expertise to execute their role, including the oversight of sustainability matters. This is achieved through a combination of extensive professional experience, specialised education, and ongoing development and updates.
Sustainability Committee Chairwoman: with 26 years of experience with the World Bank Group, where she played a key role in the implementation of early sustainability policies such as the Equator Principles in the region and contributed significantly to the advancement of sustainability initiatives later on. In 2017, she graduated from an international director programme at INSEAD, which has further enhanced her engagement with emerging trends in corporate governance and sustainability. Her expertise brings a deep understanding of global sustainability standards and responsible finance. In 2025 she completed the Sustainability Executive Programme, Your Competitive Advantage, organised by the IE University
Former Sustainability Committee Chairman and non-Executive Board Member: With over 26 years of experience, he has further strengthened his sustainability expertise by completing the Cambridge Institute for Sustainability Leadership (CISL) Business Sustainability Management programme in November 2023
Group Head of Sustainability: With 24 years of experience in real estate, she has been specialising in sustainability for over five years. Her expertise is reinforced by completing prestigious programmes at leading institutions, including the Oxford Leading Sustainable Corporations programme and the Cambridge Sustainable Real Estate programme, both finalised in 2022
These individuals bring a wealth of knowledge and leadership to ensure the Group remains at the forefront of sustainability practices. Their expertise supports strategic decision-making, policy development, and the effective integration of sustainability within the organisation’s governance framework.
The Board and its Committees demonstrate competence in sustainability governance by addressing material IROs, such as climate change, health and safety, regulatory compliance, and upholding the Group’s Code of Ethics. Their targeted oversight encompasses key sustainability priorities, including advancing energy efficiency, investing in renewable energy, optimising waste management, and implementing climate adaptation measures for the Group’s assets.
GOV-2 – Information provided to and sustainability matters addressed by the undertaking’s administrative, management and supervisory bodies
// ESRS GOV-2_01 to GOV-2_03
The administrative, management, and supervisory bodies, including the Board and the Sustainability Committee, are regularly informed about sustainability matters by the Group Head of Sustainability and by the Executive Directors. The Sustainability Committee receives updates at least twice a year and ad-hoc whenever necessary, whilst the Board is updated on a regular basis.
During the reporting period, the Board and Sustainability Committee provided oversight over critical issues, including climate change risks, regulatory compliance, progress towards sustainability targets, and ethical business conduct. This systematic approach ensures that the Group remains resilient and adaptive to the constantly evolving legal and regulatory environment, effectively safeguarding its long-term sustainability. The Group operates with a clearly defined risk appetite, maintaining a zero-tolerance policy for key risks such as regulatory breaches, unethical conduct, and non-compliance with sustainability standards. This policy is embedded in the organisation’s risk management framework, reflected in the procedures that govern material transactions and ongoing risk assessments.
Sustainability risks are documented using the DMA process and maintained within a dedicated risk register. The Risk and Compliance Committee conducts quarterly reviews of ongoing risks, ensuring that all material issues are closely monitored and reported in a timely manner. This process promotes continual improvement and transparency in risk management practices. Through its governance structures and suite of compliance and sustainability policies, the Board and Sustainability Committee ensure that risk identification, mitigation, and reporting are fully integrated into the Group’s daily operations. This approach extends to procurement and supply chain management, supporting the Group’s long-term resilience, ethical conduct, and sustainable growth.
GOV-3 – Integration of sustainability-related performance in incentive schemes
// ESRS GOV-3_01 to GOV-3_06
Please refer to the Remuneration section of the Annual Report (page ).
GOV–4 - Statement on due diligence
// ESRS GOV-4_01 |
The table below provides reference to the sections of the sustainability statement that address due diligence objectives. |
Core Elements of the Due Diligence | Paragraphs in the Sustainability Statement |
|---|---|
a) Embedding due diligence in governance strategy and business model | GOV - 1; GOV - 2; GOV – 3; SBM – 1; SBM - 2; SBM - 3 |
b) Engaging with affected stakeholders in all key steps of the due diligence | GOV – 2; IRO – 1; G1 – 2 |
c) Identifying and assessing adverse impacts | SBM – 3; IRO – 1, EU Taxonomy Report, Minimum safeguards section |
d) Taking actions to address those adverse impacts | E1 – 1; E1 – 3; E3 – 2; E5 – 2, EU Taxonomy Report, Minimum safeguards section |
e) Tracking the effectiveness of these efforts and communicating | E1 – 4; E3 – 3; E5 – 3; S1 – 5, EU Taxonomy Report, Minimum safeguards section |
GOV–5 - Risk management and internal controls over sustainability reporting
// ESRS GOV-5_01 to GOV-5_05
NEPI Rockcastle has established and maintains an internal control system designed to ensure the accuracy, completeness, and reliability of the sustainability report. Key components of the internal control system include:
Collection of environmental data across all properties using Deepki platform
Evaluation and verification of trends and monitoring of performance against targets through a structured review process, which includes investigation of outliers and cross-checking of consolidated data against primary records (such as supplier invoices, meter readings and green building certificates)
Alignment of methodologies across various departments by the Group Head of Sustainability to ensure data is accurately mapped, processed, and reported
Delivery of regular training by the sustainability team to the responsible team members of business functions to ensure they possess the necessary knowledge and skills to collect and process data
Reporting of key sustainability indicators, along with explanation of significant variance to the CFO, CEO, Sustainability Committee, and the Board regularly
The risk management approach follows a cyclical risk assessment methodology. The Group’s risks are reviewed on a quarterly basis, with an overview of key business risks reported to the Risk and Compliance Committee. Material sustainability issues are identified through the DMA and are reviewed on an annual basis. The DMA provides input into the Group’s risk management, identifying critical sustainability risks. Similar to 2024, in 2025 transition risk remains significant due to the stringent CSRD requirements. Failure to comply with these requirements could lead to reputational damage and non-compliance costs. To mitigate this, the Company is enhancing its data collection, monitoring, internal control, and reporting systems year on year. Additionally, risks related to data accuracy and integrity are addressed through ongoing cross-departmental collaboration and review.
Internal Audit evaluates on an annual basis the risk management and internal controls system at Group level, including the key sustainability controls, as part of the annual audit planning. Key audit areas are approved by the Audit Committee on a risk-based approach, guided by a transparent prioritisation process. The findings and recommendations resulting from internal audit projects are reported to the Audit Committee, ensuring a feedback loop and fostering a culture of accountability and continuous improvement.
At NEPI Rockcastle, key risks related to sustainability disclosures are systematically identified, assessed, and prioritised based on their potential impact on the accuracy, completeness, and reliability of reported information. These risks are regularly reviewed, with updates provided to senior management and the Sustainability Committee to ensure effective oversight. The company designed and implemented formal internal controls under the responsibility of the Sustainability and of the Financial Reporting function, in order to address the risks pertaining to accuracy, completeness and truthfulness of the sustainability reporting. Such internal controls address a vast array of risks, from completeness and accuracy of input utilities data to accuracy of calculations, allocations and presentation in the sustainability statements.
The progress and effectiveness of risk mitigation efforts are monitored and reported periodically to the Board of Directors. The Sustainability Committee, in collaboration with senior executive management, oversees the implementation of sustainability reporting controls and provides regular updates to the Board. Further details on general risk management approach and the effectiveness of the internal controls system can be found in the Risk management and compliance section (page ) and in the Corporate Governance Section, Internal controls and risk management statement (page ).
SBM-1 – Strategy, business model and value chain
Business Overview: Products, Markets, and Workforce
// ESRS SBM-1_01 to SBM-1_04
NEPI Rockcastle operates in the retail real estate sector, focusing on acquiring, developing, and managing shopping centres and retail properties. The portfolio includes a mix of large regional malls, community shopping centres, retail parks, as well as some office and industrial sites, catering to diverse consumer needs. The Group's operations are concentrated in CEE, with presence in Romania, Poland, Bulgaria, Hungary, Slovakia, Croatia, Czech Republic and Lithuania. NEPI Rockcastle serves a wide customer base, including international and local retailers, consumers, and visitors. There were no changes in the customer groups served during 2025. For information on NEPI Rockcastle employees across the geographies where it operates, please refer to the section S1-6 of this report, page .
Revenue Breakdown by ESRS Sectors
// ESRS SBM-1_06
For the financial year ended 31 December 2025, NEPI Rockcastle reported a total revenue of EUR 930,663 thousand as per the Financial Statements in the Annual Report. The breakdown of the Group’s total revenues is presented in Note 33- Segment Reporting of Consolidated Financial Statements.
Disclosure of Revenues from High-Risk Sectors
// ESRS SBM-1_09 to SBM-1-20
NEPI Rockcastle does not engage in extraction, production, or distribution of fossil fuels, including coal, oil, or gas activities. The Company is also not involved in chemical production, controversial weapons or the cultivation and production of tobacco. There is no revenue generated from these activities. The Group's operations are focused primarily on the real estate sector.
Sustainability Objectives and Business Strategy
// ESRS SBM-1_21 to SBM-1_23
The Group actively minimises its environmental impact by integrating renewable energy, implementing energy-efficient technologies, and BREEAM certifying its buildings. Additionally, it encourages sustainable practices among tenants, by incorporating green lease provisions in its leasing contracts.
The Group’s sustainability strategy is centrally driven and does not differentiate targets by geographical areas, stakeholder groups, or the products and services offered. The Group actively engages and collaborates with shareholders, investors, tenants, financing partners, employees, suppliers, local communities, other stakeholders, to build transparent, cooperative relations. Engagement with financial institutions is governed by green and sustainability-linked financing frameworks that embed ESG principles into the Group’s financial planning.
NEPI Rockcastle’s sustainability strategy, endorsed by its Board of Directors, is built on four foundational pillars:
Investing in healthy and sustainable buildings
Fostering trust with stakeholders
Renewable energy leadership
Cultivating an attractive, professional, and ethical work environment
Key elements of the Group's strategy include emissions and energy reduction, natural resources conservation, support for tenant-led sustainability initiatives, local employment boost around the centres, enhanced visitor satisfaction and community engagement. NEPI Rockcastle has already allocated significant resources and initiated renewable energy projects in 2025, with continued implementation planned for 2026. The €110 million investment programme focuses on on-site photovoltaic installations and greenfield developments, aiming to reduce carbon emissions across all three scopes. An additional €47 million was approved in 2025 for Battery Energy Storage Systems. Energy efficiency programmes, supported by monitoring systems, complement these efforts. €64million of the total investment programme was spent until December 2025.
NEPI Rockcastle's sustainability strategy aligns with 10 UN SDGs, as presented also in the Sustainability Linked Financing Framework (SLFF) issued in 2023, which benefited from a second party opinion by S&P Global Ratings.

Overview of Value Chain
// ESRS SBM-1_25 to SBM-1_28
The Group’s business model is centred on providing dynamic retail environments that integrate shopping, leisure, and community engagement, with a focus on creating enduring value for tenants, consumers, investors, and society at large. Rental income remains the principal revenue stream. The Group’s value chain encompasses a series of interrelated activities designed to meet strategic objectives in line with regulatory standards requirements. These activities include identifying, acquiring, operating, and developing high-quality retail properties, guided by thorough due diligence and adherence to environmental best practices. Engaging with tenants and managing leases are fundamental, with customised approaches that promote lasting relationships across a diverse tenant portfolio. Ongoing property management ensures asset quality and involves stakeholders through regular satisfaction surveys and community-oriented events. The Group prioritises direct engagement with end-users to build customer loyalty by implementing structured feedback systems, loyalty programmes, and local initiatives. To drive continual improvement and support sustainability targets, the Group measures performance using indicators such as tenant retention rates, tenant sales, footfall, Net Promoter Score (NPS), Occupancy Cost Ratio (OCR), and energy consumption.
NEPI Rockcastle relies on several key inputs to support its operations and strategic goals. These include:
Financial resources: secured through equity and debt (including sustainable finance instruments such as green bonds, loans, and revolving facilities with ESG features)
Human capital: comprising 687 employees, the workforce is critical to the Group’s success. There is a strong focus on diversity, inclusion, and professional development through training and career advancement opportunities
Supply chain: aligned with ESG principles, ensuring responsible sourcing of materials and services
Assets: the Group’s portfolio of assets, including shopping centres across the region, forms the foundation of its value proposition
Intellectual capital: a strong brand name and reputation, operating systems and processes to drive robust corporate governance
Natural resources: the Group utilises natural resources, such as energy and water. Renewable energy sources and water efficiency measures are integral to the Group’s sustainability strategy
Digital and technological infrastructure: Building Management Systems (BMSs), tenant communication platforms (Chainels), sustainability data analytics tool (Deepki), internal systems and platforms, further enhance operational efficiency and enable optimisation
The outputs of NEPI Rockcastle’s business model generate tangible benefits for stakeholders:
Tenants gain access to well-maintained, strategically located properties that support their operational needs and foster growth opportunities
Investors benefit from consistent revenue streams and long-term value appreciation
Local communities and the customers experience the well operated assets and newly developed projects that improve infrastructure, create jobs, and enhance local environments and economy
Below is a representation of the main features of the Group upstream and downstream value chain and the Group position in the value chain:
NEPI Rockcastle’s Value Chain |
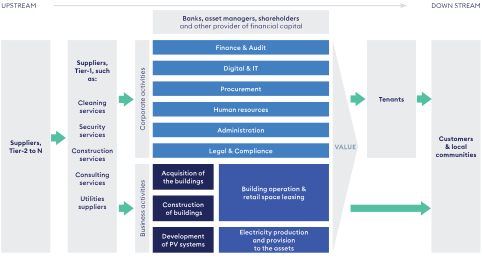
SBM-2 – Interests and views of stakeholders
Stakeholder Engagement and Insights
// ESRS SBM-2_01 to SBM-2_07, SBM-2_12
NEPI Rockcastle integrates stakeholder perspectives into its strategy and business model through a systematic and continuous engagement process that ensures alignment with expectations, supports strategic objectives, and strengthens the Group’s long-term resilience. Key stakeholder groups include employees, tenants, members of the Board of Directors, customers, visitors and local communities, financing partners and investors, suppliers, and environmental experts. Engagement is tailored to the needs of each group and conducted through interviews, surveys, workshops, and ongoing communication channels.
Stakeholder group | Examples of engagement |
|---|---|
Employees |
|
Tenants |
|
Board Members |
|
Customers, Visitors and Local Communities |
|
Financing Partners and Investors / Shareholders |
|
Suppliers |
|
The purpose of stakeholder engagement is to validate material topics, gather actionable insights to inform strategic decisions, build trust, and enhance transparency. Outcomes are generally documented and incorporated into decision-making. For example, employee feedback has led to expanding training and inclusion programmes, investor insights have improved governance practices, and community input has shaped social responsibility initiatives.
In addition to ongoing engagement, NEPI Rockcastle deepens its understanding of stakeholder priorities through the Double Materiality Assessment (DMA), which informs the identification of impacts, risks, and opportunities across all sustainability dimensions. In 2024, internal and external stakeholders were involved in the DMA process to validate and assess NEPI Rockcastle’s identification of IROs (impacts, risks, opportunities). This collaborative approach enriched the materiality analysis by integrating diverse perspectives. Engagement activities included structured interviews, surveys, and workshops. Interviews allowed key representatives to evaluate sustainability topics in depth, with feedback systematically recorded. Anonymous online surveys targeted employees and tenants, combining closed-ended questions to assess key topics with open-ended questions to gather additional insights. The table below summarises the stakeholder engagement process conducted in 2024.
Stakeholder group | Representation | Form of engagement | ESRS covered |
|---|---|---|---|
NEPI Rockcastle’s Employees | Employees | Survey | All |
NEPI Rockcastle’s Tenants | Selected tenants | Survey | All |
NEPI Rockcastle’s Board Members | Two non-Executive Directors | Interview | All |
Customer Representative | Representative of the Polish Consumer Federation | Interview | ESRS S3 ESRS S4 |
Financing partners | Selected banking partners and asset managers as bondholders | Interview | All |
Environmental experts | External advisors | Analysis | ESRS E1-E5 |
In 2025, NEPI Rockcastle’s organisational and operational structure remained unchanged. The stakeholder mapping was reviewed and confirmed as accurate, with no updates required. Given the stability of the stakeholder landscape and the absence of significant structural changes, a comprehensive engagement process was not conducted; instead, insights and perspectives gathered during prior engagements were utilised after further revision and update. For details on the DMA process, please refer to Chapter IRO-1 – Description of the process to identify and assess material impacts, risks, and opportunities, page .
The Board of Directors receives direct updates on stakeholder prospects and sustainability impacts through Annual General Meetings, investor presentations, and feedback mechanisms such as the DMA process. Consistent reporting embodying stakeholder engagement and sustainability outcomes ensures that the Board remains informed about key issues and priorities. The Sustainability Committee plays a key role in integrating stakeholder viewpoints into strategic decision-making, thereby supporting alignment with stakeholder expectations and advancing the Group’s long-term objectives.
Strategic Changes Driven by Stakeholder Interests
// ESRS SBM-2_08 to SBM-2_11
NEPI Rockcastle has systematically refined its strategy and business model in response to evolving stakeholder interests, ensuring alignment with long-term sustainability goals. The Group’s ongoing dialogue with stakeholders directly informs the Group of strategic adjustments, particularly the integration of sustainability considerations across its operations. As a result, NEPI Rockcastle has implemented Green Finance and Sustainability-Linked Financing Frameworks to embed ESG priorities within its financial structure, supporting compliance with regulatory requirements and industry best practices.
Key business model optimisations include the adoption of green leases, supplier green assessments, and an enhanced CSR engagement strategy, all aimed at fostering enduring partnerships and a resilient retail ecosystem. Anticipated future developments focus on expanding renewable energy generation, increasing digitalization for operational efficiency, and further aligning procurement and due diligence processes with sustainability objectives.
To strengthen stakeholder engagement, NEPI Rockcastle established in 2024 a dedicated Sustainability Communication channel. This channel allows stakeholders to send their feedback, questions and suggestions regarding sustainability initiatives and broader business matters.
The Group actively monitors and answers incoming messages, while the received input is tracked and summarised in an annual report with findings, if any. This process helps inform the ongoing evaluation and refinement of NEPI Rockcastle’s sustainability strategy and objectives.
In 2025, the Group received 243 emails via the Sustainability Communication channel. Only 2% of these messages were related to sustainability topics. All issues raised were forwarded to the relevant centres for clarification and resolution. The remaining messages primarily concerned leasing offers, indicating that many users treat this channel as an additional general contact point rather than a dedicated platform for sustainability‑related inquiries.
In summary, NEPI Rockcastle’s stakeholder engagement process is structured to capture and address the needs and expectations of core stakeholder groups. This approach supports transparent decision-making, fosters trust and collaboration, and drives continuous improvement. The Group will continue to regularly collect and assess stakeholder feedback to refine its sustainability strategy and measure its effectiveness, in accordance with regulatory requirements.
SBM-3 - Material impacts, risks and opportunities and their interaction with strategy and business model
// ESRS SBM-3_01 to SBM-3_08, SBM-3_10 to SBM-3_12
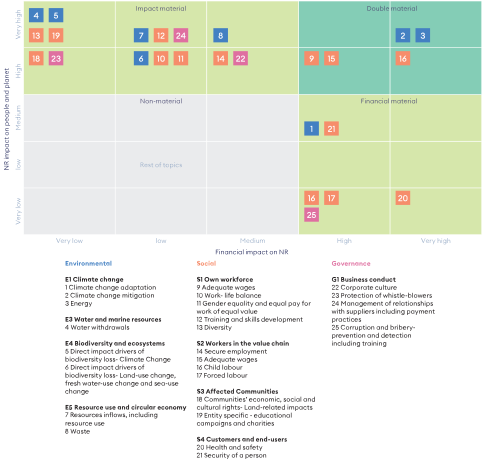
NEPI Rockcastle’s Double Materiality Map presents the outcomes of the DMA process, which was initially concluded in 2024 and subsequently updated in 2025. This map demonstrates that the Company has assessed impacts, risks, and opportunities from both an impact perspective (including environmental and social aspects) and a financial perspective. The following tables outline the sustainability-related IROs identified by NEPI Rockcastle through the DMA process. NEPI Rockcastle has determined that ESRS E1, E3, E4, E5, S1, S2, S3, S4, and G1 are material.
The 2025 update confirms overall stability of material topics compared to 2024. Most ESRS topics and sub-topics previously identified as material remain unchanged. Changes relate to a limited number of sub-topics that were assessed as material in 2024 but no longer meet the materiality threshold in 2025.
In the environmental area, selected biodiversity outcome indicators (species population size, land degradation, desertification and soil sealing), water consumption and resource outflows related to products and services were reassessed as non-material. Direct biodiversity drivers, water withdrawals, and core circular economy aspects remain material.
In the social area, several sub-topics under Workers in the value chain (S2), as well as limited elements under Own workforce (S1) and Customers and end-users (S4), were reassessed as non-material.
In this year’s report, the Company will concentrate on the following ESRS topics: E1 (climate change), E3 (water), E5 (the circular economy), S1 (NEPI Rockcastle’s own workforce), and G1 (business conduct). For the remaining topics, the Company has applied phase-in approach, which is allowed as per directive. Below is a brief description of each material topic:
E1 – Climate Change. This topic addresses the Company’s efforts to mitigate and adapt to climate change, including the reduction of greenhouse gas emissions, energy efficiency initiatives, and resilience to climate risks
E3 – Water. This focuses on responsible water management, conservation measures, and the mitigation of water-related risks across operations
E5 – Circular Economy. This pertains to the adoption of waste reduction, resource efficiency, segregation, and sustainable product lifecycle management
S1 – Own Workforce. This topic covers matters related to NEPI Rockcastle’s own employees, including labour practices, diversity and inclusion, employee wellbeing, and talent development
G1 – Business Conduct. This addresses ethical business practices, anti-corruption measures, compliance with laws and regulations, and strong corporate governance
For each of these material sub-topics, the report outlines both positive and negative impacts, as well as the associated risks and opportunities. The IROs are categorised based on whether they relate to Own Operations (OO) or the Value Chain (VC). The VC is further divided into Upstream (U) and Downstream (D). A brief description and time horizon is provided for each IRO. NEPI Rockcastle presents more detailed information for each covered ESRS topic in the following chapters of this report.
 | Positive |  | Negative |  | Opportunity |  | Risk |
E1 Climate change
Sub-topic | IRO Type | Description | Actual/Potential | Time horizon1 | Own operations/ value chain |
Climate change mitigation | | Scope 1 & 2 GHG emissions from buildings (common areas) | Actual | Long-term | Own operations |
| Scope 3 GHG emissions from tenant energy use (categories 3 & 13) | Actual | Long-term | Value chain | |
| Regulatory and investor pressure on energy efficiency | Actual | Medium-term | Own operations | |
| Emission reduction through energy-efficient technologies | Actual | Short-term | Own operations | |
| Embodied carbon reduction in building design | Potential | Medium-term | Own operations | |
Climate change adaptation | | Climate adaptation investments for building resilience | Actual | Short-term | Own operations |
Energy | | Development of own PV farms and PV panels on site | Actual | Long-term | Own operations |
| Investing in renewable energy sources, such as solar panels. | Actual | Long-term | Own operations |
- The classification of time horizons for climate-related IROs (as identified under ESRS E1) aligns with the timeframes defined in NEPI Rockcastle’s TCFD
Assessment: Short-term: 1 year; Medium-term: by 2040; Long-term: by 2050.
E3 Water and marine resources
Sub-topic | IRO Type | Description | Actual/Potential | Time horizon1 | Own operations/ value chain |
Water withdrawals | | Operational water use for commercial properties | Actual | Short-term | Own operations |
- Short-term- 1 year; Medium-term- 1–5 years; Long-term- > 5 years.
E4 Biodiversity and ecosystems
Sub-topic | IRO Type | Description | Actual/Potential | Time horizon1 | Own operations/ value chain |
Direct impact drivers of biodiversity loss | | GHG emissions across scopes 1, 2 & 3 | Actual | Long-term | Own operations Value chain |
| Land-use change and ecosystem disruption from buildings construction and operations | Actual | Long-term | Own operations |
- Short-term- 1 year; Medium-term- 1–5 years; Long-term- > 5 years.
E5 Circular economy
Sub-topic | IRO Type | Description | Actual/Potential | Time horizon1 | Own operations/ value chain |
Resources inflows, including resource use | | Resource use for construction, renovation, and extensions of the buildings | Actual | Short-term | Own operations |
Waste | | Operational waste from shopping centers | Actual | Short-term | Value chain |
- Short-term- 1 year; Medium-term- 1–5 years; Long-term- > 5 years.
S1 Own workforce
Sub-topic | IRO Type | Description | Actual/Potential | Time horizon1 | Own operations/ value chain |
Working conditions | | Employee compensation benchmarking and annual review | Actual | Long-term | Own operations |
| Remuneration benchmarking and incentive plan management | Actual | Long-term | Own operations | |
| Core benefits program with regional enhancements | Actual | Long-term | Own operations | |
Equal treatment and opportunities for all | | D&I Policy and gender equality standards | Actual | Long-term | Own operations |
| Employee Training and Development Program | Actual | Long-term | Own operations | |
Diversity | | EDGE certification and diversity enhancement initiatives | Potential | Medium-term | Own operations |
- Short-term- 1 year; Medium-term- 1–5 years; Long-term- > 5 years.
S2 Workers in the value chain
Sub-topic | IRO Type | Description | Actual/Potential | Time horizon1 | Own operations/ value chain |
Working conditions | | Promotion of suppliers workforce fair employment practices | Actual | Long-term | Value chain |
| Increase in statutory minimum wage | Actual | Medium-term | Value chain | |
| Tender-based wage verification | Actual | Medium-term | Value chain | |
Other work-related rights | | Risk of Child Labour in Upstream Supply Chain | Actual | Medium-term | Value chain |
| Risk of Forced Labour in Material Supply Chain | Actual | Medium-term | Value chain |
- Short-term- 1 year; Medium-term- 1–5 years; Long-term- > 5 years.
S3 Affected Communities
Sub-topic | IRO Type | Description | Actual/Potential | Time horizon1 | Own operations/ value chain |
Communities’ economic, social and cultural rights | | Redevelopment of previously used or contaminated sites | Actual | Short-term | Value chain |
| Awareness campaigns and educational programs in commercial properties (entity specific) | Actual | Long-term | Value chain |
- Short-term- 1 year; Medium-term- 1–5 years; Long-term- > 5 years.
S4 Customers and end-users
Sub-topic | IRO Type | Description | Actual/Potential | Time horizon1 | Own operations/ value chain |
Personal safety of consumers/end-users | | Ensuring safety in shopping centers: managing risks in high-footfall environments | Actual | Medium-term | Value chain |
| Security risks in high-traffic urban shopping centers | Actual | Long-term | Value chain |
- Short-term- 1 year; Medium-term- 1–5 years; Long-term- > 5 years.
G1 Business conduct
Sub-topic | IRO Type | Description | Actual/Potential | Time horizon1 | Own operations/ value chain |
Corporate culture | | Policies, training, and governance for risk and compliance | Actual | Short-term | Own operations Value chain |
Protection of whistle-blowers | | Whistleblowing rules, reporting mechanisms, and awareness programs | Actual | Short-term | Own operations Value chain |
Management of relationships with suppliers including payment practices | | Fair and transparent payment practices | Actual | Long-term | Value chain |
| Sustainable procurement: applying the green assessment tool in supplier selection | Actual | Medium-term | Own operations Value chain | |
Corruption and bribery | | Risk of corruption due to insufficient awareness and controls | Actual | Short-term | Own operations |
- Short-term- 1 year; Medium-term- 1–5 years; Long-term- > 5 years.
IRO-1 - Description of the process to identify and assess material impacts, risks and opportunities
NEPI Rockcastle carried out its first DMA in 2024, in alignment with ESRS requirements. The Company reviewed its DMA in 2025 and re-assessed selected impacts, risks, and opportunities to ensure that all relevant material aspects were appropriately considered and prioritised.
Methodologies and Assumptions
// ESRS IRO-1_01
The methodology applied for the Double Materiality Assessment (DMA) was based on the principles outlined in the first set of European Sustainability Reporting Standards (ESRS), issued in July 2023, and the implementation guidance on materiality assessment published by EFRAG in May 2024.
Process for Identifying Impacts, Risks and Opportunities
// ESRS IRO-1_02 – IRO-1_10
The DMA was carried out through the following steps, as illustrated in the funnel diagram below, which shows how understanding the business context feeds into the identification and assessment of potential and actual IROs, and how these are subsequently filtered to determine the final list of material sustainability topics and IROs.
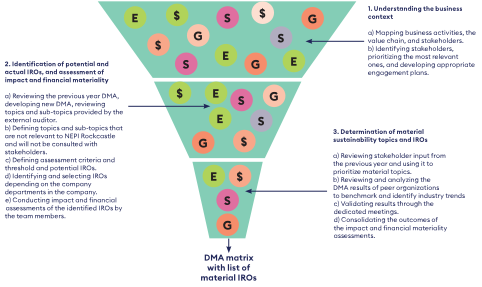
Step 1: Understanding the business context
No material changes occurred in NEPI Rockcastle’s organisational or operational structure since the previous DMA. Key developments included expanding the photovoltaic (PV) business line to include greenfield PV farm projects. These changes broadened the scope but did not significantly alter operations, so assumptions from the prior DMA were retained. Stakeholder mapping was reviewed with no changes identified. Given the stable stakeholder landscape and limited structural changes, a full engagement process was not repeated, and previous results were reviewed and used.
Step 2: Identification of potential and actual IROs, and assessment of impact and financial materiality
As part of the 2025 DMA, NEPI Rockcastle reviewed the previous year’s assessment, including methodologies, material topics, and auditor’s feedback, to improve the process and ensure compliance with CSRD and ESRS. Several sustainability topics were preliminarily excluded as no longer material to the company’s activities, value chain, or geography, based on expert judgment and prior results. Although these topics were excluded from the detailed analysis, internal teams were asked during consultations to confirm whether any related impacts, risks, or opportunities existed. Topic owners assessed actual and potential IROs in department-specific workshops moderated by the Sustainability Team, with each session including an explanation of methodology, scoring criteria, and structured discussion of relevant IROs. During these workshops, the interconnections between the identified impacts and the related risks and opportunities were considered. For each assessed risk and opportunity, participants verified whether the issue originated from, or was linked to, previously identified actual or potential impacts.
The tables below present the criteria applied in the impact, risks and opportunities materiality assessment during the department-specific workshops.
Table. Assessment of impact materiality
Impact materiality | Negative impact | Positive impact | ||
|---|---|---|---|---|
Severity | Scale | 1 | Negligible | Negligible |
2 | Minimal - These have almost negligible effect on the environment. | Minimal - Compliance with applicable national/international (including industry-specific) laws | ||
3 | Low- Noticeable impacts | Low - the solutions/ action may exceed minimum legal requirements, but their overall impact on the environment/ people is minor. | ||
4 | Medium- Substantial impacts | Medium - the action/ solution exceeds minimum regulatory requirements, and its impact is clearly visible in terms of environmental/ social improvement | ||
5 | High - Non-compliance/violation of applicable national/international (including industry-specific) laws resulting in financial penalties, sanctions, and damage to the organisation's reputation | High - Impact is beneficial for environment/people (action beyond legal regulations) | ||
Scope | 1 | It may concern individual units within the organisation (Social and Environmental impacts) | ||
2 | Impact on own employees, community/residents living near the organisation's activities/investments (Social impacts) | |||
Impact on areas near the organisation's locations/investments (Environmental impacts) | ||||
3 | Impact on own employees, employees in the value chain (suppliers), local community where the organisation operates/has investments at the city/region level (Social impacts) | |||
Impact on areas within the city/region where the organisation operates/has investments (Environmental impacts) | ||||
4 | Impact on employees in the value chain (suppliers), as well as the community where the organisation operates/has investments at the national level (Social impacts) | |||
Impact on areas within the country where the organisation operates/has investments (Environmental impacts) | ||||
5 | International/global impact on people (Social impacts) | |||
International/global environmental impacts (Environmental impacts) | ||||
Irremediable character (for negative impacts) | 1 | Almost no resources are needed to mitigate/remediate the negative impact since it is negligible | ||
2 | Relatively easy to mitigate/remediate in a short time (<1 year) (low costs, relatively low involvement) | |||
3 | Possible to mitigate/remediate over a longer period of time (1-3 years) (higher costs, requires involvement) | |||
4 | Difficult to mitigate/remediate (3-5 years) (high costs require significant involvement) | |||
5 | Very difficult to mitigate /remediate (>5 years) (very high costs, requires significant involvement) or irreversible | |||
Likelihood (for potential impacts) | 1 | Not applicable/ Negligible | ||
No known instances of occurrence | ||||
2 | 2- <=5% probability of occurrence | |||
Minimal or sporadic historical instances of occurrence | ||||
3 | 5-30% probability of occurrence | |||
Clear trend of semi-regular occurrence and reasonable to expect it may occur again | ||||
4 | 30-50% probability of occurrence | |||
Has a history of consistent occurrence and reasonable to expect it will occur again | ||||
5 | > 50% probability of occurrence | |||
Has a history of consistent occurrence and reasonable to expect it will occur again | ||||
Time horizons | Short-term: The reporting period adopted by organisation in its financial reporting- 1 year | |||
Medium-term: The period from the end of the short-term reporting period to five years- 1-5 years | ||||
Long-term: Over five years | ||||
Time horizons for E1 IROs | Short-term: The reporting period adopted by organisation in its financial reporting- 1 year | |||
Medium-term: By 2040 | ||||
Long-term: By 2050 | ||||
Table. Assessment of financial materiality
Financial materiality (risks and opportunities) | ||
|---|---|---|
Magnitude | 1 | No potential impact on EBIT/Negligible |
2 | Potential impact on EBIT <0,1% | |
3 | Potential impact on EBIT 0,1-1% | |
4 | Potential impact on EBIT 1-1,5% | |
5 | Potential impact on EBIT >=1,5% | |
Likelihood | 1 | Not applicable/ Negligible No known instances of occurrence |
2 | 2- <=5% probability of occurrence Minimal or sporadic historical instances of occurrence | |
3 | 5-30% probability of occurrence Clear trend of semi-regular occurrence and reasonable to expect it may occur again | |
4 | 30-50% probability of occurrence Has a history of consistent occurrence and reasonable to expect it will occur again | |
5 | > 50% probability of occurrence Has a history of consistent occurrence and reasonable to expect it will occur again | |
Time horizon | Short-term: The reporting period adopted by organisation in its financial reporting- 1 year | |
Medium-term: The period from the end of the short-term reporting period to five years- 1-5 years | ||
Long-term: Over five years | ||
Time horizons for E1 IROs | Short-term: The reporting period adopted by organisation in its financial reporting- 1 year | |
Medium-term: By 2040 | ||
Long-term: By 2050 | ||
Step 3: Determination of material sustainability topics and IROs
Materiality was assessed at the level of individual impacts, risks, and opportunities ('short list') for each sub-topic. A sub-topic was classified as material if any related impact, risk, or opportunity was rated High or Very High. The final list of material topics included those meeting impact or financial materiality criteria, in line with the double materiality principle. Results were validated against last year’s stakeholder feedback, compared with previous DMA outcomes, and benchmarked against peers. Final identification was confirmed through review meetings where feedback was collected and adjustments made.
Decision-Making and Internal Controls
// ESRS IRO-1_11
The Group applies certain steps to ensure that all information captured in the report is correct and aligned with the Data Collection Procedure. The Sustainability Data Analytics Manager oversees the accuracy of all input data and formulas, safeguarding data integrity and ensuring strict adherence to the established methodology. As part of the data collection procedure, relevant data was gathered from internal operational records, prior stakeholder engagement outputs, and regulatory guidance. This information was reviewed, validated, and incorporated into the working files, with checks in place to confirm traceability and consistency throughout the assessment process. The internal audit team conducted a thorough review of the double materiality assessment process, confirming its robustness and compliance with internal controls and company policies, and reviewed the calculation process for selected environment KPIs. The Head of Sustainability and the Internal Audit Director carried out reasonability checks on the DMA process and outcomes, including validation of notable differences observed between internal and external stakeholder perspectives. Additionally, the Internal Audit Director evaluated the audit trail and the complete assessment process, using records provided by the Sustainability Department to ensure transparency and traceability.
The finalised results of the double materiality assessment were submitted to the Sustainability Committee for oversight.
Integration with Risk Management and Strategy
// ESRS IRO-1_12 – IRO-1_13
The outcomes of the Double Materiality Assessment support the regular processes through which sustainability-related risks and impacts are considered within the Group’s broader risk oversight activities. The Group Head of Sustainability acts as a Sustainability Risk Partner and, together with the Group Risk and Compliance Officer, contributes to the quarterly update of the corporate risk register. As part of this process, sustainability-related insights - both impact-focused and financially oriented - are reviewed and incorporated where relevant. In addition, certain impacts and risks identified during the DMA are also reflected in the risk register by other Risk Partners responsible for their respective domains.
Input Parameters and Process Changes
// ESRS IRO-1_14 – IRO-1_15
The 2025 DMA relied on updated input parameters reflecting developments in the business, regulatory landscape, and sector practices.
Key parameters included the data sources used for the assessments such as internal operational data, previous stakeholder engagement outputs, regulatory guidance, and auditor recommendations, and the scope of operations covered, including all assets and business lines active during the reporting period, notably the expanded PV business line.
Compared with the previous cycle, clearer definitions of ESRS sub-topics and sub-sub-topics were introduced to support more consistent interpretation across departments.
Whilst the underlying methodology remained aligned with the approach applied in the prior reporting period, several refinements were implemented in 2025. These included enhancements to the structure of departmental workshops and strengthened internal validation procedures to ensure assessments were consistently reviewed and fully traceable. The next DMA review is scheduled in 2026, as part of the regular annual update cycle, with future revisions expected to reflect further regulatory guidance, assurance feedback, and developments in the company’s operations or value chain.
IRO-2 - Disclosure Requirements in ESRS covered by the undertaking’s sustainability statement
// ESRS IRO-2_01 to IRO-2-02, IRO-2_13
For each material sustainability matter, NEPI Rockcastle reviewed the relevant disclosure and application requirements included in the ESRS standards. In preparation for the 2025 Sustainability Statement, NEPI Rockcastle disclosed all mandatory information that is applicable, relevant and material to meet the objectives of the disclosure requirements. Please refer to the ESRS Table documented in the Appendix 1 of the Sustainability Statement.
MDR-P Policy overview
The Minimum Disclosure Requirement Policy (MDR-P) overview provides information relevant to the MDR-P sections E1, E3, E5, S1, and G1. At present, the Group is unable to report on the consideration of key stakeholders' interests for the policies outlined below. NEPI Rockcastle will gather the necessary information for future disclosures.
ESRS | Policy | Description | Scope | Accountability | Third party standards | Availability |
|---|---|---|---|---|---|---|
E1, E3, E5 | Environmental Policy |
| All assets | CEO with Board of Directors oversight | N/A | Internally available |
E1 | Climate Change Policy |
| All assets | CEO with Board of Directors oversight | N/A | Internally available |
E1 | Instructions for Creating Climate Change Adaptation Plans and Improving Building Resilience |
| All assets | Head of Sustainability | N/A | Internally available |
E1, E3, E5 | Sustainable Development Policy |
| New developments | CEO with Board of Directors oversight | N/A | Internally available |
E1, E3, E5 | Sustainable Procurement Policy |
| All procurement activities | The Group Head of Procurement | N/A | Internally available |
E1 | Sustainability Communication Policy |
| External parties and stakeholders | Group Head of Sustainability with Board of Directors oversight | N/A | Available publicly on NEPIRockcastle’s website |
S1 | International Labour Organisation (ILO) aligned Policy |
| All NEPI Rockcastle employees | HR Department with Board of Directors oversight | Alignment to ILO | Available publicly on NEPI Rockcastle’s website |
S1 | Diversity and Inclusion Policy and Diversity and Inclusion Employee Regulation |
| All NEPI Rockcastle employees | HR Department with Board of Directors oversight | Alignment to ILO | Internally available |
G1 | Sustainability Reporting Policy |
| All NEPI Rockcastle employees | Sustainability Department | N/A | Internal document |
G1 | Code of Ethics |
| All NEPI Rockcastle employees, Directors, Consultants, Contractors, Tenants | CEO with Board of Directors oversight | Alignment to ILO, Dutch Corporate Governance Code, King IV Report | Available publicly on NEPI Rockcastle’s website |
G1 | Whistleblowing Policy |
| All NEPI Rockcastle employees, Consultants Contractors, Tenants, any other External Stakeholders | Internal Audit with Audit Committee oversight | N/A | Available publicly on NEPI Rockcastle’s website |
G1 | Sponsorship and Donations Procedure |
| All NEPI Rockcastle employees | PR Department | Internally available | |
G1 | IT Governance Policy |
| All NEPI Rockcastle employees | Board of Directors | N/A | Internally available |
G1 | Risk Management Policy |
| All NEPI Rockcastle employees | Board of Directors | Aligned to ISO 31000 Aligned to Treadway Commission's Committee of Sponsoring Organizations (COSO) framework. | Internally available |
G1 | Compliance Policy |
| All employees | CEO with Board of Directors oversight | N/A | Internally available |
G1 | Group Procurement Procedure for Asset Management |
| Asset Management | Group Procurement Director | N/A | Internally available |
G1 | Human Rights Due Diligence Policy |
| All NEPI Rockcastle employees | Group Head of Sustainability, Compliance, Internal Audit | UNGPs, OECD Guidelines, ILO Core Conventions | Both Internal and public availability |
G1 | Payment Policy |
| All NEPI Rockcastle employees | Accounting Department | N/A | Internally available |
G1 | Sanctions Policy |
| All NEPI Rockcastle employees | The Compliance and Risk Management Department | N/A | Internally available |
G1 | Know-your- counterparty Procedure |
| All NEPI Rockcastle employees | The Compliance and Risk Management Department | N/A | Internally available |
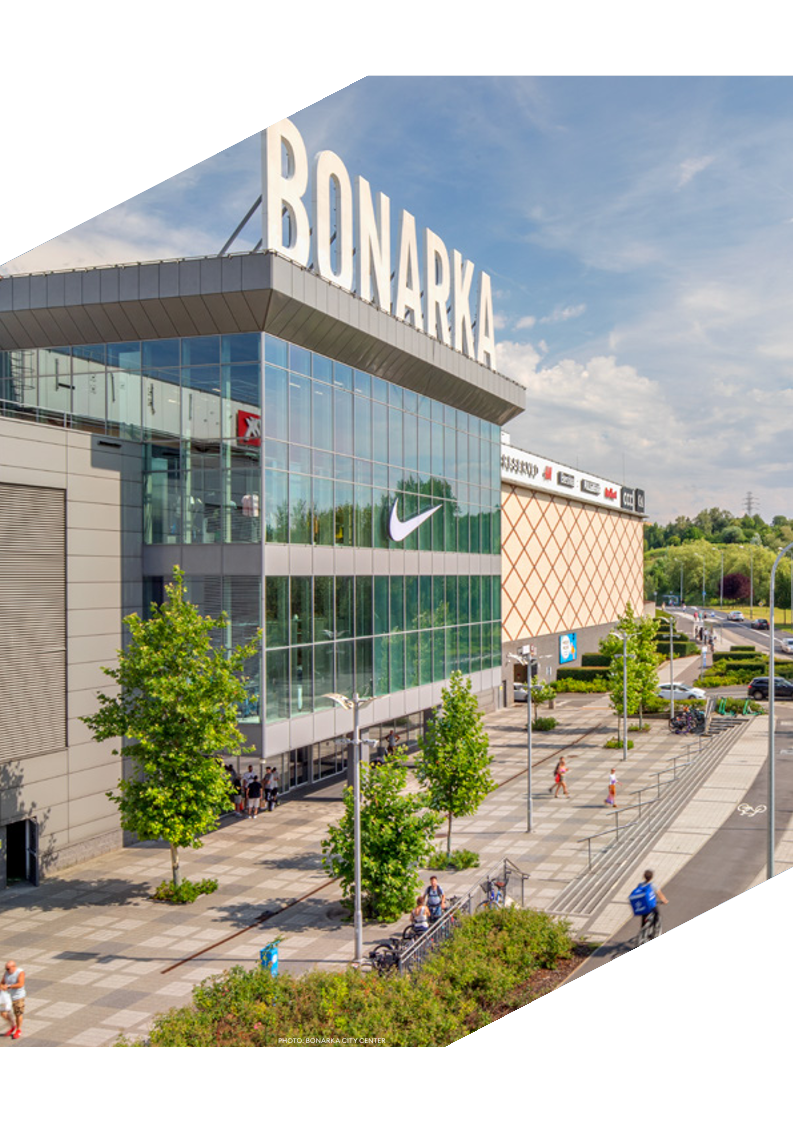
ESRS E1 - Climate Change
Introduction
Addressing climate change is a global necessity and an environmental priority for NEPI Rockcastle, given the real estate sector’s contribution to greenhouse gas (GHG) emissions and vulnerability to climate related risks. The Group recognises the necessity of integrating climate resilience and mitigation into its operations to safeguard the long-term value of its portfolio, meet regulatory requirements, and enhance tenant and customer satisfaction. Addressing climate change is interconnected with other environmental priorities, including biodiversity conservation, responsible resource management, and the shift towards a circular economy. NEPI Rockcastle’s approach is reflected in its two sustainability strategy pillars, Invest in Healthy and Sustainable Buildings and Renewable Energy Leadership, which underscore the Group's focus on reducing environmental impact whilst creating people-centric spaces.
In 2024, NEPI Rockcastle reaffirmed its climate change priorities through strategic actions aligned with and validated by the Science-Based Targets initiative (SBTi) and guided by the energy hierarchy principles. The company continued throughout 2025 to pursue these objectives, working towards the set targets as part of its climate strategy delivery.
In 2025, the Group continued to prioritise energy efficiency as a foundational step in its decarbonisation journey, and achieved measurable reductions in energy intensity across the portfolio. Simultaneously, it advanced in renewable energy adoption, with investments in on-site photovoltaic systems. The Group currently meets 6% of the electricity needs across its portfolio and aims to increase the share of self-produced renewable electricity through investments in on- and off-site photovoltaic installations.
Since 2024, the Group has advanced its climate adaptation strategy by assessing climate‑related hazards such as heatwaves, floods, and extreme weather events. An asset‑level hazard and vulnerability assessment was conducted in line with Appendix A of the EU Taxonomy Climate Delegated Act. Based on the findings, climate adaptation measures were defined to address key risks. In 2025, the Group initiated the implementation of several building‑level adaptation measures and allocated capital expenditure for further actions within the 2026 plan.
GOV-3 Integration of sustainability-related performance in incentive schemes
// ESRS E1.GOV-3_01 to E1.GOV-3_03
NEPI Rockcastle incorporates sustainability and climate-related considerations into Executives' KPIs, aligning leadership with the Group's ESG objectives. Through variable compensation mechanisms, the Group rewards contribution to its decarbonisation strategy, ensuring a direct link between sustainability achievements and remuneration.
These mechanisms are regularly reviewed and adapted to address changing regulations, market dynamics, and stakeholder expectations, with ongoing oversight by the Remuneration Committee to ensure transparency and alignment with the Group’s strategic objectives. In 2025, Executive KPIs addressed core climate objectives, including a 10% reduction in Scope 1 and 2 emissions and a 5% reduction in energy intensity in common areas. For further details on remuneration processes and figures, refer to NEPI Rockcastle’s Remuneration Report section, page .
Executive metrics include both near-term outcomes, i.e. reduction in operational emissions and energy intensity, as well as long-term goals, i.e. building the Company’s own renewable energy capacity.
E1-1 – Transition plan for climate change mitigation
Climate Transition Plan
// ESRS E1-1_1 to E1-1_3
In 2025, the Group advanced its work on developing an indicative Transition Plan, building on the foundations established in 2024. During the year, a Transition Plan was prepared, consolidating existing measures and outlining potential pathways towards the Group’s long-term objective of achieving net-zero GHG emissions by 2050. Whilst the plan was not formally adopted in 2025, it provides valuable insights into the scale, sequencing and resourcing of the actions required. From 2026 onwards, the Group will continue to refine the Transition Plan in close collaboration with its asset and property teams. The next phase will focus on identifying and prioritising asset-level initiatives, aligning actions with operational reality, and allocating budgets to initiatives that are both feasible and impactful.
This iterative approach is intended to ensure that the Transition Plan is practical, well-governed and integrated into business planning, supporting a credible and deliverable pathway towards the Group’s net-zero ambition.
NEPI Rockcastle’s draft Transition Plan consolidates existing measures and aligns decarbonisation goals with the Paris Agreement’s 1.5°C target, as validated by the SBTi in March 2024. The plan establishes ambitious interim objectives to be achieved by 2030, including reducing Scope 1 and 2 emissions by 80% from a 2019 baseline and cutting Scope 3 emissions (categories 3 and 13 - fuel and energy-related activities, downstream leased assets) by 25% from a 2022 baseline1. Additionally, 2030 targets address energy reduction and increased renewable energy use, as detailed in E1-4. Scenario-based analyses (using SSP2-4.5 and SSP5-8.5 frameworks) inform the prioritisation of high-impact initiatives, such as expanding renewable energy capacity, deploying energy-efficient technologies, and engaging tenants through green leases to foster energy-efficient practices across the portfolio.
Renewable energy expansion is a key priority. Between 2022 and 2024, the Group invested in 29 photovoltaic installations in Romania and one in Lithuania, collectively serving 28 retail properties, with a total installed capacity of 38 MW - supplying 6% of the Group’s total electricity consumption in 2024 and delivering a similar proportion again in 2025. The Group further supported its transition by sourcing certified green electricity through the Guarantees of Origin mechanism, in compliance with EU directives. In Q4 2024, NEPI Rockcastle acquired two companies with permits for greenfield photovoltaic projects. During 2025, the Group progressed with the subsequent phases of its renewable energy programme, which include the installation of 15 MW across 22 properties outside Romania and the development of new greenfield photovoltaic projects with a planned capacity of 159 MW, with full completion anticipated in the coming years. In Q4 2025 the Group inaugurated Romania’s largest greenfield photovoltaic power plant, developed and owned by a shopping centre owner - 54 MW (in testing through year-end).
Once finalised, all these projects will result in up to 47% of the Group’s portfolio electricity needs being met based on own production, positioning NEPI Rockcastle as a regional leader in green electricity for retail real estate.
Decarbonisation potential levers and associated planned key actions
NEPI Rockcastle is considering a set of decarbonisation levers that form the backbone of the Climate Transition Plan, prepared in 2025 and to be further adapted from 2026 onwards, based on operational and economic feasibility. These potential levers outline how the Group intends to deliver measurable and science‑aligned emission reduction across the near‑, medium‑ and long‑term. Each lever is designed to address specific drivers of operational energy use and GHG emissions and is sequenced to align with asset lifecycle and regulatory milestones, while the Group’s investment planning framework will be established starting 2026.
Lever 1 — Building fabric optimisation. Its purpose is to improve the energy performance of assets through building‑envelope upgrades to reduce heating and cooling demand. Key actions to be implemented once feasibility is completed:
Conduct asset‑level building-fabric assessments integrated into refurbishment plans
Upgrade thermal insulation (roofs, façades, walls) and replace existing windows/doors with higher‑performance alternatives
Implement airtightness improvements and reduce thermal bridging
Sequence fabric upgrades before HVAC system replacements to prevent oversising and reduce lifecycle costs
Lever 2 — Building technology optimisation. Its purpose is to enhance the efficiency of technical systems and controls across the portfolio. This lever represents the largest physical GHG abatement opportunity. Key actions that commenced during 2025 and will continue in 2026 and onwards:
Upgrade HVAC systems with high‑efficiency plant, smart controls and variable‑speed technologies
Modernise building management systems (BMS) to enable real‑time optimisation and fault detection
Continue to implement LED replacement programmes and intelligent lighting controls
Optimise mechanical ventilation and deploy demand‑controlled systems
Introduce digital monitoring tools to ensure operational performance is maintained over time
Lever 3 — electrification of central heating. Its purpose is to phase out fossil‑fuel‑based and carbon‑intensive heating sources by transitioning into electric, high‑efficiency, low‑carbon technologies. Options under analysis for which technical and feasibility review has to be performed:
Replace gas‑fired boilers with heat pumps in suitable assets, aligned with refurbishment and equipment end‑of‑life cycles
Conduct technical and grid‑capacity assessments for assets dependent on fossil fuels and district heating
Plan phased transition for assets with district‑heating dependencies, guided by DHN decarbonisation trajectories
Lever 4 — On‑site Solar PV Systems. Its purpose is to increase the proportion of self‑generated renewable electricity through rooftop and carport solar PV installations. Key actions carried out during 2025 and planned to continue in 2026 and onwards, part of Renewable Energy programme:
Deploy solar PV in all countries except from Romania and Lithuania where the systems are already installed
Prioritise large rooftops and car park shading structures to maximise generation potential in new developments
Lever 5 — Off‑site Utility‑Scale Solar PV Plants. Its purpose is to secure renewable energy at scale by developing off‑site solar PV generation capacity. Key planned actions that commenced during 2025 and will continue from 2026 onwards:
Continuing the greenfield installations
Battery storage installation
Lever 6 — Market‑Based Renewable Energy Procurement. Its purpose is to purchase renewable energy certified based on Guarantees of Origin (GOs), as a transitional measure. The Group has been pursuing this lever for several years, also during 2025, and will continue in 2026 and onwards. Key actions:
Maintain annual procurement of GOs where on-site and off‑site renewable electricity production does not yet meet total electricity demand
Provide transparent ESRS‑compliant disclosures, separating market‑based impacts from location‑based performance
Ensure GOs meet high‑integrity criteria and reflect actual renewable generation attributes
Collectively, the six levers enable an estimated 93% reduction in portfolio GHG emissions by 2050, relative to a location‑based business‑as‑usual scenario.
Depending on further technical and feasibility assessments, the levers may be sequenced as follows:
Decarbonisation Levers | Near-term | Medium-term | Long-term |
|---|---|---|---|
Lever 1 – Building Fabric Optimisation | ● | ● | ● |
Prioritise improving the building fabric to enhance overall energy performance | |||
Lever 2 – Building Technology Optimisation | ● | ● | ● |
Enhance building systems to improve energy performance and management | |||
Lever 3 – Electrification of Central Heating | ● | ● | |
Shift heating systems toward electric solutions to support overall decarbonisation | |||
Lever 4 – Onsite Solar PV Systems | ● | ||
Enable on-site renewable generation where feasible | |||
Lever 5 – Offsite Solar PV Plant | ● | ||
Develop utility-scale off-site renewable energy plants to supply clean electricity to the portfolio | |||
Lever 6 – Market-based Renewable Energy | ● | ● | ● |
Procure renewable energy certificates to cover purchased electricity from the grid | |||
NEPI Rockcastle closely integrates sustainability and climate-related considerations into executive KPIs, with variable compensation directly linked to decarbonisation achievements. In 2024 and 2025, the Executive Directors were evaluated on climate objectives such as reducing Scope 1 and 2 emissions and energy intensity in common areas, in support of the Group’s broader GHG reduction goals. Specifically, 15% of variable pay is tied to climate-related targets and renewable energy self-production, covering both immediate operational emission reductions and long-term capacity expansion.
Financial planning at NEPI Rockcastle is aligned with the Group’s decarbonisation strategy, employing scenario analyses to guide investment decisions and balance both environmental and economic outcomes. The CEO and CFO, together with the Sustainability Committee, oversee resource allocation and ensure that financial resources are directed towards projects with significant environmental and economic benefits, in line with the EU Taxonomy for Sustainable Activities. Operational integration of the decarbonisation plan is driven by Executive Directors, with the Group Head of Sustainability and the team responsible for implementing the plan, tracking progress, and reporting on targets. This governance structure ensures transparency, accountability, and adaptability to emerging market and regulatory developments, supporting NEPI Rockcastle's position in sustainable practices in the region.
Investments for Climate Transition
// ESRS E1-1_04 to E1-1_08
The implementation of NEPI Rockcastle’s climate transition plan will be underpinned by CAPEX allocation. Financial resources are carefully directed towards medium- to long-term projects that drive meaningful transformation. Annual CAPEX prioritisation considers alignment with the Group’s decarbonisation strategy by prioritising initiatives that deliver notable environmental and economic returns, whilst meeting evolving regulatory requirements. NEPI Rockcastle’s financial planning aligns with the criteria outlined in the EU Taxonomy for Sustainable Activities under Commission Delegated Regulation 2021/2139.
Details of how economic activities, objectives and plans align with EU Taxonomy criteria are provided in the EU Taxonomy section of this report.
The Company allocates capital expenditure to support the transition to net zero carbon. €42 million was directed in 2025 to buildings that are EU Taxonomy-aligned under activity 7.7 – Acquisition and ownership of buildings and another €48 million was invested under the Green Energy programme under activity 4.1 – Electricity generation using solar photovoltaic technology.
In addition, during the reporting year the Company invested close to €9 million (7.3 and 7.5 together) in energy efficiency measures in buildings that are not yet Taxonomy-aligned. These investments relate primarily to activities eligible under the EU Taxonomy, including installation, maintenance and repair of energy efficiency equipment and installation, maintenance and repair of instruments and devices for measuring, regulating and controlling the energy performance of buildings. These expenditures contribute to the gradual improvement of the energy performance of the existing building stock.
Moreover, the Company strives to ensure that its newly constructed buildings are sustainable and in line with the EU Taxonomy. The Group applies the Carbon Risk Real Estate Monitor (CRREM) methodology to identify and prioritise assets at risk of becoming stranded.
Locked-in GHG emissions, arising from long-lived assets, represent a significant challenge to the Group’s decarbonisation efforts. These emissions are primarily associated with aging infrastructure, fossil fuel dependency from district heating, and the carbon embodied in construction materials. High locked-in emissions potentially increase the risk of non-compliance with decarbonisation goals, regulatory penalties, and the devaluation of assets that fail to meet environmental standards. The Group has set specific targets to reduce emissions embedded in the construction process and incorporate low-carbon construction materials in new developments.
- Different baseline years have been established for Scope 1&2 and for Scope 3, to acknowledge and reflect the significant progress already made for areas within direct control, where the Company has implemented mitigating measures early on. In 2022, the Group adopted a comprehensive methodology to assess extended Scope 3 emissions across all categories as part of the SBTi carbon target validation process. Based on this evaluation, the Group prioritised emissions in Categories 3 and 13, ensuring sufficient coverage of total Scope 3 emissions, and established 2022 as the comparison baseline. Furthermore, as part of the wider 2019 target for 1&2 emissions, the Group has also defined a more granular target to decrease emissions intensity by 40% until 2030, compared to 2022 baseline (also part of the SLFF)
SBM-3 – Material impacts, risks and opportunities and their interaction with strategy and business model
// ESRS E1.SBM-3_01 to E1.SBM-3_07
NEPI Rockcastle’s 2025 DMA identified transition risks related to climate change, each posing unique challenges and creating opportunities for the Group. No physical climate risks have been prioritised through the DMA. Transition risks encompass regulatory changes, market shifts, and increased demand for carbon transparency, with key concerns including compliance with stricter environmental standards, higher costs associated with low-carbon technologies, and reputational risks tied to tenant expectations. Energy-related issues, particularly reliance on traditional energy sources, amplify the transition risks.
A resilience analysis was conducted as part of a broader risk management and sustainability strategy review in 2023, updated in 2024 and it was determined to remain relevant in 2025, in line with TCFD recommendations. SSP2-4.5 (moderate warming) and SSP5-8.5 (high warming) scenarios provided insights into potential outcomes up to a 2050- time horizon and included short-, medium-, and long-term evaluations. Near-term efforts (until 2030) focus on regulatory compliance and energy cost mitigation, whilst medium-term efforts (up to 2040) address tenant expectations, market valuation changes, and renewable energy integration. The analysis involved engagement with internal and external stakeholders, stress-testing key business segments against various climate risks and assessing financial implications.
The resilience analysis assessed the potential impacts of climate change on the strategy and business model, considering both transition and physical risks. It covered core operations, value chain, and investment strategies across all jurisdictions where the Group operates.
Transition risks are addressed through scenario analysis, including high-ambition policy pathways (1.5°C) that could introduce increased carbon pricing and stricter regulatory requirements, leading to higher operational costs and a need for accelerated investment in low-carbon technologies
Physical risks such as more frequent and severe extreme weather events (heatwaves, floods, storms, wildfires) are assessed, with the most vulnerable regions identified and adaptation strategies (e.g. enhanced cooling systems, flood defence systems) under development and implementation
Opportunities are captured by shifting towards renewable energy and circular economy initiatives, improving operational efficiency and reducing long-term costs through investments in energy efficiency, renewable energy production (on-site and off-site), and sustainable financing mechanisms
Investments and financial planning are structured through targeted capital expenditure (CAPEX) and operational expenditure (OPEX), prioritising projects that deliver significant environmental and economic returns, such as energy efficiency upgrades, renewable energy installations, and retrofitting of existing assets (to be planned)
In 2025, the Group used the Carbon Risk Real Estate Monitor (CRREM) methodology to identify and prioritise assets at risk of becoming misaligned due to “locked-in” GHG emissions, particularly from long-lived assets reliant on fossil fuels or high embodied-carbon construction materials. Retrofit strategies and the incorporation of low-carbon materials in new developments are being advanced
Financial planning is closely integrated with decarbonisation strategies, balancing environmental and economic outcomes, and ensuring that resource allocation is overseen by executive and sustainability governance bodies
Continuous monitoring and adaptation processes are in place, with climate-related investments regularly reviewed and adjusted to match evolving regulatory, market, and stakeholder expectations, supporting long-term resilience and value creation
Material climate-related impacts, risks, and opportunities (IROs) are identified and assessed using both high-level and asset-specific evaluations, leveraging data-driven platforms (e.g. Deepki) to model climate hazards and inform resilience strategies
Greenhouse gas (GHG) emissions from direct activities (Scope 1 and 2, e.g. fuel consumption for heating, electricity and heat for buildings) and value chain activities (Scope 3, e.g. tenant operations or energy used) are measured and managed as key climate change impacts
Data collection through tailored questionnaires on building characteristics, location, and resilience measures supports vulnerability assessments across operational sites, tenants, supply chain logistics, and communities, informing the prioritisation of adaptive measures
IRO-1 – Description of the processes to identify and assess material climate-related impacts, risks and opportunities
// ESRS E1.IRO-1_01 to E1.IRO-1_16
NEPI Rockcastle employs a systematic, data-driven process to identify and assess material climate-related impacts, risks, and opportunities (IROs), both high-level and asset-specific evaluations are integrated into this process.
Systemic risks and opportunities are addressed by analysing both transition risks—such as regulatory, market, and technological changes—and physical climate risks. The Group utilises the Deepki platform to model climate hazards and assess asset vulnerabilities, supporting the development of resilience strategies. Evaluations span the entire asset lifecycle, from acquisition to disposal, ensuring comprehensive coverage.
Impacts on climate change
Material climate impacts are primarily related to greenhouse gas (GHG) emissions from direct operations (Scope 1 and 2) and value chain activities (Scope 3, categories 3 and 13). Data is collected through targeted questionnaires on building characteristics, location, and resilience measures, which inform vulnerability assessments for operational sites, tenants, supply chain logistics, and communities.
Physical climate risks
Physical climate risks—including heatwaves, floods, and wildfires—are systematically assessed. Adaptive measures are prioritised based on these assessments, such as enhancing cooling systems, implementing flood defence systems, and improving construction resilience for at-risk properties.
Transition risks and opportunities
Transition risks are evaluated with reference to evolving regulatory requirements (e.g. EU Green Deal), energy efficiency standards, and technological advancements. The Group identifies and pursues opportunities for new revenue streams (e.g. photovoltaic installations), cost reductions through energy efficiency, and asset value enhancement by meeting stakeholder expectations.
Assets are screened for sensitivity to transition risks based on factors such as EPC (energy performance certificate) ratings, energy consumption, and reliance on fossil fuels. Properties with lower EPC scores or significant fossil fuel usage are assessed and will be planned for retrofitting and energy efficiency upgrades. The decision to proceed with retrofits or upgrades is made only if it is financially viable for the business overall.
Aligning climate scenario analysis with financial planning
Climate scenario analysis is integrated with financial planning, ensuring that budget allocations for sustainability projects—such as renewable electricity production and asset retrofitting—are robust under different climate pathways. This approach ensures that NEPI Rockcastle’s resource allocation aligns with both environmental and economic objectives, overseen by executive and sustainability governance bodies.
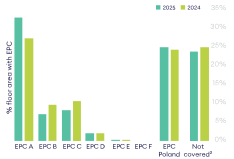
Notes:
1. A-F rating assessed based on the energy performance certificate, where A is the highest and F is the lowest indicator. For Polish assets classification not implemented in the local legislation, therefore they are reported separately
2. Limited parts of some buildings not included in the EPC evaluated area
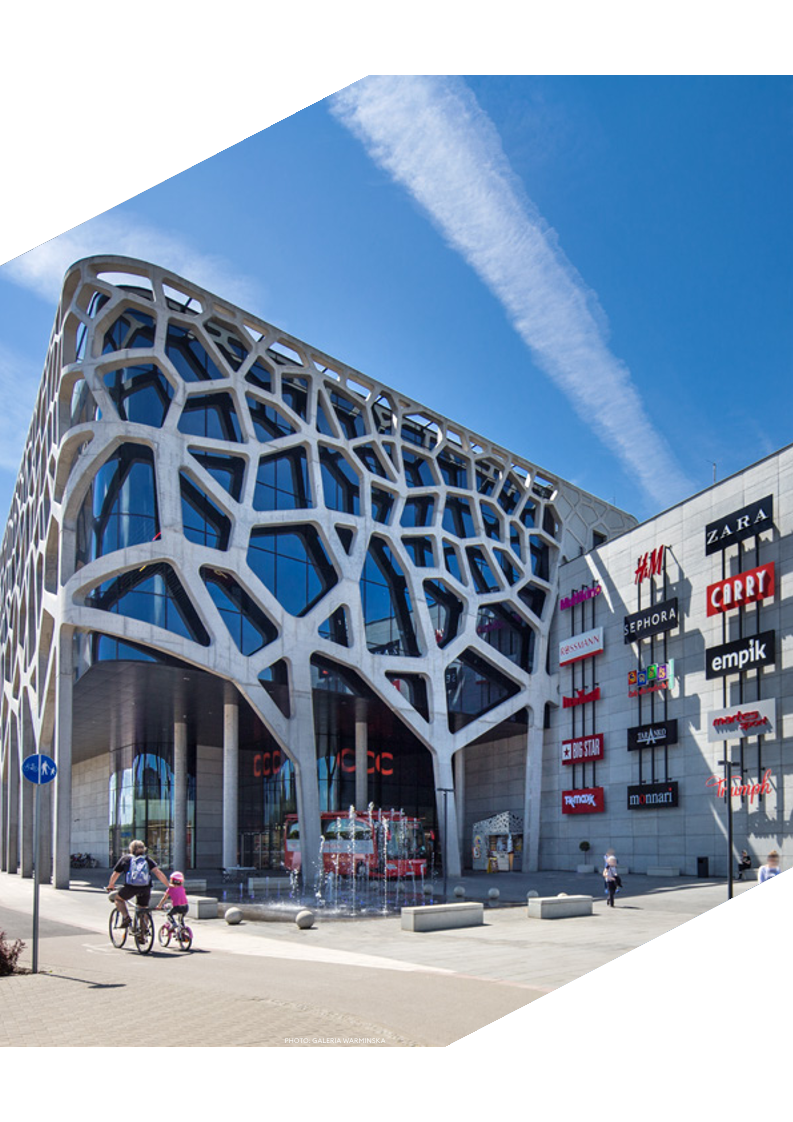
E1-2 – Policies related to climate change mitigation and adaptation
// ESRS E1.MDR-P_01-06, E1-2_01
Please refer to the MDR-P Policy Overview Table, page .
E1-3 – Actions and resources in relation to climate change policies
// ESRS E1.MDR-A_01-12, E1-3_01
Energy efficiency improvements and reduction of the energy demand.
Disclosure of key actions
Energy efficiency improvements are central to NEPI Rockcastle’s decarbonisation strategy. In 2025, the Group expanded LED lighting in common areas, increasing overall coverage up to 95%. Advanced Building Management Systems (BMSs) with automated monitoring now optimise ventilation, air handling, heating, energy use, and lighting. NEPI Rockcastle is working with external suppliers to enhance BMS energy management capabilities with smart capabilities. These smart capabilities use algorithms to adjust airflow based on CO2 levels, regulate heating demand, manage energy loads, and optimise lighting according to daylight. AI-driven BMS algorithms are being developed to further automate operations and enable predictive maintenance, where technologically possible.
Key actions carried out during 2025:
HVAC equipment repairs, including fixing rooftop cooling system leaks, chiller fan replacements for chilled water, and repair of DSO air conditioners
HVAC replacement and upgrades
LED light replacement outside, inside the malls, and parking areas to reduce electricity consumption
Automatic door repairs / replacements to improve energy retention
Exchange of electrical motion sensors in evacuation corridors for improved efficiency
Modernisation of Building Management Systems (BMSs), including advanced monitoring and automation capabilities, as well as add-ons to improve real-time monitoring and optimise system performance across assets
Application of sun protection foils to skylights for enhanced thermal control
Installation of air curtains at entrances to maintain climate control
Elevator automation upgrades to modernise vertical transport and reduce energy demand
Installation of energy saving hand dryers in public washrooms
Launch of a smart energy management technology programme to automate utility data collection, benchmarking, and rapid intervention
Piloting of AI-driven controls in selected assets to optimise BMS operation and identify inefficiencies without compromising comfort
Implementation of variable speed control for air handling units, enabling adjustment to occupancy levels and reducing unnecessary energy use
Energy efficiency continues to be a key element of reducing operational impact and driving long-term sustainability performance. Across the portfolio, these initiatives collectively help lower emissions, enhance asset resilience, and deliver operational cost savings, contributing to a more sustainable portfolio.
Scope of key actions
The energy efficiency actions addressed most pressing needs throughout NEPI Rockcastle’s entire portfolio. These measures aim to reduce energy intensity in both landlord-controlled areas and tenant- occupied spaces through technological upgrades and contractual changes.
Time horizon for key action completion
The Group has established a year‑on‑year capital expenditure plan to support the delivery of these initiatives, beginning in 2022. This structured investment approach ensures that progress is made consistently toward achieving the Group’s targets by 2030.
Description and results of actions to provide or support remedy for those harmed by material impacts
Whilst energy efficiency initiatives primarily target operational improvements, they also indirectly contribute to remedying broader environmental impacts by reducing GHG emissions and enhancing resource conservation.
Progress of prior disclosed actions
Building on progress reported in 2023 and 2024, NEPI Rockcastle maintained its focus on energy efficiency improvements. In 2025, common area energy intensity reduction of 9% across the portfolio was achieved (against a 2022 baseline), contributing to meeting the Group’s interim decarbonisation targets.
Current and future financial resources allocated (CAPEX and OPEX)
In 2025, €8 million in capital expenditure were directed towards energy efficiency projects, including LED installations, UV foil, rooftop, HVAC and BMSs upgrades, air curtains installations. Investments of up to €9 million are planned for 2026 for sustainability initiatives across all countries, covering various priorities, including energy efficiency.
Renewable energy deployment Disclosure of key actions
As outlined throughout this report, the Group made significant progress in renewable energy deployment.
Time horizon for key action completion
Near-term projects, such as on-site PV installations, were completed in Romania and Lithuania in 2023-2024, whilst medium-term investments in greenfield projects took place in 2025 and will further continue in 2026 and beyond.
Description and results of actions to provide or support remedy for those harmed by material impacts
Renewable energy initiatives directly address the Group’s reliance on fossil fuels, reducing Scope 1, 2 and partially Scope 3 GHG emissions. These actions enhance energy independence and resilience, whilst providing tenants with access to green energy.
Progress of prior disclosed actions
A significant milestone in 2024 was the realisation of returns on the €34 million investment (made during 2022-2024) in renewable energy projects in Romania. The Group allocated an additional €110 million in 2024 and committed a further €47 million in 2025 to accelerate its renewable energy programme. The allocations were approved by the Investment Committee and the Board, whilst the related expenditure will be phased over the programme implementation period (€64 million already spent until end of 2025).
In 2025 NEPI Rockcastle inaugurated Romania’s largest commercial infrastructure photovoltaic power plant developed by a real estate player, a key milestone under the Group’s renewable energy investment programme. The Group’s total renewable electricity capacity is expected to cover up to 47% of its electricity needs upon programme completion, establishing the company as the largest producer of green electricity in retail real estate across the region.
Recognising that specific impacts, risks, and opportunities (IROs) must be evaluated and prioritised for these expanding renewables portfolio, NEPI Rockcastle acknowledges that its 2025 Double Materiality Assessment (DMA) has been updated accordingly. The Company analysed the IROs associated with the construction and operation of greenfield renewable energy sources as part of its 2025 DMA update, ensuring that material financial and sustainability considerations are fully integrated into its ongoing strategic planning.
PV deployment overview1 | 2022 | 2023 | 2024 | 2025 |
|---|---|---|---|---|
Installed capacity (MW) | 4 | 36 | 38 | 92 |
No of rooftop PVs installations | 10 | 28 | 30 | 30 |
Greenfields | - | - | - | 1 |
% of total electricity covered | 1% | 6% | 6%2 | |
% of CO2 emission reduction | 1% | 5% | 5% |
- Cumulative figures
- The electricity coverage percentage excludes the 54 MW greenfield PV project in Chisineu-Cris, Romania. The plant was under testing until year-end 2025 and did not generate electricity for the Group’s consumption during this period
Stakeholder collaboration
Disclosure of key actions
Collaboration with tenants and suppliers is critical to achieving the Group’s sustainability objectives.
Scope of key actions
Stakeholder collaboration spans the Group’s upstream and downstream value chain. Tenant engagement focuses on energy efficiency, usage of electricity from renewable sources and waste management, whilst supplier collaboration emphasises sustainable materials and practices during construction and operations.
Time horizon for key action completion
Collaborative initiatives, such as the ongoing rollout of green leases, demonstrate NEPI Rockcastle’s approach to embedding sustainability across its operations.
The Company is actively working towards the ambitious goal of ensuring that 100% of its lease agreements include green lease clauses, which promote energy efficiency, responsible resource use, and environmental stewardship among tenants. This approach supports the reduction of greenhouse gas emissions and encourages tenants to adopt sustainable practices, contributing to the Group’s overall climate objectives.
On the supplier side, engagement efforts are strengthened to drive year-over-year improvements. NEPI Rockcastle assesses suppliers using green assessment forms, focusing on sustainable materials, construction practices, and operational standards. This collaborative approach with both tenants and suppliers is integral to achieving the Group’s wider sustainability targets, fostering a culture of shared responsibility and measurable progress throughout its value chain.
Description and results of actions to provide or support remedy for those harmed by material impacts
By engaging both tenants and suppliers in its decarbonisation initiatives, NEPI Rockcastle takes an approach to reducing its overall climate footprint and advancing sustainability throughout its value chain. This collaborative strategy mitigates the Company’s direct and indirect greenhouse gas (GHG) emissions and establishes a culture of environmental responsibility among all stakeholders.
Integrating green lease clauses into tenant agreements goes beyond encouraging energy-saving measures—it requires tenants to meet specific standards relating to energy efficiency, renewable electricity usage, and responsible resource management. These clauses motivate tenants to invest in energy-efficient technologies, monitor consumption, and participate in recycling and waste reduction programmes, all of which have a direct and measurable impact on reducing GHG emissions.
Similarly, NEPI Rockcastle collaborates with suppliers by evaluating their practices through green assessment forms, emphasising the use of sustainable materials, environmentally friendly construction methods, ethical business conduct and high operational standards. This proactive engagement ensures that the company’s sustainability expectations are embedded in procurement and project execution, driving continuous improvements and innovation across the supply chain.
Progress of prior disclosed actions
Tenant engagement and supplier collaboration have shown measurable progress.
During 2025, 94% of leases included green clauses, in line with the 93% already achieved in 2024.
128 strategic suppliers in operations went through green assessment as part of the tendering processes in 2024. In 2025, 55 strategic suppliers’ green practices were assessed. As this assessment is part of the tendering procedures, the number of assessed suppliers depends on the number of tenders and participants in each tender.
Outcomes of Climate Mitigation Actions
// ESRS E1-3_03 to E1-3_04 |
The following graph shows the reduction of Scope 1 and 2 emissions reduction from 2019 to 2025. |
Scope 1 and 2 emission intensity
Dependencies on Resources and Access to Finance
// ESRS E1-3_05
The successful implementation of NEPI Rockcastle's climate-related actions depends on the availability and strategic allocation of financial, technological, and human resources.
Human Resources Allocated
Group Sustainability and ESG teams to develop guidance, set targets, and monitor performance against climate objectives
Technical and engineering teams to assess and implement energy efficiency and renewable energy solutions
Local property and asset management teams for on-site implementation across the portfolio
External consultants and specialist partners engaged for technical assessments and certification processes
Financial Resources
NEPI Rockcastle relies on sustainable finance instruments (i.e. green bonds and loans, and sustainability-linked loans) to fund the transition, with ongoing engagement with financial institutions and investors to strengthen financing partnerships, secure competitive terms, and expand access to green capital.
Financial resource allocations are reviewed and updated annually in line with the evolving action plans, market conditions, and regulatory developments. The affordability of capital remains a consideration, influenced by geopolitical conditions and investor sentiment.
Strategic acquisitions and partnerships with climate-focused businesses may further accelerate the Group's sustainability transformation, subject to financial stability and investor confidence in the Company's long-term vision. The Group pursues developments in renewable energy developers, partnerships with technology and sustainability-focused service providers to accelerate the deployment of low-carbon solutions across its portfolio. These actions are expected to enhance the Group's capacity to deliver measurable emissions reductions and support compliance with evolving regulatory requirements.
Technological Resources
Evolution and availability of new technologies (such as PV modules, technical equipment) can always be a challenge. The company plans, assesses and secures technological resources in due time, to enable its decarbonisation agenda.
For additional details on sustainable finance, see the EU Taxonomy section within the Sustainability Statement, page .
E1-4 – Targets related to climate change mitigation and adaptation
Climate-Related Goals
// ESRS E1.MDR-T_01-13, E1-4_01 and E1-4_02 to E1-4_17
NEPI Rockcastle adopts a structured and transparent approach to monitoring the effectiveness of its climate change mitigation and adaptation policies through clearly defined targets. These targets serve as measurable benchmarks, aligning with the Group’s long-term sustainability objectives and providing a framework to assess progress towards achieving its goals. The targets address material climate-related IROs, forming the foundation of the Group’s decarbonisation and adaptation strategies. They are regularly reviewed, and progress is monitored based on key performance indicators (KPIs).
NEPI Rockcastle has set the following GHG reduction targets, aligned with SBTi (science-based targets initiative) standards:
Reduce Scope 1 and 2 GHG emissions per m2 from operational energy use by 80% by 2030 from 2019 baseline
Reduce absolute Scope 3 GHG emissions from operations (within Categories 3 and 13, i.e. fuel and energy related activities and downstream leased assets) by 25% by 2030 from 2022 baseline
The Group has set additional targets to contribute and support to the SBTi-aligned targets:
Reducing energy intensity in common areas by 30% by 2030 compared to 2022
Continue producing renewable energy for own consumption by 2030
All new construction and extensions over 5,000m² will meet upfront embodied carbon limits in line with the UK NZCBS (Pilot Version rev. 2, April 2025)
Relationship of targets to policy objectives
The targets established by NEPI Rockcastle are intrinsically linked to its Environmental Policy. The defined targets are either set in absolute or in relative terms, depending on the policy objective. For instance, GHG reduction targets for Scope 3 are measured in absolute terms (e.g. tonnes of CO2 equivalent), whilst energy efficiency improvements are assessed based on intensity, i.e. the energy consumption per square meter. By encompassing both approaches, the Group ensures a evaluation of its environmental performance.
Scope and baseline of targets
The scope of NEPI Rockcastle’s targets extended during 2025 across its portfolio of 60 properties (59 investment property and one held for sale) in eight countries. The baseline values and years for these targets are clearly defined to ensure consistent tracking. The Group uses 2019 as the baseline year for Scope 1 and 2 emissions and 2022 as the baseline for Scope 3 emissions and energy intensity, as agreed during the target verification by SBTi.
Methodologies and assumptions
The methodologies used to define and track emission targets are based on conclusive scientific evidence, peers’ benchmarks and internationally recognised frameworks. NEPI Rockcastle utilises the GHG Protocol for emissions tracking, ensuring consistency with global best practices. Data sources include on-site monitoring systems (utilities meters), tenant energy reports, and Deepki platform.
Significant assumptions, such as projected tenant energy consumption and the anticipated impact of renewable energy adoption, are regularly reviewed to ensure the robustness of targets. The Group considers the local context of its operations, including regulatory requirements and stakeholder expectations, ensuring that targets are both ambitious and achievable.
Stakeholder involvement and changes to targets
Where possible, NEPI Rockcastle considers stakeholder expectations, objectives and targets whilst setting and amending its own targets. Company targets and metrics are subject to periodic review, with adjustments made to reflect evolving scientific understanding, regulatory changes, or operational circumstances. For instance, the Group set Scope 3 emissions targets to include downstream leased assets in response to SBTi requirements. Such changes are transparently disclosed, along with the rationale and implications for comparability.
Performance monitoring and trends
Across the entire business NEPI Rockcastle employs a consistent monitoring approach to track performance against its disclosed targets. Since 2018, NEPI Rockcastle consistently measured and disclosed data on an annual basis. Metrics such as tonnes of CO2 equivalent for emissions and kilowatt-hours per square meter for energy efficiency are used to measure progress. Additionally, under the SLFF, NEPI Rockcastle defined annual targets for two KPIs (energy and emissions intensity), for which it monitors trends until 2030. Performance is reviewed periodically by the Executive management, the Sustainability Committee and the Board, and reported annually in the Group’s sustainability report.
Progress has been consistent with planned trajectories, as demonstrated by the 22% reduction in Scope 1, Scope 2, and Scope 3 (category 13, market-based) emissions in 2025 compared to 2024. The Group continued to increase its share of renewable electricity, reaching 85% of the total electricity used in 2025 (compared to 79% in 2024). 6% of electricity is self generated, expected to progresively grow with the completion of the renewable energy programme to 47%.
The Group’s GHG emissions reduction targets are aligned with the GHG inventory boundaries by ensuring consistency in organisational and operational scopes. NEPI Rockcastle follows internationally recognised standards such as the GHG Protocol, ensuring that the same Scopes 1, 2, and relevant Scope 3 emissions included in the inventory are covered by the set reduction targets. Regular reviews, third-party verification, and alignment with regulatory requirements help maintain accuracy and transparency in the annual reporting process.
The following tables present NEPI Rockcastle’s progress against SBTi-aligned targets. |
Year | GHG Emissions (Scope 1 & 2, Market-Based) intensity | % Reduction vs. 2019 Baseline | % Reduction vs. | Notes |
|---|---|---|---|---|
2019 (Baseline) | 100% | 0% | n/a | Baseline year for Scope 1 & 2 emissions |
2025 | 12% | 88% | 42% | Target exceeded; reflects strong focus on sustainability and energy efficiency |
2030 (Target) | 20% | 80% | n/a | Ambitious target set for 2030 |
Year | GHG Emissions (Scope 3, cat 3& 13) | % Reduction vs. 2022 Baseline | % Reduction vs. | Notes |
|---|---|---|---|---|
2022 (Baseline) | 100% | n/a | n/a | Baseline year for Scope 3 emissions |
2025 | 83% | 17% | 1% | Reflects focus on sustainability and energy efficiency in cooperation with the tenants |
2030 (Target) | 75% | 25% | n/a | Ambitious target set for 2030 |
Paris-Aligned GHG Reduction Commitments
// ESRS E1-4_18, E1-4_20, E1-4_22 to E1-4_24
NEPI Rockcastle ensures that the baseline values are carefully established, with 2019 set as the baseline year for Scope 1 and 2 emissions and 2022 for Scope 3 emissions, ensuring they are representative of the Group’s operational activities and external influences such as regulatory changes and market conditions.
The targets, validated by the SBTi, are science-based and align with the Paris Agreement’s goal to limit global warming to 1.5°C. To achieve its GHG reduction targets, the Group employs a range of decarbonisation levers, including renewable electricity production, energy efficiency improvements, and tenant engagement through green leases. Climate scenario analyses, as explained above, guide the identification of relevant environmental, societal, technological, market, and policy-related developments.
E1-5 – Energy consumption and mix
NEPI Rockcastle’s energy consumption and mix for its operations
// ESRS E1-5_01 to E1-5_20
NEPI Rockcastle reports energy consumption metrics for all owned buildings, based on invoices from suppliers and internal monitoring system of PV electricity generation. For corporate offices, NEPI Rockcastle leases its spaces and may not receive disaggregated utility data from landlords as required by ESRS standards. As a result, where energy consumption data is unavailable, it is estimated, conservatively assuming all energy is sourced from fossil fuels.
NEPI Rockcastle discloses ongoing efforts to improve data coverage and accuracy, collaborating with tenants to enhance contract terms and reporting practices.
The Company has installed on-site photovoltaic (PV) systems that generate renewable electricity and it regularly reports and monitors the breakdown of energy consumption and mixes, both renewable and non-renewable sources.
The Group strives to enhance the reliability and granularity of utility data.
The measurement of energy consumption data is not validated by an external body.
NEPI Rockcastle’s non-renewable and renewable energy (total consumption, including tenants) for properties classified as ‘high climate impact’. |
Energy consumption and mix for own operations (corporate offices) | Unit | 2025 | 2024 | % |
|---|---|---|---|---|
Total fossil energy consumption | MWh | 1,543 | 830 | 86% |
Share of fossil sources in total energy consumption | % | 100% | 100% | 0% |
Total energy consumption | MWh | 1,543 | 830 | 86% |
The figures above have been derived based on service charge paid to the lessors, for which no further analysis has been performed. |
Energy consumption and mix (total consumption) | Unit | 2025 | 2024 | % |
|---|---|---|---|---|
Fuel consumption from coal and coal products | MWh | - | - | 0% |
Fuel consumption from crude oil and petroleum products | MWh | - | - | 0% |
Fuel consumption from natural gas | MWh | 87,871 | 86,974 | 1% |
Fuel consumption from other fossil sources | MWh | - | - | 0% |
Consumption of purchased or acquired electricity, heat, steam, and cooling from fossil sources | MWh | 137,726 | 164,513 | -16% |
Total fossil energy consumption | MWh | 225,597 | 251,487 | -10% |
Share of fossil sources in total energy consumption | % | 33% | 36% | -9% |
Consumption from nuclear sources | MWh | 840 | 5,842 | -86% |
Share of consumption from nuclear sources in total energy consumption | % | 0% | 1% | -85% |
Fuel consumption for renewable sources, including biomass (also comprising industrial and municipal waste of biologic origin, biogas, renewable hydrogen, etc.) | MWh | - | - | 0% |
Consumption of purchased or acquired electricity, heat, steam, and cooling from renewable sources | MWh | 430,242 | 412,915 | 4% |
The consumption of self-generated non-fuel renewable energy | MWh | 31,786 | 30,181 | 5% |
Total renewable energy consumption | MWh | 462,028 | 443,096 | 4% |
Share of renewable sources in total energy consumption | % | 67% | 63% | 6% |
Total energy consumption | MWh | 688,465 | 700,425 | -2% |
2024 data revised as per disclosure in section BP-2
The 85% decrease in consumption from nuclear sources is outside the Company’s control, as it results from changes in the energy mix of the contracted non-renewable energy supplier. |
Energy intensity for high climate impact sectors (total consumption) | ||||
Energy intensity per net revenue | Unit | 2025 | 2024 | % |
|---|---|---|---|---|
Total energy consumption from activities in high climate impact sectors per net revenue from activities in high climate impact sectors | (MWh/ thousand euros) | 1.114 | 1.260 | -12% |
2024 data revised as per disclosure in section BP-2
Energy consumption and mix for high climate impact sectors (operational consumption) | ||||
Energy consumption and mix | Unit | 2025 | 2024 | % |
|---|---|---|---|---|
Fuel consumption from coal and coal products | MWh | - | - | - |
Fuel consumption from crude oil and petroleum products | MWh | - | - | - |
Fuel consumption from natural gas | MWh | 39,778 | 40,737 | -2% |
Fuel consumption from other fossil sources | MWh | - | - | - |
Consumption of purchased or acquired electricity, heat, steam, and cooling from fossil sources | MWh | 34,235 | 48,610 | -30% |
Total fossil energy consumption | MWh | 74,013 | 89,348 | -17% |
Share of fossil sources in total energy consumption | % | 35% | 39% | -10% |
Consumption from nuclear sources | MWh | - | 2,157 | n/a |
Share of consumption from nuclear sources in total energy consumption | % | 0% | 1% | n/a |
Fuel consumption for renewable sources, including biomass (also comprising industrial and municipal waste of biologic origin, biogas, renewable hydrogen, etc.) | MWh | - | - | - |
Consumption of purchased or acquired electricity, heat, steam, and cooling from renewable sources | MWh | 126,033 | 124,429 | 1% |
The consumption of self-generated non-fuel renewable energy | MWh | 9,314 | 10,425 | -11% |
Total renewable energy consumption | MWh | 135,347 | 134,854 | 0% |
Share of renewable sources in total energy consumption | % | 65% | 60% | 9% |
Total energy consumption | MWh | 209,359 | 226,358 | -8% |
Energy intensity for high climate impact sectors (operational consumption) | ||||
Energy intensity per net revenue | Unit | 2025 | 2024 | % |
Total energy consumption from activities in high climate impact sectors per net revenue from activities in high climate impact sectors | (MWh/ thousand euros) | 0.34 | 0.41 | -17% |
Energy production for high climate impact sectors | ||||
Energy production | Unit | 2025 | 2024 | % |
|---|---|---|---|---|
Non-renewable energy production | MWh | 5,890 | 5,036 | 17% |
Renewable energy production | MWh | 31,786 | 30,181 | 5% |
2024 data revised as per disclosure in section BP-2
Reconciliation of Revenue from High Climate Impact Sectors
// ESRS E1-5_21
NEPI Rockcastle reconciles the net revenue from high climate impact activities with the relevant financial statement line items. The real estate sector qualifies as a high climate impact sector, and the net revenue used in the energy intensity calculation aligns with the “Net rental and related income” line item from the Consolidated Statement of Comprehensive Income.
This figure includes gross rental income, service charge income, property operating expenses, revenue from energy activity and costs from energy activity.
This reconciliation ensures transparency, aligning sustainability reporting with audited financial data for accurate energy intensity calculations.
E1-6 – Gross Scopes 1, 2, 3 and Total GHG emissions
// ESRS E1-6_01 to E1-6_04, E1-6_06 to E1-6_13, E1-6_17 to E1-6_22, E1-6_24 to E1-6_25, E1-6_27 to E1-6_28, E1-6_30 to E1-6_31
NEPI Rockcastle omits data points on extended Scope 3 emissions using the phase-in option. However, the Group reports on Categories 3 and 13 as part of the set target, SBTi - validated.
Retrospective | |||||
Base year | Unit | Base Year 2022 | 2025 | 2024 | % |
|---|---|---|---|---|---|
Scope 1 GHG emissions | |||||
Gross Scope 1 GHG emissions | tCO2eq | 5,798 | 7,275 | 7,451 | -2% |
Percentage of Scope 1 GHG emissions from regulated emission trading schemes | % | - | - | - | 0% |
Biogenic emissions of CO2 from the combustion or biodegradation of biomass not included in Scope 1 GHG emissions | tCO2eq | - | - | - | 0% |
2024 data revised as per disclosure in section BP-2
Retrospective | |||||
Base year | Unit | Base Year 2022 | 2025 | 2024 | % |
|---|---|---|---|---|---|
Scope 2 GHG emissions | |||||
Gross location-based Scope 2 GHG emissions | tCO2eq | 79,352 | 65,119 | 74,285 | -12% |
Gross market-based Scope 2 GHG emissions | tCO2eq | 39,514 | 5,844 | 15,484 | -62% |
Percentage of contractual instruments, Scope 2 GHG emissions | % | 100% | 100% | 100% | 0% |
Disclosure of types of contractual instruments, Scope 2 GHG emissions | % | 100% | 100% | 100% | 0% |
Percentage of contractual instruments used for sale and purchase of energy bundled with attributes about energy generation in relation to Scope 2 GHG emissions | % | 100% | 80% | 83% | -4% |
Percentage of contractual instruments used for sale and purchase of unbundled energy attribute claims in relation to Scope 2 GHG emissions | % | 0% | 20% | 17% | 17% |
Biogenic emissions of CO2 from combustion or biodegradation of biomass not included in Scope 2 GHG emissions | tCO2eq | - | - | - | 0% |
2024 data revised as per disclosure in section BP-2
The 62% reduction in gross market‑based Scope 2 GHG emissions was driven by the acquisition of Magnolia Park and Silesia City Center in Poland. Their integration temporarily increased the 2024 market‑ and location‑based emissions, but once under full ownership in 2025, the Company was able to switch a large portion of its electricity supply to renewable electricity.
Retrospective | |||||
Base year | Unit | Base Year 2022 | 2025 | 2024 | % |
|---|---|---|---|---|---|
Significant scope 3 GHG emissions | |||||
Total Gross indirect (Scope 3) GHG emissions (Location Based) | tCO2eq | 253,737 | 210,856 | 213,552 | -1% |
Total Gross indirect (Scope 3) GHG emissions (Market Based) | tCO2eq | 151,769 | 92,123 | 100,238 | -8% |
Percentage of GHG Scope 3 calculated using primary data | % | 100% | 100% | 100% | 0% |
Fuel and energy-related activities (not included in Scope 1 or Scope 2) | tCO2eq | 78,849 | 38,252 | 37,721 | 1% |
Downstream leased assets (location based) | tCO2eq | 174,888 | 172,604 | 175,831 | -2% |
Downstream leased assets (market-based) | tCO2eq | 72,920 | 53,872 | 62,517 | -14% |
Total GHG emissions (location-based) (tCO2eq) | tCO2eq | 333,887 | 283,250 | 295,287 | -4% |
Total GHG emissions (market-based) (tCO2eq) | tCO2eq | 197,081 | 105,243 | 123,173 | -15% |
2024 data revised as per disclosure in section BP-2
Scope 3 emissions are calculated using the GHG methodology. Tenant emissions (downstream leased assets) are categorised as Scope 3, based on the operational control approach (Group’s tenants have the operational control over the utilities consumption in their units). This approach is in line with the methodology used by the Group for targets setting under the Sustainability-linked Financing Framework and SBTi alignment. This approach ensures that the Group presents the metrics and their year-on-year progress in a consistent and comparable manner. Under the financial control approach the emissions of downstream leased assets would be classified as Scope 1 and/or 2.
GHG intensity per net revenue | Unit | Base year 2022 | 2025 | 2024 | % |
|---|---|---|---|---|---|
Total GHG emissions (location-based) per net revenue | tCO2eq/ thousand euros | 0.852 | 0.458 | 0.531 | -14% |
Total GHG emissions (market-based) per net revenue | tCO2eq/ thousand euros | 0.485 | 0.170 | 0.222 | -23% |
2024 data revised as per disclosure in section BP-2
Achieved GHG emission reductions from 2022 base year | Unit | 2025 |
|---|---|---|
Absolute value of total Greenhouse gas emissions reduction | tCO2eq | 55,637 |
Percentage of total Greenhouse gas emissions reduction (as of emissions of base year) | % | 16% |
Intensity value of total Greenhouse gas emissions reduction | tCO2eq/ thousand euros | 0.090 |
Absolute value of Scope 1 Greenhouse gas emissions reduction | tCO2eq | (1,477) |
Percentage of Scope 1 Greenhouse gas emissions reduction (as of emissions of base year) | % | -25% |
Intensity value of Scope 1 Greenhouse gas emissions reduction | tCO2eq /thousand euros | (0.002) |
Absolute value of location-based Scope 2 Greenhouse gas emissions reduction | tCO2eq | 14,233 |
Percentage of location-based Scope 2 Greenhouse gas emissions reduction (as of emissions of base year) | % | 18% |
Intensity value of location-based Scope 2 Greenhouse gas emissions reduction | tCO2eq/ thousand euros | 0.023 |
Absolute value of market-based Scope 2 Greenhouse gas emissions reduction | tCO2eq | 33,670 |
Percentage of market-based Scope 2 Greenhouse gas emissions reduction (as of emissions of base year) | % | 85% |
Intensity value of market-based Scope 2 Greenhouse gas emissions reduction | tCO2eq/thousand euros | 0.054 |
Absolute value of Scope 3 Greenhouse gas emissions reduction | tCO2eq | 42,881 |
Percentage of Scope 3 Greenhouse gas emissions reduction (as of emissions of base year) | % | 17% |
Intensity value of Scope 3 Greenhouse gas emissions reduction | tCO2eq/thousand euros | 0.069 |
The changes in the baseline year CO₂e emissions are driven by differences in energy consumption and updates to the emission factors used. The main contributors to the change in energy consumption are the inclusion of data for Magnolia Park and Silesia City Centre, both acquired at the end of 2024 and now fully integrated into the metrics for the current and baseline year.
GHG Calculation Methodologies and Assumptions
// ESRS E1-6_15
NEPI Rockcastle calculates and measures its GHG emissions using methodologies aligned with the GHG Protocol. The Group applies emission factors provided in the Deepki platform (adopted from July 2023 onwards) and validated against available public sources. Scope 1 emissions include gas consumption from on-site heating, whilst Scope 2 covers landlord-procured electricity, heating, and cooling for common areas. Scope 3 emissions encompass tenant energy consumption, as well as other emissions such as those generated by HVAC equipment. These calculations are based on standardised and validated methodologies, ensuring consistency and accuracy in emissions tracking.
Impact of Significant Events on GHG Emissions
// ESRS E1-6_16
The Company confirms that no significant events or changes in circumstances affecting its GHG emissions occurred between the reporting dates and the date of its Annual Report.
Renewable Energy Instruments
// ESRS E1-6_23 and E1-6_26, E1-6_29
NEPI Rockcastle applies a range of contractual instruments to support its transition to renewable energy sourcing and its broader decarbonisation goals. To further embed sustainability within its operations, the Group is defining contractual requirements for tenants to source green electricity in leased areas, extending the use of renewable energy across its value chain.
Extended Scope 3 emissions breakdown is not included, under phase-in option.
Net Revenue Used to Calculate GHG Intensity
// ESRS E1-6_32 to E1-6_35
The net revenues reported in the 2025 financial statements is €618,110 thousand (net rental and related income).
// ESRS E1-8_01 to E1-8_09
As of today, NEPI Rockcastle does not apply any internal carbon pricing scheme. However, the Group is assessing the potential implementation of such a system in the coming years as part of its broader transition plan towards a low-carbon economy. This transition plan includes evaluating the role of internal carbon pricing as a tool to incentivise emissions reductions, support investment decisions aligned with decarbonisation goals, and manage climate-related risks and opportunities.
ESRS E3 - Water and Marine Resources
Introduction
NEPI Rockcastle recognises the importance of water management as part of its sustainability strategy and environmental stewardship priorities. The Group’s approach focuses on the identification, assessment, and management of material IROs associated with water use across its operations.
To effectively assess water-related impacts and risks, the Group has conducted a detailed screening of its assets and activities, incorporating the Worldwide Fund for Nature’s (WWF) Water Risk Filter to evaluate regional vulnerabilities, including water scarcity, flooding, and water quality risks. Through its DMA, NEPI Rockcastle analysed financial and environmental impacts, identifying key opportunities to enhance water resource efficiency whilst mitigating risks in areas of water stress.
NEPI Rockcastle concludes that water and marine resources are not material for the Group, given the relatively limited water consumption profile of retail properties, especially when compared to other asset types such as hotels or industrial facilities where hot water use and process water demand are higher. This conclusion aligns with the Group’s operational reality, where water is primarily used for sanitary facilities, cleaning activities, cooling systems, and landscaping areas.
Following the completion of the DMA cycle in 2025, NEPI Rockcastle conducted a refinement and validation stage to ensure alignment between internal assessments, stakeholder perspectives, auditor feedback, and evolving sectoral practices. Whilst the initial assessment found water-related impacts to be nonmaterial, the Group revisited certain topics to ensure consistency with peer practices, regulatory expectations, and internal expert judgement.
Accordingly, water is monitored and reported under ESRS and remains a material topic at Group level only in relation to withdrawals, except for future‑oriented monitoring needs in locations where climate projections may increase physical water‑related risks. For additional clarity, information relating to water consumption—including withdrawals and any associated risks—is presented under the Disclosure Requirement E3-4 Water Consumption in the following section.
At the core of the Group’s strategy is its Environmental Policy. This policy promotes water conservation, efficient use, and responsible wastewater treatment through initiatives such as metering systems, water-saving technologies, rainwater harvesting, and greywater reuse.
IRO-1 – Description of the processes to identify and assess material water related impacts, risks and opportunities
// ESRS E3.IRO-1_01 to E3.IRO-1_02
NEPI Rockcastle conducted the DMA to evaluate both financial and environmental impacts related to water used in operations. During this process, NEPI Rockcastle engaged with internal and external stakeholders to assess the IROs associated with its water management practices. The Group has not conducted screening assessments of its value chain to identify actual or potential IROs related to water resources, as this information is difficult to obtain.
As a developer and operator of shopping centres, NEPI Rockcastle primarily sources its water from public water networks. In some shopping malls, the Group also uses groundwater abstraction (wells) for water sourcing. Water is typically discharged into public sewage systems, except in limited cases where alternative discharge methods apply. The Group focuses on water withdrawal, measuring the total amount of water taken from these sources—rather than on water consumption. Although water discharge is not monitored, the Group assumes that discharge is approximately equal to withdrawal.
NEPI Rockcastle’s portfolio is not located in regions identified as water stressed. Nonetheless, the Group integrates water stress data using the WWF Water Risk Filter, recommended by recognised industry standards, including TNFD, to evaluate potential regional vulnerabilities. This screening assesses risks including water scarcity, flooding, and water quality across three-time horizons—2020, 2030, and 2050—under optimistic, current, and pessimistic climate scenarios. Whilst this approach highlights potential future risks, it also ensures that the Group remains vigilant even in regions without immediate water stress. NEPI Rockcastle plans to develop site-specific action plans to address localised risks and opportunities, including water-related IROs over the coming years. To date, NEPI Rockcastle has not conducted consultations specific to water-related issues.
E3-1 – Policies related to water
Water And Marine Resources: Key Policies
// ESRS E3.MDR-P_01-06, E3-1_01
Relevant aspects on water management practices are included in the Environmental Policy, described in the MDR-P Policy Overview Table, page . A separate water specific policy is not planned, as site level climate adaptation plans, developed under the EU Taxonomy, already address physical water risks where relevant.
Responsible Water Use and Pollution Prevention
// ESRS E3-1_02 to E3-1_05 and E3-1_09
Measures such as installing low-flow faucets, aerators, and dual-flush toilets have been adopted across landlord-managed spaces to promote responsible water use. Advanced water metering systems are utilised to track consumption accurately, optimise usage, and quickly identify areas of inefficiency to help reduce water waste. Whilst all facilities currently rely solely on municipal water sources, initiatives are in progress to lessen this dependence by investigating options such as collecting and reusing rainwater.
The Environmental Policy ensures responsible water management by requiring treatment and reuse where possible to minimise environmental impacts. Properties not connected to public sewage systems use on-site wastewater treatment plants, which are regularly monitored to meet environmental standards and regulatory requirements. Ongoing maintenance and efficient equipment help prevent water pollution, whilst regular discharge quality checks mitigate environmental risks and ensure compliance with laws.
The Group will continue screening future investments for water-related risks and will develop site-specific mitigation and adaptation plans as needed. The Sustainable Development Policy further integrates water use optimisation into construction projects to support resource-efficient development.
NEPI Rockcastle does not operate in coastal regions or extract marine resources, so its water management policies do not address marine environments.
E3-2 – Actions and resources related to water
Water Management Initiatives and Operational Guidelines
// ESRS E3.MDR-A_13-14
The Group will analyse the water withdrawals more closely in 2026, identifying which actions enhance water management and efficiency and assessing their materiality. NEPI Rockcastle continues to properly manage the potable water intensity, as per the ratios included below. While the Group had anticipated completing the Water Strategy and policy in 2025, this workstream has been incorporated into a wider sustainability planning cycle to ensure greater coherence and impact across the Group's environmental commitments. The evaluation of water withdrawals will be carried out from 2026 onwards.
The Group maintains its focus on transparency and will continue to provide updates, enabling stakeholders to cross-reference progress and affirmations reports. These actions will be disclosed accordingly. No additional actions related to marine resources are adopted or intended for ESRS E3-2 disclosure, as NEPI Rockcastle does not operate in coastal regions or extract marine resources. This exclusion is made in accordance with ESRS 2, paragraph 62, on the basis that marine environments are not relevant to the Group’s operations or environmental impacts.
In 2025, NEPI Rockcastle allocated dedicated capital expenditure to advance its water management strategy. These initiatives were led by the Property and Technical Management teams, with ongoing involvement from the Sustainability department to ensure effective implementation and continuous improvement. Key projects included:
Upgrading customer toilet taps to touchless models to reduce water usage and enhance hygiene
Installing tap aerators to further limit water flow
Introducing rainwater collection systems to enable water reuse
Replacing sand filters in internal fountains to optimise both water and chemical consumption
Maintaining wells to secure a dependable water supply and support operational efficiency
Renovating cooling towers to lower water demand in climate‑control systems
Adaptation Strategies for Water Scarcity and Flood Risk
// ESRS E3-2_03
NEPI Rockcastle acknowledges that climate change poses risks to water systems, which may negatively impact assets and operations in areas of water risk. Long-term changes in climate patterns, such as rising temperatures, water scarcity, and drought, can disrupt building operations, increase operating costs, and affect asset valuations, necessitating adaptation and investment. Additionally, urbanisation and reduced terrain permeability can exacerbate the risk of flash flooding, further complicating water management challenges.
NEPI Rockcastle’s properties are not located in areas with water risk, therefore no specific actions have been taken to address such risks. However, the Group remains vigilant and continues to monitor its exposure to water risk. If any assets were identified as being at risk in the future, NEPI Rockcastle would develop asset-specific action plans to mitigate and address the identified risks, ensuring alignment with its Environmental Policy and sustainability objectives.
In 2025, the Group has strengthened its water conservation programme to address potential water scarcity and drought risks. Key measures include the installation of rainwater harvesting systems for landscaping and the implementation of water-efficient technologies, such as automatic flush toilets and low-temperature systems in restrooms, which simultaneously reduce water and energy consumption. NEPI Rockcastle’s mitigation hierarchy prioritises reduction and reuse, as evidenced by the reuse of water from fire tanks and the exploration of greywater reuse systems. Looking ahead, the Group is evaluating additional measures to enhance its water management strategy. These include improving irrigation systems, expanding rainwater retention infrastructure, and using drought-resistant plants.
E3-3 – Targets related to water and marine resources
E3.MDR-T_01-13, E3-3_01, E3-3_03, E3-3_08
// ESRS E3.MDR-T_01-13, E3-3_01, E3-3_03, E3-3_08
NEPI Rockcastle is currently revisiting its initial target to reduce potable water intensity by 30% until 2030 (on a 2019 baseline), allowing it to focus on the most important impacts and direct its resources and investments accordingly.
Water intensity is measured by dividing total potable water consumption by the annual number of visitors and multiplying by 1,000. There have been no changes to the target, underlying metrics, or methodologies since the previous reporting period. Potable water intensity has decreased during 2025 to 5.8 m³ per 1,000 visitors, representing a 4% reduction from the previous year (with 6.04 m³ per 1,000 visitors). The target applies exclusively to NEPI Rockcastle’s directly managed operations within its property portfolio and extends to tenant-managed areas. The downward trend reflects the positive impact of initiatives such as the installation of low-flow fixtures, leak detection, and behavioural engagement campaigns among, e.g., maintenance companies who are responsible for the technical management of the assets. The potable water intensity in 2019 was 5.67 m³ per 1,000 visitors. The 2025 performance of 5.8 m³ per 1,000 visitors is slightly higher than the 2019 baseline, indicating that whilst there has been progress compared to the prior year, further management is necessary.
E3-4 – Water consumption
// ESRS E3-4_01 to E3-4_06 ; MDR-M_01 to 03
Water withdrawal data is collected monthly at the asset level, then verified and analysed at the corporate level. The Group’s water withdrawals metric tracks total usage across all operational sites and is collected in the Deepki platform, which consolidates and monitors usage from multiple sources. This process is aligned with the internal data collection methodology outlined in the Utility Consumption Data Collection Policy, effective January 2025.
Currently, the metric is not externally validated.
Water withdrawal is measured in cubic meters (m3) and aligns with CSRD requirements. Landlord reporting accounts for 100% of water usage, including municipally supplied water and groundwater. NEPI Rockcastle properties are primarily connected to public water and sewage networks. Water is mainly used in Group properties by food processors, equipment and visitors in shopping centres’ restrooms.
The Group does not collect data for water recycle storage and reuse.
Water withdrawals and intensity per net revenue
Water consumption | Unit | 2025 | 2024 | % (2025 -2024) |
|---|---|---|---|---|
Total water consumption | m3 | 2,082,931 | 2,204,052 | -5% |
2024 data revised as per disclosure in section BP-2
Water intensity per net revenue | Unit | 2025 | 2024 | % (2025 -2024) |
|---|---|---|---|---|
Total water consumption per net revenue | m3/ thousand euros | 3.370 | 3.965 | -15% |
2024 data revised as per disclosure in section BP-2
ESRS E5 - Resource Use and Circular Economy
Introduction
NEPI Rockcastle prioritises advancing sustainability through effective resource use and integration of circular economy principles. The Group has undertaken a comprehensive process to identify and assess the material IROs related to its operations and value chain.
The Group drives sustainable resource use and awareness of the circular economy across its properties and the communities in which it operates by organising educational events for visitors, tenants, its employees, and by supporting awareness campaigns.
IRO-1 – Description of the processes to identify and assess material resource use and circular economy-related impacts, risks and opportunities
//ESRS E5.IRO-1_01 to E5.IRO-1_02
NEPI Rockcastle has undertaken a structured approach to identifying and assessing IROs related to its operations and value chain. Whilst the Company has not yet conducted a specific screening of its assets regarding circular economy, it has implemented a DMA to evaluate financial and environmental impacts. This assessment encompasses the Group’s operational activities and external factors, including the procurement and disposal of materials, providing a detailed understanding of its environmental and strategic priorities.
The DMA process incorporates stakeholder engagement as a critical element, with input gathered from internal stakeholders, such as employees and Board members, as well as external stakeholders, including financial institutions, and investors’ asset managers. To support its assessments, the Group utilises the Deepki utility data management platform to monitor waste generation, providing essential insights for impact analysis. Plans are in place to conduct future screenings of assets, potentially leveraging data stored to enhance precision and scope of the collected data related to waste generated in the assets.
In addition to the DMA, during 2025, NEPI Rockcastle has engaged in consultations through a survey carried out among customers. The results provided valuable insights into environmental concerns and recycling behaviours, highlighting the importance of waste management to visitors. The Group acknowledges the need to broaden its approach by including relevant community representatives, to better understand the social and environmental implications of its resource use. NEPI Rockcastle will refine its consultation practices to ensure inclusivity and comprehensiveness in stakeholder engagement.
E5-1 – Policies related to resource use and circular economy
Resource use and circular economy: Key Policies
//ESRS E5.MDR-P_01-06
Please refer to the MDR-P Policy Overview section, page .
Resource Transition and Sustainable Sourcing
// ESRS E5-1_01 to E5-1_02
NEPI Rockcastle’s approach to transitioning away from reliance on primary resources and increasing the use of secondary, recycled materials is embedded across the Group’s policies and guidelines (see MDR-P Policy Overview section). While the Company does not have a standalone policy dedicated solely to resource use and circular economy, its Environmental Policy, Sustainable Development Policy and Sustainable Procurement Policy outline its overarching commitments. These documents emphasise the importance of minimising reliance on primary resources and integrating sustainable material practices into both operations and construction activities.
NEPI Rockcastle’s policies highlight the significance of sustainable sourcing and the use of renewable resources. As outlined in the Environmental and Sustainable Development Policy, the Company is committed to sourcing materials that have minimal environmental impact and to prioritising those that disclose their environmental performance. Additionally, NEPI Rockcastle aligns its construction activities with internationally recognised standards such as BREEAM, which includes specific targets for responsible sourcing.
In line with the Group’s policy framework, the “Guidelines for Sustainable Materials” referenced in the 2024 Annual Report were not developed as a standalone document. Instead, in 2025 the Group adopted the Whole Life Carbon Reporting Guideline, which establishes requirements for managing embodied carbon across the life cycle of buildings, including upfront embodied carbon thresholds for newly developed assets. Sustainable materials requirements were already covered by existing internal policies, whilst embodied carbon considerations were incorporated through this new guideline, ensuring coherent coverage without updating existing standards.
E5-2 – Actions and resources related to resource use and circular economy
// ESRS E5.MDR-A_01-12
Waste efficiency improvements
Disclosure of key actions
NEPI Rockcastle has undertaken several specific measures to improve waste efficiency and support circular economy initiatives throughout its operations. These measures include installing separate waste disposal bins, upgrading waste sorting facilities, and optimising waste flow processes to boost the amount of waste that is recycled. The Group has also introduced weighing scales and is piloting a digital platform designed to accurately track tenant-generated waste by category. Additionally, educational campaigns have been carried out to encourage environmentally responsible behaviour among tenants, visitors, and employees. Collectively, these efforts contribute to meeting the sustainability objectives set out in chapter E5-3.
Scope of key actions
The waste efficiency improvements cover all NEPI Rockcastle properties, with a particular focus on common areas, but also addressing tenant operations. The actions involve close collaboration with waste management service providers, tenants, and visitors to ensure an inclusive approach.
Time horizon for key action completion
NEPI Rockcastle plans to continuously expand and adapt the waste management programme to align with its long-term sustainability strategy and emerging best practices until 2030. Specific key actions, such as the installation of a digital waste tracking platform and infrastructure upgrades, are targeted for completion within the next three years, while ongoing educational campaigns and stakeholder engagement initiatives will be maintained and evolved throughout the entire programme.
Description and results of actions to provide or support remedy for those harmed by material impacts
The waste efficiency initiatives aim to mitigate the environmental impacts of waste generation, contributing to healthier environments for tenants and visitors. Modernised waste sorting infrastructure and streamlined processes enhance operational efficiency. These actions address material environmental impacts by diverting waste from landfills and supporting higher recycling rates.
With respect to actions to provide for or support remedy for those harmed by actual material waste-related impacts, NEPI Rockcastle has not identified any instances of harm to individuals or communities arising from its waste management practices during the reporting period. As such, there have been no remedial actions necessary or undertaken in relation to material waste-related impacts.
The Group remains committed to ongoing monitoring and engagement to promptly address any such issues should they arise in the future.
Progress of prior disclosed actions
NEPI Rockcastle has achieved measurable progress through its waste efficiency initiatives, building on actions disclosed in prior reporting periods. The installation of selective bins and the introduction of a waste tracking system are advancing the previously announced plans to enhance recycling infrastructure and data monitoring capabilities. Since 2019, the Group has collected waste data and monitored performance against established targets, with annual progress transparently reported. The improvements described in the report, such as increased segregation rates, demonstrate the tangible outcomes of the multi-year waste management strategy outlined in earlier disclosures. The 2025 progress, which is detailed in section E5-5, reflects the continuation and escalation of these efforts, evidencing both the fulfilment of earlier commitments and the Group’s ongoing dedication to waste efficiency.
Disclosure of current and future financial resources for the action plan
The Group has allocated financial resources to waste efficiency improvements, encompassing both CAPEX for infrastructure upgrades and OPEX for ongoing management and educational campaigns. In 2025, the Group continued to invest and allocate CAPEX for waste bins installation, to enable waste segregation. Going forward, investments will be directed towards the installation of a waste data collection platform and scales to better measure and track the specific fractions of waste disposed of each asset.
Stakeholder Collaboration
Disclosure of key actions
NEPI Rockcastle has prioritised stakeholder collaboration as one of the elements of its circular economy strategy. Actions include conducting marketing awareness campaigns and events on waste sorting, distributing educational materials, to engage tenants, visitors, and business partners. These efforts aim to foster collective responsibility for waste reduction and recycling practices across all properties in the Group’s portfolio.
Time horizon for key action completion
Stakeholder collaboration is an ongoing process, with key initiatives such as tenant engagement and educational workshops already underway. These efforts are regularly updated and expanded to align with NEPI Rockcastle’s sustainability objectives for 2030.
Description and results of actions to provide or support remedy for those harmed by material impacts
No remedial actions were necessary, as no stakeholders were harmed by previous waste management practices. Enhanced awareness among tenants and visitors contributes to a collective effort to reduce waste and improve recycling rates, thereby addressing material impacts effectively.
Progress of prior disclosed actions
The Group has reported progress in its stakeholder collaboration efforts. Educational workshops have improved waste segregation practices, whilst campaigns have successfully increased recycling rates.
Disclosure of current and future financial resources for the action plan
Resources for stakeholder collaboration are primarily operational, supporting educational materials, campaign organisation, and partnerships with service providers. NEPI Rockcastle remains committed to sustaining these efforts through continuous financial support, with allocations included in its sustainability budget.
E5-3 – Targets related to resource use and circular economy
// ESRS E5.MDR-T_01-13, E5-3_01 to E5-3_09, E5-3_13
NEPI Rockcastle tracks the effectiveness of its resource use practices through clearly defined voluntary adopted targets integrated into its sustainability strategy. These targets enable the Group to measure progress, identify improvement areas, and ensure alignment with its long-term environmental objectives
A primary target is to achieve a 60% operational recycling rate by 2030, building on progress from a 33% recycling rate in 2019 and reaching 48% in 2025. The Group previously set a Zero Waste to Landfill goal in 2019 and reported on it through 2024; however, in 2025, this KPI was revised internally. Because success depends heavily on external factors such as recycling infrastructure and tenant participation—areas outside the Company’s direct control the Company decided to stay with the overarching segregation rate target.
To remain focused and ensure consistent progress, NEPI Rockcastle has set intermediary targets for each year between 2026 and 2030, enabling regular assessment and adjustment of its resource use and circular economy initiatives.
NEPI Rockcastle’s waste management targets are based on historical waste data and projected gains from initiatives like selective bin installation and behavioural campaigns. These targets were developed internally, without formal stakeholder consultation, and are closely aligned with the waste hierarchy—prioritising prevention, sustainable material adoption, and stakeholder engagement. Recycling is promoted through segregation facilities and partnerships with specialised recyclers, whilst energy recovery and safe disposal address non-recyclable residual waste.
The target is informed by legislative requirements, notably the EU Waste Framework Directive, emphasising waste prevention and recycling, and is supported by sustainable procurement standards and certifications such as BREEAM. Although NEPI Rockcastle has made progress, gaps remain, mainly for targets for circular design, increasing circular material use, and minimising primary raw material use have not yet been set. Nonetheless, the Group promotes recycled content and sustainable sourcing in its operations.
These gaps indicate opportunities for future enhancements in the Group’s circular economy strategy. NEPI Rockcastle continues to collect waste data and monitor target progress since 2019, with results disclosed annually including 2025 performance in section E5-5. Progress is reviewed regularly, with strategies refined to support achievement of goals through 2030.
E5-4 – Resource inflows
// ESRS E5-4_01 to 06, E5-4_08
NEPI Rockcastle does not currently monitor resource inflows or identify material resource inflows across its operations. Additionally, the Group does not conduct estimations of resource inflows.
NEPI Rockcastle recognises the importance of understanding and tracking resource inflows as part of its focus on sustainable operations and circular economy principles. This aspect will be considered in the future as the Group continues to enhance its sustainability framework. Despite the absence of formal monitoring, NEPI Rockcastle supports the use of sustainable materials with lower environmental footprints to reduce reliance on primary resources. In its construction projects, the Group, where feasible, integrates the materials with high recycling potential and seeks alternatives to traditional resource-intensive inputs.
E5-5 – Resource outflows
// ESRS E5-5_07 to E5-5_17
The information regarding the key products, their durability, reparability, and recyclable content, both in products and packaging, does not apply for NEPI Rockcastle as the Company does not engage in production activities.
NEPI Rockcastle adopts the responsibility for the separate collection and transfer of municipal waste, including paper, cardboard, glass, metal and plastic packaging, on behalf of the tenants – a commitment managed through lease agreements.
The waste data presented below includes own operations waste generated at the locations under the Group's portfolio (including both NEPI Rockcastle and its tenants, as it is not possible to separate these figures due to the collection process and contractual obligations with the tenants). Therefore, the data does not include waste generated in the upstream value chain (e.g. construction) or downstream value chain (e.g. maintenance service providers). Whilst some tenants independently manage their waste disposal, these cases are minimal.
Waste data is compiled based on records provided by waste collection providers. Where direct mass data is unavailable, waste volumes, such as the number and size of containers, are converted into estimated weights using recognised national average waste‑density conversion factors. This approach is consistent with the internal data collection methodology outlined in the Utility Consumption Data Collection Policy.
To evaluate performance and effectiveness in relation to material circular economy impacts, NEPI Rockcastle utilises the following explicit metrics:
Volume, weight and proportion of non-hazardous waste diverted from disposal (e.g. through recycling, reuse, or other recovery methods)
Volume, weight and proportion of non-hazardous waste directed to disposal (e.g. landfill or incineration without energy recovery)
These metrics are designed to provide transparency and support compliance with waste management best practices. While they are informed by the requirements of the EU Waste Framework Directive and correspond to ESRS E5-5-defined metrics, they are tailored to the Group’s operations and thus are considered entity-specific. The metrics are not validated by an external body; all waste data is internally compiled and reviewed, with no formal external validation performed at this time.
In 2025, non-hazardous waste is categorised in two streams: waste diverted from disposal and waste directed to disposal.
Waste | |||||
|---|---|---|---|---|---|
Category | Sub-category | Unit | 2025 | 2024 | % |
Total Waste generated | Hazardous waste | Tonnes | - | - | 0% |
Non-hazardous waste | Tonnes | 28,455 | 30,895 | -8% | |
Hazardous waste diverted from disposal, breakdown by treatment type | Reuse | Tonnes | - | - | 0% |
Recycling | Tonnes | - | - | 0% | |
Other recovery operations | Tonnes | - | - | 0% | |
Non-hazardous waste diverted from disposal, breakdown by treatment type | Reuse | Tonnes | - | - | 0% |
Recycling | Tonnes | 13,690 | 13,548 | 0% | |
Other recovery operations | Tonnes | 703 | 782 | 0% | |
Hazardous waste directed to disposal, breakdown by treatment type | Incineration | Tonnes | - | - | 0% |
Landfill | Tonnes | - | - | 0% | |
Other disposal operations | Tonnes | - | - | 0% | |
Non-hazardous waste directed to disposal, breakdown by treatment type | Incineration | Tonnes | - | - | 0% |
Landfill | Tonnes | 14,062 | 16,565 | -15% | |
Other disposal operations | Tonnes | - | - | 0% | |
Non-recycled waste | Tonnes | 14,765 | 17,347 | -15% | |
Percentage of non-recycled waste | % | 52%1 | 56%2 | -8% | |
Total amount of hazardous waste | Tonnes | - | - | 0% | |
Total amount of radioactive waste | Tonnes | - | - | 0% | |
- Out of which, 49% landfill and 3% other recovery operations
- Out of which, 54% landfill and 2% other recovery operations
2024 data revised as per disclosure in section BP-2
EU Taxonomy Report
The European Union introduced the EU Taxonomy (Regulation (EU) 2020/852) to facilitate the financing of the environmental transition by directing capital towards sustainable economic activities. It serves as a unified classification system, providing investors with clear definitions of which economic activities qualify as environmentally sustainable. Consequently, all economic activities covered by the Taxonomy Regulation ('eligible' activities) must be assessed for their environmental impact based on the criteria set out in the Taxonomy Delegated Acts (Commission Delegated Regulations (EU) 2021/2139 and 2023/2486).
To be considered environmentally sustainable under the EU Taxonomy, an activity must make a substantial contribution to at least one of the six environmental objectives, without causing significant harm to the remaining five. These objectives are:
Climate Change Mitigation
Climate Change Adaptation
Sustainable Use and Protection of Water and Marine Resources
Transition to a Circular Economy
Pollution Prevention and Control
Protection and Restoration of Biodiversity and Ecosystems
In addition, the activity must comply with the Minimum Social Safeguards, which encompass social and ethical standards.
NEPI Rockcastle has implemented the reporting requirements set out in the Disclosures Delegated Act (Delegated Regulation (EU) 2021/2178) under Article 8 of the EU Taxonomy Regulation (Regulation (EU) 2020/852). This annual disclosure presents the Group’s taxonomy eligibility and alignment, together with the calculation of key performance indicators (KPIs).
Furthermore, NEPI Rockcastle has decided to apply the simplification measures introduced under the Commission Delegated Regulation (EU) 2026/73 (the “simplification act”), which allows undertakings to use streamlined assessment and reporting approaches for specific aspects of Taxonomy alignment, in line with the scope and conditions outlined in this regulation.
The determination of the eligibility of economic activities was carried out based on NACE Codes and by mapping the Group’s economic activities to the list of activities included in the Delegated Acts related to the EU Taxonomy Regulation, specifically Delegated Act No. 2021/2139 and its amendments.
Based on the conducted analysis, NEPI Rockcastle has determined the following eligible activities:
4.1 CCM/CCA Electricity generation using solar photovoltaic technology: development of greenfield PV farms
7.1 CCM/CCA /3.1 CE: Construction of new buildings: buildings that NEPI Rockcastle develops for own use and for sale
7.6 CCM/CCA: Installation, maintenance, and repair of renewable energy technologies: installation of photovoltaic panels and auxiliary equipment on the roof or carports of the assets
7.7 CCM/CCA: Acquisition and ownership of the buildings: buildings that NEPI Rockcastle owns and operates
Note regarding 7.1 CCM/CCA /3.1 CE - Construction of new buildings: NEPI Rockcastle develops new buildings both for sale (primarily residential properties) and for its own use – buildings that it manages and from which it generates rental income. In accordance with the definitions set out in Commission Delegated Regulation (EU) 2021/2139, buildings constructed for sale should be classified under category 7.1. Buildings developed for own use can, according to Commission Notice (EU) 2023/267 (question 147), be assigned to both category 7.1 and category 7.7. The Group has elected to classify buildings developed for own use under category 7.1. This represents a change compared with the previous reporting year, when buildings developed for own use were classified under category 7.7. The change results from a reassessment of the technical screening criteria and their applicability to NEPI Rockcastle’s business model. It was determined that category 7.1, together with its associated technical screening criteria, better reflects the nature of NEPI Rockcastle’s development activities. As a result, classification under category 7.1 ensures greater consistency, accuracy, and alignment with the substance of NEPI Rockcastle’s development activities.
Allocation rules to the denominators
As outlined in the Delegated Regulation, total turnover and total capital expenditure (CAPEX) have been calculated based on the International Financial Reporting Standards (IFRS) applied to NEPI Rockcastle’s activities and aligned with the financial statements.
Total turnover = Gross rental income + Service charge income + Revenues from sales of inventory property
Total CAPEX = Capital expenditure on investment properties in use + Additions from construction of investment property under development + Additions from construction of investment property + Additions from Intangible Assets + Additions from Property, Plant and Equipment + Additions to leased assets (IFRS 16) + Additions from asset deals
Operating expenditure (OPEX), as defined by the EU Taxonomy, encompasses “building renovation measures, short-term lease, maintenance and repair, and any other direct expenditure relating to the day-to-day “servicing” of the Group’s assets. To report OPEX under this definition, NEPI Rockcastle has considered the portion of property operating expenses recognised in the consolidated statement of comprehensive income, specifically non-capitalised costs incurred for general maintenance and repairs of buildings and for cleaning.
Whilst other expenses pertain to the eligible activity of acquiring and owning buildings, certain service charge expenses — such as utility expenses, security costs, property- related taxes, property management fees, and marketing costs — are excluded from the OPEX KPI, in line with the EU Taxonomy definition. Similarly, payroll and some general expenses, although typically categorised as OPEX and relevant to the Group’s activities, are excluded.
Total OPEX = OPEX for maintenance + OPEX for repairs + OPEX for cleaning
Allocation rules to the numerators: determining eligible activities
To determine the eligible share of Turnover (numerator), the Group identified revenue categories aligned with the Delegated Acts’ definitions of activities. This includes revenue from the acquisition and ownership of buildings, as well as revenue generated from the construction and sale of developed residential units (construction of new buildings for sale).
For the CAPEX numerator, all costs were deemed eligible, as they relate to the following eligible activities:
Acquisition and ownership of shopping centres
Installation, maintenance, and repair of renewable energy technologies
Construction of buildings for sale (residential units)
Electricity generation using solar photovoltaic technology
The eligible share of OPEX (numerator) encompasses the same categories of operating expenses included in the OPEX denominator, as detailed above.
Double counting prevention
To avoid double counting and ensure accuracy, the following were taken into consideration:
the eligibility criteria were initially established for all the Group’s activities and entities
the Company verified and reconciled that the same amount is not counted under multiple activities
the CAPEX, Turnover and OPEX values (mapped as described above) were reconciled to the respective amounts in the financial statements
In accordance with Regulation (EU) 2020/852 (the “EU Taxonomy”), an economic activity can be considered Taxonomy‑aligned only if it meets all criteria set out in Article 3. For NEPI Rockcastle, this includes showing a substantial contribution to climate change mitigation, ensuring that the activity does not significantly harm any of the other environmental objectives, complying with the minimum safeguards, and meeting the applicable technical screening criteria for the relevant economic activity. The assessment of compliance with each of these requirements is presented in the following subsections.
Substantial contribution to climate change mitigation
To determine the portion of its activities that are environmentally sustainable according to the EU Taxonomy (Taxonomy-aligned), the Group screened its economic activities as of 31 December 2025 against the technical criteria for making a substantial contribution to climate change mitigation, which is the most relevant environmental objective for its operations.
To qualify as making a substantial contribution to climate change mitigation, each of NEPI Rockcastle’s eligible activities across the portfolio must meet the following criteria: |
4.1 CCM: Electricity generation using solar photovoltaic technology | 7.1 CCM: Construction of new buildings | 7.6 CCM: Installation, maintenance and repair of renewable energy technologies | 7.7 CCM: Acquisition and ownership of buildings |
|---|---|---|---|
The activity generates electricity using solar PV technology. | The Primary Energy Demand (PED), is at least 10 % lower than the threshold set for the nearly zero-energy building (NZEB) requirements | Installation, maintenance and repair of renewable energy technologies, on-site | For buildings built before 31 December 2020, the building has at least an Energy Performance Certificate (EPC) class A. As an alternative, the building is within the top 15% of the national or regional building stock expressed as operational Primary Energy Demand (PED) OR For buildings built before 31 December 2020, the building is within the top 15% of the national or regional building stock expressed as operational Primary Energy Demand (PED) |
AND | |||
Airtightness and thermal integrity tests OR Robust and traceable quality control processes in place | |||
For buildings built after 31 December 2020, the building needs to meet the criteria specified in the category 7.1. Construction of new buildings that are relevant at the time of the acquisition or the construction | |||
AND | AND | ||
Calculation of lifecycle Global Warming Potential (GWP) of the building for each stage | Where the building is a large non-residential building, it is efficiently operated through energy performance monitoring and assessment |
4.1 CCM: Electricity generation using solar photovoltaic technology and 7.6 CCM: Installation, maintenance and repair of renewable energy technologies: NEPI Rockcastle invests in solar photovoltaic (PV) technology, both through installations on its own properties and through standalone PV farms.
7.1 CCM - Construction of new buildings: To ensure compliance with the requirement of achieving energy consumption at least 10% below nearly zero-energy building (NZEB) thresholds, independent third-party specialists performed NZEB studies for each project. Proper airtightness is ensured through processes outlined in the Quality Control Plan, with construction quality verified by supervising inspectors. Upon completion, thermal integrity tests are performed. A lifecycle Global Warming Potential (GWP) assessment has also been prepared to support sustainability performance evaluation.
7.7 CCM - Acquisition and ownership of buildings: The Group uses Energy Performance Certificates (EPCs) to assess alignment for buildings constructed before December 2020. In Poland, where the A–F classification system is not available, buildings are assessed based on Primary Energy Demand (PED) benchmarks issued by the Ministry of Economic Development and Technology. Efficient operation is ensured through energy performance monitoring and assessment supported by an energy consumption monitoring platform, Building Management Systems implemented across the portfolio, internal guidelines, and maintenance contracts. Buildings constructed after 31 December 2020 are assessed under the criteria applicable to 7.1 CCM.
Do no significant harm (DNSH) criteria
Adaptation to climate change
In line with the Climate Delegated Act, NEPI Rockcastle conducted comprehensive physical climate risk and vulnerability assessments for all assets, including new construction projects. Based on these results, detailed adaptation plans were developed for all properties identified as having elevated climate-related risks. The same methodology was applied to activities as follows:
7.6 CCM – Installation, maintenance, and repair of renewable energy technologies, including rooftop photovoltaic (PV) panels, and
4.1 CCM – Electricity generation using solar photovoltaic technology, including standalone PV farms
Dedicated climate change adaptation assessments were carried out for every rooftop PV installation and all PV farms.
Other objectives
For projects classified under 7.6 CCM (installation, maintenance, and repair of renewable energy technologies) and 7.7 CCM (ownership of buildings), no DNSH criteria apply beyond those related to climate change adaptation, as described above.
For the economic activity classified as 4.1 CCM (development of photovoltaic farms), compliance with DNSH criteria covering the transition to a circular economy and the protection and restoration of biodiversity and ecosystems was demonstrated, in addition to meeting climate change adaptation requirements.
For 7.1 CCM (construction of new buildings), compliance with all remaining DNSH criteria has been verified. The process of confirming compliance was coordinated and overseen by an independent third-party specialist, who also supports NEPI Rockcastle in achieving BREEAM certification for new construction projects.
The Group is committed to minimising the risk of violating the fundamental human and labour rights defined by the United Nations (UN), the International Labour Organization (ILO), and the Organisation for Economic Co-operation and Development (OECD), and to complying with the Minimum Safeguards as described in the EU Taxonomy Regulation.
Policies and procedures are available to all personnel, in every country and entity. These are posted on the Group's unified engagement and communication platform, whilst key aspects such as the Code of Ethics, the Whistleblowing Policy, the Compliance Statement, ILO Aligned Policy, the Supplier Code of Conduct, Sustainability Commitment and Human Rights Due Diligence Policy are available to all stakeholders on the Group corporate website. Details on the Compliance Management Programme are disclosed in the Risk management and compliance section of the Annual Report, Compliance and Risk Management activities in 2025.
Human rights
NEPI Rockcastle upholds fundamental individual and labour rights, with a strong emphasis on the health, safety, and wellbeing of its employees. Workforce ethics and respect for human rights are core values of the Group. These principles are embedded in the Human Rights Due Diligence Policy published in 2025 and aligned with the UN Guiding Principles on Business and Human Rights (UNGPs), OECD Guidelines for Multinational Enterprises, and ILO Conventions.
The policy defines commitments for all key stakeholder categories:
Own workforce
Suppliers and contractors’ workforce
Local communities and visitors
The human rights due diligence processes include:
Annual and ad-hoc assessments
Stakeholder engagement through various means such as surveys, consultations, workshops
Grievance mechanisms in place and accessible to all stakeholders (Whistleblowing, Sustainability Communication, Data protections, Compliance channels)
Remediation measures, supported by contingency budgets and escalation protocols
A human rights due diligence assessment has been formalised in 2025.
Key measures in place to limit human rights impacts across the Group's operations and value chain include:
A Code of Ethics that enforces zero-tolerance for violations and embeds principles of fairness, inclusion, and respect
A 24/7 whistleblowing hotline accessible to both employees and external stakeholders, ensuring confidentiality and non-retaliation
Comprehensive policies against discrimination, anti-harassment, and anti-bullying
A Supplier Code of Conduct and Sustainability commitment policy
Automated KYC / KYP verification covering besides official company records also negative information from diverse publicly available sources and analysis of major litigations including major breaches of human rights or other unethical practices are escalated for Compliance team analysis
Supplier and leasing contract templates including specific provisions related to: sustainability commitment, supplier code of conduct, anti-money laundering, sanctions, anti-corruption, compliance with laws and regulations, health and safety requirements
Strategic suppliers in asset management selected following a competitive procurement process which also includes an assessment of sustainability topics (including human-rights related) through the Green Assessment Form (internally developed tool)
Third party companies employed to specifically monitor compliance with laws and regulations in the construction site, including with health & safety provisions
Sponsorships and donations granted following a thorough KYC due diligence process, aiming to ensure that eligibility criteria are observed and partners with negative information in human rights area are not accepted
Construction project managers responsible for ensuring full compliance with the construction permit as well as with applicable laws, including for safeguarding the human rights and safety in and around the construction site
Responsible operations practices independently evaluated as part of BREEAM In Use certification and various other assessments (including lessons learned from Occupant’s survey, Noise assessment report, Biodiversity Report, Water quality and Legionella disease regular tests)
Data Privacy Impact Assesments and pen-tests assessments performed for new platforms as well as technical systems, so that to ensure that business interests and privacy related rights and liberties are adequately balanced, in line with applicable legislation
Key KPIs monitored, tracked and reported (including externally)
The Group promotes equal opportunities, diversity, and inclusion throughout the organisation, as articulated in the Diversity and Inclusion Policy and Guideline, and supports employee wellbeing through dedicated health and safety frameworks and wellbeing programmes.
Bribery/Corruption
NEPI Rockcastle has implemented anti-corruption and anti-money laundering (AML) programmes as part of its compliance framework. Specifically, the Group enforces the following programmes:
Anti-Corruption Compliance Programme:
This programme includes annual fraud and corruption risk assessments that systematically evaluate exposure across all business processes and the value chain. Internal anti-corruption guidelines are developed in accordance with international standards and local legislation and are regularly reinforced through ongoing compliance initiatives. Employees are trained to heighten awareness of corrupt practices—both active and passive and to ensure strict adherence to ethical guidelines.
Anti-Money Laundering (AML) Programme:
The Group's AML programme is centred on robust due diligence procedures during supplier, partner, and tenant selection, including Know Your Partner (KYP) screening and enhanced checks for high-risk categories. The programme is supported by documented policies and procedures that comply with international AML standards. Employees are trained to recognise potential money laundering activities and are empowered to escalate concerns through established communication channels. To strengthen AML efforts, the Group implemented a dedicated Sanctions Policy in 2025, with strong oversight from the Board, and organised a dedicated sanctions awareness programme, delivered by specialised external legal counsel for Board members, Executive Management, and key business function representatives.
Both programmes are integrated into the Group’s broader Compliance Management System, which is presented in more detail in the Risk Management Section of the Annual Report.
Taxation
The Company prioritises the adoption and implementation of robust tax risk management strategies as a key element of its governance and risk management framework. Acknowledging the complexities of tax governance and compliance, the Company integrates these aspects into its oversight mechanisms to ensure they receive appropriate focus.
The Board of Directors plays a central role in this process, adopting and regularly monitoring tax risk management strategies. These strategies are designed to identify, assess, and address financial, regulatory, and reputational risks associated with taxation. By proactively managing and reporting tax-related risks, the Company ensures compliance with all regulatory requirements.
To address the challenges of its multi-jurisdictional operations, the Company has established comprehensive policies and procedures for monitoring and mitigating taxation risks. These policies are aligned with the OECD Transfer Pricing Guidelines for Multinational Enterprises and Tax Administrations.
The Audit Committee, a sub-committee of the Board, is responsible for overseeing compliance with fiscal regulations. Further details on tax risk management can be found in the Risk and Compliance Section, Key risk areas.
Fair Competition
NEPI Rockcastle upholds fair competition practices as a core component of its risk management and compliance management. This approach aligns with local legislation in each jurisdiction where the Company operates, as well as internationally recognised best practice guidelines. The evolving legal and regulatory landscape is monitored, and measures are implemented to ensure full compliance.
To effectively identify and manage competition and antitrust risks, NEPI Rockcastle has established a structured framework that encompasses regular risk assessments. For example, before any acquisition, the Company conducts comprehensive due diligence to evaluate potential competition risks, including market dominance, anti-competitive practices, and regulatory hurdles.
The Group delivers specialised competition law and antitrust compliance training to employees in functions most exposed to regulatory risks, including senior management, legal counsel, acquisition teams, and staff involved in market-facing activities such as leasing, procurement, and supplier relations. Training modules cover local and international antitrust regulations, ethical decision-making, and reporting protocols for suspected violations. A dedicated deep-dive training programme was organised in 2025 with the support of specialised external legal counsel.
To reinforce market integrity, the Group has implemented a range of concrete measures, including a standardised supplier selection process, transparent tenant engagement processes, and zero-tolerance policies for anti-competitive behaviour. Regular internal reviews and whistleblower mechanisms enable prompt reporting and investigation of any suspected breaches.
As of December 2025, the Group reports no litigation, convictions, or regulatory penalties related to competition or antitrust matters. Any future incidents, if they occur, will be transparently disclosed in subsequent reporting periods.
Minimum Safeguards – Summary
The table below summarises compliance with minimum safeguards.
ADVERSE SUSTAINABILITY INDICATORS | RESPONSE |
|---|---|
Violations of UN Global Compact Principles and OECD Guidelines for Multinational Enterprises | Zero occurrences |
Unadjusted gender pay gap | See section S1-16 |
Board gender diversity | See Corporate Governance, Board profile section |
Exposure to controversial weapons | Zero occurrences See section SBM-1_09 to SBM-1-17, SBM-1_19 – for further details |
KPIs reporting |
The table below summarises the share of turnover, CAPEX, and OPEX associated with activities assessed as eligible and non-eligible under the EU Taxonomy for 2025. The results indicate that substantially all reported economic activities fall within the scope of the eligible categories defined in the Taxonomy Delegated Acts.
Proportion of turnover, CAPEX, OPEX from products or services associated with Taxonomy-eligible or Taxonomy-aligned economic activities – disclosure covering year (N) (summary KPIs)
KPI (1) | Total '000 Eur (2) | Proportion of Taxonomy-eligible activities (%) (3) | Taxonomy-aligned activities '000 Eur (4) | Proportion of Taxonomy-aligned activities (%) (5) | Climate Change Mitigation (%) (6) | Climate Change Adaptation (%) (7) | Water (%) (8) | Circular Economy (%) (9) | Pollution (%) (10) | Biodiversity (%) (11) | Proportion of enabling activities (%) (12) | Proportion of transitional activities (%) (13) | Not assessed activities considered non-material (%) (14) | Taxonomy-aligned activities previous financial year '000 Eur (15) | Proportion of Taxonomy-aligned activities previous financial year (%) (16) |
|---|---|---|---|---|---|---|---|---|---|---|---|---|---|---|---|
Turnover | 930,663 | 100% | 378,640 | 41% | 41% | - | - | - | - | - | 1% | - | - | 0 | 0% |
CAPEX | 206,383 | 98% | 127,506 | 62% | 62% | - | - | - | - | - | 0% | - | - | 0 | 0% |
OPEX | 76,515 | 100% | 26,861 | 35% | 35% | - | - | - | - | - | 1% | - | - | 0 | 0% |
Turnover In 2025, total Group turnover, as defined above, amounted to €930,663 thousand, with close to 100% eligible and 41% EU Taxonomy-aligned. |
Reported KPI: Turnover
Financial Year: 2025
Economic Activities (1) | Code (2) | Taxonomy eligible KPI (Proportion of Taxonomy eligible Turnover / CAPEX / OPEX) (3) | Taxonomy aligned KPI (monetary value of Turnover / CAPEX / OPEX (4) | Taxonomy aligned KPI (Proportion of Taxonomy aligned Turnover, CAPEX, OPEX (5) | Environmental objective of Taxonomy aligned activities | Enabling activity (12) | Transitional activity (13) | Proportion of Taxonomy aligned in Taxonomy eligible (14) | |||||
|---|---|---|---|---|---|---|---|---|---|---|---|---|---|
Mitigation Climate Change (6) | Adaptation Climate Change (7) | Water (8) | Circular Economy (9) | Pollution (10) | Biodiversity (11) | ||||||||
text | % | % | ('000 EUR) | % | % | % | % | % | % | % | (E where applicable) | (T where applicable) | % |
Acquisition and ownership of buildings | 7.7 CCM/CCA | 98% | 371,988 | 40% | 40% | 0% | 0% | 0% | 0% | 0% | - | - | 41% |
Installation, maintenance and repair of renewable energy technologies | 7.6 CCM/CCA | 1% | 6,652 | 1% | 1% | 0% | 0% | 0% | 0% | 0% | E | - | 100% |
Electricity generation using solar photovoltaic technology | 4.1 CCM/CCA | 0% | - | 0% | 0% | 0% | 0% | 0% | 0% | 0% | - | - | 0% |
Sum of alignment per objective | 0% | 0% | 0% | 0% | 0% | 0% | |||||||
Total KPI - Turnover | 100% | 378,640 | 41% | 41% | 0% | 0% | 0% | 0% | 0% | 40% | |||
The reported KPIs include only activities representing more than 10%, except for activities 7.6 and 4.1, which are considered core to the green energy business and are therefore presented herein as well. The Total KPI line above includes activities below the 10% threshold, for which the split was not presented (7.1). |
CAPEX CAPEX, as defined above, equals €206,383 thousand in 2025, with 98% eligible and 62% EU Taxonomy aligned. |
Reported KPI: CAPEX
Financial Year: 2025
Economic Activities (1) | Code (2) | Taxonomy eligible KPI (Proportion of Taxonomy eligible Turnover / CAPEX / OPEX) (3) | Taxonomy aligned KPI (monetary value of Turnover / CAPEX / OPEX (4) | Environmental objective of Taxonomy aligned activities | Enabling activity (12) | Transitional activity (13) | Proportion of Taxonomy aligned in Taxonomy eligible (14) | ||||||
|---|---|---|---|---|---|---|---|---|---|---|---|---|---|
Taxonomy aligned KPI (Proportion of Taxonomy aligned Turnover, CAPEX, OPEX (5) | Mitigation Climate Change (6) | Adaptation Climate Change (7) | Water (8) | Circular Economy (9) | Pollution (10) | Biodiversity (11) | |||||||
text | % | % | '000 Eur | % | % | % | % | % | % | % | (E where applicable) | (T where applicable) | % |
Acquisition and ownership of buildings | 7.7 CCM/CCA | 47% | 42,279 | 20% | 20% | 0% | 0% | 0% | 0% | 0% | - | - | 43% |
Installation, maintenance and repair of renewable energy technologies | 7.6 CCM/CCA | 0% | 957 | 0% | 0% | 0% | 0% | 0% | 0% | 0% | E | - | 100% |
Construction of new buildings | 7.1 CCM/CCA /3.1 CE | 23% | 36,000 | 17% | 17% | 0% | 0% | 0% | 0% | 0% | - | - | 75% |
Electricity generation using solar photovoltaic technology | 4.1 CCM/CCA | 23% | 48,270 | 23% | 23% | 0% | 0% | 0% | 0% | 0% | - | - | 100% |
Sum of alignment per objective | |||||||||||||
Total KPI - CAPEX | 98% | 127,506 | 62% | 62% | 63% | ||||||||
The reported KPIs include only activities representing more than 10%, except for activities 7.6 and 4.1, which are considered core to the green energy business and are therefore presented herein as well. The Total CAPEX KPI line above also includes activities below the 10% threshold, for which the split was not presented (7.3 and 7.5). |
OPEX In 2025, OPEX, as defined above, equals €76,515 thousand, with 100% eligible and 35% EU Taxonomy aligned. |
Reported KPI: OPEX
Financial Year: 2025
Economic Activities (1) | Code (2) | Taxonomy eligible KPI (Proportion of Taxonomy eligible Turnover / CAPEX / OPEX) (3) | Taxonomy aligned KPI (monetary value of Turnover / CAPEX / OPEX (4) | Environmental objective of Taxonomy aligned activities | Enabling activity (12) | Transitional activity (13) | Proportion of Taxonomy aligned in Taxonomy eligible (14) | ||||||
|---|---|---|---|---|---|---|---|---|---|---|---|---|---|
Taxonomy aligned KPI (Proportion of Taxonomy aligned Turnover, CAPEX, OPEX (5) | Mitigation Climate Change (6) | Adaptation Climate Change (7) | Water (8) | Circular Economy (9) | Pollution (10) | Biodiversity (11) | |||||||
text | % | % | ('000 EUR) | % | % | % | % | % | % | % | (E where applicable) | (T where applicable) | % |
Acquisition and ownership of buildings | 7.7 CCM/CCA | 99% | 26,482 | 35% | 35% | 0% | 0% | 0% | 0% | 0% | - | - | 35% |
Installation, maintenance and repair of renewable energy technologies | 7.6 CCM/CCA | 1% | 332 | 0% | 0% | 0% | 0% | 0% | 0% | 0% | E | - | 81% |
Electricity generation using solar photovoltaic technology | 4.1 CCM/CCA | 0% | 47 | 0% | 0% | 0% | 0% | 0% | 0% | 0% | - | - | 99% |
Sum of alignment per objective | 0% | 0% | 0% | 0% | 0% | 0% | |||||||
Total KPI - OPEX | 100% | 26,861 | 35% | 35% | 0% | 0% | 0% | 0% | 0% | 35% | |||
The reported KPIs include only activities representing more than 10%, except for activities 7.6 and 4.1, which are considered core to the green energy business and are therefore presented herein as well. |
Nuclear and fossil gas related activities
NEPI Rockcastle does not conduct any activities related to nuclear processes or fossil fuels, as defined under activities 4.26–4.31 (environmental objectives CCM and CCA).
Following the Commission Delegated Regulation (EU) of 9 March 2022, amending Delegated Regulation (EU) 2021/2139 as regards economic activities in certain energy sectors and Delegated Regulation (EU) 2021/2178 as regards specific public disclosures for those economic activities, NEPI Rockcastle shall disclose the following information:
Row | Nuclear energy related activities | |
|---|---|---|
1 | The undertaking carries out, funds or has exposures to research, development, demonstration and deployment of innovative electricity generation facilities that produce energy from nuclear processes with minimal waste from the fuel cycle | NO |
2 | The undertaking carries out, funds or has exposures to construction and safe operation of new nuclear installations to produce electricity or process heat, including for the purposes of district heating or industrial processes such as hydrogen production, as well as their safety upgrades, using best available technologies | NO |
3 | The undertaking carries out, funds or has exposures to safe operation of existing nuclear installations that produce electricity or process heat, including for the purposes of district heating or industrial processes such as hydrogen production from nuclear energy, as well as their safety upgrades | NO |
Fossil gas related activities | ||
4 | The undertaking carries out, funds or has exposures to construction or operation of electricity generation facilities that produce electricity using fossil gaseous fuels | NO |
5 | The undertaking carries out, funds or has exposures to construction, refurbishment, and operation of combined heat/cool and power generation facilities using fossil gaseous fuels | NO |
6 | The undertaking carries out, funds or has exposures to construction, refurbishment and operation of heat generation facilities that produce heat/cool using fossil gaseous fuels | NO |
ESRS S1 - Own Workforce
Introduction
NEPI Rockcastle’s commitment to fostering a strong workforce is set out in this strategic pillar: 'Cultivating an attractive, professional, and ethical work environment'. This pillar forms the foundation of the Group’s approach to human rights, workforce management strategy, employee health and safety, wellbeing, engagement, and professional development.
By aligning its practices with internationally recognised standards and maintaining strict compliance with applicable laws and regulations across its jurisdictions, NEPI Rockcastle ensures that its workforce operates within a framework of integrity, transparency, and respect.
The Group’s key business functions include asset and property management, sustainability, development, investment, leasing, marketing, human resources, finance, other support functions. Deep expertise across multiple disciplines and countries enables NEPI Rockcastle to pursue opportunities across CEE effectively. The Group recognises that its long-term performance depends on the skills, engagement, and collaboration of its employees, making workforce management a strategic priority.
SBM-3 – Material impacts, risks and opportunities and their interaction with strategy and business model
Types of Workforces Subject to Material Impacts
// ESRS S1.SBM-3_01 to S1.SBM-3_02
NEPI Rockcastle considers its own workforce to include permanent full-time and part-time staff, temporary staff, independent contractors, and service providers. The policies defined in ESRS 2 are applicable to NEPI Rockcastle entire workforce. The workforce characteristics outlined in section S1-6 reflect the Group-level profile, reinforcing the connection between the Company’s policies and its broader employee composition.
NEPI Rockcastle defines ‘permanent employees’ as full-time and part-time staff who are directly employed by NEPI Rockcastle’s management entities for an indefinite period.
NEPI Rockcastle defines ‘temporary employees’ as individuals who are hired for specific purposes or during specified periods, such as during projects. The Group approaches, engages and treats part-time employees the same as it does full-time employees.
The Group classifies independent contractors and service providers as non-employees.
Material Impacts, Risks and Opportunities Related to Own Workforce
// ESRS S1.SBM-3_03 to S1.SBM-3_06, S1.SBM-3_12
NEPI Rockcastle has identified no material negative impacts on its workforce in its DMA. A review by a cross-functional team comprising representatives from HR, Compliance, and Sustainability confirms that the Company’s operations and workforce policies effectively reduce potential risks, supporting an inclusive and sustainable work environment. The Group’s policies include health and safety protocols, equitable remuneration principles, anti-harassment and anti-discrimination principles.
The Company promotes fair remuneration, diversity and inclusion, work-life balance, health and safety, professional development. These initiatives enhance employee satisfaction and engagement whilst ensuring equitable benefits for all workforce members. Regular surveys and feedback mechanisms help align policies with workforce needs and expectations.
NEPI Rockcastle’s assessment of material workforce-related risks and opportunities applies across all workforce groups, ensuring a comprehensive approach. For further details on material IROs, refer to the tables in SBM-3 – Material impacts, risks, and opportunities and their interaction with strategy and business model.
Risk Assessment: Forced Labour, Child Labour and Workforce Vulnerability
// ESRS S1.SBM-3_07 to S1.SBM-3_11
NEPI Rockcastle closely monitors its operations and supply chains to ensure there are no risks of forced or compulsory labour. This includes strict compliance with local and international labour laws and thorough supplier vetting to reduce potential risks.
The Group enforces a zero-tolerance policy on forced or compulsory labour, extending across its operations and supply chain partnerships. Policies such as the Code of Ethics, Whistleblowing Policy (see Policy Overview) provide clear mechanisms for reporting and addressing unethical practices, enabling prompt resolution of identified risks. Whilst NEPI Rockcastle operates in regions where the risks of child labour and forced labour are inherently low, the Group proactively implements preventive measures, including its Suppliers Code of Conduct, sustainability clauses in contracts, and publicly available Sustainability Commitment Statement and Human Rights Due Diligence Policy.
The Company recognises the importance of identifying workforce groups that may face greater risks due to specific characteristics, contexts, or activities. Through its DMA process, NEPI Rockcastle evaluates potential vulnerabilities across job roles, working environments, and demographic factors. This evaluation has not identified any workforce groups currently at significant risk of harm.
S1-1 – Policies related to own workforce
Policies related to own workforce: Key Policies
// ESRS S1.MDR-P_01-06, S1-1_01
Please refer to the MDR-P Policy Overview section.
Respect for Human and Labour Rights in Own Workforce
// ESRS S1-1_03 to 04
NEPI Rockcastle enforces human rights, including labour rights, through policies and practices that promote a fair, inclusive, and equitable workplace. The Group complies with international standards such as the ILO and national laws, and mitigates the risks of forced, compulsory, and child labour in its own workforce processes. Its approach to human rights aligns with the International Bill of Human Rights, EU Taxonomy Minimum Safeguards, the UN Guiding Principles on Business and Human Rights, the OECD Guidelines for Multinational Enterprises, and ILO core conventions. This is reflected in measures like providing written employment contracts in the local language and clearly defining work schedules and consensual overtime conditions.
The Group is equally dedicated to eliminating discrimination in employment and fostering equality of opportunity and treatment. Recruitment, career development, and remuneration are based on qualifications, competencies and performance, ensuring fairness and transparency. NEPI Rockcastle offers flexible working arrangements to support work-life balance. These initiatives are complemented by a strong emphasis on data privacy and occupational health and safety, ensuring that all employees work in a secure and respectful environment.
Human Rights-Focused Engagement with Own Workforce
//ESRS S1-1_05
NEPI Rockcastle prioritises workforce engagement on human rights through its employee feedback tools. The Group’s SPOT platform serves as a central hub for updates, organisational announcements, and key developments, ensuring timely and transparent communication. Additionally, electronic communication channels deliver critical information on changes, processes, and initiatives, maintaining clarity and consistency.
To further enhance transparency and accessibility, the Group shares regular reports on its corporate website and holds frequent meetings hosted by the CEO and executive management to present results, strategic plans and initiatives, and to recognise employees’ contribution. This communication approach builds trust with employees and other stakeholders whilst showing accountability for financial, and human rights matters.
Employee feedback is integral to NEPI Rockcastle’s human rights engagement strategy. Regular engagement surveys and post-training questionnaires provide valuable insights, enabling continuous refinement of workplace practices. Employees also participate in collaborative workshops, such as the Green Office workshop, embodied carbon workshop, and biodiversity in the assets workshop, all promoting sustainable workplace practices, as well as focus groups where survey feedback is translated into actionable improvements.
Workforce Human Rights Remedies
//ESRS S1-1_06
NEPI Rockcastle’s Human Rights Due Diligence Policy and the Diversity and Inclusion Policy guide its approach to protect workforce rights. These two policies uphold labour rights, eliminate forced and child labour, and support a fair, inclusive, and equitable workplace. This is reflected in transparent recruitment processes, written employment contracts, and clear work schedules, as well as ongoing efforts to eliminate discrimination and promote equal opportunities for all employees.
NEPI Rockcastle also places a strong emphasis on open communication and engagement with its workforce. Through platforms like Whistleblowing channels or Compliance AskMe line and regular meetings with executive management, the Group ensures transparency, accountability, and active involvement of employees in shaping workplace practices. Employee feedback is gathered and used to refine human rights-related policies and procedures, further strengthening the alignment with international standards and the Group’s values.
This policy guides how NEPI Rockcastle addresses human rights issues, ensuring that any reported violations are dealt with promptly and effectively, with protection against retaliation for those who raise concerns. The Group’s work with suppliers and tenants extends these commitments throughout the value chain, promoting ethical practices and compliance beyond its own operations.
Alignment of Workforce Policies with International Standards
// ESRS S1-1_07
NEPI Rockcastle’s workforce-related policies are closely aligned with internationally recognised instruments, as described in the MDR-P Policy overview, reflecting its commitment to fair labour practices, diversity, and ethical standards.
NEPI Rockcastle’s Code of Ethics reinforces alignment with these standards by outlining expectations for ethical behaviour, respect, and integrity. Alongside the policies defining the expected behaviour, the Whistleblowing Policy provides a safe and confidential channel for reporting unethical practices, ensuring accountability and protection against retaliation.
Policies Addressing Labour Rights, Safety, and Non-Discrimination
// ESRS S1-1_08 to S1-1_12
Please refer to Social section in the MDR-P Policy Overview section.
Implementation of Anti-Discrimination and Inclusion Policies
// ESRS S1-1_13
NEPI Rockcastle implements its anti-discrimination and inclusion policies through a structured framework designed to prevent, mitigate, and address discriminatory practices whilst advancing diversity and inclusion. In terms of prevention, the Group has established clear and accessible policies that explicitly outline behavioural standards and prohibit discrimination based on race, gender, age, disability, and other protected characteristics. These policies are communicated organisation-wide to ensure awareness and compliance (details included in MDR-P Policy Overview section).
S1-2 – Processes for engaging with own workforce and workers’ representatives about impacts
Integrating Workforce Perspectives into Decision-Making
// ESRS S1-2_01
NEPI Rockcastle gathers employee feedback through regular surveys and other channels, using insights to guide decision-making. The annual engagement survey covers workplace conditions, with results shared and action plans developed. The Group uses external communication tools, including its website, as well as the SPOT platform, to keep employees and stakeholders informed. This ensures consistency in internal and external messaging and supports transparency. The Whistleblowing Policy offers a confidential means for employees to report unethical behaviour, with strong protection against retaliation.
Workforce Engagement Processes and Responsibilities
// ESRS S1-2_02 to S1-2_04, S1-2_06 to S1-2_07
NEPI Rockcastle uses a structured approach to workforce engagement, ensuring employee views can be factored in the decision-making. Communication channels include the Group website, SPOT platform, direct mailing, and management talks. Feedback is gathered through multiple channels, including an engagement survey conducted every two years, post‑training questionnaires, and specialist assessments such as EDGE Certification-the leading global standard for workplace gender equity and intersectional inclusion-and the DMA assessment. Together, these provide insights that support the continuous improvement of initiatives, policies, and people‑focused programmes.
Engagement occurs throughout the employment lifecycle, starting with onboarding to introduce new employees to the Group’s policies and culture. This engagement continues with regular updates, training sessions, and feedback mechanisms, ensuring employee involvement at key moments and addressing both actual and potential impacts effectively.
NEPI Rockcastle employs various engagement methods tailored to organisational and workforce needs. Internal communication platforms ensure timely information dissemination, whilst external channels, such as the corporate website, provide employees and stakeholders access to key documents like annual reports. The Group maintains a consistent frequency of engagement, with regular surveys providing comprehensive insights and quarterly updates reinforcing its commitment to workforce inclusion in strategic planning.
The operational responsibility for workforce engagement lies with the Human Resources (HR) Department, led by the Group HR Director, supported by Compliance and other departmental heads. This team oversees initiatives including surveys, workshops, and focus groups, ensuring they are effectively conducted and provide actionable insights. The HR leadership integrates this feedback into strategic planning whilst ensuring adherence to policies on diversity, inclusion, and non-discrimination.
Effectiveness is assessed through structured feedback mechanisms, participation metrics, and qualitative insights, ensuring engagement activities remain aligned with organisational goals and employee needs.
Global Framework Agreement
// ESRS S1-2_05
NEPI Rockcastle does not have a Global Framework Agreement in place.
S1-3 – Processes to remediate negative impacts and channels for own workforce to raise concerns
Processes for Addressing Workforce Concerns and Negative Impacts
// ESRS S1-3_01 to S1-3_02, S1-3_05 to S1-3_09
NEPI Rockcastle uses a structured approach to identifying and addressing negative impacts on its workforce. Central to this is the Whistleblowing Policy, which provides secure and confidential channels for employees and external parties to report concerns about inappropriate conduct or actions that may cause harm. Reports can be submitted anonymously through a secure web portal, Group hotline, or directly to Internal Audit, Compliance or Executive Directors. The policy guarantees confidentiality and protects whistleblowers from retaliation, creating a safe environment for raising concerns in good faith.
When a report is submitted, NEPI Rockcastle checks plausibility and, where no grounds exist to dismiss the allegation, conducts a thorough investigation. Investigations are led by the Internal Audit team, often working with other departments or external advisers (if the case), to ensure impartiality and effectiveness. Findings and recommended actions are reviewed by the Audit Committee for accountability and transparency. If an individual is dissatisfied with the response, concerns can be escalated to the Chair of the Audit Committee. Following the investigation, the responsible team proposes recommendations for remediation. These may include consequence management for those responsible, additional internal controls, or enforcement of procedures. The recommendations and management action plans are included in the investigation report. This process helps identify and resolve problems quickly, supporting the Company's ethical and legal standards.
To further support its workforce, NEPI Rockcastle provides a range of additional channels for raising concerns. Employees can report issues directly to their supervisors, the HR department, or Compliance team. Feedback mechanisms, such as Employee Engagement Survey and post-training questionnaires, capture employee insights into workplace satisfaction and performance, whilst focus groups allow for deeper discussions and the development of actionable improvement plans.
NEPI Rockcastle’s grievance and complaints handling mechanism is supported by its open-door policy and accessible reporting channels. Internal policies require that all employees be informed of their rights and the procedures for raising concerns, with this information provided during onboarding and made available through internal communication platforms. The Group Code of Ethics advises the reporting of suspected violations or unethical behaviour, whilst specific channels address data protection-related grievances via the Group Data Protection Officer. In Romania, the jurisdiction with the largest employee base, the Company has implemented a local reporting channel and Whistleblowing procedure that complies with local law, ensuring alignment with regional requirements.
The effectiveness of these mechanisms is tracked and monitored through investigations conducted by Internal Audit, supported by the Risk and Compliance Officer where applicable. Investigation outcomes and recommended actions are reported to the Audit Committee, ensuring transparency and continuous improvement. To enhance awareness and accessibility, NEPI Rockcastle conducts periodic campaigns reminding employees of the Whistleblowing Policy, Code of Ethics, and other relevant procedures. Internal regulations are centrally accessible on SharePoint, with updates published on SPOT internal platform, fostering transparency and trust across the organisation.
Relevant policies are set out in S1-1 above.
S1-4 – Taking action on material impacts on own workforce, and approaches to managing material risks and pursuing material opportunities related to own workforce, and effectiveness of those actions
Preventing Negative Impacts and Delivering Positive Outcomes
// ESRS S1-4_01 to S1-4_09; MDR-A_01-12
NEPI Rockcastle addresses workforce impacts, risks, and opportunities through targeted action plans focused on reducing risks and pursuing opportunities. The Whistleblowing Policy, regular training and awareness initiatives on diversity, non-discrimination, and workplace safety support compliance and organisational values, whilst reporting channels ensure accessibility and transparency. The Group’s Code of Ethics and internal regulations, available via SharePoint and on SPOT, are reinforced through periodic awareness campaigns.
To support continuous improvement, NEPI Rockcastle utilises employee engagement mechanisms such as surveys and focus groups, which inform workplace enhancements and proactively address workforce-related risks. Internal regulations and the Code of Ethics are centrally available and frequently promoted to enhance awareness. The Group’s approach is guided by international human rights and labour standards, with regular stakeholder consultations to identify and address potential risks.
As of the current reporting period, NEPI Rockcastle has not identified material negative impacts requiring mitigation measures. All policies and practices are reviewed regularly to ensure effectiveness, alignment with ESG standards, and ongoing support for a safe, equitable, and compliant work environment.
Key actions
NEPI Rockcastle conducts regular pay reviews and benchmarking exercises to ensure fair and competitive compensation for all employees. The Remuneration Committee oversees these processes to maintain equity and workforce retention.
Scope of key actions
These actions apply to all employees across NEPI Rockcastle’s operations, with a focus on ensuring equity across different regions, roles, and seniority levels.
Time horizon for completion
Pay reviews are conducted annually, with adjustments implemented following the review process.
Description and results of actions to provide or support remedy
Wage reviews have addressed historical discrepancies in compensation, fostering a culture of fairness and transparency. Adjustments have ensured employees are compensated in line with industry and market standards.
Progress of prior disclosed actions
Regular benchmarking has demonstrated the Group’s commitment to maintaining competitive compensation practices, contributing to improved employee satisfaction and retention.
Financial resources
Resources for these initiatives are allocated annually, as part of the Group’s operational expenditure for workforce management. Specific OPEX allocations for the implementation of this action are not available.
Key actions
NEPI Rockcastle offers benefits packages which are covering flexible working arrangements and wellness programmes, to support employee work-life balance. These initiatives reflect the Company's efforts to promote a supportive, efficient working environment whilst maintaining operational efficiency and effectiveness across all functions. The Company’s wellness initiatives are designed to support physical, mental, and social well‑being. These include wellness awareness webinars, participation in sports activities and external sport events, office‑based celebrations, and regular team activities, that strengthen engagement and foster a positive workplace culture.
Scope of key actions
These measures are available to all employees, ensuring broad access to benefits such as remote work and flexible hours.
Time horizon for completion
Work-life balance initiatives are reviewed regularly, with enhancements planned on a three-year cycle.
Description and results of actions to provide or support remedy
Flexible work policies have allowed employees to manage professional and personal responsibilities more effectively, improving overall wellbeing and productivity.
Progress of prior disclosed actions
The implementation of remote work options and wellness initiatives has received positive feedback from employees, confirming the Group’s approach to work-life balance is effective and well-received.
Financial resources
Operational resources are allocated annually to support these initiatives, including infrastructure for remote working and wellness programme management.
Key actions
EDGE certification for gender equality was obtained in December 2024 and is valid until end of 2026.
The Group is also preparing to ensure compliance with the EU Gender Pay Gap Directive (to be completed in 2026), therefore will continue to address gender equality and non-discrimination.
Scope of key actions
These actions apply to all employees, with a focus on achieving gender equity in recruitment, pay, and promotions.
Time horizon for completion
Time horizon is described together with key actions above.
Description and results of actions to provide or support remedy
The Group’s HR Department conducts internal gender pay analyses using data provided by the external salary study consultant.
When gaps are identified through the benchmarking process, the recommendations are developed and corrective actions are implemented, such as equitable pay adjustments and enhancing gender-inclusive recruitment practices.
Progress of prior disclosed actions
In 2024, the Group introduced a training session on unconscious bias, initially planning a follow-up for 2025; however, this subsequent training has been rescheduled to 2026, when awareness training for managers on identifying and mitigating gender biases in recruitment and performance evaluations will be rolled out.
Financial resources
Resources are committed annually for audits, training, and implementation of equitable practices.
Key actions
NEPI Rockcastle provides tailored training and development programmes to enhance employee skills and career growth, ensuring workforce adaptability.
Scope of key actions
Training initiatives are available to all employees, with a focus on addressing specific skill gaps and fostering leadership capabilities.
Time horizon for completion
Annual training programmes are developed and reviewed to align with business needs and employee goals.
Description and results of actions to provide or support remedy
Training initiatives have supported employees in achieving career advancements and adapting to evolving roles within the organisation.
Progress of prior disclosed actions
Selected employees have participated in leadership development programmes, contributing to internal promotions and career progression.
Financial resources
Training and development programmes are funded annually as part of the Group’s workforce investment strategy.
Key actions
The Diversity and Inclusion Policy foster an equitable and supportive workplace, focusing on recruitment, retention, and a sense of belonging for all employees.
Scope of key actions
These initiatives encompass all workforce levels, promoting diversity in hiring practices and internal growth opportunities.
Time horizon for completion
Ongoing efforts include annual reviews of recruitment materials and continuous training to address unconscious biases. In 2024, the Group introduced a short training session on unconscious bias, with an initial plan for a follow-up in 2025; however, this subsequent session has now been rescheduled for 2026.
Description and results of actions to provide or support remedy
Policies have led to more inclusive recruitment processes, ensuring representation of underrepresented groups in the workforce.
Progress of prior disclosed actions
Diversity initiatives have increased the representation of women in leadership roles and enhanced the inclusivity of workplace practices.
Financial resources
Operational resources are allocated to diversity training and policy development as part of the Group’s inclusion strategy.
Key actions
NEPI Rockcastle’s initiatives to promote equity, inclusivity, and professional development are underway. These include a policy on non-discriminatory recruitment and promotion practices, addressing gender biases through systematic reviews of job advertisements and recruitment materials. The Group’s roadmap also includes introducing awareness training focused on gender biases.
The Group’s policy prohibiting sexual harassment and all forms of discrimination provides clear procedures, mandatory training, and protections against retaliation.
Scope of key actions
These initiatives apply across all regions and employee groups, focusing on fostering an inclusive workplace whilst addressing gaps in equity and workplace safety.
Time horizon for completion
These initiatives are ongoing, with the non-discriminatory recruitment process now integrated into the Company’s internal policies and corresponding training underway. Mentoring programmes and flexible work options are refined and expanded to maximise accessibility and impact for all employees.
Description and results of actions to provide or support remedy
These initiatives have enhanced equitable hiring practices, supported employee career progression, and improved work-life balance. The sexual harassment policy has provided employees with transparent and effective mechanisms for addressing workplace concerns.
Progress of prior disclosed actions
Progress includes increased participation in mentoring programmes, including the integration of mentoring as a core component of the Business Coaching programme for Asset Management (AM), where peer-to-peer coaching and mentoring sessions are conducted. Initial success in training outcomes on gender biases, and early adoption of flexible work arrangements, have already shown improvements in employee satisfaction and engagement.
Financial resources
Resources are allocated annually to fund these programmes, including training, policy development, and the implementation of workplace safety measures, ensuring sustainable progress.
NEPI Rockcastle’s commitment to these initiatives contributes to a supportive and inclusive work environment, aligning workforce wellbeing with strategic objectives.
NEPI Rockcastle dedicates substantial resources to managing workforce impacts effectively. The HR team leads wellbeing initiatives, flexible work arrangements, and sustainability training whilst advancing diversity and inclusion. The Sustainability Department aligns environmental and workforce goals, investing in energy efficiency and sustainability reporting. Compliance, Legal, and Internal Audit teams ensure regulatory adherence, conduct audits, and promote ethical standards through codes of conduct and training.
Incident reporting and resolution processes are closely monitored, tracking reports related to harassment, discrimination, and ethical concerns. The Group ensures timely and fair investigations, fostering a safe and supportive environment. By embedding workforce-related IROs into its strategic framework, NEPI Rockcastle strengthens employee engagement, ensures compliance, and enhances organisational resilience.
Supporting Workforce During Green Economy Shift
// ESRS S1-4_19
To mitigate potential negative impacts on workers arising from the transition to a greener, climate-neutral economy, NEPI Rockcastle has implemented targeted measures to support workforce adaptability and resilience.
Key initiatives include retraining and reskilling programmes to equip employees with skills for emerging green industries. NEPI Rockcastle did not conduct a formal training programme in this area during 2025. The Group engages and educates internal stakeholders as it develops climate‑transition initiatives. As new sustainability targets are set and the Group’s Climate Transition Plan is prepared, employees from relevant teams participate in working sessions, consultations, and cross-departmental discussions. Through these practical decision-making processes, employees gain a deeper understanding of climate-related risks, decarbonisation pathways, operational implications, and the role each department plays in achieving Group-wide objectives. This keeps key employees informed and involved in shaping transition policies, building shared ownership across the organisation. By embedding learning into daily activities rather than relying on standalone training, NEPI Rockcastle builds skills over time and supports its long-term sustainability goals.
S1-5 – Targets related to managing material negative impacts, advancing positive impacts, and managing material risks and opportunities
// ESRS S1-5_01 to S1-5_03, S1.MDR-T_16-19
NEPI Rockcastle has set targets to manage own workforce IROs, however, these do not currently meet all ESRS formalisation requirements. Payroll systems and related platforms—including SPOT (Performance Management Module), the Engagement Survey platform, Charisma (Romania), and Excel files are used to measure, track and monitor performance.
S1-6 – Characteristics of the undertaking’s employees
Employee Profile: Gender, Geography and Contract Types
// ESRS S1-6_01 to S1-6_12, S1-6_18
NEPI Rockcastle’s workforce is characterised by employee gender distribution, headcount in countries with a significant share of the Group’s employment, and breakdowns by contract type and gender across countries and regions.
Employee gender distribution
Employee head count by gender | Gender distribution in number of employees at top management level | |||
|---|---|---|---|---|
Gender | 2025 | 2024 | 2025 | 2024 |
Male | 217 | 203 | 5 | 5 |
Female | 470 | 447 | 3 | 3 |
Other | 0 | 0 | 0 | 0 |
Not reported | 0 | 0 | 0 | 0 |
Total Employees | 687 | 650 | 8 | 8 |
Employee head count in countries where the Group has at least 50 employees representing at least 10% of its total number of employees
Country | Number of employees (head count) | |
|---|---|---|
2025 | 2024 | |
Poland | 221 | 191 |
Romania | 319 | 316 |
Total | 540 | 507 |
Employees by contract type, broken down by gender (head count)
Reporting on full-time and part-time employees is voluntary.
Employees by contract type | Female | Male | Other | Not disclosed | Total |
|---|---|---|---|---|---|
Number of employees (head count) | 470 | 217 | 0 | 0 | 687 |
Number of permanent employees (head count) | 435 | 206 | 0 | 0 | 641 |
Number of temporary employees (head count) | 35 | 11 | 0 | 0 | 46 |
Number of non-guaranteed hours employees (head count) | 0 | 0 | 0 | 0 | 0 |
Number of full-time employees (head count) | 465 | 211 | 0 | 0 | 676 |
Number of part-time employees (head count) | 5 | 6 | 0 | 0 | 11 |
New employees and employee turnover
New employees | 2025 | 2024 | ||
|---|---|---|---|---|
Female | 72 | 69% | 112 | 69% |
Male | 33 | 31% | 51 | 31% |
Total | 105 | 100% | 163 | 100% |
< 30 | 32 | 30% | 37 | 23% |
30-50 | 69 | 66% | 113 | 69% |
>50 | 4 | 4% | 13 | 8% |
Total | 105 | 100% | 163 | 100% |
Employees Turnover | 2025 | 2024 | ||
|---|---|---|---|---|
Gender distribution | Number of leavers | %Turnover1 | Number of leavers | %Turnover |
Female | 39 | 5.6% | 46 | 7.1% |
Male | 41 | 6.0% | 45 | 6.9% |
Total | 80 | 11.6% | 91 | 14.0% |
Age distribution | Number of leavers | %Turnover1 | Number of leavers | %Turnover |
<30 | 16 | 2.3% | 18 | 2.8% |
30-50 | 51 | 7.4% | 62 | 9.5% |
>50 | 13 | 1.9% | 11 | 1.7% |
Total | 80 | 11.6% | 91 | 14.0% |
- Total turnover is calculated by dividing the total number of leavers—whether voluntary, involuntary, or for any other reason, excluding maternity leaves—by the total active headcount as of 31 December 2025
Employees by gender and country
Country | F | M | % |
|---|---|---|---|
Bulgaria | 31 | 9 | 5.8% |
Croatia | 13 | 5 | 2.6% |
Czech Republic | 5 | 5 | 1.5% |
Hungary | 15 | 9 | 3.5% |
Lithuania | 5 | 3 | 1.2% |
Malta | 2 | 1 | 0.4% |
Poland | 166 | 55 | 32.2% |
Romania | 203 | 116 | 46.4% |
Slovakia | 27 | 9 | 5.2% |
The Netherlands | 3 | 5 | 1.2% |
Total | 470 | 217 | 100% |
Methodologies and Assumptions for Reporting Workforce Characteristics
// ESRS S1-6_13 to S1-6_17
NEPI Rockcastle employs a structured methodology to compile accurate and reliable employee data, led by the HR team. Data is consolidated from multiple sources, including payroll systems and Excel reports from payroll providers in each operational country. Employees are identified based on their paid status as of the fixed reference date of 31 December 2025, with exclusions for those on long-term unpaid leave or maternity leave without an anticipated return at this date. This static reference point ensures the data reflects the workforce composition at a specific moment, excluding any subsequent hiring or departures.
The Group reports employee numbers using a headcount methodology, providing a clear snapshot of the total number of individuals employed as of the reference date. This method consolidates payroll and departmental records and excludes employees not actively working at the time, offering a comprehensive view of strategic planning and reporting. Unlike full-time equivalent (FTE) reporting, the headcount approach ensures simplicity and transparency in capturing workforce demographics and employment statuses.
Employee numbers are reported based on the end-of-period methodology, specifically at the close of the reporting period on 31 December 2025. This approach delivers an accurate and consistent representation of the workforce by capturing all active employees as of a fixed date. It supports clarity in data reporting and aids in informed decision-making, ensuring alignment with NEPI Rockcastle’s strategic objectives.
NEPI Rockcastle validates the data internally. Currently, there is no external validation in place.
For employee-related costs, please refer to the "Administrative expenses" section in the Financial Statements.
S1-7 – Characteristics of non-employees in the undertaking’s own workforce
Non-Employee Workforce Overview
// ESRS S1-7_01 to S1-7_03
Total number of employees as at 31 December 2025 | THEREOF | Employees | Non-employees |
|---|---|---|---|
687 | 682 | 5 |
Methodology and Assumptions for Non-Employee Workforce Data
// ESRS S1-7_06 to S1-7_10
NEPI Rockcastle employs a distinct methodology to compile data on non-employees within its workforce. Non-employees, such as contractors or individual service providers, are recorded separately from payroll employees. Their inclusion is based on formal service agreements, with payment tracked through monthly service invoices rather than traditional payroll systems. Of the 687 total workforce, 5 are skilled contractors operating in legal, development, and sustainability fields, providing support in areas such as construction, leasing, legal and regulatory litigation, and due diligence. NEPI Rockcastle validates the employee demographics data internally, there is no external validation in place.
S1-9 – Diversity metrics
Workforce Diversity: Gender and Age Distribution
// ESRS S1-9_01 to S1-9_05
The workforce composition at the top management level is presented with a focus on gender distribution, alongside the age distribution of employees across defined age groups.
Gender distribution of employees (head count) at top management level
Top Management / EXCO team Headcount & Gender Distribution | Number | % |
|---|---|---|
Female | 3 | 38% |
Male | 5 | 62% |
Total | 8 | 100% |
Age distribution of employees (head count)
Head Count | Number | % |
|---|---|---|
Distribution of employees (head count) under 30 years old | 78 | 11% |
Distribution of employees (head count) between 30 and 50 years old | 534 | 78% |
Distribution of employees (head count) over 50 years old | 75 | 11% |
Total | 687 | 100% |
Applied Definition of Top Management
// ESRS S1-9_06
NEPI Rockcastle defines "top management" as individuals occupying senior leadership roles responsible for strategic decision-making and overseeing the organisation's overall direction. This includes members of the Executive Management Team, such as the Chief Executive Officer (CEO), Chief Financial Officer (CFO), Chief Operations Officer (COO), Group Asset Director, Group Legal Counsel, Group Development Director, Group HR Director, Group Investment & Mergers & Acquisitions Director. These roles are characterised by their high level of authority, responsibility for setting organisational goals, and accountability for achieving performance targets aligned with NEPI Rockcastle’s strategic objectives.
S1-10 – Adequate wages
// ESRS S1-10_01 to S1-10_03
NEPI Rockcastle ensures that all employees are paid a fair wage aligned with applicable benchmarks. The Group conducts compensation reviews during each performance cycle, benchmarking salaries against industry standards and internal equity measures. These reviews ensure that employees across all levels receive wages that are competitive in the market and equitable within the organisation. Adjustments to salaries are tied to role changes, additional responsibilities, or significant shifts in job scope, ensuring pay matches responsibilities. This transparent approach supports compliance with fair wage standards and motivates employees by linking remuneration directly to performance and impact.
10.4% of employees are positioned slightly below the adequate wage benchmark threshold recommended by the external compensation consultant (compared to 10% in 2024), with the majority occupying non‑managerial roles. The adequate wage threshold is defined as 75%-80% of the market median, and is largely shaped by a combination of internal and external factors, including turnover, labor market trends, the specific dynamics of the retail sector, broader economic conditions, market volatility, inflation and legislative changes. The country distribution is as follows: Romania – 4.7%, Poland – 3.6%, Slovakia – 1.6%, the Netherlands – 0.3%, Bulgaria and Hungary – 0.1% each. The exceptions are predominantly linked to individual circumstances, such as periods of maternity or extended medical leave, recent entry into the role, or being in a development phase following performance review outcomes.
S1-13 – Training and skills development metrics
// ESRS S1-13_01 to S1-13_04
The following disclosure provides data on employee participation in training and skills development, including total participants, number of training hours, and average hours by gender. It also includes information on time spent in regular Business Talks with the Management Team.
Number of employees that participated in training and skills development
F | M | |
|---|---|---|
Total employees that participated in training and skills development1 | 502 | 210 |
Percentage of employees that participated in training and skills development | 70.5 | 29.5 |
- The difference between trained employees and headcount at the end of December 2025 is explained by the number of employees that received training during 2025 but left before year end
Number of hours that employees participated in training and skills development
2025 | 2024 | |
|---|---|---|
Total number of hours of training attended1 | 30,825 | 25,900 |
Soft-skills training hours | 4,838 | 3,723 |
Hard-skills training hours | 7,105 | 7,955 |
Individual and group Coaching hours | 420 | 427 |
Coaching on the job hours | 140 | 1,012 |
Conferences and Business events hours | 14,287 | 10,313 |
Wellbeing topics hours | 285 | 759 |
Business Talks with Management team and Wellbeing topics | 3,750 | 1,712 |
Total number of trained employees2 | 712 | 660 |
Total Headcount at 31 December2 | 687 | 650 |
Average number of training hours per trained employees | 43.3 | 39.2 |
Average number of training hours (without Business Talks and Wellbeing topics) per trained employee | 38.0 | 36.6 |
Average training days/ trained employee | 4.8 | 4.6 |
Average number of training hours per employee (head count on 31 December) | 44.9 | 39.8 |
- Total number of hours of training attended includes also the number hours of Business Talks with Management Team and Wellbeing topics (Attendants’ demographics not kept)
- The difference between trained employees and headcount at the end of December 2025 is explained by the number of employees that received training during 2025 but left before year end
Average number of hours of training and skills development by gender
2025 | 2024 | |||
|---|---|---|---|---|
Employee Development | Women | hours/employee | 38.6 | 39.5 |
Men | hours/employee | 36.7 | 30.6 |
Total number of hours on regular Business Talks with Management Team
2025 | Participation | ||
|---|---|---|---|
Total number of hours on regular Business Talks with Management Team | Available to All Staff | 3,750 | 70-80% |
Percentage of employees that participated in the annual performance review process in 2025 reached 97%. The gender distribution was 69% women and 31% men.
S1-15 – Work-life balance metrics
Employee Access to Family Leave and Gender Breakdown
// ESRS S1-15_01 to S1-15_04
All employees are entitled to family-related leave (e.g. paternity and maternity leave, family bereavement, marriage, and other personal events) in accordance with the legal requirements of their respective jurisdictions.
Percentage of entitled employees that took family-related leave
Unit | 2025 | 2024 | |
|---|---|---|---|
Percentage of employees entitled to take family-related leave | % | 100 | 100 |
Percentage of employees that took family-related leave | % | 8.84 | 9.28 |
Percentage of entitled employees that took family-related leave by gender
Percentage of employees that took family-related leave1 | Unit | 2025 | 2024 |
|---|---|---|---|
F | % | 11.46 | 12.21 |
M | % | 2.51 | 2.55 |
Total | % | 8.84 | 9.28 |
- Calculated by breaking down the total number of women/men who took family related leave in relation to the total number of women/men
S1-16 – Remuneration metrics (pay gap and total remuneration)
// ESRS S1-16_01 to S1-16_03
A key measure of diversity and equity within the Group is the gender pay gap ratio.
The Group consistently monitors the remuneration ratio between men and women across management levels, departments, teams and geographical regions.
For the 2025 salary packages, the pay gap ratio for men compared to women—calculated based on total remuneration, including salaries, short‑term bonuses, long‑term incentive awards and benefits—varies depending on the management level, function and region. At Group level, this ratio ranges from 21% to 34%, showing improvement from the 23% to 39% range recorded in 2024. This positive trend is reflecting ongoing efforts to monitor and reduce gender pay disparities. The breakdown of the pay gap ratio across different levels is as follows:
Pay Gap Ratio women to men
Category1 | 2025 | 2024 |
|---|---|---|
Managerial and Subject matter expert2 | 30 | 33 |
Non-managerial | 21 | 23 |
Grand Total3 | 34 | 39 |
- Pay gap ratios calculated as the difference between the average remuneration of male employees and the average remuneration of female employees, divided by the average remuneration of male employees and multiplied by 100. Remuneration includes gross salaries, short‑term bonuses, long‑term incentive awards and benefits.
- Managerial and Subject Matter Expert roles - include positions that lead teams, as well as highly specialised professional roles requiring deep expertise in a specific field. These roles may not involve direct people management but have significant influence on decisions, policies, or complex cases—for example, Leasing Managers, Lawyers, or Project Managers
- The total is not an average of the pay ratios per management layers
The total pay gap ratio at Group level recorded a slight decrease compared to the previous year, driven primarily by a combination of structural and organisational mix effects. These include the internalisation of activities, the impact of new acquisitions completed at the end of 2024 and reflected in 2025, internal workforce movements, and variations in remuneration packages across different employee segments. Together, these factors influenced the overall composition of the workforce and the distribution of remuneration, resulting in a modest reduction in the total pay gap ratio.
The total remuneration ratio at Group level is 47.5, calculated by dividing the Chief Executive Officer’s annual total remuneration by the median remuneration of all employees, excluding the highest‑paid individual. Total remuneration includes salaries, short‑term and long‑term incentives – cost to company, as well as benefits such as meal tickets, fitness allowances, and medical leave. The ratio is lower than in 2024 (75.7), primarily due to variations in the CEO’s total remuneration. More details about total CEO remuneration package as well as the CEO pay ratio relative to the average employee compensation (43 for 2025 and 66 for 2024) are disclosed in the Remuneration Report, page .
Integration of MDR-M Requirements (S1-9, S1-13, S1-16)
Definition of reported metrics
Each reported metric is established based on regulatory requirements, industry standards, and internal sustainability and strategic objectives. The key aspects of metric definition include:
Scope and Coverage: Clearly defined boundaries for data collection (e.g. organisational units, geographies, business operations) in alignment with sustainability reporting methodology
Relevance to Material IROs: Metrics are identified based on the Impact, Risk, and Opportunity (IRO) analysis to ensure alignment with significant sustainability issues
Standardisation: Established frameworks such as EPRA sBPR, GRI and ESRS are used where applicable to define metrics
Regulatory Compliance: Adherence to MDR-M 73, which mandates specific disclosure requirements for each reported metric
Measurement of reported metrics
The measurement process follows a structured and standardised methodology to ensure accuracy, comparability, and consistency. Key aspects of measurement include:
Quantitative and Qualitative Assessments: Metrics are measured using a combination of numerical data (e.g. employee turnover rates, pay rates, gender distribution, training statistics maintained by HR) and qualitative evaluations (e.g. 360 feedback)
Data Collection and Validation:
Data is sourced from dedicated reporting platforms (Charisma platform for Romania, outsourced payroll providers platforms for administrative and payroll activities, SPOT)
A combination of automated tracking tools and manual inputs ensures comprehensive data collection. The data is consolidated in Excel files, with key performance indicators (KPIs) calculated and verified by HR
Internal controls are in place to validate data integrity. For instance, environmental performance is verified, as presented in other sections of this report, and staff data is cross-checked by the HR department. Performance results are reviewed for reasonability by the HR Director, calibrated with the CEO and CFO for the entire organisation
Benchmarking and Target Setting:
Metrics are compared against industry benchmarks and historical performance (especially for key executive positions)
Performance is evaluated against pre-defined KPIs
Audit and Assurance:
External validation is conducted in some areas, in accordance with MDR-M 77(b) to confirm the reliability of measurements. For example, EDGE certification on equality obtained in 2025 entailed an external review by IFC consultant (data covered: headcount, new hires, leavers, training allocation, gender distribution, and roles with P&L responsibility comparison). Verification audit was performed by Intertek
Alignment with material sustainability matters
To ensure relevance, all reported metrics are aligned with the broader sustainability framework through:
Integration with Risk and Opportunity Assessments:
Metrics are evaluated in the context of risk exposure, business resilience, and long-term sustainability strategy
This approach ensures that reported data informs strategic decision-making and risk mitigation efforts
2. Continuous Monitoring and Improvement:
Performance is monitored through regular reviews and updates via the dedicated reporting platform SPOT. Calibration is performed as the final control to ensure internal equity and fairness
Corrective actions and strategic interventions are applied when performance deviates from targets or expectations
Additionally, per MDR-M 77(b), the Group will explicitly disclose whether the measurement of reported metrics has been validated by an external body, other than the assurance provider. If applicable, the name of the external body will be specified. The use of platforms such as SPOT (Performance Management Module) and the Engagement Survey platform, along with structured Excel-based reporting, ensures efficient integration of these requirements, guaranteeing completeness and compliance.
S1-17 – Incidents, complaints and severe human rights impacts
// ESRS S1-17_1 to S1-17_11, S1-17_12 to S1-17_14
NEPI Rockcastle fosters an inclusive culture, providing equal opportunities for growth and advancement to all employees. The Company confirms that no fines, penalties, or compensation for damages have been imposed as a result of discrimination, harassment, or related complaints filed by employees. Furthermore, there have been no human rights issues or incidents (including discrimination or harassment) involving the Group’s employees, showing the Company's commitment to a fair and respectful workplace.
The Group’s Human Rights Due Diligence (HR DD) process is central to this commitment. The HR DD process is designed to identify, assess, and address potential and actual human rights risks across all areas of operation. It involves regular risk assessments, employee engagement, and monitoring to ensure early detection and resolution of issues.
The process is supported by the Policy, formalised in 2025, and internal regulations, which are communicated to all staff and supported by ongoing training and awareness initiatives. When complaints or incidents are reported, the HR, Compliance and Legal teams promptly begin a thorough review, ensuring fairness, transparency, and compliance with company policy and applicable legislation. Outcomes and any corrective actions are documented and, where appropriate, reported to relevant authorities or oversight bodies. This approach ensures that NEPI Rockcastle complies with national and international human rights standards whilst fostering a culture of inclusion, respect, and accountability throughout the organisation.
NEPI Rockcastle has not received any fines or penalties for human rights issues.
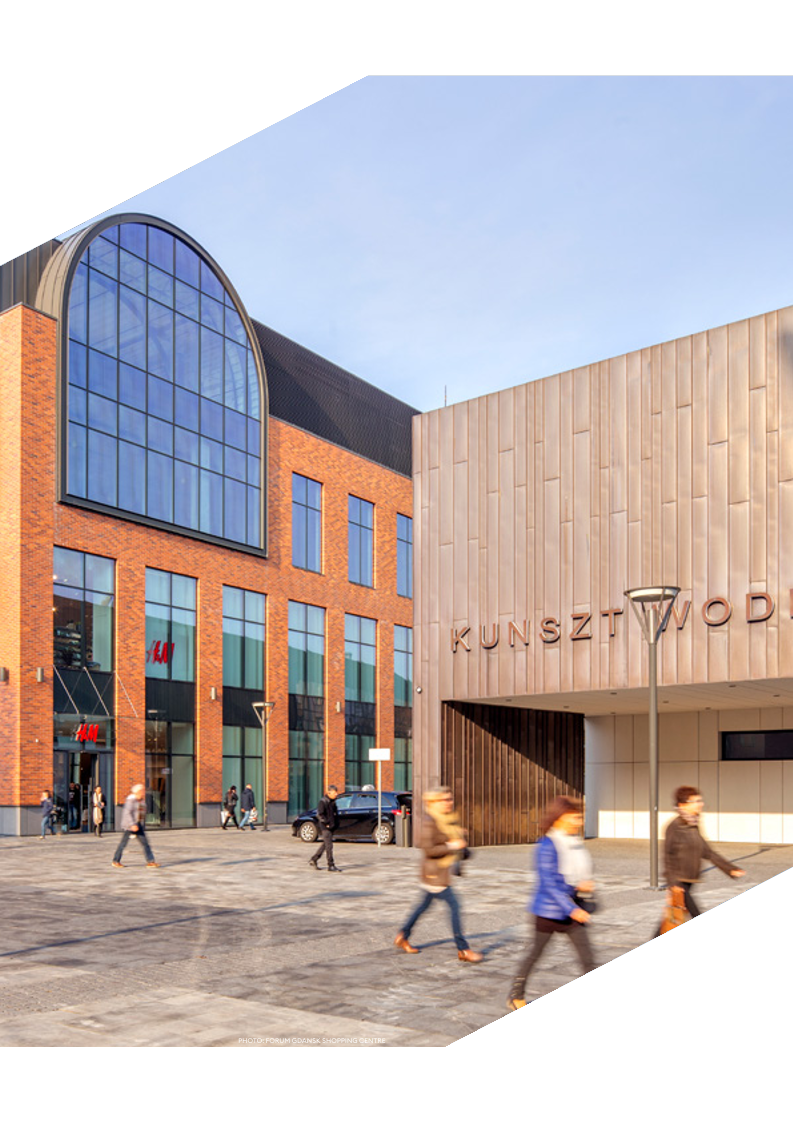
ESRS G1 - Business Conduct
Introduction
NEPI Rockcastle maintains ethical business conduct, recognising that sound governance is fundamental to its ongoing success and sustainability. The Group’s activities affect a diverse range of stakeholders, including employees, tenants, suppliers, investors, and local communities. Transparency, fairness, and integrity in all interactions are essential for sustaining stakeholder trust and confidence.
The Group’s approach to business conduct is guided by ethical governance principles, compliance with applicable laws and regulations, and alignment with internationally recognised best practices. The business conduct framework comprises policies and procedures that define expected behaviours and practices for personnel, partners, and suppliers. These policies promote integrity, fairness, and accountability in operational and strategic decision-making.
The Group recognises the role of sustainable procurement practices and responsible supplier relationships in promoting good governance. Sustainability considerations are embedded into strategic procurement processes, with partnerships prioritised with organisations that share similar values, to support positive ESG outcomes across the value chain.
NEPI Rockcastle has not defined formal targets related to business conduct in line with ESRS requirements. However, the Group’s Risk Appetite Statement, approved by the Board of Directors, establishes a zero-tolerance policy for fraud, corruption, and serious breaches of the Code of Ethics by employees, collaborators, or Directors. Violations may result in disciplinary action, including demotion or dismissal, in accordance with Internal Regulations and local laws, or contractual liability where no employment relationship exists. This zero-tolerance policy serves as a key performance indicator for the Risk and Compliance function, reviewed annually to ensure accountability. Ethical conduct risks are identified through an annual risk assessment process, monitored continuously through the Risk Register, updated quarterly, and reported to and overseen by the Risk and Compliance Committee.
ESRS Sub-Topic | Impacts | Positive/Negative | Position in the Value Chain | Risks | Opportunities |
|---|---|---|---|---|---|
GOV-1 – Role of the administrative, management and supervisory bodies | Oversight over sustainability strategy, governance of material IROs, target-setting, monitoring of progress, integration of ESG into decision-making | Positive | Own operations | Potential misalignment between strategic decisions and sustainability priorities; reputational or compliance risks; delayed response to emerging sustainability risks | Enhanced decision-making; stronger integration of sustainability; improved stakeholder trust; ability to anticipate regulatory developments |
GOV-1 – The role of the administrative, management and supervisory bodies
// ESRS G1.GOV-1_01
Please refer to the Corporate Governance section (Role of the Board chapter) in the Annual Report.
G1-1– Business conduct policies and corporate culture
Business Conduct and Culture: Key Policies
// ESRS G1.MDR-P_01-06
Please refer to MDR-P Policy Overview section.
NEPI Rockcastle has established a governance framework to address material IROs related to business conduct and corporate culture. Under the oversight of the Board of Directors, this framework ensures alignment with governance codes in the capital markets where the Company is listed, international best practices, and local legal requirements. The Group’s governance approach integrates compliance with the King IV Report on Corporate Governance, the Dutch Corporate Governance Code, and the requirements of the Johannesburg Stock Exchange, Euronext Amsterdam, and A2X.
The Board approves key governance policies and empowers the CEO to implement and oversee their effectiveness, ensuring consistency with the Group’s strategy and operations. The Board also empowers the CEO to approve and implement operational policies and procedures governing day-to-day Group activities. The Policy Framework Procedure outlines the principles for drafting, managing, and implementing these policies and procedures across the Group’s multinational operations.
In line with the Policy Framework, the Risk and Compliance Officer conducts an annual structured review together with regulation owners (individuals accountable for compliance) and key support functions such as Legal and Internal Audit. The review assesses whether changes are needed based on updated processes, systems, objectives, risks, and controls. In addition to the regular review process, regulations are revised and updated as necessary.
Business Conduct and Culture: Overview
//ESRS G1-1_01, G1-1_02, G1-1_05, G1-1_08, G1-1_10, G1-1_11
NEPI Rockcastle fosters an ethical corporate culture underpinned by strong governance, ensuring effective oversight, robust performance, and adherence to legal and regulatory standards. The Board of Directors takes collective responsibility for establishing and maintaining the Group’s governance framework, aligning corporate culture, activities, and behaviour with the principles of integrity, compliance, and sustainability. The Chairman leads efforts to embed ethical standards in the governance framework and the Company’s overall culture, whilst Executive Directors ensure alignment between corporate values and operational strategies, processes, and projects.
A formal onboarding and induction programme familiarises new Directors with the Group’s business operations, strategy, and governance framework. This programme ensures a comprehensive understanding of the Group’s culture, compliance policies, and unique business environment. Additionally, the Board oversees enterprise risk management by promoting an ethical risk profile and integrating ethical considerations into practices, policies, and procedures. Should misalignment with the Group’s values be identified, corrective actions are promptly implemented.
The Group has established a consumer-centric culture, driven by the Chief Operating Officer (COO), who focuses on refining processes, leveraging technology, and enhancing functions to meet consumer needs. This approach complements the broader corporate culture and supports governance standards and ethical business practices across all operations.
More details about the Group’s culture and Board oversight are included in the Corporate Governance section, Company’s culture chapter, page .
NEPI Rockcastle has implemented safeguards to ensure transparent reporting and resolution of irregularities. The whistleblowing mechanism provides employees, suppliers, and partners with secure, confidential, and anonymous channels for reporting breaches of laws, policies, or ethical standards. Reports are managed by Internal Audit, ensuring prompt, independent, and thorough investigation. Internal Audit staff receive annual training on functional areas, including audit and investigation topics, as well as soft skills, to enhance the quality and effectiveness of their work.
The Group framework protects whistleblowers from retaliation and guarantees confidentiality, in line with international best practices and EU Directive 2019/1937 on whistleblower protection. Local reporting channels in Romania and Poland further enhance accessibility and promote full compliance with local laws.
Beyond the whistleblowing procedure and investigations performed under this framework, the Internal Audit function is mandated through the Internal Audit Charter, approved by the Board, to investigate potential incidents of non-compliance, fraud, and corruption, either as part of the Annual Audit plan or on an ad-hoc basis.
All reports issued by Internal Audit are presented to the Audit Committee, where key conclusions, recommendations, action plans, and subsequent follow-up results are analysed. In line with the Audit Charter, Internal Audit is independent and objective in its activities. This is ensured by the functional reporting line to the Audit Committee and by not allocating responsibility for management and business decisions to this function. Further details on the organisation of the Internal Audit function and the oversight duties of the Audit Committee are included in the Corporate Governance section.
Regular training and awareness campaigns promote an ethical organisational culture, fostering transparency and fairness within the workplace and in dealings with stakeholders. For more details on employee training, please refer to section S1-13 on training and skills development metrics as well as the table provided below.
The annual Compliance Programme, led by the Compliance and Risk Management function, defines the focus areas for training. Topics covered include the General Compliance Policy, Code of Ethics, Whistleblowing Policy, and Declaration of Interests Policy. These campaigns target all employees and utilise internal communication channels, the Group’s SPOT platform, and dedicated training platforms to ensure widespread participation and understanding. Risk and Compliance also coordinate annual awareness campaigns and the collection of conflict-of-interest statements from all employees and Directors. The training and awareness campaigns are structured as follows: an annual general campaign covering all staff (including conflict of interest disclosures and acknowledgement of internal policies and procedures); a dedicated training programme for new joiners; communications via the SPOT platform on various compliance and risk management topics (ethical conduct, gifts policy, whistleblowing rules and reporting channels, data privacy, etc.); and at least two awareness campaigns per year via the KnowBe4 training platform.
The Group’s annual fraud risk assessment identifies functions most exposed to corruption and bribery, including Leasing, Procurement, Development, and Asset Management. Fraud risks are evaluated using the Group’s risk assessment methodology, with gross and residual risk levels measured against the Board-approved Risk Appetite. Mitigation measures are planned, and progress is monitored and reported to the Risk and Compliance Committee.
All Group employees are covered through training programmes (100% of functions at risk out of the active headcount). The training and awareness programme deployed in 2025 focused on the following topics: |
Topic | Personnel in scope | Channel | Frequency |
|---|---|---|---|
Competition Compliance | All staff Selected staff categories (Legal, Leasing, Procurement) | SPOT platform External provider | Annually |
Compliance training about the role and importance of policies and procedures in an organisation | All staff | SPOT platform Training platform | Annually |
Compliance training on bribery and corruption rules and required business conduct | All staff | SPOT platform | Annually |
Annual Compliance and Privacy Campaign | All staff | SPOT platform Training platform | Annually |
New joiners’ induction | New joiners | Upon onboarding | |
Responsible use of AI | All staff | SPOT platform | Occasional - awareness campaign in 2025 |
Know-Your-Counterparty due diligence process | All staff Teams in selected countries | Online | Annually, as part of annual compliance training campaign and/or the occasional awareness communications |
G1-2 – Management of relationships with suppliers
// ESRS G1-2_01 to G1-2_03, G1.MDR-P_07-08
NEPI Rockcastle applies a structured and transparent approach to managing supplier relationships, recognising their critical role in the Group’s operational success and sustainability objectives. For information on payment terms, refer to section G1-6.
To reduce potential delays and enhance operational efficiency, NEPI Rockcastle has implemented digital invoice processing platforms for most supplier categories, streamlining invoice review and validation and enabling more timely and accurate payments.
The Group adopts a comprehensive supplier management strategy designed to address risks within the supply chain and promote responsible practices. Suppliers undergo rigorous evaluation and vetting, including due diligence assessments of financial health, operational capabilities, and adherence to ethical standards and anti-money laundering regulations, based on the Know-Your-Counterparty procedure (see MDR-P Policy overview). These measures aim to address risks such as supply chain disruptions, regulatory non-compliance, quality issues, and engagement with suppliers involved in unethical practices. Additional emphasis is placed on key operational suppliers in the Group’s two largest portfolios, Romania and Poland, where supplier adherence to environmental protection and labour rights is evaluated using the Green Assessment Form (GAF).
The Group’s Procurement Policy (see MDR-P overview) requires the use of the GAF in NEPI Rockcastle’s procurement practices. The GAF is incorporated into operations tendering processes in Romania and Poland for contracts exceeding EUR 100,000 (representing approximately 80% of expenditure in each country), contributing on average 5% to the evaluation score. The assessment evaluates suppliers on environmental impact, energy efficiency, waste management practices, and sustainable sourcing. Social aspects are also considered, including labour practices, diversity and inclusion policies, ethical employment, and compliance with human rights standards. Governance factors such as ethical business conduct, transparency, and regulatory compliance are also reviewed.
The Group has implemented a supplier performance evaluation and business review process covering supplier performance in 2025, with strategic operations suppliers prioritised. The review is ongoing at the date of this report and covers top strategic suppliers in Romania (72% of strategic country spend in scope) and Poland (37% of strategic country spend in scope). The business review sessions aim to address discrepancies, including performance issues and negative impacts, collaboratively develop corrective actions, and explore approaches to enhance sustainability and responsibility across the supply chain.
G1-3 – Prevention and detection of corruption and bribery
// ESRS G1-3_01 to G1-3_08
Under the corporate governance framework, key measures to prevent and address corruption and bribery are guided by the General Compliance Policy, Code of Ethics, and Whistleblowing Policy.
The Group conducts an annual risk assessment to identify vulnerabilities, particularly in high-risk areas such as leasing, procurement, and development. In 2025, a comprehensive fraud risk assessment was undertaken to identify potential risk triggers across these and other relevant risk domains. The assessment focused on identifying exposures and recommending robust procedures, clear delegation of authority, and detailed job descriptions to mitigate risks. It also emphasised fraud risk awareness and targeted training programmes for relevant personnel, ensuring the organisation remains vigilant regarding evolving threats.
The 2025 assessment highlighted several areas considered most exposed to fraud risk, including unethical business conduct, inadequate internal controls, financial statement and reporting fraud, workforce and employee-related risks, sponsorship and donations, greenwashing, supplier and tenant-related fraud risks, mergers and acquisitions (M&A) and disposals, information assets, outsourced services, licensing and intellectual property risks, as well as relationships with authorities. Each of these risk areas was scrutinised to identify specific risk triggers, with tailored recommendations provided to strengthen controls and enhance transparency throughout the Group’s operations.
Following the assessment, the Group will continue to monitor and enhance its fraud risk management framework, ensuring that best practices are embedded within operational procedures and that staff remain adequately trained to recognise and respond to fraud risks promptly and effectively.
A structured due diligence process, based on the Know-Your-Counterparty procedure, is applied to assess business partners' compliance with anti-corruption standards. The whistleblowing mechanism, as described above, enables stakeholders to report concerns confidentially without fear of retaliation. Investigations are managed independently by Internal Audit.
NEPI Rockcastle communicates its anti-corruption and anti-bribery approach, as described in the Code of Ethics and Compliance Policy (see MDR-P Overview Table), to all employees and partners. These policies are accessible via the SPOT platform and disseminated through internal communication channels, supported by targeted training and awareness campaigns. External partners are informed of the Group’s ethical standards through contractual clauses, the publicly available Code of Ethics and Supplier Code of Conduct, and direct communication.
The Compliance agenda, including the annual training campaign, is proposed by the Risk and Compliance Officer and endorsed by the Risk and Compliance Committee. Training sessions are organised for all employees, covering topics such as bribery prevention, fraud risk management, and ethical decision-making, as described above. New employees participate in an induction training programme covering key compliance and information security topics.
Training materials, including handbooks and interactive modules, are provided to enhance understanding and engagement with key compliance principles. The training and awareness campaigns are addressed to all categories of personnel, with coverage extending to all identified high-risk functions (including personnel involved in managing sponsorships and donations, supplier management, construction process management). Additional training has been provided to local teams based on regional regulatory requirements.
Regular updates (at least annually) are provided to the Board of Directors, covering emerging regulatory obligations, business conduct risk scenarios, anti-corruption and anti-bribery matters, and updates to the Company’s Code of Ethics.
The annual conflict of interest and awareness campaign, coordinated by Compliance, also covers Executive and non-Executive Directors and includes key requirements from the Code of Ethics and governance policies.
The Risk and Compliance function reports to the Risk and Compliance Committee on a quarterly basis, as presented in more detail in the Risk management and compliance section.
Detection mechanisms, as detailed throughout this report, are in place to ensure that indications of corruption and bribery are swiftly identified, independently and objectively investigated, and addressed.
G1-6 – Payment practices
G1-6_01 to G1-6_05
// ESRS G1-6_01 to G1-6_05
The Group operates across multiple markets where payment terms range between 15 and 45 days. Whilst a rigid payment policy can restrict the flexibility needed to accommodate local business practices and supplier arrangements, the Group formally defined its supplier payment policy across jurisdictions in 2025.
Based on outstanding supplier invoices as at 31 December 2025, NEPI Rockcastle calculated an average of 26 days to pay its invoices. 69% of the annual Group invoices by value (representing OPEX suppliers) were paid within an average of 25 days, and the rest of 31% of the annual invoices by value (for CAPEX suppliers) were paid within an average of 27 days. The calculation is made using the Days Payables Outstanding (DPO) formula with 360 days considered.
Payment Practices | Total |
|---|---|
Average number of days to pay invoice from date when contractual or statutory term of payment starts to be calculated | 26 |
Percentage of payments aligned with standard payment terms | In 2025, NEPI Rockcastle was unable to calculate this indicator due to the lack of a standardised payment policy. A Group-wide Payment Policy was approved in December 2025 and will come into effect in 2026. During 2026, the Group will also establish reporting mechanisms to monitor the percentage of on-time payments |
Number of outstanding legal proceedings for late payments 1 | 2 |
- The two legal proceedings referenced are limited in scope, and the associated financial impact is immaterial relative to the total value of payments made and the scale of the Group’s supplier base. They relate to specific, isolated cases and do not indicate any systemic issues in the Group’s payment practices. The Group remains fully committed to addressing these matters with due diligence and ensuring they are resolved transparently and in a timely manner
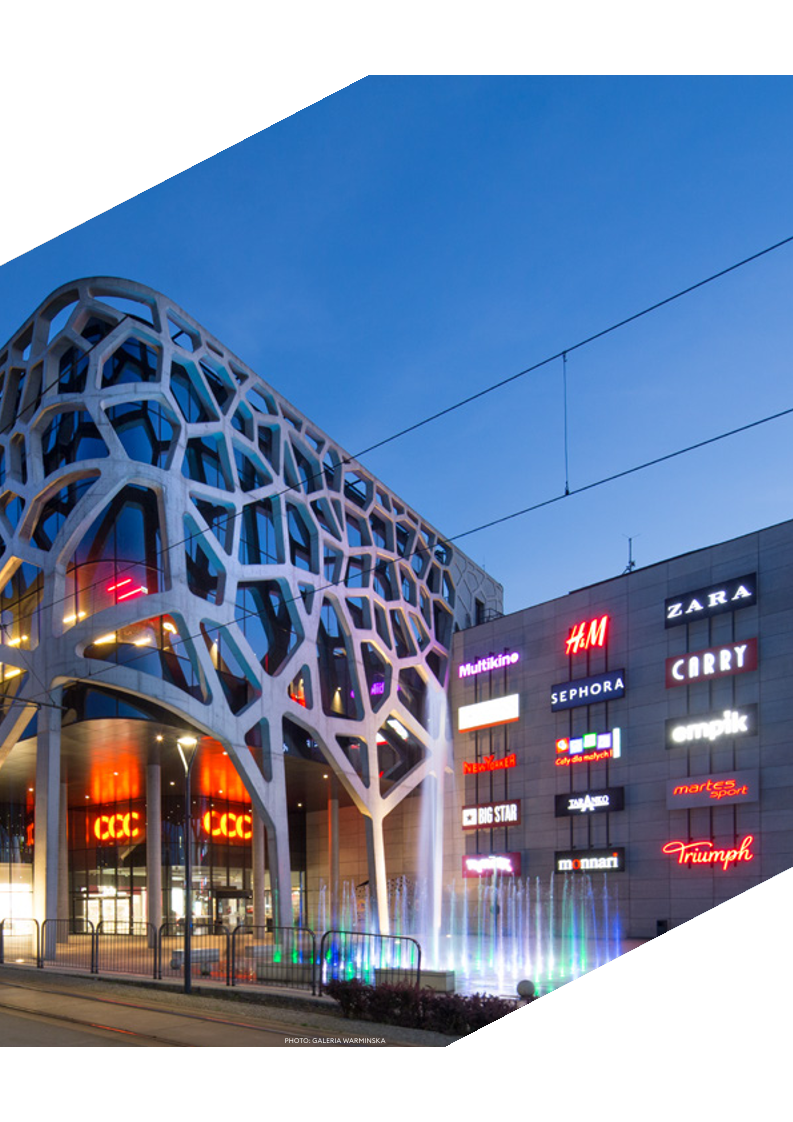
Appendix 1 - ESRS tables
Disclosure requirement | Title | Page number |
|---|---|---|
ESRS 2 General disclosures | ||
BP-1 | General basis for preparation of the sustainability statement | 181 |
BP-2 | Disclosures in relation to specific circumstances | 182 |
GOV-1 | The role of the administrative, management and supervisory bodies | 185 |
GOV-2 | Information provided to and sustainability matters addressed by the undertaking’s administrative, management and supervisory bodies | 187 |
GOV-3 | Integration of sustainability-related performance in incentive schemes | 187 |
GOV–4 | Statement on due diligence | 188 |
GOV–5 | Risk management and internal controls over sustainability reporting | 188 |
SBM-1 | Strategy, business model and value chain | 189 |
SBM-2 | Interests and views of stakeholders | 191 |
SBM-3 | Material impacts, risks and opportunities and their interaction with strategy and business model | 193 |
IRO-1 | Description of the process to identify and assess material impacts, risks and opportunities | 197 |
IRO-2 | Disclosure Requirements in ESRS covered by the undertaking’s sustainability Statement | 200 |
ESRS E1 Climate change | ||
GOV-3 | Integration of sustainability-related performance in incentive schemes | 208 |
E1-1 | Transition plan for climate change mitigation | 208 |
SBM-3 | Material impacts, risks and opportunities and their interaction with strategy and business model | 211 |
IRO-1 | Description of the processes to identify and assess material climate-related impacts, risks and opportunities | 212 |
E1-2 | Policies related to climate change mitigation and adaptation | 214 |
E1-3 | Actions and resources in relation to climate change policies | 214 |
E1-4 | Targets related to climate change mitigation and adaptation | 217 |
E1-5 | Energy consumption and mix | 220 |
E1-6 | Gross Scopes 1, 2, 3 and Total GHG emissions | 222 |
E1-7 | GHG removals and GHG mitigation projects financed through carbon credits | Assessed as not material |
E1-8 | Internal carbon pricing | 224 |
E1-9 | Anticipated financial effects from material physical and transition risks and potential climate-related opportunities | Application of phase-in provision |
ESRS E2 Pollution assessed as not material in the DMA | ||
ESRS E3 Water resources | ||
IRO-1 | Description of the processes to identify and assess material water and marine resources-related impacts, risks and opportunities | 225 |
E3-1 | Policies related to water and marine resources | 225 |
E3-2 | Actions and resources related to water and marine resources | 226 |
E3-3 | Targets related to water and marine resources | 227 |
E3-4 | Water consumption | 227 |
E3-5 | Anticipated financial effects from material water and marine resources-related risks and opportunities | Application of phase in provision |
ESRS E4 Biodiversity and Ecosystems was identified as material in the DMA. Not reported in 2024 based on the application of phase-in provision. | ||
ESRS E5 Resource use and circular economy | ||
IRO-1 | Description of the processes to identify and assess material resource use and circular economy-related impacts, risks and opportunities | 228 |
E5-1 | Policies related to resource use and circular economy | 228 |
E5-2 | Actions and resources related to resource use and circular economy | 229 |
E5-3 | Targets related to resource use and circular economy | 230 |
E5-4 | Resource inflows | 230 |
E5-5 | Resource outflows | 230 |
E5-6 | Anticipated financial effects from material resource use and circular economy-related risks and opportunities | Application of phase-in provision |
ESRS S1 Own workforce | ||
SBM-3 | Material impacts, risks and opportunities and their interaction with strategy and business model | 242 |
S1-1 | Policies related to own workforce | 243 |
S1-2 | Processes for engaging with own workforce and workers’ representatives about impacts | 244 |
S1-3 | Processes to remediate negative impacts and channels for own workforce to raise concerns | 245 |
S1-4 | Taking action on material impacts on own workforce, and approaches to managing material risks and pursuing material opportunities related to own workforce, and effectiveness of those actions | 245 |
S1-5 | Targets related to managing material negative impacts, advancing positive impacts, and managing material risks and opportunities | 248 |
S1-6 | Characteristics of the undertaking’s employees | 249 |
S1-7 | Characteristics of non-employees in the undertaking’s own workforce | 250 |
S1-8 | Collective bargaining coverage and social dialogue | Assessed as not material |
S1-9 | Diversity metrics | 250 |
S1-10 | Adequate wages | 251 |
S1-11 | Social protection | Assessed as not material |
S1-12 | Persons with disabilities | Assessed as not material |
S1-13 | Training and skills development metrics | 252 |
S1-14 | Health and safety metrics | Assessed as not material |
S1-15 | Work-life balance metrics | 252 |
S1-16 | Remuneration metrics (pay gap and total remuneration) | 253 |
S1-17 | Incidents, complaints and severe human rights impacts | 254 |
ESRS S2 Workers in the value chain assessed as material in the DMA. Not reported in 2024 based on the application of phase-in provision. | ||
ESRS S3 Affected communities assessed as material in the DMA. Not reported in 2024 based on the application of phase-in provision. | ||
ESRS S4 Consumers and end-users assessed as material in the DMA. Not reported in 2024 based on the application of phase-in provision. | ||
ESRS G1 Business conduct | ||
GOV-1 | The role of the administrative, management and supervisory bodies | 256 |
G1-1 | Business conduct policies and corporate culture | 256 |
G1-2 | Management of relationships with suppliers | 259 |
G1-3 | Prevention and detection of corruption and bribery | 259 |
G1-4 | Incidents of corruption or bribery | Assessed as not material |
G1-5 | Political influence and lobbying activities | Assessed as not material |
G1-6 | Payment practices | 260 |
Appendix 2 - Datapoints that derive from other EU legislation
Disclosure requirementand related data point | SFDR* reference | Pillar 3** reference | Benchmark Regulation*** reference | EU Climate Law**** reference | Outcome of DMA | Page number |
|---|---|---|---|---|---|---|
ESRS 2 GOV-1,para. 21(d) | Indicator no 13 of Table #1 of Annex 1 | Regulation (EU) 2020/1816*****, Annex II | material | 185 | ||
ESRS 2 GOV-1, para. 21 (e) | Regulation (EU) 2020/1816, Annex II | material | 185 | |||
ESRS 2 GOV-4,para. 30 | Indicator no 10 Table #3Annex 1 | material | 188 | |||
ESRS 2 SBM-1,para. 40 (d) i | Indicator no 4 Table #1Annex 1 | Article 449aRegulation (EU) No575/2013; Regulation(EU) 2022/2453******Table 1 and Table 2 | Regulation (EU)2020/1816,Annex II | material | 189 | |
ESRS 2 SBM-1,para. 40 (d) ii | Indicator no 9 Table #2Annex 1 | Regulation (EU) 2020/1816,Annex II | material | 189 | ||
ESRS 2 SBM-1, para. 40 (d) iii | Indicator no 14 Table #1Annex 1 | Regulation (EU) 2020/1818*******, Article 12(1) Regulation (EU) 2020/1816, Annex II | material | 189 | ||
ESRS 2 SBM-1, para. 40 (d) iv | Regulation (EU) 2020/1818,Article 12(1) Regulation (EU) 2020/1816, Annex II | material | 189 | |||
ESRS E1-1, para. 14 | Regulation(EU) 2021/1119,Article 2(1) | material | 208 | |||
ESRS E1-1, para. 16 (g) | Article 449a Regulation (EU) No 575/2013; Regulation (EU) 2022/2453 Template 1 | Regulation (EU)2020/1818, Article 12(1) dto g, and Article 12(2) | material | 208 | ||
ESRS E1-4, para. 34 | Indicator no 4 Table #2 Annex 1 | Article 449aRegulation (EU) No575/2013; Regulation(EU) 2022/2453Template 3 | Regulation (EU) 2020/1818,Article 6 | material | 217 | |
ESRS E1-5, para. 38 | Indicator no 5 Table #1 and Indicator no 5 Table #2 Annex 1 | material | 220 | |||
ESRS E1-5, para. 37 | Indicator no 5 Table #1Annex 1 | material | 220 | |||
ESRS E1-5, para. 40 to 43 | Indicator no 6 Table #1Annex 1 | material | 220 | |||
ESRS E1-6, para. 44 | Indicators no 1 and 2Table #1 Annex 1 | Article 449a;Regulation (EU) No575/2013; Regulation(EU) 2022/2453Template 1 | Regulation (EU)2020/1818,Article 5(1), 6and 8 (1) | material | 222 | |
ESRS E1-6, para. 53 to 55 | Indicator no 3 Table #1Annex 1 | Article 449aRegulation (EU) No575/2013; Regulation(EU) 2022/2453Template 3 | Regulation (EU)2020/1818,Article 8(1) | material | 222 | |
ESRS E1-7, para. 56 | Regulation(EU) 2021/1119,Article 2(1) | not material | n/a | |||
ESRS E1-9,para. 66 | Regulation (EU) 2020/1818, Annex II Regulation (EU) 2020/1816, Annex II | material (phased-in) | n/a | |||
ESRS E1-9, para. 66 (a);ESRS E1-9, para. 66 (c) | Article 449a Regulation (EU) No 575/2013; Commission Implementing Regulation (EU) 2022/2453 paragraphs 46 and 47; Template 5: Banking book - Climate change physical risk: Exposures subject to physical risk. | material (phased-in) | n/a | |||
ESRS E1-9, para. 67 (c) | Article 449aRegulation (EU) No575/2013; Regulation(EU) 2022/2453paragraph 34;Template 2 | material (phased-in) | n/a | |||
ESRS E1-9, para. 69 | Regulation (EU) 2020/1818,Annex II | material (phased-in) | n/a | |||
ESRS E2-4, para. 28 | Indicator no 8 Table #1Annex 1 Indicator no 2Table #2 Annex 1Indicator no 1Table #2 Annex 1Indicator no 3Table #2 Annex 1 | not material | n/a | |||
ESRS E3-1, para. 9 | Indicator no 7 Table #2Annex 1 | material | 225 | |||
ESRS E3-1, para. 13 | Indicator no 8 Table 2Annex 1 | not applicable | n/a | |||
ESRS E3-1, para. 14 | Indicator no 12 Table #2Annex 1 | not applicable | n/a | |||
ESRS E3-4, para. 28 (c) | Indicator no 6.2 Table#2 Annex 1 | material | 227 | |||
ESRS E3-4, para. 29 | Indicator no 6.1 Table #2Annex 1 | material | 227 | |||
ESRS 2-IRO 1 - E4, para. 16 (a) i | Indicator no 7 Table #1Annex 1 | material (phased-in) | n/a | |||
ESRS 2-IRO 1 - E4, para. 16 (b) | Indicator no 10 Table #2Annex 1 | material (phased-in) | n/a | |||
ESRS 2-IRO 1 - E4, para. 16 (c) | Indicator no 14 Table #2Annex 1 | material (phased-in) | n/a | |||
ESRS E4-2, para. 24 (b) | Indicator no 11 Table #2Annex 1 | material (phased-in) | n/a | |||
ESRS E4-2, para. 24 (c) | Indicator no 12 Table #2Annex 1 | material (phased-in) | n/a | |||
ESRS E4-2, para. 24 (d) | Indicator no 15 Table #2Annex 1 | material (phased-in) | n/a | |||
ESRS E5-5, para. 37 (d) | Indicator no 13 Table #2Annex 1 | material | 230 | |||
ESRS E5-5, para. 39 | Indicator no 9 Table #1Annex 1 | material | 230 | |||
ESRS 2-SBM 3 - S1, para. 14 (f) | Indicator no 13 Table #3Annex I | material | 242 | |||
ESRS 2-SBM 3 - S1, para. 14 (g) | Indicator no 12 Table #3Annex I | material | 242 | |||
ESRS S1-1, para. 20 | Indicator no 9 Table #3and Indicator no 11 Table#1 Annex I | material | 243 | |||
ESRS S1-1, para. 21 | Regulation (EU) 2020/1816,Annex II | material | 244 | |||
ESRS S1-1, para. 22 | Indicator no 11 Table #3Annex I | material | 244 | |||
ESRS S1-1, para. 23 | Indicator no 1 Table #3Annex I | material | 244 | |||
ESRS S1-3, para. 32 (c) | Indicator no 5 Table #3Annex I | material | 245 | |||
ESRS S1-14, para. 88 (b) and (c) | Indicator no 2 Table #3Annex I | Regulation (EU) 2020/1816,Annex II | not material | n/a | ||
ESRS S1-14, para. 88 (e) | Indicator no 3 Table #3Annex I | not material | n/a | |||
ESRS S1-16, para. 97 (a) | Indicator no 12 Table #1of annex I | Regulation (EU) 2020/1816,Annex II | material | 253 | ||
ESRS S1-16, para. 97 (b) | Indicator no 8 Table #3Annex I | material | 253 | |||
ESRS S1-17, para. 103 (a) | Indicator no 7 Table #3Annex I | material | 254 | |||
ESRS S1-17, para. 104 (a) | Indicator no 10 Table #1and Indicator no 14Table #3 Annex I | Regulation (EU)2020/1816, Annex IIRegulation (EU) 2020/1818 Art 12 (1) | material | 254 | ||
ESRS 2-SBM 3 - S2, para. 11 (b) | Indicators no 12 and 13Table #3 Annex I | material (phased-in) | n/a | |||
ESRS S2-1, para. 17 | Indicator no 9 Table #3Annex 1 and Indicator no 11 Table #1 Annex 1 | material (phased-in) | n/a | |||
ESRS S2-1, para. 18 | Indicators no 11 and no 4 Table #3 Annex 1 | material (phased-in) | n/a | |||
ESRS S2-1, para. 19 | Indicator no 10 Table #1Annex 1 | Regulation (EU) 2020/1816, Annex II, Regulation (EU)2020/1818, Art 12 (1) | material (phased-in) | n/a | ||
ESRS S2-1, para. 19 | Regulation (EU) 2020/1816,Annex II | material (phased-in) | n/a | |||
ESRS S2-4, para. 36 | Indicator no 14 Table #3Annex 1 | material (phased-in) | n/a | |||
ESRS S3-1, para. 16 | Indicator no 9 Table #3Annex 1 and Indicator no11 Table #1 Annex 1 | material (phased-in) | n/a | |||
ESRS S3-1, para. 17 | Indicator no 10 Table #1Annex 1 | Regulation (EU) 2020/1816,Annex IIRegulation (EU) 2020/1818, Art 12 (1) | material (phased-in) | n/a | ||
ESRS S3-4, para. 36 | Indicator no 14 Table #3Annex 1 | material (phased-in) | n/a | |||
ESRS S4-1, para. 16 | Indicator no 9 Table #3and Indicator no 11 Table#1 Annex 1 | material (phased-in) | n/a | |||
ESRS S4-1, para. 17 | Indicator no 10 Table #1Annex 1 | Regulation (EU) 2020/1816,Annex IIRegulation (EU) 2020/1818, Art 12 (1) | material (phased-in) | n/a | ||
ESRS S4-4, para. 35 | Indicator no 14 Table #3Annex 1 | material (phased-in) | n/a | |||
ESRS G1-1, para. 10 (b) | Indicator no 15 Table #3Annex 1 | not applicable | n/a | |||
ESRS G1-1, para. 10 (d) | Indicator no 6 Table #3Annex 1 | not applicable | n/a | |||
ESRS G1-4, para. 24 (a) | Indicator no 17 Table #3Annex 1 | Regulation (EU)2020/1816,Annex II | not material | n/a | ||
ESRS G1-4, para. 24 (b) | Indicator no 16 Table #3Annex 1 | not material | n/a |
* SFDR = Regulation (EU) 2019/2088 of the European Parliament and of the Council of 27 November 2019 on sustainability-related disclosures in the financial services sector (Sustainable Finance Disclosures Regulation) (OJ L 317, 9.12.2019, p. 1) |
** Pillar 3 = Regulation (EU) No 575/2013 of the European Parliament and of the Council of 26 June 2013 on prudential requirements for credit institutions and investment firms and amending Regulation (EU) No 648/2012 (Capital Requirements Regulation ‘CRR’) (OJ L 176, 27.6.2013, p. 1) |
*** Benchmark Regulation = Regulation (EU) 2016/1011 of the European Parliament and of the Council of 8 June 2016 on indices used as benchmarks in financial instruments and financial contracts or to measure the performance of investment funds and amending Directives 2008/48/EC and 2014/17/EU and Regulation (EU) No 596/2014 (OJ L 171, 29.6.2016, p. 1) |
**** EU Climate Law = Regulation (EU) 2021/1119 of the European Parliament and of the Council of 30 June 2021 establishing the framework for achieving climate neutrality and amending Regulations (EC) No 401/2009 and (EU) 2018/1999 (”European Climate Law”) (OJ L 243, 9.7.2021, p. 1) |
***** Commission Delegated Regulation (EU) 2020/1816 of 17 July 2020 supplementing Regulation (EU) 2016/1011 of the European Parliament and of the Council as regards the explanation in the benchmark statement of how environmental, social and governance factors are reflected in each benchmark provided and published (OJ L 406, 3.12.2020, p. 1) |
****** Commission Implementing Regulation (EU) 2022/2453 of 30 November 2022 amending the implementing technical standards laid down in Implementing Regulation (EU) 2021/637 as regards the disclosure of environmental, social and governance risks (OJ L 324,19.12.2022, p.1.) |
******* Commission Delegated Regulation (EU) 2020/1818 of 17 July 2020 supplementing Regulation (EU) 2016/1011 of the European Parliament and of the Council as regards minimum standards for EU Climate Transition Benchmarks and EU Paris-aligned Benchmarks (OJ L 406, 3.12.2020, p. 17) |
EPRA appendix
NEPI Rockcastle has not obtained third party assurance for the EPRA section in this report.
NEPI Rockcastle reports on 100% of the assets under its operational and financial control. The data reported covers the entire portfolio and the Group's workforce.
As of December 2025, NEPI Rockcastle’s real estate investment portfolio comprises 59 income producing properties and one held for sale asset, over which the Group maintains both operational and financial control, representing 100% of the assets within the organizational boundary used for sustainability reporting. The Group applies a boundary methodology based on Operational and Financial Control, meaning all entities and assets where it has the legal capacity to manage utilities, supply chain decisions and facilities operations are fully included. Tenant controlled areas - where monitoring and payment of consumption fall under tenant responsibility - are excluded, although efforts continue to expand data coverage. All relevant Group entities and activities are included in the 2025 reporting scope with no exceptions.
Control is understood as the legal capacity to monitor and make decisions on supply chain management, utilities consumption and facilities management. The Group is making efforts to collect data from the tenants – fully controlled areas, for a broader perspective on its environmental impacts. Centre and Technical Managers monitor utility consumption (energy and water) and waste on the asset level, while the Group Lead Sustainability Data Analyst at the corporate level is verifying Group-wide figures monthly. The Group Sustainability Data Analytics Manager is performing a second layer of verification of the data accuracy and completeness. The Group uses Deepki to standardise its monthly reporting of energy, GHG emissions, water and waste data. The platform enables data analysis at portfolio level, embeds climate factors and allows shopping centre performance benchmarking. Social data related to human resources is collected and handled by HR Department, led by HR Director, and monitored using an information system, enabling standardised and structured management of data. Where payroll and employee administration is outsourced, data is provided by the service providers. Community engagement partnerships (with partners and NGOs) are collected and handled by the Marketing Department, led by Group Head of Marketing, and monitored in structured data files. An annual review is in place, engaging local teams, Regional Marketing and Sustainability Department.
NEPI Rockcastle has normalised its data by using gross floor area (adjusted for tenants-controlled areas for which data is not fully collected from tenants yet) as the denominator. This means that, for example, energy intensity is calculated per m2. NEPI Rockcastle has not carried out further normalization of the data. In 2025, the gross building areas (GBA) across the portfolio were remeasured and data was corrected using standardised area measurements, ensuring consistency and accuracy throughout all properties.
Data on environmental (water, waste and GHG) and energy performance has been broken down on property type (retail, office, industrial) as well as at country level.
Explanatory details on performance are included in the body of the report and, where relevant, notes explaining any significant variances are included at the bottom of each table.
The reporting period is 1 January 2025 to 31 December 2025. Comparative data on an absolute and like-for-like basis is included for each type of the utility.
H&S-Asset Asset health and safety assessments
H&S-Comp Asset health and safety compliance
The Group incorporates in this report data pertaining to every environmental aspect across all properties under its control, as delineated in the organisational boundaries.
In the tables below where the Group presents the 2025 and 2024 Sustainability performance measures, the Group is defining coverage based on number of properties and floor area.
The Group has made a concerted effort to collect information on utilities and waste consumption at its properties, including tenant fully controlled areas. Some tenant-controlled areas are not taken into account due to insufficient data. The Group plans to continue to increase the coverage of the information reported, thus demonstrating commitment to sustainability, environmental and energy performance, both on the portfolio and corporate level. In the meantime, for calculation of intensity factors, those areas fully controlled by tenants, where the Group was not yet able to have reliable data, were excluded both from consumption and from the gross floor area.
The consumption reported includes all utilities that the Company purchased as a landlord (i.e. those consumed in the common areas and those consumed in the tenant’s areas for which NEPI Rockcastle is responsible for sourcing and tracking). There are still some limited cases where the Group does not have access to tenant managed utilities and these represent the following % calculated based on total areas:
6% for electricity
4% for fuel
1% for district heating
Based on the available tenant data and Company’s estimations, total energy not covered and managed by the tenants is approximately 61,000 MWh. Water (both tap and groundwater) is covered 100% by landlord reporting.
BREEAM Certification KPI is calculated for the whole portfolio, excluding retail parks and industrial (considered not eligible for BREEAM certification). This indicator covers therefore 98% of the portfolio by area. In some assets, where the waste is being tracked in m3 based on local practices, a reconversion rate to metric tons (as required by reporting standards) was used, as follows:
0.35 for compressed waste
0.15 for non-compressed waste
Section | Reporting scope rules | Scope & coverage rate1 |
|---|---|---|
All Energy KPIs | All assets under NEPI Rockcastle’s operational control are included in scope. All exclusions and estimations are reported in the “Coverage and Estimations” | Scope: 60 properties covered throughout the year (compared to 61 in the previous year) |
Portfolio coverage rate: 100% | ||
All GHG related KPIs | All assets under NEPI Rockcastle’s operational control are included in scope. The Company accounts for all emissions coming from owned and tracked energy usage. All exclusions and estimations are reported in the “Coverage and Estimations” | Scope: 60 properties covered throughout the year (compared to 61 in the previous year) |
Portfolio coverage rate: 100% | ||
All water related KPIs | All assets under NEPI Rockcastle’s operational control are included in scope. | Scope: 60 properties covered throughout the year (compared to 61 in the previous year) |
Portfolio coverage rate: 100% | ||
All waste related KPIs | All assets under NEPI Rockcastle’s operational control are included in scope. Strip malls and industrial excluded as the waste disposal data is not available to the Company | Scope: 52 properties covered throughout the year (compared to 53 in the previous year) |
Portfolio coverage rate (by GLA): 98%2 | ||
BREEAM certification KPIs | All eligible2 assets under NEPI Rockcastle’s operational control are included in the scope | Scope: 52 properties throughout the year |
Portfolio coverage rate (by GLA): 98%2 | ||
All photovoltaic KPIs | All assets under NEPI Rockcastle’s operational control are included in the scope | Scope: 60 properties covered throughout the year (compared to 61 in the previous year) |
Portfolio coverage rate: 100% | ||
All accessibility KPIs | All assets under NEPI Rockcastle’s operational control are included in the scope | Scope: 60 properties covered throughout the year (compared to 61 in the previous year) |
Portfolio coverage rate: 100% |
- 60 properties in 2025 include 59 investment property and one held for sale asset
- Excluding industrial and strip malls
Changes from 2024 Annual Report | ||||
|---|---|---|---|---|
2024 | 2024 | Absolute change | % | |
Electricity (MWh) | 564,210 | 524,618 | 39,592 | 8% |
Renewable Electricity (MWh) | 443,096 | 442,369 | 727 | 0% |
Fuel (MWh) | 86,974 | 81,215 | 5,759 | 7% |
District Heating (MWh) | 49,242 | 44,330 | 4,912 | 11% |
Water (m3) | 2,204,052 | 2,044,050 | 160,002 | 8% |
Waste (MT) | 30,895 | 28,147 | 2,748 | 10% |
CO2e (MTCO2e) | 60,656 | 77,224 | (16,568) | -21% |
The changes in electricity consumption, renewable electricity, fuel, district heating, cooling, water and waste derive from data being reconciled with invoices and information that was not available at the time of 2024 reporting. The main driver of these adjustments was the inclusion of data for Magnolia Park and Silesia City Center, both acquired at the end of 2024 and now fully integrated into the metrics.
The changes in CO2e are caused by the differences in energy consumption and update of emission factors used.
NEPI Rockcastle uses EPCs to meet the legal requirements applicable in the countries where it operates. An A–F EPC classification system is currently not available in Poland, where the Polish Ministry of Economic Development and Technology is in the process of developing a letter-based classification similar to those used in other countries. In 2024, due to the absence of a formal national EPC framework, the Group established an internal benchmark to differentiate EPC performance levels across its Polish properties. In 2025, the Group adopted a more conservative approach by grouping all Polish assets under a single “EPC Poland” category to eliminate any risk of misclassification.
Location EPRA Sustainability Performance The EPRA Index below gives detailed information on the location of each reported item within this report: |
EPRA Performance Measure | Definition | Page Reference |
|---|---|---|
EPRA – Sustainability Performance Measures – Environmental | ||
Elec-Abs: | Total amount of electricity consumed. It includes electricity from renewable and non-renewable sources, whether imported or generated on site. This accounts for CTP’s corporate offices | 272 |
Elec-LFL: | The consistency of the electricity consumption in the operation. A like-for-like comparison of 2025 and 2024 | 272 |
DH&C-Abs: | Total amount of indirect energy consumed from district heating or cooling systems. In this instance, ‘indirect’ means energy generated off-site and typically bought from an external energy supplier | 277 |
DH&C-LFL: | The consistency of the district heating and cooling consumption in the operation. A like-for-like comparison of 2025 and 2024 | 277 |
Fuels-Abs: | Total amount of fuel used from direct (renewable and non-renewable) sources (‘direct’ meaning that the fuel is combusted on-site) | 279 |
Fuels-LFL: | The consistency of the fuel consumption in the operation. A like-for-like comparison of 2025 and 2024 | 279 |
Energy-Int: | Consumption of direct and indirect energy normalised by an appropriate denominator | 282 |
GHG-Dir-Abs: | Total amount of direct greenhouse gas emissions generated (‘direct’ meaning that GHG emissions are generated on site through combustion of the energy source/ fuel). This calculation includes use of natural gas in offices, car fuel, as well as jet fuel | 282 |
GHG-Indir-Abs: | Total amount of indirect greenhouse gas emissions generated (‘indirect’ meaning that GHG emissions are generated off-site during combustion of the energy source) | 283 |
GHG-Int: | Emissions of direct and indirect GHGs normalised by an appropriate denominator | 289 |
Water-Abs: | Total amount of water consumed within the corporate offices over the full reporting year | 291 |
Water-LFL: | The consistency of the water consumption in the operation. A like-for-like comparison of 2025 and 2024 | 291 |
Water-Int: | Consumption of water normalised by an appropriate denominator | 292 |
Waste-Abs: | The total amount of waste produced and disposed of | 293 |
Waste-LFL: | The consistency of the waste production in the operation. A like-for-like comparison of 2025 and 2024 | 293 |
Cert-Tot: | Total number of assets that have formally obtained sustainability certification, rating, or labelling at the end of the reporting year | 296 |
EPRA – Sustainability Performance Measures – Social | ||
Diversity-Emp: | The percentage of male and female employees in the organisation’s governance bodies and other significant employee categories | 301 |
Diversity-Pay: | Ratio of the basic salary and/or remuneration of women to men | 301 |
Emp-Training: | The average number of hours employees have undertaken | 301 |
Emp-Dev: | Percentage of total employees who have received regular performance and career development reviews | 301 |
Emp-Turnover: | The total number and rate of new employee hires and employee turnover | 301 |
H&S-Emp: | The occupational health and safety performance with relation to our direct employees | 302 |
Comty-Eng: | Percentage of assets under operational control that have implemented local community engagement, impact assessments and/or development programs | 302 |
EPRA Sustainability Performance Measures – Governance | ||
Gov-Board: | The composition of the highest governance body | 303 |
Gov-Select: | The nomination and selection process for the highest governance body and its members, and the criteria used to guide the nomination and selection process | 303 |
Gov-CoI: | The processes for the highest governance body to ensure conflicts of interest are avoided and managed | 304 |
EPRA Sustainability Performance Measures (Environmental)
ENERGY | Total | Like-for-like | |||||||
|---|---|---|---|---|---|---|---|---|---|
EPRA Code | Units of Measurement | Category | Country | 2025 | 2024 | 2025 vs 2024 | 2025 | 2024 | 2025 vs 2024 |
Elec-Abs, | MWh | Electricity for landlord shared services (common areas) | Retail | 134,254 | 152,048 | -12% | 122,431 | 131,759 | -7% |
Romania | 26,511 | 31,147 | -15% | 25,519 | 30,023 | -15% | |||
Poland | 48,146 | 52,429 | -8% | 37,315 | 38,095 | -2% | |||
Slovakia | 10,393 | 10,349 | 0% | 10,393 | 10,349 | 0% | |||
Bulgaria | 15,997 | 16,351 | -2% | 15,997 | 16,351 | -2% | |||
Hungary | 13,116 | 14,545 | -10% | 13,116 | 14,545 | -10% | |||
Serbia | - | 4,831 | - | - | - | - | |||
Lithuania | 4,385 | 4,934 | -11% | 4,385 | 4,934 | -11% | |||
Croatia | 7,274 | 7,771 | -6% | 7,274 | 7,771 | -6% | |||
Czech Republic | 8,432 | 9,690 | -13% | 8,432 | 9,690 | -13% | |||
Office | 1,127 | 999 | 13% | 1,127 | 999 | 13% | |||
Slovakia | 681 | 564 | 21% | 681 | 564 | 21% | |||
Bulgaria | 447 | 435 | 3% | 447 | 435 | 3% | |||
Industrial | - | - | - | - | - | - | |||
Romania | - | - | - | - | - | - | |||
Total | 135,382 | 153,047 | -12% | 123,558 | 132,758 | -7% | |||
Elec-Abs, | MWh | (sub)metered exclusively to tenants (tenant area - tenant managed) | Retail | 330,361 | 329,655 | 0% | 295,792 | 292,313 | 1% |
Romania | 188,238 | 179,718 | 5% | 174,521 | 169,252 | 3% | |||
Poland | 53,781 | 53,410 | 1% | 32,929 | 34,407 | -4% | |||
Slovakia | 12,821 | 12,995 | -1% | 12,821 | 12,995 | -1% | |||
Bulgaria | 28,682 | 29,338 | -2% | 28,682 | 29,338 | -2% | |||
Hungary | 17,854 | 18,132 | -2% | 17,854 | 18,132 | -2% | |||
Serbia | - | 7,872 | - | - | - | - | |||
Lithuania | 7,951 | 7,930 | 0% | 7,951 | 7,930 | 0% | |||
Croatia | 12,581 | 13,014 | -3% | 12,581 | 13,014 | -3% | |||
Czech Republic | 8,454 | 7,244 | 17% | 8,454 | 7,244 | 17% | |||
Office | 1,760 | 1,771 | -1% | 1,760 | 1,771 | -1% | |||
Slovakia | 509 | 696 | -27% | 509 | 696 | -27% | |||
Bulgaria | 1,250 | 1,075 | 16% | 1,250 | 1,075 | 16% | |||
Industrial | 2,576 | 2,572 | 0% | 2,576 | 2,572 | 0% | |||
Romania | 2,576 | 2,572 | 0% | 2,576 | 2,572 | 0% | |||
Total | 334,697 | 333,997 | 0% | 300,128 | 296,656 | 1% | |||
Elec-Abs, | MWh | Total landlord-obtained electricity | Retail | 464,615 | 481,702 | -4% | 418,222 | 424,072 | -1% |
Romania | 214,749 | 210,865 | 2% | 200,039 | 199,275 | 0% | |||
Poland | 101,927 | 105,839 | -4% | 70,243 | 72,502 | -3% | |||
Slovakia | 23,213 | 23,344 | -1% | 23,213 | 23,344 | -1% | |||
Bulgaria | 44,679 | 45,689 | -2% | 44,679 | 45,689 | -2% | |||
Hungary | 30,970 | 32,677 | -5% | 30,970 | 32,677 | -5% | |||
Serbia | - | 12,704 | - | - | - | - | |||
Lithuania | 12,336 | 12,865 | -4% | 12,336 | 12,865 | -4% | |||
Croatia | 19,856 | 20,785 | -4% | 19,856 | 20,785 | -4% | |||
Czech Republic | 16,886 | 16,935 | 0% | 16,886 | 16,935 | 0% | |||
Office | 2,887 | 2,770 | 4% | 2,887 | 2,770 | 4% | |||
Slovakia | 1,190 | 1,260 | -6% | 1,190 | 1,260 | -6% | |||
Bulgaria | 1,697 | 1,510 | 12% | 1,697 | 1,510 | 12% | |||
Industrial | 2,576 | 2,572 | 0% | 2,576 | 2,572 | 0% | |||
Romania | 2,576 | 2,572 | 0% | 2,576 | 2,572 | 0% | |||
Total | 470,078 | 487,044 | -3% | 423,685 | 429,414 | -1% | |||
Elec-Abs, | MWh | Total tenant-obtained electricity (tenant managed) | Retail | 76,682 | 77,165 | -1% | 61,657 | 61,629 | 0% |
Romania | 2,150 | 2,337 | -8% | 2,150 | 2,337 | -8% | |||
Poland | 72,548 | 72,677 | 0% | 57,523 | 57,141 | 1% | |||
Slovakia | - | - | - | - | - | - | |||
Bulgaria | - | - | - | - | - | - | |||
Hungary | - | - | - | - | - | - | |||
Serbia | - | - | - | - | - | - | |||
Lithuania | 1,984 | 2,151 | -8% | 1,984 | 2,151 | -8% | |||
Croatia | - | - | - | - | - | - | |||
Czech Republic | - | - | - | - | - | - | |||
Office | - | - | - | - | - | - | |||
Slovakia | - | - | - | - | - | - | |||
Bulgaria | - | - | - | - | - | - | |||
Industrial | - | - | - | - | - | - | |||
Romania | - | - | - | - | - | - | |||
Total | 76,682 | 77,165 | -1% | 61,657 | 61,629 | 0% | |||
Elec-Abs, | MWh | Total electricity | Retail | 541,298 | 558,868 | -3% | 479,880 | 485,701 | -1% |
Romania | 216,899 | 213,202 | 2% | 202,189 | 201,612 | 0% | |||
Poland | 174,475 | 178,516 | -2% | 127,767 | 129,643 | -1% | |||
Slovakia | 23,213 | 23,344 | -1% | 23,213 | 23,344 | -1% | |||
Bulgaria | 44,679 | 45,689 | -2% | 44,679 | 45,689 | -2% | |||
Hungary | 30,970 | 32,677 | -5% | 30,970 | 32,677 | -5% | |||
Serbia | - | 12,704 | - | - | - | - | |||
Lithuania | 14,321 | 15,016 | -5% | 14,321 | 15,016 | -5% | |||
Croatia | 19,856 | 20,785 | -4% | 19,856 | 20,785 | -4% | |||
Czech Republic | 16,886 | 16,935 | 0% | 16,886 | 16,935 | 0% | |||
Office | 2,887 | 2,770 | 4% | 2,887 | 2,770 | 4% | |||
Slovakia | 1,190 | 1,260 | -6% | 1,190 | 1,260 | -6% | |||
Bulgaria | 1,697 | 1,510 | 12% | 1,697 | 1,510 | 12% | |||
Industrial | 2,576 | 2,572 | 0% | 2,576 | 2,572 | 0% | |||
Romania | 2,576 | 2,572 | 0% | 2,576 | 2,572 | 0% | |||
Total | 546,761 | 564,210 | -3% | 485,343 | 491,043 | -1% | |||
No. of applicable properties | 60 | 61 | 56 | 56 | |||||
m2 of applicable properties | 4,472,610 | 4,556,418 | 3,971,723 | 3,971,723 | |||||
% Electricity Estimated | 0% | 0% | 0% | 0% | |||||
Total electricity consumption slightly decreased due to natural changes in operations and weather conditions. No notable trends were noted.
Where NEPI Rockcastle has operational control (i.e. common areas), electricity consumption decreased in absolute and like-for-like terms, demonstrating energy efficiency improvements. Whilst the Group does encourage tenants to undertake energy efficiency programs and to adopt energy saving behaviours, ultimately the Company does not have operational control over tenant units.
ENERGY | Total | Like-for-like | |||||||
|---|---|---|---|---|---|---|---|---|---|
EPRA Code | Units of Measurement | Category | Country | 2025 | 2024 | 2025 vs 2024 | 2025 | 2024 | 2025 vs 2024 |
Elec-Abs, | % | Proportion of purchased electricity from renewable sources | Retail | 84% | 78% | 8% | 86% | 83% | 3% |
Romania | 99% | 99% | 0% | 99% | 99% | 0% | |||
Poland | 53% | 42% | 26% | 48% | 51% | -6% | |||
Slovakia | 100% | 100% | 0% | 100% | 100% | 0% | |||
Bulgaria | 100% | 95% | 5% | 100% | 95% | 5% | |||
Hungary | 100% | 72% | 39% | 100% | 72% | 39% | |||
Serbia | - | 100% | - | - | - | - | |||
Lithuania | 100% | 100% | 0% | 100% | 100% | 0% | |||
Croatia | 100% | 81% | 23% | 100% | 81% | 23% | |||
Czech Republic | 100% | 100% | 0% | 100% | 100% | 0% | |||
Office | 100% | 100% | 0% | 100% | 100% | 0% | |||
Slovakia | 100% | 100% | 0% | 100% | 100% | 0% | |||
Bulgaria | 100% | 100% | 0% | 100% | 100% | 0% | |||
Industrial | 100% | 100% | 0% | 100% | 100% | 0% | |||
Romania | 100% | 100% | 0% | 100% | 100% | 0% | |||
Total | 85% | 79% | 8% | 86% | 84% | 3% | |||
Elec-Abs, | MWh | Quantity of purchased electricity from renewable sources | Retail | 456,565 | 437,755 | 4% | 411,837 | 405,319 | 2% |
Romania | 214,775 | 210,886 | 2% | 200,065 | 199,296 | 0% | |||
Poland | 91,867 | 74,874 | 23% | 61,848 | 66,732 | -7% | |||
Slovakia | 23,213 | 23,344 | -1% | 23,213 | 23,344 | -1% | |||
Bulgaria | 44,679 | 43,594 | 2% | 44,679 | 43,594 | 2% | |||
Hungary | 30,970 | 23,476 | 32% | 30,970 | 23,476 | 32% | |||
Serbia | - | 12,704 | - | - | - | - | |||
Lithuania | 14,321 | 15,016 | -5% | 14,321 | 15,016 | -5% | |||
Croatia | 19,856 | 16,925 | 17% | 19,856 | 16,925 | 17% | |||
Czech Republic | 16,886 | 16,935 | 0% | 16,886 | 16,935 | 0% | |||
Office | 2,887 | 2,770 | 4% | 2,887 | 2,770 | 4% | |||
Slovakia | 1,190 | 1,260 | -6% | 1,190 | 1,260 | -6% | |||
Bulgaria | 1,697 | 1,510 | 12% | 1,697 | 1,510 | 12% | |||
Industrial | 2,576 | 2,572 | 0% | 2,576 | 2,572 | 0% | |||
Romania | 2,576 | 2,572 | 0% | 2,576 | 2,572 | 0% | |||
Total | 462,028 | 443,096 | 4% | 417,299 | 410,661 | 2% | |||
Elec-Abs, | % | Proportion of obtained electricity from fossil fuels | Retail | 15% | 21% | -25% | 14% | 16% | -8% |
Romania | 1% | 1% | -10% | 1% | 1% | -9% | |||
Poland | 47% | 58% | -18% | 53% | 50% | 7% | |||
Slovakia | 0% | 0% | 0% | 0% | 0% | 0% | |||
Bulgaria | 0% | 5% | - | 0% | 5% | - | |||
Hungary | 0% | 15% | - | 0% | 15% | - | |||
Serbia | - | 0% | - | - | 0% | - | |||
Lithuania | 0% | 0% | 0% | 0% | 0% | 0% | |||
Croatia | 0% | 16% | - | 0% | 16% | - | |||
Czech Republic | 0% | 0% | 0% | 0% | 0% | 0% | |||
Office | 0% | 0% | 0% | 0% | 0% | 0% | |||
Slovakia | 0% | 0% | 0% | 0% | 0% | 0% | |||
Bulgaria | 0% | 0% | 0% | 0% | 0% | 0% | |||
Industrial | 0% | 0% | 0% | 0% | 0% | 0% | |||
Romania | 0% | 0% | 0% | 0% | 0% | 0% | |||
Total | 15% | 20% | -25% | 14% | 15% | -8% | |||
Elec-Abs, | MWh | Quantity of obtained electricity from fossil fuels | Retail | 83,892 | 115,271 | -27% | 69,423 | 76,087 | -9% |
Romania | 1,284 | 1,400 | -8% | 1,284 | 1,400 | -8% | |||
Poland | 82,608 | 103,641 | -20% | 68,139 | 64,457 | 6% | |||
Slovakia | - | - | - | - | - | - | |||
Bulgaria | - | 2,096 | - | - | 2,096 | - | |||
Hungary | - | 4,777 | - | - | 4,777 | - | |||
Serbia | - | - | - | - | - | - | |||
Lithuania | - | - | - | - | - | - | |||
Croatia | - | 3,357 | - | - | 3,357 | - | |||
Czech Republic | - | - | - | - | - | - | |||
Office | - | - | - | - | - | - | |||
Slovakia | - | - | - | - | - | - | |||
Bulgaria | - | - | - | - | - | - | |||
Industrial | - | - | - | - | - | - | |||
Romania | - | - | - | - | - | - | |||
Total | 83,892 | 115,271 | -27% | 69,423 | 76,087 | -9% | |||
Elec-Abs, | % | Proportion of nuclear electricity | Retail | 0% | 1% | -85% | 0% | 1% | -85% |
Romania | 0% | 0% | -10% | 0% | 0% | -9% | |||
Poland | 0% | 0% | 0% | 0% | 0% | 0% | |||
Slovakia | 0% | 0% | 0% | 0% | 0% | 0% | |||
Bulgaria | 0% | 0% | 0% | 0% | 0% | 0% | |||
Hungary | 0% | 14% | - | 0% | 14% | - | |||
Serbia | - | 0% | 0% | - | 0% | 0% | |||
Lithuania | 0% | 0% | 0% | 0% | 0% | 0% | |||
Croatia | 0% | 2% | - | 0% | 2% | - | |||
Czech Republic | 0% | 0% | 0% | 0% | 0% | 0% | |||
Office | 0% | 0% | 0% | 0% | 0% | 0% | |||
Slovakia | 0% | 0% | 0% | 0% | 0% | 0% | |||
Bulgaria | 0% | 0% | 0% | 0% | 0% | 0% | |||
Industrial | 0% | 0% | 0% | 0% | 0% | 0% | |||
Romania | 0% | 0% | 0% | 0% | 0% | 0% | |||
Total | 0% | 1% | -85% | 0% | 1% | -85% | |||
Elec-Abs, | MWh | Nuclear (grid energy) | Retail | 840 | 5,842 | -86% | 840 | 5,842 | -86% |
Romania | 840 | 915 | -8% | 840 | 915 | -8% | |||
Poland | - | - | - | - | - | - | |||
Slovakia | - | - | - | - | - | - | |||
Bulgaria | - | - | - | - | - | - | |||
Hungary | - | 4,424 | - | - | 4,424 | - | |||
Serbia | - | - | - | - | - | - | |||
Lithuania | - | - | - | - | - | - | |||
Croatia | - | 502 | - | - | 502 | - | |||
Czech Republic | - | - | - | - | - | - | |||
Office | - | - | - | - | - | - | |||
Slovakia | - | - | - | - | - | - | |||
Bulgaria | - | - | - | - | - | - | |||
Industrial | - | - | - | - | - | - | |||
Romania | - | - | - | - | - | - | |||
Total | 840 | 5,842 | -86% | 840 | 5,842 | -86% | |||
Elec-Abs, | % | Solar Photovoltaic (% of electricity consumption from self-generated Solar PV as a percentage of total electricity consumption) | Retail | 6% | 5% | 9% | 6% | 6% | 0% |
Romania | 14% | 14% | 3% | 14% | 14% | -2% | |||
Poland | 0% | 0% | 0% | 0% | 0% | 0% | |||
Slovakia | 0% | 0% | 0% | 0% | 0% | 0% | |||
Bulgaria | 0% | 0% | 0% | 0% | 0% | 0% | |||
Hungary | 0% | 0% | 0% | 0% | 0% | 0% | |||
Serbia | - | 0% | - | - | 0% | - | |||
Lithuania | 3% | 3% | -7% | 3% | 3% | -7% | |||
Croatia | 0% | 0% | 0% | 0% | 0% | 0% | |||
Czech Republic | 0% | 0% | 0% | 0% | 0% | 0% | |||
Office | 0% | 0% | 0% | 0% | 0% | 0% | |||
Slovakia | 0% | 0% | 0% | 0% | 0% | 0% | |||
Bulgaria | 0% | 0% | 0% | 0% | 0% | 0% | |||
Industrial | 0% | 0% | 0% | 0% | 0% | 0% | |||
Romania | 0% | 0% | 0% | 0% | 0% | 0% | |||
Total | 6% | 5% | 9% | 6% | 6% | 0% | |||
Elec-Abs, | MWh | Solar Photovoltaic (self-generated) | Retail | 31,786 | 30,181 | 5% | 27,913 | 28,307 | -1% |
Romania | 31,115 | 29,725 | 5% | 27,548 | 27,894 | -1% | |||
Poland | 306 | 43 | 619% | - | - | - | |||
Slovakia | - | - | - | - | - | - | |||
Bulgaria | - | - | - | - | - | - | |||
Hungary | - | - | - | - | - | - | |||
Serbia | - | - | - | - | - | - | |||
Lithuania | 365 | 413 | -12% | 365 | 413 | -12% | |||
Croatia | - | - | - | - | - | - | |||
Czech Republic | - | - | - | - | - | - | |||
Office | - | - | - | - | - | - | |||
Slovakia | - | - | - | - | - | - | |||
Bulgaria | - | - | - | - | - | - | |||
Industrial | - | - | - | - | - | - | |||
Romania | - | - | - | - | - | - | |||
Total | 31,786 | 30,181 | 5% | 27,913 | 28,307 | -1% | |||
As part of NEPI Rockcastle’s objectives to decarbonise its portfolio, the procurement and production of renewable electricity is a priority. The increase in renewable electricity was driven by the purchase of clean electricity and improved infrastructure for solar power integration.
The self-generated green electricity is similar to the previous year, covering 6% of the Group's electricity needs. With plans to further roll out photovoltaics across the portfolio, the Group anticipates further increase of renewable electricity share in 2026 and 2027.
Notably, NEPI Rockcastle decreased its energy consumption sourced from fossil fuels by 27%.
ENERGY | Total | Like-for-like | |||||||
|---|---|---|---|---|---|---|---|---|---|
EPRA Code | Units of Measurement | Category | Country | 2025 | 2024 | 2025 vs 2024 | 2025 | 2024 | 2025 vs 2024 |
DH&C-Abs, DH&C-LfL | MWh | District heating | Retail | 32,986 | 31,336 | 5% | 31,219 | 29,997 | 4% |
Romania | - | - | - | - | - | - | |||
Poland | 15,558 | 14,280 | 9% | 13,791 | 12,941 | 7% | |||
Slovakia | 8,201 | 7,646 | 7% | 8,201 | 7,646 | 7% | |||
Bulgaria | 984 | 1,055 | -7% | 984 | 1,055 | -7% | |||
Hungary | - | - | - | - | - | - | |||
Serbia | - | - | - | - | - | - | |||
Lithuania | 3,370 | 3,407 | -1% | 3,370 | 3,407 | -1% | |||
Croatia | - | - | - | - | - | - | |||
Czech Republic | 4,872 | 4,947 | -2% | 4,872 | 4,947 | -2% | |||
Office | 1,214 | 1,238 | -2% | 1,214 | 1,238 | -2% | |||
Slovakia | 873 | 880 | -1% | 873 | 880 | -1% | |||
Bulgaria | 341 | 357 | -5% | 341 | 357 | -5% | |||
Industrial | - | - | - | - | - | - | |||
Romania | - | - | - | - | - | - | |||
Total | 34,200 | 32,574 | 5% | 32,433 | 31,235 | 4% | |||
DH&C-Abs, DH&C-LfL | MWh | District heating | Retail | 18,838 | 15,944 | 18% | 15,034 | 12,162 | 24% |
Romania | - | - | - | - | - | - | |||
Poland | 13,800 | 11,879 | 16% | 9,996 | 8,096 | 23% | |||
Slovakia | 691 | 596 | 16% | 691 | 596 | 16% | |||
Bulgaria | 9 | 13 | -29% | 9 | 13 | -29% | |||
Hungary | - | - | - | - | - | - | |||
Serbia | - | - | - | - | - | - | |||
Lithuania | - | - | - | - | - | - | |||
Croatia | - | - | - | - | - | - | |||
Czech Republic | 4,337 | 3,457 | 25% | 4,337 | 3,457 | 25% | |||
Office | 796 | 724 | 10% | 796 | 724 | 10% | |||
Slovakia | - | - | - | - | - | - | |||
Bulgaria | 796 | 724 | 10% | 796 | 724 | 10% | |||
Industrial | - | - | - | - | - | - | |||
Romania | - | - | - | - | - | - | |||
Total | 19,634 | 16,668 | 18% | 15,830 | 12,886 | 23% | |||
DH&C-Abs, DH&C-LfL | MWh | Total landlord-obtained district heating and cooling | Retail | 51,824 | 47,280 | 10% | 46,253 | 42,159 | 10% |
Romania | - | - | - | - | - | - | |||
Poland | 29,359 | 26,159 | 12% | 23,788 | 21,037 | 13% | |||
Slovakia | 8,893 | 8,242 | 8% | 8,893 | 8,242 | 8% | |||
Bulgaria | 994 | 1,068 | -7% | 994 | 1,068 | -7% | |||
Hungary | - | - | - | - | - | - | |||
Serbia | - | - | - | - | - | - | |||
Lithuania | 3,370 | 3,407 | -1% | 3,370 | 3,407 | -1% | |||
Croatia | - | - | - | - | - | - | |||
Czech Republic | 9,209 | 8,404 | 10% | 9,209 | 8,404 | 10% | |||
Office | 2,010 | 1,962 | 2% | 2,010 | 1,962 | 2% | |||
Slovakia | 873 | 880 | -1% | 873 | 880 | -1% | |||
Bulgaria | 1,137 | 1,082 | 5% | 1,137 | 1,082 | 5% | |||
Industrial | - | - | - | - | - | - | |||
Romania | - | - | - | - | - | - | |||
Total | 53,834 | 49,242 | 9% | 48,263 | 44,121 | 9% | |||
DH&C-Abs, DH&C-LfL | MWh | Total District heating | Retail | 51,824 | 47,280 | 10% | 46,253 | 42,159 | 10% |
Romania | - | - | - | - | - | - | |||
Poland | 29,359 | 26,159 | 12% | 23,788 | 21,037 | 13% | |||
Slovakia | 8,893 | 8,242 | 8% | 8,893 | 8,242 | 8% | |||
Bulgaria | 994 | 1,068 | -7% | 994 | 1,068 | -7% | |||
Hungary | - | - | - | - | - | - | |||
Serbia | - | - | - | - | - | - | |||
Lithuania | 3,370 | 3,407 | -1% | 3,370 | 3,407 | -1% | |||
Croatia | - | - | - | - | - | - | |||
Czech Republic | 9,209 | 8,404 | 10% | 9,209 | 8,404 | 10% | |||
Office | 2,010 | 1,962 | 2% | 2,010 | 1,962 | 2% | |||
Slovakia | 873 | 880 | -1% | 873 | 880 | -1% | |||
Bulgaria | 1,137 | 1,082 | 5% | 1,137 | 1,082 | 5% | |||
Industrial | - | - | - | - | - | - | |||
Romania | - | - | - | - | - | - | |||
Total | 53,834 | 49,242 | 9% | 48,263 | 44,121 | 9% | |||
No. of applicable properties | 60 | 61 | 56 | 56 | |||||
m2 of applicable properties | 4,717,460 | 4,801,269 | 4,221,970 | 4,221,970 | |||||
% district heating estimated | - | - | - | - | |||||
NEPI Rockcastle utilises District Heating across several geographies as a greener alternative to fossil fuel consumption. However, there are still emissions associated with district heating, some of which being sourced from fossil fuel. As such, NEPI Rockcastle intends to decrease reliance on both fuel and district heating where possible.
ENERGY | Total | Like-for-like | |||||||
|---|---|---|---|---|---|---|---|---|---|
EPRA Code | Units of Measurement | Category | Country | 2025 | 2024 | 2025 vs 2024 | 2025 | 2024 | 2025 vs 2024 |
Fuel-Abs, | MWh | Fuel for landlord shared services | Retail | 39,776 | 40,737 | -2% | 37,737 | 38,212 | -1% |
Romania | 8,375 | 9,080 | -8% | 8,122 | 8,663 | -6% | |||
Poland | 14,000 | 14,099 | -1% | 12,214 | 12,205 | 0% | |||
Slovakia | 3,354 | 3,932 | -15% | 3,354 | 3,932 | -15% | |||
Bulgaria | 3,402 | 3,808 | -11% | 3,402 | 3,808 | -11% | |||
Hungary | 7,808 | 6,861 | 14% | 7,808 | 6,861 | 14% | |||
Serbia | - | 213 | -100% | - | - | - | |||
Lithuania | - | - | - | - | - | - | |||
Croatia | 2,837 | 2,743 | 3% | 2,837 | 2,743 | 3% | |||
Czech Republic | - | - | - | - | - | - | |||
Office | 2 | 0 | - | 2 | 0 | - | |||
Slovakia | 2 | 0 | - | 2 | 0 | - | |||
Bulgaria | - | - | - | - | - | - | |||
Industrial | - | - | - | - | - | - | |||
Romania | - | - | - | - | - | - | |||
Total | 39,778 | 40,737 | -2% | 37,739 | 38,212 | -1% | |||
Fuel-Abs, | MWh | (sub)metered exclusively to tenants | Retail | 40,157 | 39,034 | 3% | 34,473 | 32,807 | 5% |
Romania | 30,281 | 29,020 | 4% | 27,032 | 25,746 | 5% | |||
Poland | 3,336 | 3,085 | 8% | 900 | 957 | -6% | |||
Slovakia | 3,612 | 3,231 | 12% | 3,612 | 3,231 | 12% | |||
Bulgaria | 2,039 | 1,923 | 6% | 2,039 | 1,923 | 6% | |||
Hungary | 4 | 0 | - | 4 | 0 | - | |||
Serbia | - | 825 | - | - | - | - | |||
Lithuania | 516 | 585 | -12% | 516 | 585 | -12% | |||
Croatia | 369 | 365 | 1% | 369 | 365 | 1% | |||
Czech Republic | - | - | - | - | - | - | |||
Office | - | - | - | - | - | - | |||
Slovakia | - | - | - | - | - | - | |||
Bulgaria | - | - | - | - | - | - | |||
Industrial | 7,936 | 7,202 | 10% | 7,936 | 7,202 | 10% | |||
Romania | 7,936 | 7,202 | 10% | 7,936 | 7,202 | 10% | |||
Total | 48,093 | 46,237 | 4% | 42,409 | 40,009 | 6% | |||
Fuel-Abs, | MWh | Total landlord-obtained fuels | Retail | 79,933 | 79,771 | 0% | 72,209 | 71,019 | 2% |
Romania | 38,656 | 38,100 | 1% | 35,155 | 34,409 | 2% | |||
Poland | 17,336 | 17,184 | 1% | 13,114 | 13,162 | 0% | |||
Slovakia | 6,966 | 7,163 | -3% | 6,966 | 7,163 | -3% | |||
Bulgaria | 5,441 | 5,731 | -5% | 5,441 | 5,731 | -5% | |||
Hungary | 7,812 | 6,861 | 14% | 7,812 | 6,861 | 14% | |||
Serbia | - | 1,038 | - | - | - | - | |||
Lithuania | 516 | 585 | -12% | 516 | 585 | -12% | |||
Croatia | 3,206 | 3,108 | 3% | 3,206 | 3,108 | 3% | |||
Czech Republic | - | - | - | - | - | - | |||
Office | 2 | 0 | - | 2 | 0 | - | |||
Slovakia | 2 | 0 | - | 2 | 0 | - | |||
Bulgaria | - | - | - | - | - | - | |||
Industrial | 7,936 | 7,202 | 10% | 7,936 | 7,202 | 10% | |||
Romania | 7,936 | 7,202 | 10% | 7,936 | 7,202 | 10% | |||
Total | 87,871 | 86,974 | 1% | 80,148 | 78,222 | 2% | |||
Fuel-Abs, | MWh | Total fuel | Retail | 79,933 | 79,771 | 0% | 72,209 | 71,019 | 2% |
Romania | 38,656 | 38,100 | 1% | 35,155 | 34,409 | 2% | |||
Poland | 17,336 | 17,184 | 1% | 13,114 | 13,162 | 0% | |||
Slovakia | 6,966 | 7,163 | -3% | 6,966 | 7,163 | -3% | |||
Bulgaria | 5,441 | 5,731 | -5% | 5,441 | 5,731 | -5% | |||
Hungary | 7,812 | 6,861 | 14% | 7,812 | 6,861 | 14% | |||
Serbia | - | 1,038 | - | - | - | - | |||
Lithuania | 516 | 585 | -12% | 516 | 585 | -12% | |||
Croatia | 3,206 | 3,108 | 3% | 3,206 | 3,108 | 3% | |||
Czech Republic | - | - | - | - | - | - | |||
Office | 2 | 0 | - | 2 | 0 | - | |||
Slovakia | 2 | 0 | - | 2 | 0 | - | |||
Bulgaria | - | - | - | - | - | - | |||
Industrial | 7,936 | 7,202 | 10% | 7,936 | 7,202 | 10% | |||
Romania | 7,936 | 7,202 | 10% | 7,936 | 7,202 | 10% | |||
Total | 87,871 | 86,974 | 1% | 80,148 | 78,222 | 2% | |||
Fuel-Abs, | % | Natural Gas | Retail | 100% | 100% | 0% | 100% | 100% | 0% |
Romania | 100% | 100% | 0% | 100% | 100% | 0% | |||
Poland | 100% | 100% | 0% | 100% | 100% | 0% | |||
Slovakia | 100% | 100% | 0% | 100% | 100% | 0% | |||
Bulgaria | 100% | 100% | 0% | 100% | 100% | 0% | |||
Hungary | 100% | 100% | 0% | 100% | 100% | 0% | |||
Serbia | - | 100% | - | - | - | - | |||
Lithuania | 100% | 100% | 0% | 100% | 100% | 0% | |||
Croatia | 100% | 100% | 0% | 100% | 100% | 0% | |||
Czech Republic | - | - | - | - | - | - | |||
Office | 100% | 100% | 0% | 100% | 100% | 0% | |||
Slovakia | 100% | 100% | 0% | 100% | 100% | 0% | |||
Bulgaria | 0% | 0% | 0% | 0% | 0% | 0% | |||
Industrial | 100% | 100% | 0% | 100% | 100% | 0% | |||
Romania | 100% | 100% | 0% | 100% | 100% | 0% | |||
Total | 100% | 100% | 0% | 100% | 100% | 0% | |||
Fuel-Abs, | MWh | Natural Gas | Retail | 79,933 | 79,771 | 0% | 72,209 | 71,019 | 2% |
Romania | 38,656 | 38,100 | 1% | 35,155 | 34,409 | 2% | |||
Poland | 17,336 | 17,184 | 1% | 13,114 | 13,162 | 0% | |||
Slovakia | 6,966 | 7,163 | -3% | 6,966 | 7,163 | -3% | |||
Bulgaria | 5,441 | 5,731 | -5% | 5,441 | 5,731 | -5% | |||
Hungary | 7,812 | 6,861 | 14% | 7,812 | 6,861 | 14% | |||
Serbia | - | 1,038 | - | - | - | - | |||
Lithuania | 516 | 585 | -12% | 516 | 585 | -12% | |||
Croatia | 3,206 | 3,108 | 3% | 3,206 | 3,108 | 3% | |||
Czech Republic | - | - | - | - | - | - | |||
Office | 2 | 0 | - | 2 | 0 | - | |||
Slovakia | 2 | 0 | - | 2 | 0 | - | |||
Bulgaria | - | - | - | - | - | - | |||
Industrial | 7,936 | 7,202 | 10% | 7,936 | 7,202 | 10% | |||
Romania | 7,936 | 7,202 | 10% | 7,936 | 7,202 | 10% | |||
Total | 87,871 | 86,974 | 1% | 80,148 | 78,222 | 2% | |||
No. applicable properties | 60 | 61 | 56 | 56 | |||||
m2 of applicable properties | 4,567,477 | 4,651,286 | 4,065,153 | 4,065,153 | |||||
% fuels estimated | 0% | 0% | 0% | 0% | |||||
All of NEPI Rockcastle's on-site fuel consumption is sourced from natural gas. NEPI Rockcastle intends to decrease reliance on natural gas for heating supply, though notes that consumption increased in absolute and like-for-like terms in 2025. This is partly due to operational changes, and partly due to weather.
ENERGY | Total | Like-for-like | |||||||
|---|---|---|---|---|---|---|---|---|---|
EPRA Code | Units of Measurement | Category | Country | 2025 | 2024 | 2025 vs 2024 | 2025 | 2024 | 2025 vs 2024 |
Energy-Int | kWh/m2/year | Energy Intensity | Retail | 152.22 | 152.31 | 0% | 152.60 | 152.81 | 0% |
Romania | 176.87 | 175.76 | 1% | 177.70 | 176.71 | 1% | |||
Poland | 144.53 | 145.10 | 0% | 144.49 | 143.83 | 0% | |||
Slovakia | 138.16 | 137.15 | 1% | 138.16 | 137.15 | 1% | |||
Bulgaria | 138.35 | 142.07 | -3% | 138.35 | 142.07 | -3% | |||
Hungary | 128.70 | 131.19 | -2% | 128.70 | 131.19 | -2% | |||
Serbia | - | 137.95 | - | - | - | - | |||
Lithuania | 125.51 | 131.04 | -4% | 125.51 | 131.04 | -4% | |||
Croatia | 118.93 | 123.21 | -3% | 118.93 | 123.21 | -3% | |||
Czech Republic | 178.32 | 173.18 | 3% | 178.32 | 173.18 | 3% | |||
Office | 86.59 | 83.64 | 4% | 86.59 | 83.64 | 4% | |||
Slovakia | 134.17 | 139.09 | -4% | 134.17 | 139.09 | -4% | |||
Bulgaria | 68.81 | 62.92 | 9% | 68.81 | 62.92 | 9% | |||
Industrial | 447.43 | 416.01 | 8% | 447.43 | 416.01 | 8% | |||
Romania | 447.43 | 416.01 | 8% | 447.43 | 416.01 | 8% | |||
Total | 152.90 | 152.78 | 0% | 153.35 | 153.33 | 0% | |||
While showing progress for the Group controlled area (common area), the total energy intensity across the portfolio did not change significantly in 2025.
GHG EMISSIONS | Total | Like-for-like | |||||||
|---|---|---|---|---|---|---|---|---|---|
EPRA Code | Units of Measurement | Category | Country | 2025 | 2024 | 2025 vs 2024 | 2025 | 2024 | 2025 vs 2024 |
GHG-Dir-Abs | tCO2eq | Total Direct Scope 1 | Retail | 7,275 | 7,451 | -2% | 6,902 | 6,989 | -1% |
Romania | 1,532 | 1,661 | -8% | 1,486 | 1,584 | -6% | |||
Poland | 2,561 | 2,579 | -1% | 2,234 | 2,232 | 0% | |||
Slovakia | 613 | 719 | -15% | 613 | 719 | -15% | |||
Bulgaria | 622 | 696 | -11% | 622 | 696 | -11% | |||
Hungary | 1,428 | 1,255 | 14% | 1,428 | 1,255 | 14% | |||
Serbia | - | 39 | - | - | - | - | |||
Lithuania | - | - | - | - | - | - | |||
Croatia | 519 | 502 | 3% | 519 | 502 | 3% | |||
Czech Republic | - | - | - | - | - | - | |||
Office | 0 | 0 | 0% | 0 | 0 | 0% | |||
Slovakia | 0 | 0 | 0% | 0 | 0 | 0% | |||
Bulgaria | - | - | - | - | - | - | |||
Industrial | - | - | - | - | - | - | |||
Romania | - | - | - | - | - | - | |||
Total | 7,275 | 7,451 | -2% | 6,902 | 6,989 | -1% | |||
GHG-Dir-Abs | tCO2eq | Natural Gas | Retail | 7,275 | 7,451 | -2% | 6,902 | 6,989 | -1% |
Romania | 1,532 | 1,661 | -8% | 1,486 | 1,584 | -6% | |||
Poland | 2,561 | 2,579 | -1% | 2,234 | 2,232 | 0% | |||
Slovakia | 613 | 719 | -15% | 613 | 719 | -15% | |||
Bulgaria | 622 | 696 | -11% | 622 | 696 | -11% | |||
Hungary | 1,428 | 1,255 | 14% | 1,428 | 1,255 | 14% | |||
Serbia | - | 39 | - | - | - | - | |||
Lithuania | - | - | - | - | - | - | |||
Croatia | 519 | 502 | 3% | 519 | 502 | 3% | |||
Czech Republic | - | - | - | - | - | - | |||
Office | 0 | 0 | 0% | 0 | 0 | 0% | |||
Slovakia | 0 | 0 | 0% | 0 | 0 | 0% | |||
Bulgaria | - | - | - | - | - | - | |||
Industrial | - | - | - | - | - | - | |||
Romania | - | - | - | - | - | - | |||
Total | 7,275 | 7,451 | -2% | 6,902 | 6,989 | -1% | |||
GHG-Indir-Abs | tCO2eq | Total Indirect Scope 2 Market based | Retail | 5,631 | 15,267 | -63% | 5,321 | 7,283 | -27% |
Romania | - | - | 0% | - | - | 0% | |||
Poland | 2,576 | 10,167 | -75% | 2,266 | 2,183 | 4% | |||
Slovakia | 1,438 | 1,340 | 7% | 1,438 | 1,340 | 7% | |||
Bulgaria | 173 | 447 | -61% | 173 | 447 | -61% | |||
Hungary | - | 1,299 | - | - | 1,299 | - | |||
Serbia | - | - | - | - | - | - | |||
Lithuania | 591 | 597 | -1% | 591 | 597 | -1% | |||
Croatia | - | 549 | - | - | 549 | - | |||
Czech Republic | 854 | 867 | -2% | 854 | 867 | -2% | |||
Office | 213 | 217 | -2% | 213 | 217 | -2% | |||
Slovakia | 153 | 154 | -1% | 153 | 154 | -1% | |||
Bulgaria | 60 | 63 | -5% | 60 | 63 | -5% | |||
Industrial | - | - | - | - | - | - | |||
Romania | - | - | - | - | - | - | |||
Total | 5,844 | 15,484 | -62% | 5,534 | 7,500 | -26% | |||
GHG-Indir-Abs | tCO2eq | Scope 2 Electricity - market based | Retail | 23 | 9,888 | -100% | 23 | 2,138 | -99% |
Romania | - | - | - | - | - | - | |||
Poland | 23 | 7,778 | -100% | 23 | 28 | -19% | |||
Slovakia | - | - | - | - | - | - | |||
Bulgaria | - | 262 | - | - | 262 | - | |||
Hungary | - | 1,299 | - | - | 1,299 | - | |||
Serbia | - | - | - | - | - | - | |||
Lithuania | - | - | - | - | - | - | |||
Croatia | - | 549 | - | - | 549 | - | |||
Czech Republic | - | - | - | - | - | - | |||
Office | - | - | - | - | - | - | |||
Slovakia | - | - | - | - | - | - | |||
Bulgaria | - | - | - | - | - | - | |||
Industrial | - | - | - | - | - | - | |||
Romania | - | - | - | - | - | - | |||
Total | 23 | 9,888 | -100% | 23 | 2,138 | -99% | |||
GHG-Indir-Abs | tCO2eq | Scope 2 - Local District Heating | Retail | 5,608 | 5,379 | 4% | 5,298 | 5,144 | 3% |
Romania | - | - | - | - | - | - | |||
Poland | 2,553 | 2,389 | 7% | 2,243 | 2,155 | 4% | |||
Slovakia | 1,438 | 1,340 | 7% | 1,438 | 1,340 | 7% | |||
Bulgaria | 173 | 185 | -7% | 173 | 185 | -7% | |||
Hungary | - | - | - | - | - | - | |||
Serbia | - | - | - | - | - | - | |||
Lithuania | 591 | 597 | -1% | 591 | 597 | -1% | |||
Croatia | - | - | - | - | - | - | |||
Czech Republic | 854 | 867 | -2% | 854 | 867 | -2% | |||
Office | 213 | 217 | -2% | 213 | 217 | -2% | |||
Slovakia | 153 | 154 | -1% | 153 | 154 | -1% | |||
Bulgaria | 60 | 63 | -5% | 60 | 63 | -5% | |||
Industrial | - | - | - | - | - | - | |||
Romania | - | - | - | - | - | - | |||
Total | 5,821 | 5,596 | 4% | 5,511 | 5,361 | 3% | |||
GHG-Indir-Abs | tCO2eq | Total Indirect Scope 2 (Location based) | Retail | 64,556 | 73,754 | -12% | 56,950 | 59,842 | -5% |
Romania | 6,152 | 7,227 | -15% | 5,922 | 6,967 | -15% | |||
Poland | 34,673 | 37,561 | -8% | 27,296 | 27,731 | -2% | |||
Slovakia | 4,286 | 4,177 | 3% | 4,286 | 4,177 | 3% | |||
Bulgaria | 6,028 | 6,170 | -2% | 6,028 | 6,170 | -2% | |||
Hungary | 3,773 | 4,184 | -10% | 3,773 | 4,184 | -10% | |||
Serbia | - | 3,821 | - | - | - | - | |||
Lithuania | 1,248 | 1,336 | -7% | 1,248 | 1,336 | -7% | |||
Croatia | 3,204 | 3,422 | -6% | 3,204 | 3,422 | -6% | |||
Czech Republic | 5,193 | 5,854 | -11% | 5,193 | 5,854 | -11% | |||
Office | 563 | 531 | 6% | 563 | 531 | 6% | |||
Slovakia | 340 | 309 | 10% | 340 | 309 | 10% | |||
Bulgaria | 223 | 222 | 1% | 223 | 222 | 1% | |||
Industrial | - | - | - | - | - | - | |||
Romania | - | - | - | - | - | - | |||
Total | 65,119 | 74,285 | -12% | 57,512 | 60,373 | -5% | |||
GHG-Indir-Abs | tCO2eq | Scope 2 Electricity - location based | Retail | 58,948 | 68,374 | -14% | 51,651 | 54,697 | -6% |
Romania | 6,152 | 7,227 | -15% | 5,922 | 6,967 | -15% | |||
Poland | 32,119 | 35,172 | -9% | 25,053 | 25,576 | -2% | |||
Slovakia | 2,849 | 2,837 | 0% | 2,849 | 2,837 | 0% | |||
Bulgaria | 5,856 | 5,985 | -2% | 5,856 | 5,985 | -2% | |||
Hungary | 3,773 | 4,184 | -10% | 3,773 | 4,184 | -10% | |||
Serbia | - | 3,821 | - | - | - | - | |||
Lithuania | 657 | 739 | -11% | 657 | 739 | -11% | |||
Croatia | 3,204 | 3,422 | -6% | 3,204 | 3,422 | -6% | |||
Czech Republic | 4,339 | 4,987 | -13% | 4,339 | 4,987 | -13% | |||
Office | 350 | 314 | 12% | 350 | 314 | 12% | |||
Slovakia | 187 | 155 | 21% | 187 | 155 | 21% | |||
Bulgaria | 163 | 159 | 3% | 163 | 159 | 3% | |||
Industrial | - | - | - | - | - | - | |||
Romania | - | - | - | - | - | - | |||
Total | 59,298 | 68,688 | -14% | 52,001 | 55,011 | -5% | |||
GHG-Indir-Abs | tCO2eq | Scope 2 - Local District Heating | Retail | 5,608 | 5,379 | 4% | 5,298 | 5,144 | 3% |
Romania | - | - | - | - | - | - | |||
Poland | 2,553 | 2,389 | 7% | 2,243 | 2,155 | 4% | |||
Slovakia | 1,438 | 1,340 | 7% | 1,438 | 1,340 | 7% | |||
Bulgaria | 173 | 185 | -7% | 173 | 185 | -7% | |||
Hungary | - | - | - | - | - | - | |||
Serbia | - | - | - | - | - | - | |||
Lithuania | 591 | 597 | -1% | 591 | 597 | -1% | |||
Croatia | - | - | - | - | - | - | |||
Czech Republic | 854 | 867 | -2% | 854 | 867 | -2% | |||
Office | 213 | 217 | -2% | 213 | 217 | -2% | |||
Slovakia | 153 | 154 | -1% | 153 | 154 | -1% | |||
Bulgaria | 60 | 63 | -5% | 60 | 63 | -5% | |||
Industrial | - | - | - | - | - | - | |||
Romania | - | - | - | - | - | - | |||
Total | 5,821 | 5,596 | 4% | 5,511 | 5,361 | 3% | |||
GHG-Indir-Abs | tCO2eq | Total Scope 3 (market based) | Retail | 52,265 | 61,058 | -14% | 39,529 | 41,307 | -4% |
Romania | 5,609 | 5,377 | 4% | 5,009 | 4,772 | 5% | |||
Poland | 44,563 | 50,398 | -12% | 32,428 | 31,406 | 3% | |||
Slovakia | 789 | 702 | 12% | 789 | 702 | 12% | |||
Bulgaria | 379 | 863 | -56% | 379 | 863 | -56% | |||
Hungary | 1 | 1,633 | -100% | 1 | 1,633 | -100% | |||
Serbia | - | 153 | - | - | - | - | |||
Lithuania | 95 | 108 | -12% | 95 | 108 | -12% | |||
Croatia | 68 | 1,218 | -94% | 68 | 1,218 | -94% | |||
Czech Republic | 760 | 606 | 25% | 760 | 606 | 25% | |||
Office | 140 | 127 | 10% | 140 | 127 | 10% | |||
Slovakia | - | - | - | - | - | - | |||
Bulgaria | 140 | 127 | 10% | 140 | 127 | 10% | |||
Industrial | 1,468 | 1,332 | 10% | 1,468 | 1,332 | 10% | |||
Romania | 1,468 | 1,332 | 10% | 1,468 | 1,332 | 10% | |||
Total | 53,872 | 62,517 | -14% | 41,137 | 42,766 | -4% | |||
GHG-Indir-Abs | tCO2eq | Scope 3- Electricity sub-metered to occupiers | Retail | 41,536 | 51,044 | -19% | 30,519 | 33,108 | -8% |
Romania | 9 | 10 | -8% | 9 | 10 | -8% | |||
Poland | 41,527 | 47,746 | -13% | 30,510 | 29,810 | 2% | |||
Slovakia | - | - | - | - | - | - | |||
Bulgaria | - | 505 | - | - | 505 | - | |||
Hungary | - | 1,633 | - | - | 1,633 | - | |||
Serbia | - | - | - | - | - | - | |||
Lithuania | - | - | - | - | - | - | |||
Croatia | - | 1,150 | - | - | 1,150 | - | |||
Czech Republic | - | - | - | - | - | - | |||
Office | - | - | - | - | - | - | |||
Slovakia | - | - | - | - | - | - | |||
Bulgaria | - | - | - | - | - | - | |||
Industrial | - | - | - | - | - | - | |||
Romania | - | - | - | - | - | - | |||
Total | 41,536 | 51,044 | -19% | 30,519 | 33,108 | -8% | |||
GHG-Indir-Abs | tCO2eq | Total Scope 3 (location based) | Retail | 169,818 | 173,206 | -2% | 140,841 | 139,559 | 1% |
Romania | 49,511 | 47,312 | 5% | 45,734 | 44,284 | 3% | |||
Poland | 87,564 | 87,064 | 1% | 62,364 | 62,822 | -1% | |||
Slovakia | 4,296 | 4,257 | 1% | 4,296 | 4,257 | 1% | |||
Bulgaria | 10,873 | 11,093 | -2% | 10,873 | 11,093 | -2% | |||
Hungary | 5,136 | 5,216 | -2% | 5,136 | 5,216 | -2% | |||
Serbia | - | 6,378 | - | - | - | - | |||
Lithuania | 1,718 | 1,755 | -2% | 1,718 | 1,755 | -2% | |||
Croatia | 5,608 | 5,798 | -3% | 5,608 | 5,798 | -3% | |||
Czech Republic | 5,111 | 4,334 | 18% | 5,111 | 4,334 | 18% | |||
Office | 737 | 711 | 4% | 737 | 711 | 4% | |||
Slovakia | 140 | 191 | -27% | 140 | 191 | -27% | |||
Bulgaria | 597 | 520 | 15% | 597 | 520 | 15% | |||
Industrial | 2,049 | 1,914 | 7% | 2,049 | 1,914 | 7% | |||
Romania | 2,049 | 1,914 | 7% | 2,049 | 1,914 | 7% | |||
Total | 172,604 | 175,831 | -2% | 143,627 | 142,185 | 1% | |||
GHG-Indir-Abs | tCO2eq | Scope 3- Electricity sub-metered to occupiers | Retail | 159,453 | 163,508 | -2% | 132,182 | 131,663 | 0% |
Romania | 43,973 | 42,004 | 5% | 40,790 | 39,575 | 3% | |||
Poland | 84,816 | 84,654 | 0% | 60,729 | 61,464 | -1% | |||
Slovakia | 3,514 | 3,562 | -1% | 3,514 | 3,562 | -1% | |||
Bulgaria | 10,498 | 10,739 | -2% | 10,498 | 10,739 | -2% | |||
Hungary | 5,136 | 5,216 | -2% | 5,136 | 5,216 | -2% | |||
Serbia | - | 6,227 | - | - | - | - | |||
Lithuania | 1,624 | 1,647 | -1% | 1,624 | 1,647 | -1% | |||
Croatia | 5,541 | 5,731 | -3% | 5,541 | 5,731 | -3% | |||
Czech Republic | 4,351 | 3,728 | 17% | 4,351 | 3,728 | 17% | |||
Office | 597 | 584 | 2% | 597 | 584 | 2% | |||
Slovakia | 140 | 191 | -27% | 140 | 191 | -27% | |||
Bulgaria | 458 | 393 | 16% | 458 | 393 | 16% | |||
Industrial | 598 | 597 | 0% | 598 | 597 | 0% | |||
Romania | 598 | 597 | 0% | 598 | 597 | 0% | |||
Total | 160,648 | 164,689 | -2% | 133,377 | 132,844 | 0% | |||
GHG | tCO2eq | Scope 1 + Scope 2 (location based) | Retail | 71,831 | 81,204 | -12% | 63,852 | 66,831 | -4% |
Romania | 7,684 | 8,888 | -14% | 7,407 | 8,551 | -13% | |||
Poland | 37,233 | 40,140 | -7% | 29,530 | 29,963 | -1% | |||
Slovakia | 4,900 | 4,896 | 0% | 4,900 | 4,896 | 0% | |||
Bulgaria | 6,650 | 6,867 | -3% | 6,650 | 6,867 | -3% | |||
Hungary | 5,201 | 5,439 | -4% | 5,201 | 5,439 | -4% | |||
Serbia | - | 3,860 | - | - | - | - | |||
Lithuania | 1,248 | 1,336 | -7% | 1,248 | 1,336 | -7% | |||
Croatia | 3,722 | 3,924 | -5% | 3,722 | 3,924 | -5% | |||
Czech Republic | 5,193 | 5,854 | -11% | 5,193 | 5,854 | -11% | |||
Office | 563 | 531 | 6% | 563 | 531 | 6% | |||
Slovakia | 340 | 309 | 10% | 340 | 309 | 10% | |||
Bulgaria | 223 | 222 | 1% | 223 | 222 | 1% | |||
Industrial | - | - | - | - | - | - | |||
Romania | - | - | - | - | - | - | |||
Total | 72,394 | 81,735 | -11% | 64,415 | 67,362 | -4% | |||
GHG | tCO2eq | Scope 1 + Scope 2 (market based) | Retail | 12,906 | 22,718 | -43% | 12,223 | 14,272 | -14% |
Romania | 1,532 | 1,661 | -8% | 1,486 | 1,584 | -6% | |||
Poland | 5,137 | 12,746 | -60% | 4,500 | 4,415 | 2% | |||
Slovakia | 2,051 | 2,060 | 0% | 2,051 | 2,060 | 0% | |||
Bulgaria | 795 | 1,144 | -31% | 795 | 1,144 | -31% | |||
Hungary | 1,428 | 2,554 | -44% | 1,428 | 2,554 | -44% | |||
Serbia | - | 39 | - | - | - | - | |||
Lithuania | 591 | 597 | -1% | 591 | 597 | -1% | |||
Croatia | 519 | 1,051 | -51% | 519 | 1,051 | -51% | |||
Czech Republic | 854 | 867 | -2% | 854 | 867 | -2% | |||
Office | 213 | 217 | -2% | 213 | 217 | -2% | |||
Slovakia | 153 | 154 | -1% | 153 | 154 | -1% | |||
Bulgaria | 60 | 63 | -5% | 60 | 63 | -5% | |||
Industrial | - | - | - | - | - | - | |||
Romania | - | - | - | - | - | - | |||
Total | 13,119 | 22,935 | -43% | 12,436 | 14,489 | -14% | |||
GHG | tCO2eq | Scope 1 + Scope 2 + Scope 3 (Location Based) | Retail | 241,649 | 254,411 | -5% | 204,693 | 206,390 | -1% |
Romania | 57,195 | 56,200 | 2% | 53,141 | 52,835 | 1% | |||
Poland | 124,797 | 127,204 | -2% | 91,895 | 92,786 | -1% | |||
Slovakia | 9,196 | 9,154 | 0% | 9,196 | 9,154 | 0% | |||
Bulgaria | 17,523 | 17,959 | -2% | 17,523 | 17,959 | -2% | |||
Hungary | 10,337 | 10,655 | -3% | 10,337 | 10,655 | -3% | |||
Serbia | - | 10,238 | - | - | - | - | |||
Lithuania | 2,966 | 3,091 | -4% | 2,966 | 3,091 | -4% | |||
Croatia | 9,331 | 9,722 | -4% | 9,331 | 9,722 | -4% | |||
Czech Republic | 10,304 | 10,189 | 1% | 10,304 | 10,189 | 1% | |||
Office | 1,300 | 1,242 | 5% | 1,300 | 1,242 | 5% | |||
Slovakia | 480 | 500 | -4% | 480 | 500 | -4% | |||
Bulgaria | 820 | 742 | 11% | 820 | 742 | 11% | |||
Industrial | 2,049 | 1,914 | 7% | 2,049 | 1,914 | 7% | |||
Romania | 2,049 | 1,914 | 7% | 2,049 | 1,914 | 7% | |||
Total | 244,999 | 257,567 | -5% | 208,042 | 209,546 | -1% | |||
GHG | tCO2eq | Scope 1 + Scope 2 + Scope 3 (Market Based) | Retail | 65,170 | 83,776 | -22% | 51,753 | 55,579 | -7% |
Romania | 7,141 | 7,038 | 1% | 6,494 | 6,356 | 2% | |||
Poland | 49,699 | 63,145 | -21% | 36,928 | 35,821 | 3% | |||
Slovakia | 2,840 | 2,761 | 3% | 2,840 | 2,761 | 3% | |||
Bulgaria | 1,174 | 2,006 | -42% | 1,174 | 2,006 | -42% | |||
Hungary | 1,429 | 4,187 | -66% | 1,429 | 4,187 | -66% | |||
Serbia | - | 192 | - | - | - | - | |||
Lithuania | 686 | 706 | -3% | 686 | 706 | -3% | |||
Croatia | 587 | 2,269 | -74% | 587 | 2,269 | -74% | |||
Czech Republic | 1,614 | 1,473 | 10% | 1,614 | 1,473 | 10% | |||
Office | 353 | 344 | 3% | 353 | 344 | 3% | |||
Slovakia | 153 | 154 | -1% | 153 | 154 | -1% | |||
Bulgaria | 199 | 190 | 5% | 199 | 190 | 5% | |||
Industrial | 1,468 | 1,332 | 10% | 1,468 | 1,332 | 10% | |||
Romania | 1,468 | 1,332 | 10% | 1,468 | 1,332 | 10% | |||
Total | 66,991 | 85,452 | -22% | 53,573 | 57,255 | -6% | |||
GHG | % | Proportion of Scope 1 + Scope 2 (location based) estimated | Retail | 0% | 0% | 0% | 0% | 0% | 0% |
Romania | 0% | 0% | 0% | 0% | 0% | 0% | |||
Poland | 0% | 0% | 0% | 0% | 0% | 0% | |||
Slovakia | 0% | 0% | 0% | 0% | 0% | 0% | |||
Bulgaria | 0% | 0% | 0% | 0% | 0% | 0% | |||
Hungary | 0% | 0% | 0% | 0% | 0% | 0% | |||
Serbia | 0% | 0% | 0% | 0% | 0% | 0% | |||
Lithuania | 0% | 0% | 0% | 0% | 0% | 0% | |||
Croatia | 0% | 0% | 0% | 0% | 0% | 0% | |||
Czech Republic | 0% | 0% | 0% | 0% | 0% | 0% | |||
Office | 0% | 0% | 0% | 0% | 0% | 0% | |||
Slovakia | 0% | 0% | 0% | 0% | 0% | 0% | |||
Bulgaria | 0% | 0% | 0% | 0% | 0% | 0% | |||
Industrial | 0% | 0% | 0% | 0% | 0% | 0% | |||
Romania | 0% | 0% | 0% | 0% | 0% | 0% | |||
Total | 0% | 0% | 0% | 0% | 0% | 0% | |||
GHG | % | Proportion of Scope 1 + Scope 2 (market based) estimated | Retail | 0% | 0% | 0% | 0% | 0% | 0% |
Romania | 0% | 0% | 0% | 0% | 0% | 0% | |||
Poland | 0% | 0% | 0% | 0% | 0% | 0% | |||
Slovakia | 0% | 0% | 0% | 0% | 0% | 0% | |||
Bulgaria | 0% | 0% | 0% | 0% | 0% | 0% | |||
Hungary | 0% | 0% | 0% | 0% | 0% | 0% | |||
Serbia | 0% | 0% | 0% | 0% | 0% | 0% | |||
Lithuania | 0% | 0% | 0% | 0% | 0% | 0% | |||
Croatia | 0% | 0% | 0% | 0% | 0% | 0% | |||
Czech Republic | 0% | 0% | 0% | 0% | 0% | 0% | |||
Office | 0% | 0% | 0% | 0% | 0% | 0% | |||
Slovakia | 0% | 0% | 0% | 0% | 0% | 0% | |||
Bulgaria | 0% | 0% | 0% | 0% | 0% | 0% | |||
Industrial | 0% | 0% | 0% | 0% | 0% | 0% | |||
Romania | 0% | 0% | 0% | 0% | 0% | 0% | |||
Total | 0% | 0% | 0% | 0% | 0% | 0% | |||
GHG | % | Proportion of Scope 3 estimated | Retail | 0% | 0% | 0% | 0% | 0% | 0% |
Romania | 0% | 0% | 0% | 0% | 0% | 0% | |||
Poland | 0% | 0% | 0% | 0% | 0% | 0% | |||
Slovakia | 0% | 0% | 0% | 0% | 0% | 0% | |||
Bulgaria | 0% | 0% | 0% | 0% | 0% | 0% | |||
Hungary | 0% | 0% | 0% | 0% | 0% | 0% | |||
Serbia | 0% | 0% | 0% | 0% | 0% | 0% | |||
Lithuania | 0% | 0% | 0% | 0% | 0% | 0% | |||
Croatia | 0% | 0% | 0% | 0% | 0% | 0% | |||
Czech Republic | 0% | 0% | 0% | 0% | 0% | 0% | |||
Office | 0% | 0% | 0% | 0% | 0% | 0% | |||
Slovakia | 0% | 0% | 0% | 0% | 0% | 0% | |||
Bulgaria | 0% | 0% | 0% | 0% | 0% | 0% | |||
Industrial | 0% | 0% | 0% | 0% | 0% | 0% | |||
Romania | 0% | 0% | 0% | 0% | 0% | 0% | |||
Total | 0% | 0% | 0% | 0% | 0% | 0% | |||
GHG-Int | kgCO2eq/ m2/ | Scope 1 and 2 emissions (location based) | Retail | 30.44 | 33.66 | -10% | 29.63 | 31.01 | -4% |
Romania | 11.39 | 13.39 | -15% | 11.61 | 13.40 | -13% | |||
Poland | 46.13 | 49.94 | -8% | 46.21 | 46.89 | -1% | |||
Slovakia | 26.39 | 26.37 | 0% | 26.39 | 26.37 | 0% | |||
Bulgaria | 28.66 | 29.59 | -3% | 28.66 | 29.59 | -3% | |||
Hungary | 27.54 | 28.80 | -4% | 27.54 | 28.80 | -4% | |||
Serbia | - | 57.77 | - | - | - | - | |||
Lithuania | 16.76 | 17.94 | -7% | 16.76 | 17.94 | -7% | |||
Croatia | 31.38 | 33.08 | -5% | 31.38 | 33.08 | -5% | |||
Czech Republic | 66.30 | 74.74 | -11% | 66.30 | 74.74 | -11% | |||
Office | 36.86 | 34.75 | 6% | 36.86 | 34.75 | 6% | |||
Slovakia | 131.27 | 119.30 | 10% | 131.27 | 119.30 | 10% | |||
Bulgaria | 17.60 | 17.49 | 1% | 17.60 | 17.49 | 1% | |||
Industrial | - | - | - | - | - | - | |||
Romania | - | - | - | - | - | - | |||
Total | 30.47 | 33.66 | -9% | 29.67 | 31.03 | -4% | |||
GHG-Int | kgCO2eq/ m2/ | Scope 1 and 2 emissions (market based) | Retail | 5.47 | 9.42 | -42% | 5.67 | 6.62 | -14% |
Romania | 2.27 | 2.50 | -9% | 2.33 | 2.48 | -6% | |||
Poland | 6.36 | 15.86 | -60% | 7.04 | 6.91 | 2% | |||
Slovakia | 11.05 | 11.09 | 0% | 11.05 | 11.09 | 0% | |||
Bulgaria | 3.42 | 4.93 | -31% | 3.42 | 4.93 | -31% | |||
Hungary | 7.56 | 13.52 | -44% | 7.56 | 13.52 | -44% | |||
Serbia | - | 0.58 | - | - | - | - | |||
Lithuania | 7.93 | 8.02 | -1% | 7.93 | 8.02 | -1% | |||
Croatia | 4.37 | 8.86 | -51% | 4.37 | 8.86 | -51% | |||
Czech Republic | 10.90 | 11.07 | -2% | 10.90 | 11.07 | -2% | |||
Office | 13.95 | 14.20 | -2% | 13.95 | 14.20 | -2% | |||
Slovakia | 59.23 | 59.59 | -1% | 59.23 | 59.59 | -1% | |||
Bulgaria | 4.71 | 4.94 | -5% | 4.71 | 4.94 | -5% | |||
Industrial | - | - | - | - | - | - | |||
Romania | - | - | - | - | - | - | |||
Total | 5.52 | 9.45 | -42% | 5.73 | 6.67 | -14% | |||
No. applicable properties | 60 | 61 | 56 | 56 | |||||
m2 of applicable properties* | 4,760,259 | 4,844,068 | 4,257,935 | 4,257,935 | |||||
% | Proportion of Scope 1 + Scope 2 + Scope 3 (location based) estimated | 0% | 0% | 0% | 0% | ||||
Proportion of Scope 1 + Scope 2 + Scope 3 (market based) estimated | 0% | 0% | 0% | 0% | |||||
NEPI Rockcastle has reduced its Scope 1 and 2 market-based emissions by 62% , based on a decrease in energy consumption and an increase in renewable electricity share.
WATER | Total | Like-for-like | |||||||
|---|---|---|---|---|---|---|---|---|---|
EPRA Code | Units of Measurement | Category | Country | 2025 | 2024 | 2025 vs 2024 | 2025 | 2024 | 2025 vs 2024 |
Water-abs, Water LfL | m3/year | Total landlord-obtained water | Retail | 2,061,505 | 2,185,107 | -6% | 1,838,712 | 1,890,433 | -3% |
Romania | 943,716 | 954,016 | -1% | 882,879 | 896,605 | -2% | |||
Poland | 554,515 | 602,888 | -8% | 392,559 | 419,378 | -6% | |||
Slovakia | 105,655 | 116,336 | -9% | 105,655 | 116,336 | -9% | |||
Bulgaria | 144,398 | 145,691 | -1% | 144,398 | 145,691 | -1% | |||
Hungary | 135,095 | 136,344 | -1% | 135,095 | 136,344 | -1% | |||
Serbia | - | 53,753 | - | - | - | - | |||
Lithuania | 55,829 | 50,761 | 10% | 55,829 | 50,761 | 10% | |||
Croatia | 44,698 | 46,555 | -4% | 44,698 | 46,555 | -4% | |||
Czech Republic | 77,599 | 78,764 | -1% | 77,599 | 78,764 | -1% | |||
Office | 9,108 | 9,317 | -2% | 9,108 | 9,317 | -2% | |||
Slovakia | 2,563 | 2,917 | -12% | 2,563 | 2,917 | -12% | |||
Bulgaria | 6,545 | 6,400 | 2% | 6,545 | 6,400 | 2% | |||
Industrial | 12,318 | 9,627 | 28% | 12,318 | 9,627 | 28% | |||
Romania | 12,318 | 9,627 | 28% | 12,318 | 9,627 | 28% | |||
Total | 2,082,931 | 2,204,052 | -5% | 1,860,138 | 1,909,378 | -3% | |||
Water-abs, Water LfL | m3/year | Total water | Retail | 2,061,505 | 2,185,107 | -6% | 1,838,712 | 1,890,433 | -3% |
Romania | 943,716 | 954,016 | -1% | 882,879 | 896,605 | -2% | |||
Poland | 554,515 | 602,888 | -8% | 392,559 | 419,378 | -6% | |||
Slovakia | 105,655 | 116,336 | -9% | 105,655 | 116,336 | -9% | |||
Bulgaria | 144,398 | 145,691 | -1% | 144,398 | 145,691 | -1% | |||
Hungary | 135,095 | 136,344 | -1% | 135,095 | 136,344 | -1% | |||
Serbia | - | 53,753 | - | - | - | - | |||
Lithuania | 55,829 | 50,761 | 10% | 55,829 | 50,761 | 10% | |||
Croatia | 44,698 | 46,555 | -4% | 44,698 | 46,555 | -4% | |||
Czech Republic | 77,599 | 78,764 | -1% | 77,599 | 78,764 | -1% | |||
Office | 9,108 | 9,317 | -2% | 9,108 | 9,317 | -2% | |||
Slovakia | 2,563 | 2,917 | -12% | 2,563 | 2,917 | -12% | |||
Bulgaria | 6,545 | 6,400 | 2% | 6,545 | 6,400 | 2% | |||
Industrial | 12,318 | 9,627 | 28% | 12,318 | 9,627 | 28% | |||
Romania | 12,318 | 9,627 | 28% | 12,318 | 9,627 | 28% | |||
Total | 2,082,931 | 2,204,052 | -5% | 1,860,138 | 1,909,378 | -3% | |||
Water-abs, Water LfL | m3/year | Groundwater | Retail | 39,187 | 36,999 | 6% | 39,186 | 36,998 | 6% |
Romania | 19 | 115 | -83% | 18 | 114 | -84% | |||
Poland | - | - | - | - | - | - | |||
Slovakia | 15,285 | 11,672 | 31% | 15,285 | 11,672 | 31% | |||
Bulgaria | 9,828 | 14,442 | -32% | 9,828 | 14,442 | -32% | |||
Hungary | - | - | - | - | - | - | |||
Serbia | - | - | - | - | - | - | |||
Lithuania | - | - | - | - | - | - | |||
Croatia | 14,055 | 10,770 | 31% | 14,055 | 10,770 | 31% | |||
Czech Republic | - | - | - | - | - | - | |||
Office | - | - | - | - | - | - | |||
Slovakia | - | - | - | - | - | - | |||
Bulgaria | - | - | - | - | - | - | |||
Industrial | - | - | - | - | - | - | |||
Romania | - | - | - | - | - | - | |||
Total | 39,187 | 36,999 | 6% | 39,186 | 36,998 | 6% | |||
Water-abs, Water LfL | m3/year | Municipal water supplies or other public or private utilities | Retail | 2,022,318 | 2,148,108 | -6% | 1,799,526 | 1,853,435 | -3% |
Romania | 943,697 | 953,901 | -1% | 882,861 | 896,491 | -2% | |||
Poland | 554,515 | 602,888 | -8% | 392,559 | 419,378 | -6% | |||
Slovakia | 90,370 | 104,664 | -14% | 90,370 | 104,664 | -14% | |||
Bulgaria | 134,570 | 131,249 | 3% | 134,570 | 131,249 | 3% | |||
Hungary | 135,095 | 136,344 | -1% | 135,095 | 136,344 | -1% | |||
Serbia | - | 53,753 | - | - | - | - | |||
Lithuania | 55,829 | 50,761 | 10% | 55,829 | 50,761 | 10% | |||
Croatia | 30,643 | 35,785 | -14% | 30,643 | 35,785 | -14% | |||
Czech Republic | 77,599 | 78,764 | -1% | 77,599 | 78,764 | -1% | |||
Office | 9,108 | 9,317 | -2% | 9,108 | 9,317 | -2% | |||
Slovakia | 2,563 | 2,917 | -12% | 2,563 | 2,917 | -12% | |||
Bulgaria | 6,545 | 6,400 | 2% | 6,545 | 6,400 | 2% | |||
Industrial | 12,318 | 9,627 | 28% | 12,318 | 9,627 | 28% | |||
Romania | 12,318 | 9,627 | 28% | 12,318 | 9,627 | 28% | |||
Total | 2,043,744 | 2,167,053 | -6% | 1,820,952 | 1,872,380 | -3% | |||
Water-Int | m3/1000 visitors/year | Building Water Intensity | Retail | 5.8 | 6.0 | -4% | 5.7 | 5.8 | -2% |
Romania | 6.9 | 6.9 | -1% | 6.8 | 6.9 | -2% | |||
Poland | 5.2 | 5.6 | -7% | 4.8 | 4.9 | -3% | |||
Slovakia | 3.2 | 3.4 | -8% | 3.2 | 3.4 | -8% | |||
Bulgaria | 7.6 | 7.6 | 0% | 7.6 | 7.6 | 0% | |||
Hungary | 5.6 | 5.9 | -6% | 5.6 | 5.9 | -6% | |||
Serbia | - | 7.3 | - | - | - | - | |||
Lithuania | 9.2 | 8.5 | 8% | 9.2 | 8.5 | 8% | |||
Croatia | 5.2 | 5.4 | -3% | 5.2 | 5.4 | -3% | |||
Czech Republic | 4.0 | 3.9 | 1% | 4.0 | 3.9 | 1% | |||
Office | - | - | - | - | - | - | |||
Slovakia | - | - | - | - | - | - | |||
Bulgaria | - | - | - | - | - | - | |||
Industrial | - | - | - | - | - | - | |||
Romania | - | - | - | - | - | - | |||
Total | 5.8 | 6.0 | -4% | 5.7 | 5.8 | -2% | |||
No. applicable properties | 60 | 61 | 56 | 56 | |||||
m2 of applicable properties | 4,760,259 | 4,844,068 | 4,257,935 | 4,257,935 | |||||
% Proportion of water estimated | - | - | - | - | |||||
Water is entirely obtained by NEPI Rockcastle as the landlord.
Water consumption decreased by 5% in 2025 compared with the previous year. One of the main drivers was the sale of the Serbian property in 2024, meaning its water consumption was no longer accounted for in 2025. On a like-for-like basis the decrease is of 3%.
Whilst most of the water is supplied from municipal water suppliers, some groundwater is drawn (a small percentage of total water consumption).
WASTE | Total | Like-for-like | |||||||
|---|---|---|---|---|---|---|---|---|---|
EPRA Code | Units of Measurement | Category | Country | 2025 | 2024 | 2025 vs 2024 | 2025 | 2024 | 2025 vs 2024 |
Waste-Abs, Waste-LfL | Tonnes | Total weight of waste generated - Non-Hazardous | Retail | 28,450 | 30,892 | -8% | 24,368 | 25,731 | -5% |
Romania | 11,523 | 12,449 | -7% | 10,481 | 11,352 | -8% | |||
Poland | 8,745 | 9,517 | -8% | 5,706 | 6,031 | -5% | |||
Slovakia | 1,557 | 1,612 | -3% | 1,557 | 1,612 | -3% | |||
Bulgaria | 2,652 | 2,665 | 0% | 2,652 | 2,665 | 0% | |||
Hungary | 1,281 | 1,334 | -4% | 1,281 | 1,334 | -4% | |||
Serbia | - | 579 | - | - | - | - | |||
Lithuania | 798 | 806 | -1% | 798 | 806 | -1% | |||
Croatia | 1,107 | 1,106 | 0% | 1,107 | 1,106 | 0% | |||
Czech Republic | 788 | 826 | -5% | 788 | 826 | -5% | |||
Office | 5 | 3 | 74% | 5 | 3 | 74% | |||
Slovakia | 2 | 3 | -15% | 2 | 3 | -15% | |||
Bulgaria | 3 | 0 | 0% | 3 | 0 | 0% | |||
Industrial | - | - | - | - | - | - | |||
Romania | - | - | - | - | - | - | |||
Total | 28,455 | 30,895 | -8% | 24,374 | 25,734 | -5% | |||
Waste-Abs, Waste-LfL | Tonnes | Recycled | Retail | 13,685 | 13,545 | 1% | 11,756 | 11,649 | 1% |
Romania | 5,327 | 5,555 | -4% | 4,882 | 5,106 | -4% | |||
Poland | 4,962 | 4,477 | 11% | 3,479 | 3,214 | 8% | |||
Slovakia | 700 | 641 | 9% | 700 | 641 | 9% | |||
Bulgaria | 854 | 800 | 7% | 854 | 800 | 7% | |||
Hungary | 495 | 542 | -9% | 495 | 542 | -9% | |||
Serbia | - | 184 | - | - | - | - | |||
Lithuania | 246 | 255 | -3% | 246 | 255 | -3% | |||
Croatia | 737 | 787 | -6% | 737 | 787 | -6% | |||
Czech Republic | 364 | 305 | 19% | 364 | 305 | 19% | |||
Office | 5 | 3 | 98% | 5 | 3 | 98% | |||
Slovakia | 2 | 2 | -3% | 2 | 2 | -3% | |||
Bulgaria | 3 | 0 | 0% | 3 | 0.3 | 0% | |||
Industrial | - | - | - | - | - | - | |||
Romania | - | - | - | - | - | - | |||
Total | 13,690 | 13,548 | 1% | 11,761 | 11,652 | 1% | |||
Waste-Abs, Waste-LfL | Tonnes | Landfill | Retail | 14,062 | 16,565 | -15% | 11,910 | 13,299 | -10% |
Romania | 5,493 | 6,111 | -10% | 4,897 | 5,464 | -10% | |||
Poland | 3,783 | 5,041 | -25% | 2,227 | 2,817 | -21% | |||
Slovakia | 857 | 970 | -12% | 857 | 970 | -12% | |||
Bulgaria | 1,797 | 1,864 | -4% | 1,797 | 1,864 | -4% | |||
Hungary | 786 | 792 | -1% | 786 | 792 | -1% | |||
Serbia | - | 395 | - | - | - | - | |||
Lithuania | 552 | 551 | 0% | 552 | 551 | 0% | |||
Croatia | 370 | 320 | 16% | 370 | 320 | 16% | |||
Czech Republic | 424 | 521 | -19% | 424 | 521 | -19% | |||
Office | - | 0 | - | - | 0 | - | |||
Slovakia | - | 0 | - | - | 0 | - | |||
Bulgaria | - | - | - | - | - | - | |||
Industrial | - | - | - | - | - | - | |||
Romania | - | - | - | - | - | - | |||
Total | 14,062 | 16,565 | -15% | 11,910 | 13,300 | -10% | |||
Waste-Abs, Waste-LfL | Tonnes | Other recovery operations | Retail | 703 | 782 | -10% | 703 | 782 | -10% |
Romania | 703 | 782 | -10% | 703 | 782 | -10% | |||
Poland | - | - | - | - | - | - | |||
Slovakia | - | - | - | - | - | - | |||
Bulgaria | - | - | - | - | - | - | |||
Hungary | - | - | - | - | - | - | |||
Serbia | - | - | - | - | - | - | |||
Lithuania | - | - | - | - | - | - | |||
Croatia | - | - | - | - | - | - | |||
Czech Republic | - | - | - | - | - | - | |||
Office | - | - | - | - | - | - | |||
Slovakia | - | - | - | - | - | - | |||
Bulgaria | - | - | - | - | - | - | |||
Industrial | - | - | - | - | - | - | |||
Romania | - | - | - | - | - | - | |||
Total | 703 | 782 | -10% | 703 | 782 | -10% | |||
Waste-Abs, Waste-LfL | % | Total weight of waste generated - Non-Hazardous | Retail | 100% | 100% | 0% | 100% | 100% | 0% |
Romania | 100% | 100% | 0% | 100% | 100% | 0% | |||
Poland | 100% | 100% | 0% | 100% | 100% | 0% | |||
Slovakia | 100% | 100% | 0% | 100% | 100% | 0% | |||
Bulgaria | 100% | 100% | 0% | 100% | 100% | 0% | |||
Hungary | 100% | 100% | 0% | 100% | 100% | 0% | |||
Serbia | - | 100% | - | - | 100% | - | |||
Lithuania | 100% | 100% | 0% | 100% | 100% | 0% | |||
Croatia | 100% | 100% | 0% | 100% | 100% | 0% | |||
Czech Republic | 100% | 100% | 0% | 100% | 100% | 0% | |||
Office | 100% | 100% | 0% | 100% | 100% | 0% | |||
Slovakia | 100% | 100% | 0% | 100% | 100% | 0% | |||
Bulgaria | 100% | 100% | 0% | 100% | 100% | 0% | |||
Industrial | - | - | - | - | - | - | |||
Romania | - | - | - | - | - | - | |||
Total | 100% | 100% | 0% | 100% | 100% | 0% | |||
Waste-Abs, Waste-LfL | % | Recycled | Retail | 48% | 44% | 10% | 48% | 45% | 7% |
Romania | 46% | 45% | 4% | 47% | 45% | 4% | |||
Poland | 57% | 47% | 21% | 61% | 53% | 14% | |||
Slovakia | 45% | 40% | 13% | 45% | 40% | 13% | |||
Bulgaria | 32% | 30% | 7% | 32% | 30% | 7% | |||
Hungary | 39% | 41% | -5% | 39% | 41% | -5% | |||
Serbia | - | 32% | - | - | 0% | - | |||
Lithuania | 31% | 32% | -3% | 31% | 32% | -3% | |||
Croatia | 67% | 71% | -6% | 67% | 71% | -6% | |||
Czech Republic | 46% | 37% | 25% | 46% | 37% | 25% | |||
Office | 100% | 88% | 14% | 100% | 88% | 14% | |||
Slovakia | 100% | 87% | 15% | 100% | 87% | 15% | |||
Bulgaria | 100% | 100% | 0% | 100% | 100% | 0% | |||
Industrial | 0% | 0% | - | 0% | 0% | - | |||
Romania | 0% | 0% | - | 0% | 0% | - | |||
Total | 48% | 44% | 10% | 48% | 45% | 7% | |||
Waste-Abs, Waste-LfL | % | Landfill | Retail | 49% | 54% | -8% | 49% | 52% | -5% |
Romania | 48% | 49% | -3% | 47% | 48% | -3% | |||
Poland | 43% | 53% | -18% | 39% | 47% | -16% | |||
Slovakia | 55% | 60% | -9% | 55% | 60% | -9% | |||
Bulgaria | 68% | 70% | -3% | 68% | 70% | -3% | |||
Hungary | 61% | 59% | 3% | 61% | 59% | 3% | |||
Serbia | - | 68% | - | - | - | - | |||
Lithuania | 69% | 68% | 1% | 69% | 68% | 1% | |||
Croatia | 33% | 29% | 16% | 33% | 29% | 16% | |||
Czech Republic | 54% | 63% | -15% | 54% | 63% | -15% | |||
Office | 0% | 12% | - | 0% | 12% | - | |||
Slovakia | 0% | 13% | - | 0% | 13% | - | |||
Bulgaria | 0% | 0% | - | 0% | 0% | - | |||
Industrial | 0% | 0% | - | 0% | 0% | - | |||
Romania | 0% | 0% | - | 0% | 0% | - | |||
Total | 49% | 54% | -8% | 49% | 52% | -5% | |||
Waste-Abs, Waste-LfL | % | Other recovery operations | Retail | 3% | 2% | 50% | 3% | 3% | -5% |
Romania | 6% | 6% | -3% | 7% | 7% | -3% | |||
Poland | 0% | 0% | - | 0% | 0% | - | |||
Slovakia | 0% | 0% | - | 0% | 0% | - | |||
Bulgaria | 0% | 0% | - | 0% | 0% | - | |||
Hungary | 0% | 0% | - | 0% | 0% | - | |||
Serbia | - | 0% | - | - | - | - | |||
Lithuania | 0% | 0% | - | 0% | 0% | - | |||
Croatia | 0% | 0% | - | 0% | 0% | - | |||
Czech Republic | 0% | 0% | - | 0% | 0% | - | |||
Office | 0% | 0% | - | 0% | 0% | - | |||
Slovakia | 0% | 0% | - | 0% | 0% | - | |||
Bulgaria | 0% | 0% | - | 0% | 0% | - | |||
Industrial | 0% | 0% | - | 0% | 0% | - | |||
Romania | 0% | 0% | - | 0% | 0% | - | |||
Total | 3% | 2% | 50% | 3% | 3% | -5% | |||
No. of applicable properties | 60 | 61 | 56 | 56 | |||||
m2 of applicable properties | 4,760,259 | 4,844,068 | 4,257,935 | 4,257,935 | |||||
% Proportion of waste estimated | 0% | 0% | 0% | 0% | |||||
100% of waste reported is non-hazardous waste. Recycling rate has increased in 2025 The amount of waste generated by the Group increased, however the Company managed to increase the recycling rate. Recycling now accounts for 48% of waste, a 10% increase since 2024. Waste to landfill decreased, indicating that NEPI Rockcastle is making progress in its targets to promote a circular economy.
CERTIFICATIONS | 2025 | 2024 | 2025 vs 2024 | |||
|---|---|---|---|---|---|---|
Cert-Tot | % | % Portfolio Certified | Retail | 76% | 75% | 1% |
Romania | 89% | 87% | 2% | |||
Poland | 76% | 75% | 2% | |||
Slovakia | 56% | 54% | 3% | |||
Bulgaria | 59% | 59% | 0% | |||
Hungary | 55% | 55% | 0% | |||
Serbia | - | 78% | - | |||
Lithuania | 76% | 76% | 0% | |||
Croatia | 53% | 53% | 0% | |||
Czech Republic | 78% | 77% | 0% | |||
Office | 84% | 84% | 0% | |||
Slovakia | 108% | 108% | 0% | |||
Bulgaria | 75% | 75% | 0% | |||
Industrial | 98% | 99% | 0% | |||
Romania | 98% | 99% | 0% | |||
Total | 76% | 75% | 1% | |||
% | EPC A | Retail | 34% | 28% | 20% | |
Romania | 81% | 73% | 12% | |||
Poland | 0% | 0% | 0% | |||
Slovakia | 51% | 23% | 122% | |||
Bulgaria | 0% | 0% | 0% | |||
Hungary | 0% | 0% | 0% | |||
Serbia | - | 0% | - | |||
Lithuania | 0% | 0% | 0% | |||
Croatia | 53% | 53% | 0% | |||
Czech Republic | 0% | 0% | 0% | |||
Office | 29% | 29% | 0% | |||
Slovakia | 108% | 108% | 0% | |||
Bulgaria | 0% | 0% | 0% | |||
Industrial | 0% | 0% | 0% | |||
Romania | 0% | 0% | 0% | |||
Total | 33% | 28% | 20% | |||
% | EPC B | Retail | 6% | 8% | -31% | |
Romania | 8% | 11% | -30% | |||
Poland | 0% | 0% | 0% | |||
Slovakia | 5% | 31% | -85% | |||
Bulgaria | 4% | 4% | 0% | |||
Hungary | 14% | 14% | 0% | |||
Serbia | - | 0% | - | |||
Lithuania | 0% | 0% | 0% | |||
Croatia | 0% | 0% | 0% | |||
Czech Republic | 48% | 48% | 0% | |||
Office | 55% | 55% | 0% | |||
Slovakia | 0% | 0% | 0% | |||
Bulgaria | 75% | 75% | 0% | |||
Industrial | 97% | 98% | 0% | |||
Romania | 97% | 98% | 0% | |||
Total | 7% | 10% | -28% | |||
% | EPC C | Retail | 8% | 11% | -25% | |
Romania | 0% | 4% | -100% | |||
Poland | 0% | 0% | 0% | |||
Slovakia | 0% | 0% | 0% | |||
Bulgaria | 56% | 56% | 0% | |||
Hungary | 7% | 7% | 0% | |||
Serbia | - | 78% | - | |||
Lithuania | 76% | 76% | 0% | |||
Croatia | 0% | 0% | 0% | |||
Czech Republic | 29% | 29% | 1% | |||
Office | 0% | 0% | 0% | |||
Slovakia | 0% | 0% | 0% | |||
Bulgaria | 0% | 0% | 0% | |||
Industrial | 0% | 0% | 0% | |||
Romania | 0% | 0% | 0% | |||
Total | 8% | 11% | -25% | |||
% | EPC D | Retail | 2% | 2% | 2% | |
Romania | 0% | 0% | 0% | |||
Poland | 0% | 0% | 0% | |||
Slovakia | 0% | 0% | 0% | |||
Bulgaria | 0% | 0% | 0% | |||
Hungary | 31% | 31% | 0% | |||
Serbia | - | 0% | - | |||
Lithuania | 0% | 0% | 0% | |||
Croatia | 0% | 0% | 0% | |||
Czech Republic | 0% | 0% | 0% | |||
Office | 0% | 0% | 0% | |||
Slovakia | 0% | 0% | 0% | |||
Bulgaria | 0% | 0% | 0% | |||
Industrial | 1% | 1% | 20% | |||
Romania | 1% | 1% | 20% | |||
Total | 2% | 2% | 2% | |||
% | EPC E | Retail | 0% | 0% | 2% | |
Romania | 0% | 0% | 0% | |||
Poland | 0% | 0% | 0% | |||
Slovakia | 0% | 0% | 0% | |||
Bulgaria | 0% | 0% | 0% | |||
Hungary | 3% | 3% | 0% | |||
Serbia | - | 0% | - | |||
Lithuania | 0% | 0% | 0% | |||
Croatia | 0% | 0% | 0% | |||
Czech Republic | 0% | 0% | 0% | |||
Office | 0% | 0% | 0% | |||
Slovakia | 0% | 0% | 0% | |||
Bulgaria | 0% | 0% | 0% | |||
Industrial | 0% | 0% | 0% | |||
Romania | 0% | 0% | 0% | |||
Total | 0% | 0% | 2% | |||
% | EPC Poland | Retail | 26% | 25% | 3% | |
Romania | 0% | 0% | 0% | |||
Poland | 76% | 75% | 2% | |||
Slovakia | 0% | 0% | 0% | |||
Bulgaria | 0% | 0% | 0% | |||
Hungary | 0% | 0% | 0% | |||
Serbia | 0% | 0% | 0% | |||
Lithuania | 0% | 0% | 0% | |||
Croatia | 0% | 0% | 0% | |||
Czech Republic | 0% | 0% | 0% | |||
Office | 0% | 0% | 0% | |||
Slovakia | 0% | 0% | 0% | |||
Bulgaria | 0% | 0% | 0% | |||
Industrial | 0% | 0% | 0% | |||
Romania | 0% | 0% | 0% | |||
Total | 25% | 25% | 3% | |||
% | Percentage of rental income from BREEAM certified assets | Retail | 100% | 100% | 0% | |
Romania | 100% | 100% | 0% | |||
Poland | 100% | 100% | 0% | |||
Slovakia | 100% | 100% | 0% | |||
Bulgaria | 100% | 100% | 0% | |||
Hungary | 100% | 100% | 0% | |||
Serbia | - | 100% | - | |||
Lithuania | 100% | 100% | 0% | |||
Croatia | 100% | 100% | 0% | |||
Czech Republic | 100% | 100% | 0% | |||
Office | 100% | 100% | 0% | |||
Slovakia | 100% | 100% | 0% | |||
Bulgaria | 100% | 100% | 0% | |||
Industrial | 0% | 0% | 0% | |||
Romania | 0% | 0% | 0% | |||
Total | 100% | 100% | 0% | |||
% | Outstanding | Retail | 3% | 0% | 0% | |
Romania | 1% | 0% | 0% | |||
Poland | 8% | 0% | 0% | |||
Slovakia | 0% | 0% | 0% | |||
Bulgaria | 0% | 0% | 0% | |||
Hungary | 0% | 0% | 0% | |||
Serbia | - | 0% | - | |||
Lithuania | 0% | 0% | 0% | |||
Croatia | 0% | 0% | 0% | |||
Czech Republic | 0% | 0% | 0% | |||
Office | 0% | 0% | 0% | |||
Slovakia | 0% | 0% | 0% | |||
Bulgaria | 0% | 0% | 0% | |||
Industrial | 0% | 0% | 0% | |||
Romania | 0% | 0% | 0% | |||
Total | 3% | 0% | 0% | |||
% | Excellent | Retail | 85% | 86% | -1% | |
Romania | 91% | 92% | -1% | |||
Poland | 92% | 96% | -5% | |||
Slovakia | 30% | 21% | 41% | |||
Bulgaria | 100% | 100% | 0% | |||
Hungary | 0% | 0% | 0% | |||
Serbia | - | 100% | - | |||
Lithuania | 100% | 100% | 0% | |||
Croatia | 100% | 100% | 0% | |||
Czech Republic | 100% | 100% | 0% | |||
Office | 69% | 100% | -31% | |||
Slovakia | 0% | 100% | -100% | |||
Bulgaria | 100% | 100% | 0% | |||
Industrial | 0% | 0% | 0% | |||
Romania | 0% | 0% | 0% | |||
Total | 85% | 86% | -2% | |||
% | Very Good | Retail | 10% | 11% | -14% | |
Romania | 8% | 8% | 0% | |||
Poland | 0% | 3% | -100% | |||
Slovakia | 70% | 79% | -11% | |||
Bulgaria | 0% | 0% | 0% | |||
Hungary | 53% | 53% | 0% | |||
Serbia | - | 0% | - | |||
Lithuania | 0% | 0% | 0% | |||
Croatia | 0% | 0% | 0% | |||
Czech Republic | 0% | 0% | 0% | |||
Office | 31% | 0% | 0% | |||
Slovakia | 100% | 0% | 0% | |||
Bulgaria | 0% | 0% | 0% | |||
Industrial | 0% | 0% | 0% | |||
Romania | 0% | 0% | 0% | |||
Total | 10% | 11% | -10% | |||
% | Good | Retail | 3% | 3% | -2% | |
Romania | 0% | 0% | 0% | |||
Poland | 0% | 0% | 0% | |||
Slovakia | 0% | 0% | 0% | |||
Bulgaria | 0% | 0% | 0% | |||
Hungary | 47% | 47% | 0% | |||
Serbia | - | 0% | - | |||
Lithuania | 0% | 0% | 0% | |||
Croatia | 0% | 0% | 0% | |||
Czech Republic | 0% | 0% | 0% | |||
Office | 0% | 0% | 0% | |||
Slovakia | 0% | 0% | 0% | |||
Bulgaria | 0% | 0% | 0% | |||
Industrial | 0% | 0% | 0% | |||
Romania | 0% | 0% | 0% | |||
Total | 2% | 3% | -2% | |||
The Company is committed to enhancing the sustainability performance of its buildings from both a structural and operational standpoint. This is achieved by evaluating and certifying the buildings sustainability based on BREEAM methodology, covering various aspects such as climate change, energy and water use, health and wellbeing, pollution, transportation, materials, waste management, ecology and biodiversity, management processes. 100% of rental income from eligible properties (excluding retail parks and industrial) is sourced from BREEAM certified assets. NEPI Rockcastle has a self-imposed target to achieve BREEAM in-use to a minimum standard of ‘Very Good’. The Company also obtains Energy performance certificates for all its properties. The indicators above is based on total area coverage, with some parts of some buildings not in scope of certification, based on local regulations.
Own operations – corporate offices | ||||
|---|---|---|---|---|
EPRA Code | Units of Measurement | 2025 | 2024 | 2025 vs 2024 (%) |
Elec-Abs | MWH | 1,111 | 670 | 66% |
District Heating-Abs | MWH | 236 | 75 | 214% |
Fuel-Abs | MWH | 196 | 85 | 132% |
Energy-Int | kWh/m²/year | 586 | 315 | 86% |
GHG-Indinr-Abs | MT CO2e | 592 | 232 | 155% |
Water-Abs | m³ | 1,400 | 1,538 | -9% |
Notes: | |
1 | The data reported covers 60 income producing properties (under operational and financial control) and all of its staff. The portfolio comprises of 57 retail properties, 2 office buildings and 1 industrial property (classified as held for sale), where the Group has operational and financial control. The report includes utility data for the Serbian property sold by the Group in October 2024, covering the period during which it was under the Group’s ownership. Control is understood as the legal capacity to monitor and make decisions on supply chain management, utilities consumption and facilities management. This excludes any area over which the tenant has full control in terms of monitoring consumption and payment |
2 | The Group incorporates in this report data pertaining to every environmental aspect across all properties under its control, as delineated in the organisational boundaries. There are still some limited cases where the Group does not have access to tenant managed utilities. In these cases, NEPI Rockcastle has not carried out estimations and all data presented in the tables above is comprised of actual data (meter readings, invoices, supplier estimates) |
3 | Areas are adjusted to reflect a weighted average for the period the assets were owned by the Company (applicable for investment and divestment activities) |
4 | Slight differences in totals may exist due to rounding |
EPRA Sustainability Performance Measures (Social)
Impact area | EPRA Code | Units of measure | Indicator | Category | Corporate performance | |||
|---|---|---|---|---|---|---|---|---|
2025 | 2024 | |||||||
Male | Female | Male | Female | |||||
Diversity | Diversity-Emp | Number | Gender diversity | Proportion of male and female employees | 217 | 470 | 203 | 447 |
Gender by level | Board | 8 | 3 | 7 | 2 | |||
Managerial and Subject matter experts1 | 84 | 140 | 80 | 129 | ||||
Non-managerial Employees | 133 | 330 | 123 | 318 | ||||
Number | Number of governing bodies by age range | Over 50 years old | 75 | 78 | ||||
30 - 50 years old | 534 | 495 | ||||||
Under 30 years old | 78 | 77 | ||||||
Diversity-Pay | Ratio % | Male and female remuneration by level | Managerial and Subject matter experts | 30 | 33 | |||
Non-managerial Employees | 21 | 23 | ||||||
- Exco included
Impact area | EPRA Code | Units of measure | Indicator | Category | Corporate performance | |||
|---|---|---|---|---|---|---|---|---|
2025 | 2024 | |||||||
Male | Female | Male | Female | |||||
Employees | Emp-Training | Number of hours | Total hours of training | All employees | 30,825 | 25,900 | ||
7,700 | 19,374 | 6,395 | 17,794 | |||||
Average hours of training undertaken by employees in the reporting period (per employee) | All employees | 44.9 | 39.8 | |||||
36.7 | 38.6 | 30.6 | 39.5 | |||||
Emp-Dev | % of employees | Employees receiving performance appraisals | Total % | 97% | 92% | |||
Emp-Turnover | Number of employees | Direct employees | Total number of employees | 217 | 470 | 203 | 447 | |
Total number of new hires | 33 | 72 | 51 | 112 | ||||
Rate of new hires in % | 15% | 25% | ||||||
Total turnover (departures) | 41 | 39 | 45 | 46 | ||||
Total rate of turnover (departures) | 12% | 14% | ||||||
Impact area | EPRA Code | Units of measure | Indicator | Category | Corporate performance | |
|---|---|---|---|---|---|---|
2025 | 2024 | |||||
Health and Safety | H&S-Emp | Per 100,000 hours worked | Injury rate | Direct employees | 0.11 | 0 |
Per 100,000 hours worked | Lost day rate | Direct employees | 6.67 | 0 | ||
Days per employee | Absentee rate | Direct employees | 1.71 | 1.93 | ||
Accident Severity Rate1 | Direct employees | 0 | 0 | |||
Total number | Fatalities | Direct employees | 0 | 0 | ||
- Data included in Lost day rate
Percentage of centres that organised local initiatives | |||
|---|---|---|---|
Territory | EPRA code | 2025 | 2024 |
Romania | Comty-Eng | 100% | 100% |
Poland | 100% | 100% | |
Slovakia | 100% | 100% | |
Bulgaria | 100% | 100% | |
Hungary | 100% | 100% | |
Serbia | 100% | 100% | |
Lithuania | 100% | 100% | |
Croatia | 100% | 100% | |
Czech Republic | 100% | 100% | |
Total | 100% | 100% | |
Impact area | EPRA Code | Units of measure | Indicator | Category | Corporate performance | |
|---|---|---|---|---|---|---|
2025 | 2024 | |||||
Community | Comty-Eng | % | % of assets | Community engagement, impact assessments and development programmes | 100% | 100% |
EPRA Sustainability Performance Measures (Governance)
Impact area | EPRA Code | Units of measure | Indicator | Category | Corporate performance | |||
|---|---|---|---|---|---|---|---|---|
2025 | 2024 | |||||||
Male | Female | Male | Female | |||||
Board | Gov-Board | Total number | Board composition | Composition of highest governance body | 12 | 12 | ||
Executive | 2 | 1 | 2 | 1 | ||||
Non-Executive (members) | 7 | 2 | 7 | 2 | ||||
Average tenure in years | 5.8 | 4.8 | ||||||
Total non-Executives with environmental and social competencies | 2 | 2 | ||||||
% | Proportion of | Total non-Executives with environmental and social competencies | 22% | 22% | ||||
Gov-Selec | Narrative | Board selection | In accordance with the Articles of Association, Directors are appointed, suspended or removed by the shareholders. Appointment is made based on the Board’s binding nomination, which can be deprived of its binding character by the shareholders decision. The Board can suspend Executive Directors, while the suspension can be lifted by the shareholders. To facilitate the Board’s regular refreshing, the Group has a retiring-by-rotation policy, which means that each year, at least one third of the Directors retire by rotation and may stand for re-appointment by the shareholders. Therefore, within a three-year period, all Directors retire at least once. The Board appointments are conducted in a formal and transparent manner following recommendations made by the Nomination Committee to the Board. Candidates’ profiles are carefully analysed and the Board considers whether they have the necessary background, experience, competencies, independence and diversity, as set out in the Board Profile Paper and in the Group Diversity Policy. High-profile and experienced recruitment agencies may be used to identify and assess new Director candidates, based on the decision of the Nomination Committee. The candidates’ background and references are analysed, and multiple information sources are used for the assessment. The independence of every newly proposed Director is assessed by the Nomination Committee and presented to the Board, as well as reassessed annually, based on clear criteria defined in the Corporate Governance Framework, formalised and approved by the Board. A formal onboarding programme is in place when new Directors join the Company, under the close coordination of the Chairman of the Board, with support from the CEO and the Company Secretary. The onboarding programme is designed to help the new Director become familiar with the Group’s business, strategy, policies and structure, as well as the operational approach in the Board and Committees activity. The programme covers general financial, social and legal affairs and financial reporting, as well as aspects that are specific to the Group and its business. | |||||
Impact area | EPRA Code | Units of measure | Indicator | Category | Corporate performance |
|---|---|---|---|---|---|
Conflicts of interest | Gov-COI | Narrative | Conflicts of Interest | Dealing in Company’s securities by Directors, their associates and key Group employees, is regulated and monitored in accordance with the applicable stock exchange listing requirements, guidelines, legislation, regulations and directives. To prevent the risk of insider trading and to ensure that none of the restricted persons abuse, and do not place themselves under suspicion of abusing inside privileged information, the Group has adopted a formal Dealing Code, available and communicated to all employees and Directors. The Dealing Code sets out obligations for the Group’s Directors, managers, staff and persons closely associated with them, under the Market Abuse Regulation and stock exchange listing requirements and guidelines, regarding clearance to deal and notification of transactions in the Group’s securities. The Group prohibits all Directors and employees from using confidential information, not generally known or available to the public, for personal benefit. NEPI Rockcastle maintains a closed period from the end of a financial period until publication of the financial results for that period and a prohibited period when sensitive information not yet publicly available is known by the Company’s employees or Directors. The Group announces closed and other prohibited periods to its employees and the Company’s Directors, and, during such periods, all those with insider knowledge are banned from dealing. In compliance with JSE Listings Requirements, the Company announces publicly all its Directors’ dealings in the Company’s securities, through SENS. Directors’ and Directors’ associates interests are disclosed in line with the Declaration of Interests Policy. Directors’ direct and indirect holdings as of year-end are published in the Annual Report. Moreover, the Group formalised its Related party transactions policy, in line with JSE Listings Requirements and applicable international accounting standards. According to the Group Code of Ethics, Board members are alert to conflicts of interest and ethical conduct and should generally refrain from the following:
Potential conflicts of interest related to topics on the agenda are checked at each Board and Committee meeting. Any potential conflict of interest would be declared and discussed in the Board meeting. The Board needs to decide on the measures to be implemented and the degree of further involvement of the respective Director in the matter at hand. Any actual conflict of interest deemed significant by the Board during the year would be disclosed in the Annual Report. Such information considers, but is not limited to, related party transactions and cross-shareholdings. Related party transactions will be entered into, only if beneficial to the Group entities and on the customary market terms that they would have been concluded with an independent party (arm’s length principle). The Group ensures that identification, negotiation, conclusion of related party transactions by Group entities are governed by:
No actual conflicts of interest have been identified in 2024 and no related party transactions, as defined in the internal policy, have been carried out by the Group entities, besides those detailed in the Related party transactions note (described in the Remuneration review section). |
NEPI Rockcastle is able to contribute positively towards the United Nations Sustainable Development Goals. The Global Goals are a set of 17 interlinked goals adopted by the United Nations General Assembly in 2015, with the aim of ending poverty, protecting the planet, and ensuring peace and prosperity for all by the year 2030. The areas in which NEPI Rockcastle makes a positive difference include:
Goal | Description (as per UN public information) | |
|---|---|---|
 | Goal 3: Good health and wellbeing | To ensure healthy lives and promote wellbeing for all at all ages |
 | Goal 4: Quality education | Ensure inclusive and equitable quality education and promote lifelong learning opportunities for all |
 | Goal 6: Clean water and sanitation | More efficient use and management of water are critical to addressing the growing demand for water, threats to water security and the increasing frequency and severity of droughts and floods resulting from climate change |
 | Goal 7: Affordable and clean energy | Encourage public and private investments in energy technologies. Promote better regulatory frameworks and innovative business models to transform the world's energy systems |
 | Goal 8: Decent work and economic growth | Sustainable economic growth will require societies to create the conditions that allow people to have quality jobs and stimulate the economy, while not harming the environment. Job opportunities and decent working conditions are advocated |
 | Goal 9: Industry, innovation, and infrastructure | Technological progress is the foundation of efforts to achieve environmental objectives, such as increased resource and energy efficiency |
 | Goal 11: Sustainable cities and communities | Rapid urbanisation challenges, such as the safe removal and management of solid waste within cities, can be overcome in ways that allow them to continue to thrive and grow, while improving resource use and reducing pollution and poverty |
 | Goal 12: Responsible consumption and production | Economic and social progress over the last century has been accompanied by environmental degradation that is endangering the very systems on which our future development and very survival depend. Sustainable consumption and production refer to “the use of services and related products, which respond to basic needs and bring a better quality of life while minimising the use of natural resources and toxic materials as well as the emissions of waste and pollutants over the life cycle of the service or product so as not to jeopardise the needs of future generations” |
 | Goal 13: Climate action | Climate change is a global challenge that does not respect national borders. It is an issue that requires solutions that need to be coordinated at the international level to help developing countries move towards a low-carbon economy |
 | Goal 15: Life on land | Deforestation and desertification caused by human activities and climate change pose major challenges to sustainable development and have affected the lives and livelihoods of millions of people in the fight against poverty |

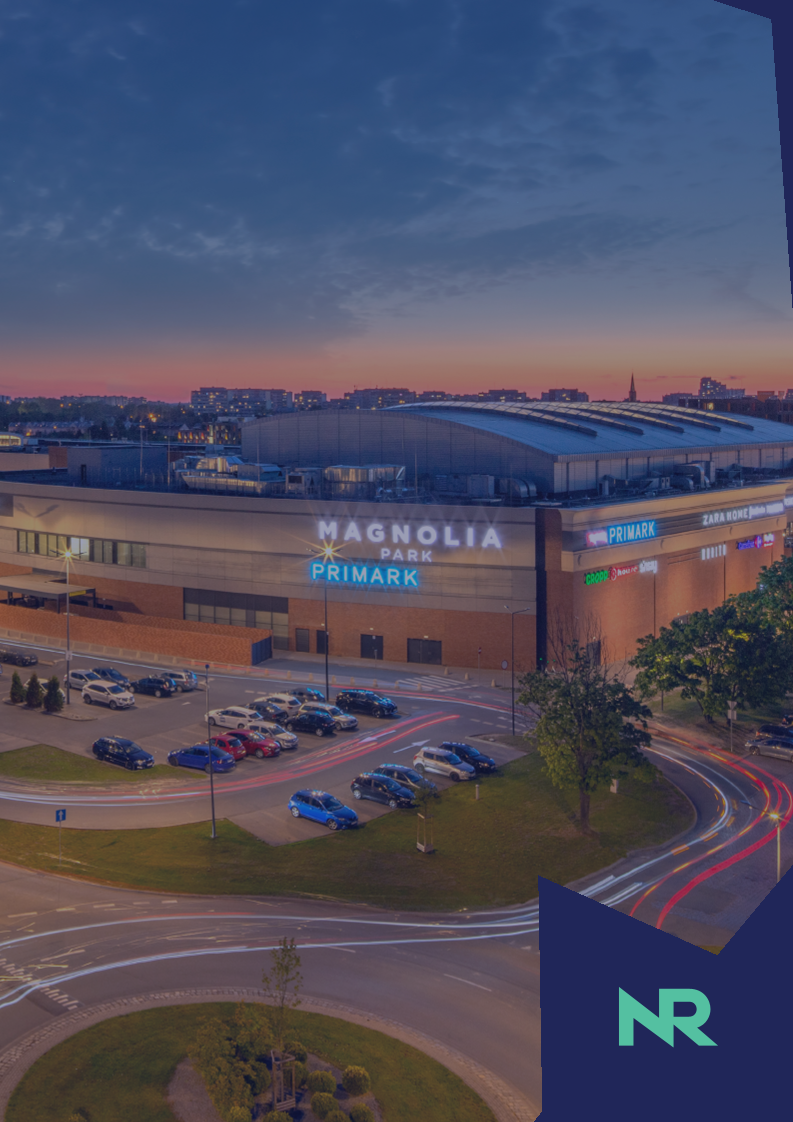
Statement of Directors’ responsibilities
The Directors are responsible for preparing the Financial Statements in accordance with applicable laws and regulations.
The Directors have prepared the Financial Statements in accordance with IFRS Accounting Standards as issued by the International Accounting Standards Board ("IASB"), the SAICA Financial Reporting Guides as issued by the Accounting Practices Committee, Financial Pronouncements as issued by the Financial Reporting Standards Council, the JSE Requirements, IFRS Accounting Standards as adopted by the European Union and with Title 9 of Book 2 of the Dutch Civil Code.
In preparing the Financial Statements, the Directors are responsible for:
selecting suitable accounting policies and then applying them consistently;
stating whether they have been prepared in accordance with IFRS Accounting Standards;
making judgements and accounting estimates that are reasonable and prudent; and
preparing the Financial Statements on the going concern basis unless it is inappropriate to presume that the Group and the Company will continue in business.
Each of the directors, whose names are stated below, hereby confirm that:
the annual Financial Statements set out on pages 310 to 376 fairly present in all material respects the financial position, financial performance and cash flows of the issuer in terms of IFRS Accounting Standards;
to the best of our knowledge and belief, no facts have been omitted or untrue statements made that would make the annual financial statements false or misleading;
internal financial controls have been put in place to ensure that material information relating to the issuer and its consolidated subsidiaries have been provided to effectively prepare the financial statements of the issuer;
the internal financial controls are adequate and effective and can be relied upon in compiling the annual financial statements, having fulfilled our role and function as executive directors with primary responsibility for implementation and execution of controls;
where we are not satisfied, we have disclosed to the audit committee and the auditors any deficiencies in design and operational effectiveness of the internal financial controls and have taken steps to remedy the deficiencies; and
we are not aware of any fraud involving directors.
With reference to Section 5:25c paragraph 2, sub c of the Financial Markets Supervision Act (Wet op het financieel toezicht), the Board declares that to the best of its knowledge:
The financial statements provide a true and fair view of the assets, liabilities, financial position and profit or loss of NEPI Rockcastle N.V. and of the companies included in the consolidation taken as a whole;
The directors' report provides a true and fair view of the situation on the balance sheet date and of the developments during the financial year of NEPI Rockcastle N.V. and of its affiliated companies whose information has been included in the financial statements, together with a description of the main risks NEPI Rockcastle N.V. faces.
The Directors are responsible for keeping proper accounting records that are sufficient to show and explain the Group’s transactions and disclose with reasonable accuracy at any time the financial position of the Group and the Company. They are also responsible for safeguarding the assets of the Group and hence for taking reasonable steps for the prevention and detection of fraud and other irregularities.
The Directors are responsible for the maintenance and integrity of the corporate and financial information included on the Group’s website.
The Financial Statements on pages 310 to 376 were approved by the Board of Directors on 17 March 2026, authorised for publication on 18 March 2026 and signed on its behalf by:
Rüdiger Dany | Eliza Predoiu |
|---|---|
Chief Executive Officer | Chief Financial Officer |
Consolidated Financial Statements for the year ended 31 December 2025
Consolidated Statement of financial position
in € thousand | Note | 31 Dec 2025 | 31 Dec 2024 |
|---|---|---|---|
ASSETS | |||
Non-current assets | |||
Investment property | |||
Investment property in use | |||
Investment property under development | |||
Goodwill | |||
Deferred tax assets | |||
Property, plant and equipment | |||
Other long-term assets | |||
Derivative financial assets at fair value through profit or loss | |||
Current assets | |||
Trade and other receivables | |||
Inventory property | |||
Cash and cash equivalents | |||
Derivative financial assets at fair value through profit or loss | |||
Assets held for sale | |||
TOTAL ASSETS | |||
EQUITY AND LIABILITIES | |||
TOTAL SHAREHOLDERS' EQUITY | |||
Equity attributable to equity holders | |||
Share capital | |||
Share premium | |||
Other reserves | ( | ( | |
Treasury shares | ( | ||
Accumulated profit | |||
Total liabilities | |||
Non-current liabilities | |||
Bank loans | |||
Bonds | |||
Deferred tax liabilities | |||
Lease liabilities | |||
Other long-term liabilities | |||
Current liabilities | |||
Trade and other payables | |||
Income tax payable | |||
Bank loans | |||
Bonds | |||
Lease liabilities | |||
TOTAL EQUITY AND LIABILITIES | |||
Net Asset Value per share (euro) | |||
EPRA Net Reinstatement Value per share (euro)1 | |||
Number of shares for Net Asset Value/EPRA Net Reinstatement Value |
- EPRA Net Reinstatement Value per share (alternative performance measure) is Net Asset Value per share adjusted for the effect of non-monetary balance sheet items, such as deferred tax, goodwill, and interest rate derivatives.
- Excludes 1,640,511 treasury shares as at 31 December 2025. For further details please see Note 17.
Consolidated Statement of comprehensive income
in € thousand | Note | 31 Dec 2025 | 31 Dec 2024 |
|---|---|---|---|
Gross rental income | |||
Service charge income | |||
Property operating expenses | ( | ( | |
Revenue from energy activity | |||
Costs of the energy activity | ( | ||
Net rental and related income | |||
Administrative expenses | ( | ( | |
Revenue from sales of inventory property | |||
Cost of sales of inventory property | ( | ( | |
EBIT1 | |||
Fair value adjustments of investment property | |||
Foreign exchange loss | ( | ( | |
Gain on disposal of assets held for sale | |||
Profit before net finance costs and other items | |||
Finance income | |||
Finance costs | ( | ( | |
Bank charges, commissions, and fees | ( | ( | |
Losses on extinguishment of financial instruments | ( | ||
Fair value adjustments of derivatives | ( | ( | |
Profit before tax | |||
Income tax expense | ( | ( | |
Current tax expense | ( | ( | |
Deferred tax expense | ( | ( | |
Profit after tax | |||
Total comprehensive income for the year | |||
Profit attributable to: | |||
Equity holders of the parent | |||
Total comprehensive income attributable to: | |||
Equity holders of the parent | |||
Basic weighted average number of shares | |||
Diluted weighted average number of shares | |||
Basic earnings per share (euro cents) attributable to equity holders | |||
Diluted earnings per share (euro cents) attributable to equity holders |
- EBIT (Earnings Before Interest and Taxes) represents the Group's Operating profit, defined as Net rental and related income plus Revenue from sales of inventory property less Cost of sales of inventory property, less Administrative expenses (Depreciation and Amortisation are included in Administrative expenses).
- Excludes 1,640,511 treasury shares as at 31 December 2025. For further details please see Note 17.
Consolidated Statement of changes in equity
in € thousand | Note | Share capital | Share premium | Other reserves | Treasury shares | Accumulated profit | Total |
|---|---|---|---|---|---|---|---|
Balance at 1 January 2024 | ( | ||||||
Transactions with owners | ( | ( | |||||
Share capital movements | ( | ||||||
Earnings distribution – capital repayment | ( | ( | |||||
Issue of shares, net of transaction costs | |||||||
Earnings distribution – dividend out of accumulated profit | ( | ( | |||||
Earnings distribution – impact of foreign exchange hedges | |||||||
Earnings distribution – scrip issue | ( | ||||||
Shares purchased for LTSIP1 | ( | ( | |||||
Share based payment expense | |||||||
LTSIP reserve release | |||||||
Total comprehensive income | |||||||
Profit for the year | |||||||
Balance at 31 December 2024 | ( | ||||||
Transactions with owners | ( | ( | ( | ( | |||
Share capital movements2 | ( | ||||||
Earnings distribution – capital repayment3 | ( | ( | |||||
Earnings distribution – dividend out of accumulated profit3 | ( | ( | |||||
Earnings distribution – impact of foreign exchange hedges3 | |||||||
Shares purchased for LTSIP1 | ( | ( | |||||
Share based payment expense | |||||||
LTSIP reserve release | |||||||
Treasury shares | ( | ( | |||||
Total comprehensive income | |||||||
Profit for the year | |||||||
Balance at 31 December 2025 | ( | ( |
- LTSIP = debt free Long-Term Share Incentive Plan with a vesting component.
- Share capital movements relate to the net increase of the nominal value of the shares in respect to the shareholders that elected the distributions as capital repayment. For further details, please refer to Note 17.
- The Company offers three possible alternatives for settlement of its distribution: capital repayment (default option), dividend out of accumulated profit and scrip issue, the latter one at the discretion of the Board. For further details on distribution options impacting the reporting year, please refer to Note 17.
Consolidated Statement of cash flows
in € thousand | Note | 31 Dec 2025 | 31 Dec 2024 |
|---|---|---|---|
CASH FLOWS FROM OPERATIONS | |||
Interest paid on loans and borrowings | ( | ( | |
Interest paid on lease liabilities | ( | ( | |
Interest paid on bonds | ( | ( | |
Income tax paid | ( | ( | |
Bank charges paid | ( | ( | |
Interest received | |||
Cash received from derivatives settlements | |||
NET CASH FLOWS FROM OPERATING ACTIVITIES | |||
INVESTING ACTIVITIES | |||
Expenditure on investment property1 | ( | ( | |
Acquisition of investment property | ( | ||
Acquisition of property, plant and equipment | ( | ||
Settlements of deferred consideration for prior years acquisitions | ( | ||
Expenditure on property, plant and equipment2 | ( | ( | |
Proceeds from disposal of assets held for sale | |||
NET CASH FLOW USED IN INVESTING ACTIVITIES | ( | ( | |
FINANCING ACTIVITIES | |||
Proceeds from issue of shares | |||
Payment to acquire shares for LTSIP | ( | ( | |
Sale of unvested shares under LTSIP | |||
Repurchase of shares | ( | ||
Net movements in bank loans, bonds, and other long-term liabilities | |||
Proceeds from bank loans | |||
Proceeds from bonds | |||
Repayment of bank loans | ( | ( | |
Repayment of bonds | ( | ( | |
Premium paid on repurchase of bonds | ( | ||
Other payments | ( | ( | |
Repayments of lease liabilities | ( | ( | |
Premium paid on acquisitions of derivatives | ( | ( | |
Repayment of loans from third parties | ( | ||
Earnings distribution - Capital repayment and dividend | ( | ( | |
NET CASH FLOW (USED IN)/FROM FINANCING ACTIVITIES | ( | ||
NET (DECREASE)/ INCREASE IN CASH AND CASH EQUIVALENTS | ( | ||
Cash and cash equivalents brought forward | |||
CASH AND CASH EQUIVALENTS CARRIED FORWARD |
- Includes capital expenditure for the investment property under development and the existing in use properties.
- The 2025 amount includes €
- The Company offers three possible alternatives for settlement of its distribution: capital repayment (default option), dividend out of accumulated profit and scrip issue, the latter one at the discretion of the Board. For further details on distribution options impacting the reporting year, please refer to Note 17.
Notes to the Consolidated Financial Statements
1 General
The Group’s Consolidated Financial Statements and the Company’s Separate Financial Statements are collectively referred to as the Financial Statements. The Financial Statements for the year ended 31 December 2025 were approved by the Board of Directors on 17 March 2026 and authorised for publication on 18 March 2026.
2 Basis of preparation
a Statement of compliance
The Consolidated Financial Statements have been consistently prepared in accordance with IFRS Ⓡ Accounting Standards as issued by the International Accounting Standards Board (IASB), the SAICA Financial Reporting Guides as issued by the Accounting Practices Committee, Financial Pronouncements as issued by the Financial Reporting Standards Council, the JSE Listings Requirements, IFRS Accounting Standards as adopted by the European Union and with Title 9 of Book 2 of the Dutch Civil Code. They comprise the Company and its subsidiaries, as detailed in “Basis of consolidation” in Note 3.2.
The material accounting policies applied in the preparation of these Consolidated Financial Statements are set out below in Note 3 and are consistent with those applied for the preparation of the annual Consolidated Financial Statements as at 31 December 2024, except for the new mandatory standards and interpretations effective as of 1 January 2025, described below:
IAS 21 The Effects of Changes in Foreign Exchange Rates: Lack of Exchangeability (Amendments)
These amendments and interpretations did not have a significant impact on the Consolidated Financial Statements as at 31 December 2025.
Management has prepared the financial statements on a going concern basis. Having considered the potential impact of the overall macroeconomic environment on the Company’s and the wider NEPI Rockcastle Group revenues, profits, cash flows, operations, liquidity position and debt facilities, management concluded that despite the market reactions to various geopolitical events during 2025 and subsequent to the year-end, there are no material uncertainties relating to the Group’s ability to continue as a going concern.
Climate related matters
The Group acknowledges that climate change poses both risks and opportunities to its business and has integrated environmental, social and governance (ESG) considerations into its strategy, financial planning, and reporting. Main considerations of climate-related matters impact on the Group are outlined below.
Going concern
Management has considered the potential impact of climate-related matters, including physical and transition risks, on the Group’s business model, operations, and liquidity. Based on the resilience of the portfolio, the strategic focus on sustainable assets, and the availability of green financing, management concluded that climate-related matters do not give rise to material uncertainties that would cast significant doubt on the Group’s ability to continue as a going concern.
Significant estimates and assumptions
The most significant estimates and assumptions affected by climate-related matters are connected to the valuation of investment property. In determining the fair value of investment properties, the Group and its external independent valuers consider the impact of climate-related risks. While the Group has assessed that its properties are currently not materially exposed to physical risks (such as flooding or wildfires), it recognizes exposure to transition risks, specifically increasing legislative requirements for energy efficiency and tenant demand for low-emission buildings.
Valuers incorporate ESG criteria into their assessment. While currently the link between ESG metrics and market value is often qualitative due to limited market evidence of direct correlation, the valuation models account for capital expenditure required to upgrade assets to ensure future compliance with energy efficiency regulations and the sustainability profile of the assets (e.g. BREEAM certifications), which supports liquidity and tenant demand.
Impact on financial statments
The carrying value of investment properties reflects the portfolio's high sustainability standards, with the majority of the portfolio being BREEAM certified. The Group actively invests in retrofitting and energy efficiency improvements (e.g. LED lighting, BMS upgrades) and renewable energy installations.
The Group’s liability structure is increasingly linked to its sustainability performance. As of the reporting dates, a significant portion of the Group’s funding (including green bonds and green loans from IFC) is governed by the Group's Green Finance Framework or Sustainability-Linked Financing Framework. These instruments offer favorable financial terms contingent upon meeting specific ESG key performance indicators (KPIs), such as reducing greenhouse gas emissions and increasing energy efficiency.
The Group monitors the impact of climate change on property operating expenses, including potential increases in energy prices and carbon taxes. These risks are partially mitigated by the ability to pass through costs to tenants and by investments in energy efficiency. Operating expenses include costs associated with the implementation of measures aimed at reducing GHG emissions.
Climate-related initiatives are also creating new opportunities. The Group generates revenue from the sale of green energy produced by its photovoltaic plants installed across the portfolio which will expand through the greenfield photovoltaic developments. This income creates a natural hedge against energy price volatility and contributes positively to Group's revenues.
b Basis of measurement
The Consolidated Financial Statements are prepared on the historical cost basis, except for investment property in use, land for investment property under development, and interest rate derivatives, which are measured at fair value.
c Use of estimates and judgements
The preparation of Consolidated Financial Statements in conformity with IFRS requires management to make judgements, estimates and assumptions that affect the application of policies and reported amounts of assets and liabilities, income and expenses. Estimates and associated assumptions are based on experience and other factors believed to be reasonable under the circumstances and enable judgements to be made about the carrying values of assets and liabilities not readily apparent from other sources. Actual results may differ from these estimates. Estimates and underlying assumptions are reviewed on an ongoing basis. Revisions to accounting estimates are recognised in the period when the estimate is revised.
d Presentation
The Consolidated Financial Statements are presented in thousands of Euros (“€’000s”), rounded off to the nearest thousand, unless stated otherwise.
3 Material accounting policies
The material accounting policies set out below have been consistently applied to all periods presented.
3.1 Foreign currency translation
a Functional and presentation currency
The Consolidated Financial Statements are presented in Euro (“€”, “EUR”) thousands unless otherwise stated, which is NEPI Rockcastle’s functional and presentation currency. The assessment of the functional currency of the Group is presented in Note 4 – Significant Accounting Estimates and Judgements in Applying Accounting Policies.
b Transactions and balances
Foreign currency transactions are translated into the functional currency using the exchange rates prevailing at the dates of the transactions or valuation where items are re‑measured. Foreign exchange gains and losses resulting from the settlement of such transactions and from the translation at year‑end exchange rates of monetary assets and liabilities denominated in foreign currencies are recognised in profit or loss.
3.2 Basis of consolidation
Subsidiaries
The Consolidated Financial Statements incorporate the assets, liabilities, operating results and cash flows of the Company and its subsidiaries.
Subsidiaries are all entities controlled by the Company. The financial statements of subsidiaries are included in the Consolidated Financial Statements from the date the control commences until the date the control ceases.
These Consolidated Financial Statements include the Company and the fully consolidated subsidiaries, as set out below:
No | Subsidiary | Country of | Principal activity | Effective interest 2025 (%) | Effective interest 2024 (%) |
|---|---|---|---|---|---|
1 | ACE3 Sp. z o.o. | Poland | Property-owning | 100 | 100 |
2 | Arena Center Zagreb d.o.o. | Croatia | Property-owning | 100 | 100 |
3 | AUPARK Kosice SC, s.r.o. | Slovakia | Services | 100 | 100 |
4 | AUPARK Kosice, spol. s.r.o. | Slovakia | Property-owning | 100 | 100 |
5 | AUPARK Piestany SC, s.r.o. | Slovakia | Services | 100 | 100 |
6 | AUPARK Piestany, spol. s.r.o. | Slovakia | Property-owning | 100 | 100 |
7 | AUPARK Tower Kosice, s.r.o. | Slovakia | Property-owning | 100 | 100 |
8 | AUPARK Žilina SC a.s. | Slovakia | Services | 100 | 100 |
9 | AUPARK Žilina, spol. s.r.o. | Slovakia | Property-owning | 100 | 100 |
10 | Aurora Mall Buzau SRL | Romania | Property-owning | 100 | 100 |
11 | Białystok Property Sp. z o.o. | Poland | Property-owning | 100 | 100 |
12 | Bonarka City Center Sp. z o.o. | Poland | Property-owning | 100 | 100 |
13 | Braila Promenada Mall SRL | Romania | Property-owning | 100 | 100 |
14 | Brasov Shopping City SRL | Romania | Property-owning | 100 | 100 |
15 | Bulfeld EOOD | Bulgaria | Property-owning | 100 | 100 |
16 | CEE Property Bulgaria EOOD | Bulgaria | Property-owning | 100 | 100 |
17 | CHP 1 Sp. z o.o. | Poland | Services | 100 | 100 |
18 | City Park Constanta SRL | Romania | Property-owning | 100 | 100 |
19 | Constanta Shopping City SRL | Romania | Property-owning | 100 | 100 |
20 | Copernicus Property Sp. z o.o. | Poland | Property-owning | 100 | 100 |
21 | Deva Shopping City SRL | Romania | Property-owning | 100 | 100 |
22 | Elco Energy Sp. z o.o. | Poland | Services | 100 | 100 |
23 | Elco ICT Sp. z o.o. | Poland | Services | 100 | 100 |
24 | Energit Sp. z o.o. | Poland | Services | 100 | 100 |
25 | E-Power Supply d.o.o. Beograd | Serbia | Services | 100 | 100 |
26 | E-power supply EOOD | Bulgaria | Services | 100 | 100 |
27 | E-power supply Kft | Hungary | Services | 100 | 100 |
28 | E-power supply management d.o.o. | Croatia | Services | 100 | 100 |
29 | E-Power Supply s.r.o. | Slovakia | Services | 100 | 100 |
30 | Expo Real Estate Project SRL | Romania | Services | 100 | 100 |
31 | Festival Shopping Center SRL | Romania | Property-owning | 100 | 100 |
32 | Floreasca Center SRL | Romania | Holding | 100 | 100 |
33 | Forum Gdansk Property Sp. z o.o. | Poland | Property-owning | 100 | 100 |
34 | FORUM Usti s.r.o. | Czech Republic | Property-owning | 100 | 100 |
35 | Galati Shopping City SRL | Romania | Property-owning | 100 | 100 |
36 | General Building Management SRL | Romania | Property-owning | 100 | 100 |
37 | General Investment SRL | Romania | Property-owning | 100 | 100 |
38 | Gontar Sp. z o.o. | Poland | Property-owning | 100 | 100 |
39 | HANSA Immobilien EOOD | Bulgaria | Property-owning | 100 | 100 |
40 | Iris Titan Shopping Center SRL | Romania | Property-owning | 100 | 100 |
41 | Karolinka Property Sp. z o.o. | Poland | Property-owning | 100 | 100 |
42 | Liberec Property s.r.o. | Czech Republic | Property-owning | 100 | 100 |
43 | Magnolia Property Sp. z o.o. | Poland | Property-owning | 100 | 100 |
44 | Mammut Zrt | Hungary | Property-owning | 100 | 100 |
45 | Mammut Management Kft | Hungary | Services | 100 | 100 |
46 | Mammut Real Estate Kft | Hungary | Property-owning | 100 | 100 |
47 | Marapi Sp. z o.o. | Poland | Property-owning | 100 | 100 |
48 | Mega Mall Bucuresti SRL | Romania | Property-owning | 100 | 100 |
49 | Milvus Sp. z o.o. | Poland | Property-owning | 100 | 100 |
50 | Mlyny a.s. | Slovakia | Property-owning | 100 | 100 |
51 | Monarda Sp. z o.o. | Poland | Property-owning | 100 | 100 |
52 | MUNTENIA BETON MAX SRL | Romania | Services | 100 | 100 |
53 | NE Property B.V. | Netherlands | Holding | 100 | 100 |
54 | NEPI Bucharest One SRL | Romania | Property-owning | 100 | 100 |
55 | NEPI Bucharest Two SRL | Romania | Property-owning | 100 | 100 |
56 | NEPI Croatia Management d.o.o. | Croatia | Services | 100 | 100 |
57 | NEPI Czech Management s.r.o. | Czech Republic | Services | 100 | 100 |
58 | Nepi Four Real Estate Solutions SRL | Romania | Holding | 100 | 100 |
59 | NEPI Investment Management SRL | Romania | Services | 100 | 100 |
60 | NEPI Project Four EOOD | Bulgaria | Property-owning | 100 | 100 |
61 | NEPI Project One EOOD | Bulgaria | Property-owning | 100 | 100 |
62 | NEPI Project Three EOOD | Bulgaria | Services | 100 | 100 |
63 | NEPI Project Two EOOD | Bulgaria | Holding | 100 | 100 |
64 | NEPI Real Estate Development d.o.o. | Serbia | Services | 100 | 100 |
65 | NEPI Rockcastle Green Energy B.V. | Netherlands | Holding | 100 | 100 |
66 | NEPI Rockcastle Hungary Kft | Hungary | Services | 100 | 100 |
67 | NEPI Rockcastle Lithuania UAB | Lithuania | Services | 100 | 100 |
68 | Nepi Seventeen Land Development SRL | Romania | Services | 100 | 100 |
69 | NEPI Six Development SRL | Romania | Services | 100 | 100 |
70 | Nepi Sixteen Real Estate Investment SRL | Romania | Holding | 100 | 100 |
71 | Nepi Slovak Centres One a.s. | Slovakia | Services | 100 | 100 |
72 | NEPI Slovakia Management s.r.o. | Slovakia | Services | 100 | 100 |
73 | NEPI Ten Development Solutions SRL | Romania | Property-owning | 100 | 100 |
74 | Nepi Twenty Real Estate Development SRL | Romania | Services | 100 | 100 |
75 | Nepi Twenty-One Investment Estate SRL | Romania | Services | 100 | 100 |
76 | Nepi Twenty-Three Investment Solutions SRL | Romania | Property-owning | 100 | 100 |
77 | NEPIOM Ltd | Malta | Holding | 100 | 100 |
78 | New Energy Management SRL | Romania | Services | 100 | 100 |
79 | NRE Sibiu Shopping City SRL | Romania | Property-owning | 100 | 100 |
80 | Olsztyn Property Sp. z o.o. | Poland | Property-owning | 100 | 100 |
81 | Piotrków Property Sp. z o.o. | Poland | Property-owning | 100 | 100 |
82 | Platan Property Sp. z o.o. | Poland | Property-owning | 100 | 100 |
83 | Ploiesti Shopping City SRL | Romania | Property-owning | 100 | 100 |
84 | Pogoria Property Sp. z o.o. | Poland | Property-owning | 100 | 100 |
85 | Promenada Mall Bucuresti SRL | Romania | Property-owning | 100 | 100 |
86 | Ramnicu Valcea Shopping City SRL | Romania | Property-owning | 100 | 100 |
87 | Real Estate Asset Management SRL | Romania | Services | 100 | 100 |
88 | Retail Park Pitesti SRL | Romania | Property-owning | 100 | 100 |
89 | Rockcastle Poland Sp. z o.o. | Poland | Services | 100 | 100 |
90 | Satu Mare Shopping City SRL | Romania | Property-owning | 100 | 100 |
91 | SCP s.r.o. | Slovakia | Property-owning | 100 | 100 |
92 | Severin Shopping Center SRL | Romania | Property-owning | 100 | 100 |
93 | Shopping City Piatra Neamt SRL | Romania | Property-owning | 100 | 100 |
94 | Sibiu Shopping City 2 SRL | Romania | Property-owning | 100 | 100 |
95 | Silesia Property Sp. z o.o. | Poland | Property-owning | 100 | 100 |
96 | Shopping City Timisoara SRL | Romania | Property-owning | 100 | 100 |
97 | ShoppingSpot Sp. z o.o. (wound up in 2025) | Poland | Services | 100 | 100 |
98 | Sofia Commercial Centre EOOD | Bulgaria | Services | 100 | 100 |
99 | Solpower Energy SRL | Romania | Services | 100 | 100 |
100 | Stichting NEPI Rockcastle Incentive Plan Foundation | Netherlands | Services | 100 | 100 |
101 | Symmetry Arena Kft | Hungary | Property-owning | 100 | 100 |
102 | Targu Jiu Development SRL | Romania | Property-owning | 100 | 100 |
103 | Targu Mures Shopping City SRL | Romania | Property-owning | 100 | 100 |
104 | Tummam Kft | Hungary | Property-owning | 100 | 100 |
105 | Uždaroji akcinė bendrovė Ozantis | Lithuania | Property-owning | 100 | 100 |
106 | Vulcan Residential Park SRL | Romania | Property-owning | 100 | 100 |
107 | Vulcan Value Centre SRL | Romania | Property-owning | 100 | 100 |
108 | Zielona Góra Property Sp. z o.o. | Poland | Property-owning | 100 | 100 |
Transactions and balances eliminated on consolidation
Intra-group balances and transactions, and any gains and losses or income and expenses arising from intra-group transactions, as well as investments in subsidiaries and corresponding equity in the subsidiaries are eliminated in preparing the Consolidated Financial Statements.
3.3 Investment property in use
Investment property is held to earn rental income, capital appreciation or both.
The cost of investment property acquired by any other means than a business combination consists of the purchase price and directly attributable expenditure.
Subsequent expenditure relating to investment property is capitalised when future economic benefits from the use of the asset are probable and the cost of the item can be measured reliably. All other subsequent expenditure is recognised as an expense during the period it is incurred.
After initial recognition, investment property in use is measured at fair value. Fair value is determined semi-annually by external, independent professional valuers, with appropriate and recognised qualifications and recent experience in the location and category of property being valued. Valuations are based on the income method, respectively, the applied method used for all investment property in use is discounted cash flow (DCF).
Gains or losses arising from changes in the fair values are included in the Statement of comprehensive income for the period during which they arise. Unrealised gains or losses, net of deferred tax, are non-distributable.
Lease incentives, such as rent-free periods, discounts during the lease or payment of fit-out works for the benefit of the tenants, are part of value of the investment property and are straight-lined over the lease term. The lease term corresponds to the contractual duration for the majority of the leases, except for the anchor tenants, for which the lease duration is assessed by the Group based on past experience and taking into account factors such as: GLA of the property where the anchor tenant is located, catchment area, dominance/competition in the catchment area or purchasing power.
Transfers are made to or from investment property only when there is a change in use. For a transfer from investment property to owner-occupied property, the deemed cost for subsequent accounting is the fair value at the date of change in use.
3.4 Investment property under development
Property that is being constructed or developed for future use as investment property is classified as investment property under development and carried at cost until construction or development is complete, or its fair value can be reliably determined.
The land on which investment property is constructed or developed is carried at fair value, which is determined semi-annually by external, independent professional valuers, with appropriate and recognised qualifications and recent experience in the location and category of property being valued. Valuations are performed using the market comparable approach or residual approach.
Gains or losses arising from changes in the fair values are included in the Statement of comprehensive income during the period when they arise. Unrealised gains or losses, net of deferred tax, are non-distributable.
3.5 Assets classified as held for sale
An investment property or a group of assets including an investment property (disposal group) are classified as held for sale if their carrying amount will be recovered through a sale transaction rather than through continuing use. For this to be the case:
the assets must be available for immediate sale in their present condition;
the Group must be committed to sell;
there must be a plan to locate a buyer; and
it is highly probable that a sale will be completed within one year from the date of classification.
On re-classification as held for sale, investment property that is measured at fair value continues to be measured in this way.
An investment property or disposal group classified as held for sale is presented separately in the Statement of financial position as assets or liabilities classified as held for sale.
3.6 Property, plant and equipment
Property, plant and equipment are valued at their cost price, net of accumulated depreciation and accumulated impairment losses, if any. The cost price includes all directly attributable costs and the relevant part of the indirect costs incurred to make the asset ready for use. Subsequent costs are included in the asset’s carrying amount or recognised as a separate asset, as appropriate, only when it is probable that future economic benefits associated with the item will flow to the Group and the cost of the item can be measured reliably. All other repair and maintenance costs are recognised in profit or loss as incurred.
Construction in progress is stated at cost, net of accumulated impairment losses, if any.
Depreciation is calculated on a straight-line basis over the estimated useful lives of the assets, as follows:
Photovoltaic installations | 4-40 years |
Office equipment | 2-16 years |
Office improvements | over the term of the underlying lease |
Equipment used in owner-managed activities | 3-22 years |
The expected useful lives of assets and methods of depreciation are reviewed at least annually.
Starting in 2025, photovoltaic installations also include greenfield developments, which have a different structure of equipment components. As a result, the useful lives have been updated.
3.7 Goodwill
Goodwill arises upon business combination and represents the excess of the consideration transferred over the Group’s interest in net fair value of the net identifiable assets, liabilities, and contingent liabilities of the acquiree.
For the purpose of impairment testing, goodwill acquired in a business combination is allocated to each of the cash-generating units (“CGUs”), or groups of CGUs, that is expected to benefit from the synergies of the combination. Each unit or group of units to which the goodwill is allocated represents the lowest level within the Group at which the goodwill is monitored for internal management purposes and it is represented by the individual properties.
3.8 Impairment of non-financial assets
Assets that are subject to depreciation or amortisation are reviewed for impairment whenever events or changes in circumstances indicate that the carrying amount may not be recoverable. Non‑financial assets, other than goodwill and intangible assets with infinitive useful life, that have suffered an impairment are reviewed for possible reversal of the impairment at each reporting date, if indicators of reversal exist.
3.9 Financial assets
3.9.1 Classification
In line with IFRS 9 “Financial instruments”, the Group classifies its financial assets in the following measurement categories:
those to be measured subsequently at fair value through profit or loss; and
those to be measured at amortised cost.
The classification and subsequent measurement of debt instruments financial assets depends on: (i) the Group’s business model for managing the related assets portfolio and (ii) the cash flow characteristics of the asset.
For financial assets measured at fair value through profit or loss (“FVTPL”), gains and losses are recorded in profit or loss.
3.9.2 Recognition and derecognition
All purchases and sales of financial assets that require delivery within the time frame established by regulation or market convention (“regular way” purchases and sales) are recorded at trade date, which is the date when the Group commits to deliver a financial instrument. All other purchases and sales are recognised when the entity becomes a party to the contractual provisions of the instrument.
Financial assets are derecognised when the rights to receive cash flows from the financial assets have expired or have been transferred and the Group have transferred substantially all the risks and rewards of ownership.
3.9.3 Measurement
At initial recognition, the Group measures a financial asset at its fair value plus, in the case of a financial asset not at FVTPL, transaction costs that are directly attributable to the acquisition of the financial asset. Transaction costs of financial assets carried at FVTPL are expensed in profit or loss. Fair value at initial recognition is best evidenced by the transaction price.
a Debt instruments
Subsequent measurement of debt instruments depends on the Group’s business model for managing the asset and the cash flow characteristics of the asset: assets that are held for collection of contractual cash flows where those cash flows represent solely payments of principal and interest (“SPPI”) are measured at amortised cost. Any gain or loss arising on derecognition is recognised directly in profit or loss. Impairment losses are presented as separate line item in the Statement of comprehensive income. Financial assets measured at amortised cost (“AC”) comprise cash and cash equivalents, loans to participants in the Share Purchase Scheme, long-term receivables and trade and other receivables (excluding prepaid expenses).
b Derivatives
Derivatives are initially recognised at fair value on the date a derivative contract is entered into, and they are subsequently remeasured to their fair value at the end of each reporting period.
3.9.4 Impairment – credit loss allowance for Expected Credit Losses (“ECL”)
In line with IFRS 9 “Financial instruments”, the Group assesses on a forward-looking basis the ECL for debt instruments (including loans) measured at amortised cost. The Group measures ECL and recognises credit loss allowance on an annual basis. The measurement of ECL reflects: (i) an unbiased and probability weighted amount that is determined by evaluating a range of possible outcomes, (ii) time value of money and (iii) all reasonable and supportable information that is available without undue cost and effort at the end of each reporting period about past events, current conditions and forecasts of future conditions.
The carrying amount of the financial assets is reduced through the use of an allowance account, and the amount of any loss is recognised in the Statement of comprehensive income (profit or loss). Debt instruments measured at amortised cost are presented in the balance sheet net of the allowance for ECL.
ECLs are recognised for loans granted in two stages. For credit exposures for which there has not been a significant increase in credit risk since initial recognition, ECLs are provided for credit losses that result from default events that are possible within the next 12-months (a 12-month ECL). For those credit exposures for which there has been a significant increase in credit risk since initial recognition, a loss allowance is required for credit losses expected over the remaining life of the exposure, irrespective of the timing of the default (a lifetime ECL).
Expected credit losses for trade receivables are recognised using the simplified approach. Therefore, the Group does not track changes in credit risk, but instead recognises a loss allowance based on lifetime ECLs at each reporting date.
3.9.5 Reclassification
Financial instruments are reclassified only when the business model for managing those assets changes. The reclassification has a prospective effect and takes place from the start of the first reporting period following the change.
3.9.6 Write-off
Financial assets are written-off, in whole or in part, when the Group has exhausted all practical recovery efforts and has concluded that there is no reasonable expectation of recovery. The write-off represents a derecognition event. Indicators that there is no reasonable expectation of recovery include, among others, insolvency or significant financial difficulties of the tenant, default on payment terms and vacation or abandonment of the leased premises. Impaired trade and other receivables are derecognised when all reasonable efforts to collect the amounts outstanding have failed and they are assessed as uncollectable.
3.9.7 Modification
The Group sometimes renegotiates or otherwise modifies the contractual terms of the financial assets. The Group assesses whether the modification of contractual cash flows is substantial considering, among other, the following factors: new contractual terms that substantially affect the risk profile of the asset, significant change in interest rate, change in the currency denomination.
If the modified terms are substantially different, the rights to cash flows from the original asset expire and the Group derecognises the original financial asset and recognises a new asset at its fair value. The date of renegotiation is considered to be the date of initial recognition for subsequent impairment calculation purposes, including determining whether a significant increase in credit risk has occurred. The Company also assesses whether the new loan or debt instrument meets the SPPI criterion. Any difference between the carrying amount of the original asset derecognised and fair value of the new substantially modified asset is recognised in profit or loss, unless the substance of the difference is attributed to a capital transaction with owners.
In a situation where the renegotiation was driven by financial difficulties of the counterparty and inability to make the originally agreed payments, the Company compares the original and revised expected cash flows to assess whether the risks and rewards of the asset are substantially different as a result of the contractual modification. If the risks and rewards do not change, the modified asset is not substantially different from the original asset and the modification does not result in derecognition. The Company recalculates the gross carrying amount by discounting the modified contractual cash flows by the original effective interest rate and recognises a modification gain or loss in profit or loss.
Specific valuation techniques used to value financial assets include:
The use of quoted market prices or dealer quotes for similar instruments (for financial assets/liabilities at fair value through profit or loss);
Discounted cash flow analysis (for the remaining financial instruments).
3.10 Financial liabilities – measurement categories
Financial liabilities are initially recognised at fair value and classified and subsequently measured at amortised cost, except for financial liabilities at FVTPL: this classification is applied to interest rate derivatives and other financial liabilities designated as such at initial recognition.
3.11 Borrowings (bonds and bank loans)
Borrowings are recognised initially at the fair value of the liability (determined using the prevailing market rate of interest if significantly different from the transaction price) and net of transaction costs incurred. In subsequent periods, borrowings are subsequently carried at amortized cost using the effective interest method. Any difference between the proceeds (net of transaction costs) and the redemption value is recognised in the Statement of comprehensive income over the period of the borrowings, using the effective interest method, unless they are directly attributable to the acquisition, construction or production of a qualifying asset, in which case they are capitalised as part of the cost of that asset. Borrowings are classified as current liabilities, unless the Group has an unconditional right to defer settlement of the liability for at least twelve months after the balance sheet date.
Borrowings are removed from the balance sheet when the obligation specified in the contract is extinguished (i.e. discharged, cancelled or expires). The difference between the carrying amount of a financial liability that has been extinguished or transferred to another party and the consideration paid, including any non-cash assets transferred or liabilities assumed, is recognised in the Statement of comprehensive income.
An exchange between the Group and its original lenders of debt instruments with substantially different terms, as well as substantial modifications of the terms and conditions of existing financial liabilities, are accounted for as an extinguishment of the original financial liability and the recognition of a new financial liability. The terms are substantially different if the discounted present value of the cash flows under the new terms, including any fees paid net of any fees received and discounted using the original effective interest rate, is at least 10% different from the discounted present value of the remaining cash flows of the original financial liability. In addition, other qualitative factors, such as the currency that the instrument is denominated in, changes in the type of interest rate, new conversion features attached to the instrument and change in loan covenants are also considered.
If an exchange of debt instruments or modification of terms is accounted for as an extinguishment, any costs or fees incurred are recognised as part of the gain or loss on the extinguishment. If the exchange or modification is not accounted for as an extinguishment, any costs or fees incurred adjust the carrying amount of the liability and are amortised over the remaining term of the modified liability.
Modifications of liabilities that do not result in extinguishment are accounted for as a change in estimate using a cumulative catch-up method, with any gain or loss recognised in the Statement of comprehensive income.
Borrowing costs are interest and other costs that the Group incurs in connection with the borrowing of funds, including interest on borrowings, amortisation of discounts or premiums relating to borrowings and amortisation of ancillary costs incurred in connection with the arrangement of borrowings to the extent that they are regarded as an adjustment to interest costs.
Borrowing costs that are directly attributable to the acquisition, construction or production of a qualifying asset, being an asset that necessarily takes a substantial period of time to get ready for its intended use (such as properties developed for future sale, capital appreciation or rental income) are capitalised as part of the cost of that asset, when it is probable that they will result in future economic benefits to the Group and the costs can be measured reliably.
3.12 Cash and cash equivalents
Cash and cash equivalents include cash balances, cash deposits and short-term, highly liquid investments with original maturities of three months or less that are readily convertible to known amounts of cash and which are subject to an insignificant risk of changes in value. Cash and cash equivalents are carried at amortised cost because: (i) they are held for collection of contractual cash flows and those cash flows represent solely payments of principal and interest (SPPI), and (ii) they are not designated at FVTPL.
3.13 Trade receivables
Trade receivables are amounts due from customers for rental and service charge income from tenants in the ordinary course of business. If collection is expected in one year or less, they are classified as current assets. If not, they are presented as non-current assets.
Trade receivables are recognised initially at fair value, generally at the amount of consideration that is unconditional. The Group holds the trade receivables with the objective to collect the contractual cash flows and therefore measures them subsequently at amortised cost using the effective interest method.
Trade receivables are also subject to the impairment requirements of IFRS 9. The Group applies the IFRS 9 simplified approach to measuring expected credit losses.
Trade receivables are written-off when there is no reasonable expectation of recovery. Indicators that there is no reasonable expectation of recovery include, amongst others, the failure of a debtor to engage in a repayment plan with the Group.
3.14 Inventory property
Property acquired or being constructed for sale in the ordinary course of business, rather than to be held for rental or capital appreciation, is held as inventory property and is measured at the lower of cost and net realisable value (“NRV”). Principally, this is residential property that the Group develops and intends to sell on completion of development.
The commencement of development with a plan or a prior agreement to sell represents a change in use and accordingly the project is transferred from investment property to inventory property.
Costs incurred in inventory property include:
freehold and leasehold rights for land;
amounts paid to contractors for development; and
planning and design costs, costs of site preparation, professional fees for legal services, property transfer taxes, development overheads and other related costs.
NRV is the estimated selling price in the ordinary course of business, based on market prices at the reporting date, less estimated costs of completion and the estimated costs necessary to make the sale.
When an inventory property is sold, the carrying amount of the property is recognised as an expense in the period in which the related revenue is recognised. The carrying amount of inventory property recognised in profit or loss is determined with reference to the directly attributable costs incurred on the property sold and an allocation of any other related costs based on the relative size of the property sold.
3.15 Share capital and share premium
Ordinary shares are classified as equity. Incremental external costs directly attributable to the issue of new shares are shown in equity as a deduction from the proceeds.
The consideration paid, including any directly attributable incremental costs (net of income taxes for the purchases of the Company’s equity instruments by any of the Group’s subsidiaries, as a result of a share buy-back or for a share-based incentive plan) is presented within “Other reserves”, until the shares are cancelled or reissued. Where such ordinary shares are cancelled, their nominal value is debited to Share capital, with the corresponding difference up to their purchase price (including any attributable incremental cost, net of taxes) debited from Share premium. Where such ordinary shares are subsequently reissued, any consideration received, net of any directly attributable incremental transaction costs and the related income tax effects, is included in equity attributable to the owners of the Group. Usually, shares are purchased for the debt-free Long-Term Share Incentive Plan (Note 3.16 (b)).
3.16 Share-based payments
To date, NEPI Rockcastle has initiated two types of incentive programs that offered share-based payments in exchange for services provided to it by its directors and employees (equity-settled transactions), which are detailed below.
a Purchase Offers with a vesting component – Share Purchase Scheme (“NRP SPS”)
This program was put in place before the 2017 merger of the former groups New Europe Property Investments plc (“NEPI”) and Rockcastle Global Real Estate Company Ltd (“Rockcastle”). Under this program, participants were granted loans to acquire shares in the Company at fair value at the grant date. These loans were classified as “loans to participants in the incentive plan” and included in Other long-term assets (Note 10). The loans are carried at amortised cost and the accrued interest is recognised as finance income in the Statement of Comprehensive Income. The costs under this program are nil.
b Debt free Long-Term Share Incentive Plan with a vesting component (“LTSIP”)
This program was put in place after the 2017 merger of the former groups NEPI and Rockcastle. Under this incentive plan, shares may be issued by the Group to executive directors and other key personnel for no cash consideration. Awards under this plan are at the discretion of the Board of Directors and are based on the performance of the Group and the employees. The costs related to the LTSIP are measured based on the fair value of the shares at the grant date and are recognised over the vesting period.
The costs are presented as part of the Administrative expenses in the Statement of comprehensive income and within Other reserves in the Statement of changes in equity.
3.17 Accumulated profit
The balance on the Statement of comprehensive income is transferred to accumulated profit at the end of each financial period. Distributions paid in cash are deducted from accumulated profit. Distributions for which shareholders elected to receive a return of capital are accounted for as an issue of share capital with a corresponding deduction from the share premium account.
3.18 Revenue
Revenue is recognised at the fair value of the consideration received or receivable. Revenue comprises rental and related income and recovery of expenses, excluding VAT.
Rental income
Rental income receivable from operating leases is recognised on a straight-line basis over the duration of the lease, except for variable lease payments which are recognised when they arise.
Contractually agreed and signed concessions granted to, and obtained from, tenants are treated according to IFRS 16 “Leases”. IFRS 16 defines “lease modification” as a change in scope, or consideration, of the lease, not part of the original terms and conditions, such as rent discounts, lease extensions, increase in variable rent (overage/turnover), introduction of break options, etc. Lease modifications are recognised prospectively over the new lease term and accounted for by the Group from the date the modification is contractually agreed and signed by both parties. Agreed lease modifications are recognised as lease incentives from the date the modification was signed. Such modifications are straight-lined over the new lease term and recognised in the Consolidated Statement of comprehensive income as a reduction of Gross rental income.
Service charges income from tenants
Revenue from service and property management charges is recognised in the accounting period in which control of the services are passed to the customer, which is when the service is rendered. For certain service contracts, revenue is recognised based on the actual service provided to the end of the reporting period as a proportion of the total services.
As specified in the lease agreements, the Group has the primary responsibility for providing services to tenants (electricity, water and gas utilities, interior and exterior cleaning, security, maintenance, repairs, etc). The Group has determined that these services constitute distinct non-lease components (transferred separately from the right to use the underlying asset) and are within the scope of IFRS 15. The Group allocates the consideration in the contract to the separate lease and revenue (non-lease) components on a relative stand-alone selling price basis. In respect of the revenue component, these services represent a series of daily services that are individually satisfied over time because the tenants simultaneously receive and consume the benefits provided by the Group. The Group applies the time elapsed method to measure progress.
The Group negotiates directly with the suppliers all contracts for services provided to tenants. These contracts are concluded between the Group subsidiaries which own the properties and the direct supplier. As the Group sometimes uses the same providers for services across most of its portfolio, it can negotiate better prices through the economies of scale. The Group is considered principal in these transactions, in terms of the IFRS 15 requirements.
The Group negotiates and pays all expenses incurred by the tenants and then re-invoices these costs to them as defined in the contractual clauses included in the lease agreements. A flat fee is charged monthly during the year. This fee is estimated based on the previous year’s actual costs, with an annual service charge reconciliation performed based on current year’s actual costs incurred by the Group. For contracts terminated during the year, the Group estimates the service charge to be collected based on the current budget and last year’s actual costs.
Revenue from sales of residential property
Revenue is recognised when the performance obligation associated with the sale is completed. The transaction price comprises the fair value of the consideration received or receivable, net of value added tax, rebates and discounts.
The sale of completed property constitutes a single performance obligation and the Group has determined that this is satisfied at the point in time when control transfers. The Group’s sales contracts qualify as unconditional exchange of contracts, which occurs when legal title transfers to the customer. Payments are usually received on the date when contracts are signed or with several days delay.
Revenue from energy activity
Revenue from energy is generated through the sale of electricity, based on agreements between the Group’s property companies and the tenants of Group’s properties in a particular jurisdiction. Revenue recognition in a period is based on the delivery of electricity, taking into account the contractual price per kilowatt-hour (kWh) and the amount of electricity delivered in the period.
Consistent with electricity purchased from external suppliers, the Group has determined that revenue from energy activity constitutes a distinct non-lease component (transferred separately from the right to use the underlying asset) and is within the scope of IFRS 15.
3.19 Property operating and administrative expenses
Property operating expenses and administrative expenses are recognised on an accrual basis.
3.20 Earnings distribution
A distribution is recorded as a liability and deducted from equity in the period in which it is declared and approved. Any distribution declared after the reporting period and before the financial statements are authorised for issue is disclosed in Note 17.
3.21 Taxation
Taxation on the profit or loss for the year comprises current and deferred tax. Current income tax and liabilities are measured at the amount expected to be recovered from, or paid to, taxation authorities. Management periodically evaluates positions taken in tax returns with respect to situations in which applicable tax regulations are subject to interpretation and establishes provisions where appropriate.
Deferred tax is determined using the liability method and is based on temporary differences between the carrying amounts of assets and liabilities for financial reporting purposes and their tax bases.
The following temporary differences are not provided for: goodwill not deductible for tax purposes; the initial recognition of assets or liabilities that affect neither accounting nor taxable profit, and differences relating to investments in subsidiaries that are unlikely to reverse in the foreseeable future.
A deferred tax asset is recognised based on the assumption that it is probable that future taxable profits will be available against which it can be utilised. Deferred tax assets are reduced to the extent that it is no longer probable that the related tax benefit will be realised.
The current tax expense incurred by the Group reflects tax accrued in the subsidiaries of the Group located in Bulgaria, Croatia, Czech Republic, Hungary, Lithuania, Malta, Poland, Romania, Serbia, Slovakia, and
3.22 Segment reporting
In accordance with IFRS 8, operating segments are identified on the basis of the internal reporting used by management when evaluating performance and allocating resources.
The Group has a homogeneous asset base (real estate properties), with similar economic characteristics, which provide similar nature of services, i.e. leasing of its properties, that generate rental income.
The Group’s Chief Operating Decision Makers (CODM) are the executive directors, and they take decisions based on detailed reports. These are prepared regularly and are presented to the Board of Directors, which approves the results and gives guidance on the subsequent strategy to be undertaken.
In particular, the financial information in respect of investment property is provided to the Board of Directors focuses primarily on net rentals (including rental income, service charge income and property operating expenses) and valuation gains and losses.
The operating segments for management purposes are the individual properties. For reporting purposes, the Group aggregates the retail properties (shopping malls and retail centres) on country level and presents the financial information on the following geographic reportable segments for retail properties: Bulgaria, Croatia, Czech Republic, Hungary, Lithuania, Poland, Romania, Slovakia.
In addition, the CODM are separately monitoring the activities related to the residential property development and sale ("Residential" segment) and the activities related to the green energy generation which is supplied to the Group's tenants. The Energy business involves investment in photovoltaic installations on the rooftops of Group properties, as well as greenfield photovoltaic plants. The revenues generated by the Energy segment is realised from the sale of electricity to the tenants of the Group’s retail properties.
Lastly, the Group’s CODM closely follow changes in distributable earnings to its shareholders as a measure of profitability and as a result of successful implementation of the Group’s strategy. Distributable earnings per share is calculated in terms of the SA REIT Association’s Best Practice Recommendations Second Edition.
3.23 Investment property acquisitions and business combinations
The Group acquires subsidiaries that own real estate. At the time of acquisition, the Group considers whether each acquisition represents the acquisition of a business or the acquisition of an asset. The Group accounts for an acquisition as a business combination where an integrated set of activities and assets, including property, is acquired. More specifically the following criteria, which indicate an acquisition of a business, are considered: the number of properties acquired, the extent to which strategic management processes and operation processes are acquired and the complexity of the processes acquired. In line with amended IFRS 3 since 1 January 2020 the Group may also apply optional concentration test.
Business combinations are accounted for using the acquisition method. When the acquisition of subsidiaries does not represent a business combination, it is accounted for as an acquisition of a group of assets and liabilities. The cost of the acquisition is allocated to the assets and liabilities acquired based upon their relative fair values, and no goodwill or deferred tax is recognised.
3.24 Leases where the Group is a lessee
The Group recognises lease liabilities to make lease payments and right-of-use assets representing the right to use the underlying assets for all leases, except for short-term leases and leases of low-value assets. The Group recognises right-of-use assets at the commencement date of the lease (i.e., the date the underlying asset is available for use).
Right-of-use assets are measured at cost, adjusted for any remeasurement of lease liabilities. The cost of right-of-use assets includes the amount of lease liabilities recognised and lease payments made at or before the commencement date.
Lease liabilities are measured at the present value of lease payments to be made over the lease term. The lease payments include fixed payments. The present value of lease payments is recognised by discounting the contractual lease payments using the rate that the lessee would have to pay to borrow the funds necessary to obtain an asset of similar value to the right-of-use asset in a similar economic environment with similar terms, security and conditions.
3.25 Standards issued but not yet effective and not early adopted
Certain new accounting standards, amendments to accounting standards and interpretations have been published that are not mandatory for 31 December 2025 reporting periods and have not been early adopted by the Group.
The following standards have been issued but are not yet effective and have been endorsed by the European Union as at 31 December 2025, and were not early adopted by the Group:
IFRS 9 Financial Instruments and IFRS 7 Financial Instruments: Disclosures - Classification and Measurement of Financial Instruments (Amendments)
The amendments are effective for annual reporting periods beginning on or after 1 January 2026. Early adoption of amendments related to the classification of financial assets and the related disclosures is permitted, with the option to apply the other amendments at a later date. The amendments clarify that a financial liability is derecognised on the ‘settlement date’, when the obligation is discharged, cancelled, expired, or otherwise qualifies for derecognition. They introduce an accounting policy option to derecognise liabilities settled via electronic payment systems before the settlement date, subject to specific conditions. They also provide guidance on assessing the contractual cash flow characteristics of financial assets with environmental, social, and governance (ESG)-linked features or other similar contingent features. Additionally, they clarify the treatment of non-recourse assets and contractually linked instruments and require additional disclosures under IFRS 7 for financial assets and liabilities with contingent event references (including ESG-linked) and equity instruments classified at fair value through other comprehensive income. The Group is currently working to identify all impacts the amendments will have on the primary financial statements and notes to the financial statements.
IFRS 9 Financial Instruments and IFRS 7 Financial Instruments: Disclosures - Contracts Referencing Nature-dependent Electricity (Amendments).
The amendments are effective for annual reporting periods beginning on or after 1 January 2026, with earlier application permitted. The amendments include clarifying the application of the 'own-use' requirements, permitting hedge accounting if contracts in scope of the amendments are used as hedging instruments, and introduce new disclosure requirements to enable investors to understand the impact of these contracts on a company's financial performance and cash flows. The clarifications regarding the 'own-use' requirements must be applied retrospectively, but the guidance permitting hedge accounting have to be applied prospectively to new hedging relationships designated on or after the date of initial application. The Group is currently working to identify all impacts the amendments will have on the primary financial statements and notes to the financial statements.
Annual Improvements to IFRS Accounting Standards – Volume 11
The IASB’s annual improvements process deals with non-urgent, but necessary, clarifications and amendments to IFRS. In July 2024, the IASB issued Annual Improvements to IFRS Accounting Standards — Volume 11. An entity shall apply those amendments for annual reporting periods beginning on or after 1 January 2026. The Annual Improvements to IFRS Accounting Standards - Volume 11, includes amendments to IFRS 1, IFRS 7, IFRS 9, IFRS 10, and IAS 7. These amendments aim to clarify wording, correct minor unintended consequences, oversights, or conflicts between requirements in the standards. The Group is currently working to identify all impacts the amendments will have on the primary financial statements and notes to the financial statements.
The following standards have been issued but are not yet effective and have not been endorsed by the European Union as at 31 December 2025, and were not early adopted by the Group:
IFRS 18 Presentation and Disclosure in Financial Statements
IFRS 18 introduces new requirements on presentation within the statement of profit or loss. It requires an entity to classify all income and expenses within its statement of profit or loss into one of the five categories: operating; investing; financing; income taxes; and discontinued operations. These categories are complemented by the requirements to present subtotals and totals for ‘operating profit or loss’, ‘profit or loss before financing and income taxes’ and ‘profit or loss’. It also requires disclosure of management-defined performance measures and includes new requirements for aggregation and disaggregation of financial information based on the identified ‘roles’ of the primary financial statements and the notes. In addition, there are consequential amendments to other accounting standards. IFRS 18 is effective for reporting periods beginning on or after 1 January 2027, with earlier application permitted. Retrospective application is required in both annual and interim financial statements. The Group is currently working to identify all impacts the amendments will have on the primary financial statements and notes to the financial statements. The initial expected material impacts on Group’s financial statements are as follows:
(a) commitment fees on revolving credit facilities are classified in the operating category, as these do not relate to a specific borrowing;
(b) interest income on cash deposits is classified in the investing category as these financial assets generate returns individually and largely independent of the Group’s other resources;
(c) finance costs are disaggregated into Interest on loans and borrowings and interest on other liabilities and are classified in the financing category.
IFRS 19 Subsidiaries without Public Accountability: Disclosures
IFRS 19 permits subsidiaries without public accountability to use reduced disclosure requirements if their parent company (either ultimate or intermediate) prepares publicly available consolidated financial statements in compliance with IFRS accounting standards. These subsidiaries must still apply the recognition, measurement and presentation requirements in other IFRS accounting standards. Unless otherwise specified, eligible entities that elect to apply IFRS 19 will not need to apply the disclosure requirements in other IFRS accounting standards. IFRS 19 is effective for reporting periods beginning on or after 1 January 2027, with early application permitted. The standard has not yet been endorsed by the EU. This amendment is not expected to have a material impact on the Group.
4 Significant accounting estimates and judgements in applying accounting policies
Valuation of investment property
Investment property is stated at its fair value based on valuation reports prepared by international appraisers as at 30 June and 31 December each year. Valuations are based on discounted cash flow projections based on reliable estimates of future cash flows, using discount rates that reflect current market assessments of the uncertainty in the amount and timing of the cash flows. These are supported by the terms of any existing lease and other contracts and by external evidence such as current market rents for similar properties in the same location and condition.
In preparing the valuation reports on the Group’s investment property, the external appraisers excluded distressed sales when considering comparable sales prices (used for valuation of plots of land held for development). Management reviewed the appraisers’ assumptions relating to the discounted cash flow models used in the valuations and confirmed that factors such as the discount rate applied have been appropriately determined considering the market conditions at the end of the reporting period.
Valuations of the income generating properties are based on cash flow statements, in which the present value of net operating income during a ten-year period and the residual value of the property at the end of the period are calculated.
Forecasts of net operating income are based on leases signed at the time of the valuation date, the estimated rental values for existing leases when they expire and the estimated achievable rental values of the existing vacancies. The value of long-term vacancies is estimated based on the properties’ location and condition. The valuers’ assessments of non-recoverable expenses are based on their experience of comparable properties and historical costs provided by the Group.
The discount rates used are nominal returns on total capital before tax and vary between 7.80% and 11.75% (2024: 7.80% and 11.95%). The required rates of return are based on assessments of the market’s required returns for similar properties. The discount rate is set individually for each property and is based on the condition and location, the stability of the tenants and lease duration.
Further information relating to sensitivity of material accounting estimates used in the valuation of investment property is presented in Note 8.
Functional currency
In assessing the functional currency of the Group, including the Company and its subsidiaries, management considers factors such as the local currencies of the countries where the Group operates, as well as the currency that mainly influences rental prices for its properties, the currency that mostly influences labour, material and other costs of providing its services, the currency in which funding is accessed by the Group.
Although the competitive forces and regulations that determine the sales prices of goods and services are present in the countries which use different currencies than EUR, the macroeconomic developments in these countries to some extent is influenced by the eurozone. In addition, in real estate, leases agreements in the countries where the Group operates, as well as the financing of properties are generally denominated in EUR.
The Group predominately concludes its lease agreements in Euro (or, if these contracts are not concluded in Euro, they are indexed to the Euro exchange rate), even if invoiced in local currencies. Agreements for construction and development of investment properties are negotiated and concluded in EUR. Administrative and corporate expenses, such as advisory fees, audit fees, valuation fees, asset management fees are mostly negotiated and contracted in EUR. Salary and other employee related costs, although denominated in local currencies, are benchmarked to EUR.
Financing contracted by the Group, which include bonds, unsecured credit facilities and secured bank loans is denominated and settled in EUR. Interest paid on bank loans is linked to Euribor. Intra-group funding for property development is also denominated and settled in EUR.
In terms of transactions on the real estate market, acquisitions and sales of properties are negotiated and contracted in EUR in all jurisdictions the Group operate, due to the active international investors in those markets. This is also substantiated in external valuation reports, as valuations of properties are prepared in EUR.
In conclusion, management assessed that EUR is the functional currency for the Group, including the Company and its subsidiaries.
Current and deferred tax expense
The Group is subject to income taxes on taxable profits of its companies’ operating in all jurisdictions. The calculation of the Group’s tax charge and provisions for income taxes necessarily involves a degree of estimation and judgment in evaluating the nature of its companies’ transactions and their respective tax treatment.
Significant management judgement is required to determine the amount of deferred tax assets that can be recognised, based upon the likely timing and the level of future taxable profits, together with future tax planning strategies.
5 Financial risk management and financial instruments
The Group has exposure to the following risks due to its use of financial instruments: credit, liquidity, and market, including currency and interest rate. This note presents information about the Group’s exposure to each, as well as its objectives, policies and processes for measuring and managing risk.
The Board of Directors has overall responsibility for the establishment and oversight of the Group’s risk management framework. The Board of Directors has delegated the responsibility for developing this framework to the Risk Committee. This Committee reports to the Board of Directors on its activities, oversees how management monitors compliance policies and procedures, and reviews the adequacy of the framework regarding the risks faced.
The Group’s policies are established to identify and analyse the risks it may encounter by performing its activities, to set appropriate limits and controls, and to monitor risks and adherence to limits. These policies and systems are reviewed regularly to reflect changes in market conditions and Group activities.
The Group’s operations have demonstrated resilience in the face of macroeconomic headwinds and geopolitical events. While military conflicts, such as those in Ukraine and the Middle East, and global tariff policies have not directly impacted Group operations, the broader landscape has influenced investor sentiment and the European commercial real estate sector.
Despite challenges like sluggish global economic growth and geopolitical tensions, the CEE region, where Nepi Rockcastle operates, demonstrated resilience with positive GDP growth and an expanding middle class. This resilience is reflected in the Group's strong financial performance in 2025, with significant NOI growth and proactive debt management.
Management has assessed these risks as follows:
Going Concern
Having considered the potential impact of military conflicts and the overall macroeconomic environment on revenues, cash flows and operations, management concluded that there are no material uncertainties relating to the Group’s ability to continue as a going concern. The evolving fiscal landscape in Romania, one of the Group's significant markets, might have a dampening effect on consumer spending. Despite this, the Group’s tenant sales in 2025 were strong and projections for the next 12 months remain resilient.
Impact on credit risk tenant receivable
The Group did not experience significant changes in the collection rate of receivables from tenants in 2025. Tenant sales continued to grow, indicating their financial robustness. Collection rate has been consistently high at 99%.
Disruptions in the Group’s development program
The Group's in-house development team actively manages construction projects, mitigating potential disruptions due to price fluctuations and availability of construction materials. Fixed-price contracts with suppliers further mitigate this risk.
Refinancing risk and impact on loan covenants
The Group successfully raised considerable funding in 2025 through green bonds, ensuring ample liquidity and proactively managing upcoming debt maturities in October 2026 and July 2027. The Group actively monitors loan covenants, which show ample headroom.
Broader economic impact in the jurisdictions where the Group operates
The Group's diversified portfolio across eight CEE countries and a wide range of tenants mitigates risks associated with adverse macroeconomic conditions. The annual rent indexation mechanism provides an economic hedge against inflation. Rents paid by the top ten tenants represented 25.7% of the Group’s revenues in the year ended 31 December 2025 ( 31 December 2024: 25.3%). The Group’s main tenants are leading companies in their sectors and all tenants are subject to a financial review before signing leases with the Group.
Valuers included in their valuation assumptions factors resulting from the indirect impact of the current macroeconomic environment, through:
stable valuation yields, with no significant changes compared with previous period;
adjusting future cash flows with risk premia, to account for additional unrecoverable expenses and potential collection difficulties (on average 0.5%( 31 December 2024: 0.5%));
indexing the future cash flows with projected inflation rates for the next period (on average 2.1% ( 31 December 2024: 2.2%)).
More details on valuation assumptions and inputs are provided in Notes 8 and 9.
5.1 Credit risk
Credit risk is the risk of financial loss to the Group if a counterparty to a financial instrument fails to meet its contractual obligations and arises principally from the Group’s receivables from tenants and cash and cash equivalents.
The gross carrying amount of financial assets represents the maximum credit exposure. The maximum exposure to credit risk at the reporting date is set out below:
Credit exposure on financial instruments | Note | 31 Dec 2025 | 31 Dec 2024 |
|---|---|---|---|
in € thousand | |||
Tenant receivables | 97,294 | 106,650 | |
Cash and cash equivalents | 313,994 | 448,498 | |
Derivative financial assets at fair value through profit or loss1 | 4,544 | 9,662 | |
Loans to participants in the Share Purchase Scheme2 | 854 | 890 | |
Total | 416,686 | 565,700 |
- Includes both long-term and short-term financial assets at fair value through profit or loss.
- Presented in line Other long-term assets in the Statement of financial position.
Out of the above maximum credit exposure, the balance of Loans to participants in the Share Purchase Scheme is not considered to present credit risk as these are guaranteed with the Company’s shares held as security (see details in Note 18).
When monitoring customer credit risk, customers are grouped according to their credit characteristics, including whether they are an individual or legal entity, the industry they work in, business size and previous financial difficulties.
The exposure to credit risk is mainly influenced by the tenant’s individual characteristics. The Group’s widespread customer base reduces credit risk. The majority of rental income (68% as at 31 December 2025 and as at 31 December 2024) is derived from type A tenants (large international and national tenants; large listed tenants; government and major franchisees and companies with assets and/or turnovers exceeding €200 million), and there is no concentration of credit risk with respect to trade debtors: top 10 tenants account for 25.7% of the rental income as at 31 December 2025 (31 December 2024: 25.3%).
Management has established a credit policy where new customers are analysed individually for creditworthiness before standard payment terms and conditions are offered. When available, the analysis includes external ratings.
The Group establishes an allowance for impairment based on a simplified expected credit loss model in respect of Tenant receivables. For credit exposures for which there has not been a significant increase in credit risk since initial recognition, ECLs are provided for credit losses that result from default events that are possible within the next 12-months (a 12-month ECL). For those credit exposures for which there has been a significant increase in credit risk since initial recognition, a loss allowance is required for credit losses expected over the remaining life of the exposure, irrespective of the timing of the default (a lifetime ECL).
The carrying value of financial assets approximates their fair value. The Group’s exposure to credit risk associated cash and cash equivalents is limited through using financial institutions of good standing for investment and cash handling purposes.
An overview of the tenant receivables net of impairment provision is set out below:
in € thousand | Note | 31 Dec 2025 | 31 Dec 2024 |
|---|---|---|---|
Tenant receivables – gross | 97,294 | 106,650 | |
Less: Impairment provisions | (10,362) | (10,796) | |
TENANT RECEIVABLES - NET OF IMPAIRMENT PROVISION | 86,932 | 95,854 |
Reconciliation of impairment provisions is set out below:
Movement of provisions for doubtful debtors | 31 Dec 2025 | 31 Dec 2024 |
|---|---|---|
in € thousand | ||
Carrying value at beginning of the year | (10,796) | (10,701) |
Additional provision from properties acquired during the year | - | (2,607) |
Additional expected credit losses | (3,691) | (3,138) |
Write-off of receivables | 2,013 | 2,062 |
Recovery of previously expected credit losses | 2,012 | 3,702 |
Released in relation to assets held for sale disposed during the year | - | 116 |
Foreign exchange gain/(loss) | 100 | (230) |
Carrying value | (10,362) | (10,796) |
The expected loss rates are based on the historical payment profiles of tenants and the corresponding historical credit losses, adjusting for forward looking macroeconomic data. For example, if forecast economic conditions are expected to deteriorate over the next year which can lead to an increased number of defaults in a customer segment, the historical default rates are adjusted upwards. At every reporting date, the historical observed default rates are updated and changes in the forward-looking estimates are analysed. On that basis, the provision for doubtful debtors as at 31 December 2025 was determined as follows for Tenant receivables:
31 December 2025 | Current | 0-30 days | 31-60 days | 61-90 days | >90 days | Total |
|---|---|---|---|---|---|---|
in € thousand | ||||||
Expected loss rate | 0% | 1% | 11% | 42% | 100% | |
Gross carrying amount – trade receivables | 76,700 | 8,907 | 1,321 | 594 | 9,772 | 97,294 |
PROVISION FOR DOUBTFUL DEBTORS | (142) | (74) | (143) | (249) | (9,754) | (10,362) |
The impairment provision for Tenant receivables as at 31 December 2024 is set out below:
31 December 2024 | Current | 0-30 days | 31-60 days | 61-90 days | >90 days | Total |
|---|---|---|---|---|---|---|
in € thousand | ||||||
Expected loss rate | 0% | 0% | 6% | 25% | 87% | |
Gross carrying amount – trade receivables | 81,730 | 10,759 | 1,250 | 958 | 11,953 | 106,650 |
PROVISION FOR DOUBTFUL DEBTORS | (69) | (16) | (76) | (241) | (10,394) | (10,796) |
The contractual maturity profile of the Financial assets at fair value through profit or loss is disclosed below:
31 December 2025 | 3–12 months | over 1 year –3 years | over 3 years –5 years | Total |
|---|---|---|---|---|
in € thousand | ||||
Financial assets at fair value through profit or loss | 2,087 | 2,084 | 373 | 4,544 |
31 December 20241 | 3–12 months | over 1 year –3 years | over 3 years –5 years | Total |
|---|---|---|---|---|
in € thousand | ||||
Financial assets at fair value through profit or loss | 55 | 5,025 | 4,582 | 9,662 |
- 2024 figures were amended by adding more granularity for the 1–5 years time band, which is now split into over 1 year–3 years time band and over 3 years–5 years time band.
While cash and cash equivalents are also subject to the impairment requirements of IFRS 9, the expected credit losses are immaterial.
For purposes of liquidity management, the Group has various deposit accounts and negotiated current account agreements with several banks. The arrangements in place result in an optimized mix between flexibility and reduced interest charges or best interest offered. The banks’ credit ratings, as well as exposure per each bank are constantly monitored. At 31 December 2025, 96% of the Group's cash was held with investment-grade rated banks (31 December 2024: 79%), as detailed below:
Cash and cash equivalents | 31 Dec 2025 | 31 Dec 2024 |
|---|---|---|
Held with banks as rated by Moody’s | ||
Aa2 | 2% | 0% |
Aa3 | 15% | 6% |
A1 | 34% | 38% |
A2 | 7% | 8% |
A3 | 9% | 9% |
Baa1 | 28% | 18% |
Ba2 | 1% | 0% |
Held with banks without a formal credit rating | 4% | 21%1 |
Total | 100% | 100% |
- The cash held with banks without a formal credit rating at 31 December 2024 was mostly the cash held in the Serbian bank account following the sale of Promenada Novi Sad. This was transferred to a rated bank account in the Netherlands in February 2025. Adjusted for this amount held in Serbian bank, 99% of Group cash balances were held with formal credit rated banks.
5.2 Liquidity risk
Liquidity risk is the risk that the Group will not be able to meet its financial obligations when due. The Group’s approach to managing this risk ensures, as far as possible, it will always have enough liquidity to meet its liabilities when due, under normal and stressed conditions, without incurring unacceptable losses or risking damage to its reputation. To ensure this occurs, the Group prepares budgets, cash flow analyses and forecasts, which enable the Directors to assess the level of financing required for future periods. Budgets and projections are used to assess any future potential investments and are compared to existing funds held to evaluate the nature, and extent of any future funding requirements.
Further reference to bank loan maturity analysis is made in Note 19.
The table below presents undiscounted cash flows for all financial liabilities, computed at the contractual rates:
31 Dec 2025 | Note | under 3 months | 3–12 months | over 1 year –3 years | over 3 years –5 years | over 5 years | Total undiscounted cash flows | Total carrying amount |
|---|---|---|---|---|---|---|---|---|
in € thousand | ||||||||
Bonds (including estimated future interest) | 53,947 | 293,082 | 348,286 | 334,197 | 1,072,343 | 2,101,855 | 2,016,331 | |
Bank loans (including estimated future interest) | 15,004 | 41,962 | 336,685 | 712,061 | 18,451 | 1,124,163 | 998,349 | |
Trade and other payables | 138,611 | 40,677 | - | - | - | 179,288 | 179,289 | |
Other long-term liabilities | - | - | 14,817 | 14,841 | 6,832 | 36,490 | 36,490 | |
Lease liabilities (including estimated future interest) | 3,081 | - | 6,161 | 6,161 | 184,995 | 200,398 | 91,257 | |
Total | 210,643 | 375,721 | 705,949 | 1,067,260 | 1,282,621 | 3,642,194 | 3,321,716 |
31 Dec 20241 | Note | under 3 months | 3–12 months | over 1 year –3 years | over 3 years –5 years | over 5 years | Total undiscounted cash flows | Total carrying amount |
|---|---|---|---|---|---|---|---|---|
in € thousand | ||||||||
Bonds (including estimated future interest) | 37,548 | 38,518 | 1,087,554 | 57,370 | 1,042,568 | 2,263,558 | 2,001,423 | |
Bank loans (including estimated future interest) | 15,989 | 45,079 | 115,343 | 888,073 | 79,292 | 1,143,776 | 962,945 | |
Trade and other payables | 143,876 | 43,208 | - | - | - | 187,084 | 187,084 | |
Other long-term liabilities | - | - | 13,409 | 10,879 | 6,305 | 30,593 | 30,593 | |
Lease liabilities (including estimated future interest) | 2,889 | - | 5,864 | 5,864 | 179,163 | 193,780 | 85,949 | |
Total | 200,302 | 126,805 | 1,222,170 | 962,186 | 1,307,328 | 3,818,791 | 3,267,994 |
- 2024 figures were amended by adding more granularity for the 1–5 years time band, which is now split into over 1 year–3 years time band and over 3 years–5 years time band.
5.3 Market risk
Market risk is the risk that changes in market prices, such as foreign exchange rates, interest rates or equity prices will affect the Group’s fair value or future cash flows of financial instruments. The objective of market risk management is to manage market risk exposures within acceptable parameters, while optimising returns. The carrying value of financial assets and liabilities approximates their fair value, except for the carrying value of bonds.
5.3.1 Currency risk
Group’s current assets and liabilities are exposed to foreign currency risk on purchases and receivables denominated in Romanian leu (RON), Polish zloty (PLN), Bulgarian Lev (BGN), Hungarian forint (HUF), Serbian dinar (RSD), Czech crown (CZK) and South African rand (ZAR). Cash inflows received in other currencies than Euro are converted to Euro using the spot rate available on the collection date. The amount converted to Euro is the net amount of cash inflow in a foreign currency and the estimated cash outflow in the same currency. The Group applies this policy to control its currency exposures in respect of monetary assets and liabilities denominated in currencies other than EUR. Sensitivities of profit or loss to reasonably possible changes in exchange rates applied at the financial position date relative to the local currency of the respective Group entities, with all other variables such as interest rates held constant, are immaterial.
5.3.2 Interest rate risk
Interest rate risk is the risk that the future cash flows of a financial instrument will fluctuate because of changes in market interest rates. The Group is exposed to interest rate risk on loans, borrowings and cash balances held. Group policy is to substantially hedge this risk through the use of derivative financial instruments. As at 31 December 2025 and 31 December 2024, the Group held interest rate instruments in the form of interest rate swaps and interest rate caps, as further disclosed in Note 20.
in € thousand | 31 Dec 2025 | 31 Dec 2024 |
|---|---|---|
Bank loans | 998,349 | 962,945 |
Rate capped | 482,804 | 523,549 |
Rate swapped | 38,800 | 39,400 |
Variable rate1 | 487,164 | 411,308 |
Accrued interest on loans and deferred loan costs | (10,419) | (11,312) |
- As of 31 December 2025, the balance exposed to variable interest rate corresponds to 16% of the total outstanding debt (31 December 2024: 14%), mainly relating to the IFC loan balance.
Loans and borrowings balances are subject to change over the year. A change of 50 basis points (bps) in interest rates would have increased/(decreased) equity and profit for the year as shown below. Calculations are based on the loans and borrowings balances outstanding at the respective balance sheet dates. This analysis assumes that all other variables, particularly foreign currency rates, remain constant. All sensitivity analysis calculations are presented below.
The benchmark rate for the bank loans with an outstanding amount of €998,349 thousand as at 31 December 2025 (2024: €962,945 thousand) is Euribor 3 months; if this rate is less than zero, Euribor shall be deemed to be zero.
Loans and borrowings with fixed or swapped interest rates are not affected by market changes in interest rates.
A change of 50 basis points (bps) in interest rates would have increased/(decreased) equity and profit for the year as shown below. Calculations are based on loans and borrowings balances outstanding at 31 December 2025 and at 31 December 2024.
in € thousand | Note | 31 Dec 2025 | 31 Dec 2024 |
|---|---|---|---|
Loans to participants in the Share Purchase Scheme | 854 | 890 | |
Loans and borrowings (variable or capped rate) | (969,968) | (934,857) | |
Total | (969,114) | (933,967) |
31 Dec 2025 | Profit or loss 50bps increase | Profit or loss 50bps decrease | Equity 50bps increase | Equity 50bps decrease |
|---|---|---|---|---|
in € thousand | ||||
Loans to participants in the Share Purchase Scheme (including accrued interest) | 4 | (4) | 4 | (4) |
Loans and borrowings (variable or capped rate)1 | (2,448) | 2,472 | (2,448) | 2,472 |
Total | (2,444) | 2,468 | (2,444) | 2,468 |
- Calculation is based considering loans' specifics and the allocated hedges (CAPs) net of tax.
31 Dec 2024 | Profit or loss 50bps increase | Profit or loss 50bps decrease | Equity 50bps increase | Equity 50bps decrease |
|---|---|---|---|---|
in € thousand | ||||
Loans to participants in the Share Purchase Scheme (including accrued interest) | 4 | (4) | 4 | (4) |
Loans and borrowings (variable or capped rate)1 | (1,532) | 1,957 | (1,532) | 1,957 |
Total | (1,528) | 1,953 | (1,528) | 1,953 |
- Calculation is based considering loans' specifics and the allocated hedges (CAPs) net of tax.
5.4 Fair value of financial instruments
Set out below, is an overview of financial assets and liabilities held by the Group as at 31 December 2025:
in € thousand | Carrying amount | Fair value | Measurement |
|---|---|---|---|
Assets | |||
Financial assets at amortised cost | |||
Cash and cash equivalents | 313,994 | 313,994 | The book value of cash approximates their fair value, as these financial instruments have a short maturity. |
Trade and other receivables | 113,533 | 113,533 | The book value of short-term receivables approximates their fair value, as these financial instruments have a short maturity. |
Financial assets at fair value through profit or loss | |||
Interest rate derivatives | 4,544 | 4,544 | The fair value of derivatives is based on fair value quotes from counterparty banks. |
Total | 432,071 | 432,071 | |
Liabilities | |||
Financial liabilities at amortised cost | |||
Bonds | 2,016,331 | 1,986,400 | The fair value of bonds is based on market trading prices. |
Bank loans | 998,349 | 998,349 | The book value of loans approximates their fair value. |
Trade and other payables | 179,289 | 179,289 | The book value of short-term payables approximates their fair value, as these financial instruments have a short maturity. |
Lease liabilities | 91,257 | 91,257 | The present value of lease payments is recognised by discounting the contractual lease payments using the rate that the lessee would have to pay to borrow the funds necessary to obtain an asset of similar value to the right-of-use asset in a similar economic environment with similar terms, security and conditions. |
Total | 3,285,226 | 3,255,295 |
Set out below, is an overview of financial assets and liabilities held by the Group as at 31 December 2024:
in € thousand | Carrying amount | Fair value | Measurement |
|---|---|---|---|
Assets | |||
Financial assets at amortised cost | |||
Cash and cash equivalents | 448,498 | 448,498 | The book value of cash approximates their fair value, as these financial instruments have a short maturity. |
Trade and other receivables | 115,947 | 115,947 | The book value of short-term receivables approximates their fair value, as these financial instruments have a short maturity. |
Financial assets at fair value through profit or loss | |||
Interest rate derivatives | 9,662 | 9,662 | The fair value of derivatives is based on fair value quotes from counterparty banks. |
Total | 574,107 | 574,107 | |
Liabilities | |||
Financial liabilities at amortised cost | |||
Bonds | 2,001,423 | 1,966,050 | The fair value of bonds is based on market trading prices. |
Bank loans | 962,945 | 962,945 | The book value of loans approximates their fair value. |
Trade and other payables | 187,084 | 187,084 | The book value of short-term payables approximates their fair value, as these financial instruments have a short maturity. |
Lease liabilities | 85,949 | 85,949 | The present value of lease payments is recognised by discounting the contractual lease payments using the rate that the lessee would have to pay to borrow the funds necessary to obtain an asset of similar value to the right-of-use asset in a similar economic environment with similar terms, security and conditions. |
Total | 3,237,401 | 3,202,028 |
6 Internal controls to manage risks
The Board of Directors is responsible for the Group’s system of internal control and for reviewing its effectiveness. This system is designed to mitigate rather than eliminate the risk of failure to meet business objectives, and can only provide reasonable, not absolute, assurance against material misstatement or loss.
The key features of the Group’s system of internal control include:
Strategic and business planning: the Group prepares, and agrees, a business plan each year, to which the performance of the business is regularly monitored;
Investment appraisal: capital projects, major contracts and business and property acquisitions are reviewed in detail and approved by the Investment Committee, and/or the Board of Directors where appropriate, in accordance with delegated authority limits;
Financial monitoring: profitability, cash flow and capital expenditure are closely monitored, and key financial information is reported to the Board of Directors regularly, including explanations of variances between actual and budgeted performance; and
Systems of control procedures and delegated authority: clearly defined guidelines and approval limits exist for capital and operating expenditure and other key business transactions and decisions.
7 Capital management
The primary objective of the Group’s capital management is to ensure it complies with its quantitative banking covenants and maintains a strong credit rating. During the year, no changes were made in the objectives, policies or processes.
Capital is primarily monitored using the gearing ratio (Loan-to-value or “LTV”), which was 32.8% (31 December 2024: 32.1%). The Group’s long-term strategic LTV threshold is 35%. The ratio is computed as interest bearing debt less lease liabilities less cash, divided by investment property (including investment property held for sale and excluding the right-of-use assets) and property, plant and equipment related to photovoltaic installations (for 31 December 2024 the ratio was computed as interest bearing debt less lease liabilities less cash, divided by investment property (including investment property held for sale and excluding the right-of-use assets); the 2024 measure excluded photovoltaic installations from the denominator, as this refinement was introduced in 2025). Loan-to-value is a non IFRS measure.
The Group’s policy is to maintain a strong capital base of equity so as to maintain investor, creditor and market confidence and to sustain future business development. In particular, the Group monitors the Debt/ Debt + Equity ratio, a non IFRS measure, calculated as interest bearing debt less lease liabilities less cash, divided by interest bearing debt less lease liabilities less cash and shareholders’ equity. The Debt/ Debt + Equity ratio threshold of the Group is 40%. As at 31 December 2025, the Debt/ Debt + Equity ratio was 35.0% (31 December 2024: 33.9%). The Board of Directors also monitors the level of distributions to shareholders. Neither the Company, nor its subsidiaries, are subject to externally imposed capital requirements, except that the Group’s subsidiaries are subject to compliance with bonds and bank borrowings’ covenants, as presented in Note 19.
The Group ensures it retains comfortable levels of access to liquidity to finance the Group’s ongoing operations and further investment opportunities.
8 Investment property in use
Movement in investment property in use | Note | 31 Dec 2025 | 31 Dec 2024 |
|---|---|---|---|
in € thousand | |||
Carrying value at beginning of year | 7,694,798 | 6,627,247 | |
Additions from asset deals | 959 | 759,666 | |
Capital expenditure | 66,480 | 51,373 | |
Transferred from investment property under development | 26,694 | 65,798 | |
Fair value adjustments | 160,581 | 183,942 | |
Remeasurement of right-of-use assets | 5,798 | - | |
Additions to the right-of-use assets from acquired assets | - | 29,840 | |
Fair value adjustment of right-of-use asset | (490) | (412) | |
Transfers from property, plant and equipment | 1,684 | 556 | |
Investment property reclassified to property, plant and equipment | - | (23,212) | |
Investment property reclassified as held for sale | (9,075) | - | |
CARRYING VALUE | 7,947,429 | 7,694,798 |
As at 31 December 2025, the balance of investment property included also right-of-use assets of €91,257 thousand (2024: €85,949 thousand) representing long-term land concessions for the Group's Polish properties contracted from local government.
Investment property is carried at fair value and is independently assessed on a semi-annual basis, as at 30 June and 31 December.
For the years ended 31 December 2025 and 31 December 2024 respectively, the Group commissioned independent appraisal reports on its investment property from Colliers International, Cushman&Wakefield and Affiliate Partners and Jones Lang LaSalle, all of whom are members of the Royal Institution of Chartered Surveyors (RICS). Valuations are prepared in accordance with the RICS Valuation - Global Standards 2025 (the “Red Book”, issued 2024 and effective 31 January 2025) and ANEVAR Valuation Standards - 2025 Edition which incorporate the International Valuation Standards 2025 Edition (“IVS”).
All investment property in use is valued by the Income Method. For the years ended 31 December 2025 and 31 December 2024 respectively, the applied method used for all investment property in use was discounted cash flow (“DCF”).
DCF uses explicit assumptions regarding the benefits and liabilities of ownership over the asset’s life, including an exit, or terminal, value. As an accepted method within the Income Method to valuation, the DCF method involves the projection of a series of cash flows onto a real property interest. To these projected cash flow series, an appropriate, market-derived discount rate is applied to establish the present value of cash inflows associated with the real property.
The duration of cash flow, and the specific timing of inflows and outflows, are determined by events such as rent reviews, lease renewal and related lease-up periods, re-letting, redevelopment or refurbishment. The appropriate duration is typically driven by market behaviour. In the case of investment property, periodic cash flow is typically estimated as gross income less vacancy, non-recoverable expenses, collection losses, lease incentives, maintenance costs, agent and commission fees, and other operating and management expenses. The series of periodic net cash inflows, combined with the estimated terminal value anticipated at the end of the projection period, is then discounted. For all investment property in use, the current use equates to the highest and best use.
The Group provides all information necessary for the valuations, including detailed tenancy schedules, comprising information on occupied and vacant units, unit areas and numbers, lease commencement and expiry dates, break options and indexation clauses. All properties are inspected by representatives of external valuers once a year.
The Group’s valuers note in their valuation reports that wherever appropriate, sustainability and environmental (ESG) matters are an integral part of the valuation approach. They have performed an analysis of the ESG criteria and determined the level of alignment of the subject assets to the required standards and noted that this represents only a qualitative assessment which gives an indication on the level of alignment of the subject assets to the ESG legal and market practice. However, due to the lack of market proofs regarding the impact in the market value of ESG criteria and lack of data regarding the total costs required by the improvement of the assessed real estate assets from ESG scoring point of view, the valuers noted that there is not direct correlation between the estimation of the market value of the subject assets and the qualitative analysis of the ESG criteria.
As at 31 December 2025, the investment property in use had an EPRA Vacancy Rate of 1.2% (31 December 2024: 1.7%). EPRA Vacancy Rate is a non-IFRS measure which is defined in section Other information, Glossary.
As compared to the valuations on 31 December 2024, the estimated rental values generally increased, supported by the good performance of the assets, with no significant changes in valuation yields.
As at 31 December 2025, the Group’s portfolio included retail properties and two office properties.
The Group currently discloses fair values according to a ‘fair value hierarchy’ (as per IFRS 13) which categorises the inputs used in valuation techniques into three levels. The hierarchy gives the highest priority (Level 1) to quoted prices in active markets for identical assets or liabilities and the lowest priority (Level 3) to unobservable inputs. The fair value hierarchy is explained below:
Level 1: quoted prices (unadjusted) in active markets for identical assets or liabilities;
Level 2: use of a model with inputs (other than quoted prices included within Level 1) that are directly, or indirectly, observable market data; and
Level 3: use of a model with inputs not based on observable market data.
The Group’s investment property is categorised as Level 3. For assets and liabilities that are recognised in the financial statements on a recurring basis, the Group determines whether transfers have occurred between levels in the hierarchy by re-assessing categorisation (based on the lowest level input that is significant to the fair value measurement as a whole) at the end of each reporting period. There were no transfers between hierarchy levels during the year.
The significant unobservable inputs used in the fair value measurement categorized within Level 3 of the fair value hierarchy of the Group’s property portfolio, together with the impact of significant movements in these inputs on the fair value measurement, are detailed below:
Unobservable input | Impact on fair value of increase in input |
|---|---|
Estimated rental value | Increase |
Discount rate | Decrease |
Capitalisation rate for terminal value | Decrease |
Information relating to fair value measurement using significant unobservable inputs (Level 3) as at 31 December 2025 for retail properties is presented in the table below:
Segment | Valuation technique | Estimated market rental value | Discount rate | Capitalisation rate for terminal value |
|---|---|---|---|---|
(yearly amount in ‘000 €) | (%) | (%) | ||
Romania | Discounted cash flow | 335 - 27,838 (14,551)1 | 8.85% - 10.35% (9.65)1 | 6.75% - 8.25% (7.55)1 |
Poland | Discounted cash flow | 2,908 - 27,249 (18,004)1 | 7.80% - 10.20% (8.35)1 | 6.60% - 9.00% (7.08)1 |
Slovakia | Discounted cash flow | 3,264 - 12,915 (9,836)1 | 9.00% - 10.25% (9.12)1 | 7.00% - 8.25% (7.12)1 |
Hungary | Discounted cash flow | 19,400 - 21,130 (20,363)1 | 8.70% - 9.50% (9.05)1 | 6.70% - 7.50% (7.05)1 |
Bulgaria | Discounted cash flow | 19,260 - 31,692 (27,098)1 | 10.43% | 7.50% - 7.75% (7.59)1 |
Croatia | Discounted cash flow | 1,847 - 23,319 (21,643)1 | 9.75% | 7.50% - 7.75% (7.73)1 |
Czech Republic | Discounted cash flow | 6,971 - 7,158 (7,067)1 | 9.00% | 7.00% |
Lithuania | Discounted cash flow | 13,520 | 10.00% | 8.25% |
- Amounts or percentages represent weighted averages.
Information relating to fair value measurement using significant unobservable inputs (Level 3) as at 31 December 2024 for retail properties is presented in the table below:
Segment | Valuation technique | Estimated market rental value | Discount rate | Capitalisation rate for terminal value |
|---|---|---|---|---|
(yearly amount in ‘000 €) | (%) | (%) | ||
Romania | Discounted cash flow | 323 - 27,509 (13,945)1 | 8.95% - 10.45%(9.73)1 | 6.75% - 8.25% (7.53)1 |
Poland | Discounted cash flow | 2,973 - 26,710 (17,530)1 | 7.80% - 10.20% (8.34)1 | 6.60% - 9.00% (7.08)1 |
Slovakia | Discounted cash flow | 3,287 - 12,855 (9,816)1 | 9.00% - 10.25% (9.12)1 | 7.00% - 8.25% (7.12)1 |
Hungary | Discounted cash flow | 19,617 - 20,949 (20,343)1 | 8.60% - 9.20% (8.87)1 | 6.60% - 7.20% (6.87)1 |
Bulgaria | Discounted cash flow | 17,224 - 28,872 (24,423)1 | 10.43% | 7.50% - 7.75% (7.60)1 |
Croatia | Discounted cash flow | 1,723 - 19,666 (18,281)1 | 9.75% | 7.50% - 7.75% (7.73)1 |
Czech Republic | Discounted cash flow | 6,850 - 6,974 (6,913)1 | 9.75% | 7.25% |
Lithuania | Discounted cash flow | 13,256 | 10.00% | 8.25% |
- Amounts or percentages represent weighted averages.
Portfolio valuation: sensitivity to changes in the discount rate, exit rate and rental income
The tables below present the change in the valuation of the shopping centre portfolio using different discount rate, exit rate and rental income assumptions than those used by the appraisers as at 31 December 2025:
Discount rate variance | ||||
|---|---|---|---|---|
Country | (50 bps) | (25 bps) | 25 bps | 50 bps |
Romania | 3.39% | 1.68% | -1.64% | -3.24% |
Poland | 3.44% | 1.78% | -1.74% | -3.69% |
Slovakia | 3.55% | 1.76% | -1.72% | -3.38% |
Hungary | 3.63% | 1.79% | -1.77% | -3.50% |
Bulgaria | 2.04% | 1.00% | -0.97% | -1.91% |
Croatia | 3.39% | 1.69% | -1.76% | -3.55% |
Czech Republic | 3.55% | 1.80% | -1.70% | -3.44% |
Lithuania | 3.31% | 1.65% | -1.65% | -3.19% |
Total | 3.33% | 1.68% | -1.64% | -3.34% |
Exit rate variance | ||||
|---|---|---|---|---|
Country | (50 bps) | (25 bps) | 25 bps | 50 bps |
Romania | 6.96% | 3.36% | -3.14% | -6.09% |
Poland | 7.76% | 3.74% | -3.48% | -6.72% |
Slovakia | 7.60% | 3.64% | -3.40% | -6.57% |
Hungary | 7.94% | 3.81% | -3.57% | -6.88% |
Bulgaria | 5.11% | 2.41% | -2.16% | -4.10% |
Croatia | 6.04% | 3.12% | -3.32% | -6.87% |
Czech Republic | 7.81% | 3.75% | -3.44% | -6.68% |
Lithuania | 6.38% | 3.07% | -2.95% | -5.67% |
Total | 7.12% | 3.44% | -3.23% | -6.28% |
Rental Income (ERV) | ||||
|---|---|---|---|---|
Country | -10% | -5% | 5% | 10% |
Romania | -10.06% | -5.03% | 5.03% | 10.06% |
Poland | -7.16% | -3.60% | 3.63% | 7.31% |
Slovakia | -8.50% | -4.24% | 4.26% | 8.50% |
Hungary | -8.24% | -4.13% | 4.11% | 8.24% |
Bulgaria | -7.56% | -3.80% | 3.83% | 7.68% |
Croatia | -7.80% | -3.88% | 3.92% | 7.84% |
Czech Republic | -8.43% | -4.21% | 4.21% | 8.43% |
Lithuania | -6.91% | -3.42% | 3.42% | 6.85% |
Total | -8.45% | -4.23% | 4.25% | 8.51% |
9 Investment property under development
Movement in investment property under development | Note | 31 Dec 2025 | 31 Dec 2024 |
|---|---|---|---|
in € thousand | |||
Carrying value at beginning of year | 231,797 | 197,743 | |
Additions from construction in progress | 77,942 | 88,061 | |
Fair value adjustments | 2,228 | 12,020 | |
Assets which became operational and were transferred to Investment property in use | (26,694) | (65,798) | |
Investment property under development reclassified to property, plant and equipment | - | (229) | |
Carrying value | 285,273 | 231,797 |
Land included in Investment property under development is carried at fair value and is independently assessed on a semi-annual basis. For the years ended 31 December 2025 and 31 December 2024 respectively, the Group commissioned independent reports to Colliers International, Cushman&Wakefield and Affiliate Partners and Jones Lang LaSalle, based on which the fair value of land was adjusted. Land included in Investment property under development is classified Level 3 on the fair value hierarchy as defined in IFRS 13.
The valuation technique is sales comparison or residual approach, in accordance with RICS Valuation Standards and ANEVAR Valuation Standards (for Romanian properties). Land under sales comparison method was valued by the external appraisers using the recent transactions of similar land for development in the proximity of the subject property.
The estimated fair value of Investment property under development would increase/(decrease) if the market comparable price per square meter is higher/(lower) as there is a direct relationship between the fair value and the market comparable price per square meter.
The residual approach determines the residual land value by subtracting purchase and development cost from the expected gross development value of the project at completion. The construction works in the investment property under development are held at cost, and their carrying value is a reasonable approximation of their fair value. The methods have been consistently applied for the comparative period.
Borrowing costs capitalised in 2025 amount to €6,104 thousand (2024: €4,379 thousand) and were calculated using an average annual interest rate of 3.2% (2024: 2.7%).
The balance of Investment property under development split by land carried at fair value and additions from construction works held at cost (which approximate fair value) is detailed below:
Investment property under development | 31 Dec 2025 | 31 Dec 2024 |
|---|---|---|
in € thousand | ||
Land (at fair value) | 110,811 | 108,314 |
Construction works (at cost) | 174,462 | 123,483 |
Total | 285,273 | 231,797 |
10 Other long-term assets
Other long-term assets are classified below:
in € thousand | 31 Dec 2025 | 31 Dec 2024 |
|---|---|---|
Loans to participants under the Share Purchase Scheme | 854 | 890 |
Intangible assets | 6,614 | 5,822 |
Non-current receivables | 31,258 | 4,648 |
Total | 38,726 | 11,360 |
The increase in Non-current receivables in 2025 is the effect of payments made to Romanian Tax Authorities, following tax inspections performed at several Romanian entities of the Group, which resulted in additional tax liabilities imposed by the tax authorities. The recognition of these amounts paid as receivable is based on the assessment that these are to be recovered by the Group. Refer to Note 35 for more details.
11 Property, plant and equipment
The photovoltaic installations that were built on the rooftops of Romanian and Lithuanian retail properties were initially recognised in Investment property and measured at fair value as part of those individual properties. In 2024, the Board approved the roll-out of the energy project to the remaining countries in the portfolio and investment in greenfield ready-to-build photovoltaic fields in Romania. The investments expand the Group's green energy generating capacity and increase the coverage of electricity consumption needs of its tenants across the portfolio.
Consequently, the photovoltaic installations were reclassified from Investment property to Property, plant and equipment effective from 1 September 2024. The initial cost of recognition of the photovoltaic installations as plant and equipment is the fair value of the assets at the date of the transfer. The Group adopted the cost model for subsequent measurement of photovoltaic installations, whereby assets are valued at their cost price, net of accumulated depreciation and accumulated impairment losses, if any.
Photovoltaic installations include photovoltaic panels, mounting and support structures, Alternating Current/Direct Current infrastructure (wiring and cables, switches, etc.), inverters, electric panels, automation and control systems.
In 2024 NEPI Rockcastle started to produce solar power energy from 38MW of power-generating capacity installed on the 27 properties from Romania and one in Lithuania. In October 2025 NEPI Rockcastle has completed its first greenfield photovoltaic project in Chisineu-Cris, with commercial operations starting in 2026.
Management performed an impairment assessment for Photovoltaic installations as at 31 December 2025 and concluded that no impairment arose in relation to the carrying amount.
The "Other" category of property, plant and equipment presented in the table below include office furniture, improvements and equipment.
in € thousand | Note | Photovoltaic installations | Photovoltaic installations under construction | Other | Total |
|---|---|---|---|---|---|
Cost | |||||
At 1 January 2025 | 23,750 | 12,972 | 9,197 | 45,919 | |
Additions from assets deals | - | 980 | - | 980 | |
Additions | - | 51,0311 | 1,199 | 52,230 | |
Transfer to Investment property in use | - | - | (1,684) | (1,684) | |
Transfers | 30,032 | (30,032) | - | - | |
At 31 December 2025 | 53,782 | 34,951 | 8,712 | 97,445 | |
Depreciation | |||||
At 1 January 2025 | 447 | - | 3,848 | 4,295 | |
Depreciation charge for the year | 1,623 | - | 419 | 2,042 | |
At 31 December 2025 | 2,070 | - | 4,267 | 6,337 | |
Net book value | |||||
At 1 January 2025 | 23,303 | 12,972 | 5,349 | 41,624 | |
At 31 December 2025 | 51,712 | 34,951 | 4,445 | 91,108 |
- Includes Borrowing costs capitalised of €980 thousand as of 31 December 2025 calculated using an average annual interest rate of 3.2%.
in € thousand | Note | Photovoltaic installations | Photovoltaic installations under construction | Other | Total |
|---|---|---|---|---|---|
Cost | |||||
At 1 January 2024 | - | - | 8,103 | 8,103 | |
Investment property reclassified to property, plant and equipment | 23,212 | - | - | 23,212 | |
Investment property under development reclassified to property, plant and equipment | - | 229 | - | 229 | |
Additions from assets deals | - | 10,559 | 41 | 10,600 | |
Additions | 538 | 2,184 | 1,609 | 4,331 | |
Transfers to Investment property in use | - | - | (556) | (556) | |
At 31 December 2024 | 23,750 | 12,972 | 9,197 | 45,919 | |
Depreciation | |||||
At 1 January 2024 | - | - | 3,358 | 3,358 | |
Depreciation charge for the year | 447 | - | 490 | 937 | |
At 31 December 2024 | 447 | - | 3,848 | 4,295 | |
Net book value | |||||
At 1 January 2024 | - | - | 4,745 | 4,745 | |
At 31 December 2024 | 23,303 | 12,972 | 5,349 | 41,624 |
12 Goodwill
The Group recognised goodwill for the following business acquisitions:
in € thousand | Balance at | Balance at |
|---|---|---|
Pitesti Retail Park (Romania) | 1,671 | 1,671 |
Internalisation of NEPI Investment Management (Romania) | 5,882 | 5,882 |
Aupark Kosice Mall (Slovakia) | 5,189 | 5,189 |
Iris Titan Shopping Center (Romania) | 934 | 934 |
Forum Usti nad Labem (Czech Republic) | 5,646 | 5,646 |
Shopping City Sibiu (Romania) | 9,850 | 9,850 |
Korzo Shopping Centrum (Slovakia) | 2,899 | 2,899 |
Aupark Shopping Center Piestany (Slovakia) | 1,585 | 1,585 |
Arena Centar and Retail Park (Croatia) | 13,512 | 13,512 |
Energit (Poland) | 6,976 | 6,976 |
Paradise Center (Bulgaria) | 9,311 | 9,311 |
Arena Mall (Hungary) | 7,905 | 7,905 |
Galeria Mlyny (Slovakia) | 5,444 | 5,444 |
Total | 76,804 | 76,804 |
There were no movements of goodwill in 2025 and 2024.
According to the Group’s accounting policies based on IFRS, goodwill is tested at least annually for impairment or whenever there is an indication that it may be impaired. The lowest level within the Group at which the goodwill is allocated and monitored for internal management purposes is the CGU, represented by each individual property. CGUs to which the goodwill has been allocated were tested for impairment by comparing their carrying amount with the recoverable value, which is the higher of value in use and fair value less cost to sell.
Goodwill from recognition of deferred taxes at the date of the business combination
All the goodwill summarised in the table above, with the exception of NEPI Investment Management and Energit, resulted from business combinations, as the difference between the deferred tax liability recognised in the balance sheet of the business acquired and the expected tax to be paid in case of a future disposal.
As a consequence, impairment tests performed on this type of goodwill at each reporting date consist in comparing the net asset value of that CGU (composed of the investment property value, goodwill and deferred tax liability balances attributable to the CGU), with the CGUs fair value less cost of disposal.
As a result of this test in 2025, no impairment arose in respect to the goodwill from recognition of deferred taxes at the date of the business combination (31 December 2024: nil).
Goodwill from management and energy trading companies
Goodwill arising at the level of management company, NEPI Investment Management, is monitored at the level of this subsidiary, which employs part of the Group’s key management and charges management fees to property operating companies.
The recoverable amount of NEPI Investment Management and Energit is represented by their value in use, determined based on the DCF derived from the five-year financial budgets for these two entities approved by management. Cash flows beyond the five-year period were extrapolated using the estimated cash flow of year 5. The discount rate used was based on the weighted average cost of capital in the specific geography of the two entities.
As a result of this test, no impairment arose in connection with the above two entities.
13 Trade and other receivables
in € thousand | Note | 31 Dec 2025 | 31 Dec 2024 |
|---|---|---|---|
Tenant receivables (net of ECL) | 86,932 | 95,854 | |
VAT receivable | 15,276 | 9,204 | |
Prepaid property expenses | 6,126 | 8,230 | |
Other receivables | 3,480 | 2,510 | |
Other prepaid fees | 1,719 | 149 | |
Total | 113,533 | 115,947 |
14 Cash and cash equivalents
Cash and cash equivalents by currency | 31 Dec 2025 | 31 Dec 2024 |
|---|---|---|
in € thousand | ||
EUR | 221,286 | 301,218 |
RON | 47,501 | 46,398 |
PLN | 22,124 | 70,433 |
BGN | 12,144 | 11,355 |
HUF | 6,753 | 6,154 |
CZK | 3,573 | 10,930 |
RSD | 105 | 217 |
ZAR | 508 | 1,793 |
Total | 313,994 | 448,498 |
Cash and cash equivalents by type | 31 Dec 2025 | 31 Dec 2024 |
|---|---|---|
in € thousand | ||
Current accounts | 261,570 | 350,366 |
Deposits | 52,300 | 98,000 |
Petty cash | 124 | 132 |
Total | 313,994 | 448,498 |
15 Assets held for sale
There were no disposals of assets held for sale in the year 2025.
Disposals in the comparative year
In July 2024, the Group entered into a binding agreement to dispose of 100% of the shares in the subsidiary holding Promenada Novi Sad in Serbia. The disposal was successfully concluded on 7 October 2024 in accordance with the terms of the agreement for a transaction value of €177 million, generating a gain on sale (adjusted for working capital) of €25.5 million.
In January 2024, the Group sold the industrial property in Romania, Otopeni Warehouse and Logistics, for a transaction value of €4.4 million and a gain on disposal of €0.4 million.
Assets held for sale as at 31 December 2025
At 31 December 2025, the assets held for sale included one non-core property and one industrial property, both located in Romania. The value of the assets held for sale as of 31 December 2025 fully relates to the value of the investment property held for sale at fair value.
15.1 Investment property held for sale
in € thousand | Note | 31 Dec 2025 | 31 Dec 2024 |
|---|---|---|---|
Carrying value at beginning of year | 559 | 151,820 | |
Transfer from investment property in use | 9,075 | - | |
Additions during the period | - | 119 | |
Fair value adjustments | (67) | (170) | |
Disposals | - | (151,210) | |
CARRYING VALUE | 9,567 | 559 |
Investment properties held for sale are carried at fair value and are independently assessed on a semi-annual basis, as at 30 June and 31 December.
For further details regarding valuations techniques and hierarchy used please see information detailed in Note 8.
16 Inventory property
The residential property units (apartments) in Romania are held as inventory property and measured at the lower of cost and net realisable value (“NRV”).
The commencement of development with a plan or a prior agreement to sell represents a change in use and accordingly the project is transferred from investment property to inventory property.
NRV is the estimated selling price in the ordinary course of business, based on market prices at the reporting date, less estimated costs of completion and the estimated costs necessary to make the sale.
As of 31 December 2025 all residential propertiy units were sold.
in € thousand | 31 Dec 2025 | 31 Dec 2024 |
|---|---|---|
Inventory property | - | 4,227 |
17 Share capital and share premium
In February 2025, the Board declared a final distribution of 27.05 euro cents per share for the six months ended 31 December 2024, corresponding to a 90% dividend pay-out ratio, to be received as capital repayment (to be settled from Share capital). Shareholders could have also elected the settlement of the same dividend amount as ordinary cash distribution out of distributable profits (to be settled from Accumulated profit).
The results of the election by NEPI Rockcastle shareholders and their Euro equivalent have been summarised below:
Final distribution for 2024: elections | Number of NEPI Rockcastle shares election | Final distribution per share (euro cents) | EUR equivalent out of the final distribution (thousand) |
|---|---|---|---|
Capital repayment | 567,531,672 | 27.05 | 153,517 |
Dividend out of accumulated profit | 144,825,637 | 27.05 | 39,175 |
Total | 712,357,309 | 192,692 |
In April 2025, the Company repurchased 1,640,511 own shares (representing 0.23% of outstanding ordinary shares in issue) on the market for a total consideration of €10,076 thousand. The cost of repurchased shares was recognised in the treasury shares reserve. Treasury shares do not carry the right to vote at general meetings, to distribution and to the surplus assets of the Group on winding-up.
In August 2025, the Board declared an interim distribution of 27.95 euro cents per share for the six months ended 30 June 2025, corresponding to a 90% dividend pay-out ratio, to be received as capital repayment (to be settled from Share capital). Shareholders could have also elected the settlement of the same dividend amount as ordinary cash distribution out of distributable profits (to be settled from Accumulated profit).
The results of the election by NEPI Rockcastle shareholders and their Euro equivalent have been summarised below:
Interim distribution for 2025: elections | Number of NEPI Rockcastle shares election | Final distribution per share (euro cents) | EUR equivalent out of the final distribution (thousand) |
|---|---|---|---|
Capital repayment | 574,989,643 | 27.95 | 160,710 |
Dividend out of accumulated profit | 135,727,155 | 27.95 | 37,936 |
Impact of foreign exchange hedges1 | (199) | ||
Total | 710,716,7982 | 198,447 |
- For the distribution to be settled as capital repayment and dividend out of accumulated profit, the Group entered into foreign exchange forward agreements to hedge the ZAR: EUR movement. As a result of these hedges, the cash outflow resulting from the cash settlement was €199 thousand more than the nominal exposure. This amount was reflected in the Share premium.
- Excludes 1,640,511 treasury shares as at 31 December 2025.
As a result of the above elections for the settlement of the final distribution for 2024, the interim distribution for 2025 and the repurchase of shares, the impact in the Share capital and Share premium reserves has been set out below:
Movement of ordinary shares | Number of shares | Share capital | Share premium |
|---|---|---|---|
in € thousand | |||
Balance at 1 January 2025 | 712,357,309 | 7,124 | 3,255,148 |
Share capital increase1 | - | 498,650 | (498,650) |
Share capital decrease1 | - | (184,423) | 184,423 |
Capital repayment paid to shareholders | - | (314,227) | - |
Impact of foreign exchange hedges | - | - | 199 |
Repurchase of shares | (1,640,511) | - | - |
Carried forward as at 31 December 2025 | 710,716,798 | 7,124 | 2,941,120 |
- Before each distribution period, the parent Company amended its Articles of Association, as approved by the shareholders through Annual General Meeting voting (in June 2024) and Annual General Meeting voting (in May 2025), by increasing the nominal value of an ordinary share with 0.35 euro. After each distribution, the Company amended its Articles of Association by decreasing the nominal value of the shares with 0.35 euro. The net impact of such adjustment, as reflected by the capital repayment paid to shareholders amounted to €314,227 thousand.
Ordinary shares carry the right to vote at general meetings, to distribution and to the surplus assets of the Group on winding-up.
18 Share-based payments
The Group has implemented incentive plans to reward performance and align the interests of executive directors and key individuals with those of the shareholders.
The aim of the Group’s incentive plan (“Incentive Plan”) is to motivate directors and employees to meet the Group’s short-term and long-term objectives by giving such participants an opportunity to receive performance-based Awards (in cash or shares), on short-term (immediate settlement in cash or shares) or long-term (shares with a vesting component). The Board determines which executive directors are eligible to participate in the Incentive Plan, and the allocation of incentives, based on key performance indicators. The executive directors determine which key employees are eligible to participate in the Incentive Plan, and the allocation of incentives is discretionary, based on key performance indicators and other considerations regarding the employees’ performance.
To date, NEPI Rockcastle has initiated two types of incentive programs that offered share-based payments in exchange for services provided to it by its directors and employees (equity-settled transactions), which are detailed below:
a Purchase Offers (“SPS”)
Under this program, loans were granted to participants in the share purchase schemes (the “Share Purchase Scheme” or “SPS”) to buy shares, the repayment of which could be made in part out of the distribution payable in relation to the shares (the “NRP SPS”). Of the shares initially subscribed for, 20% vested annually. The Group offered each participant the immediate right to subscribe for the permitted number of shares at their market value, less a maximum discount of 5%, together with a loan to fund the purchase. Each loan carried interest at the weighted average rate that the Group can borrow money. Loans are payable in full, together with interest, ten years after its subscription date, but could be repaid earlier. The Company has security interests that ensure the repayment of the principal and interest on the loan given to participants. The NRP SPS is a full recourse scheme (i.e., recourse in relation to loans granted is not limited to shares issued). Pending repayment of the loan, the distributions on such shares are used to repay loan interest. Any excess distribution after interest payment is used to repay the loan.
No shares were issued during 2025 and 2024 under the NRP SPS.
The number of shares outstanding and the loans to participants under the Share Purchase Scheme as at the year-end are summarised below:
NRP SPS | 31 Dec 2025 | 31 Dec 2024 |
|---|---|---|
Number of shares outstanding, collateralizing the Loans to participants under | 114,109 | 114,109 |
Loans to participants under the Share Purchase Scheme (in € thousand) | 854 | 890 |
b Debt free Long-Term Share Incentive Plan with a vesting component (“LTSIP”)
Under this incentive plan, shares are awarded by the Group to executive directors and other key employees for no cash consideration. For key employees, shares are awarded to participants on condition of employment in the Group for the next three years (vesting period), with shares being vested proportionally over each year of the corresponding vesting periods (tranche vesting). For executive directors, shares are awarded subject to a full vesting of them at the end of three years (cliff vesting) plus a further two-year lock-up period, during which the vested shares cannot be disposed of by the directors. Shares awarded under LTSIP cannot be disposed of or otherwise encumbered up to their respective vesting dates.
The number of shares granted but unvested at 31 December 2025 and their fair value at grant date are summarised below:
LTSIP | 31 Dec 2025 | 31 Dec 2024 |
|---|---|---|
Number of shares granted but unvested at year-end | 1,679,156 | 1,717,101 |
Fair value at the grant date (€ thousand) | 9,432 | 10,546 |
The number of shares granted during the year and their fair value at grant date are presented below. The fair value was calculated using the share price on the date of acquisition of shares allocated to LTSIP.
LTSIP | 31 Dec 2025 | 31 Dec 2024 |
|---|---|---|
Number of shares granted during the year | 1,007,063 | 785,206 |
Fair value at the grant date (€ thousand) | 7,148 | 5,154 |
The maximum number of shares which could be offered for subscription under the Incentive Plan is 5% of the issued share capital of the Company at the end of any financial year prior to each award, provided that such number shall not exceed 30,449,745 shares. The number of shares that remained available for issue in terms of the Incentive Plan were as follows:
31 Dec 2025 | 31 Dec 2024 | |
|---|---|---|
Number of shares that remain available for issue at year-end | 25,651,774 | 26,658,837 |
19 Borrowings (bonds and bank loans)
The Group is currently assigned a long-term corporate credit rating of BBB (positive outlook) from Standard & Poor’s Rating Services and BBB+ (stable outlook) from Fitch Ratings.
In 2025, NEPI Rockcastle extended the contractual maturities related to its unsecured committed revolving credit facilities, as follows:
the revolving credit facility from ING Bank was extended to a maturity of three years, with two additional one-year extension options, currently expiring in July 2028; the maximum principal available under this facility was maintained at €100 million;
the revolving credit facility from a three-bank syndicate (BRD-Groupe Société Générale, Garanti Bank and Unicredit Bank) was also extended to a maturity of three years, with two additional one-year extension options, currently expiring in July 2028; the maximum principal available under this facility was increased from €170 million to €190 million;
the revolving credit facility from a four-bank syndicate led by Deutsche Bank AG as arranger, was extended for one year, until January 2029, with the maximum principal available increased to €250 million from €200 million, having JP Morgan joining the four bank syndicate; and
the revolving credit facility from Raiffeisen Bank International was extended for one year, until January 2029, with the maximum principal available maintained at €200 million.
Consequently, as at 31 December 2025, the revolving credit facilities’ capacity amounts to €740 million (31 December 2024: €670 million) and is fully undrawn.
In October 2024, the Group issued its third €500 million green unsecured Eurobond, having a 7-year tenor and maturing in January 2032. The bond carries a 4.25% fixed coupon, with an issue price of 99.124%. The allocations of the proceeds were aligned to the Group’s Green Finance Framework.
In September 2025, the Group issued another €500 million green unsecured Eurobond, having a 8-year tenor and maturing in September 2033. The bond carries a 3.875% fixed coupon, with an issue price of 99.353%. Net proceeds were used to proactively manage the upcoming maturities in October 2026 and July 2027, with €250 million of each tranche refinanced. The allocations of the proceeds were aligned to the Group’s Green Finance Framework.
The partial repurchase of 2026 and 2027 maturing bonds was made at market price in October 2025, with premium paid over the carrying amount of repaid bond of €4.7 million recognised in the Statement of Comprehensive Income. Since the Group repurchased bonds before their maturity date, this constitutes an extinguishment of the financial liability associated with those bonds.
In December 2025, the Group increased one of its existing secured loans in Romania by €32 million to further strengthen its liquidity position. The maturity of the loan remains un-changed, with proceeds being disbursed in December 2025.
In December 2025, the Group signed a new green unsecured facility with Raiffeisen Bank, dedicated to refinancing the photovoltaic solar plants being developed in Romania. The facility has a 10-year tenor and a total commitment of €45 million. The first tranche of €21 million was disbursed in December 2025, while the second tranche is expected to be drawn in 2026.
The Group's weighted average effective interest rate on outstanding debt for the period was 3.75% (2024: 3.55%). Including the commitment fees incurred on the undrawn revolving credit facility, the all-in cost of maintaining the Group's total committed debt facilities was 3.2% on a blended basis (2024: 3%). Management considers the all-in cost to be a relevant measure as it reflects the full cost of securing and maintaining the Group's available financing capacity.
Unsecured debt represented 87% of total debt as at 31 December 2025. The unhedged balance exposed to variable interest rate corresponds mainly to the IFC loan and represents 16% of the total outstanding debt.
The fair value of all financial instruments is substantially in line with their carrying amounts as reflected on the Statement of financial position, except for bonds.
The below table details the market trading of bonds issued:
Outstanding nominal | Issue date | Maturity date | 31 December 2025 | 31 December 2024 |
|---|---|---|---|---|
249,997 | October-2019 | October-2026 | 99.41% | 97.84% |
250,003 | July-2020 | July-2027 | 100.73% | 100.19% |
500,000 | January-2022 | January-2030 | 94.81% | 92.72% |
500,000 | October-2024 | January-2032 | 102.92% | 102.46% |
500,000 | September-2025 | September-2033 | 99.48% | n/a |
The repayment profile for outstanding loans, excluding future interest, is detailed below:
Interest bearing borrowings 31 Dec 2025 | Type | Payable in less than 1 year | Payable in over 1 year–3 years | Payable in over 3 years –5 years | Payable over 5 years | Total |
|---|---|---|---|---|---|---|
in € thousand | ||||||
Netherlands | Unsecured fixed coupon bonds | 249,997 | 250,003 | 500,000 | 1,000,000 | 2,000,000 |
Netherlands | Unsecured loans | - | 73,521 | 444,955 | - | 518,476 |
Poland | Secured loans | 745 | 1,490 | 70,569 | - | 72,804 |
Slovakia | Secured loans | 5,800 | 11,600 | 76,337 | - | 93,737 |
Czech Republic | Secured loans | 600 | 1,200 | 37,000 | - | 38,800 |
Romania | Secured loans | 12,433 | 183,415 | 72,848 | 16,255 | 284,951 |
Accrued interest on loans and deferred loan costs | (2,646) | (6,800) | (695) | (278) | (10,419) | |
Accrued coupon on bonds | 39,359 | - | - | - | 39,359 | |
Deferred bond costs | (2,507) | (3,930) | (3,158) | (2,393) | (11,988) | |
Issue discount on bonds | (2,790) | (3,959) | (2,725) | (1,566) | (11,040) | |
Total | 300,991 | 506,540 | 1,195,131 | 1,012,018 | 3,014,680 |
Interest bearing borrowings 31 Dec 20241 | Type | Payable in less than 1 year | Payable in over 1 year–3 years | Payable in over 3 years –5 years | Payable over 5 years | Total |
|---|---|---|---|---|---|---|
in € thousand | ||||||
Netherlands | Unsecured fixed coupon bonds | - | 1,000,000 | - | 1,000,000 | 2,000,000 |
Netherlands | Unsecured loans | - | - | 518,476 | - | 518,476 |
Poland | Secured loans | 745 | 1,490 | 71,314 | - | 73,549 |
Slovakia | Secured loans | 5,800 | 11,600 | 82,137 | - | 99,537 |
Czech Republic | Secured loans | 600 | 1,200 | 1,200 | 36,400 | 39,400 |
Romania | Secured loans | 10,477 | 21,455 | 170,455 | 40,908 | 243,295 |
Accrued interest on loans and deferred loan costs | (2,094) | (8,772) | (366) | (80) | (11,312) | |
Accrued interest on bonds | 24,685 | - | - | - | 24,685 | |
Deferred bond costs | (2,666) | (4,189) | (2,474) | (1,372) | (10,701) | |
Issue discount on bonds | (3,453) | (5,288) | (2,656) | (1,164) | (12,561) | |
Total | 34,094 | 1,017,496 | 838,086 | 1,074,692 | 2,964,368 |
- 2024 figures were amended by adding more granularity for the 1–5 years time band, which is now split into over 1 year–3 years time band and over 3 years–5 years time band.
Bonds and bank loans reconciliation
This section sets out an analysis of bonds and bank loans outstanding and the related movements for the periods presented.
in € thousand | Bank loans | Bonds | Total1 |
|---|---|---|---|
Debt as at 31 December 2024 | 962,945 | 2,001,423 | 2,964,368 |
Cash repayments of principal | (17,984) | (500,000) | (517,984) |
Cash proceeds from bank loans or bonds | 52,496 | 500,000 | 552,496 |
Cash payments of interest on bank loans or coupon on bonds | (44,957) | (44,418) | (89,375) |
Interest expense1 | 44,797 | 59,110 | 103,907 |
Amortisation of capitalised borrowing costs | 3,309 | 2,644 | 5,953 |
Amortisation of bond discount | - | 3,328 | 3,328 |
Additional capitalised borrowing costs in the period | (2,257) | (4,959) | (7,216) |
Additional bond discount in the period | - | (3,235) | (3,235) |
Costs released on bonds buy-back prior to maturity | - | 2,438 | 2,438 |
Debt as at 31 December 2025 | 998,349 | 2,016,331 | 3,014,680 |
- The above finance costs do not include interest capitalised on developments of €7,084 thousand (Note 9, Note 11) and interest on lease liabilities related to the right-of-use assets of €2,533 thousand.
in € thousand | Bank loans | Bonds | Total1 |
|---|---|---|---|
Debt as at 31 December 2023 | 533,721 | 1,999,031 | 2,532,752 |
Cash repayments of principal | (17,297) | (498,980) | (516,277) |
Cash proceeds from bank loans or bonds | 446,107 | 500,000 | 946,107 |
Cash payments of interest on bank loans or coupon on bonds | (55,355) | (44,982) | (100,337) |
Interest expense1 | 55,029 | 49,344 | 104,373 |
Amortisation of capitalised borrowing costs | 3,213 | 2,622 | 5,835 |
Amortisation of bond discount | - | 3,529 | 3,529 |
Additional capitalised borrowing costs in the period | (2,473) | (4,761) | (7,234) |
Additional bond discount in the period | - | (4,380) | (4,380) |
Debt as at 31 December 2024 | 962,945 | 2,001,423 | 2,964,368 |
- The tables above do not contain interest bearing loans from third parties (loans were fully reimbursed in 2024) and the associated finance cost. The above finance costs do not include interest capitalised on developments of €4,379 thousand (Note 9) and interest on lease liabilities related to the right-of-use assets of €1,470 thousand (Note 23).
Further details for the Group’s loans and bonds are presented below:
Secured term loans
The Group has secured term loans contracted by some of its subsidiaries in Poland, Slovakia, Czech Republic and Romania. These loans are subject to various retrospective and prospective covenants, including prospective debt service coverage ratios. As of the reporting date, the Group has no indication that it will face difficulty complying with any of these covenants.
Securities
General security over the properties (fair values as at 31 December 2025), current assets, cash inflows from operating activities, accounts and receivables; and
General security over the shares in the property-owning entities.
Covenants
Debt service cover ratio (historical and prospective) of a minimum between 110% and 140%; and
Loan to value ratio of a maximum between 55% and 70%.
Unsecured green term loans
The Group has two green unsecured financing agreements with IFC and one with Raiffeisen Bank. Out of the two IFC loans, one matures in June 2028 in amount of €73.5 million, and the other matures in January 2029 in amount of €445 million.
The €445 million loan has sustainability-linked KPIs in line with the Group’s Sustainability-Linked Financing Framework. Management considers that the sustainability related variability feature does not meet the definition of a derivative, as defined in Appendix A of IFRS 9, on the basis that these KPIs are non–financial variables specific to the Group.
Unsecured committed revolving facilities
At 31 December 2025, there were €740 million revolving facilities available for drawdown.
All available revolving facilities are linked either to the ESG performance of the Group through the sustainability rating provided by Sustainalytics or have sustainability-linked KPIs in line with the Group’s Sustainability-Linked Financing Framework.
Management considers that the above ESG related variability feature does not meet the definition of a derivative, as defined in Appendix A of IFRS 9, on the basis that the external rating is a non–financial variable specific to the Group.
Unsecured fixed coupon bonds
The Group successfully issued fixed coupon bonds as follows:
October 2019: €500 million of unsecured, 7-year Eurobonds. €250 million are outstanding at 31 December 2025 and mature on 9 October 2026, carrying a 1.875% fixed coupon, with an issue price of 98.927%;
July 2020: €500 million of green unsecured, 7-year Eurobonds. €250 million are outstanding at 31 December 2025 and mature on 14 July 2027, carrying a 3.375% fixed coupon, with an issue price of 98.172%;
January 2022: €500 million of green unsecured, 8-year Eurobonds. The bonds mature on 21 January 2030 and carry a 2.00% fixed coupon, with an issue price of 98.713%;
October 2024: €500 million of green unsecured, 7-year Eurobonds. The bonds mature on 21 January 2032 and carry a
4.25% fixed coupon, with an issue price of 99.124%; and
September 2025: €500 million of green unsecured, 8-year Eurobonds. The bonds mature on 30 September 2033 and carry a 3.875% fixed coupon, with an issue price of 99.353%.
All the bonds include early redemption options. At each date of bond issue initial recognition management has performed an assessment whether those options are closely related to the host contract, considering the IFRS 9 clauses, which states that early repayment options are closely related to the host debt, if either:
the option’s exercise price is approximately equal on each exercise date to the host debt instrument’s amortised cost; or
the exercise price of a prepayment option reimburses the lender for an amount up to the approximate present value of lost interest for the remaining term of the host contract.
Based on management assessment in case of the exercise of any of the early redemption options either first or second criteria will be met, therefore those were considered as closely related to the bond and thus not separately valued and disclosed.
NEPI Rockcastle has complied with all financial covenants of its borrowing facilities during 2025 and 2024. The ratios calculated for all unsecured loans and bonds showed ample headroom compared to the covenants:
Covenants | Requirement | 31 Dec 2025 | 31 Dec 2024 |
|---|---|---|---|
Solvency Ratio | Maximum 0.60 | 0.38 | 0.38 |
Consolidated Coverage Ratio | Minimum 2:1 | 5.04 | 5.01 |
Unsecured Ratio | Minimum 150% | 266% | 261% |
20 Derivative financial assets and liabilities at fair value through profit or loss
The Group uses derivative instruments to hedge variable interest rate (Euribor) exposure. Their fair value is summarised below:
in € thousand | 31 Dec 2025 | 31 Dec 2024 |
|---|---|---|
Derivative financial assets – long-term | 1,415 | 5,392 |
Derivative financial assets – short-term | 3,129 | 4,270 |
Total | 4,544 | 9,662 |
The above financial assets consist of interest rate caps and fixed interest rate swaps which are not designated as cash flow hedges. The fair value was categorised in Level 2 of the fair value hierarchy. The fair value of derivatives is based on pricing quotes from counterparty banks. The valuation model uses an interest rate curve based on observable market rates. Future interest payments are determined using this curve, which are then discounted to present value.
The derivative financial assets classification to non-current or current sections of the Statement of financial position is driven by interest settlement dates of the instruments.
At 31 December 2025, €483 million of debt exposed to Euribor was hedged with interest rate caps and €39 million with interest rate swaps (Note 5.3.2).
21 Trade and other payables
in € thousand | 31 Dec 2025 | 31 Dec 2024 |
|---|---|---|
Property related payables | 73,473 | 79,110 |
Advances from tenants | 57,363 | 55,365 |
Advances from residential customers | - | 309 |
Payable for investment property and property, plant and equipment under construction | 29,775 | 22,927 |
Payables for administrative expenses | 7,989 | 10,243 |
Tenant security deposits | 10,136 | 13,289 |
Deferred consideration on acquisitions of subsidiaries and asset deals | 553 | 5,841 |
Total | 179,289 | 187,084 |
22 Other long-term liabilities
in € thousand | 31 Dec 2025 | 31 Dec 2024 |
|---|---|---|
Tenant security deposits | 35,652 | 30,109 |
Other long-term payables | 838 | 484 |
Total | 36,490 | 30,593 |
23 Lease liabilities
The Group recognises the right-of-use assets from leases of land plots on which the majority of its Polish properties are located, commissioned from the local authorities. The correspondent lease liabilities are recognised by discounting the contractual lease payments using the rate that the lessee would have to pay to borrow the funds necessary to obtain an asset of similar value to the right-of-use asset in a similar economic environment with similar terms, security and conditions.
The contractual lease agreements are signed for the period of 99 years with extension option by the lessee. The agreements include fixed payment terms subject to adjustment due to revaluation of land, such revaluation can be done by the lessor not more often than every three years.
in € thousand | Note | 31 Dec 2025 | 31 Dec 2024 |
|---|---|---|---|
Carrying value of the lease liabilities - Opening Balance | 85,949 | 56,520 | |
Out of which short-term - Opening Balance | 2,890 | 1,546 | |
Additions to lease liabilities from acquired assets | - | 29,840 | |
Remeasurement of lease liability | 5,798 | - | |
Interest expense | 2,533 | 1,470 | |
Lease liability payment | (3,023) | (1,881) | |
Carrying value of the lease liabilities - Closing Balance | 91,257 | 85,949 | |
Out of which short-term - Closing Balance | 3,081 | 2,890 |
24 Corporate tax charge and deferred tax
On 23 May 2023, the International Accounting Standards Board issued International Tax Reform – Pillar Two Model Rules – Amendments to IAS 12. These amendments clarify that IAS 12 applies to income taxes arising from tax law enacted or substantively enacted to implement the Pillar Two model rules published by the OECD, including Qualified Domestic Minimum Top-up Taxes (QDMTTs).
The Group has applied these amendments. The Pillar Two rules became applicable to the Group for the financial year beginning 1 January 2025, following the enactment or substantive enactment of the relevant legislation in all jurisdictions in which the Group operates.
The Group has applied the exception provided by IAS 12.88A, and accordingly does not recognise and does not disclose information about deferred tax assets and liabilities related to Pillar Two income taxes.
The Group performed a jurisdictional assessment to determine its exposure to Pillar 2 top-up taxes, using the 2025 actual financial results. In most of the jurisdictions in which the Group operates, the Pillar Two effective tax rate exceeds 15%.
The Group continues to monitor Pillar Two legislative developments globally and will assess any potential future impacts on its consolidated financial position, results of operations, and cash flows as additional jurisdictions enact or substantially enact these rules.
Tax expense comprises current and deferred tax. Current tax and deferred tax are recognised in profit or loss, except to the extent they relate to business combination or items recognised directly to equity. Deferred tax assets and liabilities are measured at the tax rates (and tax laws) that have been enacted or substantively enacted by the end of the reporting period and are expected to apply when the related assets are realised or the liabilities are settled. Deferred tax assets are recognised only to the extent that it is probable that future taxable profits will be available against which the temporary differences can be utilised.
in € thousand | 31 Dec 2025 | 31 Dec 2024 |
|---|---|---|
Current tax expense | 28,831 | 30,563 |
Deferred tax expense | 97,262 | 31,472 |
INCOME TAX EXPENSE | 126,093 | 62,035 |
Reconciliation of deferred tax liabilities, net
in € thousand | 31 Dec 2025 | 31 Dec 2024 |
|---|---|---|
As of 1 January | 437,846 | 408,136 |
Other adjustments (included in the disposal proceeds) - with P&L effect | - | (1,762) |
Deferred tax expense | 97,262 | 31,472 |
As of 31 December, out of which: | 535,108 | 437,846 |
Deferred tax asset | (69,957) | (107,395) |
Deferred tax liability | 605,065 | 545,241 |
in € thousand | Consolidated Statement of | Consolidated Statement of | ||
|---|---|---|---|---|
Deferred tax liability (net) | 31 Dec 2025 | 31 Dec 2024 | 31 Dec 2025 | 31 Dec 2024 |
Valuation of investment property at fair value | (634,669) | (571,357) | (63,312) | (75,330) |
Recognised unused tax losses | 43,723 | 46,360 | (2,637) | (1,444) |
Deferred tax asset related to HFS written off upon sale | - | 89 | (89) | - |
Deductible/Taxable temporary differences | 55,838 | 87,062 | (31,224) | 45,302 |
Total | (535,108) | (437,846) | (97,262) | (31,472) |
Reflected in the Statement of Financial Position as follows: | 31 Dec 2025 | 31 Dec 2024 |
|---|---|---|
Deferred tax assets | 69,957 | 107,395 |
Deferred tax liabilities | (605,065) | (545,241) |
The net deferred tax balance as at 31 December 2025 comprises:
Deferred tax assets, primarily from unused fiscal losses and other tax attributes (including carry-forward Notional Interest Deduction in the Maltese subsidiary, a Maltese tax incentive based on equity financing); and
Deferred tax liabilities, arising from temporary differences mainly on investment property (due to fair value revaluations), as well as other local adjustments such as tax depreciation, non-capitalised items and foreign exchange impact (where the tax base is in local currency).
Deferred tax liabilities are not expected to be settled within the next five years from the reporting date. In 2025, €27.5 million of deferred tax asset was released following the utilization of the carry-forward Notional Interest Deduction (for which deferred tax asset of €56.7 million was recognized in 2024 in the Maltese subsidiary). The remaining carry-forward deferred tax asset balance at 31 December 2025 is €29 million, which continues to meet the recognition criteria based on probable future taxable profits.
The Group is liable for taxation on taxable profits in the following jurisdictions at the rates below:
Corporate income tax rates | 31 Dec 2025 | 31 Dec 2024 |
|---|---|---|
Netherlands | 25.8% | 25.8% |
Romania | 16% | 16% |
Poland | 19% | 19% |
Slovakia | 24% | 21% |
Serbia | 15% | 15% |
Czech Republic | 21% | 21% |
Croatia | 18% | 18% |
Bulgaria | 10% | 10% |
Hungary | 9% | 9% |
Lithuania1 | 16% | 15% |
Malta | 35% | 35% |
- Starting 1 January 2026 the tax rate in Lithuania changed from 16% to 17%.
A reconciliation between the current year income tax charge (current and deferred tax) and the Group consolidated profit/(loss) before tax for the years 2025 and 2024 is presented below:
Profit Before Tax Reconciliation | 31 Dec 2025 | 31 Dec 2024 |
|---|---|---|
Consolidated Profit Before Tax | 624,932 | 649,600 |
Weighted tax rate on consolidated Profit Before Tax | 14.93% | 15.40% |
Group income tax charge based on Group weighted | (93,302) | (100,035) |
Effect in corporate income tax resulting from | ||
Effects in changes in foreign exchange rates | (5,202) | (403) |
Changes in previous years' deferred tax | 299 | (103) |
Changes in the liabilities for uncertain tax positions | 3,076 | (3,393) |
Utilisation of previously unrecognised temporary differences | 360 | 890 |
Tax rate differences inter-company transactions | (1,837) | (3,348) |
Deferred tax assets released due to fiscal losses expired and/or not utilised | - | (784) |
Deferred tax asset release following sale of subsidiary | - | (1,762) |
Increase of Deferred Tax Liability due to change of tax rate in various jurisdictions (Slovakia and Lithuania starting 2025) and Lithuania starting with 2026 | (719) | (10,221) |
Deferred tax asset reconised/ (utilised) for tax attributes available to be used in the future | (27,528) | 56,708 |
Others | (1,240) | 416 |
Total Group tax expense | (126,093) | (62,035) |
Effective tax rate (Group consolidated Profit Before Tax) | 20% | 10% |
Deferred taxes are calculated assuming the theoretical future property disposals occur via asset deals, resulting in taxation at the full corporate income tax rate in the relevant jurisdiction. In practice, if the Group would be in the position to dispose of certain assets, these disposals are most probably to be structured as share deals (given properties are held in separate special purpose vehicles), which would significantly reduce the effective tax rate on any capital gains.
Group subsidiaries are subject to corporate tax annually. The Group has aggregated carried forward fiscal losses of €315,071 thousand (31 December 2024: €328,529 thousand), primarily available for offset against future taxable profits in the companies where they arose, generally up to seven years (with some jurisdictions allowing indefinite carry-forward).
Deferred tax assets are recognised for unused tax losses only to the extent that it is probable that sufficient taxable profit will be available for utilisation. This requires significant management judgement regarding the timing and level of future taxable profits, as well as tax planning opportunities.
No deferred tax assets have been recognised in respect of €114,072 thousand of fiscal losses (31 December 2024: €109,733 thousand) due to the uncertainty over the generation of sufficient future taxable profits in the specific entities concerned (based on historical performance and current forecasts).
The expiry dates for these losses are as follows:
in € thousand | 31 Dec 2025 | 31 Dec 2024 |
|---|---|---|
2025 | - | 21,369 |
2026 | 2,206 | 4,873 |
2027 | 16,063 | 14,721 |
2028 | 6,646 | 3,269 |
2029 | 12,838 | 8,202 |
20301 | 59,052 | 57,299 |
Indefinite within the relevant table | 17,267 | - |
Total | 114,072 | 109,733 |
- At 31 December 2024, the amount of €57,299 thousand in line “2030” above included €10,631 thousand representing tax losses which can be carried forward indefinitely and for which no deferred tax asset was recognised, while at 31 December 2025, these are shown separately in row “Indefinite within the relevant table”.
There are no income tax consequences attached to the payment of dividends in either 2025 or 2024 by the Group to its shareholders.
25 Net asset value per share
in € thousand, unless otherwise stated | Note | 31 Dec 2025 | 31 Dec 2024 |
|---|---|---|---|
Net Asset Value (per the Statement of financial position) | 5,006,336 | 4,908,482 | |
Deferred tax liabilities | 605,065 | 545,241 | |
Deferred tax assets | (69,957) | (107,395) | |
Goodwill | (76,804) | (76,804) | |
Derivative financial assets at fair value through profit or loss | (4,544) | (9,662) | |
EPRA Net Reinstatement Value | 5,460,096 | 5,259,862 | |
Net Asset Value per share (euro) | 7.04 | 6.89 | |
EPRA Net Reinstatement Value per share (euro) | 7.68 | 7.38 | |
Number of shares for Net Asset Value/ EPRA Net Reinstatement Value | 710,716,7981 | 712,357,309 |
- Excludes 1,640,511 treasury shares as of 31 December 2025. For further details please see Note 17.
26 Net rental and related income
in € thousand | 31 Dec 2025 | 31 Dec 2024 |
|---|---|---|
Gross rental income | 624,348 | 566,069 |
Service charge income | 288,556 | 259,563 |
Gross rental and service charge income | 912,904 | 825,632 |
Property management fees, tax, insurance, and utilities | (171,430) | (159,272) |
Property maintenance cost | (131,320) | (120,033) |
Net expected credit losses | (1,679) | 564 |
Property operating expenses | (304,429) | (278,741) |
Revenue from energy activity | 11,262 | 9,048 |
Costs of the energy activity | (1,627) | - |
TOTAL NET RENTAL AND RELATED INCOME | 618,110 | 555,939 |
Out of the total Net rental and related income for 2025, €57.8 million (2024: €8 million) relates to the two acquisitions made in fourth quarter of 2024 (Magnolia Park and Silesia City Center in Poland).
Property management fees, tax, insurance, and utility costs presented above are split as follows:
in € thousand | 31 Dec 2025 | 31 Dec 2024 |
|---|---|---|
Utility expenses1 | (96,330) | (89,525) |
Property related taxes | (34,923) | (32,039) |
Property management fees | (37,209) | (34,890) |
Property insurance expenses | (2,968) | (2,818) |
Property management fees, tax, insurance, and utilities | (171,430) | (159,272) |
- The Group acts as principal in relation to the provision of utilities to its tenants. Thus, utility expenses and the corresponding utility recoveries are recognised, on a gross basis, in the Property operating expenses and Service charge income respectively.
Property maintenance cost presented above comprises of:
in € thousand | 31 Dec 2025 | 31 Dec 2024 |
|---|---|---|
Cleaning and security | (55,837) | (50,077) |
Maintenance and repairs | (41,836) | (38,168) |
Marketing | (25,653) | (23,921) |
Services and related costs | (3,995) | (3,640) |
Other | (3,999) | (4,227) |
Property maintenance cost | (131,320) | (120,033) |
The Group rents its investment property under operating leases of various expiry terms. The standard terms of the leases comprise information relating to leased space, rent, rights and obligations of the landlord and tenant, including notice periods, renewal options and service charge arrangements. For most of the leases, the rent is indexed annually, over the term of the leases. Most retail leases have overage rent clauses, which specify that if the agreed percentage of turnover from the retail unit under lease exceeds the base rent, the tenant will pay the difference to the Group.
A proportion of 9.6% (€ 59,678 thousand) of the Gross rental income is represented by the turnover and overage rent (paid on top of fixed rent) as at 31 December 2025 (31 December 2024: 11.2% (€ 63,424 thousand)).
Lease incentives represent the non-recurring amount granted (in cash or as fit-out works) by the Group, to a new or an existing tenant, in connection with a new or renewed lease. Lease incentives are straight-lined over the lease term and recorded as reduction in revenue. The lease term corresponds to the contractual duration for the majority of the leases, except for the anchor tenants, for which the lease duration is assessed by the Group based on past experience and taking into account factors such as: GLA of the property where the anchor tenant is located, catchment area, dominance/competition in the catchment area or purchasing power.
The future minimum lease payments receivable under operating leases are detailed below:
in € thousand | 31 Dec 20251 | 31 Dec 20241 |
|---|---|---|
No later than 1 year | 524,140 | 506,772 |
Between 1-2 years | 435,876 | 411,126 |
Between 2-3 years | 354,981 | 332,374 |
Between 3-4 years | 271,374 | 257,325 |
Between 4-5 years | 182,424 | 180,070 |
Later than 5 years | 427,949 | 421,540 |
Total | 2,196,744 | 2,109,207 |
- Figures computed based on contractual lease maturity date.
The breakdown of the net rental and related income by country is disclosed in Note 33.
27 Administrative expenses
in € thousand | Note | 31 Dec 2025 | 31 Dec 2024 |
|---|---|---|---|
Staff costs1 | (14,225) | (12,908) | |
Directors’ remuneration | (5,624) | (4,551) | |
Advisory services | (6,224) | (5,635) | |
Audit and other assurance services | (3,004) | (2,866) | |
Companies’ administration2 | (4,003) | (2,710) | |
Depreciation charge for Photovoltaic installations | (1,623) | (447) | |
Depreciation charge for other property, plant and equipment | (419) | (490) | |
Travel and accommodation | (1,645) | (1,695) | |
Stock exchange expenses | (921) | (851) | |
Share based payment expense3 | (7,354) | (3,040) | |
Total | (45,042) | (35,193) |
- Staff costs capitalised on investment property under development in 2025 amount to €2,469 thousand (2024: €2,394 thousand).
- Includes amortisation of intangibles of €1,165 thousand as of 31 December 2025 ( 31 December 2024: €1,116 thousand).
- Includes an amount of €3,130 thousand corresponding to the accelerated vesting of share awards following the conclusion of Rüdiger Dany's CEO mandate, as explained in Note 36.
Out of the above administrative expenses, audit fees are summarised below:
31 Dec 2025 | EY Accountants B.V. | Other EY network | Non-EY network |
|---|---|---|---|
in € thousand | |||
Audit of financial statements | (470) | (2,132) | (30) |
Other assurance procedures | (275) | (97) | - |
Total | (745) | (2,229) | (30) |
31 Dec 2024 | EY Accountants B.V. | Other EY network | Non-EY network |
|---|---|---|---|
in € thousand | |||
Audit of financial statements | (475) | (1,911) | (31) |
Other assurance procedures | (345) | (104) | - |
Total | (820) | (2,015) | (31) |
28 Fair value adjustments of investment property
in € thousand | Note | 31 Dec 2025 | 31 Dec 2024 |
|---|---|---|---|
Fair value adjustments of investment property in use | 160,581 | 183,942 | |
Fair value adjustments of investment property under development | 2,228 | 12,020 | |
Fair value adjustments of investment property held for sale | (67) | (170) | |
Fair value adjustments of right-of-use assets | (490) | (412) | |
Total | 162,252 | 195,380 |
29 Net finance costs and other items
in € thousand | Note | 31 Dec 2025 | 31 Dec 2024 |
|---|---|---|---|
Interest on Loan to participants under Share Purchase Scheme | 27 | 67 | |
Interest on bank deposits | 6,011 | 19,840 | |
Finance income | 6,038 | 19,907 | |
Bonds borrowing costs1 | (65,082) | (55,495) | |
Interest expense on bank borrowings | (48,106) | (58,242) | |
Interest rate derivatives settlements | 4,695 | 12,454 | |
Interest expense on borrowings from third parties | - | (1,763) | |
Interest expense on lease liabilities | (2,533) | (1,470) | |
Interest expense other borrowings | (21) | (7) | |
Interest expense capitalised on developments2 | 7,084 | 4,379 | |
Finance costs | (103,963) | (100,144) | |
Bank charges, commissions, and fees | (4,127) | (4,381) | |
Total | (102,052) | (84,618) |
- Bonds borrowing costs include coupon, amortisation of borrowing costs and debt discount, using the effective interest approach.
- In 2025 and 2024 interest expense was capitalised only on developments.
30 Basic and diluted earnings per share
The calculation of basic and diluted earnings per share for the year ended 31 December 2025 was based on the profit attributable to equity holders of the parent of €498,839 thousand (31 December 2024: €587,565 thousand) and the weighted average number of shares.
in € thousand, unless otherwise stated | 31 Dec 2025 | 31 Dec 2024 |
|---|---|---|
Profit for the year attributable to equity holders | 498,839 | 587,565 |
Basic weighted average number of shares | 709,479,0531 | 670,058,874 |
Diluted weighted average number of shares | 711,167,4871 | 671,468,377 |
Basic earnings per share (euro cents) attributable to equity holders | 70.31 | 87.69 |
Diluted earnings per share (euro cents) attributable to equity holders | 70.14 | 87.50 |
- Excludes 1,640,511 treasury shares as of 31 December 2025. For further details please see Note 17.
Weighted and diluted weighted average number of shares in 2025 for basic and diluted earnings per share purposes are detailed below:
2025 | Event | Number of shares | Cumulative number of shares after equity-related transactions | % of period | Weighted average |
|---|---|---|---|---|---|
01/01/2025 | Opening balance | 712,357,309 | 712,357,309 | 27% | 195,702,557 |
11/04/2025 | Repurchase of shares | (1,640,511) | 710,716,798 | 73% | 515,464,930 |
31/12/2025 | Diluted weighted average number of shares | 711,167,487 | |||
Effect of unvested shares under LTSIP | (1,688,434) | ||||
Basic weighted average number of shares | 709,479,053 |
Weighted and diluted weighted average number of shares in 2024 for basic and diluted earnings per share purposes are detailed below:
2024 | Event | Number of shares | Cumulative number of shares after equity-related transactions | % of period | Weighted average |
|---|---|---|---|---|---|
01/01/2024 | Opening balance | 660,826,020 | 660,826,020 | 79% | 521,418,887 |
15/10/2024 | Return of capital | 9,806,671 | 670,632,691 | 1% | 3,674,700 |
17/10/2024 | Issue of shares | 41,724,618 | 712,357,309 | 20% | 146,374,790 |
31/12/2024 | Diluted weighted average number of shares | 671,468,377 | |||
Effect of unvested shares under LTSIP | (1,409,503) | ||||
Basic weighted average number of shares | 670,058,874 |
31 Headline earnings and diluted headline earnings per share
The starting point is for headline earnings per share calculation are earnings as determined in IAS 33, excluding “separately identifiable re-measurements”, net of related tax (both current and deferred) and non-controlling interest, other than remeasurements specifically included in headline earnings (referred to as included re-measurements), in terms of Circular 1/2023 issued by South African Institute of Chartered Accountants (SAICA).
The calculation of headline earnings per share for the year ended 31 December 2025 was based on headline earnings of €363,781 thousand (31 December 2024: of €405,824 thousand) and the weighted average number of shares.
Reconciliation of profit for the year to headline earnings | Note | 31 Dec 2025 | 31 Dec 2024 |
|---|---|---|---|
in € thousand, unless otherwise stated | |||
Profit for the year attributable to equity holders of the parent | 498,839 | 587,565 | |
Fair value adjustments of investment property | (162,252) | (195,380) | |
Gain on disposal of assets held for sale | - | (25,934) | |
Tax effects of adjustments for investment property and gain on disposal of assets held for sale | 27,194 | 39,573 | |
HEADLINE EARNINGS | 363,781 | 405,824 | |
Basic weighted average number of shares | 709,479,0531 | 670,058,874 | |
Diluted weighted average number of shares | 711,167,4871 | 671,468,377 | |
Headline earnings per share (euro cents) | 51.27 | 60.57 | |
Diluted headline earnings per share (euro cents) | 51.15 | 60.44 |
- Excludes 1,640,511 treasury shares as at 31 December 2025. For further details please see Note 17.
32 Significant asset deals
No acquisitions were made in 2025.
Acquisitions made in 2024
Magnolia Park
On 1 October 2024, the Group acquired Magnolia Property Sp. z.o.o., the legal entity that owns Magnolia Park in Wroclaw, Poland. The acquisition was recognised as a property asset acquisition as the acquired entity does not represent a business as defined by IFRS 3.
The carrying amount of the identifiable assets and liabilities at the date of acquisition was as follows:
in € thousand | Value recognised on acquisition |
|---|---|
Investment property in use | 353,277 |
Trade and other receivables | 4,360 |
Cash and cash equivalents | 4,500 |
Identifiable acquired assets | 362,137 |
Other long-term liabilities | 1,554 |
Trade and other payables | 2,747 |
Identifiable acquired liabilities | 4,301 |
Net identifiable assets | 357,836 |
Net identifiable assets of the subsidiary acquired at the date of acquisition amounted to €357,836 thousand. The net cash outflow connected with the acquisition (cash outflow adjusted for working capital items, less cash and cash equivalents acquired) amounted to €351,794 thousand, the remaining difference to the net asset value being an accrued payable adjustment to the purchase price paid. Acquisition costs of €2,715 thousand were capitalised on the value of investment property.
The investment property reflected above does not include the right-of-use assets and related lease liability, of €29,840 thousand, connected to the land under concession for Magnolia Park.
Silesia City Center
On 6 December 2024, the Group acquired Helios SCC Sp. z.o.o. (subsequently changed its name to Silesia Property Sp. z o.o.), the legal entity which owns Silesia City Center, a shopping centre located in Katowice, Poland. The Group has concurrently acquired Elco Energy Sp. z o.o. and Elco ICT Sp. z o.o., the legal entities that provide communication infrastructure and energy services for the tenants in Silesia City Center. The acquisition was recognised as a property asset acquisition as the acquired companies do not represent a business as defined by IFRS 3.
The carrying amount of the identifiable assets and liabilities at the date of acquisition was as follows:
in € thousand | Value recognised on acquisition |
|---|---|
Investment property in use | 406,389 |
Property, plant and equipment under construction | 513 |
Property, plant and equipment - Other | 41 |
Trade and other receivables | 9,420 |
Cash and cash equivalents | 9,320 |
Identifiable acquired assets | 425,683 |
Other long-term liabilities | 1,667 |
Trade and other payables | 14,991 |
Identifiable acquired liabilities | 16,658 |
Net identifiable assets | 409,025 |
Net identifiable assets of the subsidiaries acquired at the date of acquisition amounted to €409,025 thousand. The net cash outflow connected with the acquisition (cash outflow adjusted for working capital items, less cash and cash equivalents acquired) amounted to €400,270 thousand. Accrued receivable from the seller of €565 thousand was recognised as adjustment to the purchase price paid. Acquisition costs of €2,287 thousand were capitalised on the value of investment property.
Solpower Energy SRL
On 18 November 2024, the Group acquired 100% of the share capital of Solpower Energy SRL, a Romanian legal entity with in place land rights, building permits and grid connection permits aimed at the development of a photovoltaic power plant with a targeted capacity of 50 MWp. The acquired property will be used by the Group for the development of one of its greenfield photovoltaic projects in Romania. The acquisition was recognised as an asset acquisition as the acquired entity does not represent a business as defined by IFRS 3.
The carrying amount of the identifiable assets and liabilities at the date of acquisition was as follows:
in € thousand | Value recognised on acquisition |
|---|---|
Property, plant and equipment under construction | 5,143 |
Trade and other receivables | 326 |
Cash and cash equivalents | 10 |
Identifiable acquired assets | 5,479 |
Trade and other payables | 2 |
Identifiable acquired liabilities | 2 |
Net identifiable assets | 5,477 |
Net identifiable assets of the subsidiaries acquired at the date of acquisition amounted to €5,477 thousand. The net cash outflow connected with the acquisition (cash outflow adjusted for working capital items, less cash and cash equivalents acquired) amounted to €5,450 thousand, the remaining difference to the net asset value being an accrued payable adjustment to the purchase price paid.
Muntenia Beton Max SRL
On 27 December 2024, the Group acquired 100% of the share capital of Muntenia Beton Max SRL, a Romanian legal entity with in place land rights, building permits and grid connection permits aimed at the development of a photovoltaic power plant with a targeted capacity of 109 MWp. The acquired property will be used by the Group for the development of one of its greenfield photovoltaic projects in Romania. The acquisition was recognised as an asset acquisition as the acquired entity does not represent a business as defined by IFRS 3.
The carrying amount of the identifiable assets and liabilities at the date of acquisition was as follows:
in € thousand | Value recognised on acquisition |
|---|---|
Property, plant and equipment under construction | 4,903 |
Trade and other receivables | 78 |
Cash and cash equivalents | 179 |
Identifiable acquired assets | 5,160 |
Trade and other payables | 314 |
Identifiable acquired liabilities | 314 |
Net identifiable assets | 4,846 |
Net identifiable assets of the subsidiaries acquired at the date of acquisition amounted to €4,846 thousand. The net cash outflow connected with the acquisition (cash outflow adjusted for working capital items, less cash and cash equivalents acquired) payable to the seller as at 31 December 2024 is €4,667 thousand. The consideration was paid in January 2025.
33 Segment reporting
The operating segments for management purposes are the individual properties. For reporting purposes, the Group aggregates the retail properties (shopping malls and street retail centres) on geographic regions of operation. There are a total of eight retail reportable segments which include Romania, Poland, Bulgaria, Slovakia, Hungary, Croatia, Czech Republic and Lithuania for 2025 and nine reportable segments for 2024 comparative period, including Serbia.
Retail properties are considered to have a different economic and risk profiles compared to other types of properties in the Group portfolio, therefore are aggregated and reported separately on geographies.
The office and industrial businesses are immaterial for the Group from both operational and financial statements disclosure points of view. The weight of these categories are below 1% of the total Group portfolio. These properties, together with the corporate entities (group holding companies), are separately disclosed in the “Unallocated” section below.
Starting December 2024, the Group started to voluntarily present two new business segments - Residential and Energy. The Residential segment, based on a Board decision in August 2024, will be expanded from one development in 2023 to another 3 developments in Romania in the following years. The Energy business involves investment in photovoltaic installations on the rooftops of Group properties, as well as greenfield photovoltaic plants. The revenues generated by the photovoltaic installations is realised from the sale of electricity to the tenants of the Group’s retail properties. This revenue will increase in the coming years following the roll-out of the rooftops' installations across all Group geographies and investments in greenfield plants.
The gain on disposal of assets held for sale is realised by NE Property B.V., the Dutch direct parent of the sold properties.
The Chief Operating Decision Makers ("CODM") monitor the results of each reportable segment independently for the purposes of allocating resources to the segment and assessing its performance, as this is the key IFRS 8 driver of segmentation. The measure of reporting segment performance is Profit before net finance costs and other items, as disclosed in the following tables. The Group’s financing policy (including its impact on financial income and expenses), corporate activities and income tax matters are handled at Group level, and the resulting impacts are not allocated to the operating segments.
For the balance sheet, the relevant measure of segment analysis is considered the investment properties and property, plant and equipment for the Energy segment, as the CODM are monitoring closely the asset performance at each reporting date.
Segment investments over a period is the total cost incurred during the period to acquire and develop investment properties, as well as capital expenditure spent on investment properties and property, plant and equipment.
Segment results 31 Dec 2025 | Romania | Poland | Hungary | Slovakia | Bulgaria | Croatia | Czech Republic | Lithuania | Total Retail Segments | Residential | Energy | Unallocated | Total |
|---|---|---|---|---|---|---|---|---|---|---|---|---|---|
Gross rental income | 220,552 | 208,812 | 39,465 | 41,547 | 51,533 | 26,024 | 13,984 | 16,167 | 618,084 | - | - | 6,264 | 624,348 |
Service charge income | 109,278 | 95,473 | 17,636 | 18,498 | 20,898 | 9,816 | 9,327 | 5,442 | 286,368 | - | - | 2,188 | 288,556 |
Property operating expenses | (112,578) | (104,792) | (19,047) | (18,922) | (21,136) | (9,903) | (9,425) | (5,908) | (301,711) | - | - | (2,718) | (304,429) |
Revenue from energy activity | - | - | - | - | - | - | - | - | - | - | 11,262 | - | 11,262 |
Costs of the energy activity | - | - | - | - | - | - | - | - | - | (1,627) | - | (1,627) | |
Net rental and related income | 217,252 | 199,493 | 38,054 | 41,123 | 51,295 | 25,937 | 13,886 | 15,701 | 602,741 | - | 9,635 | 5,734 | 618,110 |
Administrative expenses | (11,572) | (4,902) | (283) | (186) | (36) | (45) | (34) | (182) | (17,240) | (254) | (2,200)1 | (25,348) | (45,042) |
Revenues from sales of inventory property | - | - | - | - | - | - | - | - | - | 6,497 | - | - | 6,497 |
Cost of sales of inventory property | - | - | - | - | - | - | - | - | - | (4,439) | - | - | (4,439) |
EBIT2 | 205,680 | 194,591 | 37,771 | 40,937 | 51,259 | 25,892 | 13,852 | 15,519 | 585,501 | 1,804 | 7,435 | (19,614) | 575,126 |
Fair value adjustments of investment property | 31,901 | 92,319 | (24,757) | (5,620) | 54,267 | 4,278 | 8,833 | 4,664 | 165,885 | - | - | (3,633) | 162,252 |
Foreign exchange (loss)/gain | (1,853) | 492 | 635 | - | (51) | 6 | 439 | - | (332) | (130) | (285) | 302 | (445) |
Profit before net finance costs and other items | 235,728 | 287,402 | 13,649 | 35,317 | 105,475 | 30,176 | 23,124 | 20,183 | 751,054 | 1,674 | 7,150 | (22,945) | 736,933 |
Finance income | 6,038 | 6,038 | |||||||||||
Finance costs | (103,963) | (103,963) | |||||||||||
Bank charges, commissions and fees | (4,127) | (4,127) | |||||||||||
Losses on extinguishment of financial instruments | (4,676) | (4,676) | |||||||||||
Fair value adjustments of derivatives | (5,273) | (5,273) | |||||||||||
Profit before tax | 624,932 | ||||||||||||
Income tax expense | (126,093) | (126,093) | |||||||||||
Current tax expense | (28,831) | (28,831) | |||||||||||
Deferred tax expense | (97,262) | (97,262) | |||||||||||
Profit after tax | 498,839 |
- Out of total amount, €1,623 thousand represents depreciation charge for photovoltaic installations and €577 thousand other expenses, mostly staff costs.
- EBIT (Earnings Before Interest and Taxes) represents the Group's Operating profit, defined as Net rental and related income plus Revenue from sales of inventory property less Cost of sales of inventory property and less Administrative expenses (Depreciation and Amortisation are included in Administrative expenses).
Segment results 31 Dec 2024 | Romania | Poland | Hungary | Slovakia | Bulgaria | Croatia | Czech Republic | Lithuania | Serbia | Total Retail Segments | Residential | Energy | Unallocated | Total |
|---|---|---|---|---|---|---|---|---|---|---|---|---|---|---|
Gross rental income | 215,537 | 153,037 | 39,251 | 39,994 | 47,282 | 24,775 | 13,374 | 15,318 | 11,603 | 560,171 | - | - | 5,898 | 566,069 |
Service charge income | 106,054 | 69,258 | 17,816 | 15,800 | 18,924 | 9,673 | 9,346 | 5,432 | 5,090 | 257,393 | - | - | 2,170 | 259,563 |
Property operating expenses | (110,956) | (80,125) | (19,313) | (15,974) | (19,438) | (9,812) | (9,558) | (5,772) | (5,163) | (276,111) | - | - | (2,630) | (278,741) |
Revenue from energy activity | - | - | - | - | - | - | - | - | - | - | - | 9,048 | - | 9,048 |
Net rental and related income | 210,635 | 142,170 | 37,754 | 39,820 | 46,768 | 24,636 | 13,162 | 14,978 | 11,530 | 541,453 | - | 9,048 | 5,438 | 555,939 |
Administrative expenses | (12,368) | (4,320) | (33) | (21) | (62) | (138) | (12) | (25) | (272) | (17,251) | (133) | (851)1 | (16,958) | (35,193) |
Revenues from sales of inventory property | - | - | - | - | - | - | - | - | - | - | 18,680 | - | - | 18,680 |
Cost of sales of inventory property | - | - | - | - | - | - | - | - | - | - | (13,546) | - | - | (13,546) |
EBIT2 | 198,267 | 137,850 | 37,721 | 39,799 | 46,706 | 24,498 | 13,150 | 14,953 | 11,258 | 524,202 | 5,001 | 8,197 | (11,520) | 525,880 |
Fair value adjustments of investment property | 95,846 | 63,928 | (27,965) | 6,640 | 45,031 | 2,846 | 1,790 | 6,687 | - | 194,803 | - | - | 577 | 195,380 |
Foreign exchange (loss)/gain | (88) | 893 | (806) | - | (53) | - | (250) | - | 9 | (295) | 9 | (16) | 144 | (158) |
Gain on disposal of assets held for sale | - | - | - | - | - | - | - | - | - | - | - | - | 25,934 | 25,934 |
Profit before net finance costs and other items | 294,025 | 202,671 | 8,950 | 46,439 | 91,684 | 27,344 | 14,690 | 21,640 | 11,267 | 718,710 | 5,010 | 8,181 | 15,135 | 747,036 |
Finance income | 19,907 | 19,907 | ||||||||||||
Finance costs | (100,144) | (100,144) | ||||||||||||
Bank charges, commissions and fees | (4,381) | (4,381) | ||||||||||||
Fair value adjustments of derivatives | (12,818) | (12,818) | ||||||||||||
Profit before tax | 649,600 | |||||||||||||
Income tax expense | (62,035) | (62,035) | ||||||||||||
Current tax expense | (30,563) | (30,563) | ||||||||||||
Deferred tax expense | (31,472) | (31,472) | ||||||||||||
Profit after tax | 587,565 |
- Out of total amount, €447 thousand represents depreciation charge for photovoltaic installations and €404 thousand other expenses, mostly staff costs.
- EBIT (Earnings Before Interest and Taxes) represents the Group's Operating profit, defined as Net rental and related income plus Revenue from sales of inventory property less Cost of sales of inventory property and less Administrative expenses (Depreciation and Amortisation are included in Administrative expenses).
The value of investment property, inventory property and property, plant and equipment (PPE) by operating segment, as shown in the Consolidated Statement of financial position, is presented below:
Segment per country assets 31 Dec 2025 | Note | Romania | Poland1 | Hungary | Slovakia | Bulgaria | Croatia | Czech Republic | Lithuania | Total Retail Segments | Energy | Unallocated | Total |
|---|---|---|---|---|---|---|---|---|---|---|---|---|---|
Investment property | 2,961,397 | 2,833,671 | 542,700 | 536,560 | 615,544 | 308,449 | 194,600 | 170,656 | 8,163,577 | - | 69,125 | 8,232,702 | |
—Investment property in use | 2,740,334 | 2,822,857 | 537,800 | 535,500 | 576,613 | 301,200 | 194,600 | 169,400 | 7,878,304 | - | 69,125 | 7,947,429 | |
—Investment property under development | 221,063 | 10,814 | 4,900 | 1,060 | 38,931 | 7,249 | - | 1,256 | 285,273 | - | - | 285,273 | |
Investment property held for sale | 492 | - | - | - | - | - | - | - | 492 | - | 9,075 | 9,567 | |
Property, plant and equipment - Photovoltaic installations | - | - | - | - | - | - | - | - | - | 51,712 | - | 51,712 | |
Property, plant and equipment - Photovoltaic installations under construction | - | - | - | - | - | - | - | - | - | 34,951 | - | 34,951 |
- The right-of-use assets of €91.3 million, representing long-term land concessions associated to part of the Group’s properties located in Poland are included in the above fair values.
Segment per country assets 31 Dec 2024 | Note | Romania | Poland1 | Hungary | Slovakia | Bulgaria | Croatia | Czech Republic | Lithuania | Total Retail Segments | Residential | Energy | Unallocated | Total |
|---|---|---|---|---|---|---|---|---|---|---|---|---|---|---|
Investment property | 2,857,684 | 2,700,550 | 556,000 | 535,523 | 552,674 | 294,426 | 183,700 | 164,942 | 7,845,499 | - | - | 81,096 | 7,926,595 | |
-Investment property in use | 2,676,467 | 2,698,049 | 551,100 | 534,500 | 518,486 | 287,600 | 183,700 | 163,800 | 7,613,702 | - | - | 81,096 | 7,694,798 | |
-Investment property under development | 181,217 | 2,501 | 4,900 | 1,023 | 34,188 | 6,826 | - | 1,142 | 231,797 | - | - | - | 231,797 | |
Investment property held for sale | 559 | - | - | - | - | - | - | - | 559 | - | - | - | 559 | |
Property, plant and equipment - Photovoltaic installations | - | - | - | - | - | - | - | - | - | - | 23,303 | - | 23,303 | |
Property, plant and equipment - Photovoltaic installations under construction | - | - | - | - | - | - | - | - | - | - | 12,972 | - | 12,972 | |
Inventory property | - | - | - | - | - | - | - | - | - | 4,227 | - | - | 4,227 |
- The right-of-use assets of €85.9 million, representing long-term land concessions associated to part of the Group’s properties located in Poland are included in the above fair values.
Segment Investments over the period 31 Dec 2025 | Note | Romania | Poland | Hungary | Slovakia | Bulgaria | Croatia | Czech Republic | Lithuania | Total Retail Segments | Residential | Energy | Unallocated | Total |
|---|---|---|---|---|---|---|---|---|---|---|---|---|---|---|
Development works | 46,946 | 15,333 | 7,274 | 37 | 2,422 | 5,862 | - | 68 | 77,942 | - | - | - | 77,942 | |
Capital expenditure | 23,980 | 17,974 | 4,184 | 6,621 | 6,181 | 3,884 | 1,940 | 981 | 65,745 | - | - | 735 | 66,480 | |
Additions from asset deals - Investment property in use | - | 959 | - | - | - | - | - | - | 959 | - | - | - | 959 | |
Additions from asset deals - PPE - Photovoltaic installations under construction | - | - | - | - | - | - | - | - | - | - | 980 | - | 980 | |
Capital expenditure on PPE - Photovoltaic installations under construction | - | - | - | - | - | - | - | - | - | - | 51,031 | - | 51,031 |
Segment Investments over the period 31 Dec 2024 | Note | Romania | Poland | Hungary | Slovakia | Bulgaria | Croatia | Czech Republic | Lithuania | Total Retail Segments | Residential | Energy | Unallocated | Total |
|---|---|---|---|---|---|---|---|---|---|---|---|---|---|---|
Development works | 73,326 | 6,107 | 4,949 | - | 2,417 | - | 4 | 1,258 | 88,061 | - | - | - | 88,061 | |
Capital expenditure | 15,730 | 21,456 | 2,734 | 2,759 | 1,849 | 2,506 | 2,106 | 866 | 50,006 | - | - | 1,367 | 51,373 | |
Additions from asset deals - Investment property in use | - | 759,666 | - | - | - | - | - | - | 759,666 | - | - | - | 759,666 | |
Capital expenditure on PPE - Photovoltaic installations | - | - | - | - | - | - | - | - | - | - | 538 | - | 538 | |
Additions from asset deals - PPE - Photovoltaic installations under construction | - | - | - | - | - | - | - | - | - | - | 10,559 | - | 10,559 | |
Capital expenditure on PPE - Photovoltaic installations under construction | - | - | - | - | - | - | - | - | - | - | 2,184 | - | 2,184 |
RECONCILIATION OF PROFIT FOR THE YEAR TO DISTRIBUTABLE EARNINGS | 31 Dec 2025 | 31 Dec 2024 |
|---|---|---|
Profit attributable to equity holders of the parent | 498,839 | 587,565 |
Accounting specific adjustments | (57,938) | (174,472) |
Fair value adjustments of investment property | (162,252) | (195,380) |
Depreciation and amortisation expense (in relation to intangibles and property, plant and equipment of an administrative nature)2 | 1,584 | 1,607 |
Fair value adjustments of derivatives | 5,273 | 12,818 |
Losses on extinguishment of financial instruments | 4,676 | - |
Amortisation of financial assets | (2,619) | (3,593) |
Deferred tax expense | 97,262 | 31,472 |
Profit from inventory property sale3 | (1,803) | (4,569) |
Foreign exchange loss unrealised | 224 | - |
Gain on disposal of assets held for sale | - | (25,934) |
Antecedent earnings | (283) | 9,107 |
Distributable earnings | 440,901 | 413,093 |
Interim distributable earnings | (220,695) | (199,044) |
Final distributable earnings | (220,206) | (214,049) |
Distributable earnings per share (euro cents) | 62.03 | 60.17 |
Interim distributable earnings per share (euro cents) | 31.05 | 30.12 |
Final distributable earnings per share (euro cents) | 30.98 | 30.05 |
Distribution declared | 396,811 | 371,784 |
Interim distribution | 198,626 | 179,140 |
Final distribution | 198,185 | 192,644 |
Distribution declared per share (euro cents) | 55.83 | 54.16 |
Interim distribution per share (euro cents) | 27.95 | 27.11 |
Final distribution per share (euro cents) | 27.88 | 27.05 |
Earnings not distributed | 44,090 | 41,309 |
Interim earnings not distributed | 22,069 | 19,904 |
Final earnings not distributed | 22,021 | 21,405 |
Earnings not distributed per share (euro cents) | 6.20 | 6.01 |
Earnings not distributed per share interim (euro cents) | 3.10 | 3.01 |
Earnings not distributed per share final (euro cents) | 3.10 | 3.00 |
Number of shares entitled to interim distribution | 710,716,7984 | 660,826,020 |
Number of shares entitled to final distribution | 710,716,7984 | 712,357,309 |
- Distributable earnings per share is prepared on a basis that is consistent with SA REIT funds from operations (SA REIT FFO) as set out in the SA REIT Association’s Best Practice Recommendations Second Edition.
- In the computation of distributable earnings, the Company eliminated the impact of the amortisation and depreciation related to intangibles and PPE of an administrative nature. The DEPS is impacted by the depreciation expense of the photovoltaic installations in amount of €1,623 thousand in 2025 (2024: €447 thousand), which is a revenue generating activity.
- The current tax expense line in SOCI includes €255 thousand in 2025 (2024: €565 thousand) representing the current tax expense on residential business, thus, the profit of residential is computed as revenue less cost of sale less current tax expense, and it is excluded from the computation of distribution earnings.
- Excludes 1,640,511 treasury shares as at 31 December 2025. For further details please see Note 17.
34 Cash flow from operations
in € thousand | Note | 31 Dec 2025 | 31 Dec 2024 |
|---|---|---|---|
OPERATING ACTIVITIES | |||
Profit after tax | 498,839 | 587,565 | |
Adjustments | 86,848 | (56,592) | |
Fair value adjustments of investment property | (162,252) | (195,380) | |
Foreign exchange loss | 445 | 158 | |
Gain on disposal of assets held for sale | - | (25,934) | |
Finance income | (6,038) | (19,907) | |
Finance costs | 103,963 | 100,144 | |
Bank charges, commissions, and fees | 4,127 | 4,381 | |
Fair value adjustments of derivatives | 5,273 | 12,818 | |
Losses on extinguishment of financial instruments | 4,676 | - | |
Deferred tax expense | 97,262 | 31,472 | |
Current tax expense | 28,831 | 30,563 | |
Depreciation expense for property, plant and equipment and amortization of intangibles | 3,207 | 2,053 | |
Share based payment expense | 7,354 | 3,040 | |
Changes in working capital | (13,104) | 2,655 | |
(Increase) in trade and other receivables | (19,126) | (38,395) | |
Increase in trade and other payables | 1,795 | 28,011 | |
Decrease in Inventory property | 4,227 | 13,039 | |
Net cash flow from operations | 572,583 | 533,628 |
35 CONTINGENT ASSETS AND LIABILITIES
Contingencies
The Group is subject to various taxes across all jurisdictions in which it operates. The calculation of tax charges and provisions involves a degree of estimation and judgment. There are transactions and calculations for which the relevant tax authorities have indicated different interpretations of the fiscal legislation compared to the Group’s approach. When such discrepancies arise, the carrying amount of tax provisions and charges is determined based on the expected resolution of tax assessments and the stage of discussions or negotiations with the relevant tax authorities. Given the complexity of tax regulations, the final outcome of tax proceedings is often uncertain and may take several years to be resolved.
Several Group entities in Romania have been subject to tax inspections by the Romanian Tax Authorities (“RTA”). The tax inspections have been finalized, resulting in additional tax liabilities imposed by RTA’s totaling €32.5 million as of the date of these financial statements which have also been entirely paid by 31 December 2025. These liabilities are primarily related to the RTA’s challenges to the deductibility and pricing of certain intra-group transactions, reflecting a position that differs from the Group’s interpretation of applicable tax legislation and transfer pricing principles.
As the Group is not aware of the RTA’s position being established as market practice in Romania or in other CEE countries where it operates, it has challenged the RTA’s conclusions where appropriate. A tax receivable corresponding to the amount paid has been recognised in Other long-term assets, based on Group’s assessment of the likely outcome of the challenge.
No additional tax liabilities have been recorded in connection with these audits, as the Group believes further tax assessments are not warranted.
To assess potential tax contingencies, the Group has evaluated various scenarios, incorporating different sets of possible outcomes, updated for the most recent tax positions taken by the RTA. Based on this analysis, the weighted average estimated impact of potential additional tax liabilities is €13.1 million.
Legislative framework
The Group operates in a complex legal and regulatory environment, exposing it to various risks. It carefully evaluates all facts and assesses the implications that could have a material effect on the financial statements. To the extent the Group is subject to reviews, procedures, information requests and other assessments, including regulatory or tax matters, multiple outcomes are possible, which may result in further regulatory or tax investigations, litigations or sanctions.
The implementation of Pillar Two across multiple jurisdictions, uncertainties in its wording, reliance on safe harbor provisions, and unclear charging mechanisms create challenges in assessing NEPI Rockcastle’s (future) tax exposure. The Group continuously monitors the impact it has on the financial statements for each jurisdiction. Uncertainties in interpretation of Pillar Two mean different outcomes are possible.
Guarantees
As at 31 December 2025, the Group had received letters of guarantee from tenants worth €163,032 thousand (31 December 2024: €152,131 thousand) and from suppliers worth €49,575 thousand (31 December 2024: €32,565 thousand) related to ongoing developments.
Commitments
In 2026, the Group estimates to invest €338 million in development and capital expenditure related to its ongoing projects or new development opportunities (impacting investment property, property, plant and equipment and inventory property), out of which only a portion is already contracted at reporting date.
36 Related party transactions
Identity of related parties with whom material transactions have occurred
The Directors are related parties for the Group.
a Material related party transactions
Fees paid to Directors, together with the performance bonus, during the current and previous year are detailed below. No other payments were made to Directors by NEPI Rockcastle, except reimbursements for travel and accommodation.
31 Dec 2025 | 31 Dec 2024 | |||
|---|---|---|---|---|
in € thousand | Directors’ fees | Performance related remuneration | Directors’ fees | Performance related remuneration |
Rüdiger Dany1 | 675 | 1,800 | 675 | 1,067 |
Eliza Predoiu | 440 | 656 | 385 | 554 |
Marek Noetzel | 440 | 739 | 385 | 628 |
George Aase | 157 | - | 157 | - |
Antoine Dijkstra | 102 | - | 102 | - |
Andre van der Veer | 108 | - | 108 | - |
Andreas Klingen | 100 | - | 100 | - |
Steve Brown | 87 | - | 87 | - |
Andries de Lange | 78 | - | 78 | - |
Jonathan Lurie | 79 | - | 79 | - |
Ana Maria Mihaescu | 90 | - | 90 | - |
Jeanine Holscher2 | 73 | - | 56 | - |
Total | 2,429 | 3,195 | 2,302 | 2,249 |
- Upon the conclusion of Rüdiger Dany's CEO mandate on 31 March 2026, the Board approved a one-off reward of €700 thousand supplementary to the performance-related remuneration for the year 2025, as recognition of his significant contribution to the Group's strategic and operational performance. In addition, in accordance with the good leaver provisions of the NEPI Rockcastle Incentive Plan, the Board approved the accelerated vesting of share awards with a value of €3,130 thousand (Note 27). Half of the vested shares are subject to a two-year selling restriction following 31 December 2025.
- Ms Jeanine Holscher was appointed as an Independent non-Executive Director with effect from 14 May 2024.
b Shares held under the Share Purchase Schemes
Name of Director | Number of shares held as at 31 Dec 2025 | Number of shares held as at 31 Dec 20241 |
|---|---|---|
Marek Noetzel | 88,358 | 88,358 |
Total | 88,358 | 88,358 |
- Shares presented in the table above are pledged as security for the loan under Share Purchase Scheme.
c Shares unvested under the LTSIP
Name of Director | Number of shares unvested at 31 Dec 2025 | Number of shares unvested at 31 Dec 2024 |
|---|---|---|
Rüdiger Dany1 | - | 399,740 |
Eliza Predoiu | 396,405 | 256,194 |
Marek Noetzel | 404,467 | 275,256 |
Total | 800,872 | 931,190 |
- Please refer to Note 36 a) for further details on Rüdiger Dany's accelerated share vesting.
The Directors of the Group hold 2,391,243 shares as at 31 December 2025 (31 December 2024: 1,854,569 shares), which represents 0.34% of the outstanding shares (31 December 2024: 0.26% of the outstanding shares). Out of the above-mentioned shareholding, 645,020 shares (31 December 2024: 560,858 shares) which represent 0.09% of the outstanding shares (31 December 2024: 0.08% of the outstanding shares) are held by the non-Executive Directors. There were no changes to the Director’s interests from 31 December 2025 to the approval of the annual audited Consolidated Financial Statements, other than the shares awarded in February 2026, as detailed in the Remuneration section of this Annual Report, on page . Other than as set out in note 36(b) above, none of the shares of the Director are subject to security, guarantee, collateral, and they are not encumbered in any way.
d Share based payment expense
Name of Director | 2025 | 2024 |
|---|---|---|
Rüdiger Dany | 4,1191 | 483 |
Eliza Predoiu | 538 | 360 |
Marek Noetzel | 608 | 482 |
Total | 5,265 | 1,325 |
- Including €3,130 thousand accelerated share awards as disclosed in Note 36 a).
e Other related party transactions
Under Romanian fiscal legislation, corporate income taxpayers may redirect a portion of their corporate income tax liability towards sponsorship of eligible non-profit organisations registered with the Romanian tax authorities. During 2025 the Group decided to redirect an amount of €50 thousand to the Salbek Castle Association in support of the Association's community-oriented cultural and heritage projects, in line with NEPI Rockcastle's strategy on Corporate Social Responsibility. The Salbek Castle Association is a related party to Ana Maria Mihaescu, a non-Executive Director of the Company.
37 Subsequent events
Subsequent to the year-end, the Group signed a €225 million green term facility agreement with a five-year maturity, arranged with a consortium of three banks — ING, SMBC, and Intesa. The committed facility is scheduled to be drawn down by 31 March 2026. The funding was secured at competitive terms, referenced to Euribor rates. The facility strengthens the Group's liquidity position and is in line with the Group's Green Finance Framework.
In addition, one of the secured green portfolio loan facilities in Romania was successfully renegotiated, resulting in a €74 million top‑up. The loan is provided by a consortium of Erste, BCR and Raiffeisen.
Subsequent to the reporting date, geopolitical tensions in the Middle East, including the ongoing conflict involving Iran, have continued to evolve. The Group has no direct operations, investments or assets in Iran or the broader Middle East region. The Directors do not expect the conflict to have a direct material impact on the Group's assets, liabilities, or financial performance. The Group operates in Central and Eastern European markets, and notes that any prolonged regional instability may indirectly affect economic conditions in these markets through volatility in energy prices, inflationary pressures, and potential impacts on consumer spending. Such effects, if they arise, are consistent with the broader macro‑economic risks to which the Group is exposed. Management continues to closely monitor these developments and the potential implications of these events on the business. No adjusting subsequent events have been identified as at the date of approval of these financial statements.
Except for the above, the Directors are not aware of any subsequent events from 31 December 2025 and up to the date of signing these Consolidated Financial Statements which are likely to have a material effect on the financial information contained in this report.
Separate Financial Statements for the year ended 31 December 2025
Separate Statement of financial position
in € thousand | Note | 31 Dec 2025 | 31 Dec 2024 |
|---|---|---|---|
ASSETS | |||
Non-current assets | 3,402,642 | 3,576,147 | |
Investments in subsidiaries | 3,401,788 | 3,575,257 | |
Other long-term assets | 854 | 890 | |
Current assets | 28,888 | 115,901 | |
Trade and other receivables | 25,523 | 51,031 | |
Cash and cash equivalents | 3,365 | 64,870 | |
TOTAL ASSETS | 3,431,530 | 3,692,048 | |
EQUITY AND LIABILITIES | |||
TOTAL SHAREHOLDERS' EQUITY | 3,424,081 | 3,679,968 | |
Share capital | 7,124 | 7,124 | |
Share premium | 2,941,120 | 3,255,148 | |
Merger reserve | 25,188 | 25,188 | |
Other reserves | (9,432) | (9,662) | |
Treasury shares | (10,076) | - | |
Accumulated profit | 470,157 | 402,170 | |
Total liabilities | 7,449 | 12,080 | |
Current liabilities | 7,449 | 12,080 | |
Trade and other payables | 6,107 | 4,794 | |
Income tax payable | 1,342 | 7,286 | |
TOTAL EQUITY AND LIABILITIES | 3,431,530 | 3,692,048 |
Separate Statement of comprehensive income
in € thousand | Note | 31 Dec 2025 | 31 Dec 2024 |
|---|---|---|---|
Interest income | 804 | 1,510 | |
Guarantee fee income | 12,754 | 25,772 | |
Dividend income | 130,000 | 340,000 | |
Strategic asset management income | 8,981 | 6,296 | |
Administrative expenses | (10,142) | (9,682) | |
Foreign exchange gain | 451 | 75 | |
Other finance expense | (30) | (24) | |
Profit before tax | 142,818 | 363,947 | |
Income tax credit/ (expense) | 2,280 | (4,462) | |
Profit after tax | 145,098 | 359,485 | |
Total comprehensive income for the year | 145,098 | 359,485 |
Separate Statement of changes in equity
in € thousand | Note | Share capital | Share premium | Other reserves | Shares buyback reserve | Merger reserve | Accumulated profit/ (deficit) | Total |
|---|---|---|---|---|---|---|---|---|
Balance at 1 January 2024 | 6,608 | 3,137,063 | (7,637) | - | 25,188 | 143,105 | 3,304,327 | |
Transactions with owners | 516 | 118,085 | (2,025) | - | - | (100,420) | 16,156 | |
Share capital movements1 | 178,079 | (178,079) | - | - | - | - | - | |
Earnings distribution – capital repayment2 | (178,079) | - | - | - | - | - | (178,079) | |
Issue of shares, net of transaction costs | 418 | 294,757 | - | - | - | - | 295,175 | |
Earnings distribution – dividend out of accumulated profit2 | - | - | - | - | - | (100,420) | (100,420) | |
Earnings distribution – impact of foreign exchange hedges2 | - | 1,505 | - | - | - | - | 1,505 | |
Earnings distribution – scrip issue2 | 98 | (98) | - | - | - | - | - | |
Shares purchased for LTSIP3 | - | - | (5,154) | - | - | - | (5,154) | |
Share based payment expense | - | - | 3,040 | - | - | - | 3,040 | |
LTSIP reserve release | - | - | 89 | - | - | - | 89 | |
Total comprehensive income | - | - | - | - | - | 359,485 | 359,485 | |
Profit for the year | - | - | - | - | - | 359,485 | 359,485 | |
Balance at 31 December 2024 | 7,124 | 3,255,148 | (9,662) | - | 25,188 | 402,170 | 3,679,968 | |
Transactions with owners | - | (314,028) | 230 | (10,076) | - | (77,111) | (400,985) | |
Share capital movements1 | 314,227 | (314,227) | - | - | - | - | - | |
Earnings distribution – capital repayment2 | (314,227) | - | - | - | - | - | (314,227) | |
Earnings distribution – dividend out of accumulated profit2 | - | - | - | - | - | (77,111) | (77,111) | |
Earnings distribution – impact of foreign exchange hedges2 | - | 199 | - | - | - | - | 199 | |
Shares purchased for LTSIP3 | - | - | (7,148) | - | - | - | (7,148) | |
Share based payment expense | - | - | 7,354 | - | - | - | 7,354 | |
LTSIP reserve release | - | - | 24 | - | - | - | 24 | |
Treasury shares | - | - | - | (10,076) | - | - | (10,076) | |
Total comprehensive income | - | - | - | - | - | 145,098 | 145,098 | |
Profit for the year | - | - | - | - | - | 145,098 | 145,098 | |
Balance at 31 December 2025 | 7,124 | 2,941,120 | (9,432) | (10,076) | 25,188 | 470,157 | 3,424,081 |
- Share capital movements relate to the net increase of the nominal value of the shares in respect to the shareholders that elected the distributions as capital repayment. For further details, please refer to Note 17.
- The Company offers three possible alternatives for settlement of its distribution: capital repayment (default option), dividend out of accumulated profit and scrip issue, the latter one at the discretion of the Board. For further details on distribution options impacting the reporting year, please refer to Note 17.
- LTSIP = debt free Long-Term Share Incentive Plan with a vesting component.
Separate Statement of cash flows
in € thousand | Note | 31 Dec 2025 | 31 Dec 2024 |
|---|---|---|---|
OPERATING ACTIVITIES | |||
Profit after tax | 145,098 | 359,485 | |
Adjustments | (132,682) | (336,931) | |
Dividend income | (130,000) | (340,000) | |
Income tax (credit)/ expense | (2,280) | 4,462 | |
Share based payment expense | 823 | 168 | |
Foreign exchange gain | (451) | (75) | |
Net finance income | (774) | (1,486) | |
Changes in working capital | |||
Decrease/ (Increase) in trade and other receivables | 26,022 | (22,836) | |
Decrease in trade and other payables | (2,381) | (4,032) | |
Interest received | 777 | 1,318 | |
Dividend received | 130,000 | 340,000 | |
NET CASH FLOWS FROM OPERATING ACTIVITIES | 166,834 | 337,004 | |
INVESTING ACTIVITIES | |||
Increase in investment from capital contribution | - | (300,000) | |
Proceeds from a reduction of share premium of subsidiary | 180,000 | - | |
NET CASH FLOW FROM/(USED) IN INVESTING ACTIVITIES | 180,000 | (300,000) | |
FINANCING ACTIVITIES | |||
Proceeds from issue of shares | - | 295,175 | |
Payment to acquire shares for LTSIP1 | (7,148) | (5,154) | |
Sale of unvested shares under LTSIP | 24 | 89 | |
Repurchase of shares | (10,076) | - | |
Earnings distribution - Capital repayment and dividend | (391,139) | (276,994) | |
NET CASH FLOW (USED IN)/FROM FINANCING ACTIVITIES | (408,339) | 13,116 | |
NET (DECREASE)/INCREASE IN CASH AND CASH EQUIVALENTS | (61,505) | 50,120 | |
Cash and cash equivalents brought forward | 64,870 | 14,750 | |
CASH AND CASH EQUIVALENTS CARRIED FORWARD | 3,365 | 64,870 |
- LTSIP = Debt free long-term share incentive plan with a vesting component.
Notes to the Separate Financial Statements
38 Basis of preparation
The separate financial statements of the Company have been prepared in accordance with IFRS Ⓡ Accounting Standards as issued by the International Accounting Standards Board (IASB), the SAICA Financial Reporting Guides as issued by the Accounting Practices Committee, Financial Pronouncements as issued by the Financial Reporting Standards Council, the JSE Listings Requirements, IFRS Acounting Standards as adopted by the European Union and with Title 9 of Book 2 of the Dutch Civil Code.
In case no other policies are mentioned, reference should be made to the accounting policies described in the Consolidated Financial Statements. For an appropriate interpretation, the Company financial statements of NEPI Rockcastle N.V. should be read in conjunction with the Consolidated Financial Statements.
The separate financial statements are presented in Euro (“€”, “EUR”) thousands unless otherwise stated, which is the Company’s functional and presentation currency.
The Company’s separate financial statements include intra-group balances and transactions, investments in subsidiaries and any gains and losses or income and expenses arising from intra-group transactions. The Company’s investments in subsidiaries are subject to impairment testing annually, if indicators of impairment exist.
Management has prepared the financial statements on a going concern basis. Having considered the potential impact of the overall macroeconomic environment on the Company’s and the wider NEPI Rockcastle Group revenues, profits, cash flows, operations, liquidity position and debt facilities, management concluded that despite the market reactions to various geopolitical events during 2025 and subsequent to the year-end, there are no material uncertainties relating to the Company’s ability to continue as a going concern.
39 Summary of material accounting policies
The material accounting policies set out below have been consistently applied to all periods presented.
The following accounting policies presented in the Consolidated Financial Statements are relevant for the Company only financial statements:
3.9. Financial assets
3.12. Cash and cash equivalents
3.17. Accumulated profit
3.20. Earnings distribution
3.25. Standards issued but not yet effective and not early adopted
39.1 Financial liabilities – measurement categories
Financial liabilities are initially recognised at fair value and classified and subsequently measured at amortised cost.
Financial guarantee contracts are recognised as a financial liability at the time the guarantee is issued. The liability is initially measured at fair value and subsequently at the higher of:
the amount determined in accordance with the expected credit loss model under IFRS 9 Financial Instruments, and
the amount initially recognised less, where appropriate, the cumulative amount of income recognised in accordance with the principles of IFRS 15 Revenue from Contracts with Customers.
The fair value of financial guarantees is determined based on the present value of the difference in cash flows between the contractual payments required under the debt instrument and the payments that would be required without the guarantee, or the estimated amount that would be payable to a third party for assuming the obligations.
Guarantee fee income represent the premium received for the guarantee granted by the Company to its subsidiary and is recognised in the income statement in Guarantee fee income line on a straight line basis over the life of the guarantee.
39.2 Investments in subsidiaries
Investments in subsidiaries are stated at cost less accumulated impairment losses. An impairment loss is recognised for the amount by which the asset’s carrying amount exceeds its recoverable amount. The recoverable amount is the higher of an asset’s fair value less costs to sell and value in use. At each reporting period investments in subsidiaries are assessed subject to any indicators of impairment. The impairment test itself is carried when such indicators exist. An impairment loss is recognised for the amount by which the asset’s carrying amount exceeds its recoverable amount. Assets that have suffered an impairment are reviewed for possible reversal of the impairment at each reporting date.
39.3 Trade receivables
Trade receivables are recognised initially at fair value, generally at the amount of consideration that is unconditional. The Company holds the trade receivables with the objective to collect the contractual cash flows and therefore measures them subsequently at amortised cost using the effective interest method. If collection is expected in one year or less, they are classified as current assets. If not, they are presented as non-current assets.
Trade receivables are written off when there is no reasonable expectation of recovery. Indicators that there is no reasonable expectation of recovery include, amongst others, the failure of a debtor to engage in a repayment plan with the Company.
39.4 Administrative expenses
Administrative expenses are recognised on an accrual basis.
39.5 Dividend income
Dividends are recognised as income in the Statement of comprehensive income when the Company’s right to receive payment is established.
39.6 Interest income
Interest income is recognised on a time-proportionate basis using the effective interest method.
39.7 Taxation
Current income tax and liabilities are measured at the amount expected to be recovered from, or paid to, taxation authorities. The tax rates and tax laws used to compute the amount are those that are enacted, or substantively enacted, by the reporting date. Current income tax relating to items recognised directly in equity is recognised directly in equity and not in the Statement of comprehensive income. Management periodically evaluates positions taken in tax returns with respect to situations in which applicable tax regulations are subject to interpretation and establishes provisions where appropriate.
Output Value Added Tax (VAT) related to sales is payable to tax authorities on either the collection of receivables from customers or the delivery of services to customers depending on which occurs first. Input VAT is generally recoverable against output VAT upon receipt of the invoice. VAT relating to sales and purchases is recognised in the Statement of financial position on a net basis and is disclosed separately as an asset or liability, as the case may be. Where provision has been made for impairment of receivables, the loss is recorded for the gross amount of the debt, including VAT.
39.8 Share-based payments
To date, NEPI Rockcastle has initiated two types of incentive programs that offered share-based payments in exchange for services provided to it by its directors and employees (equity-settled transactions), which are detailed below:
a Purchase Offers with a vesting component – Share Purchase Scheme (“NRP SPS”)
This program was put in place before the 2017 merger of the former groups New Europe Property Investments plc (“NEPI”) and Rockcastle Global Real Estate Company Ltd (“Rockcastle”). Under this program, participants were granted loans to acquire shares in the Company at fair value at the grant date. These loans were classified as “loan to participants in the incentive plan” and included in Other long-term assets (Note 43). The loans are carried at amortised cost and the accrued interest is recognised as finance income in the Statement of comprehensive income. The costs under this program are nil.
b Debt free Long-Term Share Incentive Plan with a vesting component (“LTSIP”)
This program was put in place after the 2017 merger of the former groups NEPI and Rockcastle. Under this incentive plan, shares may be issued by the Company to executive directors and other key personnel for no cash consideration. Awards under this plan are at the discretion of the Board of Directors and are based on the performance of the Group and the employees. The costs related to the LTSIP are measured based on the fair value of the shares at the grant date and are recognised in the Company’s financial statements over the vesting period as an increase in the investment in the subsidiaries, as the employees receiving the awards are providing services to the subsidiaries of the Company. The correspondent credit is recognised in Other reserves in the Statement of changes in equity.
In the accounts of the subsidiaries, an expense for the grant date fair value of the award is recognised over the vesting period, with the credit recognised in equity. The credit to equity is treated as a capital contribution, because the Company is compensating the subsidiaries’ employees with no recharge to the subsidiaries.
40 Significant accounting estimates and judgements in applying accounting policies
The estimates and associated assumptions are based on historical experience and various other factors which are considered reasonable under the circumstances. These are used to make judgements about the carrying values of assets and liabilities that are not apparent from other sources. Actual results may differ from these estimates.
The estimates and associated assumptions are reviewed on an ongoing basis. Revisions to accounting estimates are recognised in the period when the estimate is revised if the revision affects only that period or in the period of the revision and future periods if the revision affects both.
Judgements and estimates that can cause a significant adjustment to the carrying amount of assets and liabilities within the next financial year are detailed below.
Impairment of investments in subsidiaries
The Company has an investment in Nepiom Limited that acts as intermediary holding and financing vehicle. That entity has an investment in NE Property B.V. which holds investments in all the operating subsidiaries of the Group. Its consolidated net assets value consists mainly of investment properties at fair value, as well as other items for which the carrying amount is considered to approximate fair value (loans, working capital items), therefore it is used as a recoverable amount in the impairment calculation. When the investments in subsidiaries are higher than the subsidiaries net assets value, the carrying value of that investment is reduced.
41 Financial risk management and financial instruments
The Company has exposure to the following risks due to its use of financial instruments: credit, liquidity, and market, including currency and interest rate. This note presents information about the Company’s exposure to each, as well as its objectives, policies and processes for measuring and managing risk.
The fair value of all financial instruments is substantially in line with their carrying amounts as reflected on the Statement of financial position.
41.1 Credit risk
Credit risk is the risk of financial loss to the Company if a counterparty to a financial instrument fails to meet its contractual obligations and arises principally from the Company’s group receivables, cash and cash equivalents, and financial guarantees.
The exposure to credit risk at the reporting date is set out below:
Credit exposure on financial instruments excluding exposure to guarantees granted | Note | 31 Dec 2025 | 31 Dec 2024 |
|---|---|---|---|
in € thousand | |||
Loans to participants in Share Purchase Scheme (including accrued interest) | 854 | 890 | |
Trade and other receivables | 25,523 | 51,031 | |
Cash and cash equivalents | 3,365 | 64,870 | |
Total | 29,742 | 116,791 |
Included in the “Trade and other receivables” above, there is an annual guarantee fee that the Company charges to one of its indirect subsidiaries, NE Property B.V. (NEBV), for its role as a guarantor under the external financing agreements concluded by NEBV, namely issued fixed coupon bonds and unsecured revolving credit facilities. At 31 December 2025, the balance of guarantee fee receivable from NEBV was of €16,064 thousand (31 December 2024: €42,312 thousand).
In accordance with the Group’s external unsecured financing agreements, the Company has guaranteed the due and punctual payment of all sums from time to time payable by NEBV under those agreements in case of non-payment by the latter. The value of NEBV liabilities (excluding future interest) towards its creditors under above mentioned financing agreements at 31 December 2025 was of €2,518,476 thousand (31 December 2024: €2,518,476 thousand).
The Company has assessed the fair value of the liability for financial guarantee at inception being immaterial. As at 31 December 2025 and 31 December 2024 the respective financial liability has been measured in accordance with the accounting policy at the higher of Expected Credit Loss allowance and amount initially recognised. The ECL allowance amount was determined to be immaterial considering the total exposure for amounts guaranteed and NEBV’s credit risk.
For cash and cash equivalents, the banks’ credit ratings, as well as exposure per each bank are constantly monitored at the level of the Group. At 31 December 2025, 84% of the Company's cash was held with investment-grade rated banks (31 December 2024: 99%):
Cash and cash equivalents | 31 Dec 2025 | 31 Dec 2024 |
|---|---|---|
Held with investment-grade rated banks (rated by Moody's) | ||
A1 | 84% | 99% |
Held with banks without a formal credit rating | 16% | 1% |
Total | 100% | 100% |
The balance of loans to participants in the Share Purchase Scheme is not considered to present credit risk as these are guaranteed with shares (see details in Note 46).
41.2 Liquidity risk
Liquidity risk is the risk that the Company will not be able to meet its financial obligations when due. The Company’s approach to managing this risk ensures, as far as possible, it will always have sufficient liquidity to meet its liabilities when due, under normal and stressed conditions, without incurring unacceptable losses or risking damage to its reputation. To ensure this occurs, the Company prepares budgets, cash flow analyses and forecasts, which enable the Directors to assess the level of financing required for future periods. Budgets and projections are used to assess any future potential investments and are compared to existing funds to evaluate the nature, and extent of any future funding requirements. All financial liabilities are due within 12 months.
Ability to meet financial obligation when due is influenced by the fact that the Company has guaranteed the due and punctual payment of all sums from time to time payable by NEBV under those agreements in case of non-payment by the latter, as described in Note 41.1. The undiscounted cash flows which the Company is exposed to amounts to €2,667,878 thousand (31 December 2024: €2,865,784 thousand) which becomes payable on demand only upon default by NEBV.
41.3 Market risk
Market risk is the risk that changes in market prices, such as foreign exchange rates, interest rates or equity prices will affect the Company’s fair value or future cash flows of financial instruments. The objective of market risk management is to manage market risk exposures within acceptable parameters, while optimising returns. The carrying value of financial assets and liabilities approximates their fair value.
41.3.1 Currency risk
Company’s current assets and liabilities are exposed to foreign currency risk on purchases and receivables denominated in South African rand (ZAR). Cash inflows received in other currencies than Euro are converted to Euro using the spot rate available on the collection date. The amount converted to Euro is the net amount of cash inflow in a foreign currency and the estimated cash outflow in the same currency. The Company applies this policy to control its exposures in respect of monetary assets and liabilities denominated in currencies other than the one cash inflows are received in. Sensitivities of profit or loss to reasonably possible changes in exchange rates applied at the financial position date relative to currencies other than EUR, with all other variables such as interest rates held constant, are immaterial.
41.3.2 Interest rate risk
Sensitivity analysis for interest bearing financial instruments
A change of 50 basis points (bps) in interest rates would have increased/(decreased) equity and profit for the years presented below. Calculations are based on loans balances outstanding at 31 December 2025. Loans balances are subject to change over the year. This analysis assumes that all other variables, particularly foreign currency rates, remain constant. All sensitivity analysis calculations presented below are before tax.
in € thousand | 31 Dec 2025 | 31 Dec 2024 |
|---|---|---|
Loans to participants in the Share Purchase Scheme | 854 | 890 |
Total | 854 | 890 |
31 Dec 2025 | Profit or loss 50bps increase | Profit or loss 50bps decrease | Equity 50bps increase | Equity 50bps decrease |
|---|---|---|---|---|
in € thousand | ||||
Loans to participants in the Share Purchase Scheme (including accrued interest) | 4 | (4) | 4 | (4) |
Total | 4 | (4) | 4 | (4) |
A change of 100 basis points (bps) in interest rates would have increased/(decreased) equity and profit for the years presented below. Calculations are based on loans balances outstanding at 31 December 2024.
31 Dec 2024 | Profit or loss 100bps increase | Profit or loss 100bps decrease | Equity 100bps increase | Equity 100bps decrease |
|---|---|---|---|---|
in € thousand | ||||
Loans to participants in the Share Purchase Scheme (including accrued interest) | 9 | (9) | 9 | (9) |
Total | 9 | (9) | 9 | (9) |
42 Investments in subsidiaries
At 31 December 2025 and 31 December 2024, the Company held 100% ownership in Nepiom Limited, a company incorporated in Malta. Investments in subsidiaries are stated at cost less accumulated impairment losses.
The movements in investment in subsidiaries are presented below:
in € thousand | 31 Dec 2025 | 31 Dec 2024 |
|---|---|---|
Balance as at the beginning of the year | 3,575,257 | 3,272,385 |
Additions | - | 300,000 |
Reduction of share premium of subsidiary | (180,000) | - |
Additions from LTSIP1 | 6,531 | 2,872 |
Balance as at the end of the year | 3,401,788 | 3,575,257 |
- The costs related to the LTSIP recognised in the Company’s financial statements as an increase in the investment in the subsidiaries, as disclosed in in Note 39.8.
In November 2024, the Company subscribed additional shares to its investment in Nepiom Limited in amount of €300 million, following the capital raise made by the Company in October 2024.
In June 2025, the Company approved a reduction of the share premium account of its subsidiary, Nepiom Limited, by €180 million, with the return of capital becoming effective after the statutory three‑month lapse period, and the Company received the related funds in October 2025.
There were no indicators of impairment in investment in subsidiary as at 31 December 2025.
43 Other long-term assets
in € thousand | 31 Dec 2025 | 31 Dec 2024 |
|---|---|---|
Loans to participants in the Share Purchase Scheme | 854 | 890 |
44 Trade and other receivables
in € thousand | 31 Dec 2025 | 31 Dec 2024 |
|---|---|---|
VAT receivable | - | 160 |
Guarantee fee receivables from subsidiaries | 16,064 | 42,312 |
Strategic asset management fee receivable from subsidiaries | 7,493 | 7,512 |
Other receivables from subsidiaries | 1,595 | 629 |
Other receivables | 40 | 162 |
Other prepaid fees | 331 | 256 |
Total | 25,523 | 51,031 |
45 Cash and cash equivalents
Cash and cash equivalents by currency | 31 Dec 2025 | 31 Dec 2024 |
|---|---|---|
in € thousand | ||
EUR | 2,672 | 63,109 |
ZAR | 693 | 1,761 |
Total | 3,365 | 64,870 |
Cash and cash equivalents by type | 31 Dec 2025 | 31 Dec 2024 |
|---|---|---|
in € thousand | ||
Current accounts | 3,365 | 14,870 |
Deposits | - | 50,000 |
Total | 3,365 | 64,870 |
46 Share-based payments
The NEPI Rockcastle Group has incentive plans to reward performance and align the interests of executive directors and key individuals with those of the shareholders.
The aim of the plan is to incentivise directors and employees to meet the Group’s short-term and long-term objectives by giving such participants an opportunity to receive performance-based Awards (in cash or shares), on short-term (immediate settlement in cash or shares) or long-term (shares with a vesting component). The Board determines which executive directors are eligible to participate in the Incentive Plan, and the allocation of incentives, based on key performance indicators. The executive directors determine which key employees are eligible to participate in the Incentive Plan, and the allocation of incentives is discretionary, based on key performance indicators and other considerations regarding the employees’ performance.
To date, NEPI Rockcastle has initiated two types of incentive programs that offered share-based payments in exchange for services provided to it by its directors and employees (equity-settled transactions), which are detailed below.
a Purchase Offers (“SPS”)
Under this program, loans were granted to participants in the share purchase schemes (the “Share Purchase Scheme” or “SPS”) to buy shares, the repayment of which could be made in part out of the distribution payable in relation to the shares (the “NRP SPS”). Of the shares initially subscribed for, 20% vested annually. The Group offered each participant the immediate right to subscribe for the permitted number of shares at their market value, less a maximum discount of 5%, together with a loan to fund the purchase. Each loan carried interest at the weighted average rate that the Group can borrow money. Loans are payable in full, together with interest, ten years after its subscription date, but could be repaid earlier. The Company has security interests that ensure the repayment of the principal and interest on the loan given to participants. The NRP SPS is a full recourse scheme (i.e., recourse in relation to loans granted is not limited to shares issued). Pending repayment of the loan, the distributions on such shares are used to repay loan interest. Any excess distribution after interest payment is used to repay the loan.
No shares were issued during 2025 and 2024 under the NRP SPS.
The number of shares outstanding and the loans to participants under the Share Purchase Scheme as at the year-end are summarised below:
NRP SPS | 31 Dec 2025 | 31 Dec 2024 |
|---|---|---|
Number of shares outstanding, collateralizing the Loans to participants under the Share Purchase Scheme | 114,109 | 114,109 |
Loans to participants under the Share Purchase Scheme (in € thousand) | 854 | 890 |
b Debt free Long-Term Share Incentive Plan with a vesting component (“LTSIP”)
Under this incentive plan, shares are awarded by the Group to executive directors and other key employees for no cash consideration. For key employees, shares are awarded to participants on condition of employment in the Group for the next three years (vesting period), with shares being vested proportionally over each year of the corresponding vesting periods (tranche vesting). For executive directors, shares are awarded subject to a full vesting of them at the end of three years (cliff vesting) plus a further two-year lock-up period, during which the vested shares cannot be disposed of by the directors. Shares awarded under LTSIP cannot be disposed of or otherwise encumbered up to their respective vesting dates.
The number of shares granted but unvested at 31 December 2025 and their fair value at grant date are summarised below:
LTSIP | 31 Dec 2025 | 31 Dec 2024 |
|---|---|---|
Number of shares granted but unvested at year-end | 1,679,156 | 1,717,101 |
Fair value at the grant date (in € thousand) | 9,432 | 10,546 |
The number of shares granted during the year and their fair value at grant date are presented below. The fair value was calculated using the share price on the date of acquisition of shares allocated to LTSIP.
LTSIP | 31 Dec 2025 | 31 Dec 2024 |
|---|---|---|
Number of shares granted during the year | 54,250 | 33,255 |
Fair value at the grant date (in € thousand) | 385 | 218 |
The maximum number of shares which could be offered for subscription under the Incentive Plan is 5% of the issued share capital of the Company at the end of any financial year prior to each award, provided that such number shall not exceed 30,449,745 shares. The number of shares that remained available for issue in terms of the Incentive Plan were as follows:
31 Dec 2025 | 31 Dec 2024 | |
|---|---|---|
Number of shares that remain available for issue at year-end | 25,651,774 | 26,658,837 |
The costs related to the LTSIP are measured based on the fair value of the shares at the grant date and are recognised in the Company’s financial statements over the vesting period as an increase in the investment in the subsidiaries, as the employees receiving the awards are providing services to the subsidiaries of the Company. The correspondent credit is recognised in Other reserves in the Statement of changes in equity.
In the accounts of the subsidiaries, an expense for the grant date fair value of the award is recognised over the vesting period, with the credit recognised in equity. The credit to equity is treated as a capital contribution, because the Company is compensating the subsidiaries’ employees with no recharge to the subsidiaries.
47 Trade and other payables
in € thousand | 31 Dec 2025 | 31 Dec 2024 |
|---|---|---|
Accrued administrative expenses | 5,936 | 4,794 |
VAT payable | 171 | - |
Total | 6,107 | 4,794 |
48 Administrative expenses
in € thousand | Note | 31 Dec 2025 | 31 Dec 2024 |
|---|---|---|---|
Directors' remuneration | (1,333) | (1,292) | |
Share based payment expense | (823) | (168) | |
Audit and other assurance services | (1,401) | (1,359) | |
Advisory services | (2,764) | (2,961) | |
Travel and accommodation | (647) | (608) | |
Companies' administration | (2,253) | (2,443) | |
Stock exchange expenses | (921) | (851) | |
Total | (10,142) | (9,682) |
Out of the above administrative expenses, fees related to EY, as the Company’s auditors, are summarised below. Full audit fees at Group level are disclosed in in Note 27.
31 Dec 2025 | EY Accountants B.V. | Other EY network |
|---|---|---|
in € thousand | ||
Audit of financial statements | (373) | (666) |
Other assurance procedures | (275) | (87) |
Total | (648) | (753) |
31 Dec 2024 | EY Accountants B.V. | Other EY network |
|---|---|---|
in € thousand | ||
Audit of financial statements | (390) | (548) |
Other assurance procedures | (345) | (76) |
Total | (735) | (624) |
During 2025 and 2024, the Company had twelve directors and no employees.
49 Interest and other finance income/(expense)
in € thousand | 31 Dec 2025 | 31 Dec 2024 |
|---|---|---|
Interest on Share Purchase Scheme | 27 | 67 |
Interest on bank deposits | 777 | 1,443 |
Guarantee fee income | 12,754 | 25,772 |
Finance income | 13,558 | 27,282 |
Bank charges | (30) | (24) |
Finance costs | (30) | (24) |
Total | 13,528 | 27,258 |
50 Reconciliation between company and consolidated information
In accordance with article 2:389 of Dutch Civil Code, the reconciliation of equity is as follows:
in € thousand | 31 Dec 2025 | 31 Dec 2024 |
|---|---|---|
Total Company equity | 3,424,081 | 3,679,968 |
Accumulated profit of subsidiaries | 1,582,255 | 1,228,514 |
Total consolidated Group equity | 5,006,336 | 4,908,482 |
The reconciliation of net result is presented below:
in € thousand | 31 Dec 2025 | 31 Dec 2024 |
|---|---|---|
Company net profit | 145,098 | 359,485 |
Eliminated intercompany transactions | (149,745) | (369,775) |
Results of subsidiaries, net of intercompany transactions | 503,486 | 597,855 |
Consolidated profit after tax attributable to equity holders | 498,839 | 587,565 |
51 Related party transactions
The subsidiaries and Directors are related parties for the Company.
Details of investments in subsidiaries are set out in Note 42 . Other related party transactions include guarantee fee income and strategic asset management fees charged by the Company to its indirect subsidiary, NEBV, and are detailed in Note 41.1, Note 44, and Note 49.
Fees paid to Directors, together with the performance bonus, during the current and previous year are presented below. No other payments were made to Directors by NEPI Rockcastle, except reimbursements for travel and accommodation.
31 Dec 2025 | 31 Dec 2024 | |||
|---|---|---|---|---|
in € thousand | Directors’ fees | Performance related remuneration | Directors’ fees | Performance related remuneration |
Rüdiger Dany | 70 | 110 | 70 | 107 |
Eliza Predoiu | 70 | 65 | 70 | 55 |
Marek Noetzel | 70 | 74 | 70 | 63 |
George Aase | 157 | - | 157 | - |
Antoine Dijkstra | 102 | - | 102 | - |
Andre van der Veer | 108 | - | 109 | - |
Andreas Klingen | 100 | - | 101 | - |
Steve Brown | 87 | - | 87 | - |
Andries de Lange | 78 | - | 77 | - |
Jonathan Lurie | 79 | - | 79 | - |
Ana Maria Mihaescu | 90 | - | 89 | - |
Jeanine Holscher1 | 73 | - | 56 | - |
Total | 1,084 | 249 | 1,067 | 225 |
- Ms Jeanine Holscher was appointed as an Independent non-Executive Director with effect from 14 May 2024.
Information on shares held by the Directors in the Group SPS and LTSIP is disclosed in note 36.
52 Subsequent events
This note should be read in conjunction with note 37 Subsequent events in the consolidated financial statements.
The Board proposes to add the Profit after tax to Accumulated profit. The Board has declared a dividend of 27.88 € cents per share, coresponding to a 90% dividend pay-out ratio, to be settled as capital repayment (default option). Shareholders can also elect for the settlement of the same dividend amount as an ordinary cash distribution out of distributable profits. In line with the Dutch legislation, the capital repayment will be paid to shareholders unless they elect to receive the ordinary cash distribution option.
The Directors are not aware of any other subsequent events from 31 December 2025 and up to the date of signing these financial statements which are likely to have a material effect on the financial information contained in this report.



Provisions in the Articles of Association relating to profit
Pursuant to article 26 of the Articles of Association of the Company, the Board may appropriate the profits realised during a financial year to form reserves or distribute them to shareholders, subject to applicable law. To the extent permitted by applicable law all sums standing to reserves may be applied from time to time, at the discretion of the Board, for any other purpose to which the profits of the Company may properly be applied. Pending such application, the reserves may either be employed in the business of the Company or be invested in such investments as the Board thinks fit so that it shall not be necessary to keep any investment constituting
the reserve separate or distinct from any other investment of the Company. A proposal to pay a distribution will be dealt with as a separate agenda item at the General Meeting. Distributions from the Company's distributable reserves are made pursuant to a resolution of the Board and will not require a resolution from the General Meeting. The Company's policy on reserves and dividends shall be determined and can be amended by the Board. The adoption and thereafter each amendment of the policy on reserves and dividends shall be discussed and accounted for at the General Meeting under a separate agenda item.
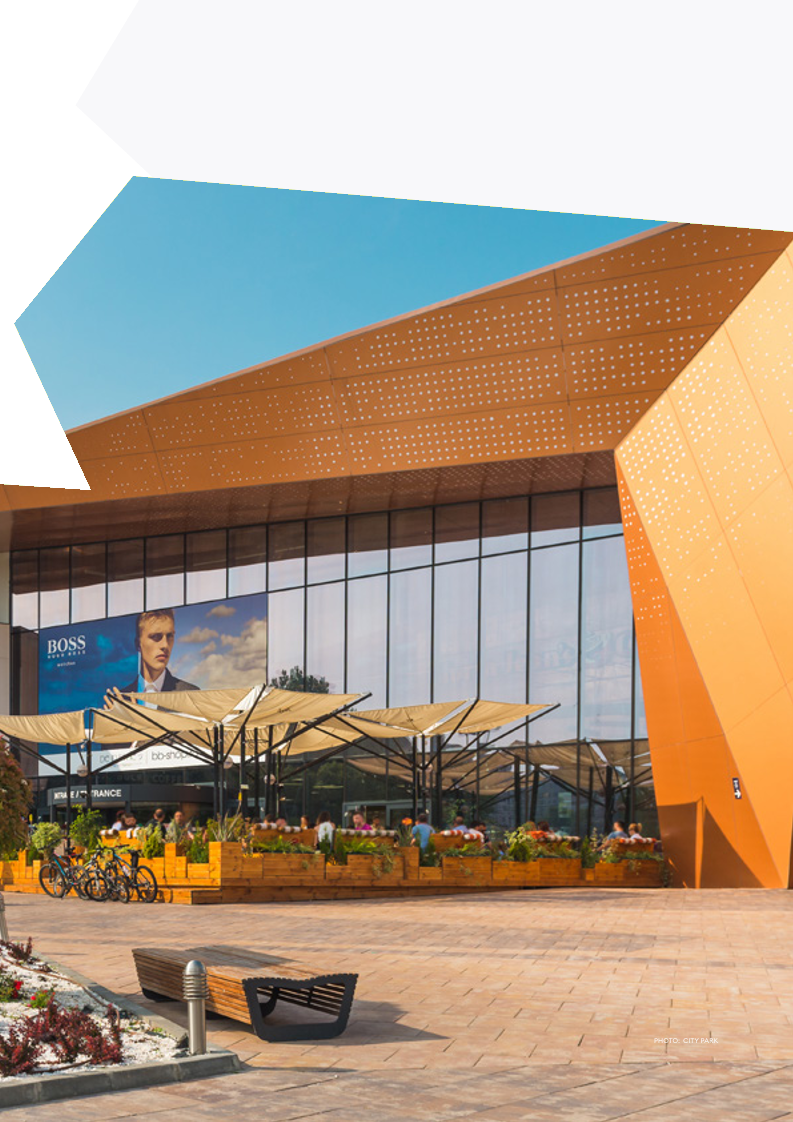
Independent Auditor's Report
To: the shareholders and board of directors of NEPI Rockcastle N.V.
Report on the audit of the financial statements 2025 included in the annual report
We have audited the accompanying financial statements for the year ended 31 December 2025 of NEPI Rockcastle N.V. based in Amsterdam, the Netherlands.
In our opinion the financial statements give a true and fair view of the financial position of NEPI Rockcastle N.V. as at 31 December 2025 and of its result and its cash flows for 2025 in accordance with IFRS Accounting Standards as adopted in the European Union (IFRS Accounting Standards) and with Part 9 of Book 2 of the Dutch Civil Code.
The financial statements comprise:
The consolidated and separate statement of financial position as at 31 December 2025
The following statements for 2025: the consolidated and separate statements of comprehensive income, changes in equity and cash flows
The notes comprising material accounting policy information and other explanatory information
We conducted our audit in accordance with Dutch law, including the Dutch Standards on Auditing. Our responsibilities under those standards are further described in the Our responsibilities for the audit of the financial statements section of our report.
We are independent of NEPI Rockcastle N.V. in accordance with the EU Regulation on specific requirements regarding statutory audit of public-interest entities, the Wet toezicht accountantsorganisaties (Wta, Audit firms supervision act), the Verordening inzake de onafhankelijkheid van accountants bij assurance-opdrachten (ViO, Code of Ethics for Professional Accountants, a regulation with respect to independence) and other relevant independence regulations in the Netherlands. Furthermore, we have complied with the Verordening gedrags- en beroepsregels accountants (VGBA, Dutch Code of Ethics for Professional Accountants).
We believe the audit evidence we have obtained is sufficient and appropriate to provide a basis for our opinion.
Information in support of our opinion
We designed our audit procedures in the context of our audit of the financial statements as a whole and in forming our opinion thereon. The following information in support of our opinion and any findings were addressed in this context, and we do not provide a separate opinion or conclusion on these matters.
NEPI Rockcastle N.V. (the company, and, together with its consolidated subsidiaries, “the group”) is a multinational owner and operator of shopping centers in Central and Eastern Europe, with presence in eight countries and an investment portfolio of € 8.2 billion. We paid specific attention in our audit to a number of areas driven by the operations of the group and our risk assessment.
We determined materiality and identified and assessed the risks of material misstatement of the financial statements, whether due to fraud or error in order to design audit procedures responsive to those risks and to obtain audit evidence that is sufficient and appropriate to provide a basis for our opinion.
Materiality | €79 million (2024: 78.5 million) |
Benchmark applied | 1.6% of total shareholders' equity as at 31 December 2025 |
Explanation | We determined materiality based on our understanding of the company's business and our perception of the financial information needs of users of the financial statements. We consider total equity an important metric for the financial position of the company. |
We have also taken into account misstatements and/or possible misstatements that in our opinion are material for the users of the financial statements for qualitative reasons.
We agreed with the audit committee of the board of directors (hereinafter: the audit committee) that misstatements in excess of €3.95 million, which are identified during the audit, would be reported to them, as well as smaller misstatements that in our view must be reported on qualitative grounds.
NEPI Rockcastle N.V. is at the head of a group of entities. Corporate activities, human resources, compliance and risk management, internal audit, financing and tax matters are centralized at group level. The financial information of this group is included in the financial statements.
We are responsible for planning and performing the group audit to obtain sufficient appropriate audit evidence regarding the financial information of the entities or business units within the group as a basis for forming an opinion on the financial statements. We are also responsible for the direction, supervision, review and evaluation of the audit work performed for purposes of the group audit. We bear the full responsibility for the auditor’s report.
Based on our understanding of the group and its environment, the applicable financial framework and the group’s system of internal control, we identified and assessed risks of material misstatement of the financial statements and the significant accounts and disclosures. Based on this risk assessment, we determined the nature, timing and extent of audit work performed, including the entities or business units within the group (components) at which to perform audit work. For this determination we considered the nature of the relevant events and conditions underlying the identified risks of material misstatements for the financial statements, the association of these risks to components and the materiality or financial size of the components relative to the group.
We have worked closely together with our regional component team in Romania, in performing audit work in respect of valuation of investment property in use and our audit approach related to fraud risks and non-compliance with laws and regulations; and in directing, supervising, reviewing or coordinating the work of component teams. We communicated the audit work to be performed and identified risks through instructions for component auditors as well as requesting component auditors to communicate matters related to the financial information of the component that is relevant to identifying and assessing risks.
This resulted in a coverage of 100% of the group’s investment property, 95% of gross rental income, and 100% of total shareholders’ equity (Net Asset Value).
For other components, we performed analytical procedures to corroborate that our risk assessment and scoping remained appropriate throughout the audit.
We performed site visits to meet with management and our regional component team in Romania, observe the operations, discuss the group risk assessment and the risks of material misstatements. We reviewed and evaluated the adequacy of the deliverables from our regional component team and reviewed key working papers to address the risks of material misstatement. We held planning meetings, key meetings required based on circumstances and we attended the closing meeting with management and the regional component team in Romania. During these meetings and calls, amongst others, the planning, procedures performed based on risk assessments, findings and observations were discussed and any further work deemed necessary by the primary or regional component team was then performed.
By performing the audit work mentioned above at the entities or business units within the group, together with additional work at group level, we have been able to obtain sufficient and appropriate audit evidence about the group’s financial information to provide an opinion on the financial statements.
We ensured that the audit teams both at group and at component levels included the appropriate skills and competences which are needed for the audit of a listed client in the real estate industry. We included specialists in the areas of IT audit, forensics and income tax and have made use of our own real estate valuation experts in the various countries of operations.
Climate change and the energy transition are high on the public agenda. Issues such as CO2 reduction impact financial reporting, as these issues entail risks for the business operation, the valuation of assets and provisions or the sustainability of the business model and access to financial markets of companies with a larger CO2 footprint.
The board of directors summarized the company’s commitments and obligations, and reported in the sustainability section of the annual report how the company is addressing climate-related and environmental risks.
As part of our audit of the financial statements, we evaluated the extent to which climate-related risks and the possible effects of the energy transition are taken into account in estimates and significant assumptions, including the valuation of investment property, as well as in the design of relevant internal control measures. Furthermore, we read the annual report and considered whether there is any material inconsistency between the non-financial information and the financial statements.
Based on the audit procedures performed, we do not deem climate-related risks to have a material impact on the financial reporting judgments, estimates or significant assumptions as at 31 December 2025. As such, climate-related risks are not part of our key audit matter on the valuation of investment property in use.
Our responsibility
Although we are not responsible for preventing fraud or non-compliance and we cannot be expected to detect non-compliance with all laws and regulations, it is our responsibility to obtain reasonable assurance that the financial statements, taken as a whole, are free from material misstatement, whether caused by fraud or error. The risk of not detecting a material misstatement resulting from fraud is higher than for one resulting from error, as fraud may involve collusion, forgery, intentional omissions, misrepresentations, or the override of internal control.
Our audit response related to fraud risks
We identified and assessed the risks of material misstatements of the financial statements due to fraud. During our audit we obtained an understanding of the company and its environment and the components of the system of internal control, including the risk assessment process and the board of directors’ process for responding to the risks of fraud and monitoring the system of internal control, as well as the outcomes. We refer to the risk management and compliance section of the annual report for the board of directors’ (fraud) risk assessment.
We evaluated the design and relevant aspects of the system of internal control and in particular the fraud risk assessment, as well as the code of ethics, whistleblowing policy and incident registration. We evaluated the design and the implementation of internal controls designed to mitigate fraud risks.
As part of our process of identifying fraud risks, we evaluated fraud risk factors with respect to financial reporting fraud, misappropriation of assets and bribery and corruption, in close co-operation with our forensic specialists. We evaluated whether these factors indicate that a risk of material misstatement due to fraud is present.
We incorporated elements of unpredictability in our audit. We also considered the outcome of our other audit procedures and evaluated whether any findings were indicative of fraud or non-compliance.
We addressed the risks related to management override of controls, as this risk is present in all organizations. For these risks we have, among other things, performed procedures to evaluate whether the selection and application of accounting policies by the company, particularly those relating to subjective measurements and complex transactions, as disclosed in Note 4 ‘Significant accounting estimates and judgments in applying accounting policies’ to the consolidated financial statements, may be indicative to fraudulent financial reporting. We have also used data analysis to identify and address high-risk journal entries and other adjustments made in the consolidation and financial reporting process. We evaluated the business rationale (or the lack thereof) of significant extraordinary transactions, including those with related parties.
When identifying and assessing fraud risks we presumed that there are risks of fraud in revenue recognition from investment properties. We considered the risk of recognition of gross rental income, including lease incentives and indexations, in the incorrect period. We designed and performed our audit procedures relating to revenue recognition responsive to this presumed fraud risk. These procedures included use of correlation related data analytics, reconciliation of rent rolls to reported revenue, and analysis of underlying lease agreements for terms and conditions that would have an impact on revenue recognition.
We considered available information and made enquiries of relevant executives, directors, internal audit, legal, compliance, human resources and regional directors and the board of directors.
The fraud risks we identified, enquiries and other available information did not lead to specific indications for fraud or suspected fraud potentially materially impacting the view of the financial statements.
Our audit response related to risks of non-compliance with laws and regulations
As disclosed in Note 35 Contingent assets and liabilities to the consolidated financial statements, the group operates in a complex legal and regulatory environment, exposing it to various risks that could have a material effect on the financial statements. Moreover, the Group is subject to various taxes across all jurisdictions in which it operates and determining tax charges and provisions involves a degree of estimation and judgment.
We performed appropriate audit procedures regarding compliance with the provisions of those laws and regulations that have a direct effect on the determination of material amounts and disclosures in the financial statements. Furthermore, we assessed factors related to the risks of non-compliance with laws and regulations that could reasonably be expected to have a material effect on the financial statements from our general industry experience, through discussions with the board of directors, reading minutes, inspection of internal audit and compliance reports, and performing substantive tests of details of classes of transactions, account balances or disclosures.
We also inspected lawyers’ letters and correspondence with regulatory authorities and remained alert to any indication of (suspected) non-compliance throughout the audit. Finally, we obtained written representations that all known instances of non-compliance with laws and regulations have been disclosed to us.
As disclosed in section Basis of Preparation in Note 2 to the consolidated financial statements, the financial statements have been prepared on a going concern basis. When preparing the financial statements, the board of directors made a specific assessment of the company’s ability to continue as a going concern and to continue its operations for the foreseeable future.
We discussed and evaluated the specific assessment with the board of directors exercising professional judgment and maintaining professional skepticism. We considered whether the board of directors’ going concern assessment, based on our knowledge and understanding obtained through our audit of the financial statements or otherwise, contains all relevant events or conditions that may cast significant doubt on the company’s ability to continue as a going concern. If we conclude that a material uncertainty exists, we are required to draw attention in our auditor’s report to the related disclosures in the financial statements or, if such disclosures are inadequate, to modify our opinion.
Based on our procedures performed, we did not identify material uncertainties about going concern or the board of directors’ use of the going concern basis of accounting. Our conclusions are based on the audit evidence obtained up to the date of our auditor’s report. However, future events or conditions may cause a company to cease to continue as a going concern.
Key audit matters are those matters that, in our professional judgment, were of most significance in our audit of the financial statements. We have communicated the key audit matter to the board of directors. The key audit matter is not a comprehensive reflection of all matters discussed.
In comparison with previous year, the nature of our key audit matter did not change.
Valuation of investment property in use | |
|---|---|
Risk | The investment property in use of NEPI Rockcastle N.V. consists of income-generating assets located in Central and Eastern Europe. The value of investment property in use is €7,9 billion (2024: €7.7 billion), representing 89% (2024: 88%) of the Group’s total assets as at 31 December 2025. The portfolio is predominantly made up of retail properties (shopping malls and street retail centres). As detailed in the 'Valuation of Investment Property' section of Note 4 and Note 8 (titled ‘Investment Property in Use’) in the consolidated financial statements, the fair value of the investment properties in use is determined by external appraisers selected by management, based on the discounted cash flow (DCF) method. This DCF method is based on various assumptions relating to the properties, including the estimated market rental value, discount rates and capitalization rates for terminal value. The evaluation of the fair value of investment property in use remains a key audit matter, as the valuation of this portfolio is inherently subjective and complex in nature. Several factors influence this, including the unique characteristics of each property, its location, and the expected future rental income associated with that property. Additionally, uncertainty regarding the broader macroeconomic and geopolitical landscape has contributed to the subjectivity of the assumptions used in valuing these investment properties. A high degree of judgment is required in determining the fair value of investment property in use. Determining the fair value of these properties necessitates specialized expertise and involves substantial judgment regarding the assumptions incorporated into the valuation process. |
Our audit approach | Our audit procedures included, among others, the following:
|
Key observations | Based on our procedures performed, we consider the valuation of investment property in use reasonable in accordance with generally accepted property valuation practices in the real estate market and compliant with IFRS Accounting Standards. |
Report on other information included in the annual report
The annual report contains other information in addition to the financial statements and our auditor’s report thereon.
Based on the following procedures performed, we conclude that the other information:
Is consistent with the financial statements and does not contain material misstatements
Contains the information as required by Part 9 of Book 2 of the Dutch Civil Code for the management report (excluding the sustainability statement) and the other information as required by Part 9 of Book 2 of the Dutch Civil Code and as required by Sections 2:135b and 2:145 sub‑section 2 of the Dutch Civil Code for the remuneration report.
We have read the other information. Based on our knowledge and understanding obtained through our audit of the financial statements or otherwise, we have considered whether the other information contains material misstatements.
By performing these procedures, we comply with the requirements of Part 9 of Book 2 and Section 2:135b sub-Section 7 of the Dutch Civil Code and the Dutch Standard 720. The scope of the procedures performed is substantially less than the scope of those performed in our audit of the financial statements.
The board of directors is responsible for the preparation of the other information, including the management report in accordance with Part 9 of Book 2 of the Dutch Civil Code and other information required by Part 9 of Book 2 of the Dutch Civil Code. The board of directors is responsible for ensuring that the remuneration report is drawn up and published in accordance with Sections 2:135b and 2:145 sub‑section 2 of the Dutch Civil Code.
Description of responsibilities regarding the financial statements
The board of directors is responsible for the preparation and fair presentation of the financial statements in accordance with IFRS Accounting Standards and Part 9 of Book 2 of the Dutch Civil Code. Furthermore, the board of directors is responsible for such internal control as the board of directors determines is necessary to enable the preparation of the financial statements that are free from material misstatement, whether due to fraud or error.
As part of the preparation of the financial statements, the board of directors is responsible for assessing the company’s ability to continue as a going concern. Based on the financial reporting framework mentioned, the board of directors should prepare the financial statements using the going concern basis of accounting unless the board of directors either intends to liquidate the company or to cease operations, or has no realistic alternative but to do so. The board of directors should disclose events and circumstances that may cast significant doubt on the company’s ability to continue as a going concern in the financial statements.
The audit committee assists the board of directors in fulfilling its responsibilities for overseeing the company’s financial reporting process.
Our objective is to plan and perform the audit engagement in a manner that allows us to obtain sufficient and appropriate audit evidence for our opinion.
Our audit has been performed with a high, but not absolute, level of assurance, which means we may not detect all material misstatements, whether due to fraud or error during our audit.
Misstatements can arise from fraud or error and are considered material if, individually or in the aggregate, they could reasonably be expected to influence the economic decisions of users taken on the basis of these financial statements. The materiality affects the nature, timing and extent of our audit procedures and the evaluation of the effect of identified misstatements on our opinion.
We have exercised professional judgment and have maintained professional skepticism throughout the audit, in accordance with Dutch Standards on Auditing, ethical requirements and independence requirements. The Information in support of our opinion section above includes an informative summary of our responsibilities and the work performed as the basis for our opinion.
Our audit further included among others:
Performing audit procedures responsive to the risks identified, and obtaining audit evidence that is sufficient and appropriate to provide a basis for our opinion
Obtaining an understanding of internal control relevant to the audit in order to design audit procedures that are appropriate in the circumstances, but not for the purpose of expressing an opinion on the effectiveness of the company’s internal control
Evaluating the appropriateness of accounting policies used and the reasonableness of accounting estimates and related disclosures made by the board of directors
Evaluating the overall presentation, structure and content of the financial statements, including the disclosures
Evaluating whether the financial statements represent the underlying transactions and events in a manner that achieves fair presentation
We communicate with the audit committee and the board of directors regarding, among other matters, the planned scope and timing of the audit and significant audit findings, including any significant findings in internal control that we identify during our audit.
In this respect we also submit an additional report to the audit committee in accordance with Article 11 of the EU Regulation on specific requirements regarding statutory audit of public-interest entities. The information included in this additional report is consistent with our audit opinion in this auditor’s report.
We provide the audit committee with a statement that we have complied with relevant ethical requirements regarding independence, and to communicate with them all relationships and other matters that may reasonably be thought to bear on our independence, and where applicable, related safeguards.
From the matters communicated with the board of directors, we determine the key audit matters: those matters that were of most significance in the audit of the financial statements. We describe these matters in our auditor’s report unless law or regulation precludes public disclosure about the matter or when, in extremely rare circumstances, not communicating the matter is in the public interest.
Report on other legal and regulatory requirements and ESEF
We were appointed by the general meeting as auditor of NEPI Rockcastle N.V. on 30 June 2022, as of the audit for the year 2022 and have operated as statutory auditor ever since that date.
We have not provided prohibited non-audit services as referred to in Article 5(1) of the EU Regulation on specific requirements regarding statutory audit of public-interest entities.
NEPI Rockcastle N.V. has prepared the annual report in ESEF. The requirements for this are set out in the Delegated Regulation (EU) 2019/815 with regard to regulatory technical standards on the specification of a single electronic reporting format (hereinafter: the RTS on ESEF).
In our opinion the annual report prepared in the XHTML format, including the (partially) marked-up consolidated financial statements as included in the reporting package by NEPI Rockcastle N.V., complies in all material respects with the RTS on ESEF.
The board of directors is responsible for preparing the annual report, including the financial statements, in accordance with the RTS on ESEF, whereby the board of directors combines the various components into a single reporting package.
Our responsibility is to obtain reasonable assurance for our opinion whether the annual report in this reporting package complies with the RTS on ESEF.
We performed our examination in accordance with Dutch law, including Dutch Standard 3950N, ”Assurance-opdrachten inzake het voldoen aan de criteria voor het opstellen van een digitaal verantwoordingsdocument” (assurance engagements relating to compliance with criteria for digital reporting). Our examination included amongst others:
Obtaining an understanding of the company’s financial reporting process, including the preparation of the reporting package
Identifying and assessing the risks that the annual report does not comply in all material respects with the RTS on ESEF and designing and performing further assurance procedures responsive to those risks to provide a basis for our opinion, including:
Obtaining the reporting package and performing validations to determine whether the reporting package containing the Inline XBRL instance document and the XBRL extension taxonomy files, has been prepared in accordance with the technical specifications as included in the RTS on ESEF
Examining the information related to the consolidated financial statements in the reporting package to determine whether all required mark-ups have been applied and whether these are in accordance with the RTS on ESEF.
Utrecht, 18 March 2026
EY Accountants B.V.
Signed by M.J. Noordhoff
Limited assurance report of the independent auditor on the sustainability statement
To: the shareholders and the board of directors of NEPI Rockcastle N.V.
Our conclusion
We have performed a limited assurance engagement on the consolidated sustainability statement for 2025 of NEPI Rockcastle N.V. based in Amsterdam (hereinafter: the company) in the sustainability chapter of the accompanying management report including the information incorporated in the sustainability statement by reference (hereinafter: the sustainability statement).
Based on our procedures performed and the evidence obtained, nothing has come to our attention that causes us to believe that the sustainability statement is not, in all material respects:
prepared in accordance with the European Sustainability Reporting Standards (ESRS) as adopted by the European Commission and compliant with the double materiality assessment process carried out by the company to identify the information reported pursuant to the ESRS; and
compliant with the reporting requirements provided for in Article 8 of Regulation (EU) 2020/852 (Taxonomy Regulation).
Our conclusion has been formed on the basis of the matters outlined in this limited assurance report.
Basis for our conclusion
We have performed our limited assurance engagement on the sustainability statement in accordance with Dutch law, including Dutch Standard 3810N, “Assurance-opdrachten inzake duurzaamheidsverslaggeving” (Assurance engagements relating to sustainability reporting), which is a specified Dutch standard that is based on the International Standard on Assurance Engagements (ISAE) 3000 (Revised), “Assurance engagements other than audits or reviews of historical financial information”.
Our assurance engagement was aimed to obtain a limited level of assurance that the sustainability statement is free from material misstatements. The procedures vary in nature and timing from, and are less in extent, than for a reasonable assurance engagement. Consequently, the level of assurance obtained in a limited assurance engagement is substantially lower than the assurance that would have been obtained had a reasonable assurance engagement been performed.
Our responsibilities in this regard are further described in the section ‘Our responsibilities for the limited assurance engagement on the sustainability statement’ of our report.
We are independent of NEPI Rockcastle N.V. in accordance with the Verordening inzake de onafhankelijkheid van accountants bij assurance-opdrachten (ViO, Code of Ethics for Professional Accountants, a regulation with respect to independence) and other relevant independence regulations in the Netherlands. This includes that we do not perform any activities that could result in a conflict of interest with our independent assurance engagement and we are not involved in the preparation of the sustainability statement, as doing so may compromise our independence. Furthermore, we have complied with the Verordening gedrags- en beroepsregels accountants (VGBA, Dutch Code of Ethics for Professional Accountants). The ViO and VGBA are at least as demanding as the International code of ethics for professional accountants (including International independence standards) of the International Ethics Standards Board for Accountants (the IESBA Code) as relevant to limited assurance engagements on sustainability statements of public interest entities in the European Union.
We believe that the assurance evidence we have obtained is sufficient and appropriate to provide a basis for our conclusion.
Inherent limitations associated with measurement or evaluation of sustainability information
Section BP-2 – Disclosures in relation to specific circumstances in the sustainability statement identifies the quantitative metrics and monetary amounts that are subject to a high level of measurement uncertainty and discloses information about the sources of measurement uncertainty and the assumptions, approximations and judgements the company has made in measuring these in compliance with the ESRS.
The sustainability statement may not include every impact, risk and opportunity or additional entity-specific disclosure that each individual stakeholder (group) may consider important in its own particular assessment.
In reporting forward-looking information in accordance with the ESRS, management describes the underlying assumptions and methods of producing the information, as well as other factors that provide evidence that it reflects the actual plans or decisions made by the company (actions). Forward-looking information relates to events and actions that have not yet occurred and may never occur. The actual outcome is likely to be different since anticipated events frequently do not occur as expected.
Responsibilities of management and the board of directors for the sustainability statement
Management is responsible for the preparation of the sustainability statement in accordance with the ESRS, including the double materiality assessment process carried out by the company as the basis for the sustainability statement and disclosure of material impacts, risks and opportunities in accordance with the ESRS. As part of the preparation of the sustainability statement, management is responsible for compliance with the reporting requirements provided for in Article 8 of Regulation (EU) 2020/852 (Taxonomy Regulation).
Furthermore, management is responsible for such internal control as it determines is necessary to enable the preparation of the sustainability statement that is free from material misstatement, whether due to fraud or error.
The board of directors is responsible for overseeing the sustainability reporting process including the double materiality assessment process carried out by the company.
Our responsibilities for the limited assurance engagement on the sustainability statement
Our responsibility is to plan and perform the limited assurance engagement in a manner that allows us to obtain sufficient and appropriate assurance evidence for our conclusion.
We apply the applicable quality management requirements pursuant to the Nadere voorschriften kwaliteitsmanagement (NVKM, regulations for quality management) and the International Standard on Quality Management (ISQM) 1, and accordingly maintain a comprehensive system of quality management including documented policies and procedures regarding compliance with ethical requirements, professional standards and other relevant legal and regulatory requirements.
Our limited assurance engagement included amongst others:
Performing inquiries and an analysis of the external environment and obtaining an understanding of relevant sustainability themes and issues, the characteristics of the company, its activities and the value chain and its key intangible resources in order to assess the double materiality assessment process carried out by the company as the basis for the sustainability statement and disclosure of all material sustainability-related impacts, risks and opportunities in accordance with the ESRS
Obtaining through inquiries a general understanding of the internal control environment, the company’s processes for gathering and reporting entity-related and value chain information, the information systems and the company’s risk assessment process relevant to the preparation of the sustainability statement and for identifying the company’s activities, determining eligible and aligned economic activities and prepare the disclosures provided for in Article 8 of Regulation (EU) 2020/852 (Taxonomy Regulation), without obtaining assurance information about the implementation or testing the operating effectiveness of controls
Assessing the double materiality assessment process carried out by the company and identifying and assessing areas of the sustainability statement, including the disclosures provided for in Article 8 of Regulation (EU) 2020/852 (Taxonomy Regulation), where misleading or unbalanced information or material misstatements, whether due to fraud or error, are likely to arise (‘selected disclosures’). Designing and performing further assurance procedures aimed at assessing that the sustainability statement is free from material misstatements responsive to this risk analysis
Considering whether the description of the double materiality assessment process in the sustainability statement made by management appears consistent with the process carried out by the company
Performing analytical review procedures on quantitative information in the sustainability statement, including consideration of data and trends
Assessing whether the company’s methods for developing estimates are appropriate and have been consistently applied for selected disclosures. We considered data and trends, however our procedures did not include testing the data on which the estimates are based or separately developing our own estimates against which to evaluate management’s estimates
Analyzing, on a limited sample basis, relevant internal and external documentation available to the company (including publicly available information or information from actors throughout its value chain) for selected disclosures
Reading the other information in the annual report to identify material inconsistencies, if any, with the sustainability statement
Considering whether the disclosures provided to address the reporting requirements provided for in Article 8 of Regulation (EU) 2020/852 (Taxonomy Regulation) for each of the environmental objectives, reconcile with the underlying records of the company and are consistent or coherent with the sustainability statement, appear reasonable, in particular whether the eligible economic activities meet the cumulative conditions to qualify as aligned and whether the technical screening criteria are met, and whether the key performance indicators disclosures have been defined and calculated in accordance with the Taxonomy delegated acts, and comply with the reporting requirements provided for in Article 8 of Regulation (EU) 2020/852 (Taxonomy Regulation), including the format in which the activities are presented
Considering the overall presentation, structure and fundamental qualitative characteristics of information (relevance and faithful representation: complete, neutral and accurate) reported in the sustainability statement, including the reporting requirements provided for in Article 8 of Regulation (EU) 2020/852 (Taxonomy Regulation)
Considering, based on our limited assurance procedures and evaluation of the evidence obtained, whether the sustainability statement as a whole, is free from material misstatements and prepared in accordance with the ESRS.
We communicate with the board of directors regarding, among other matters, the planned scope and timing of the assurance engagement and significant findings that we identify during our assurance engagement.
Utrecht, 18 March 2026
EY Accountants B.V.
Signed by M.J. Noordhoff

Independent Auditor’s Report
To the Shareholders of NEPI Rockcastle N.V.
Report on the Audit of the Consolidated and Separate Financial Statements
Opinion
We have audited the consolidated and separate financial statements of NEPI Rockcastle N.V. (‘’the Company’') and its subsidiaries (‘the Group’) set out on pages 310 to 376, which comprise of the consolidated and separate statements of financial position as at 31 December 2025, and the consolidated and separate statements of comprehensive income, the consolidated and separate statements of changes in equity and the consolidated and separate statements of cash flows for the year then ended, and notes to the consolidated and separate financial statements, including material accounting policy information.
In our opinion, the consolidated and separate financial statements present fairly, in all material respects, the consolidated and separate financial position of the Group and Company as at 31 December 2025, and its consolidated and separate financial performance and consolidated and separate cash flows for the year then ended, in accordance with IFRS Accounting Standards as issued by the International Accounting Standards Board.
Basis for Opinion
We conducted our audit in accordance with International Standards on Auditing (ISAs). Our responsibilities under those standards are further described in the Auditor’s Responsibilities for the Audit of the Consolidated and Separate Financial Statements section of our report. We are independent of the Group and Company in accordance with the Independent Regulatory Board for Auditors’ Code of Professional Conduct for Registered Auditors (IRBA Code) as applicable to audits of financial statements of public interest entities, and other independence requirements applicable to performing audits of financial statements of the Group and Company and in South Africa. We have fulfilled our other ethical responsibilities in accordance with the IRBA Code and in accordance with other ethical requirements applicable to performing audits of the Group and Company and in South Africa. The IRBA Code is consistent with the corresponding sections of the International Ethics Standards Board for Accountants’ International Code of Ethics for Professional Accountants (including International Independence Standards). We believe that the audit evidence we have obtained is sufficient and appropriate to provide a basis for our opinion.
In terms of the IRBA Rule on Enhanced Auditor Reporting for the Audit of Financial Statements of Public Interest Entities, published in Government Gazette Number 49309 dated 15 September 2023 (EAR Rule) we report:
Final Materiality
The ISAs recognise that:
misstatements, including omissions, are considered to be material if the misstatements, individually or in the aggregate, could reasonably be expected to influence the economic decisions of users taken on the basis of the financial statements.
judgments about materiality are made in light of surrounding circumstances, and are affected by the size or nature of a misstatement, or a combination of both; and
judgments about matters that are material to users of the financial statements consider users as a Group rather than as specific individual users, whose needs may vary greatly.
The amount we set as materiality represents a quantitative threshold used to evaluate the effect of misstatements to the financial statements as a whole based on our professional judgment. Qualitative factors are also considered in making final determinations regarding what is material to the financial statements.
Group | Company | |
|---|---|---|
Overall materiality | We determined final materiality for the Group to be EUR 79 000 000, which is based on 1.6% of total shareholders’ equity (Net Asset Value). | We determined final materiality for the standalone Company to be EUR 61 630 000, which is based 1.8% of total shareholders’ equity (Net Asset Value). |
Rationale for benchmark applied | We have identified that a capital-based measure, being total shareholders’ equity (Net Asset Value), as the most appropriate basis for both Group and the standalone company, because in our view, it is a prominent metric utilised by users of the financial statements to evaluate the financial reporting of the Group and Company. This is consistent with our understanding of the Group and Company’s business, industry within which it operates, and our assessment of financial information provided by the Group and Company. | |
Group Audit Scope
Our assessment of audit risk, our evaluation of materiality and our allocation of performance materiality determine our audit scope for each component within the Group. Taken together, this enables us to form an opinion on the consolidated financial statements. We take into account the size and risk profile of the components in the Group. In addition, we further consider the organisation of the Group and effectiveness of Group wide controls, changes in the business environment, and other factors such as our experience in prior years and recent internal audit results when assessing the level of work to be performed at each component of the Group. Our process focuses on identifying and assessing the risk of material misstatements of the Group financial statements as a whole including, with respect to the consolidation process.
In establishing our overall approach to the Group audit, we determined the type of work that needed to be undertaken at each of the components by us, as the primary audit engagement team, or by component auditors under our instruction.
In selecting components, we perform risk assessment activities across the Group and its components to identify risks of material misstatement. We then identify how the nature and size of the account balances at the components contribute to those risks and thus determine which account balances require an audit response. We then consider for each component the degree of risk identified (whether pervasive or not) and the number of accounts requiring audit responses to assign either a full or specific scope (including specified procedures) to each component. We involved component auditors in this risk assessment process.
In our assessment of the residual account balances not covered by the audit procedures, we considered whether these could give rise to a risk of material misstatement of the Group financial statements. This assessment included performing overall analytical procedures at Group level.
Of the 63 components selected, we identified:
26 components (“full scope components”) which were selected based on the pervasiveness of risk in those components and for which we therefore performed procedures on what we considered to be the entire financial information of the component.
37 components (“specific scope or specified procedure components”) where our procedures were more focussed or limited to specific accounts which we considered had the potential for the greatest impact on the significant accounts in the financial statements given the specific risks identified.
Key Audit Matters
Key audit matters are those matters that, in our professional judgement, were of most significance in our audit of the consolidated and separate financial statements of the current period. These matters were addressed in the context of our audit of the consolidated and separate financial statements as a whole, and in forming our opinion thereon, and we do not provide a separate opinion on these matters. For each matter below, our description of how our audit addressed the matter is provided in that context.
We have fulfilled the responsibilities described in the Auditor’s Responsibilities for the Audit of the Consolidated and Separate Financial Statements section of our report, including in relation to these matters. Accordingly, our audit included the performance of procedures designed to respond to our assessment of the risks of material misstatement of the consolidated and separate financial statements. The results of our audit procedures, including the procedures performed to address the matters below, provide the basis for our audit opinion on the accompanying consolidated and separate financial statements.
In terms of the EAR Rule, we are required to report the outcome of audit procedures or key observations with respect to the key audit matter and this is included below.
The key audit matter applies to the audit of the consolidated financial statements.
Key audit matter description | How the matter was addressed in the audit |
|---|---|
Valuation of investment property in use | |
The investment property in use of NEPI Rockcastle N.V. consists of income-generating assets located in Central and Eastern Europe. The value of investment property in use is €7.9 billion (2024: €7.7 billion), representing 89% (2024: 88%) of the Group’s total assets as at 31 December 2025. The portfolio is predominantly made up of retail properties (shopping malls and street retail centres). As detailed in the 'Valuation of Investment Property' section of Note 4 and Note 8 (titled ‘Investment Property in Use’) in the consolidated financial statements, the fair value of the investment properties in use is determined by external appraisers selected by management, based on the discounted cash flow (DCF) method. This DCF method is based on various assumptions relating to the properties, including the estimated market rental value, discount rates and capitalization rates for terminal value. The evaluation of the fair value of investment property in use remains a key audit matter, as the valuation of this portfolio is inherently subjective and complex in nature. Several factors influence this, including the unique characteristics of each property, its location, and the expected future rental income associated with that property. Additionally, uncertainty regarding the broader macroeconomic and geopolitical landscape has contributed to the subjectivity of the assumptions used in valuing these investment properties. A high degree of judgment is required in determining the fair value of investment property in use. | Our audit procedures included, among others, the following:
|
Key Observations Based on our procedures performed, we consider the valuation of investment property in use reasonable in accordance with generally accepted property valuation practices in the real estate market and compliant with IFRS Accounting Standards | |
Other Information
The directors are responsible for the other information. The other information comprises the information included in the 403-page document titled “NEPI Rockcastle 2025 Annual Report - Integrated report and financial statements”, which includes the Statement of Directors’ responsibilities. The other information does not include the consolidated or the separate financial statements and our auditor’s report thereon.
Our opinion on the consolidated and separate financial statements does not cover the other information and we do not express an audit opinion or any form of assurance conclusion thereon.
In connection with our audit of the consolidated and separate financial statements, our responsibility is to read the other information and, in doing so, consider whether the other information is materially inconsistent with the consolidated and separate financial statements or our knowledge obtained in the audit, or otherwise appears to be materially misstated. If, based on the work we have performed, we conclude that there is a material misstatement of this other information, we are required to report that fact. We have nothing to report in this regard.
Responsibilities of the Directors for the Consolidated and Separate Financial Statements
The directors are responsible for the preparation and fair presentation of the consolidated and separate financial statements, in accordance with IFRS Accounting Standards as issued by the International Accounting Standards Board, and for such internal control as the directors determine is necessary to enable the preparation of consolidated and separate financial statements that are free from material misstatement, whether due to fraud or error.
In preparing the consolidated and separate financial statements, the directors are responsible for assessing the Group and Company’s ability to continue as a going concern, disclosing, as applicable, matters related to going concern and using the going concern basis of accounting unless the directors either intend to liquidate the Group and Company or to cease operations, or have no realistic alternative but to do so.
Auditor’s Responsibilities for the Audit of the Consolidated and Separate Financial Statements
Our objectives are to obtain reasonable assurance about whether the consolidated and separate financial statements as a whole are free from material misstatement, whether due to fraud or error, and to issue an auditor’s report that includes our opinion. Reasonable assurance is a high level of assurance, but is not a guarantee that an audit conducted in accordance with ISAs will always detect a material misstatement when it exists. Misstatements can arise from fraud or error and are considered material if, individually or in the aggregate, they could reasonably be expected to influence the economic decisions of users taken on the basis of these consolidated and separate financial statements.
As part of an audit in accordance with ISAs, we exercise professional judgement and maintain professional scepticism throughout the audit. We also:
Identify and assess the risks of material misstatement of the consolidated and separate financial statements, whether due to fraud or error, design and perform audit procedures responsive to those risks, and obtain audit evidence that is sufficient and appropriate to provide a basis for our opinion. The risk of not detecting a material misstatement resulting from fraud is higher than for one resulting from error, as fraud may involve collusion, forgery, intentional omissions, misrepresentations, or the override of internal control.
Obtain an understanding of internal control relevant to the audit in order to design audit procedures that are appropriate in the circumstances, but not for the purpose of expressing an opinion on the effectiveness of the Group and Company’s internal control.
Evaluate the appropriateness of accounting policies used and the reasonableness of accounting estimates and related disclosures made by the directors.
Conclude on the appropriateness of the directors’ use of the going concern basis of accounting and based on the audit evidence obtained, whether a material uncertainty exists related to events or conditions that may cast significant doubt on the Group and Company’s ability to continue as a going concern. If we conclude that a material uncertainty exists, we are required to draw attention in our auditor’s report to the related disclosures in the consolidated and separate financial statements or, if such disclosures are inadequate, to modify our opinion. Our conclusions are based on the audit evidence obtained up to the date of our auditor’s report. However, future events or conditions may cause the Group and/or the Company to cease to continue as a going concern.
Evaluate the overall presentation, structure and content of the consolidated and separate financial statements, including the disclosures, and whether the consolidated and separate financial statements represent the underlying transactions and events in a manner that achieves fair presentation.
Plan and perform the Group audit to obtain sufficient appropriate audit evidence regarding the financial information of the entities or business units within the Group as a basis for forming an opinion on the consolidated and separate financial statements. We are responsible for the direction, supervision and review of the audit work performed for the purposes of the Group audit. We remain solely responsible for our audit opinion.
We communicate with the directors regarding, among other matters, the planned scope and timing of the audit and significant audit findings, including any significant deficiencies in internal control that we identify during our audit.
We also provide the directors with a statement that we have complied with relevant ethical requirements regarding independence, and to communicate with them all relationships and other matters that may reasonably be thought to bear on our independence, and where applicable, actions taken to eliminate threats or safeguards applied.
From the matters communicated with the directors, we determine those matters that were of most significance in the audit of the consolidated and separate financial statements of the current period and are therefore the key audit matters. We describe these matters in our auditor’s report unless law or regulation precludes public disclosure about the matter or when, in extremely rare circumstances, we determine that a matter should not be communicated in our report because the adverse consequences of doing so would reasonably be expected to outweigh the public interest benefits of such communication.
Report on Other Legal and Regulatory Requirements
In terms of the IRBA Rule published in Government Gazette Number 39475 dated 4 December 2015, we report that Ernst & Young Inc. has been the auditor of NEPI Rockcastle N.V. for four years.
Ernst & Young Inc.
Director – Gerhardus J van Deventer CA(SA)
Registered Auditor
18 March 2026
102 Rivonia Road
Sandton
South Africa
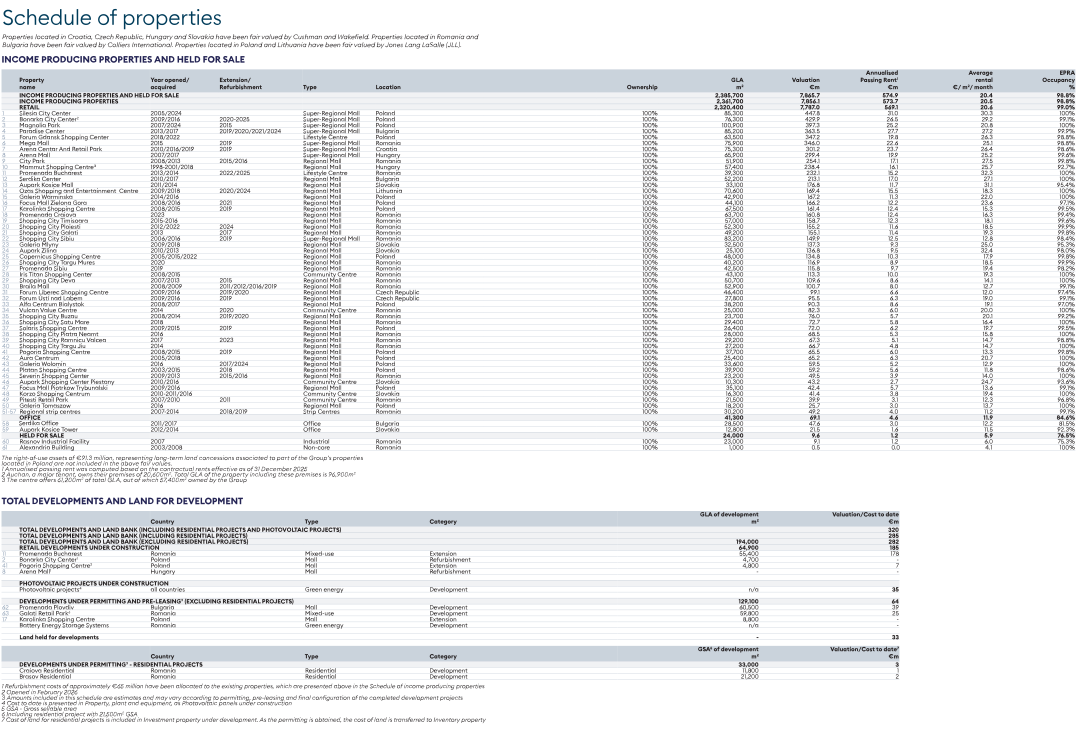
Glossary
Collection rate: operational performance indicator computed as cash collected relative to the Gross rental income and Service charge income as recognised in the Consolidated Financial Statements (adjusted for accruals and concessions granted in the year)
Committed projects: projects currently under construction, for which the Group owns the land or building rights and has obtained all necessary authorisations and permits
Like-for-like: operational measure computed based on the investment property excluding acquisitions, divestments, transfers to and from investment property under development and all other changes resulting in significant change to the square meters of a property
Loan-to-value (LTV): (Interest bearing debt – Lease liabilities associated to right-of-use assets – Cash)/(Investment property (including investment property held for sale and Property, plant and equipment - Photovoltaic installations in use and under construction) – Right-of-use assets)
Occupancy cost ratio (Effort ratio): Annual Base rent, overage rent, service charge and marketing contribution, divided by tenant sales; excludes sales reported by hypermarkets
(Weighted) average cost of debt: a mathematical measure of the finance expense divided by the periodical average outstanding debt
EPRA Cost ratio: The purpose of the EPRA Cost ratio is to reflect the relevant overhead and operating costs of the business. It is calculated by expressing the sum of property expenses (net of service charge recoveries and third-party asset management fees) and administration expenses (excluding exceptional items) as a percentage of Gross rental income
EPRA Earnings: Profit after tax attributable to the equity holders of the Company, excluding fair value adjustments of investment property, profits or losses on investment property disposals and related tax adjustment for losses on disposals, gains on acquisition of subsidiaries, acquisition costs, fair value and net result on sale of financial investments at fair value through profit or loss and deferred tax expense
EPRA Earnings Per Share: EPRA Earnings divided by the number of shares outstanding at the period or year-end
EPRA NAV Metrics:
EPRA Net Reinstatement Value (EPRA NRV): Highlights the value of net assets on a long-term basis. It is computed as the net assets per the Statement of financial position, excluding the goodwill, deferred taxation net balance and mark-to-market of interest rate derivatives (which represents assets and liabilities not expected to crystallise in normal course of business)
EPRA Net Tangible Assets (EPRA NTA): Assumes that entities buy and sell assets, thereby crystallising certain levels of unavoidable deferred tax
EPRA Net Disposal Value (EPRA NDV): Represents the shareholders’ value under a disposal scenario, where deferred tax, financial instruments and certain other adjustments are calculated to the full extent of their liability, net of any resulting tax
EPRA Net Initial Yield: Annualised rental income based on the cash rents passing at the balance sheet date, less non-recoverable property operating expenses, divided by the market value of the portfolio
EPRA “topped-up” Yield: EPRA Net Initial Yield adjusted in respect of the annualised rent-free at the balance sheet date
EPRA Vacancy Rate: Vacancy rate computed based on estimated rental value of vacant space compared to the estimated rental value of the entire property
EPRA loan-to-value (EPRA LTV): A key (shareholder-gearing) metric to determine the percentage of debt comparing to the appraised value of the properties
I. General ESRS-Specific Abbreviations
CSRD – Corporate Sustainability Reporting Directive
ESRS – European Sustainability Reporting Standards
ESRS 2 – General Disclosures (mandatory across all ESRS)
EFRAG – European Financial Reporting Advisory Group
II. ESRS Structural Abbreviations
SBM – Strategy, Business Model, and Value Chain
GOV – Governance
IRO – Impact, Risks, and Opportunities
MDR – Minimum Disclosure Requirements
DR – Disclosure Requirement
III. Environmental (ESRS E) Abbreviations
ESRS E1 – Climate Change
ESRS E3 – Water and Marine Resources
ESRS E5 – Resource Use and Circular Economy
GHG – Greenhouse Gas
DNSH – Do No Significant Harm
IV. Social (ESRS S) Abbreviations
ESRS S1 – Own Workforce
ESRS S2 – Workers in the Value Chain
ESRS S3 – Affected Communities
ESRS S4 – Consumers and End Users
ILO – International Labour Organization
V. Governance (ESRS G) Abbreviations
ESRS G1 – Business Conduct
AML – Anti-Money Laundering
VI. Reporting and Compliance
DMA – Double Materiality Assessment
EU Taxonomy – EU Classification System for Sustainable Activities
IFRS – International Financial Reporting Standards
TCFD – Task Force on Climate-related Financial Disclosures