

Annual Report
Signify is the world leader in lighting. We leverage over 130 years of leadership in lighting to create dynamic, innovative and human-centric projects.
We provide professional customers and consumers with quality products, systems and services. Our connected lighting offerings bring light and the data they collect to devices, places and people - redefining what light can do and how people use it. Our innovations contribute to a safer, smarter, and more sustainable world.
In homes, offices, shops, supermarkets, sports stadiums, cities, greenhouses and factories – as well as through the Signify Foundation – our purpose is to unlock the extraordinary potential of light for brighter lives and a better world.
We are Signify
1 Performance highlights
1.1 Financial performance
2024 | 2025 | |
|---|---|---|
Comparable sales growth | (6.6)% | (3.4)% |
Nominal sales growth | (8.4)% | (6.2)% |
Adjusted EBITA margin | 9.9% | 8.9% |
Net income1 | 334 | 259 |
Free cash flow1 | 438 | 440 |
Net cash provided by operating activities1 | 514 | 531 |
- In EUR million
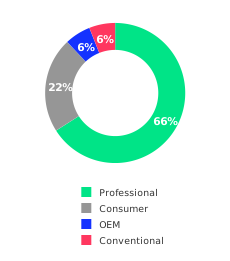
Businesses | Professional | Consumer | OEM | Conventional |
|---|---|---|---|---|
Sales1 | 3,767 | 1,274 | 355 | 327 |
Comparable sales growth | (1.4)% | 1.4% | (16.5)% | (23.1)% |
Nominal sales growth | (4.2)% | (1.7)% | (18.8)% | (25.2)% |
EBITA margin | 8.3% | 8.9% | 3.2% | 12.0% |
Adjusted EBITA margin | 8.9% | 10.6% | 4.8% | 16.1% |
- In EUR million
This chapter contains certain non-IFRS financial measures and ratios, such as comparable sales growth, EBITA, Adjusted EBITA and free cash flow, and related ratios, which are not recognized measures of financial performance or liquidity under IFRS. These measures are further discussed in chapter 4, Corporate performance. For a reconciliation of these non-IFRS financial measures to the most directly comparable IFRS financial measures, see chapter 18, Reconciliation of non-IFRS financial measures. |
1.2 Sustainability performance
Brighter Lives highlights | 2024 | 2025 |
|---|---|---|
Brighter lives revenues | 33% | 35% |
Women in leadership | 28% | 27% |
Safety at work (TRC rate) | 0.17 | 0.12 |
Supplier Sustainability Performance | 96% | 97% |
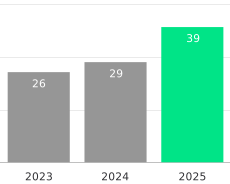
Lives lit since 2017 (in million) | 10.5 | 14.8 |
Better World highlights | 2024 | 2025 |
|---|---|---|
Cumulative carbon reduction over value chain, in million tonnes CO2e1 | 4982 | 655 |
Circular revenues | 35% | 37% |
Total waste to landfill | <1% | <1% |
- The cumulative yearly difference between the GHG emissions of Paris Agreement 1.5°C pathway and the actual value chain emissions of Signify from 2022, 2023, 2024 and 2025.
- 2024 figure has been revised
2 CEO message
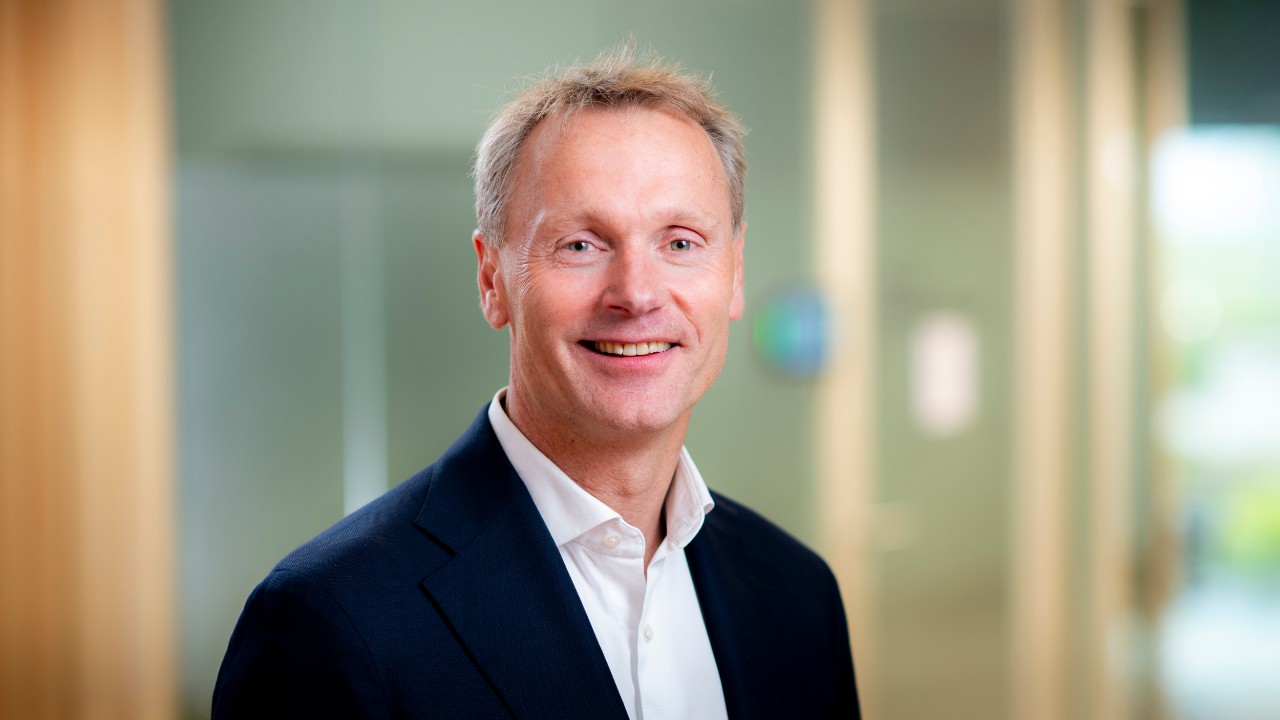
Over the past months, I have spent time listening, learning, and engaging with colleagues, customers, investors and partners across the globe. What I have seen reinforces my belief that Signify has a bright future and many opportunities ahead.
We have a strong innovation engine, deeply rooted technical expertise, and passionate people who care about the impact of their work. We are leading at the forefront of connected and energy-efficient lighting that improves lives and delivers meaningful benefits for businesses, communities, and individuals. There is much to be proud of.
At the same time, I have arrived at a challenging moment. As the global leader in lighting, our portfolio and geographic footprint are broad. This diversity brings resilience but also exposes us to a range of external headwinds. The past year was shaped by macroeconomic uncertainty and structural shifts in our industry, revealing both the strength of some parts of the business and the need to sharpen our execution in other areas.
There are clear, bright spots. Within Professional lighting, the connected and specified project segments present compelling opportunities. Our Consumer business has delivered consistent growth, led by our premium smart-home offering and powerful brands. We continue to grow in specialty applications and in focus markets such as the US and India, demonstrating the impact of disciplined execution and local relevance.
However, while we were able to neutralize the direct impact of tariffs in the US, the resulting overcapacity led to intensified competition in the more commoditized, non-connected LED and component categories and trade channels. A slowdown in public procurement and infrastructure projects weighed on the
Professional business in Europe, while our OEM business experienced reduced demand and pricing pressure.
These contrasts will inform our new strategy, to be shared at Capital Markets Day later in the year. As communicated in our full-year results, we are reviewing our portfolio with a clear objective: to develop a focused roadmap that delivers durable, profitable growth.
Sustainability remains central to how we create value. In 2025, we concluded five years of progress under our Brighter Lives, Better World program, exceeding our targets for energy efficiency and emissions reduction, circularity, and impact beyond illumination. External recognition from organizations such as EcoVadis, the Dow Jones Sustainability Index, and CDP, as well as surpassing 10 million lives lit by the Signify Foundation, reflects the impact of our efforts.
Through what will be a transitional year for Signify, we anticipate the challenging conditions of 2025 will continue. To outperform in this environment, we will be decisive. Commercial and supply-chain excellence will be critical. We will focus our resources and investments on areas where we can win, with a strict culture of cost and capital discipline.
Equally important is how we operate. We will continue to evolve our culture to deliver the full value of our operating model, strengthening a market-led mindset across the organization. We will leverage digital and AI capabilities and accelerate the modernization of our technology stack to support speed, simplicity, and better decision-making.
In closing, I want to express my sincere thanks to the people of Signify. It has been a privilege to meet so many of you around the world, and I am inspired by your dedication, professionalism, and belief in what we do. Thank you to our Supervisory Board for your guidance and support, and to our shareholders for your trust. And above all, thank you to our customers for your partnership, enthusiasm, and confidence in Signify.
The road ahead will require focus, discipline, and courage. But I am confident in our path and in the future we are building together.
As Tempelman
CEO Signify

In 2025, Philips Hue opened a new chapter with the launch of the Hue Bridge Pro. As the central hub of the Philips Hue system, the Hue Bridge Pro strengthens the technological foundation that unlocks broader smart home experiences, supporting automation, security, entertainment, and well-being through a single, intuitive platform.
The Hue Bridge Pro sets new standards for performance, capacity, and speed, supporting up to 150 lights and 50 accessories from a single device. This scale allows even the most ambitious Hue homes to be managed simply and consistently, as well as creating a future-ready base for new services and integrations.
More power, more performance
Equipped with a processor five times more powerful and memory 15 times larger than the Hue Bridge, the Hue Bridge Pro delivers faster system response and greater creative flexibility. Users can store more than 500 personalized lighting scenes, while benefiting from improved speed and stability across the system.
Powered by the new Hue Chip Pro, the Bridge Pro also enables advanced capabilities such as Hue Motion Aware, which allows Philips Hue lights to function as motion sensors. By intelligently interpreting changes within a space, lighting can respond automatically when movement is detected — enhancing everyday convenience without the need for additional hardware.
Expanding the Hue ecosystem
The Hue Bridge Pro anchors a broader portfolio expansion in 2025, including the Philips Hue Essentials range, designed to make smart lighting more accessible, and new Hue Secure solutions such as the video doorbell, extending Philips Hue’s role in home awareness and monitoring. With the Hue Bridge Pro at its core, the Philips Hue ecosystem continues to scale in capability while maintaining simplicity and reliability.
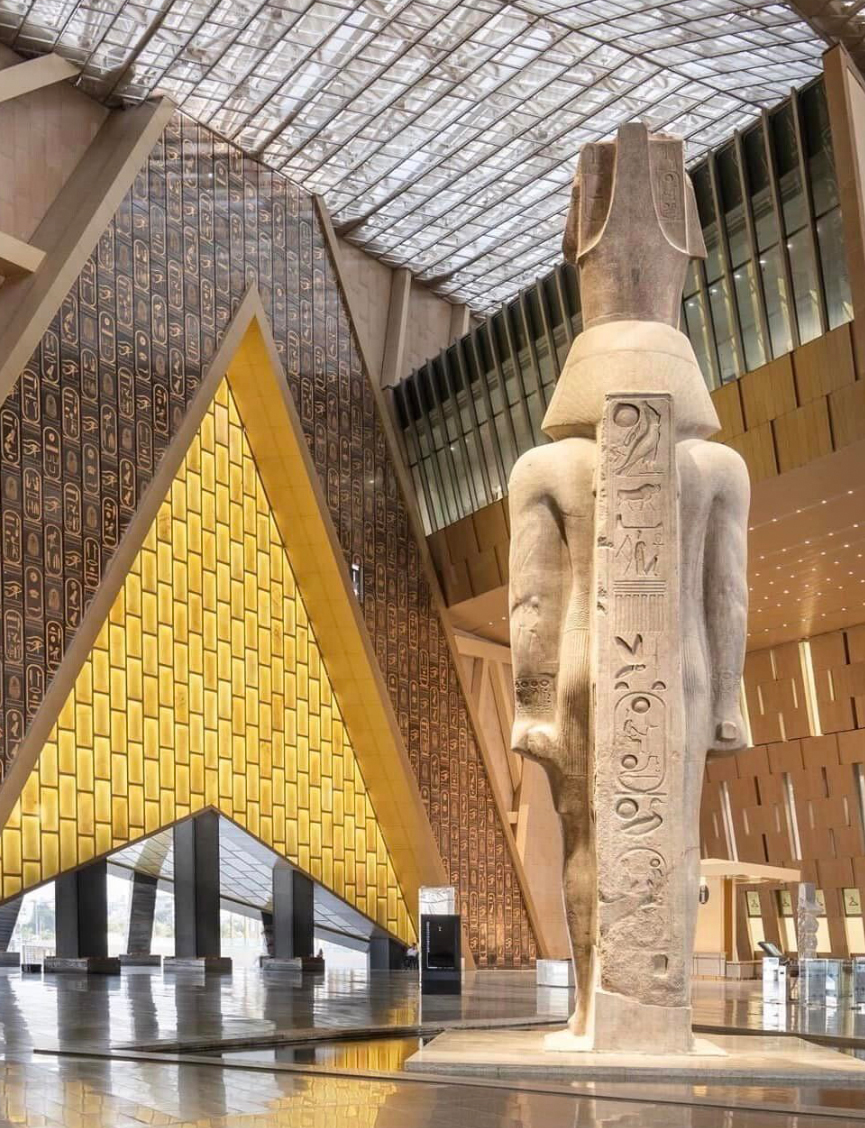
The Grand Egyptian Museum (GEM) is one of the world’s largest cultural and archaeological museum complexes, bringing together more than 100,000 ancient artefacts in one magnificent new site in Giza, Egypt. To showcase the exhibits in their best light, Signify partner Modernlite needed a flexible and scalable connected lighting control system that would be capable of balancing visitor experience, conservation needs, and operational complexity.
The Dynalite system is an advanced connected lighting control system with the power to manage a large-scale, complex environment. The system delivers consistent and precise control across more than 30,000 lighting fixtures installed throughout the space. In total, approximately 10,000 Dynalite devices were installed across the complex including sensors, user interfaces, certified DALI-2 controllers, and System Manager software. Together, these components support dynamic scene control, energy optimization, and coordinated operations across galleries, exhibition halls, retail, hospitality, and public circulation zones.
Flexible and scalable
Beyond the main galleries and exhibition halls, the museum includes many smaller multi-use rooms and flexible spaces, which frequently change function to accommodate temporary exhibitions, education spaces, or storage needs. With Dynalite, managers can adjust lighting scenes and configurations through software, without rewiring or controlling circuits.
In this large-scale space, some areas of the museum are flooded with natural light, while others have strict light control measures in place to protect sensitive artefacts. A bespoke collection of lighting scenes was developed to respond to these conditions, helping to maintain the comfort of visitors whilst supporting the highest conservation standards.
To simplify operations, the lighting control system interfaces reliably with the building management system, streamlining the day-to-day work of facility managers. In Dynalite, the Grand Egyptian Museum has a lighting control platform suited to its scale and complexity, providing long-term flexibility and ease of use in this unique space.

Located in Guizhou Province, China, Huajiang Grand Canyon Bridge spans 1,420 meters and rises 623 meters above the canyon floor, setting a double world-first record. As a critical piece of regional infrastructure and a future tourism landmark, the bridge’s lighting brings together safety, performance, and bold visual impact.
Signify supplied more than 1,000 floodlights positioned at key locations across the structure, including the bridge towers, the main steel framework, and piers. Wall-washers and in-ground lights were used for façade and landscape lighting at the adjoining Yundu Service Area. Signify’s LiteMagic brand was selected for its proven reliability, precise light control and accurate color rendering of the bridge’s impressive structure. The lighting integrates seamlessly with the bridge’s control system, which manages lasers, waterfalls, and other functions to create artistic evening light shows.
Performance under pressure
The project also presented demanding technical challenges. The site is exposed to frequent strong winds and constant humidity, making the stability and safety of every luminaire essential. Beyond the standard mounting design, all LiteMagic floodlights were fitted with stainless steel anti-fall safety ropes. The luminaires also passed a 500-hour salt spray test and are rated for a 50,000-hour lifespan, helping to reduce maintenance in this challenging environment.
With vehicles travelling at speeds of up to 80 km/h and around 1,200 crossings every hour, the structure is in constant motion. Every luminaire underwent a 100,000-hour vibration test to ensure it could stay steady and reliable, even under continuous dynamic load.
Bridges like this one are not just achievements of engineering but play a vital role in connecting previously isolated communities and promoting economic development. With a two-hour travel time reduced to just minutes, local people can enjoy the benefits of stronger regional connections and feel pride in a beautifully illuminated iconic landmark that can be appreciated for generations.
3 Business and strategy
3.1 About Signify
Signify, headquartered in Eindhoven, The Netherlands, is the world market leader in lighting with recognized expertise in the development, manufacture and sale of innovative, energy-efficient lighting products, systems and services. Our purpose is to unlock the extraordinary potential of light for brighter lives and a better world.
We have pioneered many key breakthroughs in lighting over the past 130 years and have been a driving force behind several leading technological innovations. Signify continues to innovate in LED lighting and is leading the industry’s expansion to lighting systems in both the professional and consumer markets. Our position as industry leader in connected lighting, makes Signify the lighting company for the Internet of Things (IoT).
Our Signify brands
Our products, Interact systems and data-enabled services, deliver business value and transform life in homes, buildings and public spaces. Find more information on our technology and specialty brands on our website.  |
Our global presence
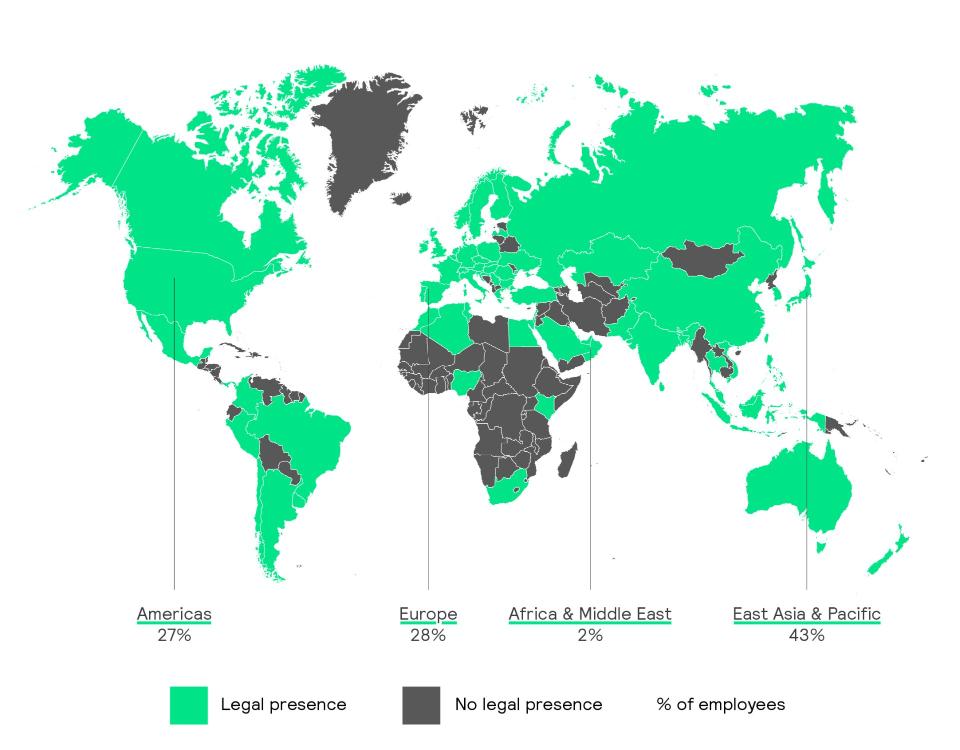
Signify has a global presence in 71 markets with around 26,600 employees. Our operations are split across four businesses which bring over 30 brands to market. |
Strategic context
The macroeconomic environment in 2025 remained complex, shaped by continuing uncertainty driven by geopolitical tensions and renewed trade disputes — including the introduction of tariffs in several regions. These developments created ripple effects across markets as trade flows adjusted, weighing on demand and increasing price erosion in many regions, especially in the trade channel. Despite these headwinds, several structural trends provided a more positive outlook for the lighting industry.
The global shift toward energy efficiency, urban renewal, and digital transformation continued to stimulate demand for connected and sustainable lighting solutions. However, non-residential construction activity remained muted in many regions, with investment decisions still constrained by cautious business sentiment and slower project execution. Some recovery was visible in markets supported by public investment in infrastructure and climate-focused renovation programs.
The lighting industry continued its transformation in 2025, driven by growth in LED and connected lighting technologies. The ongoing market transition toward sustainable lighting alternatives led to a further contraction in the market for conventional lighting. Meanwhile, the LED segment, though increasingly mature and fragmented, saw growing momentum in connected and specialty lighting, which offer higher differentiation, added functionality, and stronger value-creation potential.
In 2025, we launched our renewed strategy, building on the new operating model implemented in 2024 — a structure organized around four vertically integrated businesses. As this model enhances the autonomy of our businesses, it enables us to better meet the evolving needs of our customers.
Our renewed strategy is designed to align with the distinct trajectories of each of our businesses and to address the diverse market dynamics across our portfolio. It provides a clear framework to:
Expand in specialty lighting, capturing growth opportunities in areas outside of general lighting through innovation and technical leadership.
Maintain leadership in connected lighting, continuing to define the industry through digitalization and data-enabled solutions.
Strengthen our competitive position in non-connected LED, driving efficiency, quality, and differentiation to reinforce our market position.
Maximize value from the conventional lighting business, managing its natural decline while optimizing profitability and leveraging our long-standing expertise.
This corporate strategy acts as a unifying framework for our four businesses — Professional, Consumer, OEM, and Conventional — empowering each to develop bespoke strategies that reflect their unique customer bases, market dynamics, and growth potential. Together, these strategies ensure that we continue to unlock the extraordinary potential of light for brighter lives and a better world.
Signify’s AI strategy and roadmap are owned by our Chief Digital and Information Officer and our Chief Innovation Officer, who regularly align with the Board of Management holding ultimate responsibility and who periodically report progress and risks to the Digital Committee within our Supervisory Board. We have made strategic choices to selectively deploy AI in areas where we expect it generates the best business outcomes and return on investment. This has resulted in several AI use cases across the value chain, from innovation and product development to sales, marketing, finance, and supply chain, all aimed at driving productivity, improving our competitiveness, and serving our customers.
Annually, Signify engages in a Strategic Review Process, alongside a comprehensive Sustainability Materiality Assessment (more details in chapter 5, Sustainability statements). As an outcome of the 2025 review, Signify will, during 2026, sharpen its strategy to further accelerate growth, strengthen competitiveness, and enhance long-term value creation. [SBM-1_02; SBM-1_21 & 22]
Professional | Consumer | Original Equipment Manufacturer (OEM) | Conventional | |||
 |  |  |  | |||
The Professional business offers LED products and connected lighting systems & services to professional customers across the globe. Customer segments include offices, commercial buildings, shops, hospitality venues, specialty areas like agriculture and public lighting. The Professional business aims to maintain its leadership position by further innovating in LED products, winning in connected lighting and exploring new opportunities in areas of specialty lighting to drive growth. | The Consumer business offers a wide variety of LED lamps and functional LED luminaires to the consumer segment. As a leader in connected home lighting systems, notably Philips Hue and WiZ, Signify serves our consumer customers through various online and offline channels. The Consumer business aims to maintain and diversify its leadership by strengthening its online sales channels, by adopting a regional approach to grow in consumer luminaires and by differentiating its product portfolio in LED lamps. Growing Connected systems through innovations in products and applications remains a key priority. | The OEM business offers lighting components – such as LED drivers, electronics, modules and sensors to the industry. OEM serves both the internal organization for its requirements and other manufacturers across the globe in segments such as Retail and Hospitality, Office and Industry and Outdoor. The OEM business balances sales growth and profitability through delivering cost-effective and fit for purpose solutions for both non-connected and connected offerings while also target specialty lighting segments through leveraging existing expertise and capabilities. | The Conventional business offers a range of products, including conventional lamps, electronics, and specialty lighting, with a focus on niche areas such as digital projection lighting. These conventional lamps are sold to consumers, electrical installers, distributors, and professional end users. The strategic priority of the Conventional business is to maintain its leadership in the declining conventional lamps and electronics market, while utilizing its technology expertise and application knowledge to expand its presence in specialty lighting. |
Our commitments and 2025 results
Signify advanced the implementation of its renewed strategy throughout 2025. Across our businesses, we made progress in translating our strategic priorities into tangible outcomes. |
Strengthen competitiveness in non-connected LED lighting | Maintain leadership in connected lighting | Expand in specialty lighting | Maximize value from conventional lighting | |||||
Description | Improve efficiency and differentiation in mainstream LED products to sustain market share and profitability. | Reinforce Signify’s global leadership in connected systems through digitalization and data‑enabled innovation. | Capture growth opportunities in areas outside of general lighting by leveraging innovation, technical expertise, and application knowledge. | Manage the natural decline of the conventional portfolio while leveraging technology expertise to retain value in specialty applications. | ||||
Focus Areas | Optimize cost structure; strengthen multi-brand and private-label offerings; expand offering in Ultra Efficient LED solutions to deliver greater energy savings and performance. | Develop multi-tiered offerings and launch new features across Professional and Consumer businesses. | Drive expansion in agriculture, solar, and other specialty applications. | Focus on profitability, cash generation, and selective growth in areas of sustained demand. | ||||
Results | Product competitiveness improved through cost discipline and quality enhancements; market share remained stable. | Connected lighting share of sales increased; new digital features enhanced customer experience and energy efficiency. | Specialty lighting delivered growth in Professional, supported by innovation in horticulture and solar lighting. 3D printing also contributed. | Profitability maintained through disciplined cost management and operational excellence; specialty segments remained resilient. |
Our sustainable value created
Signify is committed to generating value through its business model. The inputs are resources from which value is unlocked when transformed and leveraged through our business activities, resulting in outputs and outcomes that create value for our stakeholders [CSRD SBM1_26 & 27]. The overview considers the interdependencies between the company’s competitiveness, performance, stakeholders, supply chains, communities, and natural environment it impacts and relies upon. Signify ensures the gathering, developing and securing of the inputs by having integrated them as part of a business function's responsibilities. The financial inputs are part of the business financial and strategic processes and the environmental and social inputs are connected to our topical action plans and programs.
Input | Output | Outcome | ||||||
Financial | Capital Expenditures; | 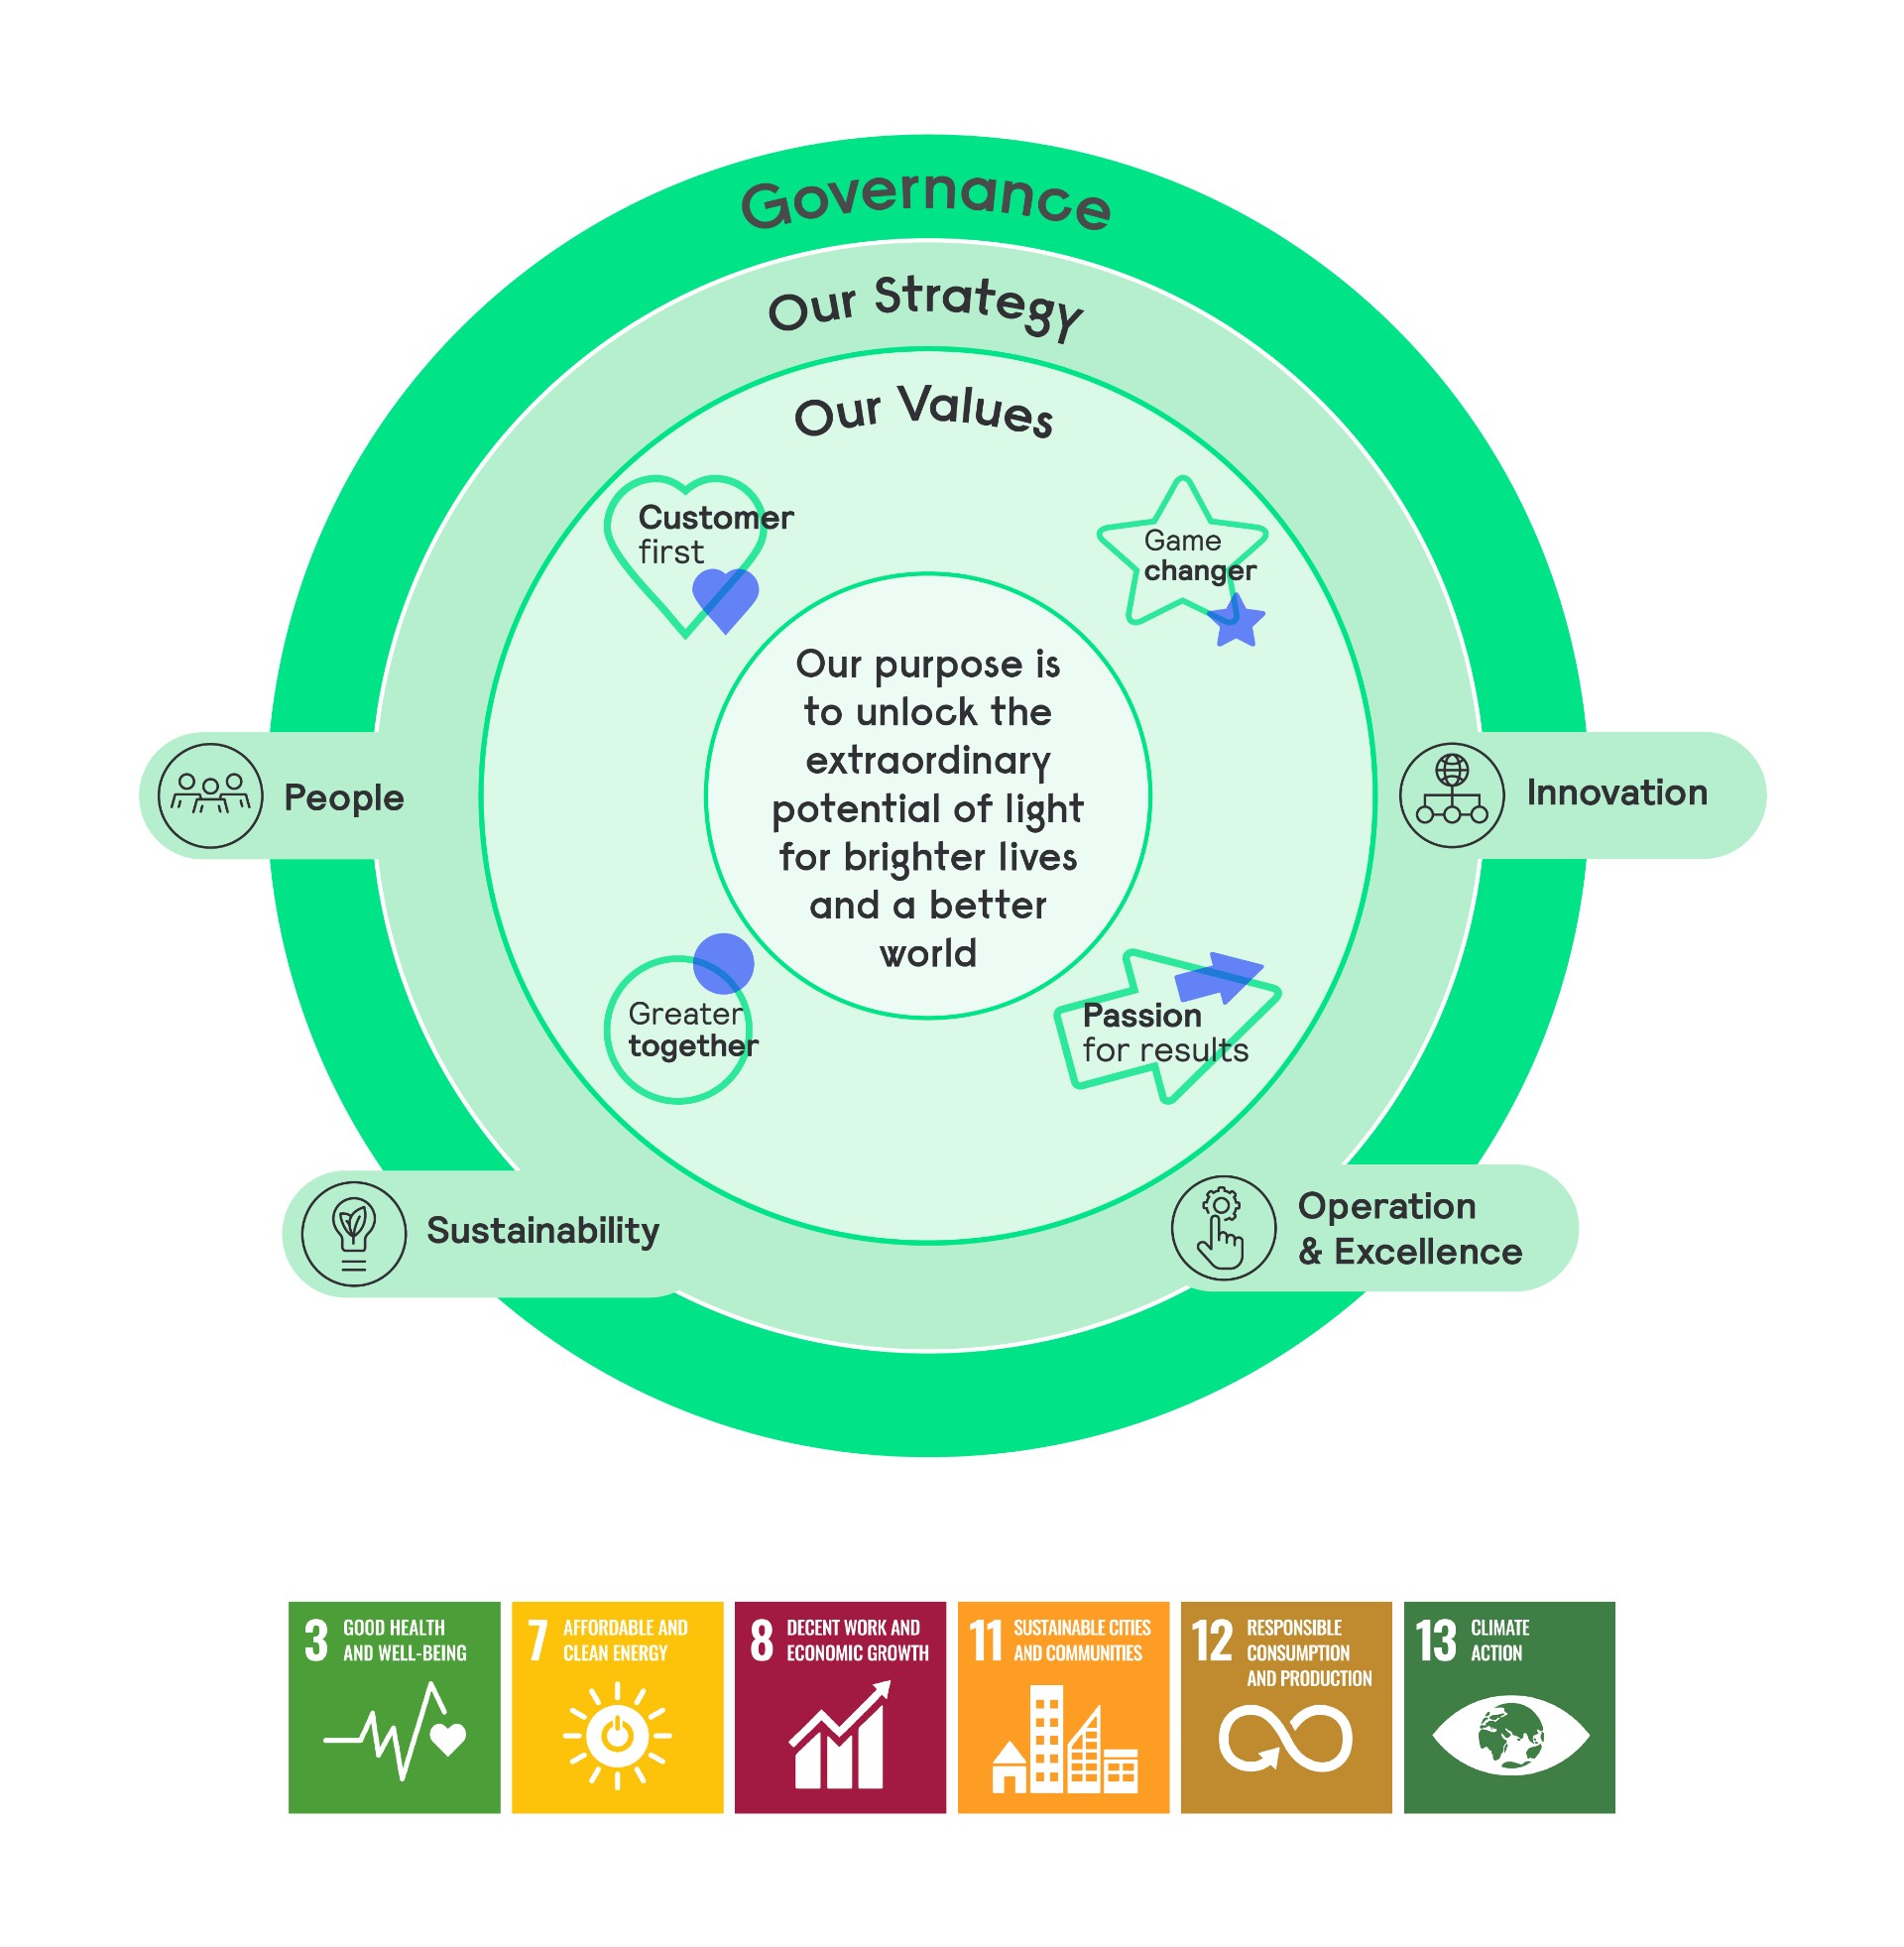 | Sales; | New innovations in ultra efficient and circular products benefiting customers, shareholders, governments and society at large; | ||||
Environmental | Energy, including renewable electricity; | Emissions reduction aligned with our SBTi-approved targets and CO2 avoided; | Reduced environmental impacts and decreased negative effects on environment which benefits society at large and nature; | |||||
Social | Employees in 73 countries and over 91 nationalities; | Improved employee satisfaction; | Increased employee satisfaction and well-being; |
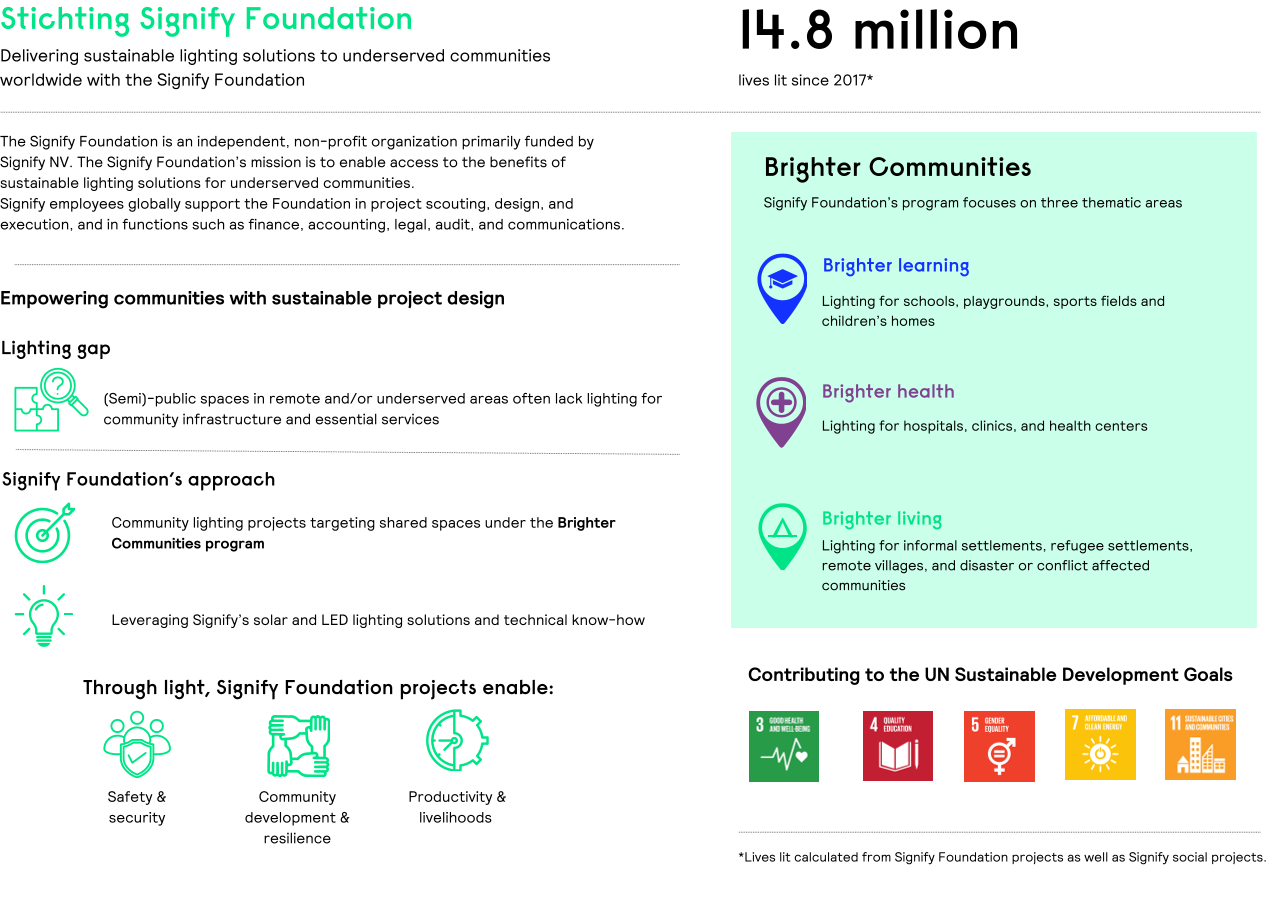
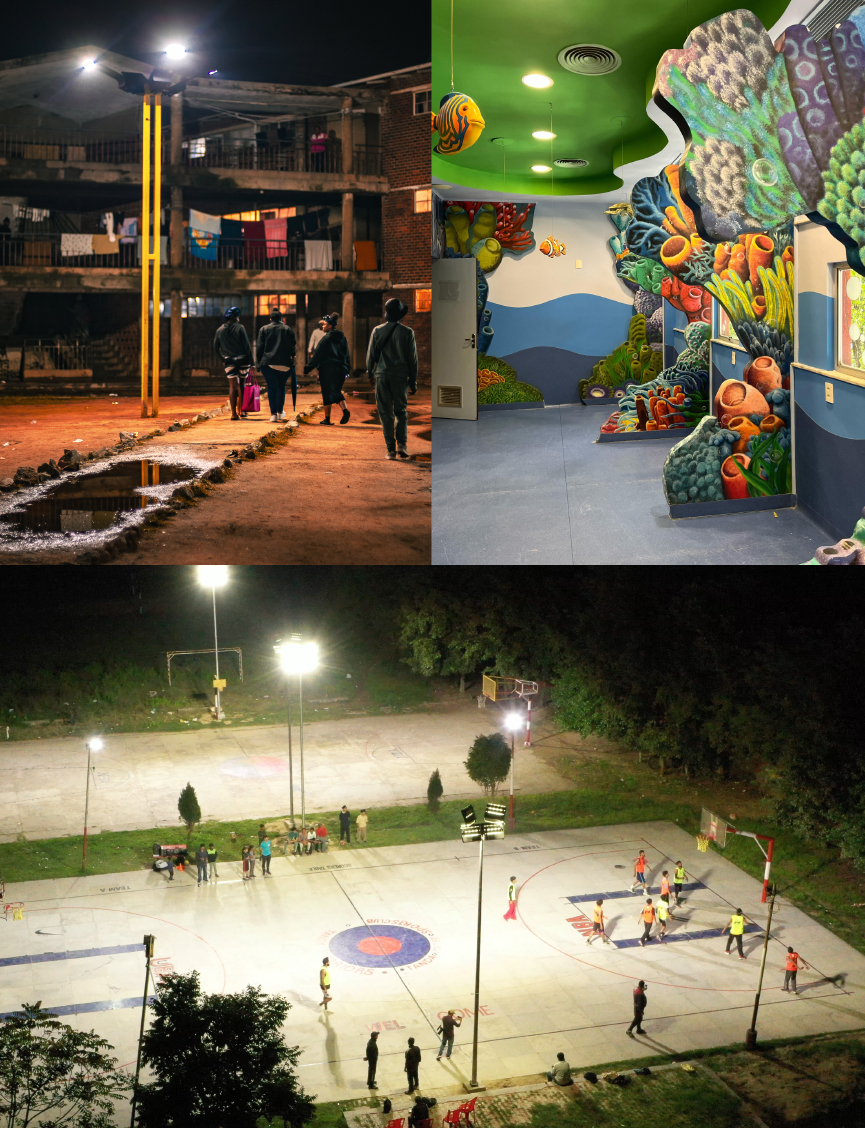
Signify’s purpose – to unlock the extraordinary potential of light for brighter lives and a better world – is reflected in the projects initiated by Signify teams around the world and in the support provided to the independent Signify Foundation.
The Signify Foundation works with partners to bring light and opportunities to people who aspire to create a brighter future. Its focus is on building recovery and resilience for underserved communities by enabling access to light and livelihood development.
Brighter health, Brazil
Thoughtful lighting design can help create more welcoming, sensitive, and human healthcare environments, an important consideration in pediatric settings. At Hospital Hemorio in Rio de Janeiro, 186 Philips GreenPerform luminaires were installed to improve lighting quality and comfort, bringing comfort to families, doctors, and staff. The project was delivered in collaboration with Instituto Desiderata, BEBO Arquitetura, and Signify's lighting designer Marcelo Castillo.
Brighter living, South Africa
In the Alexandra township of Johannesburg, the Signify Foundation worked with Wakanda Food Accelerator to install solar lighting solutions around a women’s hostel, school premises, health centers, and public spaces. With access to reliable lighting, children can continue playing, and communities can socialize and work after dark with an increased sense of safety.
Brighter learning, India
In partnership with Pro Sport Development, Signify installed lighting across 17 sports courts and play areas in Hoshiarpur, Punjab. The new lighting enables students to train safely beyond daylight hours, which particularly benefits girls’ participation in sport. The project also includes safeguarding workshops for coaches and young athletes to help promote safe and inclusive sports environments.
These projects open a small window into the work of the Signify Foundation. For more stories about the transformative power of light, please visit the Signify Foundation’s dedicated website and annual report. https://www.signify.com/global/our-company/signify-foundation
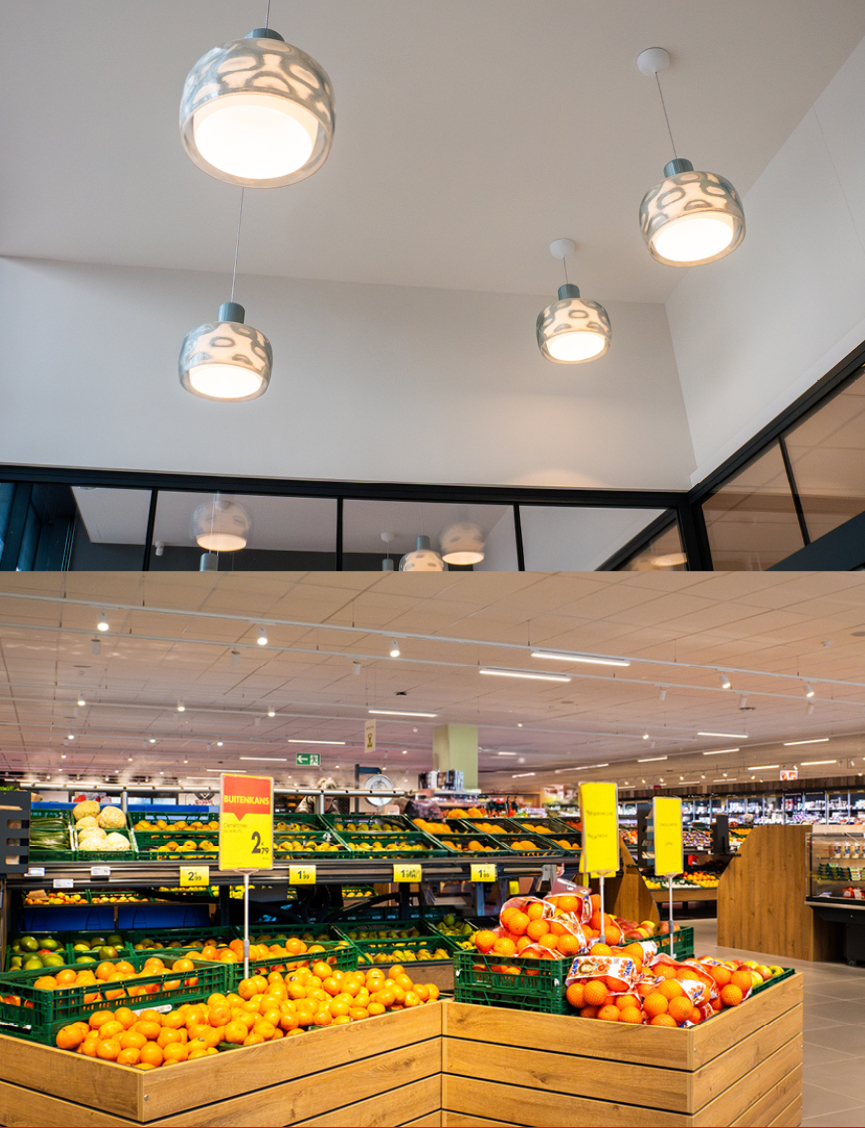
Lighting can have a profound impact on how customers experience and interact with a retail space. For the Carrefour Market in Mariakerke, Oostende, Belgium, owner Karen Pollet needed lighting that would present products clearly and attractively while creating an inviting and appealing atmosphere for customers, from the car park to the checkout. At the same time, the lighting upgrade was an important opportunity to reduce the store’s environmental footprint. Circularity was a key design principle. Carrefour aimed to demonstrate how recycled materials could be integrated into a modern retail environment while limiting the use of new natural resources. The store selected Signify’s 3D-printed luminaires across the sales area. These luminaires are made with at least 65% recycled or bio-circular materials and are designed to be upgradeable, reusable, fully serviceable, and recyclable.
A sustainable vision
At the store’s entrance, distinctive luminaires made from recycled 19-liter cooler bottles create a clear visual identity and introduce the concept of circularity to customers as soon as they arrive. Inside the store, StoreSet linear fixtures help guide customers through the space, maintaining visual consistency across departments.
Energy efficiency was another important consideration. Precise control of the store’s lights using Signify Interact lighting management system delivers up to 30% additional energy savings, resulting in an annual CO2 emissions reduction of almost 4 tons while maintaining high-quality illumination that brings out the best in the store’s products. This combination of customer experience, circular design, and operational efficiency was formally recognized in 2025, when Karen Pollet received an award from the European Franchise Federation for her efforts to integrate sustainable practices into an effective retail business.
"Signify's beautiful 3D-printed light fixtures from recycled 19-liter cooler bottles are the showpiece of my shop when it comes to circularity. Signify supported us with expert advice and a lighting plan that saves energy and optimizes customer experience."
Karen Pollet, Owner, Carrefour Market Mariakerke, Oostende
4 Corporate performance
2024 | 2025 | |
|---|---|---|
Sales | 6,143 | 5,765 |
Comparable sales growth1 | (6.6)% | (3.4)% |
Gross margin | 2,442 | 2,271 |
as a % of sales | 39.7% | 39.4% |
Income from operations | 477 | 383 |
Financial income and expenses | (82) | (61) |
Income tax expense | (60) | (62) |
Net income | 334 | 259 |
Adjusted gross margin1 | 2,501 | 2,310 |
Adjusted indirect costs1 | (1,965) | (1,864) |
Adjusted EBITA1 | 606 | 511 |
as a % of sales | 9.9% | 8.9% |
Restructuring, acquisition and incidental items1 | (63) | (72) |
EBITA1 | 543 | 439 |
Basic earnings per share in EUR | 2.60 | 2.06 |
Dividend per share in EUR2 | 1.56 | 1.57 |
Shareholders’ equity | 3,162 | 2,673 |
Net debt1 | 3,267 | 2,767 |
Working capital1 | 422 | 329 |
Net cash provided by operating activities | 514 | 531 |
Free cash flow1 | 438 | 440 |
as a % of sales | 7.1% | 7.6% |
- For a reconciliation to the most directly comparable IFRS financial measure, see chapter 18, Reconciliation of non-IFRS financial measures.
- 2025 Dividend subject to approval by the 2026 Annual General Meeting of Shareholders.
4.1 Financial performance
4.1.1 Company performance
In 2025, Signify operated in a challenging market environment characterized by subdued demand in parts of Europe, price pressure in professional trade channels, and the indirect ripple effects of global tariffs. While the direct impact of tariffs on sales and profitability was effectively mitigated through supply chain optimization and disciplined pricing, overcapacity in certain geographies intensified competitive dynamics. At the same time, market conditions proved more resilient in other regions, with the US and India showing solid momentum. Consumer demand remained robust, especially for connected lighting, reflecting the continued structural shift toward smart, digitally enabled solutions.
Against this backdrop, Signify delivered mixed performance across its businesses. The Professional segment grew in the US but declined in Europe, reflecting continued weakness in regional construction markets. The Consumer business delivered growth across all regions except China. Connected lighting grew across Signify's Professional and Consumer businesses, partly offset by a decline in non-connected products, especially in trade channels. The OEM business faced reduced demand and price pressure. Despite these headwinds, both Professional and Consumer businesses maintained strong gross margins, underscoring the resilience of the operating model.
Nominal sales decreased by 6.2% to EUR 5,765 million, including a negative currency effect of 2.8% largely due to the USD depreciation. Comparable sales declined by 3.4%, as growth in the Consumer business and in the US Professional business was more than offset by continued weakness in the Professional Europe business and OEM businesses. Excluding the Conventional business, Signify's comparable sales declined by 1.9%.
The Adjusted gross margin decreased by 60 bps to 40.1%, as positive sales mix and effective COGS were offset by price pressure in some of Signify's markets and temporary effects within the Conventional and OEM businesses. Adjusted indirect costs as a percentage of sales increased by 30 bps to 32.3%, as continued cost reductions were offset by the effect of lower volume.
Adjusted EBITA was EUR 511 million. The Adjusted EBITA margin decreased by 100 bps to 8.9%, largely related to the lower gross margin and a higher proportion of indirect costs.
Adjusted items of EUR -72 million were mainly related to restructuring charges.
Net income decreased to EUR 259 million, mainly attributable to lower operational income.
Free cash flow slightly increased to EUR 440 million, mainly due to further improvements in working capital and the lower utilization in provisions for restructuring and pension liabilities, partly offset by lower income from operations. Free cash flow included a total restructuring payout of EUR 54 million (2024: EUR 133 million).
Compared with the end of December 2024, the cash position decreased by EUR 12 million and the gross debt increased by EUR 25 million. As a result, net debt increased by EUR 37 million. At the end of December 2025, the net debt/EBITDA ratio was 1.5x (Q4 24: 1.3x).
4.1.2 Performance by Business
Professional
The Professional business offers LED products and connected lighting systems & services to professional customers across the globe. Customer segments include offices, commercial buildings, shops, hospitality venues, specialty areas like agriculture and public lighting.
The Professional business aims to maintain its leadership position by further innovating in LED products, winning in connected lighting, and exploring new opportunities in areas of specialty lighting to drive growth.
In 2025, the Professional lighting market showed strong regional divergence, with clear regional differences: the US market showed relative resilience despite the impact of trade tariffs, supported by steadier construction activity, while Europe continued to face a difficult demand environment, particularly in the trade channel, amid economic uncertainty and subdued project
activity. Across regions, customers continued to prioritize efficiency, digitalization, and lifecycle value, driving sustained growth in connected lighting solutions.
2024 | 2025 | |
|---|---|---|
Sales | 3,933 | 3,767 |
Nominal sales growth | (7.6)% | (4.2)% |
Comparable sales growth1 | (5.8)% | (1.4)% |
Adjusted EBITA1 | 367 | 334 |
as a % of sales | 9.3% | 8.9% |
Free cash flow12 | 397 | 379 |
Number of employees | 14,578 | 14,330 |
- For a reconciliation to the most directly comparable IFRS financial measure, see chapter 18, Reconciliation of non-IFRS financial measures.
- Excluding non-allocated free cash flows items (e.g. tax,
interest and other costs in 'Other').
Nominal sales decreased by 4.2% to EUR 3,767 million, including a negative currency effect of 2.8% largely due to USD depreciation. Comparable sales decreased by 1.4%, as growth in the US Professional business was offset by the weakness in Europe's Professional business, particularly in the trade channel, and in emerging markets. The Adjusted EBITA margin decreased by 40 bps to 8.9% mainly reflecting price and volume pressure in European business, while the effect of trade tariffs was mitigated. Free cash flow was EUR 379 million.
Consumer
The Consumer business offers a wide variety of LED lamps and functional LED luminaires to the consumer segment.
As a leader in connected home lighting systems, notably Philips Hue and WiZ, Signify serves our consumer customers through various online and offline channels.
The Consumer business aims to maintain and diversify its leadership by strengthening its online sales channels, by adopting a regional approach to grow in consumer luminaires and by differentiating its product portfolio in LED lamps. Growing Connected systems through innovations in products and applications remains a key priority.
In 2025, the Consumer lighting market continued to evolve toward connected solutions, which stood out as the key structural growth driver across regions. Consumer adoption of connected lighting remained strong, supported by innovation, portfolio expansion and the continued shift toward smart, digitally enabled homes, with online channels playing an important role. Demand proved particularly resilient in markets such as India, while China experienced a more challenging consumer backdrop relative to other markets.
2024 | 2025 | |
|---|---|---|
Sales | 1,297 | 1,274 |
Nominal sales growth | (3.4)% | (1.7)% |
Comparable sales growth1 | (1.2)% | 1.4% |
Adjusted EBITA1 | 144 | 135 |
as a % of sales | 11.1% | 10.6% |
Free cash flow12 | 147 | 123 |
Number of employees | 9,207 | 7,866 |
- For a reconciliation to the most directly comparable IFRS financial measure, see chapter 18, Reconciliation of non-IFRS financial measures.
- Excluding non-allocated free cash flows items (e.g. tax,
interest and other costs in 'Other').
Nominal sales decreased by 1.7% to EUR 1,274 million, including a negative currency effect of 3.1% due to USD and other currencies depreciation. Comparable sales increased by 1.4% driven by strong connected sales throughout the year, partly offset by a decline in the non-connected business and weaker performance in China.
The Adjusted EBITA margin decreased by 50 bps to 10.6%, mainly due to higher commercial investments. Free cash flow was EUR 123 million.
OEM
The OEM business offers lighting components, such as LED drivers, electronics, modules and sensors to the industry. OEM serves both the internal organization for its requirements and other manufacturers across the globe in segments such as Retail and Hospitality, Office and Industry and Outdoor.
The OEM business balances sales growth and profitability through delivering cost-effective and fit for purpose solutions for both non-connected and connected offerings while also target specialty lighting segments through leveraging existing expertise and capabilities.
In 2025, the OEM lighting market faced a difficult competitive environment, marked by sustained price pressure and overcapacity. Demand remained subdued, with weak customer demand in Europe, as intense pricing competition was exacerbated by the ripple effects of tariffs and increased imports of Chinese components, especially in non-connected components.
2024 | 2025 | |
|---|---|---|
Sales | 437 | 355 |
Nominal sales growth | (4.5)% | (18.8)% |
Comparable sales growth1 | (2.0)% | (16.5)% |
Adjusted EBITA1 | 48 | 17 |
as a % of sales | 11.1% | 4.8% |
Free cash flow12 | 81 | 14 |
Number of employees | 2,484 | 2,074 |
- For a reconciliation to the most directly comparable IFRS financial measure, see chapter 18, Reconciliation of non-IFRS financial measures.
- Excluding non-allocated free cash flows items (e.g. tax,
interest and other costs in 'Other').
Nominal sales decreased by 18.8% to EUR 355 million, including a negative currency effect of 2.3% largely due to USD depreciation. Comparable sales decreased by 16.5%, primarily reflecting weak end-market demand and intense price pressure amid structural overcapacity in the market. This was further exacerbated by lower orders from two major customers, an effect that impacted results throughout the year. The Adjusted EBITA margin decreased to 4.8%, reflecting the impact of lower volumes and continued gross margin pressure. Free cash flow was EUR 14 million.
Conventional
The Conventional business offers a range of products, including conventional lamps, electronics, and specialty lighting, with a focus on niche areas such as digital projection lighting. These conventional lamps are sold to consumers, electrical installers, distributors, and professional end users.
The strategic priority of the Conventional business is to maintain its leadership in the declining conventional lamps and electronics market, while utilizing its technology expertise and application knowledge to expand its presence in specialty lighting.
In 2025, the Conventional lighting market continued its predictable structural decline, reflecting the ongoing industry-wide shift away from traditional lighting technologies. As connected and LED solutions gained further traction, Conventional products steadily lost relevance, in line with long-term expectations.
2024 | 2025 | |
|---|---|---|
Sales | 437 | 327 |
Nominal sales growth | (30.2)% | (25.2)% |
Comparable sales growth1 | (29.2)% | (23.1)% |
Adjusted EBITA1 | 78 | 53 |
as a % of sales | 17.9% | 16.1% |
Free cash flow12 | 55 | 42 |
Number of employees | 2,875 | 2,069 |
- For a reconciliation to the most directly comparable IFRS financial measure, see chapter 18, Reconciliation of non-IFRS financial measures.
- Excluding non-allocated free cash flows items (e.g. tax,
interest and other costs in 'Other').
Nominal sales decreased by 25.2% to EUR 327 million, including a negative currency effect of 2.1% due to USD and CNY depreciation. Comparable sales decreased by 23.1% reflecting the structural decline of the business. The Adjusted EBITA margin decreased by 180 bps to 16.1%. Free cash flow was EUR 42million.
Other
'Other' reflects the P&L of Signify’s venture businesses, in addition to centrally incurred costs not assigned to individual businesses, predominantly those related to exploratory research initiatives and audit activities. Adjusted EBITA was EUR -27 million (2024: EUR -32 million).
4.2 Proposed distribution to shareholders
Pursuant to Article 10 of the Articles of Association of Signify N.V., a dividend will first be declared on preference shares out of net income. The remainder of the net income, after reservations made with the approval of the Supervisory Board, shall be available for distribution to holders of ordinary shares subject to shareholder approval after year-end. As of December 31, 2025, the issued share capital consists only of ordinary shares; no preference shares have been issued. Under Article 10 of the Articles of Association of Signify N.V., the Board of Management can determine what portion of the net income shall be retained by way of reserve, subject to the approval of the Supervisory Board.
Signify proposes a cash dividend of EUR 1.57 per share for 2025, in line with its policy to pay an increasing annual cash dividend per share year on year. The dividend proposal is subject to approval at the Annual General Meeting of Shareholders (AGM) to be held on April 24, 2026. Further details will be provided in the agenda for the AGM.
The balance sheet presented in this report, as part of the company financial statements for the period ended December 31, 2025, is before appropriation of the result for the financial year 2025.
4.3 Outlook
Signify anticipates the challenging conditions to persist through 2026. Considering the diverging dynamics in its end markets, the company has not provided guidance on full-year sales. Signify expects an adjusted EBITA margin of 7.5-8.5%, and free cash flow generation of 6.5-7.5% of sales.
On January 30, 2026, Signify announced that the company will structurally reset its cost base and establish continuous productivity improvements, while remaining committed to its operating model. To drive this, Signify announced a EUR 180 million cost reduction program, which will impact 900 roles across Signify. The majority of savings will be delivered through 2026, with the full benefit realized in 2027.
As communicated, Signify is undertaking a comprehensive review of its strategy and portfolio with the objective of developing a focused roadmap that delivers durable growth. This review is intended to refine the company’s strategic positioning by determining the businesses and segments in which it will prioritize investment and growth, as well as those that may be harvested or divested over time. The objective is to ensure that the portfolio is fully aligned with long-term value creation and focused on areas where Signify can establish and sustain a competitive advantage.
The portfolio review is expected to be completed in the first half of 2026, with the outcomes to be presented at the Capital Markets Day in June 2026. On that occasion, Signify will outline the resulting portfolio priorities and explain how these decisions will shape its future strategic direction and capital allocation framework.
4.4 Responsible tax policy
Our tax principles are based on the recognition that tax is an integral element of our overall corporate social responsibility as well as commitment to the United Nations Sustainable Developments Goals.
Responsible Tax is an important topic for Signify to report on. For us, acting with integrity means paying the right amount of tax, in the right place, at the right time. Being a responsible taxpayer is aligned with our purpose, business strategy and Integrity code. We are committed to providing timely, regular, and reliable information on Signify’s tax position, including the Group effective tax rate, our total tax contributions, and our main tax exposures (see chapter 15, Consolidated financial statements, note 8, Income taxes).
We embrace the Tax Governance Code, as published by the Confederation of Netherlands Industry and Employers (VNO-NCW) and provide more information on our Tax Principles, Tax Strategy, Tax Organization and Tax Contributions in our Tax Report: https://www.signify.com/global/our-company/investors/governance.
The global tax strategy and policy are aligned with our business and sustainability strategies. The responsibility for Signify’s Tax Strategy, Tax Principles and how we manage our tax risks, ultimately rests with the CFO and the Board of Management. The Board of Management, enabling functions, and Businesses are advised on tax matters by Signify's Tax Function to ensure both the needs of the business and of the tax function are balanced. At least once a year, the Tax Principles and Tax Strategy as well as the Tax Risks are discussed with Signify’s Board of Management and the Audit Committee of the Supervisory Board. If needed these principles and strategy are updated and subsequently approved by our Board of Management to ensure continuous alignment with our purpose, business structure and overall corporate social responsibility.
Signify’s Tax Principles ensure compliance with local and international tax laws and regulations for all our group entities. These principles govern how Signify operates with customers, suppliers, contractors, and employees. We aim to prepare and file all required tax returns on time, providing complete, accurate and timely disclosures to all relevant tax authorities. In addition, the company has corporate requirements for the management of the company's legal entities in line with tax legislation.
Signify has a Tax Control Framework in place, to monitor and test the execution of critical tax processes as well as for risk management. Our Tax Controls are part of our Business Control Framework and our internal controls for financial reporting (ICS). They are monitored and documented by our Tax Function and the dedicated ICS team. Internal auditors regularly review our tax controls, and external auditors review our key tax positions and our tax processes as part of the audit of our Annual Report.
Signify maintains an open dialogue with our stakeholders and we engage constructively in national and international dialogue with governments, business groups and civil society to support the development of effective tax systems, legislation and administration. We regularly participate in meetings of business groups, to learn from our stakeholders and to provide our view on tax developments.
Signify aims to build and maintain a cooperative and healthy working relationship with all relevant (tax) authorities. The transparency in our tax policy is a key factor in building mutual respect and trust with tax authorities. The company also participates in national and international forums of experts to represent its interests. Signify's 2025 tax report includes all financial information on a country-by-country basis based on the EU Directive for public country-by-country reporting (Directive (EU) 2021/2101). The template laid down in the EU directive will be made available on our website later in 2026.
Our total tax contributions in the financial year 2025 amounted to EUR 923 million. This amount consists of both taxes borne and taxes collected by Signify. The taxes borne include the income tax paid, customs duties and the employer part of the payroll taxes. For more information on the definitions used in this chapter, refer to chapter 19, Definitions and abbreviations.
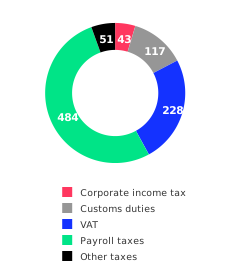
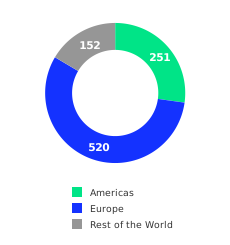
The amounts of corporate income tax paid reflect the geographic spread of Signify’s activities. The most significant amounts are paid and accrued in China and India where Signify has substantial business operations. In the United States we used losses from prior years, resulting in lower income tax paid. In the Netherlands there is a cash tax refund related to prior years.
Countries | EUR million |
|---|---|
India | 13 |
China | 13 |
Mexico | 3 |
Germany | 3 |
Canada | 2 |
Poland | 2 |
Spain | 2 |
United States of America | 1 |
The Netherlands | (6) |
Other | 10 |
Total | 43 |

Guests at the five-star Villa Miraé hotel in Cap d’Antibes expect luxurious facilities, discreet service, and elegant surroundings that reflect the property’s historic character. Owned by Inwood Hotels, it has been lovingly reimaged as a place where every detail contributes to a truly unique experience and an unforgettable stay.
Smart technology has become an integral part of the modern hotel experience. For Villa Miraé, the challenge was to introduce advanced digital systems that would elevate guest comfort without compromising the character of this high-end, heritage property. Inwood Hotels selected Signify Interact, which powers a user experience that combines the intuitive simplicity of smart home technology with the scale and reliability required in a luxury hospitality environment. The result is an experience that feels fluid and natural for guests while remaining practical and efficient for hotel staff.
Advanced personalization
In each room and suite, guests can personalize their environment through discreet, easy-to-use control panels. They can adjust lighting scenes, air conditioning, and ambience, all accessed via custom icons designed in step with the hotel’s visual identity. Lighting scenarios can be applied across different zones of the room to support how guests move through and use the space at different times of day.
This familiar interface also simplifies communication with hotel staff. With a simple touch of the control panel, guests can select ‘Do not disturb’ or request a room cleaning. These requests are instantly visible both outside the room and at reception, enabling housekeeping teams to respond in real time. This centralized visibility reduces delays, avoids unnecessary interruptions, and helps staff coordinate their work more effectively. And with streamlined operations and improved responsiveness, the hospitality team can focus on what matters most: providing an exceptional guest experience.
“We are delighted with the partnership with Signify. The Interact solution has allowed us to modernize our hotel while providing exceptional comfort for our guests."
Yann Protois, Technical and Maintenance Director, Inwood Hotels Group
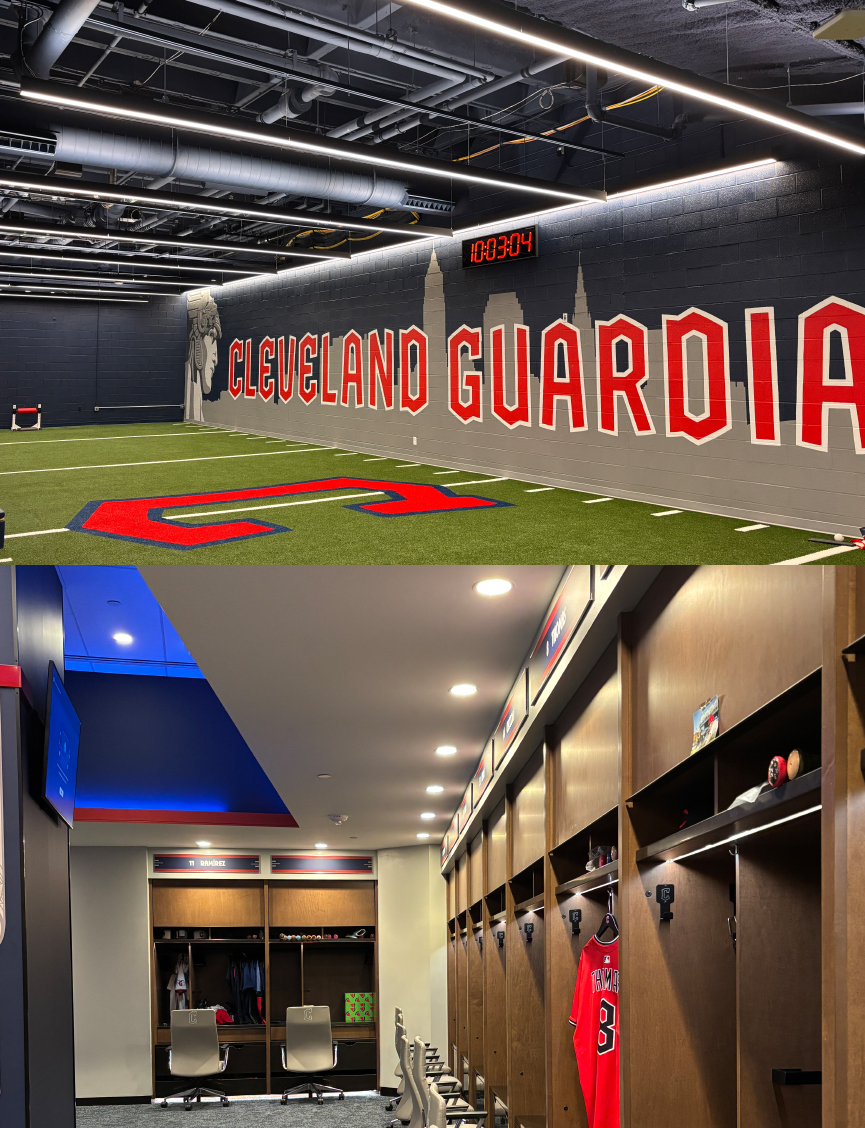
For more than 30 years, Progressive Field in Cleveland, Ohio has hosted Cleveland Guardians fans through the highs and lows of Major League Baseball. In recent years, the stadium has been reimagined to improve the comfort and experience of the team’s loyal supporters. In 2025, the team’s focus shifted inward with an expansion of the renovation program to support the needs of the players.
Working with lighting agency Lighting and Controls, lighting designer Zinkon Creative, and architect Moody Nolan, the Guardians embarked on a renovation of the team’s clubhouse, including locker rooms, amenity areas, and other indoor spaces reserved for players and staff. The goal of the lighting design was to dramatically improve the team’s clubhouse environment to support the team’s success. That included lighting solutions that support health and well-being, and maintain a clean, contemporary aesthetic.
The team selected lighting and controls from Cooper Lighting Solutions, a Signify business. Lighting solutions included brands Corelite and Portfolio, both integrating BioUp technology, Fail-safe, HALO, Metalux, and NeoRay.
The result is a cohesive and considered environment that supports players before they take to the field and as they recover afterwards. The lighting integrates seamlessly into the interior design, helping the space feel purposeful and supporting players all the way up to the all-important moment when they step out onto the field.
“We specified Cooper Lighting for the Cleveland Guardians stadium because their broad, high-quality product portfolio could address the venue’s diverse spaces, and we trusted their team and BioUp technology to reliably deliver a sophisticated circadian lighting strategy at scale.”
Ardra Zinkon, CLD, IALD, President & Director of Lighting Design, Zinkon Creative
5 Sustainability Statements
Introduction
2025 was a critical year for Signify, marking the conclusion of our five-year Brighter Lives, Better World 2025 program. It was a moment to reflect on the progress we have made across climate action, circularity, brighter lives, and diversity. Despite the uncertainty that continued to shape the year in terms of geopolitical instability, global trade tensions and growing social vulnerabilities, we remained determined and focused, delivering meaningful impact through our sustainability commitments.
This year, we achieved several important milestones. Our portfolio of sustainable products continued to grow at pace, and we reached our climate action and circularity targets ahead of schedule-an accomplishment that reflects both our sustained investment in innovation and increased demand from customers seeking products that lower energy use, reduce emissions, and extend product lifetimes. Thanks to our solutions, we contributed to 148 million tonnes CO2 avoided emissions in 2025. And as global debates on energy security intensified, the essential role that efficient lighting can play in reducing energy demand became increasingly clear.
Since 2020, Signify has completed over 37,000 projects with cities across the globe, helping over 10,000 local auctorities to switch their lighting systems from conventional to connected LED.
We are also proud to celebrate a major milestone for the Signify Foundation, which succeeded in supporting over 10 million lives before its 2025 target. Through projects that bring light to underserved and remote communities, the Foundation demonstrated once again how access to sustainable lighting can improve safety, education, health, and economic opportunities.
As we close our 2025 program cycle, we take pride in the progress made over the past five years. We accelerated the transformation of our business and helped advance a more energy efficient, sustainable world—one where light improves lives and contributes to the protection of our planet’s ecosystems. Looking ahead, we remain committed to pushing boundaries, scaling innovations, and deepening our contributions to society. Together, we will continue to unlock the extraordinary potential of light for brighter lives and a better world.
This chapter is closely structured as subscribed by the European Sustainability Reporting Standards (ESRS). Some information related to the general business and strategy, governance, incentives, remuneration and risk management are included in other chapters of this report and incorporated by reference. In section 5.6,Disclosure requirements and incorporation by reference, we provide an overview of where all ESRS disclosure requirements are reported. We start our sustainability statements with an update of the progress of our Brighter Lives, Better World 2025 program.
5.1 Brighter Lives, Better World 2025 progress
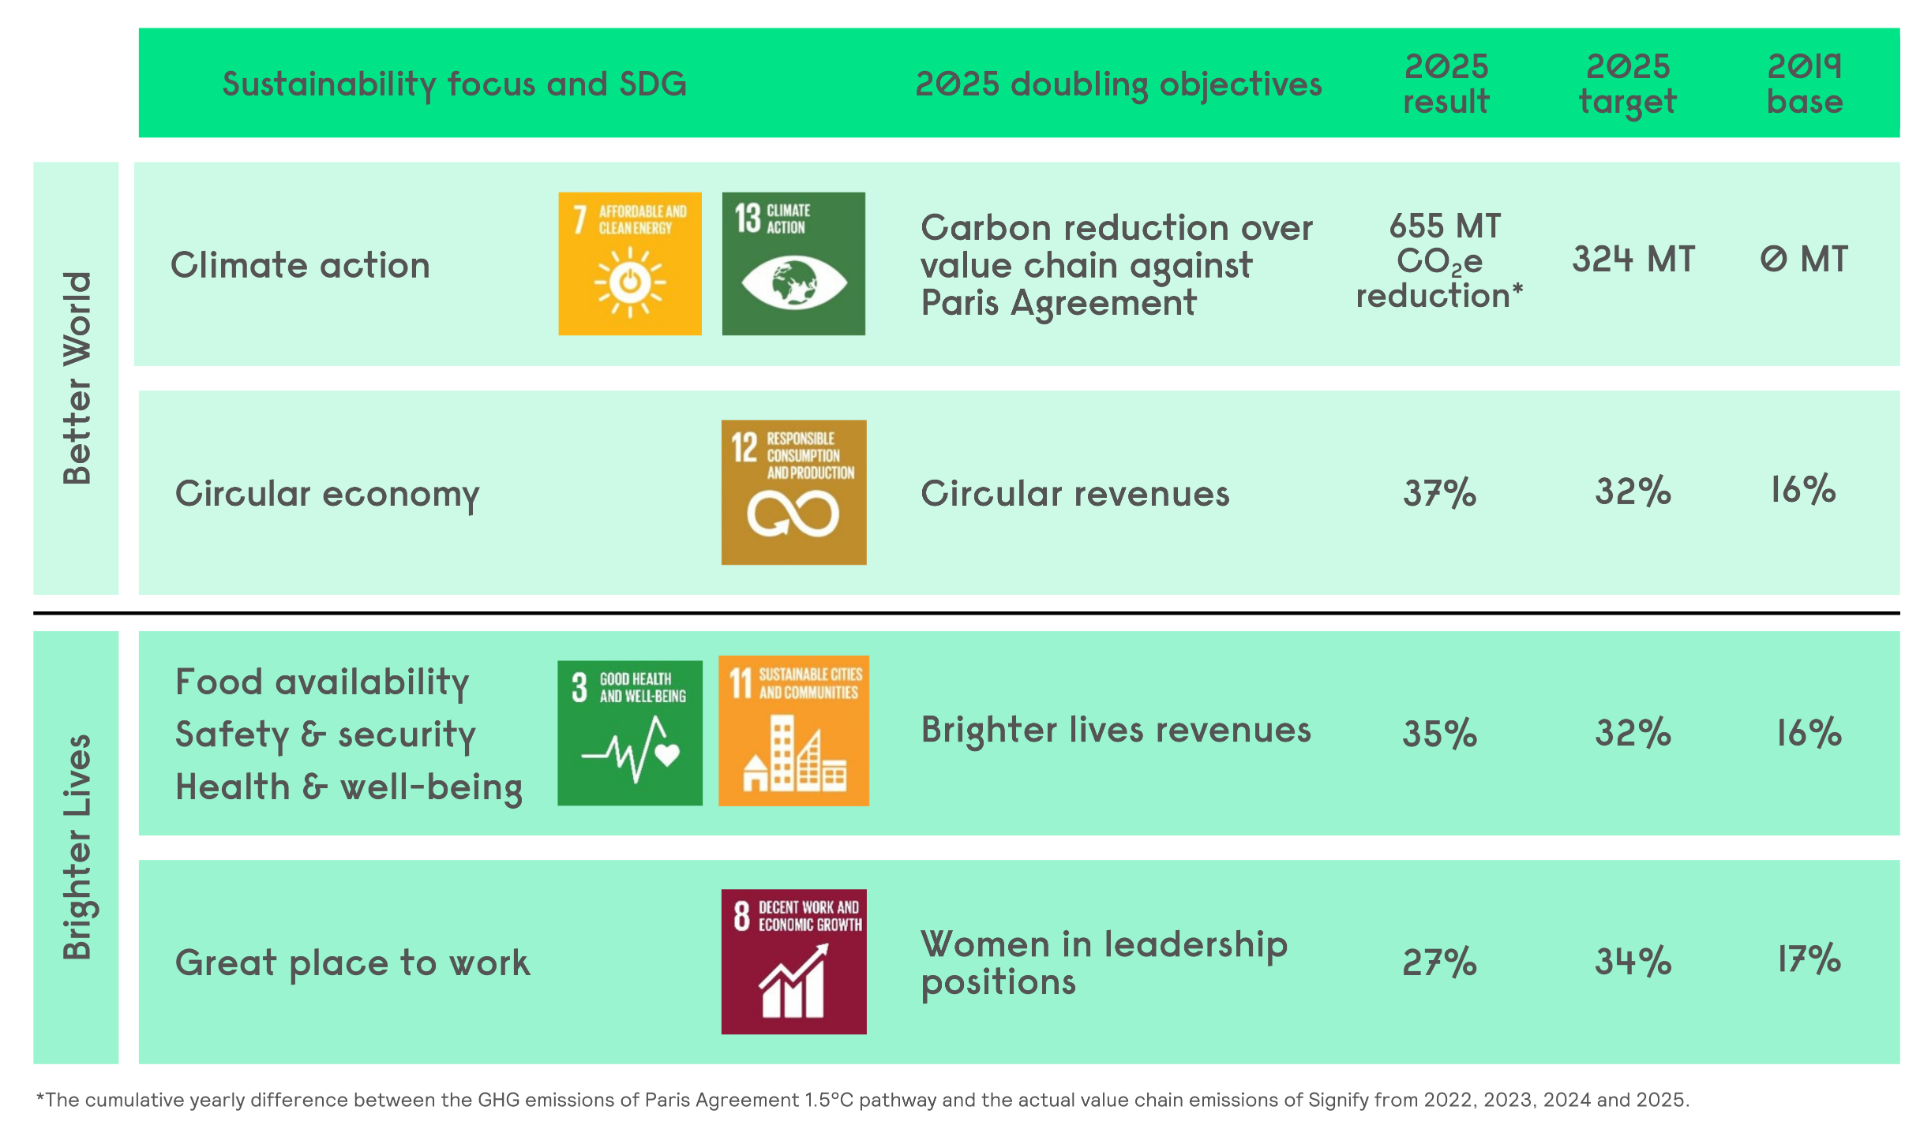
Our sustainability commitments are structured under our Brighter Lives, Better World 2025 program. Launched in September 2020, the program comprises a set of doubling commitments covering a five‑year period through the end of 2025, with 2019 serving as the baseline year. The year 2025 represents the fifth and final reporting year of this program. Building on the achievements of Brighter Lives, Better World 2025, we are now preparing to launch our next five‑year sustainability program, which will set a new level of ambition to accelerate our positive impact towards 2030. |
General basis for preparation
BP-1 - General basis for preparation of sustainability statements
Signify aims to provide stakeholders with complete and transparent information on its sustainability programs, performance and progress against goals, and key challenges. The Sustainability Statement is prepared in accordance with Part 28 of the Companies Act 2014 and in compliance with the European Sustainability Reporting Standards (ESRS) issued by the EU Commission in accordance with the Corporate Sustainability Reporting Directive (CSRD) 2022/2464/EU.
The consolidated sustainability statement includes the sustainability statement of Signify N.V. and its consolidated subsidiaries (hereafter referred to as "Signify", or "the company") for the reporting year ended on December 31, 2025. The scope of the consolidated sustainability statement is the same as for the consolidated financial statements, see Interest in Entities in chapter 15, Consolidated financial statements, note 11, Interest in entities for further information.
The sustainability statement scope covers our entire value chain including our own operations. New ventures and acquisitions acquired by Signify during the reporting year will be included in our environmental and social disclosures in the reporting year. Divestitures completed before December 31, 2025, are included in environmental and social reporting up to the date of disposal. In 2025, there were no new acquisitions or divestitures. In cases where data is not yet available, estimation methods have been used. An overview of the data definitions, measurement methods, estimations, and any uncertainties inherent in the measurements can be found in section 5.5, Reporting principles. We did not exclude any information related to intellectual property, proprietary know‑how, innovation outcomes, or matters currently under negotiation.
Our external auditor, EY Accountants B.V. (EY), has provided reasonable assurance on the KPIs: "Total Greenhouse gas emissions (scope 1, 2 and 3)", "Brighter lives revenues", "Circular revenues" and "Percentage of women in leadership". These KPIs represent the 2025 results of our Brighter Lives, Better World 2025 program doubling commitments. EY has also provided limited assurance on our sustainability statements in chapter 5, Sustainability statements. For the respective assurance statements, refer to section 17.2, Assurance reports on the sustainability statements 2025.
Section 5.6, Disclosure requirements and incorporation by reference of this chapter includes a GRI Content Index and an ESRS mapping indicating the disclosures made by reference in other chapters. For information incorporated by reference, a disclosure code has been added at the end of the relevant sentence. All policies referenced within this statement are publicly available through our website at www.signify.com/global.
In 2025, Signify reaffirmed its commitment to the United Nations Global Compact, to advance its 10 universal principles in the areas of human rights, labor, the environment, and anti-corruption efforts. This report serves as our annual Communication on Progress (COP) towards abiding by these principles. We report our contribution to six SDGs where we believe we can make the greatest impact: Good health and well-being (3), Affordable and clean energy (7), Decent work and economic growth (8), Sustainable cities and communities (11), Responsible consumption and production (12) and Climate action (13). We also respond annually to the CDP Climate questionnaire and make our disclosure publicly available.
Specific circumstances
BP-2 - Disclosures in relation to specific circumstances
Regarding the specific circumstances of our reporting approach, the following elements were considered for each topic. Further details are provided in section 5.5, Reporting principles.
Time horizons alignment with the ESRS: all topics and assessments follow the ESRS time horizons unless otherwise specified in the respective topical sections: short-term is within one year, medium-term is between one to five years and long-term if more than five years.
Value chain estimation: we currently use estimates for the following metrics:
E1, Climate change, GHG emissions
E5, Resource use and circular economy, inflows and waste
S1, Own Workforce
Details on the estimation methodology, basis for preparation, our plans to transition towards actual data are provided in the reporting principles and the resulting level of accuracy is described.
Data uncertainty: we have identified data uncertainty in our GHG emissions for Scope 3, Category 11 - Use of sold products, Inflows and Waste data and our Own workforce employee data. These uncertainties and estimation approaches are addressed in the reporting principles, with further details on the sources, assumptions and approximations.
Forward-looking uncertainty: forward-looking statements are based on certain assumptions and analyses we make in light of our experience and our perception of historical trends, current conditions, expected future developments and other factors we believe are appropriate given the circumstances.
Changes from the previous reporting and comparative information: any changes to data calculations or estimation methods are disclosed in the reporting principles. We retain performance data from previous years if the data remains comparable. If the previous definition is not comparable, we excluded the historical data from the report. For new metrics, historical data is not disclosed.
Validation of data: data and metrics provided for material IROs are not validated by any external body other than our assurance provider.
Reporting errors: no reporting errors from previous periods were identified.
Reporting risk management and controls
GOV-5 – Risk management and internal controls over sustainability reporting
Signify's sustainability reporting cycle and processes are aligned with the business principles and statutory reporting policies. Risk management and internal controls are incorporated within the Signify Business Control Framework. Each year, we conduct a risk assessment of our reporting process to identify the most material risks and define appropriate controls. This process is jointly led by the Sustainability team and the Internal control team and is compliant with the COSO framework.
The primary risks identified relate to the accuracy and completeness of data collection, particularly concerning environmental metrics. To address these risks, we have implemented controls within the software and tools used to collect prioritized data points. A roadmap for future control implementation has been established, based on the prioritization of material topics. The prioritization is determined by assessing the severity and scale of the risks. The Sustainability team and Internal Control team jointly evaluate these risks and propose areas of focus for annual improvement projects.
The controls for sustainability reporting are integrated in the internal control platform, where they are actively monitored. The accuracy and completeness of data for our prioritized topics and metrics are assessed annually. Where issues persist, corrective actions are implemented, logged and documented. The Audit Committee of the Supervisory Board provides oversight for the system of internal business controls and risk management. The governance model is described in section 13.1, Establishing a strong risk management environment.
Sustainability governance
GOV-1 - The role of the administrative, management and supervisory bodies, GOV-2 - Information and sustainability matters addressed by governing bodies
General governance information regarding the Board of Management and the Supervisory Board is available in the governance chapters of this report. Additional details on sustainability governance are provided in the following paragraphs.
The Board of Management is responsible for driving sustainable long-term value creation for the company. The two members of the Board of Management are the Chief Executive Officer (CEO) and the Chief Financial Officer (CFO). Our new CEO, As Tempelman, brings deep sustainability expertise from his previous leadership roles in the energy sector, where he drove ambitious climate initiatives and significantly reduced emissions while leading the company. The CFO brings extensive experience and expertise in our business, industry and material IRO topics, having served as a leader of Signify for many years. The Board of Management is tasked with designing a strategy in pursuance of our long-term value creation vision and relevant targets. The Supervisory Board is involved in shaping this strategy and oversees its implementation by the Board of Management.
Sustainability is an inherent part of the company’s overall strategy and a key business driver. Accordingly, both Boards consider relevant sustainability aspects – including impacts, risks and opportunities – when designing and overseeing the strategy. The same applies when considering major transactions and the company’s risk management process.
The responsibilities of the Board of Management include preparing the outcome of the double materiality assessment (DMA) in accordance with the CSRD, and overseeing the impacts, risks and opportunities associated with material sustainability topics identified through this process. The Supervisory Board supervises and advises the Board of Management regarding the process of preparing the DMA. These responsibilities are outlined in the Rules of Procedure for both the Board of Management and the Supervisory Board, which are available on the company’s website. While there is no formal employee representation on the Boards, Signify has established processes and engagement mechanisms to ensure regular dialogue between workers representatives and the Boards throughout the year.
Signify’s sustainability program, Brighter Lives, Better World 2025, is embedded in our purpose and integral to our strategy and the way we do business. The program and its associated targets are discussed in more detail in section 5.1, Brighter Lives, Better World 2025 progress. These targets were set by the Board of Management, and progress is reviewed quarterly by both the Audit Committee and the Supervisory Board. Additional Impacts, risks and opportunities (IRO) targets are proposed by relevant function leads.
Subsequently, these IRO targets are set and reviewed quarterly by the Board of Management when included in departmental strategic initiatives. Each specific committee and lead departments have action plans defined in alignment with the targets. The Chief Strategy, Sustainability and Marketing monitors performance against these plans and targets in collaboration with the relevant function leads. Progress and challenges are discussed when necessary and mitigation actions are implemented. Activities related to sustainability topics undertaken by the Supervisory Board and its Audit Committee in 2025 are discussed in chapter 9, Supervisory Board report.
The results and effectiveness of the policies and action plans in place addressing our material IROs, as well as the implementation of due diligence processes are monitored by the management of the respective functions- such as HR, Sustainability, and Procurement. These management teams update the Board of Management as needed, and corrective actions are taken when necessary. All actions are documented and tracked accordingly.
In 2025, the Board of Management prepared the double materiality assessment, which was presented to the Supervisory Board. More information on the assessment and the identified material sustainability topics is provided in the double materiality section and the respective topical sections.
Our organization is committed to effectively managing the impacts, risks, and opportunities associated with our operations. To support this commitment, we have implemented specific controls and procedures that integrate these elements across our internal functions. These include:
An annual double materiality assessment
Due diligence processes
Ongoing impact management and data collection for material IROs
Clear ownership of material IROs by designated functions and leads
External assurance, certifications, and internal audits
Each function lead is responsible for overseeing the controls and procedures related to their material IROs.
We communicate our sustainability program initiatives and achievements on a quarterly basis to Signify employees and share updates on our website for external stakeholders. Sustainability programs are embedded in the Signify organization and ways of working. Departments actively implementing these programs include sales, innovation, manufacturing, procurement and logistics.
The sustainability reporting cycle is managed by the Sustainability team in close collaboration with all relevant departments. The ESG Reporting Steering Committee oversees the annual ESG reporting strategy and progress on objectives throughout the year in half-yearly meetings. These meetings also include updates on risks assessments and the prioritization process for ESG reporting. The Committee is comprised of senior representatives from the following functions: Finance, Accounting, Digital, Procurement, and Sustainability.
Incentives
GOV-3 – Integration of sustainability-related performance in incentive schemes
Signify has adopted a sustainability-related target into its incentive structure, as defined in the Remuneration Policy. Sustainability targets account for 25% of the long-term incentive metric. More details on incentive structures and performance alignment can be found in chapter 10, Remuneration report.
Due diligence process
GOV-4 - Statement on due diligence
At Signify, due diligence is integral to our commitment to responsible business practices, aligned with the OECD Guidelines for Multinational Enterprises, UN Guiding Principles on Business & Human Rights and increasingly with the EU Corporate Sustainability Due Diligence Directive (CSDDD). Our comprehensive due diligence framework addresses both human rights and environmental impacts, ensuring we meet regulatory requirements and adherence to our ethical standards. The process as defined in our Human Right Policy covers our own workforce, workers in the value chain, consumers, affected communities, and business partners.
We conduct annual risk assessments to identify and mitigate potential adverse impacts across our value chain. This includes evaluating our own operations and those of our suppliers, focusing on environmental management systems and compliance with international standards. These standards encompass fair labor practices, environmental protection, and anti-corruption measures. Regular audits and assessments are conducted, and any non-compliance is addressed through corrective action plans. The due diligence core elements are fully integrated across all businesses and operational processes. Additional details on our human rights due diligence process is provided in the S1 and S2 sections.
Element of Due Diligence | Section | Page |
|---|---|---|
Embedding due diligence in governance, strategy and business model | General business governance | 30-31 |
Engaging with affected stakeholders in all key steps of the due diligence | Interest and views of stakeholders | 35 |
Identifying and assessing adverse impacts | Double materiality assessment for all material topics | 36-41 |
Taking actions to address those adverse impacts | E1 – Climate change | 44 |
Tracking the effectiveness of these efforts and communicating | S1 – Own workforce | 75 |
Strategy, business model and value chain
SBM-1 – Strategy, business model and value chain
With a legacy spanning more than 130 years, we have consistently been at the forefront of lighting technological advancement and innovation. Our strategy and business are outlined in chapter 3, Business and strategy.
For details on our principal markets, refer to the revenue per country table in chapter 15, Consolidated financial statements, note 2, Information by segment and main country. Our customer groups are aligned with our businesses described in chapter 3, Business and strategy, namely Professional, Consumer, OEM and Conventional. Some conventional lighting products are banned in the EU, the US and Australia due to regulations regarding incandescent, fluorescent and halogen lamps in relation to energy efficiency requirements. These products are sold in limited quantities in other markets where regulations do not apply.
Signify’s main activities are related to the Manufacturing of Electronics and Electronic Equipment (MEL) with NACE sectors and respective revenues as follows:
C.27.40 Manufacture of electric lighting equipment (97.6% of revenues in 2025);
F.43.21 Electrical installation (0.4% of revenues in 2025);
N77.40 Leasing of intellectual property and similar products, except copyrighted works (2% of revenues in 2025).
Summary information on sales, regional breakdown, and business segment performance is provided in chapter 1, Performance highlights. Our activities under NACE code C.27.40 are classified as having a high climate impact. In 2025, our total revenue amounted to EUR 5.765 billion. For further details on related revenues, see chapter 15, Consolidated financial statements, note 3, Income from operations.
Core to our business is sustainability – we are committed to delivering energy efficient, serviceable, and upgradeable lighting products that enhance visibility, well-being and performance for businesses, cities, and consumers, aiming to reduce global electricity consumption from lighting. This is achieved by fostering a sustainable value chain built on circular solutions that promote longevity, repairability, and recyclability. By offering sustainable lighting products, systems, and services, we enable our customers to make more sustainable choices.
Our product portfolio is categorized according to climate, circular and social attributes, as well as EU Taxonomy requirements. Further details are available in section 5,1, Brighter Lives, Better World 2025 progress, and in subsection 5.2.3, EU Taxonomy. Potential material impacts, risks and opportunities related to our NACE sectors are identified through our double materiality assessment, with the exception for our activities related to the leasing of intellectual property, which does not present any potential material IROs for the business.
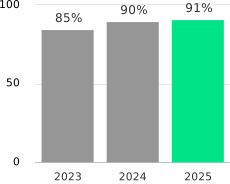
As a company driven by innovation, we invest significantly in product design. This dedication was rewarded in 2025 with 11 Red Dot Awards and 8 iF Awards. We lead the LED lighting industry with 20,400 patents, serving a market where LED products represent 91% of our sales. Additionally, we are the global frontrunner in connected lighting for homes, cities, and workplaces, with 160 million connected lighting points worldwide.
The strategic context outlined in chapter 3, Business and strategy provides an overview of the current priorities and focus for our strategy and sustainability ambitions. It also addresses the challenges faced by our business in recent years and how these were managed. Further details on these challenges are discussed in the material topics sections, reflecting their impact on strategic decisions.
Our sustainability program, Brighter Lives, Better World 2025 is described on page 28. The program’s targets span the entire product lifecycle - from design to end-of-life and reflect our engagement with customers, suppliers, public authorities, communities and investors. Through our Brighter lives revenues and Circular revenues targets, we assess the alignment of our products and services across markets and customer segments, and report progress quarterly.
Our value chain
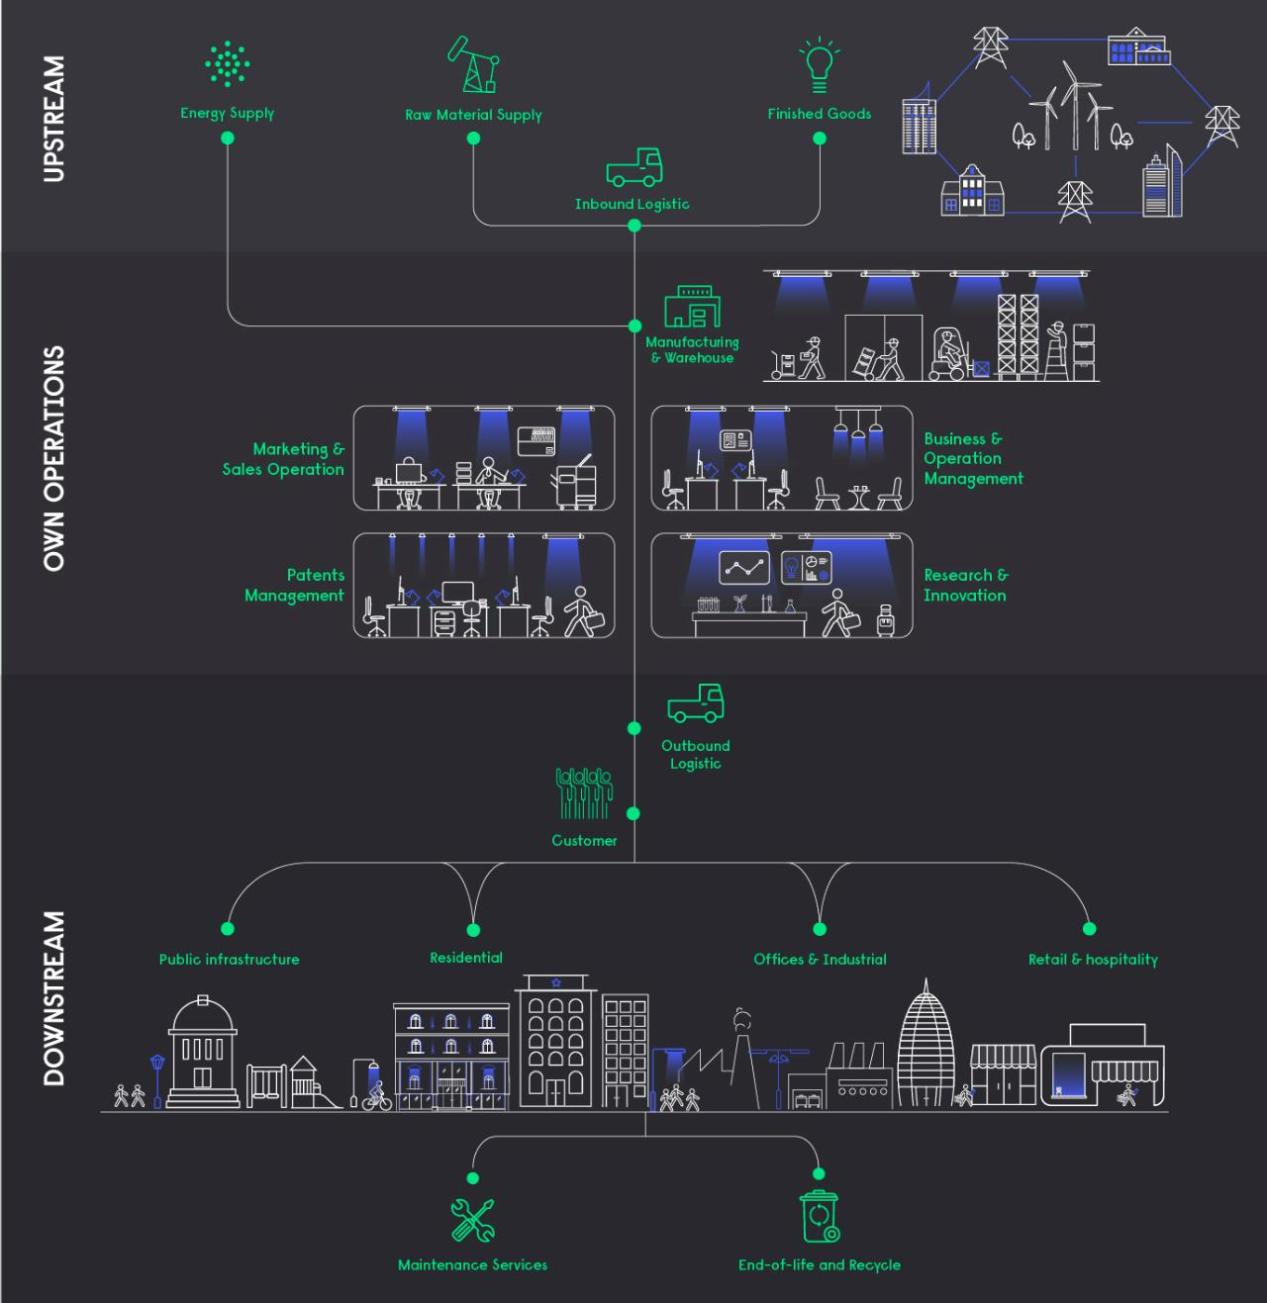
This diagram describes our value chain activities related to the manufacture of electric lighting and electrical installation. We have excluded the leasing of intellectual property.
Given our broad portfolio of products across multiple brands, Signify operates a complex global supply chain aligned with our corporate strategy and sustainability program. We categorize our supply chain into three groups: product-related, indirect and freight & distribution.
Product-related suppliers account for approximately 60% of our total supplier spend, covering essential commodities such as electronic components, aluminum, steel, plastics, and packaging materials. Suppliers are primarily located in Greater China, followed by Europe and the Americas;
Indirect services suppliers represent 30% of spend. These include temporary labor, business services, equipment, storage, and office service providers. They are mainly based in Europe, followed by the Americas;
Freight & distribution suppliers represent 10% of spend. Signify coordinates transportation between manufacturing sites and warehouses with business partners. Our sites and warehouses are located in countries where most of our suppliers operate, with the majority located in the Americas and Europe.
More details on our suppliers can be found in section 5.3.2, S2, Workers in our value chain.
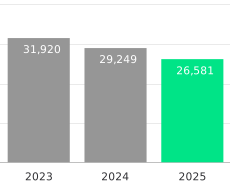
Our operational activities are carried out across manufacturing sites, warehouses and offices, primarily located in North America, Europe and South and East Asia. Signify employs 26,581 FTEs globally with 43% in Asia & Pacific, 28% in Europe, 27% in the Americas and 2% in Africa & the Middle East. Across the organization, approximately 53% of employees were employed in Operations, 24% were employed in Commercial functions and 14% in Innovation, Research and Development. The remaining 9% worked in Corporate functions.
More details on our workforce available in section 5.3.1, S1, Own workforce.
Our products reach a diverse range of customers globally through multiple channels. Key customer groups include retailers, distributors and wholesalers, installers and contractors, professional end-users, corporate and system integrators (CSIs), original equipment manufacturers (OEMs), public services and cities. These customers serve various end-market segments such as residential, office and industrial spaces, retail and hospitality environments, and public infrastructure. This broad network ensures that our solutions contribute to sustainable lighting and energy efficiency across homes, businesses, and communities worldwide.
Our products are delivered to customers through collaboration with installers and logistic partners. For outdoor lighting installations, potential impacts on local communities are assessed in consultation with customers and engagement with community representatives is conducted when deemed necessary. During the design phase, our products undergo rigorous quality testing, and our research and innovation teams ensure compliance with all health and safety requirements.
Post-sale, our customer support team remains the primary contact point for assistance, maintenance services, product recalls, and more. For professional services, we offer tools, training and support to help bring lighting projects to life.
At the end-of-life, Signify partners with local organizations to refurbish and recycle products, primarily in Europe under the Waste Electrical and Electronic Equipment (WEEE) regulations. For professional lighting, end-of-life management can be included in customer contracts, where we commit to replacing fixtures or bulbs and reusing the returned products and materials.
Sustainable Innovation
Innovation is an important pillar of Signify's purpose and our R&D drives investments toward our material IROs. Our sustainable products and systems must demonstrate proven measurable benefits in one or more of the following eight sustainable focal areas (SFAs).
Our five Better World SFAs:
Energy & solar – increasing energy efficiency of products, systems and services, and solar systems and solutions;
Circularity – optimally preserving value and avoiding waste via serviceable luminaires, circular components, intelligent asset management, and circular services;
Packaging – reducing packaging weight and volume, increasing recycled material in the packaging, eliminating the use of fossil-fuel based plastics in the packaging of consumer products, and optimizing transportation efficiency;
Substances – eliminating harmful substances;
Weight & materials – reducing product weight, selecting recycled and/or renewable materials.
Our three Brighter Lives SFAs:
Safety & security – providing light that has a positive effect on reducing crimes such as burglary and theft in cities and houses, increases safety in traffic and protection against cybercrime;
Health & well-being – designing light to support health, well-being, and performance of humans, animals and wildlife with visual, biological, and emotional benefits of light;
Food availability – providing light that enables the production of more and better-quality food, while optimizing the use of land, water and energy and avoiding the use of pesticides.
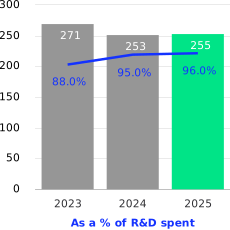
Our sustainable innovations continue to transform the lighting industry. In 2025, we invested EUR 255 million in sustainable innovation which represents 96% of Signify R&D expenses (2024: 95%). We believe that sustainable innovation will help create an increasingly future-proof and purposeful portfolio of products, systems and services.
Interest and views of stakeholders
SBM-2 – Interests and views of stakeholders
Capturing perspectives from a diverse range of stakeholders enables us to gain broader insights into our impact and contributes to the definition of our future strategy and plans. Signify engages regularly with its strategic stakeholders; those most likely to be impacted by our activities and have the greatest influence on achieving our commitments. We use a variety of engagement channels tailored to each stakeholder group. Each engagement process is owned by a relevant department, which leverages the input and feedback received. This input is also used to inform our double materiality assessment. The table provides an overview of the engagement topics discussed with each stakeholder group and how these insights impact the strategy.
The Supervisory Board is updated annually on sustainability-related insights collected from key stakeholders through discussions on material topics. These insights are integrated into relevant action plans and strategies, which are presented to both the Board of Management and Supervisory Board as relevant.
One area identified for improvement is engagement with local communities. Currently, Signify gathers input through market partners and local teams. By 2027, we aim to expand our engagement with local community representatives and the Signify Foundation. This engagement is not expected to affect the view of these stakeholders.
Stakeholder group | Engagement type | Topics covered | Impact on strategy |
|---|---|---|---|
Employees | Employee Team survey, workers representatives, compliance ethics channel, local townhalls. | Health & safety, well-being, diversity, equity & inclusion, working conditions, equal treatment, sustainability objectives, new busines strategy, new CEO onboarding. | Health & safety annual awareness week and focus engagement on the total recordable case rate target, diversity, equity & inclusion roadmap, new well-being program and new recognition process, equal pay assessment, employee Net Promotor Score, sustainability quarterly webcasts content, engagement campaigns, input for materiality assessment. |
Customers / Consumers | Business development, consumer panels, customer Net Promoter Score Survey, customer project development. | Satisfaction rates, fluctuation in energy availability and cost, environmental product declaration and life cycle assessment, ESG performance, sustainability targets, due diligence. | R&D investment, awareness campaigns on sustainable principles in products, Brighter lives and Circular revenue targets, regional approach to increase sales for more sustainable products, due diligence process. |
Suppliers | Supplier onboarding, quality improvement projects, cooperation in industry working groups, strategic commodity management. | RBA audit program, ESG performance, peer learning. | Audit program improvement, prioritized topics for engagement and trainings, increased data accuracy and collection from suppliers. |
NGOs | Partnerships with NGOs, cross sector (multi-stakeholder) projects, social investment program, Signify Foundation, fundraising and donation campaigns. | Social impact of light and regional context, sustainable operations, growth for sustainability. | Target and progress on social impact of light and Lives Lit target, input for materiality assessment. |
Public authorities | Annual innovation experience, research projects, advocacy activities, Signify Switch programs and Signify circular framework. | Sustainable cities and buildings, energy efficiency, renovation policy, sustainable innovation, circular lighting, ESG reporting. | Focus on sales and marketing for relevant market, implementation of the public policy and advocacy policy, engagement on ESG reporting and due diligence debates. |
Investors | Virtual roadshows, (ESG) investor conferences and 1-1 meetings, investor webcasts, investor relations website, investor perception study. | Strategic alignment sessions, ESG performance, sustainability targets and progress. | Alignment on priority topics, financial quantification of sustainability risks, TCFD and TNFD progress, CSRD and EU Taxonomy, Human rights and due diligence. |
Research / Academic | R&D projects, student learning projects. | Energy efficiency, innovation, climate risks. | Contribute to innovation projects, provide input for new reporting topics and standards. |
Peers / Industry associations | Industry associations meetings, peer network groups, memberships, conferences and association newsletters. | Climate, nature, human rights and due diligence, energy crisis, lighting market, ESG reporting standards. | Insights in upcoming trends and preparation needed, alignment on reporting best practices, peer learning and trainings. |
Double materiality assessment
IRO-1 – Description of the processes to identify and assess material IRO, IRO-2 - Disclosure requirements in ESRS covered by the sustainability statement
The Double Materiality Assessment (DMA) is reviewed annually to reflect changes that impact our activities across the value chain, as well as key internal business developments. The objective is to review and confirm the list of material topics related to Signify’s actual and potential impacts on the environment and society, along with the associated risks and opportunities for our strategy and business model.
The assessment covers the entire value chain, considering both direct and indirect impacts. It examines actual and potential, positive and negative impacts, as well as risks and opportunities. The due diligence process is integrated into the steps of this assessment. For more details, please refer to the due diligence table in this section, page 31.
In 2025, we reviewed both the long list and short list of material topics and conducted desk research on peers, customers, and investors to benchmark and validate our approach. We also refined the magnitude criteria used in our financial risk assessment by incorporating quantitative figures.
Every three years, we conduct a full assessment and engage with external stakeholders to gather their input and perspectives before scoring the shortlist of topics. The most recent full assessment was conducted in 2023, with the next scheduled for 2026. The methodology and process are described in the following five steps.
We began the process by reviewing our value chain mapping, which outlines Signify’s activities, business relationships and key stakeholders. This mapping considers stakeholders who may be affected by our business operations, as well as those who rely on our sustainability statements. For more information on the value chain, see page 33.
We reviewed a comprehensive list of topics, drawing from the European Sustainability Reporting Standards (ESRS) and desk research focused on the material priorities of our peers, customers, and investors. Some topics were further broken down to allow for a more detailed assessment. To ensure broad internal representation, we engaged stakeholders across departments, business functions, and geographies through surveys and interviews. This process helped validate the relevance of each topic and led to a prioritized list based on stakeholder input, confirming the final shortlist for assessment.As for external stakeholders, we engage with them every three years as part of the Double Materiality Assessment (DMA). The next engagement cycle is scheduled for 2026.
The criteria and methodology used for assessing the topics relied on the same definitions and thresholds established in 2023 to ensure consistency and comparability. Each criterion was evaluated using a standardized scoring system ranging from 1 to 5, with a materiality threshold set at 2.5.
For impact, we assessed severity – defined by scope, scale and remediability for negative impacts, and by scale and scope for positive impacts – as well as likelihood in the case of potential impacts. Precedence was given to severity when evaluating human rights-related impacts.
For financial risks and opportunities, we assessed the magnitude and likelihood. The assessment considered inherent impacts and risks, without factoring in existing mitigation measures – except in the case of positive impacts, where current programs and activities were considered.
Scoring for each topic in the shortlist was informed by available data, as well as insights and input gathered from the internal stakeholders and external parties through our annual engagement process (see Interest and views of stakeholders section). For social and human rights topics specifically, we incorporated findings from our due diligence risk assessments.
Each topic and its associated scoring were reviewed and discussed with the relevant internal experts. During these discussions, we considered interlinkages between impacts, dependencies, risks and opportunities, as well as relationships between sub-topics. The following elements were taken into account: the entire value chain, actual and potential positive and negative impacts as well as risks and opportunities; affected stakeholders and the short-, medium- and long-term horizons.
We plan to strengthen our engagement with affected stakeholders in 2026 to ensure that the assessment reflects a broader range of perspectives and insights.
Following the assessment and scoring process, the list of material topics was confirmed based on the predefined thresholds. For a detailed overview of the potential and actual, positive and negative impacts, as well as risks and opportunities, refer to the table on pages 38-41.
The outcome of the assessment was presented to the ESG Reporting Steering Committee and subsequently to the Board of Management, which formally adopted the results. The double materiality assessment was also presented to the Supervisory Board, and no changes were requested. For further details, see the Sustainability Governance section above. The finalized list of material topics serves as input to our Enterprise Risk Management process (see below), and informs our annual strategic planning, which takes place in the last quarter of each year.
Following approval of the double materiality assessment, the Sustainability team prepared this section to transparently report on the process and outcomes. Disclosure requirements were defined by confirming the mandatory disclosures for each material IRO and supplementing them with voluntary information aligned with the expectations from ESG ratings and rankings (see ESRS mapping table, section 5.6, Disclosure requirements and incorporation by reference).
The outcome of the double materiality assessment was integrated into Signify’s annual Enterprise Risk Management (ERM) process. The Sustainability team collaborated closely with the Risk team to incorporate the material sustainability risks into the prioritized shortlist of ERM topics. Where relevant, specific sustainability risks were used to inform the overall risk profile of certain business activities. For more details, refer to chapter 13, Risk factors and risk management.
SBM-3 – Description of material IRO resulting from materiality assessment
The 2025 review of our materiality assessment reaffirmed the same five material ESRS, encompassing 17 material IROs. The following ESRS are in scope for this report: E1 Climate change, E5 Circular economy and resource use, S1 Own workforce, S2 Workers in the value chain and G1 Business conduct.
Topics under the following ESRS scored below the materiality threshold: E2 Pollution, E3 Water and marine resources, E4 Biodiversity and ecosystem, S3 Affected Communities and S4 Consumers and end-users. We held follow-up discussions with the teams responsible for these areas, particularly for topics that scored close to the threshold. It was agreed to closely monitor the evolution of related impacts and risks and reassess them in 2026.
Key changes from 2024 are:
E1 – Climate change: a new financial risk related to physical climate risks and severe weather events was added. This change was driven by our new automated calculations, which increased the severity score and made the risk material. Conversely, the climate transition risk associated with investment needs has been removed, as it is no longer perceived as a risk but rather as a strategic investment.
S1 – Own workforce: the topic of living wage was removed as we aligned to the CSRD definition of adequate wage this year. However, we continue to report voluntarily on living wage, which remains an internal priority.
G1 – Business conduct: topics such as corporate culture, corruption and bribery were reclassified from a potential positive impact to a material financial risk, following further internal alignment with relevant teams and the ERM process. Additionally, political engagement and responsible advocacy were newly identified as a potential positive impact, reflecting the adoption of our climate transition plan – which includes advocacy as a strategic pillar – and our strengthened efforts to support policy development on environmental and social issues.
The following tables outline the material impacts, risks and opportunities (IROs), along with high level information on the strategies and actions in place to address them. These reflect Signify’s business approach and resilience in managing these IROs. Signify is equipped to address its IROs through its existing business model and strategy. A dedicated resilience analysis has been conducted for E1 Climate Change, and the results are presented in the E1 section. The tables also provide insights into the current effects on our strategy, value chain and business model.
The current financial effects of material risks and opportunities and the allocated budgets to the IRO action plans fall below financial materiality thresholds, and as such are not disclosed in this report or in the financial statements. Specific risks with anticipated future effects are further explained in the section 15.6, Notes to the Consolidated financial statements, when financially material. The connection between our strategy and business model is further elaborated in the relevant topical sections, which also include more detailed information on related policies, action plans and metrics.
Our material IROs are aligned with the ESRS. In addition, we report Signify specific metrics from our Brighter Lives, Better World 2025 program, and supplementary metrics under E1 Climate Change, S1 Own Workforce and S2 Workers in the Value Chain. Our two entity-specific disclosures are Circular revenues (E5) and Supplier sustainability performance (S2).
IRO | IRO description | Strategy and actions | Value chain | Affected stakeholders | Time horizon | |||
|---|---|---|---|---|---|---|---|---|
E1 Climate change | ||||||||
Climate change mitigation | Emissions from manufacturing processes in own operations and in supply chain: emissions from our value chain production processes, the embedded carbon in purchased goods, and the greenhouse gas emissions generated by our own production activities. | Signify has set emissions reduction targets for its own operations and supply chain, reaching 90% reduction by 2040. We have adopted a Climate Transition Plan and have programs in place to meet this target through our own operations activities and with our suppliers. |
| Customers and consumers Communities | Short and Medium-term | |||
Climate change mitigation | Product use phase emissions: emissions avoided during the use phase of sold products, thanks to the development of energy efficient solutions. | Our energy efficient products contribute to reducing energy consumption and associated emissions, leading to a positive impact during the use phase. This positive impact contributes directly to our Scope 3 reduction target and supports our strategic objective to innovate with increasingly energy efficient solutions. |
| Customers and consumers | Short, Medium and Long-term | |||
Climate change mitigation | Product use phase emissions: growth in the energy efficient products market due to increased societal awareness of the challenges of the climate crisis leading to a shift in consumer preferences and prompting new policy developments. | Leverage the growing demand for energy efficient products by continuously innovating and expanding our portfolio to address evolving market needs. We capture opportunities by investing in sustainable technologies ensuring our offerings align with customer priorities while driving growth and reducing environmental impact. |
| Customers and consumers | Short and Medium-term | |||
Climate change adaptation | Climate risks preparation for our own operations and supply chain: climate-related physical risks, such as severe weather events, pose potential threats to both our own operations and those of our supply chain. These disruptions could result in financial risks associated with our assets and production capabilities. | Signify addresses climate-related physical risks by enhancing the resilience of its value chain against severe weather events. We take proactive measures such as diversifying suppliers, and implementing adaptive risk management practices to minimize disruptions, safeguard production, and ensure consistent supply chain performance. |
| Investors | Short, Medium and Long-term | |||
Energy | Energy management in product use phase: designing energy efficient products helps Signify to mitigate climate change by reducing energy consumption throughout our products lifetime. | We deliver highly energy efficient lighting solutions that significantly reduce energy consumption during their use phase. Actively advocating for the transition to a green energy grid, amplifying the positive impact of our products by aligning reduced energy consumption with cleaner energy sources, while continuing to innovate and expand our portfolio with increasingly efficient products. |
| Communities | Short, Medium and Long-term | |||
 | ||||||||
E5 Circular economy and resource use | ||||||||
Inflows | Materials and finished products from suppliers: the extraction of primary raw materials for our product manufacturing is linked to our suppliers' production processes, contributing to the depletion of virgin resources and posing environmental risks such as pollution, deforestation, land use change, and biodiversity loss. | Collaborate closely with suppliers to source sustainable materials, promote recycling and reuse, and integrate circular design principles into our products - minimizing waste and reducing the environmental footprint of our supply chain. |
| Communities | Short and Medium-term | |||
Inflows | Materials and finished products from suppliers: rising prices of virgin materials due to challenges with availability, along with the higher costs of sustainable alternatives, present a financial risk due to increased procurement expense. | As part of our procurement processes, we monitor the costs and availability of virgin materials. To mitigate associated risks, we consider and, where feasible, use alternative sustainable materials in alignment with our circularity principles and procurement guidelines. |
| Customers and consumers | Short and Medium-term | |||
Outflows | Products with circular principles: by implementing circular principles in the design of our products, Signify enhances product circularity, which reduces end-of-life waste and minimizes negative environmental impacts. | Prioritize circular design, expanding the use of sustainable materials, collaborate with partners to establish robust recycling programs, and innovate solutions that align with circular economy principles and support the transition to a more circular economy. |
| Customers and consumers Nature | Short, Medium and Long-term | |||
Outflows | Products with circular principles: growing customer interest and evolving policies are driving increased demand and market opportunities for circular products and services, creating a financial opportunity for Signify. | Capturing market growth by expanding our portfolio of circular products, investing in innovative technologies, and forging partnerships that advance circular economy initiatives - ensuring we meet customer needs while driving revenue growth. |
| Customers and consumers Nature | Short, Medium and Long-term | |||
Waste | Waste management in our own operations: waste generated from our manufacturing and distribution activities can lead to environmental contamination, regulatory non-compliance, and increased operational costs if not well managed. | Committed to minimizing waste generation and enhancing recycling efforts. By implementing waste reduction strategies, optimizing production processes, and adopting circular economy principles, we aim to mitigate environmental impact while improving operational efficiency and sustainability. |
| Communities | Short and Medium-term | |||
| ||||||||
S1 Own workforce | ||||||||
Health and safety | Health & safety: potential risk of incidents and injuries within our manufacturing and distribution environments, which could impact employee safety and operational continuity. | Signify has robust processes and programs designed to protect our workforce and contractors. By fostering a culture of safety, providing regular training, and implementing stringent compliance measures, we ensure a safe working environment and mitigate risks across all operations. |
| Own workforce | Short, Medium and Long-term | |||
Talent and development | Talent and development: a shortage of talent and critical skills presents a financial risk, potentially leading to increased attrition costs, loss of specialized knowledge, difficulties in meeting evolving workforce expectations, and challenges in managing disruptions caused by changes in workforce location. | Strong focus on proactive workforce planning, strategic talent development, and fostering a culture of learning and innovation. By investing in upskilling and reskilling programs and creating an inclusive workplace that attracts and retains diverse talent, we ensure our organization remains agile and well-positioned to address evolving market demands and maintain operational excellence. |
| Own workforce | Short, Medium and Long-term | |||
Diversity, equity and inclusion, and gender equality | DE&I and gender equality: inclusive and equitable workplace practices foster inclusive leadership and a diverse workforce, cultivating a sense of belonging and equal opportunity that supports mental well-being. | By fostering an inclusive culture, implementing equitable policies, and actively promoting representation in leadership, Signify aims to create opportunities for underrepresented groups and empower a diverse workforce to thrive and contribute to our collective success. |
| Own workforce | Short, Medium and Long-term | |||
S2 Workers in the value chain | ||||||||
Working conditions Negative impact (potential) | Working conditions: potential negative impact on workers in the value chain due to poor working conditions, including excessive working hours, inadequate wages and benefits, and inadequate health and safety practices, which can harm workers’ well-being and pose reputational and operational risks. | Robust supplier engagement and ethical sourcing practices are implemented through regular audits, compliance checks, training and partnerships. Ensure adherence to fair labor standards, adequate wages, reasonable working hours, and safe working conditions, fostering sustainability and ethical practices throughout our supply chain. |
| Workers in the value chain | Short and Medium-term | |||
| ||||||||
S2 Workers in the value chain | ||||||||
Human rights | Other human rights: potential negative impact in the value chain due to the risk of forced and child labor, as well as the exploitation of young workers, which can lead to severe human rights violations, reputational damage, and legal consequences. | Committed to ensuring ethical practices across the supply chain, actively addressing the potential issues related to forced labor, child labor, and the exploitation of young workers. Through stringent supplier audits, certifications, and a zero-tolerance policy for child and forced labor, we enforce compliance with international labor standards. In partnership with organizations advocating for human rights, we foster a transparent and responsible supply chain that prioritizes dignity, safety, and fairness for all workers. |
| Communities | Short and Medium-term | |||
G1 Business conduct | ||||||||
Corporate culture, corruption and bribery | Corporate culture, corruption & bribery: financial risk associated with compliance with our Integrity code, including the potential for corruption and bribery across our value chain and among stakeholders. | Foster a robust ethical culture and implement comprehensive compliance programs. We ensure rigorous adherence to anti-corruption laws, conduct regular employee training, and maintain transparent policies to uphold integrity across all levels of the organization and safeguard against reputational and financial risks. |
| Customers and consumers | Short, Medium and Long-term | |||
Political engagement and responsible advocacy | Political engagement and responsible advocacy: responsible advocacy practices supporting policy development on environmental and social topics through engagement and advocacy activities. | Support for ambitious climate policies and sustainable practices guided by our Climate Transition Plan and Responsible Advocacy Policy. Through active collaboration with policymakers, industry stakeholders, and environmental organizations, we aim to champion initiatives that accelerate climate action and align with our commitment to sustainability. |
| Communities | Short, Medium and Long-term | |||
| ||||||||


5.2 Environment
5.2.1 | E1. Climate change | |
5.2.2 | E5. Resource use and circular economy | |
5.2.3 | Disclosure pursuant to article 8 of Regulation (EU) 2020/852 Taxonomy Regulation |
Signify aims to address some important challenges of our time, such as climate change and resource scarcity. These shape the needs of our customers, employees, all our stakeholders and the society we live in. This section presents our policy, actions and progress regarding our material impacts, risks and opportunities on climate change, circular economy and resource use. Our actions directly contribute to the achievement of SDGs 7: Affordable and clean energy, 11: Sustianable cities and communities, 12: Responsible consumption and production, and 13: Climate action.
SunStay Pro Solar street lighting
5.2.1 Climate change (E1)
Our approach
E1-GOV3 - Integration of sustainability-related performance in incentive schemes
As the global leader in lighting, Signify has an important role to play in the transition to a global low-carbon economy. We have been at the forefront of the transformation of the lighting industry. In 2006, we called for the phase-out of incandescent lighting at a time when it accounted for two-thirds of our sales volume. While this radical shift challenged many within the company and among our stakeholders and peers, it was the foundation of our industry leadership position today.
In 2025, 91% of our revenues came from energy efficient LED-based technologies. We have pioneered ultra-efficient technologies that last longer and greatly surpass the energy savings previously possible with standard LED. As a result of our innovations, we have achieved a 60% absolute reduction in scope 1, 2 and 3 greenhouse gas (GHG) emissions across our entire value chain, including emissions from the product use phase, since 2019. At the end of 2025, the total avoided emissions achieved through our LED technology sales (compared to Conventional technology) was 148 million tonnes CO2e.
Signify continues to accelerate its climate action efforts. In 2024, the company strengthened its long-standing sustainability agenda by launching its Climate Transition Plan, signaling a renewed commitment to faster, deeper progress. Signify announced net‑zero targets validated by the Science-Based Targets initiative, aiming to reduce greenhouse gas emissions by 90% across the entire value chain by 2040, using 2019 as the baseline and without relying on carbon credits. This approach encompasses not only Signify’s own operations but its full value chain. The company also actively engages customers, employees, and policymakers to help drive broader climate action and advance brighter lives and a better world.
The management of our impact, risks and opportunities follows the governance model applied to our sustainability program Brighter Lives, Better World. Read more on this in section 5.1, Brighter Lives, Better World 2025 progress. Signify has adopted sustainability incentives, of which climate related targets account for 6.25% of the total. More details on the incentives in chapter 10, Remuneration report.
Material impacts, risks and opportunities
E1 IRO-1 - Description of the processes to identify and assess material climate-related IROs
E1 SBM3 - Material IRO and interaction with strategy and business model
E1-2 - Policies related to climate change mitigation and adaptation
The double materiality assessment identified the following material IROs:
Low carbon product use – actual positive impact – downstream
Emissions from production process – actual negative impact – upstream and own operations
Energy efficient products market – financial opportunity – downstream
Climate-physical risks – financial risk – own operations
Energy efficiency – actual positive impact - downstream
The table right summarizes the relevant policies and associated details, as well as their linkage to the E1 IROs.
Policy | Description | Related IROs | Key stakeholders & scope | Accountability & Governance |
|---|---|---|---|---|
Sustainability Policy | The policy sets out our commitment to mitigating climate change in our value chain, by reducing carbon emissions, increasing energy efficiency and use of 100% renewable electricity. | 1, 2, 3, 4, 5 | These policies cover our entire value chain and relevant stakeholders including employees, sub-contractors, and suppliers. | These policies are overseen by the Chief Strategy, Sustainability and Marketing Officer. The implementation responsibility is with the Global Head of Sustainability. |
Climate Action Policy | It outlines our commitments and responsibilities toward combating climate change, advancing energy efficiency and accelerating the global renewable energy transition. | 1, 2, 3, 4, 5 | ||
Energy Management Policy | It outlines our commitment to responsible energy use by improving efficiency, reducing environmental impact, complying with ISO 50001, and continually enhancing energy performance. | 2,5 | This policy covers our own operations and includes all Signify sites and relevant stakeholders including employees, temporary workers, and contractors. | The policy is overseen by the Head of Operations Professional Europe. The implementation responsibility is with the Global Head of Environment, Health & Safety. |
Environmental, Health & Safety Policy | It defines our commitments to protecting our environment and creating a safe and healthy workplace for all employees and involved stakeholders within our own operations. | 2, 4 | The policy applies to all Signify sites, majority owned joint ventures, and service projects in the marketplace. | The policy is overseen by the Chief Strategy, Sustainability and Marketing Officer. The implementation responsibility is with the Global Head of Environment, Health & Safety. |
Supplier Sustainability Declaration | Supplier Sustainability Declaration sets out the standards and behaviors we require from our suppliers and their suppliers to improve conditions for workers and promote a cleaner environment for local communities. | 2 | The policy covers our direct suppliers both upstream and downstream globally. | The Supplier Sustainability Declaration is overseen by the Head of Procurement and managed by the Supplier Sustainability Manager. |
In terms of process, the material impacts, risks and opportunities related to climate change were identified through the double materiality assessment as well as a specific climate-related risks and opportunities assessment based on climate change scenario analysis. The double materiality assessment is further explained in section 5,1 and the climate-related risks and opportunities assessment is presented in this section.
Our Climate Transition Plan directly addresses these impacts, risks and opportunities and the action plan and resources are explained in the sections hereinafter. For climate-related risks and opportunities specifically, Signify conducts an annual assessment considering multiple climate change scenarios. Based on the double materiality threshold, we perform further analysis on the financial impact of material risks and opportunities. See section Climate scenario analysis for more details.
There were no significant changes in Signify's definition of what constitutes the reporting undertaking and its upstream and downstream value chain. Signify does not have significant CapEx for coal-related economic activities, for oil-related economic activities and for gas-related economic activities. Signify is not excluded from EU Paris-aligned Benchmarks.
Action plan, targets and resources
E1-1 – Transition plan for climate change mitigation
E1-4 – Targets related to climate change mitigation and adaptation
Signify accounts for all its Scopes 1, 2, and 3 GHG emissions. It accounts for all seven greenhouse gases under the Kyoto Protocol, namely carbon dioxide (CO2), methane (CH4), nitrous oxide (N2O), hydrofluorocarbons (HFCs), perfluorocarbons (PFCs), sulfur hexaflouride (SF6), and nitrogen trifluoride (NF3), where applicable and expressed in CO2-equivalent. Signify does not have material GHG emissions other than CO2. Signify does not use biomass or biofuels, thus does not have material biogenic emissions. For our 2025 target of doubling the pace of the Paris Agreement 1.5°C pathway to decarbonize our entire value chain, 2019 was chosen as the base year. It is the earliest year of available emissions data for all categories of Scope 1, Scope 2, and Scope 3 where data was available. Scope 2 emission targets have been calculated using the market-based method. This target was set before the first reporting year of CSRD.
Signify's Climate Transition Plan was launched in June 2024 based on our net zero targets validated by the Science Based Targets Initiative (SBTi). By following the SBTi’s cross-sector absolute reduction requirement with a minimum 4.2% annual reduction, our targets are aligned with the Paris Agreement's 1.5°C pathway for scope 1, 2 and 3 GHG emissions. The plan was approved by the Chief Strategy, Sustainability and Marketing Officer and reviewed by the Supervisory Board and Board of Management. The Climate Transition Plan sets our company’s climate strategy, ambitions and action plan to mitigate climate change. It is integrated into our overall business strategy and financial planning, by including climate-related topics into budgeting planning, business continuity planning and risk management. The decarbonization levers and action plans are not necessarily updated annually, they are expected to be updated when there are significant changes in business structure, strategy, and decarbonization solutions. Signify monitors progress on these actions quarterly and reports annually on the implementation of the plan. The approach and planned actions are aligned with our Sustainability Policy and are managed through the same governance processes.
Our SBTi approved targets are:
Net-zero greenhouse gas emissions across the entire value chain by 2040;
50% reduction in absolute Scope 1, 2 and 3 greenhouse gas emissions by 2030, compared with 2019 base year;
90% reduction in absolute Scope 1, 2 and 3 greenhouse gas emissions by 2040, compared with 2019 base year.
Our targets cover 100% of our Scope 1, 2, and 3 GHG emissions, including all seven Kyoto gases. To reach our net zero target, we are committed to eliminating the residual up to 10% through carbon removals, in addition to 90% emissions reduction. The plan covers our entire value chain and defines specific actions and decarbonization levers which are connected to our five material IROs under E1.
The use phase of our products accounts for more than 99% of total emissions across our value chain. To achieve net-zero, we must further increase the energy efficiency of our product portfolios. We must also advocate for the green energy transition to phase out fossil fuels and increase the use of renewable electricity in the world’s grids. It is clear that without this transition, we will not be able to achieve our 2040 net zero target.
Our Climate Transition Plan involves making further energy efficiency gains at our manufacturing facilities and offices and increasing reuse and recycling of Signify products and components when they have reached the end of their useful life. But most of all, it is about designing and delivering ever more efficient LED lighting, which saves energy, reduces GHG emissions, and lowers energy bills. We have made considerable advances in Ultra Efficient (UE) LED lighting, achieving efficiencies that are 50-75% more efficient than first‑generation LED technology.
Meanwhile, we will encourage a faster shift towards these technologies, and a faster decline in global energy demand, by partnering with others to advocate for an increase in the renovation of buildings, streetlights and other infrastructure globally. We realize these changes will affect our suppliers, customers, and employees, as we decrease production of inefficient conventional lighting in response to increasing market demand for energy efficient solutions and evolving regulations. We are committed to supporting them during the transition, ensuring that our products remain affordable, especially for those on low incomes. At the same time, we are convinced that our transition to net zero will bring clear, long-term benefits.
E1-3 – Actions and resources in relation to climate change policies
The actions outlined in our Climate Transition Plan rely on our broader commitment to developing more sustainable lighting solutions and directing capital toward sustainable economic activities under the EU taxonomy. This directly supports our actions required to reduce emissions from product use, which represents 99% of our emissions.
In 2025, Signify reported 43.8% of capital expenditures and 44.1% of operational expenditures to taxonomy-aligned activities, for absolute values refer to section 5.2.3, EU Taxonomy. These investments directly contribute to sustainable activities under CCM 3.5 – Manufacture of energy efficient equipment for buildings, CCM 3.6 - Manufacture other low carbon technologies that result in substantial GHG emission reductions in other sectors of the economy, CCM 6.5 - Transport by motorbikes, passenger cars and light commercial vehicles and CCM 7.7 – Acquisition and ownership of buildings. These investments include:
Capital expenditure: purchasing equipment for LED production and enhancing the energy efficiency of our factories and other facilities, as well as lease contracts for new and/or renovated buildings.
Operating expenditure: investment in innovation, research, and development to further improve the energy efficiency of our product portfolio and support greater circularity.
Based on our current assessment, the implementation of our climate transition plan is not expected to require significant additional investment, and we do not anticipate any material future financial effects beyond the expenditures already embedded in our existing operational and capital plans. We do not require any additional resources to implement our Climate Transition Plan.
Our ambition is to increase our aligned investment towards the EU Taxonomy objectives to support our Climate Transition Plan targets. In 2026, we will continue to develop and align our financial allocation plan required to address the actions for the other areas of our Climate Transition Plan, representing 1% of remaining emissions.
E1-8 – Internal Carbon Pricing
Signify has an internal carbon pricing scheme in the form of a uniform shadow price in place to drive emissions reduction across value chain. To quantify the impact of carbon emissions, we refer to the World Bank Carbon Pricing Dashboard and use the upper bound of the price range as our internal carbon price of the year. For 2025, the internal carbon pricing is USD 158.8/tonne CO2e. This shadow price is intended for Signify’s businesses and functions to incorporate into decision-making process for the assessment of GHG emissions and potential financial impact, thereby driving investment and resources allocation toward low-carbon solutions. The shadow price can be used for Scope 1, 2 and 3 GHG emissions and all activities, entities and geographies. This price is considered relevant for our application as it reflects the actual value of carbon prices being used in regulated markets worldwide, providing a concrete quantification of the maximum financial impact of GHG emissions of business and operational activities.
All teams have the autonomy to determine whether and when to apply internal carbon pricing for their projects and activities. In 2025, we did not identify any specific use cases for internal carbon pricing; therefore, no Scope 1, 2, 3 emissions covered by internal carbon price are disclosed. The internal carbon pricing (shadow price) is not utilized in the financial statements.
Decarbonizing scenarios
E1-3 – Actions and resources in relation to climate change policies
In developing our Climate Transition Plan, we mapped out four different decarbonization scenarios, based on the latest IEA’s Net-Zero Roadmap and the sixth IPCC Assessment Report. These scenarios range from average global warming of 1.5°C to 4.4°C – and clearly show that achieving net zero will depend on further climate action by government and business, particularly in accelerating the transition to renewables. We set our Scope 1, 2 and 3 climate reduction targets in line with the 1.5°C scenario decarbonization pathway.1For more details on the breakdown of emissions reduction targets, levers, action plan, and estimated emissions reduction, please refer to the Signify Climate Transition Plan, chapter 2, Action.
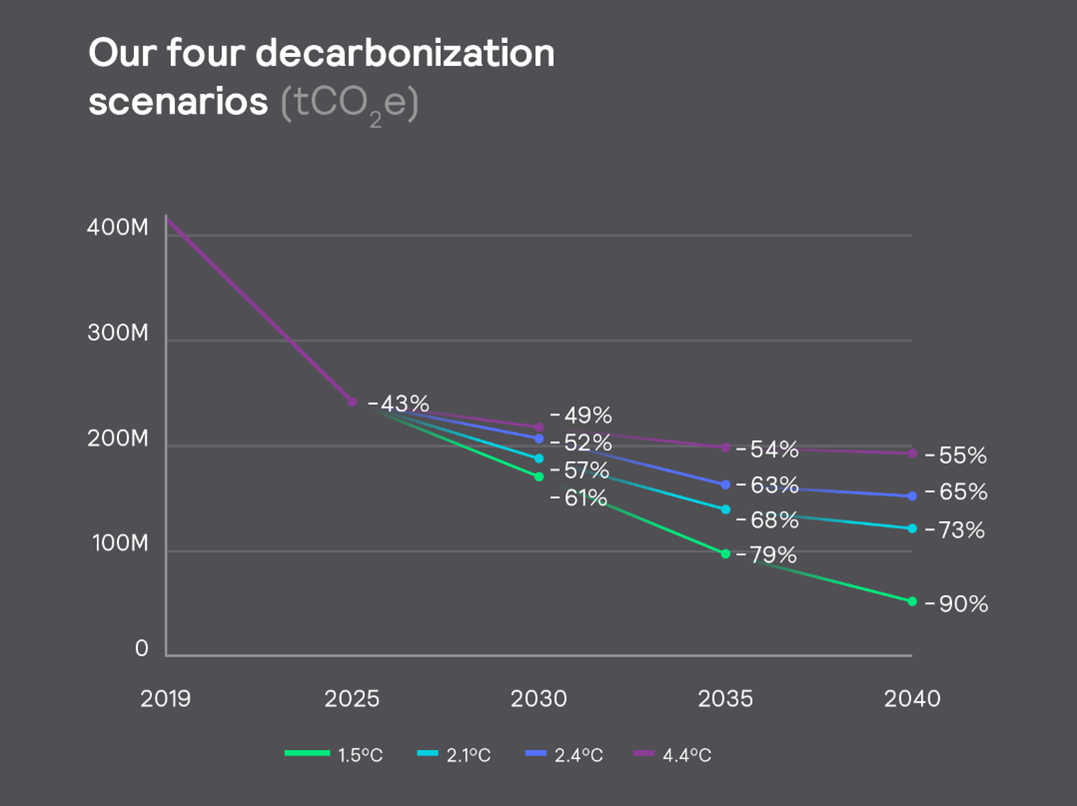
The majority of Signify's locked-in GHG emissions are primarily derived from the use of sold products over their lifetime. To address this, we leverage our Climate Transition Plan and commit to reducing GHG emissions to achieve net zero by 2040, with a particular focus on Scope 3 category 11 emissions (from the use of sold products). We aim to achieve this by continuously improving the energy efficiency of our products and advocating for an accelerated transition to renewable energy.
Therefore, these locked-in emissions do not pose a risk to Signify’s GHG emissions reduction targets or lead to transition risks. As we continue phasing out the conventional business and reducing the manufacturing footprint of it, no key assets (under Scope 1 and 2) are considered as locked-in emissions.
Signify's decarbonization action plan and identified emission reduction levers are based on a set of forward-looking assumptions reflecting expected technological, market, and regulatory developments in the lighting industry and for the broader value chain. These assumptions are used for projection purposes and are subject to uncertainty.
With most emissions outside our operations, we have identified two main drivers to achieve our net-zero ambition:
To further improve the energy efficiency of our portfolio – this will help reduce energy consumption and support our customers’ decarbonization goals. Our action plan assumed a continued transition towards energy-efficient LED and connected lighting solutions, with ongoing improvements in luminous efficacy and digital control capabilities driven by our own sustainable innovation. The energy efficiency improvement rate was based on internal expert insights.
To advocate for a green energy transition – this means working with governments, business and other stakeholders to increase the use of renewable energy in the world’s power grids. We assumed a progressive decrease in the greenhouse gas intensity of electricity grids worldwide, driven by energy transition plans, by governments, and by the private sector. The rate of renewable electricity transition in the IEA Net Zero Emissions scenario was used in our Climate Transition Plan to model the energy transition lever. By 2040, we expect over 40% of our emissions reduction will come from the transition to renewables from 2025 onward.
For our own operations, the plan assumed continued commitment to source 100% renewable electricity and continued improvement in reducing energy consumption and operational energy intensity. For business travel, we assumed a sustained reduction in business travel, especially air travel compared to pre-pandemic levels, driven by the continued use of hybrid working practices, more sustainability-centered travel policy as well as decarbonization of travel service providers in line with industry trends. For employee commuting, continued hybrid working arrangements were assumed, together with a gradual shift towards lower-carbon commuting modes. For supply chain, we assumed gradual improvements in supplier energy efficiency, increased use of renewable energy by key suppliers, and incremental increases in recycled and lower-carbon materials, subject to availability, cost, and supplier readiness. For logistics, we assumed gradual improvements in logistics efficiency, including route optimization, load consolidation, and improved vehicle utilization. We further assumed progressive decarbonization of transport services providers, including increased use of electric vehicles, and lower-carbon fuels, in line with sectoral and regulatory developments. For end-of-life treatment of sold products, we assumed improvement in waste reduction thanks to expanding circular business models and incremental improvements in product collection, recycling rates, and material recovery efficiencies, supported by extended producer responsibility schemes and regulatory developments.
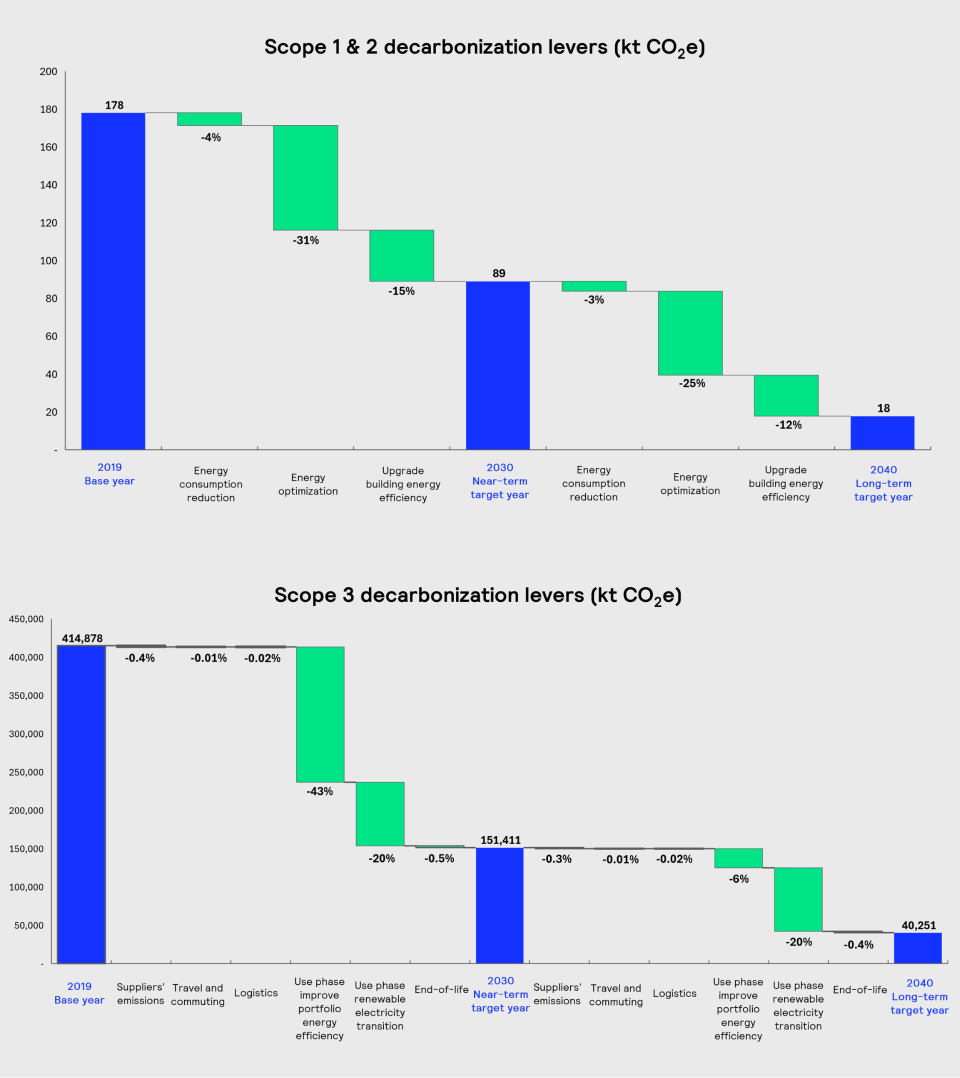
- The four decarbonization scenarios are depicted based on (1) the renewable energy transition rates derived from the Net Zero Emissions (NZE) scenario (i.e., 1.5℃ scenario), the Announced Pledges Scenario (APS) (i.e., 2.1 ℃ scenario) and the Stated Policies Scenario (STEPS) (i.e., 2.4 ℃ scenario) from the IEA Net Zero Roadmap report and the SSP5 -8.5 scenario (i.e., 4.4 ℃ scenario) in sixth IPCC Assessment Report; and (2) projected energy efficiency improvement of Signify’s product portfolio. The model emissions reductions are calculated against the 2019 base year actual emissions data for scope 1, 2 and 3 emissions. These decarbonization pathways were modeled for total scope 1, 2, and 3 emissions. Note that our projected emissions reduction by 2030 in the 1.5℃ scenario is more than the 50% required by the science-based near term target, this is because we expect significant improvement in portfolio energy efficiency will drive drastic emissions reduction in the first few years.
- The timeframe of the action plan has changed compared to 2024, it was updated to better align with our near-term and long-term climate targets. Note that the 2030 CO2e shown in the Scope 3 decarbonization levers chart is Signify’s projected emissions, which is more ambitious than the science-based near-term target.
Decarbonizing our own operations (Scope 1 and 2)
Signify has reduced 53% of its absolute carbon footprint in operations (Scope 1 & 2) compared to our 2019 baseline, and continues to do so, through implementing initiatives in our factories, warehouses, and offices. 2025 saw a 2% year-on-year emissions reduction vs 2024, primarily thanks to the effort of reducing natural gas consumption in factories.
Signify did not invest in GHG removals and storage projects in 2025. For details on the finance resources and planning (OpEx and CapEx), please refer to chapter 2.8, Investments and business models of the Signify Climate Transition Plan, aligning with the EU Taxonomy.
Driving clean energy transition with solar
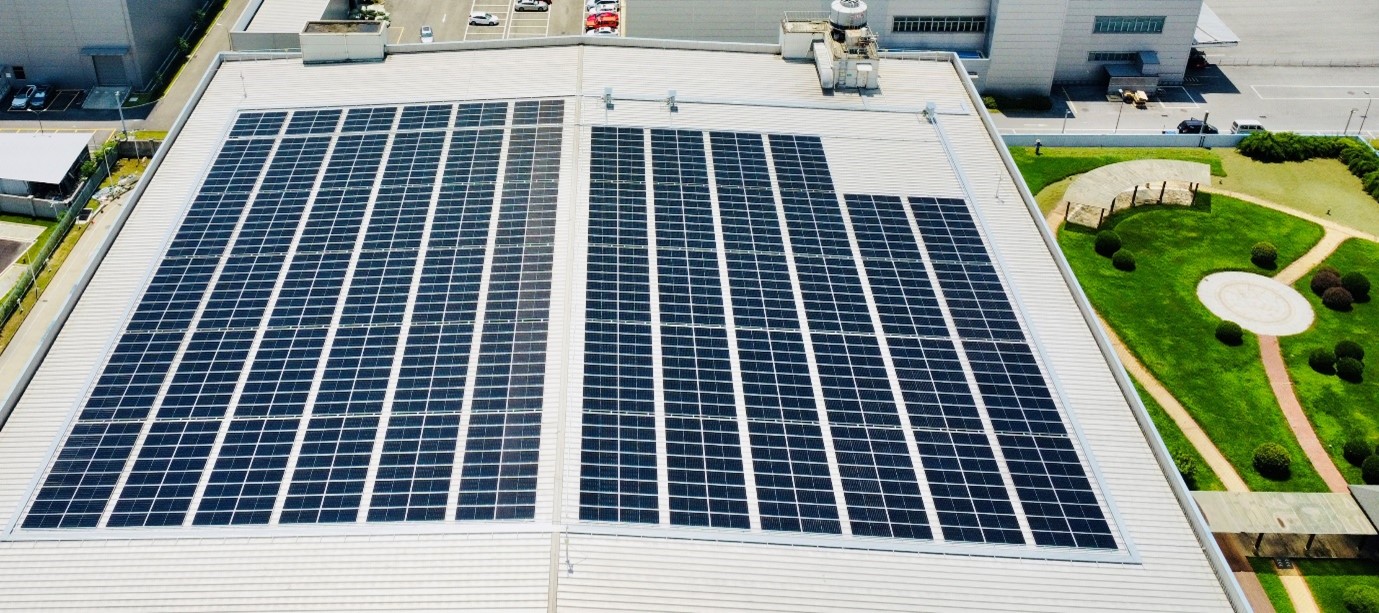
In August 2025, the solar energy project at the Chengdu factory was successfully completed. The installation is expected to generate approximately 465 MWh of electricity annually, covering around 22% of the site's total electricity consumption and enabling an estimated 275 tonnes CO2e emissions reduction each year. From August to December 2025, the system generated 140 MWh renewable electricity, resulting in 83 tonnes CO2e reduction. Beyond reducing energy costs, the project strengthens the factory’s access to clean energy and supports Signify’s broader commitment to sustainable and low‑carbon operations. Additionally, any surplus electricity will be fed into the national grid, helping meet local energy demand and supporting the country's transition toward a cleaner national energy mix.
Actions | Planned actions | Planned CO2e emission reduction vs. 2019 and implementation timeframe |
|---|---|---|
Energy consumption reduction |
| 2024-2030: 6.7 kt (0.002%) |
Energy optimization |
| 2024 - 2030: 55 kt (0.013%) |
Upgrade building energy efficiency |
| 2024 - 2030: 27 kt (0.007%) |
E1-5 Energy consumption and mix
We continue to procure 100% of our electricity from renewable sources. This achievement directly contributes to SDG 7: Affordable and clean energy. All electricity consumed by our operations worldwide was sourced from renewable sources or matched with Energy Attribute Certificates (EACs).
Signify’s total energy usage in 2025 amounted to 1,946 terajoules (540,394 MWh). Our operational energy intensity in terajoules per million-euro was 0.34 in 2025 (94 MWh/million-euro). This is 8% more efficient than 2024 (0.37) and is due to operational optimization, improved energy efficiency, less reliance on energy intensive activities in our factories and reduced heating and lighting requirements.
Approximately 12% of our renewable electricity was contracted through our energy providers, 44% was sourced via the procurement of Energy Attribute Certificates (EACs), and 44% came from our participation in Power Purchase Agreements (PPAs). In 2025, Signify had four operating PPAs: three virtual PPAs (vPPAs) in the US, Poland, and Finland, and one physical PPA in Belgium. Our PPAs support our climate transition by accelerating the shift to more renewable electricity grids and reinforcing our commitment to achieving net zero by 2040.
2024 | 2025 | |
|---|---|---|
Fuel consumption from coal and coal products | n.a | n.a |
Fuel consumption from crude oil and petroleum products | 45,246 | 40,761 |
Fuel consumption from natural gas | 336,177 | 282,289 |
Fuel consumption from other fossil sources | n.a | n.a |
Consumption of purchased or acquired electricity, heat, steam, and cooling from fossil sources | n.a | n.a |
Total fossil energy consumption (calculated as the sum of rows 1 to 5) | 381,423 | 323,050 |
Share of fossil sources in total energy consumption (%) | 60% | 60% |
Consumption from nuclear sources | n.a | n.a |
Share of consumption from nuclear sources in total energy consumption (%) | n.a | n.a |
Fuel consumption for renewable sources, including biomass | n.a | n.a |
Consumption of purchased or acquired electricity, heat, steam, and cooling from renewable sources | 248,541 | 208,386 |
The consumption of self-generated non-fuel renewable energy | 5,641 | 8,958 |
Total renewable energy consumption (calculated as the sum of rows 11 and 12) | 254,182 | 217,344 |
Share of renewable sources in total energy consumption (%) | 40% | 40% |
Total energy consumption (calculated as the sum of rows 6, 11 and 12) | 635,605 | 540,394 |
Energy intensity in high climate impact sector (MWh/million-euro)2 | 103 | 94 |
- Total energy consumption decreased by 15% in 2025, mainly driven by our continued effort in phasing out the production of conventional lighting, which is more energy intensive.
- Activities related to NACE sector C.27.40, see chapter 15, note 3, Income from operations
statements.
Travel and commuting (Scopes 3.6 and 3.7)
We are adopting a more sustainable approach to business travel, with the goal of drastically reducing emissions from both business travel (Scope 3.6) and employee commuting (Scope 3.7).
This will be achieved by updating our travel policy to introduce a stricter approval process, banning short-distance flights, and transitioning company lease cars to electric or hybrid vehicles.
In 2025, GHG emissions from business travel and employee commuting decreased by 31% and 9% year-on-year, respectively, due to reduced travel activity-particularly in air travel-as a result of our tightened travel policy.
Actions | Planned actions | Planned CO2e emission reduction vs. 2019 and implementation timeframe |
|---|---|---|
Sustainable travel policy |
| 2024-2030:22 kt (0.005%) |
Engagement and partnerships |
| 2024-2030: 34 kt (0.008%) |
Enabling carbon reduction at our suppliers (Scope 3.1)
By 2040, we plan to significantly reduce GHG emissions from our suppliers. This will be done mainly by engaging with suppliers, incentivizing them to take climate action, reduce emissions and switch to renewable energy. Where possible, we will also increase our use of alternative, low-carbon materials and integrate carbon costs into our procurement decisions. In 2025, we reduced emissions from purhcased goods and services by 8% year-on-year.
In 2025, we continued our efforts to increase the use of recycled materials in our products, reducing emissions from purchased goods while advancing circularity. One example is our 3D‑printed Urban Grey collection.
These luminaires use polycarbonate recycled from old streetlight shades, which is repurposed through 3D‑printing technology to create sustainable lighting products. By incorporating 75% recycled polycarbonate waste, we achieved a 70% reduction in greenhouse gas emissions per luminaire from the upstream supply chain.

Urban Grey collection
In 2025, we advanced our Scope 3 upstream emissions work by investigating the possibility of moving from a spend-based calculation to a methodology that combines activity-based and spend-based data. This shift gives us a more accurate view of where emissions occur across our supply chain and enables more targeted action. As we onboard suppliers and engage, we will enrich this methodology with primary data from suppliers. As the dataset develops, it will guide benchmarking, support the definition of reduction scenarios and help us focus emission-reduction efforts on the suppliers with the greatest contribution to our upstream footprint.
To determine where to act first, we are conducting a hotspot analysis to identify the commodity groups, suppliers and items with the highest contribution to our Scope 3 emissions from purchased goods and services. From 2026 onwards, we will begin direct engagement with the 20 suppliers representing the highest share of upstream emissions from purchased goods and services identified in the analysis. These suppliers will be asked to provide primary emissions data and will be involved in the development of reduction scenarios and indicative timelines. Insights from this process will flow into our climate transition planning and will support delivery against our emissions reduction ambitions.
Actions | Planned actions | Planned CO2e emission reduction vs. 2019 and implementation timeframe |
|---|---|---|
Engagement | Incentivize suppliers through our supplier sustainability program to:
| 2024-2030: 1,218 kt (0.293%) |
Renewable energy |
| 2024-2030: 44 kt (0.011%) |
Sustainable materials |
| 2024-2030: 210 kt (0.051%) |
Sustainable procurement |
| 2024-2030: 187 kt (0.045%) |
Logistics (Scope 3.4 and 3.9)
Logistics GHG emissions are mainly in shipping materials to our factories and in transporting finished products to customers. We will reduce these emissions by opting for more sustainable forms of transport, favoring ocean and rail freight, for example, working in partnership with shippers and rail haulers, and investing in cleaner, alternative fuels.
In 2025, GHG emissions from logistics operations increased by 12% compared to 2024, mainly driven by increased road freight emissions.
Actions | Planned actions | Planned CO2e emission reduction vs. 2019 and implementation timeframe |
|---|---|---|
Prioritizing sustainable forms of transport |
| 2024-2030: 53 kt (0.013%) |
Engage and invest |
| 2024-2030: 27 kt (0.007%) |
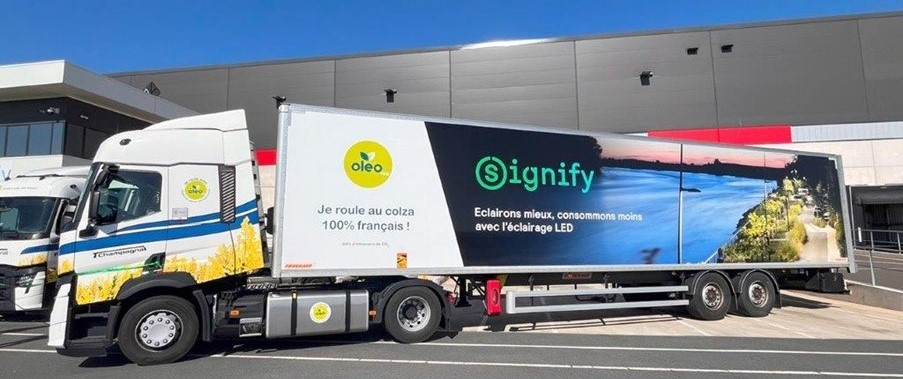
In partnership with our local logistic provider, we now power operations in the Île-de-France region with 100% plant-based biofuel derived from French rapeseed. This switch cuts CO₂ emissions by 60% and improves urban air quality. With over 196 deliveries and 6,731 km annually in this region, this sustainable-fuel initiative leads to 5.6 tonnes CO₂ emissions reduction and marks a key step toward decarbonizing our supply chain and scaling sustainable low-carbon transport across Europe.
Enabling carbon reduction for our customers (Scope 3.11)
Phasing out conventional lighting and switching to energy efficient LEDs, introducing solar lighting, and further enhancing energy saving with smart connected LED lighting has significant environmental benefits. As mentioned previously, the majority of our value-chain emissions lie in the product use phase. Helping our customers to reduce emissions through energy efficiency is a vital aspect of our innovation process.
The progress in our portfolio to support climate change mitigation has been aligned with the EU Taxonomy regulation and is reflected in the Taxonomy specific section of this report. The benefits include comparable and harmonized measures throughout the industry.
In 2025, Signify’s Ultra Efficient (UE) LED solutions portfolio expanded with the introduction of our next generation of UE outdoor luminaires. Engineered to deliver exceptional performance, these luminaires enable customers to achieve up to 65% additional energy savings compared to the most efficient standard product previously available in the same range.
Ultra Efficient luminaires continue to meet Signify’s circular economy framework criteria, ensuring high material efficiency, design for repairability, and long lifetimes. Their significantly reduced energy consumption and extended lifespan help lower operational costs while dramatically decreasing waste and carbon emissions over the products’ life cycle.
As a result, we reduced our GHG emissions by 3% in 2025 compared with 2024.
Actions | Planned actions | Planned CO2e emission reduction vs. 2019 and implementation timeframe |
|---|---|---|
Increasing energy efficiency of our portfolio |
| 2024 - 2030: 176 Mt (43%) |
Transitioning of the grid to renewable energy |
| 2024 - 2030: 83 Mt (20%) |
End of life (Scope 3.12)
By moving to a more circular approach, we will reduce both waste and our reliance on increasingly scarce natural resources. We will do this by encouraging reuse, recycling and remanufacture. Initiatives are already underway to redesign our packaging and further embed circularity into initial product development.
Actions | Planned actions | Planned CO2e emission reduction vs. 2019 and implementation timeframe |
|---|---|---|
Increasing reuse and recycling |
| 2024-2030: 1109 kt (0.267%) |
Redesign packaging to be more sustainable |
| 2024-2030: 756 kt (0.182%) |
Circular product design and innovation |
| 2024-2030: 396 kt (0.095%) |
In 2025, we continued to optimize our product packaging design to reduce material use and reduce emissions. We achieved a major milestone in sustainable packaging of our WiZ brand as we progress in our climate transition: 46% reduction in packaging volume, leading to 75.5% material saving for the WiZ Smart Plug. This results in and 1.2 tonne CO2e emissions reduction from used raw materials and 18 kg CO2e emissions reduction from end-of-life treatment. The packaging is made of easy-to-recycle paper materials and with this more compact design, we are able to stack 130% more products per pallet, optimizing transportation in the meantime.
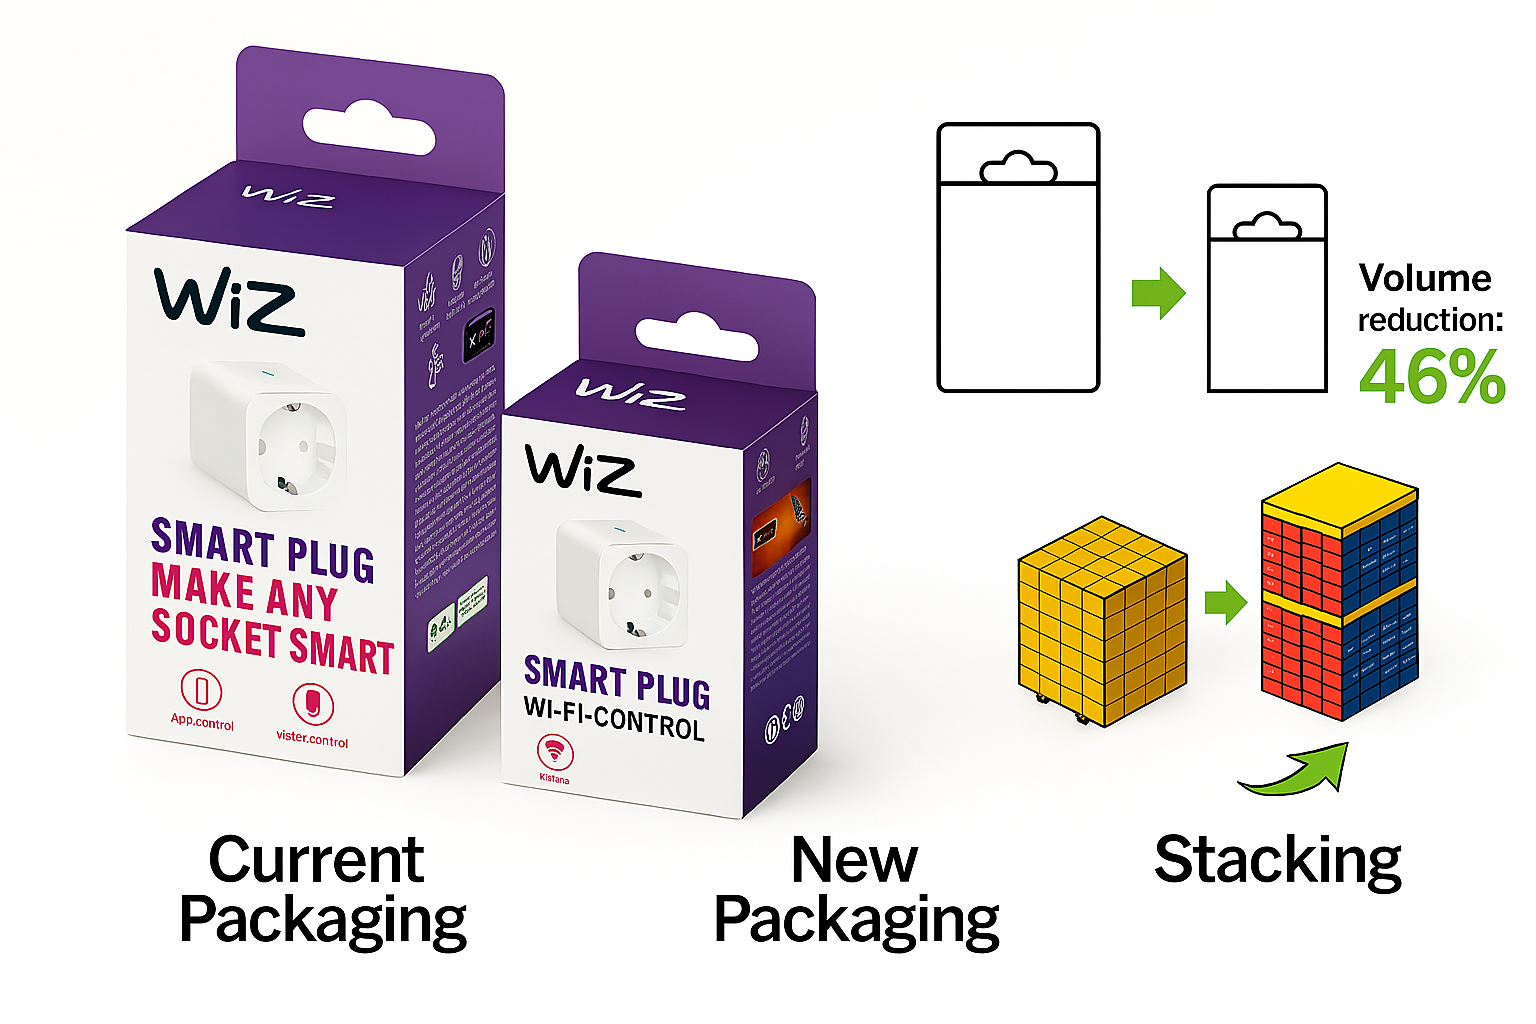
WiZ Smart Plug packaging optimizaiton
GHG emissions and intensity
E1-6 – Gross Scopes 1, 2, 3 and total GHG emissions
2019 | 2023 | 2024 | 2025 | % change 2025/2024 | Milestones and | Annual % | Annual % | ||
|---|---|---|---|---|---|---|---|---|---|
2030 | 2040 | ||||||||
Scope 11 | 167,921 | 148,393 | 85,582 | 83,474 | -2% | -50% | -90% | -4% | -4% |
% of Scope 1 GHG emissions from regulated emission trading schemes | n.a. | 21% | 19% | 15% | -21% | n.a. | n.a. | n.a. | n.a. |
Scope 2 (market based) | 10,137 | 0 | 0 | 0 | n.a. | -50% | -90% | -4% | -4% |
Scope 2 (location based) | 181,056 | 128,887 | 118,753 | 96,115 | -19% | n.a. | n.a. | n.a. | n.a. |
Scope 3 (indirect emission categories)2 | |||||||||
Category 1: Purchased goods and services | n.a. | 683,152 | 671,584 | 615,023 | -8% | n.a. | n.a. | n.a. | n.a. |
Category 2: Capital goods | n.a. | 14,747 | 4,360 | 4,256 | -2% | n.a. | n.a. | n.a. | n.a. |
Category 3: Fuel- and Energy-Related Activities. Not Included in Scope 1 or Scope 2 | n.a. | 32,779 | 33,822 | 27,642 | -18% | n.a. | n.a. | n.a. | n.a. |
Category 4: Upstream transportation and distribution | 160,000 | 87,343 | 74,230 | 82,797 | 12% | n.a. | n.a. | n.a. | n.a. |
Category 5: Waste generated in operations | n.a. | 8,507 | 7,202 | 8,098 | 12% | n.a. | n.a. | n.a. | n.a. |
Category 6: Business travel | 24,882 | 13,193 | 13,415 | 9,323 | -31% | n.a. | n.a. | n.a. | n.a. |
Category 7: Employee commuting | n.a. | 35,443 | 32,846 | 30,031 | -9% | n.a. | n.a. | n.a. | n.a. |
Category 8: Upstream leased assets | n.a. | n.a. | n.a. | n.a. | n.a. | n.a. | n.a. | n.a. | n.a. |
Category 9: Downstream transportation and distribution | n.a. | n.a. | n.a. | n.a. | n.a. | n.a. | n.a. | n.a. | n.a. |
Category 11: Use of sold products | n.a. | 191,779,024 | 169,651,0643 | 164,099,789 | -3% | n.a. | n.a. | n.a. | n.a. |
Category 12: End of Life treatment of sold products | n.a. | 18,391 | 10,038 | 15,147 | 51% | n.a. | n.a. | n.a. | n.a. |
Category 13: Downstream leased assets | n.a. | n.a. | n.a. | n.a. | n.a. | n.a. | n.a. | n.a. | n.a. |
Category 14: Franchises | n.a. | n.a. | n.a. | n.a. | n.a. | n.a. | n.a. | n.a. | n.a. |
Category 15: Investments | n.a. | n.a. | n.a. | n.a. | n.a. | n.a. | n.a. | n.a. | n.a. |
Scope 3 total | 414,878,003 | 192,672,579 | 170,498,561 | 164,892,105 | -3% | -50% | -90% | -4% | -4% |
Scope 1+2 total (market based) | 178,058 | 148,393 | 85,582 | 83,474 | -2% | -50% | -90% | -4% | -4% |
Scope 1+2 total (location based) | 348,977 | 277,280 | 204,335 | 179,589 | -12% | n.a. | n.a. | n.a. | n.a. |
Scope 1+2+3 total (market based) | 415,056,061 | 192,820,972 | 170,584,143 | 164,975,579 | -3% | -50% | -90% | -4% | -4% |
Scope 1+2+3 total (location based) | 415,226,980 | 192,949,859 | 170,702,896 | 165,071,694 | -3% | n.a. | n.a. | n.a. | n.a. |
GHG emissions intensity (market-based) (tonnes-CO2e/million euro)4 | 66,441 | 28,771 | 27,769 | 28,607 | 3% | n.a. | n.a. | n.a. | n.a. |
GHG emissions intensity (location-based) (tonnes-CO2e/million euro)4 | 66,468 | 28,790 | 27,788 | 28,623 | 3% | n.a. | n.a. | n.a. | n.a. |
- The EU ETS scheme requires third-party verification, which might take place after the publication of this report. In case of material differences, this datapoint will be restated in next year’s annual report. In 2025, we disclosed the 2024 data point, which was not available at the time of publication.
- Across all Scope 3 GHG categories, the proportion of the GHG emissions reported based on primary data was 87%.
- 2024 revised figure based on revision in 2025 data. See section 5.5, Reporting principles - Scope 3, Category 11 for full details.
- Calculated using sales (net revenue) reported in section 15.6, note 4, Income from operations.
Climate scenario analysis
The potential financial impacts of climate change pose a challenge to the stability and continuity of businesses over the short, medium, and long terms With a global footprint, Signify’s manufacturing sites and supply chain are exposed to these physical and transition risks related to climate change. Assessing climate-related physical and transition risks enables us to understand their implications on our operations and financial positions, thereby prioritizing risk mitigation and effectively addressing them in our policies and programs while improving business resilience with climate change mitigation and/or adaptation strategies. Signify has been reporting its climate-related risks and opportunities in alignment with the Task Force on Climate related Financial Disclosures (TCFD) recommendations and guidance since 2018 and has aligned to the ESRS requirements. In 2025, we continued our efforts to update our assessment of climate-related risks and opportunities, contributing to our Climate Transition Plan and showcasing our commitment to long-term business sustainability.
No assets and business activities that are incompatible with or need significant efforts to be compatible with the transition to a climate-neutral economy have been identified. The same set of assumptions used in the climate scenario analysis is being used in our financial statements, in chapter 15, Consolidated financial statements, note 1, Basis of preparation, Climate-related matters.
Our governance is effectively designed to manage the energy transition strategy and continues making significant progress towards optimizing long-term value through financial, environmental and social resources. The governance for climate-related risks and opportunities are the same as our general sustainability governance. For details on the responsibilities of our governance, refer to 9.2 Key discussion topics and meetings in 2025, Sustainability.
Climate-related risks and opportunities are managed the same way as other risks. Signify’s Board of Management is responsible for the overall risk management associated with the company's activities. It is assisted by the company Leadership Team, which participates on a quarterly basis in audit risk and control meetings organized by the Risk Committee, to identify material risks and review progress on the implementation of risk responses, including climate-related risks. The executive responsibility for climate-related issues is assigned to our Chief Strategy, Sustainability and Marketing Officer, to ensure the strong linkage and synergy between the company’s strategy and sustainability commitments, as well as to drive Signify's performance in the space of climate action. Our Chief Strategy, Sustainability and Marketing Officer oversees strategy setting, sustainability budget, and climate action plans and reports directly to our CEO and addresses climate-related issues regularly to the Board of Management in case of major capital expenditures, acquisitions, and divestitures. Signify’s Chief Strategy, Sustainability and Marketing Officer oversees a multi-discipline Climate Risk Assessment Taskforce, consisting of experts in Operations, Insurance, Risk Committee, Internal Audit, Sustainability, and Environmental, Health, and Safety (EHS). The Taskforce team is responsible for the continuous evaluation of the company’s short-, medium- and long-term climate-related risks and opportunities. This, as part of Signify’s integral risk management and business control, contributes to maximizing climate-related opportunities and improving our resilience to climate change.
The assessment of climate related risks and opportunities starts with understanding climate change scenarios for physical risks and mega trends for transition risks and opportunities. This is followed by screening our sites against climate hazards, and key transition drivers in regulation, market and technology to identify relevant risks and opportunities. Next, we investigate how these identified risks and opportunities would affect our global operations and our supply chain. The materiality of these risks and opportunities are evaluated based on their likelihood of occurrence as well as the estimated magnitude of impact. In response, we develop risk adaptation and mitigation strategies that enhance our operational resilience, risk management, and financial planning where applicable. We also use the results of the assessment to inform our strategy and action plan to drive the climate transition toward net zero and a low-carbon economy.
Physical risks
At Signify, climate-related physical risks stem from the impacts of climate change on our manufacturing sites, warehouses, offices, and key suppliers. We assess the severity of both acute and chronic risks using a location-specific risk profiling tool.
Climate-related physical risks are assessed under the following time horizons. The short-term horizon is defined as one year; the medium-term horizon is defined as 1-5 years, and the long-term horizon is defined as beyond five years. The short-term one-year horizon is in line with our annual financial planning. The medium-term five-year horizon is linked to our company strategy planning and capital allocation planning cycle. The long-term horizon informs the company’s financial decisions and aligns with the IPCC climate change scenarios. As the short-term and the medium-term horizons are close and the lack of data for a five-year climate change scenario, we consider the medium-term assessment the same as the short-term assessment. For the long-term, 2080 has been used for the assessment year due to data availability.
Signify assesses climate-related physical risks for three different scenarios, namely a short-term scenario and two long-term scenarios. The short-term scenario is in line with the Shared Socio-economic Pathways (SSP) – SSP1-2.6 scenarios. The long-term scenarios are in line with SSP1-2.6 scenario (a stringent mitigation below 2°C scenario, or in line with the Paris Agreement 1.5°C scenario) and SSP 5-8.5 scenario (a very high GHG emissions scenario), as described in the IPCC AR6 report. The physical risk assessment approach consists of four steps: (1) risk screening, (2) risk mapping, (3) risk assessment, and (4) risk mitigation and/or adaptation.
The first step is risk screening based on the climate-related hazards listed in ESRS E1, to identify the hazards that are relevant for Signify based on our sector, our value chain, our operational activities and site locations. This is done by cross checking the nature of our operations, previous year’s analysis and inserting coordinates of Signify sites and key suppliers into the risk profiling tool. Next, risk mapping is performed for all our manufacturing sites, warehouses, offices, and key suppliers, in line with each of these relevant climate-related hazards. Under different climate change scenarios, we evaluate the future hazard score at an individual site level based on the site’s geographical location. Subsequently, we further assess the risk level of each site based on its future hazard scores that are categorized by six hazard scores: “very low”, “low”, “medium”, “high”, “very high,” and “extreme.” Next, the gross financial impact would be quantified based on the production activities and value of assets on site, by estimating the likelihood of occurrence and magnitude of effect of each climate hazard. If the sum of financial exposure of a specific risk is above our financial materiality threshold (same as ERM), that risk is considered material for Signify. Based on each site’s risk level – when it’s “very high” or “extreme” – we perform further investigation into its site-specific vulnerability regarding such climate-related hazards to inform mitigation strategy. Finally, in the risk mitigation step, we design business continuity and response plans to mitigate risks and strengthen resilience. Our Corporate Security team oversees Signify’s business continuity management, which covers emergency response, major incident/crisis response and business continuity (recovery). Each Signify site develops their own site-level business continuity plan based on local context and in line with potential risks, including material climate-related physical and transition risks.
Transition risks
Our transition risks assessment is grounded in external transition megatrends - including policy and regulation, market dynamics, technological developments (including AI), energy system evolution, and customer preferences - relevant to Signify during the reporting year. These external drivers are derived from:
The IEA Net Zero Emissions by 2050 scenario, used as our primary transition reference point;
Widely recognized external publications and industry analyses;
Insights from Signify’s Double Materiality Assessment (DMA).
To better understand potential impacts, we made the following assumptions:
There are varying levels of regulatory requirements on the energy efficiency of lighting products;
No price erosion;
Signify maintains its current market share in the lighting industry;
There will be an increased need for lighting based on population increase, urbanization, GDP growth and lighting market intelligence.
This approach ensures alignment with regulatory expectations and the evolving external landscape. According to the IEA’s Net Zero Emissions by 2050 scenario and its 2024 progress update, the global energy transition is accelerating but becoming more complex. Broader adoption of renewable energy and electrification continues, driven by declining technology costs and growing corporate commitments to source carbon-free power. At the same time, energy systems face increasing policy fragmentation, grid constraints, and regional disparities in clean technology deployment. Governments are tightening environmental and climate disclosure requirements through frameworks such as the EU CSRD and the forthcoming GHG Protocol revisions, creating new expectations for transparency and credible decarbonization pathways. These dynamics are expected to heighten both regulatory and market transition risks while expanding opportunities for companies that offer verified low-carbon and resource-efficient solutions.
Using the megatrends described above, and focusing on Signify’s assets and business activities, we identify transition risk and opportunity drivers that could possibly affect Signify’s business model, strategy, operations, supply chain, or market positioning. These drivers are assessed through the lens of both outside-in (transition risks) and inside-out (transition opportunities) effects. Each identified risk or opportunity is evaluated across impact (magnitude of potential consequences) and likelihood (probability of occurrence), based on multiple working sessions with internal experts from Strategy, Risk, Insurance and Procurement. The methodology is consistent with Signify’s Double Materiality Assessment, and is applied across short-term, medium-term, and long-term time horizons, in line with physical risk assessment time horizons. Based on the combined Impact × Likelihood scores, risks and opportunities are categorized as high, medium or low by testing each transition risk/opportunity drivers against the company’s activities and strategies. Items assessed as high risk or high opportunity are considered material and undergo further quantification of potential financial effects, in accordance with ESRS E1 requirements. The approach incorporates inputs from relevant teams and internal experts, and the process is reviewed annually to ensure alignment with the latest external developments, internal strategy and risk updates, and reporting requirements.
Supply chain risk assessment
For our supply chain, climate-related physical risks are assessed for the 70 most relevant suppliers that could have the most significant business impact, following the same approach as our own sites. Climate-related transition risks are assessed as part of Signify integral transition risks and opportunities assessment. Results are presented in section Risks and opportunities identified.
In parallel, the procurement team runs a supply chain risk management tool, which continuously assesses a list of risks related to the location of our suppliers that could impact business continuity. This covers 5,000 supplier locations (representing 93% of spend). In case of a severe event, the tool will signal this, enabling us to quickly map suppliers in the impacted area and initiate fast and dedicated mitigation actions. In late 2025, we began implementing a new supplier engagement tool, which will enhance how we manage hotpots and engage with priority suppliers.
Risk and opportunities identified
The results of climate-related physical risks are presented in the table to the right. We identified six climate-related hazards relevant for Signify’s manufacturing sites, warehouses, offices, and key suppliers, namely, flooding, drought, heatwave, wildfire, storm, and extreme precipitation. It is worth noting that the long-term impact of physical risks is influenced by climate change and degree of global warming. In particular, the long-term risks of flooding, droughts, and heatwaves under the above 4°C scenario are expected to be significantly higher than under the below 2°C scenario.
As a result of the 2025 climate-related physical risk assessment, one risk – flooding – is considered material leading to a gross financial impact of EUR 43 million in the long term. The financial impact of drought, heatwaves and extreme precipitation were assessed qualitatively, as these hazards are acute and are not expected to cause significant damage to our assets, and are therefore considered financially immaterial. Nevertheless, they remained in the scope of our physical risks assessment due to potential impact on employee commuting and well-being.
The assessment of physical risk is conducted on a yearly basis due to the unpredictability of extreme weather events, leading to an increased or decreased level of risks due to climate change. Nevertheless, Signify is well prepared for climate-related physical risks and has a resilient adaptation plan in the form of a business continuity plan. This adaptation plan enables flexibility in terms of production locations, employee working locations, sourcing options, and transportation options, thereby minimizing the overall impact of climate-related physical risks on Signify’s operations as well as value chain.
Hazard score | |||||||
|---|---|---|---|---|---|---|---|
Climate hazard | Risk assessment summary | Short term | Long term | Long term | Resiliency score | Risk score | |
Flooding | 3% of our sites are located in or adjacent to areas potentially associated with a very high hazard score of riverine or coastal flooding. The gross financial impact of flooding exceeds our materiality threshold, making this hazard material. However, due to strong preparedness measures and high site-level resilience, the net financial exposure is expected to be low, and the risk is therefore not considered material. |
|
|
|
| Material | |
Droughts | 9% of our sites are located in or adjacent to areas potentially associated with a very high drought hazard score. The gross financial impact of drought does not exceed our materiality threshold, so this hazard is not material. Given strong preparedness measures and high site‑level resilience, the net financial exposure is expected to be low, and the risk remains non‑material. |
|
|
|
| Not material | |
Heatwaves | 23% of our sites are located in or adjacent to areas potentially associated with a very high hazard score for heatwaves. The gross financial impact of heatwaves does not exceed our materiality threshold, so this hazard is not material. Given strong preparedness measures and high site‑level resilience, the net financial exposure is expected to be low, and the risk remains non‑material. |
|
|
|
| Not material | |
Wildfire | None of our sites are located in or adjacent to areas potentially associated with a very high wildfire hazard score. No significant impacts are expected, and the risk is therefore considered to be non-material. |
|
|
|
| Not material | |
Storm | 4% of our sites are located in or adjacent to areas potentially associated with a very high storm hazard score. The gross financial impact of storms does not exceed our materiality threshold, so this hazard is not material. Given strong preparedness measures and high site‑level resilience, the net financial exposure is expected to be low, and the risk remains non‑material. |
|
|
|
| Not material | |
Extreme Precipita-tion | 58% of our sites are located in or adjacent to areas potentially associated with a very high extreme precipitation hazard score. Extreme precipitation does not significantly affect our operations; therefore, the gross financial impact does not exceed our materiality threshold, and the hazard is not considered material. With strong preparedness measures and high site‑level resilience, the net financial exposure is expected to remain low, and the risk non‑material. |
|
|
|
| Not Material | |
 | |||||||


Transition risks and opportunities (E1.SBM-3_01) The results of climate-related transition risks and opportunities are presented in the table below. We identified three transition risks and four transition opportunities for Signify. Of those identified, three of the transition opportunities are relevant. Transition risks and opportunities are considered relevant if the level is “High (H)” in the short term. |
Short term (1 year) | Medium term (1 – 5 years) | Long term (>5 years) | Quantification | Mitigation/adaptation | ||||
|---|---|---|---|---|---|---|---|---|
Policy and regulation | Tightening climate disclosures & products standards |
| Global divergence of regulations |
| Net-zero alignment pressure |
| Not material | Signify is well prepared for newly introduced and upcoming regulations while leveraging our CTP to drive climate transition in our operations and across value chain, stay competitive through sustainable innovation and product design, and minimize related financial impact due to imposed emissions-related pricing or taxes. |
Technology (inc. AI) | Emerging energy and data intensity |
| Broader environmental impact of AI |
| Systemic dependency risk |
| Not Material | Signify’s operations are not heavily dependent on AI. We have a responsible use of AI policy that guides our use of AI within Signify. We are actively engaging our AI and cloud service providers to improve the efficiency of their algorithms and source carbon-free energy. In the meanwhile, we leverage AI and digitalization in our smart and connected lighting systems to facilitate more efficient use of electricity and maximize energy and emissions reduction for our customers worldwide. |
Supply chain | Limited supplier readiness for ESG reporting requirements |
| Rising cost and competition for low-carbon materials and components |
| Sustainable materials not cost competitive |
| Not Material | Signify’s supplier sustainability program drives co-development of SBTs, renewable sourcing, and circular co-design with suppliers. The program incentivizes sustainability performance of suppliers, while investing in supplier engagement tooling and foster partnerships for sustainable materials innovation. In addition, we maintain a wide-ranging supply network and dual sourcing strategy. We further diversify the sourcing of critical materials and components and are actively monitoring market dynamics. |
Market and product | Customer preference shift |
| Increased competition in the low carbon marketplace |
| Structural market transformation |
| EUR 166 million | Signify holds a strong, distinctive position in driving the LED and connected‑LED lighting transition. Through ongoing sustainable innovation, we will develop new products, systems and services that open niche markets with higher energy efficiency and connectivity, increasing revenues from low‑carbon and sustainable design. We will use our broad portfolio to capture opportunities across market segments and rely on third‑party verification to demonstrate our leadership in product environmental impact. In our Climate Transition plan, we advocate for a 3% annual renovation rate to accelerate LED adoption, and we quantify this opportunity as 3% of our 2024 LED revenues. |
Reputation | Recognized sustainability leadership |
| Stakeholder awareness and ESG rating competition |
| License to operate |
| Not Material | Clear, credible and transparent disclosure of our impact and strategy for climate and circularity strengthens Signify’s brand reputation while improving customers confidence in our energy efficient and low-emission portfolio. However, the opportunities level is deemed low as currently only limited numbers of large customers prioritize sustainability performance in tenders, while in the long term sustainability credentials will become the license to operate, making it more challenging to stand out. |
Energy security | Volatile energy prices |
| Energy efficiency to improve energy security |
| Grid bottlenecks further intensify energy insecurity |
| Not Material | As energy systems shift toward renewables and demand-side flexibility, our lighting technologies — among the most energy efficient in the world — are uniquely positioned to contribute to reduced grid load, lower emissions, and smarter energy use. LED and connected lighting solutions consume up to 80% less electricity than conventional technologies, directly reducing Scope 2 emissions for our customers and supporting national energy efficiency targets. When integrated with digital controls and sensors, these systems enable demand response, load balancing, and peak-shaving, helping stabilize renewable-heavy grids and enhance overall energy resilience. |
 | ||||||||


Our business resilience analysis
Our company strategy and business model remain firmly rooted in sustainability and energy efficiency, which are essential in the transition towards a low-carbon and resilient economy. This makes us climate-resilient in relation to climate change while navigating global energy transitions.
The scope of our resilience analysis covers Signify’s strategy and business model, including our own operations and upstream and downstream value chain where applicable. Based on our climate risk assessment, the resilience analysis was done in line with the same time horizons and scenarios used for material physical and transition risks, while taking into account our decarbonization targets (net zero by 2040). Over the short-term, medium-term and long-term. The resilience analysis is performed annually. The resilience of company strategy and business model is embedded in the annual ERM cycle. The resilience against material physical risks and transition risks is evaluated based on the site-specific vulnerability assessment, the results of which are incorporated into the site-level business continuity plan (BCP) based on the local context. Insights gathered from the vulnerability assessment informs business continuity decision making. Integrating these findings into the BCP enhances organizational preparedness, safeguards the continuity of critical operations, and minimizes recovery time in the event of climate‑related disruptions. Preventive and responsive measures are developed accordingly to ensure the short-term and long-term business continuity. Ultimately, this strengthens the site's overall resilience and supports a robust risk management framework aligned with Signify’s sustainability and operational goals.
As we transition to a low-carbon and more resilient economy, in line with a 1.5°C climate scenario, our key assumption of uncertainty is that consumer and business awareness of, and demand for, low-carbon products will increase. We also expect regulatory requirements for low emissions and high energy efficiency to continue. Additionally, we anticipate that the global power grid will continue its shift toward renewable energy, which will require improvements in energy efficiency and the expansion of grid capacity. This shift will make it more challenging for the lighting industry to generate revenue from less energy efficient conventional technologies, while simultaneously creating opportunities for innovative, low-carbon products.
Sustainable product design and offering is at the core of our strategy and business model. We ensure there is sufficient investment in sustainable innovation to keep advancing the energy efficiency of our portfolio and seizing the material transition opportunity as described in the table above. With a strong and differentiated portfolio of low-carbon and energy efficient products, we are responding to evolving market trends that emerged due to climate change and the energy crisis.
One material physical risk (flooding) was identified for 2025. Accordingly, we assessed the resilience of our sites that were identified with high flooding risk via a vulnerability survey. The results show that our sites have a high level of preparedness and resilience at the individual site level, and thus the net financial exposure is expected to be minimized.
Since there are no material transition risks identified for 2025, no anticipated financial effects from material transition risks as well as the mitigation actions and resources were considered.
Ultimately, our resilience analysis approach in line with material risks and opportunities deepens our understanding about business resilience and allows response plans to be developed in a timely matter. Mitigating climate-related risks in our supply chain and climate change-related physical risks in different geographical locations could potentially interrupt our supply chain and business continuity. Nevertheless, due to our wide-ranging supply network and our dual sourcing strategy, these risks are well monitored and not considered material at present.
Regular surveys are conducted by Signify to identify and rank suppliers based on their vulnerability to climate-related physical and transition risks. As a result, we can identify hotspots accordingly and develop a robust adaptation strategy or business continuity plan (including but not limited to dual sourcing practices) for our operations as well as our supply base. This enables us to respond appropriately and timely, and prevent disruptions to our business operations. We optimize our supply chains for their efficiency and resilience to climate risk.
5.2.2 Resource use and circular economy (E5)
At Signify, we recognize the importance of adopting circular economy practices to preserve value and reduce waste, increase resource efficiency, and promote sustainable consumption and production. Our efforts address our value chain with key improvements, such as remote serviceability (connected lighting) and end-of-life services. By minimizing material waste and reducing the environmental impact, we create an ecosystem that extends the life of our lighting products.
That is why, as part of our Brighter Lives, Better World 2025 sustainability program, we had the ambition to double our revenues from circular products, systems, and services to 32% by the end of 2025. Additionally, we are committed to more sustainable packaging, for example, removing fossil-fuel based plastics from our consumer packaging since 2019, and to sending zero manufacturing waste to landfill. Our actions cover the entire life cycle of a product (from production, use and re-use to waste management) and directly contribute to the achievement of SDG 12: Responsible consumption and production.
Our approach
The circular economy seeks to drive economic growth while using resources more efficiently, ensuring progress is no longer tied to increasing resource consumption. Products are designed and built as part of a value network where they will be used, serviced, and upgraded to meet customers' needs. Their lifetimes can be prolonged and where possible they can be reused, refurbished, remanufactured, or recycled, avoiding the creation of waste to landfill.
To support effective implementation, Signify has established a range of circularity‑related policies, with regular updates shared through an internal platform accessible to all relevant stakeholders. In 2025, Signify published its Circular Economy Policy, which outlines an approach built around three key commitments. This policy—together with Signify’s broader suite of circularity policies—is informed by leading international frameworks, including the European Green Deal and its key legislative components such as the EU Circular Economy Action Plan (EU CEAP), the Ecodesign for Sustainable Products Regulation (ESPR), and the Packaging and Packaging Waste Directive (PPWR). The three key principles focus on:
Use less: Reduce material use in products and packaging, prioritize recycled and renewable materials, and limit the environmental footprint of materials;
Use longer: Extend product lifespan through better design, serviceability, and upgradability, including offering lighting as a service;
Use again: Minimize waste through reuse, remanufacturing, and recycling, maintaining zero manufacturing waste to landfill.
Signify describes its circular economy activities in five concentric loops, as seen in the figure below. The five loops represent:
Service and repair activities aimed at maintaining or restoring the function of products, so they remain usable for longer, thereby extending the technical and economic lifespan;
Upgrade and or refurbishment of products at the end of their useful life so they can be resold and continue functioning in the market;
Remanufacturing of obsolete or end-of-life products to a like-new condition, including disassembly and replacement of worn components;
Parts harvesting to recover valuable parts from products that are no longer in use, so those parts can be sold, reused or repurposed in other products;
Recycling products at the end of their life to recover raw materials, which can be reprocessed and reintroduced into the economy.
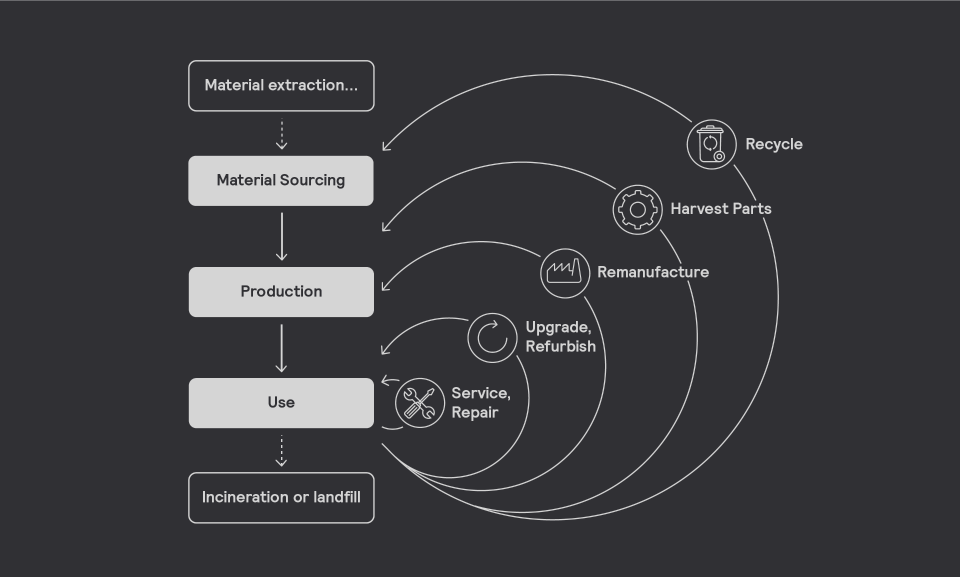
Material impact, risks and opportunities
IRO-1 – Description of the processes to identify and assess material resource use and circular economy-related IRO, E5-1 Policies related to resource use and circular economy
The double materiality assessment identified the following material IRO:
Extraction of primary raw materials – actual negative impact – upstream
Higher purchasing cost - potential risk – own operations and upstream
Circular principles - actual positive impact – own operations, upstream and downstream
Circular market growth – potential financial opportunity – own operations
Waste generation – actual negative impact – upstream and our own operations
The table below summarizes the relevant policies and associated details, as well as their linkage to the E5 IRO. For further information on the DMA, see section 5.1, Brighter Lives, Better World 2025 progress.
Policy | Description | Related IROs | Key stakeholders & scope | Accountability & governance |
|---|---|---|---|---|
Sustainability Policy | The policy sets out our commitment to mitigating climate change in our value chain, by reducing carbon emissions, increasing energy efficiency and the use of 100% renewable electricity. | 1, 2, 3, 4, 5 | These policies cover our entire value chain and relevant stakeholders including employees, sub-contractors, and suppliers. | These policies are overseen by the Chief Strategy, Sustainability and Marketing Officer. The implementation responsibility is with the Global Head of Sustainability. |
Circular Economy Policy | The policy guides the company’s transition toward a circular business model by embedding circular principles across the value chain. | 1, 2, 3, 4, 5 | ||
Sustainable Design Procedure | It applies to all our new products and maintenance services and sets the general principles and ambitions. | 3, 4 | The procedure is only available to internal stakeholders on our policy and procedures database. | The Research and Development, Product and Commercial teams are responsible for its application. |
Sustainable Packaging Requirements | It applies to all product packaging resourcing processes which include certified renewable sources such as FSC, SFI and PEFC. | 1, 2, 3, 4 | The requirements are available on our website for suppliers and external stakeholders. | The packaging designers, architects and procurement team are responsible for its application. |
Environmental, Health & Safety Policy | It defines our commitments to protecting our environment and creating a safe and healthy workplace for all employees and involved stakeholders within our own operations. This policy is aligned with ISO45001 (Occupational Health & Safety Management), ISO14001 (Environmental Management System) and ISO50001 (Energy Management). | 3, 5 | The policy applies to all Signify sites, majority owned joint ventures, and service projects in the marketplace. The policy is available publicly on our website. | The policy is overseen by the Chief Strategy, Sustainability and Marketing Officer. The implementation responsibility is with the Global Head of EHS. |
Supplier Quality Manual | This manual outlines key sustainability requirements that all suppliers must comply with, contributing to the advancement of the circular economy, including Supplier Sustainability Declaration; sustainability audits; regulated substance management; conflict minerals and responsible sourcing; carbon disclosure; wood and packaging requirements; and supply chain security audits (SCS). | 1, 2 | It applies to all newly onboarded suppliers without exception. It is distributed to all suppliers. | The procurement team is responsible for ensuring its application. |
Waste Management Standard | It establishes the procedures for handling and disposal of waste generated by different processes and to define proper waste segregation to promote environmental protection and occupational health & safety. | 5 | It is an internal document which is only available to internal stakeholders through our quality system. | The policy is overseen by the Chief Strategy, Sustainability and Marketing Officer. The implementation responsibility is with the Global Head of EHS. |
Through the assessment we engaged with various stakeholders. We plan to include affected communities and stakeholders in the assessment as well as in the review of the action plan, policies and targets in 2026 as part of the DMA process. The impacts, risks and opportunities are further described below in the resource inflows, resource outflows and waste management sections.
When conducting our materiality assessment for E5 topics, we looked at our entire value chain and screened the business activities and assets associated with resource use and circular economy. The screening was done based on a mapping of activities, as part of step 1 of the DMA. Read more about our value chain in section 5.1, Brighter Lives, Better World 2025 progress.
For resource inflows, we specifically looked at our main commodities and locations of key suppliers. For resource outflows, we focused on our products and circular principles integrated and leveraged the information from the Environmental Product Declarations (EPDs) generated from our digital Life Cycle Assessment (LCA) tool. For waste management, we focused on our manufacturing sites, distribution centers and suppliers to assess the type of waste and the maturity in terms of processes already in place.
In 2025, we renewed our Circular Economy Action Plan (CEAP), which directly addresses our material impacts, risks, and opportunities across key business functions. The CEAP was developed in close collaboration with key internal stakeholders, including R&D, EHS, and Procurement. Its effectiveness is monitored through a structured internal assessment cycle throughout the year, during which progress and outcomes are reviewed. These reviews may lead to adjustments in policies, targets, or actions when necessary.
As the CEAP was renewed at the end of 2025, various actions have been initiated and early progress has been made. However, as these actions are newly introduced, progress has not yet been evaluated against the 2024 baseline at the time of this annual report.
Details on the of material resources used for our manufacturing activities are provided in the section on inflows. With respect to the resources allocated to the plan, we refer to the CapEx and OpEx reported under the EU Taxonomy objective on the Transition to a Circular Economy. No evidence has been found of severe negative impacts that require provision of remedy for harmed stakeholders. Through its various programs Signify aims to prevent negative impacts in the first place.
Specific metrics and targets are also described in each section, none of which are linked to a regulation requirement nor validated by an external body. We considered the production phase (inflow), use phase (outflow) and the end of functional life of products and materials (waste management) in setting targets, more details on the targets are provided in each topical paragraph.
Inflows
E5-2 – Actions and resources related to resource use and circular economyE5-3 – Targets related to resource use and circular economy
As part of our internal action plan on circular economy, we have committed to accelerating the transition to circular practices related to inflows and resource use by:
Prioritizing reduction and reuse of products to achieve a resource-efficient circular economy;
Focusing on materials and transitioning away from the use of primary (virgin) resources;
Promoting and increasing the use of secondary (recycled) resources;
Enforcing sustainable sourcing practices and use of renewable resources.
The action plan for inflows is managed by the Procurement team in collaboration with the businesses.
At Signify, we place strong emphasis on managing material inflows responsibly as part of our broader circular economy strategy. By focusing on the resources in our value chain, we aim to reduce our reliance on virgin materials and increase the use of sustainable, high-quality alternatives. Within this context, the new Signify Circle framework establishes clear targets for the 2026–2030 period related to material inflows. Specifically, we have set measurable objectives for the percentage of recycled content used in Signify Circle products, ensuring a steady increase in the use of secondary materials and reducing the overall impact of raw material consumption. In addition, the targets address other key areas such as the development and promotion of circular business models, including revenue generated from Lighting-as-a-Service (LaaS).
In addition, we are committed to full compliance with our Signify Regulated Substance List (RSL) - with no waivers allowed, having more sustainable packaging, and reinforcing our dedication to safe and responsible material sourcing. The RSL combines legal requirements with Signify’s own environmental and safety standards.
To track the progress and effectiveness of our actions and policy, in 2025 we continued to focus on collecting and aggregating accurate data from our suppliers. We are collaborating with our key vendors per material group to declare the content of primary, secondary and biological (where relevant) substances in their materials.
Our key commodities include metals, plastics, glass, e-components, cables, finished goods and packaging. These represent over 80% of our total suppliers. We focused our sustainability efforts on metals (specifically aluminum and steel), plastics, glass and packaging as these material groups showed the greatest potential in the approach to minimizing the use of virgin materials and increasing the share of secondary materials. These prioritized suppliers are located across the different regions: Asia Pacific, Europe, and the Americas.
E5-4 - Resource inflows
In 2025, 12% (2024: 12%) of total weight of materials were from biological materials and 20% (2024: 19%) were from secondary materials, See section 5.5, Reporting principles for more details and definitions. 79% (2024:73%) of Signify’s total biological material weight is coming from sustainably sourced materials. This applies to biological products certified by credible schemes that ensure responsible forest management and sustainable supply chains. The relevant material groups are packaging wood, packaging paper/cardboard, and (bio-)plastics. Main accepted sustainability certifications include FSC, SFI, PEFC, Rainforest Alliance, and ISCC Plus.
In Europe, Signify has taken steps to increase the use of recycled plastics and bioplastics in its products. During 2025, a total of 238.5 metric tonnes of recycled plastics and bioplastics were added to Signify’s material inflows in the region. Regarding reduction and reuse, we are continuously evaluating and improving our designs. In 2025, we successfully designed our GentleSpace Gen 4 to be 20% smaller and lighter than its predecessor, featuring a housing made with 85% post consumer recycled aluminum. Next to that, we have initiated a major re-use project in collaboration with a retail customer on the re-use of luminaires. For this project, luminaires from various shop locations are cleaned and inspected within our factors and consequently sent to the customer's new opening locations.
In 2025, Signify implemented a refined methodology for weight calculations, resulting in more granular and accurate data. This methodological enhancement improved the reliability of the reported figures and explains the observed decrease in total reported weight compared to the 2024 annual report, which reflects improved measurement and calculation rather than operational changes. We have also retroactively applied this methodology to the 2024 data, yielding more representative figures than those presented in the Annual Report 2024.
2024 | 2025 | |
|---|---|---|
Total weight of all materials (metric tonnes) | 280,055 | 268,328 |
Weight of technical materials (metric tonnes) | 246,170 | 236,047 |
Weight of biological materials (metric tonnes) | 33,885 | 32,281 |
Weight of secondary materials (metric tonnes) | 52,904 | 53,914 |
Percentage of secondary materials and biological materials, inlcluding sustainable sourcing | ||
2024 | 2025 | |
Percentage of secondary materials | 19% | 20% |
| 88% | 89% |
| 18% | 1% |
| 33% | 28% |
| 43% | 44% |
| 71% | 69% |
| 22% | 5% |
| 19% | 19% |
| 2% | 2% |
| 0% | 0% |
Percentage of biological materials | 12% | 12% |
Percentage of biological material that is sustainably sourced | 73% | 79% |
| 40% | 49% |
| 100% | 100% |
| 88% | 88% |
With the creation of the Signify Circle framework and the updated Circular Economy Policy in 2025, we have set the roadmap for the next 5 years where we expect to capture market opportunities and further embed circularity into the customer value proposition. To do so, Signify circularity principles have been integrated into the innovation and product development processes. This allows us to explore sustainable and recycled alternatives and review our sourcing practices to reduce virgin material use and increase recycled and non‑virgin materials. We will advance this transformation by delivering circular-economy training to our procurement employees and to key suppliers. The roll-out of this program is planned throughout 2026.
The sustainable performance of a lighting product and system depends heavily on its energy efficiency and durability. Any transition to more sustainable materials must therefore ensure that these essential performance attributes are fully maintained. When selecting sustainable materials, we apply the following guidelines:
Minimize the weight and volume of materials;
Applied materials should be recyclable where possible;
The design of our product should allow easy separation at end-of-life and facilitate recycling;
When changing over to a sustainable material, the environmental footprint of the alternative material should be equal or better compared to the regular material, underpinned with LCA data;
To support circularity, materials with Post- Consumer-Recycled (PCR) content are prioritized;
In plastics, mechanically recycled PCR solutions are preferred over chemically recycled PCR;
Bio-based or bio-circular plastics are a second-best solution, after PCR. Natural sources for these materials should be disclosed and certified (ISCC PLUS);
In metals, as far as technology allows, use secondary sources with a high scrap percentage;
In packaging, follow the respective packaging requirements which provides guidelines on prioritizing PCR paper and cardboard as well as plastic.
Outflows
E5-2 – Actions and resources related to resource use and circular economyE5-3 – Targets related to resource use and circular economy E5-5 - Resource outflows
As part of our internal action plan on circular economy, we have committed to accelerating the transition to circular practices regarding outflows by:
Designing products with a longer lifetime, improved durability, and increased serviceability and repairability to extend their use phase;
Developing take-back, remanufacturing, and refurbishment programs to keep products and components in use;
Providing clear disassembly and recycling instructions to facilitate responsible product recovery.
The Research & Development team leads on this objective and invests annually in innovation and developing new products with circular attributes. See Sustainable Innovation in section 5.1, Brighter Lives, Better World 2025 progress.
In 2025, we renewed our Sustainable Design Procedure which assesses new innovations based on criteria related to the circularity attributes (serviceable luminaires, circular components, circular services), the weight and materials used, the packaging (renewable material, decreased weight) and the elimination of harmful substances (ROHS, REACH, mercury).
In 2020, we adopted an internal framework to track our progress towards the Brighter Lives, Better World 2025 program target for Circular revenues. The framework defined circular attributes to support the increase of circular design in our different products. As new products are created, the circular attributes are considered and implemented.
By the end of 2025, Circular revenues reached 37%, up from 35% in 2024. This exceeds our 2025 target of 32%, which was originally set based on a 2019 baseline of 16%. This strong performance was supported by the launch and enhancement of product lines designed to meet circular economy attributes.
In our efforts to transition to a circular economy, we continued to extend our lighting for circularity portfolio in 2025. Via well-established sustainable design rules, Signify continuously lowers the weight of new product designs, resulting in less material use and costs for our product portfolio. The sustainable design rules are also optimized for circularity, resulting in products that can be reused, serviced/repaired, upgraded/refurbished, remanufactured, or recycled. For more information about the performance and benefits of our lighting for circularity solutions, please visit our website.
Building on this approach, the Signify Circle framework sets clear 2026–2030 targets for material outflows, focusing on enhancing product durability, repairability, and recyclability to extend product lifetimes and reduce waste. We aim to maximize material recovery through reuse, remanufacturing, and refurbishment, and to expand circular business models - such as Lighting-as-a-Service - to keep products and materials in use longer.
Our circular innovations cover four categories which are described in Sustainable Innovation, section 5.1, Brighter Lives, Better World 2025 progress. Here are two examples of products that meet the criteria:
Retrofit project with Acerta
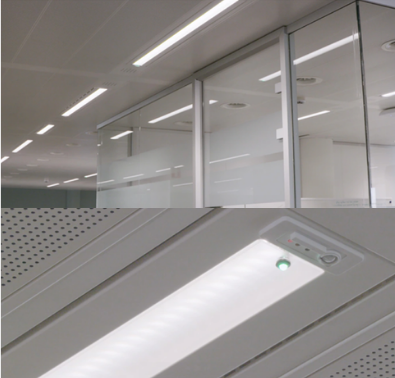
Instead of removing and discarding the existing lighting system, the Acerta office, in Belgium choose a retrofit approach. This involved retaining the current fixtures and renewing their internal components, replacing outdated fluorescent lights with modern LED modules. Beyond upgrading to more energy-efficient technology, the new installation features connected, smart-controlled LED luminaires operating via a wireless protocol. This enables energy savings, supports flexible reconfiguration, and allows for easier future adaptations - reducing unnecessary material waste and avoiding disruptive renovation work.
Circular Upgrade on the A470 in Wales
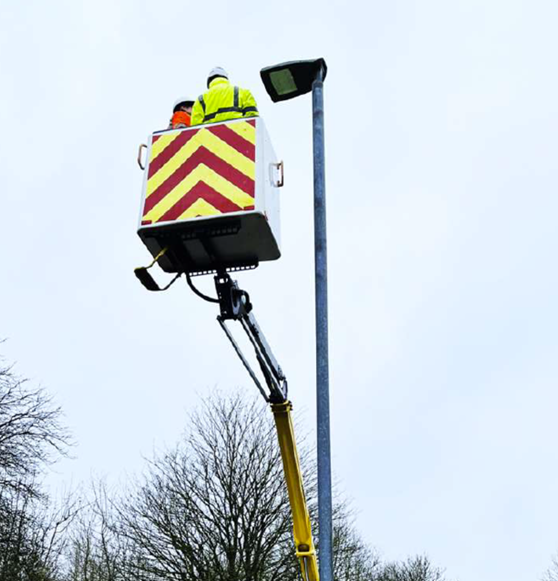
This lighting upgrade project exemplifies circular economy best practices by extending the life of the existing Luma Gen 1 luminaires through modular component replacement. The upgrade kit replaces only the LED boards, driver components, and connectivity modules, while preserving the original columns and housings - significantly reducing material waste and avoiding the need for new manufacturing. The new 74W, 4000K system delivers around 42% energy savings and reduces CO2 emissions by about two tonnes per year. In addition, its serviceable design and digital tagging support future maintenance and upgrades, further extending the system's long term value.
We are committed to delivering serviceable, intelligent lighting solutions that combine high efficiency with long‑term sustainability. Our products come equipped with the Signify Service Tag app, which provides access to information on spare parts. This QR-code-based identification system enables smart product maintenance and diagnostics, making it easier to manage installations, maintenance, and spare parts.
Through Service Tag, customers can efficiently replace failed drivers, support repairs, and extend the product life of their luminaire. In addition to using sustainable materials and technologies, we are constantly innovating to improve the characteristics of our products.
The repairability of our products is identified through our products’ serviceability. The serviceability refers to the ability to prolong the technical and economic lifetime of the product, after it has been put into service. More than half of our reported Circular revenues are aligned with the serviceability criteria.
The minimum criteria for product serviceability are the following:
Identifiable: easy access to product information, clear indication which components are serviceable (e.g., Service Tag);
Accessible: warranty or service agreement;
Removable: listed spare parts must be easily accessible and replaceable.
At Signify, we have made significant improvements in enhancing the durability and lifetime of our lighting products through innovative technologies and sustainable practices. By integrating advanced materials and smart design, we have developed products that not only last longer but also maintain high performance over time. Our commitment to quality and longevity ensures that our products provide reliable and efficient lighting solutions for various applications. These innovations reduce the need for frequent replacements, thereby minimizing waste.
Typical life of the lighting installation1 | 2024 | 2025 | |
|---|---|---|---|
Outdoor professional LED based products | <100,000 | 90,525 | 85,561 |
Indoor professional LED based products | <50,000 | 66,079 | 59,000 |
Consumer products | n.a | 20,393 | 21,221 |
OEM products (indoor and outdoor) | n.a | 36,000 | 36,000 |
Conventional products | n.a | 19,200 | 19,077 |
- According to the LightingEurope guideline on lifetime for LED products, outdoor installations remain in place for 100,000 hours, and indoor installations remain in place for 50,000 hours or less (depending on the application). Product lifetimes should not be claimed higher than 100,000 hours according to this guide. With the average product lifetimes achieved under these constraints, nearly all products are expected to last at least as long as the installation lifetime.
The information regarding the durability of our products represents the service lifetime. In 2025, we have refined our methodology enhancing the reliability of represented figures. This refinement has resulted in a revision of the 2024 figures compared to the data presented in the Annual Report 2024. Similar to the update for Inflows data, we consider these figures to be more representative.
It should be noted that the benchmark used for comparison (LightingEurope) reflects European market practices only, whereas our disclosed performance data covers products sold globally. In several non-European markets, typical lifetime specifications and market practices are significantly lower, which may affect overall averages when assessed on a worldwide basis. Our portfolio averages 85,561 hours, with many products reaching the 100,000 hours (we follow the LightingEurope guideline not to claim higher). Signify's indoor portfolio also performs above the industry norm, averaging 59,000 hours compared to the 50,000 hour benchmark.
We are committed to ensuring most of the materials in our products are recyclable through our design policies. Some of our products' key commodities have a high level of recyclability such as glass, metals and paper.For packaging, our policy requires the use of paper containing at least 80% recycled content and that is fully recyclable.
When virgin materials are used, they must be responsibly sourced from certified sustainable suppliers. In 2025, for product packaging recyclable content, we have chosen the main commodities based on volume, with paper and cardboard accounting for 89%, plastic accounting for 2% and wood accounting for 6%.
2024 | 2025 | |
|---|---|---|
All products | 43% | 48% |
Professional LED based products | 42% | 48% |
| 47% | 50% |
| 41% | 47% |
Consumer products | 46% | 45% |
OEM products (indoor and outdoor) | 58% | 57% |
Conventional | 41% | 40% |
Recyclable content % in packaging | ||
All selected packaging | 98% | 98% |
Paper/cardboard | 99% | 99% |
Plastic | 61% | 49% |
Wood | 100% | 100% |
Waste management
E5-2 – Actions and resources related to resource use and circular economy
E5-3 – Targets related to resource use and circular economy
E5-5 - Resource outflows
We are dedicated to responsible waste management practices that minimize our environmental impact. By implementing comprehensive recycling programs and reducing waste generation across our operations, we ensure that materials are reused and repurposed effectively. We have a commitment of zero manufacturing waste to landfill. As part of our internal Circular Economy Action Plan we are committed to accelerate the transition to circular practices regarding waste management by:
Reducing waste streams, including hazardous waste, caused by manufacturing sites and preventing these streams ending up in landfills;
Enabling more sustainable waste treatment methods like reuse and high-quality recycling;
Collecting more and accurate data from manufacturing sites and warehouses, including data on key sources of waste generation, and;
Engaging with suppliers in risk countries on responsible waste management practices.
Within our Circular Economy Action Plan, our objective is to improve our waste management practices across our value chain and to reduce waste. To achieve this objective, the EHS team, local site leaders and Innovation teams are leading key initiatives and programs aimed at improving our waste management practices. Our target is to achieve zero waste to landfill from our manufacturing sites. This goal applies to all levels of the waste hierarchy and is measured in kilograms. It is an annual, absolute target, meaning there is no baseline year. In 2025, as part of its Low Nature Impact program, Signify introduced a new target focused on hazardous waste. The objective is to reduce hazardous waste at all Signify manufacturing sites to 20 kg per 1,000 units produced or less by 2030.
We have focused on driving continuous improvements and optimizing processes across our sites. Signify continues to meet its commitment to send zero waste to landfill for all its manufacturing sites. We enhanced our waste segregation practices, provided waste awareness training, and shared best practices across regions.
Signify registered a total of 36,889 metric tonnes of waste in 2025. In comparison to our inflows, our total outflow waste is minimal. Our recycling programs address waste arising from manufacturing activities, such as glass or canteen waste, as well as from suppliers, such as packaging materials. 90% of total waste was recycled in 2025 (2024: 90%) and, like in 2024, we continued to recycle 100% of our metal and glass waste. We generated 1,883 metric tonnes of hazardous waste, of which 43% was recycled (2024: 1,666 metric tonnes, 33% recyled). The waste reporting scope includes both manufacturing sites and warehouses. In 2024, the reporting scope covered only factories, and therefore no primary data was collected from warehouses. Therefore, the warehouse data from 2025 has been used to make estimations for the amount of waste in 2024.
2024 | 2025 | |
|---|---|---|
Total waste generated | 38,626 | 36,889 |
Total non-recycled waste | 3,943 | 3,680 |
Percentage non recycled waste | 10% | 10% |
Total non-hazardous waste | 36,960 | 35,006 |
Non-hazardous waste diverted from disposal | 34,128 | 32,396 |
Recycled non-hazardous waste | 34,128 | 32,396 |
Non-hazardous waste directed to disposal | 2,832 | 2,611 |
Incinerated non-hazardous waste | 2,599 | 2,384 |
Landfilled non-hazardous waste | 238 | 227 |
Total hazardous waste | 1,666 | 1,883 |
Hazardous waste diverted from disposal | 555 | 814 |
Recycled hazardous waste | 555 | 814 |
Hazardous waste directed to disposal | 1,111 | 1,069 |
Incinerated hazardous waste | 729 | 865 |
Landfilled hazardous waste | 377 | 204 |
Total radioactive waste | n.a. | n.a. |
We fully comply with the European Waste of Electrical and Electronic Equipment (WEEE) directive. To reduce the impact of our products ending up in landfills, we partner with a variety of recycling programs and companies throughout Europe and North America. Signify has developed solutions to reduce or eliminate waste throughout the entire product life cycle, with a prime example being the 3D-printed Signify myCreation products. All manufacturers of printed parts are using at least 65% recycled or bio-circular plastics, with the entire bio-circular supply chain ISCC Plus certified. We repurpose waste materials, such as recycled water cooler jugs for the Water Blue collection and old street lighting for the Urban Grey collection. Signify myCreation products are produced locally and on demand to minimize unsold stock. Any rejected parts are recycled in-house for reuse. The 3D-printed products are designed for easy disassembly, using no glue, no paint, no permanent fasteners, and minimal screws. Printed parts can be recycled through our EU Take Back program to create new products.
5.2.3 EU Taxonomy
The European Commission has introduced the EU Taxonomy as a crucial mechanism to enhance sustainable investments and achieve carbon neutrality in the EU by 2050. At Signify, we aspire to serve as a catalyst for transformation and are dedicated to amplifying our positive impact on both the environment and society. We consistently explore opportunities to expand our portfolio of products and solutions that contribute to a more sustainable future. This commitment is evidenced by the significant increase in our LED-based revenues over the past 12 years, rising from 29% in 2013 to 91% in 2025.
This transition has transformed us from a company focused on conventional lighting, which is characterized by low energy efficiency, to a leading LED enterprise. This significant shift has been facilitated by ongoing investments in research and development aimed at sustainable innovation. In 2025, we allocated EUR 255 million (2024: 253 million) towards sustainable innovation, which constitutes 96% (2024: 95%) of Signify's total R&D spend.
The EU Taxonomy reporting framework
The European Commission created a catalog of economic activities to assess whether they significantly contribute to a sustainable economy, a framework known as the EU Taxonomy. The framework EU Taxonomy Regulation (EU) 2020/852 is supplemented by the Climate Delegated Act (EU) 2021/2139, the Environmental Delegated Act (EU) 2023/2486, the Disclosures Delegated Act (EU) 2021/2178 and all the applicable amendments up to, and including December 31, 2025, such as the (EU) 2026/73. Signify has elected to report the simplified reporting tables under in line with the Omnibus package.
For the financial year 2025, Signify reports its eligibility and alignment within six environmental objectives: Climate Change Mitigation, Climate Change Adaptation, Water and Marine Resources, Transition to a Circular Economy, Pollution Prevention and Control, and Biodiversity and Ecosystems. Given the nature of our business, our main contributions are focused on Climate Change Mitigation and the Transition to a Circular Economy.
Signify's economic activities
The definitions of the EU Taxonomy are broadly formulated which leaves room for companies to interpret it for their business activities. We applied judgment, interpretations and assumptions based on currently available information. Future guidance could result in more accurate definitions and other reporting obligations, which could impact our future EU Taxonomy reporting. The analysis of Signify’s economic activities in the context of the EU Taxonomy has revealed that the following activities contribute to the environmental objectives:
CCM 3.5 Manufacture of energy efficiency equipment for buildings. We allocate manufacturing of LED and connected technologies for indoor spaces to this economic activity.
CCM 3.6 Manufacture other low-carbon technologies that result in substantial GHG emission reductions in other sectors of the economy. We allocate manufacturing of LED and connected technologies for outdoor spaces to this economic activity.
CCM 6.5 Transport by motorbikes, passenger cars and light commercial vehicles. We allocate here the investment (CapEx) made in company light vehicle leasing.
CCM 7.2 Renovation of existing buildings. We allocate here the investment (CapEx) done in renovation of existing factories and offices.
CCM 7.3 Installation, maintenance and repair of energy efficiency equipment. We allocate installation, maintenance and repair activities of lighting products such as lamps and luminaires, without controls, for indoor spaces to this economic activity.
CCM 7.4 Installation, maintenance and repair of charging stations for electric vehicles in buildings (and parking spaces attached to buildings). We allocate in this activity the investments (CapEx) related to charging stations for electric vehicles.
CCM 7.5 Installation, maintenance and repair of instruments and devices for measuring, regulation and controlling energy performance of buildings. We allocate installation, maintenance and repair activities of lighting systems, such as luminaires with control modules, for indoor spaces to this economic activity. The system might also include sensors, triggers, software, on-site or cloud connectivity.
CCM 7.7 Acquisition, ownership or leasing of buildings.We allocate in this activity the investments (CapEx) done related to aquisition and leasing of real estate assets.
CE 1.2 Manufacture of electrical and electronic equipment. We allocate here manufacturing of electrical and electronic equipment and their related activities, mostly related to lighting, including LED technology and conventional lighting.
CE 3.2 Renovation of existing buildings. We allocate here the investment (CapEx) done in renovation of existing factories and offices.
CE 5.1 Repair, refurbishment and remanufacturing. We allocate services offered to customers to repair, refurbishor remanufacture lighting products and related items.
CE 5.2 Sale of spare parts. We allocate manufacturing of components aimed at replacing an existing part of a final product.
CE 5.5 Product-as-a-service and other circular use and result-oriented service models. We allocate products and related services that are marketed under a Light as a Service and other pay-per-use business models.
The analysis has not revealed any activities that contribute significantly to the four other environmental objectives, namely, Climate Change Adaptation, Water and Marine Resources, Pollution Prevention and Control and Biodiversity and Ecosystems. Our revenues are connected to one main economic activity (as per NACE codes), specifically C27.40.
Signify's approach
The EU Taxonomy identifies Turnover, Capital Expenditure (CapEx), and Operating Expenditure (OpEx) as essential performance indicators that must be reported. The financial data relevant to Signify's EU Taxonomy reporting is derived from the IFRS consolidated financial statements for the fiscal year 2025.
In 2025, we continued the comprehensive effort started in 2024 to operationalize the regulation for Signify. This endeavor resulted in a detailed list of product attributes for turnover and project attributes for CapEx and OpEx, ensuring compliance with all requirements. Regarding turnover, we conducted a review of our product portfolio to identify items meeting the eligibility and alignment criteria. We translated regulatory requirements into practical product-related attributes and subsequently performed a tagging exercise to identify these attributes' values within our product portfolio. This process has streamlined our data collection. The denominator includes all sales for the year, while the numerator comprises the proportion of products deemed eligible or aligned based on the identified attribute values. As a conservative measure, products with uncollected attributes are considered non-eligible. This approach prioritizes data accuracy over completeness for eligibility and alignment; in that sense we aim to refine this process annually to maximize data completion.
Concerning CapEx and OpEx, similar to the turnover process, we adapt the requirements into project attributes and tagged material projects to determine compliance. For projects below the defined materiality threshold, we continued to use turnover values as allocation key. Our CapEx/OpEx calculations include total CapEx/OpEx in the denominator, while the numerator comprises the proportion of investments identified as eligible/aligned through the tagging exercise, plus the proportion derived using turnover averages of eligibility and alignment as allocation key for non-material projects.
To avoid double-counting eligibility towards the Transition to a Circular Economy and Climate Change Mitigation objectives, we have allocated Turnover, CapEx, and OpEx contributing to both objectives solely to Climate Change Mitigation. This approach ensures that no economic values are counted twice.
In 2025, we continued the digitalization journey initiated in 2024. Throughout the year, we successfully automated most of the data‑collection processes related to products and R&D projects. In addition, we developed a digital dashboard capable of displaying key performance indicators for Turnover, Capex, and OpEx. We will continue to expand these digital capabilities in the coming years to further enhance data availability, accuracy, and completeness.
Turnover
The eligible turnover is defined as the part of the net turnover derived from products or services, including intangibles, associated with Taxonomy-eligible economic activities. The following list sets out Signify’s Taxonomy eligible turnover, contributing to the following environmental objectives:
Climate Change Mitigation:
Turnover of the manufacturing of LED and connected technologies, for indoor spaces (CCM 3.5) and outdoor spaces (CCM 3.6);
Turnover of the installation, maintenance, and repair of energy-efficient lighting, without controls (CCM 7.3) and with control modules (CCM 7.5).
Transition to a Circular Economy
Turnover of the manufacturing of electrical and electronic products (CE 1.2), light as a service (CE 5.5), components (CE 5.2), and related activities (CE 5.1).
EUR 923.1 million met the screening criteria used to measure the substantial contribution to the environmental objectives. This includes the sales from products which meet the following criteria:
Climate Change Mitigation
CCM 3.5 g) Light sources rated in the highest two populated classes of energy efficiency in accordance with Regulation (EU) 2017/1369.
Signify utilizes the European Product Registry for Energy Labelling (EPREL) as a foundational resource to identify the two highest populated energy efficiency classes, as mandated.
For product groups that are either incomplete or questionable within EPREL, we analyzed the distribution of energy labels across our portfolio. In cases where an EPREL label is unavailable—such as for non- European products and luminaires—we have developed an equivalent EPREL label based on parameters including power, luminous flux, directionally, and mains characteristics. As a conclusion, Signify defines the highest two populated classes as follows:
A & B classes - or equivalent - for lamps and white light sources;
C & D classes - or equivalent - (on luminaire level) for professional indoor luminaires;
C & D classes - or equivalent - for color controllable lamps.
CCM 3.5 j) Presence and daylight controls for lighting systems
We define presence and daylight controls as LED indoor standalone sensors that can connect to a lighting system to provide input from presence and daylight, enabling dimming capabilities. Sensors integrated into luminaires are excluded from this category.
CCM 3.5 m) Energy-efficient building automation and control systems for residential and non-residential buildings.
In this category, we consider LED indoor lighting systems that are connectable. This definition encompasses the following products:
LED Indoor Connectable Full Lighting Systems: Signify offers integrated and packaged lighting systems to customers. These comprehensive systems include hardware components such as luminaires, light sources, sensors, and other necessary parts, as well as software primarily designed for control systems;
LED Indoor Connectable Devices: this includes connectable lamps, luminaires and drivers, intended for professional markets. These connectable devices are designed for integration with professional building control systems.
CCM 3.6) Manufacture other low carbon technologies that result in substantial GHG emission reductions in other sectors of the economy.
The revenues that are attributable to the following subset of product families from the eligible revenues, with a third party verified Environmental Product Declaration (EPD) issued complying with ISO 14040 Life Cycle Assessment standard that covers the framework ISO 14044.
CCM 7.3 d) Installation, maintenance and repair of energy efficiency equipment.
The activity consists of installation and replacement of energy efficient light sources rated in the highest two populated classes of energy efficiency – Class A and B of EPREL – or equivalent.
CCM 7.5 Installation, maintenance and repair of instruments and devices for measuring, regulation and controlling energy performance of buildings.
As in the regulation there is no substantial contribution criteria for CCM 7.5, all Services that are eligible will automatically be considered as compliant with the substantial contribution criteria.
Transition to a Circular Economy activities
Signify has been providing circular products and solutions for many years. In 2025, we completed our assessment of the substantial contribution criteria for the EU Taxonomy circular economy activities relevant to Signify (CE 1.2, CE 5.1, CE 5.2, and CE 5.5). The evaluation showed that, despite significant progress, we do not yet fully meet some of the requirements. Particularly those related to the new or more stringent chemical criteria introduced by the EU Taxonomy, which go beyond current lighting-specific product regulations. We are actively working to bridge these gaps through targeted improvements in materials, design, and compliance processes, and remain committed to further strengthening our contribution to circular economy objective.
In 2025, out of the EUR 5,764.9 million total Turnover, EUR 4,649.9 million are Taxonomy-eligible (A.2) and EUR 923.1 million Taxonomy-aligned (A.1).
KPI | Total | Proportion of Taxonomy eligible activities | Taxonomy aligned activities | Proportion of Taxonomy aligned activities | Breakdown by environmental objectives of Taxonomy aligned activities | Proportion of enabling activities | Proportion of transitional activities | Not assessed activities considered non-material | Taxonomy aligned activities in 2024 | Proportion of Taxonomy aligned activities in 2024 | |||||
|---|---|---|---|---|---|---|---|---|---|---|---|---|---|---|---|
Climate change mitigation | Climate change adaptation | Water | Circlular economy | Pollution | Biodiversity | ||||||||||
EUR million | % | EUR million | % | % | % | % | % | % | % | % | % | % | EUR million | % | |
Turnover | 5,764.90 | 96.7% | 923.1 | 16.0% | 16.0% | - | - | 0% | - | - | - | - | 0% | 771.7 | 12.60% |
CapEx | 230.46 | 91.9% | 101 | 43.80% | 43.80% | - | - | 0% | - | - | - | - | 0% | 40.1 | 29.50% |
OpEx | 334.8 | 97.2% | 147.7 | 44.1% | 44.1% | - | - | 0% | - | - | - | - | 0% | 117.1 | 32.2% |
CapEx
The following list sets out Signify’s Taxonomy eligible Capital Expenditures, contributing to the environmental objectives:
a) Related to assets or processes that are associated with Taxonomy-eligible economic activities:
Climate Change Mitigation: CapEx related to the manufacturing of LED and connected technologies, for Indoor spaces (CCM 3.5) and outdoor spaces (CCM 3.6), and the annual turnover of the installation, maintenance and repair of energy-efficient lighting, without controls (CCM 7.3) and with control modules (CCM 7.5);
Transition to a Circular Economy: CapEx related to the manufacturing of electrical and electronic products (CE 1.2 and CE 5.5), components (CE 5.2), and related activities (CE 5.1).
b) Part of a plan to expand Taxonomy-eligible economic activities or to allow Taxonomy eligible economic activities to become Taxonomy-aligned; among others, new production lines and extension of production capacity of LED, connected technologies and product refurbishment.
c) Related to the purchase of output from Taxonomy-eligible economic activities and individual measures. In this category we are considering the following economic activities:
CCM 6.5 Transport by motorbikes, passenger cars and light commercial vehicles;
CCM 7.2 / CE 3.2 Renovation of existing buildings;
CCM 7.3 Installation, maintenance and repair of energy efficiency equipment;
CCM 7.4 Installation, maintenance and repair of charging stations for electric vehicles in buildings;
CCM 7.7 Acquisition, ownership or leasing of buildings.
In 2025, out of the EUR 230.5 million total CapEx, EUR 211.5 million are Taxonomy-eligible (A.2) and EUR 101.4 million Taxonomy-aligned (A.1).
OpEx
The following list sets out Signify’s Taxonomy eligible operational expenditures, contributing to the environmental objectives:
a) Related to assets or processes that are associated with Taxonomy-eligible economic activities; we are including under this category:
Climate Change Mitigation: OpEx related the manufacturing of LED and connected technologies, for Indoor spaces (CCM 3.5) and outdoor spaces (CCM 3.6), and the annual revenue of the installation, maintenance and repair of energy-efficient lighting, without controls (7.3) and with control modules (7.5);
Transition to a Circular Economy: OpEx related the manufacturing of electrical and electronic products (1.2 and 5.5), components (5.2), and related activities (5.1).
b) Part of a plan to expand Taxonomy-eligible economic activities or to allow Taxonomy eligible economic activities to become Taxonomy-aligned; we are considering here R&D projects in new lighting technologies, repairability options, etc.
In 2025, out of the EUR 334.8 million total OpEx, EUR 177.8 million are Taxonomy-eligible (A.2) and EUR 147.7 million Taxonomy-aligned (A.1).
Do No Significant Harm criteria
The EU Taxonomy Regulation establishes that an economic activity must Do No Significant Harm (DNSH) to any of the other environmental objectives. To conduct the different assessments, we have gathered information about our measurements, processes and policies for each of the DNSH criteria covering the economic activities.
We have adopted the same conservative approach as with the substantial contribution in turnover. In cases where no data is available to prove compliance with DNSH or MSS, we have chosen to classify it as not meeting the criteria.
We performed a climate risk and vulnerability assessment to identify potential physical and transition risks in our operations and value chain (upstream and downstream). Regarding the physical risks, we have analyzed all the climate-related hazards listed in appendix A from Annex 1 of the EU Taxonomy and focused on assessing physical risks relevant to Signify’s manufacturing sites, warehouses / distribution centers, offices and key suppliers namely, flooding, drought, heatwave, wildfire, storm, and extreme precipitation for the short-term (2030) and two long-term (2080) scenarios. The two long-term scenarios cover a below 2°C or SSP1-2.6 scenario – taking the sustainable lower emissions pathway, and an above 4°C or SSP5-8.5 scenario – fossil fueled development path. In the 2025 assessment, one risk - flooding – is considered material. In response, we develop risk adaptation and mitigation strategies that enhance our operational resilience, risk management, and financial planning where applicable. For more details on our climate risk and vulnerability assessment, refer to our ESRS E1 – Climate Change section of this report.
For all our operations, Signify follows the local environmental regulation and has developed local studies about water impact when relevant based on the sites' operation and location. We operate in accordance with the international standards ISO 14001 and ISO 45001, as stipulated in our EHS Policy.
For water pollution, in 2025, we revised our assessment approach. Whereas in 2024 we relied on the external Nature Positive assessment, this year we adopted an approach based on the Science Based Targets for Nature methodology, complemented with updated internal criteria. The results confirm we have four sites at risk, the impact identified is limited and we have mitigating actions in place.
For water scarcity, we used the Swiss Re Water Security Index, which applies the World Resources Institute Baseline Water Stress Indicator to assess the level of exposure based on each site’s location. Results show that for the 13 manufacturing sites located in areas at risk of water scarcity, water consumption has been maintained or reduced in 7 sites, and increased at 6 sites. Stable and reduced consumption reflects efficiency measures, while increases were driven by higher production volumes or temporary incidents that have since been resolved. In all cases, changes in water use are justified and managed appropriately.
Regarding the protection of water and marine resources, we expanded our threshold distance to 10 km (previously 5 km) to more effectively identify sites located near coastal waters. The results showed that we have nine sites within range, none of them have any relevant potential impact.
Signify has assessed its practices related to the Do No Significant Harm criteria for transitioning to a circular economy, focusing on its internal programs, policies, and supply chain initiatives. Circular economy is a central focus in the company's sustainability program. This assessment highlights several key initiatives. Signify's circle framework aims to develop lighting products that are repairable, reusable, and recyclable, while ensuring high durability to minimize waste. Since 2020, the company has achieved a zero-waste-to-landfill goal in its manufacturing processes. Our Sustainability Policy further reinforces this commitment by promoting responsible consumption and production aligned with the Sustainable Development Goal 12.
In 2025, we published the Circular Economy Policy, which outlines Signify’s commitments and core principles for circularity: use less, use longer, use again. Building on this foundation, we also developed a new circular framework for products that will guide the company’s efforts to expand its circularity ambitions over the next five years.
We also have a renovated Circular Economy Action Plan 2025-2030, that sets out the main actions, initiatives and targets towards the circular economy.
Our Sustainable design procedure guides research and development efforts to enhance product sustainability through durability, recyclability, and ease of disassembly. Signify has integrated circular economy principles into various product categories, focusing on preserving value and reducing waste through serviceable luminaires and intelligent asset management. Additionally, Signify participates in collection and recycling programs for conventional and LED lighting products and expands its remanufacturing services for used luminaires. The company has also increased the use of recycled and bio-circular materials in its products, particularly in 3D printing, where a significant percentage of materials used are sustainable. Moreover, the responsible packaging initiative has led to a substantial reduction in plastic usage.
Through our commitments, procedures, and current activities, Signify mitigates the risk of harming the objective of transitioning to a circular economy. For more information about our actions towards this topic, refer to subsection Circular Economy.
In line with the DNSH criteria, Signify has a comprehensive policy for pollution prevention and control. The company meticulously manages the use and disposal of all raw materials in its operations. Signify mandates that all suppliers disclose all substances in their components and adhere to the stipulations outlined in the Regulated Substance List (RSL).
The RSL is a crucial document that encompasses product substance requirements derived from various legal sources, including federal, state, county, and municipal laws, regulations, ordinances, and codes, as well as Signify's own requirements. This list is an integral part of Signify's Sustainability policy and is incorporated into the company's general purchasing conditions. All suppliers and brand licensees are obligated to ensure their products comply with this list. Signify conducts an annual assessment of substances used in manufacturing sites to ensure compliance with DNSH requirements. In 2025, we excluded sales from products manufactured in sites where either insufficient data was available or where the assessment revealed the use of substances not permitted under the requirements.
Regarding the protection of biodiversity and ecosystems, all our sites follow at minimum the local environmental regulations and all sites located within the EU comply with mandatory Environmental Impact Assessments (EIAs) requirements.
In 2025, we revised our assessment and applied an approach based on Science Based Targets for Nature. This assessment focused on key environmental pressure categories relevant to our operations, including freshwater and marine ecosystem use, soil and water pollution, non-GHG air pollutants and potential disturbance. The results showed we have two sites with a potential high biodiversity risk. At one site an on-site assessment was conducted in 2025, impacts were identified and mitigating actions are in place. For the other site, an assessment is planned for 2026.
Minimum Social Safeguards
The Minimum Safeguards (MSS) provision of the EU Taxonomy Regulation requires companies involved in environmentally sustainable economic activities must also meet criteria for responsible business conduct already outlined in the OECD Guidelines for Multinational Enterprises, the United Nations Guiding Principles on Business and Human Rights, the Fundamental Conventions of the International Labour Organization (ILO) and the International Bill of Human Rights.
In 2024, Signify developed a new Due Diligence process based on our Human Rights Policy and in alignment with the Minimum Safeguards requirements. This process is integral to the company's commitment to responsible business practices, aligning with the OECD Guidelines for Multinational Enterprises and the UN Guiding Principles on Human Rights.
The due diligence framework encompasses both human rights and environmental impacts, ensuring regulatory compliance and ethical standards. Signify conducts annual risk assessments to identify and mitigate potential adverse impacts across its value chain, evaluating operations and suppliers on environmental management and compliance with international standards. Regular audits are performed to ensure adherence, with corrective action plans implemented for any non-compliance.
Human rights considerations are embedded in Signify's policies and practices, guided by the International Bill of Human Rights and the UN Global Compact. The Human Rights Committee oversees risk assessments and mitigation plans, prioritizing issues based on severity and likelihood. A complaints mechanism allows stakeholders to raise concerns, with issues tracked and reviewed by the Integrity Committee.
In addition, we assessed the coverage of our codes and standards to the principles and policies under the MSS of the EU Taxonomy. We scanned all the relevant internal policies and procedures and did a matching exercise with the different frameworks required for the Minimum Safeguards. The assessment confirmed that we meet the requirements.
Complementary information
The detailed results following the format of the Taxonomy Regulation can be found in the following pages. Signify understands and appreciates the fact that the EU Taxonomy framework is in constant evolution, and that the company’s reporting obligations will continue to evolve over the next years. Signify is committed to increasing its taxonomy eligibility and taxonomy-alignment percentages independently of regulatory developments.
Economic activities | code | Taxonomy eligible KPI (proportion of Taxonomy eliglible Turnover) | Taxonomy aligned KPI | Taxonomy aigned KPI (proportion of Taxonomy aligned Turnover) | Environmental objective of Taxonomy aligned activities | Enabling activity | Transitional activity | Proportion of Taxonomy aligned in Taxonomy eligible | |||||
|---|---|---|---|---|---|---|---|---|---|---|---|---|---|
CCM | CCA | WTR | CE | PPC | BIO | ||||||||
Text | % | EUR million | % | % | % | % | % | % | % | % | % | % | |
Manufacture of energy efficiency equipment for buildings | CCM 3.5 | 64.1% | 897.5 | 15.6% | 15.6% | - | - | - | - | - | - | - | 24.3% |
Manufacture other low carbon technologies that result in substantial GHG emission reductions in other sectors of the economy | CCM 3.6 | 19.4% | 7.2 | 0% | 0.1% | - | - | - | - | - | - | - | 0.6% |
Installation, maintenance and repair of energy efficiency equipment | CCM 7.3 | 0.1% | - | - | - | 0.0% | |||||||
Installation, maintenance and repair of instruments and devices for measuring, regulation and controlling energy performance of buildings | CCM 7.5 | 0.30% | 18.4 | 0.3% | 0.3% | - | - | - | - | - | - | - | 100.0% |
Manufacture of electrical and electronic equipment | CE 1.2 | 12.7% | - | - | - | - | - | - | - | - | - | - | 0.0% |
Repair, refurbishment and remanufacturing | CE 5.1 | - | - | - | - | - | - | - | - | - | - | - | - |
Sale of spare parts | CE 5.2 | 0.1% | - | - | - | - | - | - | - | - | - | - | 0.0% |
Product-as-a-service and other circular use- and result-oriented service models | CE 5.5 | - | - | - | - | - | - | - | - | - | - | - | - |
Economic activities | code | Taxonomy eligible KPI (proportion of Taxonomy eliglible CapEx) | Taxonomy aligned KPI (monetary valueof CapEx) | Taxonomy aigned KPI (proportion of Taxonomy aligned CapEx) | Environmental objective of Taxonomy aligned activities | Enabling activity | Transitional activity | Proportion of Taxonomy aligned in Taxonomy eligible | |||||
|---|---|---|---|---|---|---|---|---|---|---|---|---|---|
CCM | CCA | WTR | CE | PPC | BIO | ||||||||
Text | % | EUR million | % | % | % | % | % | % | % | % | % | % | |
Manufacture of energy efficiency equipment for buildings | CCM 3.5 | 32.1% | 34.6 | 15.0% | 15.0% | - | - | - | - | - | - | - | 47.0% |
Manufacture other low carbon technologies that result in substantial GHG emission reductions in other sectors of the economy | CCM 3.6 | 13.0% | 10.1 | 4.4% | 4.4% | - | - | - | - | - | - | - | 33.5% |
Acquisition and ownership of buildings | CCM 7.7 | 38.9% | 55.8 | 24.2% | 24.2% | - | - | - | - | - | - | - | 62.3% |
Transport by motorbikes, passenger cars and light commercial vehicles | CCM 6.5 | 2.8% | 0.5 | 0.2% | 0.2% | - | - | - | - | - | - | - | 8.6% |
Renovation of existing buildings | CCM 7.2 / CE3.2 | 1.1% | - | - | - | - | - | - | - | - | - | - | 0.0% |
Installation, maintenance and repair of energy efficiency equipment | CCM 7.3 | 0.3% | - | - | - | - | - | - | - | - | - | - | 0.0% |
Manufacture of electrical and electronic equipment | CE 1.2 | 3.7% | - | - | - | - | - | - | - | - | - | - | - |
Economic activities | code | Taxonomy eligible KPI (proportion of Taxonomy eliglible OpEx) | Taxonomy aligned KPI (monetary valueof OpEx) | Taxonomy aigned KPI (proportion of Taxonomy aligned OpEx) | Environmental objective of Taxonomy aligned activities | Enabling activity | Transitional activity | Proportion of Taxonomy aligned in Taxonomy eligible | |||||
|---|---|---|---|---|---|---|---|---|---|---|---|---|---|
CCM | CCA | WTR | CE | PPC | BIO | ||||||||
Text | % | EUR million | % | % | % | % | % | % | % | % | % | % | |
Manufacture of energy efficiency equipment for buildings | CCM 3.5 | 64.7% | 118.4 | 35.4% | 35.4% | - | - | - | - | - | - | - | 54.7% |
Manufacture other low carbon technologies that result in substantial GHG emission reductions in other sectors of the economy | CCM 3.6 | 25.3% | 29.0 | 8.7% | 8.7% | - | - | - | - | - | - | - | 34.3% |
Installation, maintenance and repair of instruments and devices for measuring, regulation and controlling energy performance of buildings | CCM 7.5 | 0.1% | 0.2 | 0.1% | 0.1% | - | - | - | - | - | - | - | - |
Manufacture of electrical and electronic equipment | CE 1.2 | 7.1% | - | - | - | - | - | - | - | - | - | - | - |
Sale of spare parts | CE 5.2 | 0.1% | - | - | - | - | - | - | - | - | - | - | - |
5.3 Social
5.3.1 | S1. Own workforce | |
5.3.2 | S2. Workers in the value chain |
Signify continued to advance its commitment to positive social impact, focusing on workforce well-being, ethical supply chain practices, and strong human rights due diligence. We strengthened programs that promote inclusion and diversity, fair labor conditions, and community development. This section details our progress and initiatives, reflecting our dedication to social responsibility. Through these efforts, we strive to make a meaningful difference in the lives of our employees and suppliers' workers and contribute to the achievements of SDG 3: Good health and well-being and 8: Decent work and economic growth.
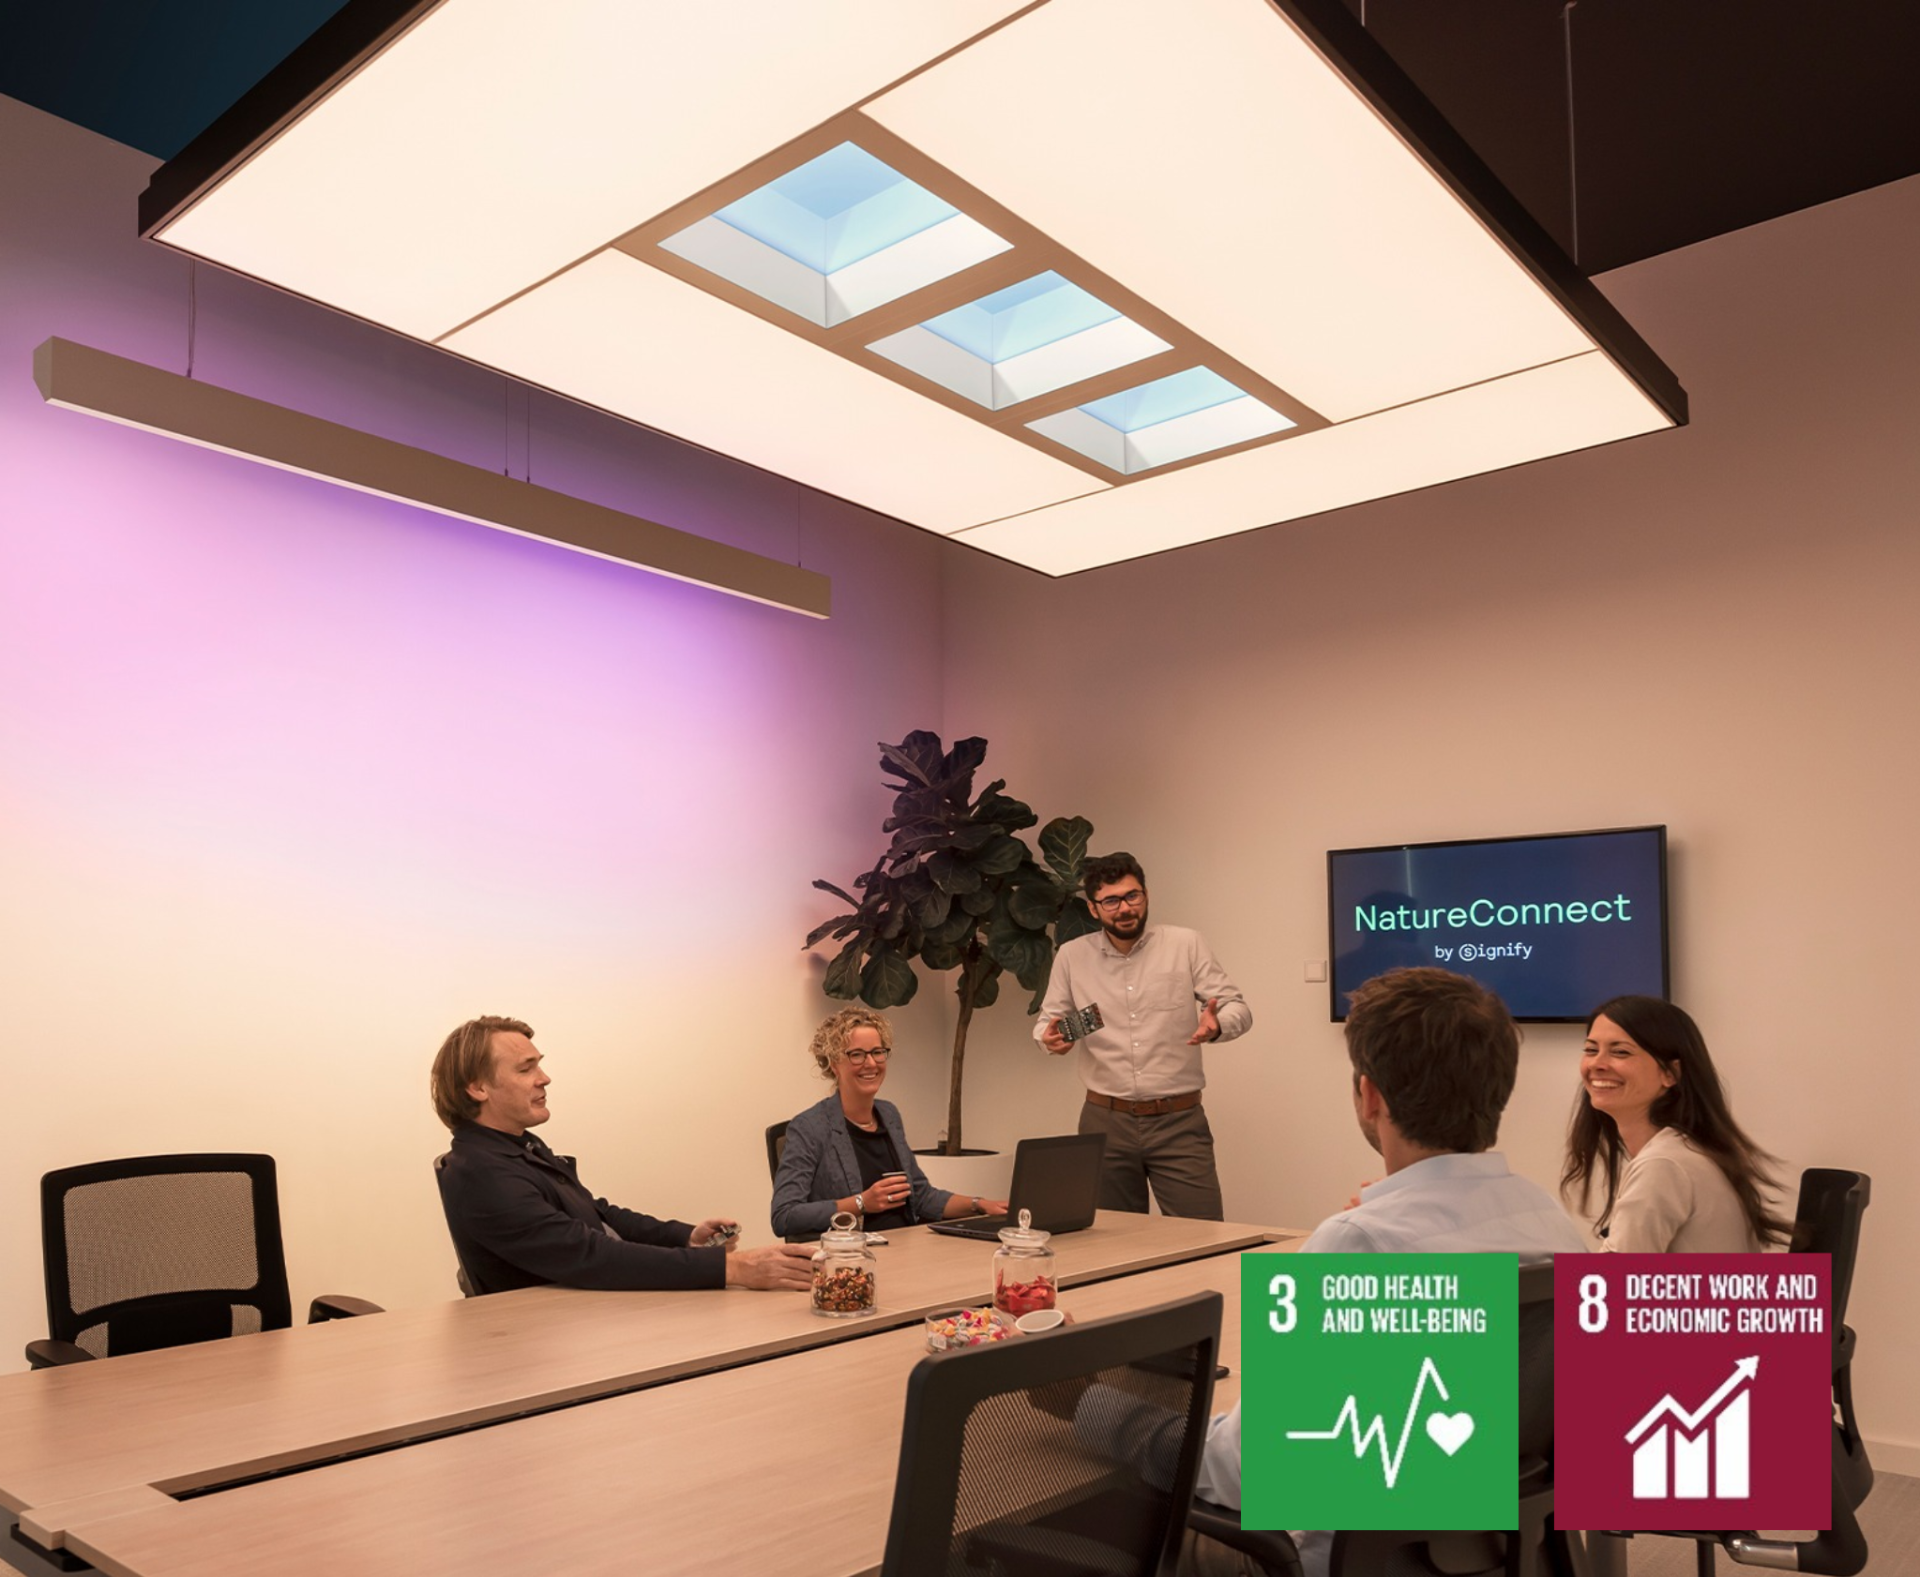
NatureConnect brings daylight indoors to support well-being
5.3.1 Own Workforce (S1)
Our approach
At Signify, our workforce is at the heart of our success in driving innovation and delivering sustainable solutions in the global lighting industry. As the world embraces more sustainable ways of working, we are committed to shaping our operations in a way that not only responds to this shift but also champions the well‑being, development, and inclusion of all our people. Guided by international principles, including human rights and labor standards, our strategic focus is to foster a safe, fair, and supportive environment for all our employees.
This section outlines our comprehensive approach to managing the social aspects of our operations. It begins with general disclosures, followed by information regarding our risk and impact assessment, and details our commitments to safety at work, living wages – which differs from CSRD’s “adequate wage” –, talent development, diversity, equity, and inclusion.
Material impacts, risk and opportunities
S1 SBM3 - Material IRO and their interaction with strategy and business model
S1-1 - Policies related to own workforce
S1-2 - Processes for engaging with workers and representatives about impacts
S1-5 - Targets related to managing material IRO
The double materiality assessment identified the following material IROs:
Health and safety; potential risk of incidents - potential negative impact – own operations
Talent and development; talent and skills shortages - potential risk – own operations
DE&I; inclusive workplace practices - actual positive impact – own operations
The table below summarizes the relevant policies and associated details, as well as their linkage to the S1 IROs. For further information on the DMA, see section 5.1, Brighter Lives, Better World 2025 progress.
When defining our material impact, we specify the type of employees potentially affected, which also includes non-employees. As part of this process, we engaged with various stakeholders, including employees through our Employee Team survey. The feedback gathered helps guide our efforts in setting targets and developing employee engagement action plans where relevant. Our Chief Human Resources Officer has operational responsibility over these engagements.
All material topics have targets, except for Talent & Development which is a material financial risk and therefore does not have a target and applies to our entire workforce. Our internal and external metrics have been set in accordance with our targets to ensure the effectiveness of our actions. While we value employee representation and dialogue, it should be noted that employees are not currently represented at the Supervisory Board or the Board of Management. However, the company provides an alternative platform for cross-border worker engagement through its European Works Council. This council plays a key role in facilitating dialogue and ensuring representation across European markets.
Policy | Description | Related IROs | Key stakeholders & scope | Accountability & governance |
|---|---|---|---|---|
Sustainability Policy | The policy sets out our commitment to climate action, clean energy, circular economy practices, social well‑being, decent work, diversity and inclusion and responsible sourcing in our value chain. | 1, 2, 3 | The policy covers our entire value chain and relevant stakeholders including employees, sub-contractors, and suppliers. | The policy is overseen by the Chief Strategy, Sustainability and Marketing Officer. The implementation responsibility is with the Global Head of Sustainability. |
Integrity Code | Integrity being at the core of how we do business at Signify, our Integrity code guides us on how to always act with integrity and helps us in protecting our company reputation. | 1, 2, 3 | The Integrity Code applies to Signify’s employees, customers, business partners, shareholders and wider community. | The Integrity Committee oversees the Integrity code. This Committee is chaired by the Chief Legal Officer. Its members include the Chief Executive Officer, Chief Financial Officer, Chief HR Officer, Head of Business Integrity Office and the Head of Legal Compliance |
Human Rights Policy | The policy sets out our commitment to uphold and respect human rights in all aspects of our own operations and across the value chain, as well as our dedication to promoting and protecting human rights and making a positive contribution. | 1, 2, 3 | The policy covers our entire value chain and stakeholders including our employees, workers in the value chain, consumers and communities, and business partners. | The policy is overseen by the Chief Strategy, Sustainability and Marketing Officer. The implementation responsibility is with the Human Rights Committee. |
Diversity, Equity & Inclusion Policy | It underscores our commitment to creating a fair and inclusive workplace. It ensures equitable treatment for all employees, regardless of race, color, age, gender, gender identity or expression, sexual orientation, language, religion, political views, disability, veteran status, national origin, or any other protected characteristic. | 3 | As part of the Integrity code, the DE&I policy applies to Signify’s employees; and business partners are also expected to comply. | As part of the Integrity code, the DE&I policy is overseen by the Integrity Committee. |
Environmental, Health & Safety Policy | It defines our commitments to protecting our environment and creating a safe and healthy workplace for all employees and involved stakeholders within our own operations. This policy is aligned with ISO45001 (Occupational Health & Safety Management), ISO14001 (Environmental Management System) and ISO50001 (Energy Management). | 1 | The policy applies to all Signify sites, majority owned joint ventures, and service projects in the marketplace. The policy is available publicly on our website. | The policy is overseen by the Chief Strategy, Sustainability and Marketing Officer. The implementation responsibility is with the Global Head of EHS. |
Anti-harassment and Anti-discrimination Policy | The policy prevents unlawful behavior, promotes accountability, and protects our organization’s reputation. This also includes workplace principles designed to foster flexibility, inspiration, collaboration, and belonging. | 3 | The policy applies to all employees, including interns and contingent workers of Signify and its controlled subsidiaries worldwide. | This policy is overseen by the Integrity Committee as part of the Integrity code review process. |
Global Pay Policy | The policy allows the organization to provide competitive pay to attract, retain and reward talent, while providing a consistent global compensation framework that rewards the achievement of business objectives and the delivery of shareholder value. | 3 | The policy applies, in principle, to all our employees. Exclusions may apply based on country and where negotiated union contracts exist. | The policy is owned by the Head of Global Rewards and Performance Management. It is overseen by the Chief Human Resources Officer. |
Human rights management approach
S1-3 - Process to remediate negative impacts and channels to raise concerns
S1-4 - Taking action on material impacts, and approaches to mitigating risks and pursuing opportunities
S1-17 - Incidents, complaints and severe human rights impacts
Respecting human rights is a central foundation of the way we work. Our commitment to respecting and promoting human rights extends beyond our own operations, across our wider sphere of influence, including our supply chain. To that end, we integrate human rights considerations into our policies, processes, and practices.
Our Human Rights Policy – addressing issues such as human trafficking, forced labor or compulsory labor and child labor – is based on the International Bill of Human Rights, the United Nations Global Compact Ten Principles, and the International Labor Organization’s declaration on Fundamental Principles and Rights at work. Our process is aligned with the OECD Guidelines for Multinational Enterprises and the UN Guiding principles on Business and Human Rights. Signify carries out continuous research and stakeholder engagement activities to identify the most salient ethical and social principles that govern our relationship with stakeholders worldwide.
Through our due diligence process, we conduct annual risk assessments to identify and mitigate potential adverse impacts across our value chain. This includes evaluating our own operations and our suppliers on environmental management systems and compliance with international standards which includes provisions on fair labor practices, environmental protection, and anti-corruption measures. Regular audits and assessments are conducted to ensure compliance, and any non-compliance is addressed through corrective action plans. We monitor the implementation of those plans bi-annually to ensure their effectiveness and adjust if proven necessary. Our Ethics Line is available to all our stakeholders for complaints or concerns to be raised. You can find more details about this in section 5.4, Governance.
The risk assessment and engagement with supply chain workers is described in subsection 5.3.2, S2, Workers in the value chain.
As part of our annual due diligence process, we conduct a comprehensive human rights risk assessment for our own workforce, including both direct and indirect employees globally. This process is aligned with the EU Corporate Sustainability Due Diligence Directive (CSDDD) and meets the EU Taxonomy Minimum Social Safeguards (MSS).
We identify salient human rights risks by gathering insights from various internal and external sources. Each risk is evaluated based on its severity and likelihood, allowing us to prioritize mitigation actions effectively. The identified risks and proposed mitigation measures are reviewed and approved annually by our Human Rights Committee, which includes senior leaders from across the organization.
Compliance with our Human Rights Policy is embedded in our Integrity code, supported by mandatory training for all employees. This training is refreshed regularly and included in the onboarding process for new hires.
We monitor the effectiveness of our approach through tools such as the Employee Team Survey, which includes questions on ethical behavior and safety compliance as well as monitoring the implementation of mitigation actions adopted. These insights help us assess employee awareness and trust in our reporting mechanisms. Details on anti-retaliation protections are provided in section G1, Governance.
To identify potential human rights risks, we analyze multiple sources, including:
Responses to our compliance questionnaire
Cases reported via the Ethics Line
Annual living wage assessments
Health & Safety Total Recordable Case Rate results
Interviews with internal and external stakeholders
Internal audit findings
Industry trend desk research
Since 2017, we have applied a country risk-based approach to our manufacturing sites, and we are using the RBA country classification to identify high-risk regions. Sites in these regions are required to complete periodic self-assessments which are based on the RBA questionnaire. In 2025, we expanded this scope to include warehouses.
Mitigation actions are prioritized based on the severity of identified risks and implemented and monitored by the due diligence working group. The Human Rights Committee is updated annually on the status of mitigation actions.
In 2025, our country risk assessment identified 18 manufacturing sites and 3 warehouses in high-risk countries: Brazil, China, Egypt, India, Indonesia, Mexico, Philippines, and Saudi Arabia.
The following salient risks and respective mitigation actions were defined:
Working hours and rest days: a few sites had issues with workers exceeding the local legal limits and rest day policies. We have adopted new internal guidelines and are implementing a global monitoring system overseen by the due diligence working group and operations team to ensure alignment to the limits.
Access to contracts and manuals: we are ensuring all employees can easily access physical and digital copies of all employment documents and are aware of the process.
Voluntary overtime: we are reinforcing procedures to ensure proper documentation, especially for sites where overtime is frequently proposed.
Health and Safety: this remains a priority area for continuous improvement. See Health and Safety section for further details.
We have completed all the remediation actions defined in 2024, related to fines and salary deductions, ensuring all sites comply with local regulations and communicate policies clearly. Additionally, we now ensure that medical tests for employees and applicants are legally compliant and justified from a health and safety perspective. There have been no instances of forced and child labor reported. These topics are assessed with a focus on manufacturing workforces located in risk countries as listed above.
In addition to the assessment and mitigation actions with sites and warehouses located in high-risk countries, we also monitor and engage with all sites and workers globally. Internal stakeholder discussions highlighted the need for a preventive approach for new manufacturing sites launched in 2024 and beyond. We have worked to ensure that appropriate policies and practices are embedded from the outset as part of the general new operations process.
In 2025, 320 cases were reported via the Ethics Line, from which 13 were related to discrimination and harassment. None were classified as severe human rights incidents and no fines or compensations were issued in relation to employee compliants. All concerns raised are consistenly registered in a single database and are investigated in accordance with the standardized investigation procedure in a prompt, independent and objective way as specified by the reporting policy. More details on the process and categorization of complaints is available in Section G1.
Workforce general disclosures
S1-6 – Characteristics of the undertaking’s employees
S1-13 – Training and skills development metrics
The total size of the Signify workforce at the end of 2025 was 26,581 FTEs, compared to 29,249 at year-end 2024.
In 2025, Signify’s adjusted employee turnover increased to 23% (2024: 16%). On a reported basis, the total turnover was 8,799 people, which represents 35% (2024: 28%) including estimates for companies not fully integrated (CNFI), and the specifics of the Mexican labor law, which prohibits contingent labor and therefore causes a significant impact on a consolidated basis. In 2025, we improved our data accuracy for turnover with the inclusion of Klite actual data. Signify applies high standards in its factories around the world to ensure its competitiveness in highly dynamic labor markets, while continuously improving employee satisfaction and reducing turnover.
Financial information related to our workforce can be found in chapter 15, Consolidated financial statements, note 4, Employee benefit expenses. The Financial Statements report a different FTE number than the Sustainability Statements due to differing methodologies: the former uses an average FTE number, while the latter reflects the end-of-year FTE count.
Total headcount by country1 | ||
|---|---|---|
2024 | 2025 | |
China2 | 6,561 | 6,066 |
Mexico | 4,220 | 3,870 |
Poland | 2,783 | 2,616 |
India | 2,672 | 2,609 |
USA | 2,241 | 2,115 |
- For countries with more than 50 employees representing more than 10% total employees.
- Inlcudes estimates for CNFI population.
Employee turnover breakdown in 20251 | ||||||
|---|---|---|---|---|---|---|
Staff | Professional | Mid-Level Professional | Senior-Level Professional | Leadership | Grand Total | |
Total adjusted2 | 15% | 6% | 1% | 1% | 0% | 23% |
Total | 28% | 6% | 1% | 0% | 0% | 35% |
Voluntary | 19% | 3% | 1% | 0% | 0% | 23% |
Involuntary | 9% | 3% | 0% | 0% | 0% | 12% |
- Includes estimates for Klite and CNFI.
- Excludes manufacturing population from Mexico.
Employees by contract type, broken down by gender (head count)1 | ||||||||
|---|---|---|---|---|---|---|---|---|
2024 | 20252 | |||||||
Female | Male | Not disclosed | Total | Female | Male | Not disclosed | Total | |
Employees | 10,767 | 14,663 | 8 | 25,438 | 10,100 | 13,866 | 12 | 23,978 |
Permanent | 10,616 | 14,493 | 8 | 25,117 | 8,345 | 12,507 | 11 | 20,863 |
Temporary | 151 | 170 | 0 | 321 | 1,755 | 1,358 | 1 | 3,115 |
Full-time | 10,475 | 14,446 | 7 | 24,928 | 9,824 | 13,646 | 11 | 23,482 |
Part-time | 291 | 217 | 1 | 509 | 276 | 219 | 1 | 496 |
- Includes estimates for CNFI population.
- Increase in temporary employees is due to the inclusion of Klite actual data.
Our company culture is built on three foundational pillars: our purpose & values, sustainability and building high performance teams. These foundational elements guide why we exist, what we value, and how we work. Our purpose is to unlock the extraordinary potential of light for brighter lives and a better world. It is our guiding light and it has been since we became an independent company. Underpinning our purpose are our values which are brought to life through our behaviors.
In 2024, we articulated what those behaviors look like and activated them through management teams cascades and team workshops, with more than 600 teams participating.
Inculcating new behaviors requires sustained effort, and in 2025 we continued this commitment. First, 150 of our most senior leaders reflected on their own behavior journeys during Ignite in February, led by our CEO and CHRO, after which the discussions cascaded through regional Ignite sessions. To support teams more broadly, we developed quarterly, team‑run workshops that allow employees to deep‑dive into selected new behaviors and translate them into concrete actions.
To sustain excitement and engagement, colleagues from around the world participated in videos showing the behaviors to bring them to life. They were shared on global platforms to help employees familiarize themselves and understand the behaviors deeper. We also continue to reinforce our alues. On a quarterly basis, we focus on one specific value, and the CEO recognizes teams that have exemplified that value on the global webcast. We also rolled out a recognition platform called Spotlight which allows colleagues to recognize each other for display of our values. This is underpinned by our belief that lived experiences are what entrenches a culture within the Company. As a result, scores for our four values have been climbing steadily over the past four quarters in our quarterly surveys. Scores for each value improved by 2% from a high base, to reach 86% to 93% for each of the four values.
Our commitment to sustainability is ingrained in our strategy and culture. In 2025, we’ve continued to engage employees through regular sustainability challenges and quarterly engagement themes that link personal values with our business practices. We're constantly striving to deepen our understanding of sustainability and its implications. Our performance culture is supported by quarterly individual performance conversations between office employees and managers. During these check-in conversations, employees shared progress toward goals and development priorities, while managers provided coaching and support to overcome challenges and foster growth.
In 2025, managers continued to serve as a cornerstone in driving performance culture across the organization. The quarterly check-ins were further embedded as a key tool to enable ongoing performance and development conversations, strengthening alignment and accountability at all levels. Completion rates remained robust throughout the year, reaching 91% which reflects the continued adoption of our performance culture under the new operating model. Looking ahead to 2026 and beyond, we will continue to reinforce managerial capability, advance coaching excellence, and further integrate feedforward and recognition practices, with a particular focus on enhancing team effectiveness to unlock sustainable growth at Signify.
Population that participated in quarterly career development and performance reviews (S1-13)1 | ||||
|---|---|---|---|---|
2024 | 2025 | |||
Female | 49% | 53% | ||
Male | 59% | 63% | ||
Not disclosed | 75% | 67% | ||
Total | 55% | 59% | ||
2025 quarterly career development and performance review completion rates for the eligible population | ||||
Q1 | Q2 | Q3 | Q4 | |
Female | 90% | 88% | 93% | 94% |
Male | 90% | 88% | 92% | 94% |
Not disclosed | 100% | 83% | 88% | 100% |
Total | 90% | 88% | 93% | 94% |
- Includes full population and does not capture offline performance reviews.
Promoting employee engagement and well-being strengthens our organization’s resilience and brings our shared vision to life — a workplace where everyone feels included, makes a meaningful contribution, and takes pride in shaping our company’s success. When employees are engaged, they drive business performance and sustainability outcomes while fueling a culture of energy and excellence.
Our workforce actively participates in volunteering activities across our various regions and offices. By engaging with local NGOs and supporting community initiatives, our employees drive meaningful engagement. Volunteering is deeply embedded within our corporate culture, reflecting our commitment to social responsibility. This dedication not only strengthens our community ties but also fosters a culture of giving and collaboration within our organization. We also collaborate and support the work of the Signify Foundation. Read more about the work of the Foundation in their report.
Our teams and offices globally have engaged in multiple initiatives and partnerships with local organizations. Here are a few highlights:
Our team in Lodz, Poland, volunteers annually to replant trees in the local forest. This year the team planted 1,000 trees.
In Camargo, Mexico, our team spent a day with the association ADN, which supports children and adolescents in vulnerable situations. They hosted activities with the children, played games and prepared small surprises for them to take home.
In Shanghai, the team hosted a workshop series titled “Wonderful Interactions between Light and Living Organisms” co-created with the Shanghai Natural History Museum. Six workshops were hosted in 2025, aimed at children.
At the Takbo Para sa Kalikasan Earth Run in the Philippines, Signify employees participated in a tree-planting activity, contributing directly to environmental restoration and biodiversity protection.
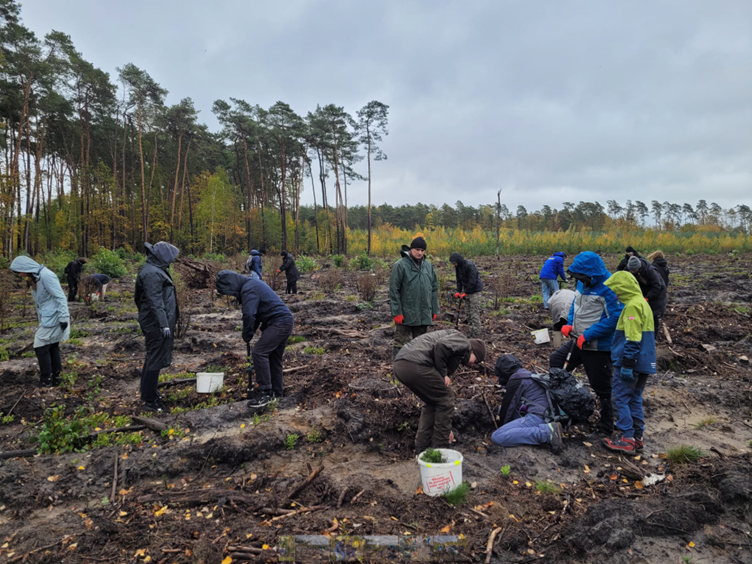
Tree planting in Lodz, Poland
Takbo Para sa Kalikasan Earth Run in the Philippines
In 2025, we strengthened our commitment to employee engagement and well-being through several initiatives designed to foster resilience, connection, and inclusion. The Be Well program, launched in June, provides employees and their families with confidential counseling, as well as financial and legal guidance — helping them access the support they need to sustain well-being and performance. In September, we launched Spotlight, our new global recognition platform that celebrates everyday achievements and reinforces a culture of appreciation. By encouraging peer-to-peer recognition, we continue to build stronger, more connected teams across Signify. We also celebrated individuality and inclusion through the You & Identity Exhibition, a collaborative event with six other companies in Amsterdam exploring personal identity and authenticity through portraits and storytelling. Together, these initiatives reflect our belief that when people feel well, valued, and seen, they bring their best selves to work and help strengthen our culture of engagement and belonging.
Our Employee Team survey is a powerful tool for regularly gauging employee sentiment in line with our company purpose and values. Conducted every quarter, it has proven to be a positive driver of employee engagement, enabling us to monitor trends and discuss outcomes and actions at the team level when needed.
In 2025, we updated our survey questions to align with the refreshed behaviors that underpin our values. This enables us to stay on top of the trends around employee engagement and understanding and acceptance of our new operating model. Additionally, the survey provides valuable insights into the inclusivity in teams and the impact of our managers, as measured by the Manager and Inclusion indexes.
Our results show that 85% of employees believe we put our Customer First, 92% acknowledge that we are Greater Together, 90% feel that we are Game Changers, and 88% agree that we have Passion for Results. Employees also acknowledge that we Act with Integrity as an organization. We address improvement points at the team level through our Team Dialogues and continue to track progress on these questions during our Quarterly Performance Reviews.
To measure employee sentiment, the Net Promoter Score (NPS) methodology is used as part of our Employee Team Survey. Employees are asked to assess how likely it is that they would recommend our company as a great place to work. At the end of 2025, we recorded an average annual Employee NPS score of +39 across the Signify population (2024: +29), with an average employee response rate of 83% (2024: 82%).
In 2025, we continued building on our updated Employer brand pillars: leading an industry and shaping the future, creating a sustainable future and growing a thriving career. During 2025, we continued to infuse our new EVP into our employee touchpoints and external communications. Finally, we are very proud of the recognition that we continue to receive for being an Employer of Choice in many countries. Here's a glimpse of the awards we received in 2025:
We won four US awards from RippleMatch Excellence in Recruitment Strategies, Excellence in Tech Innovation; Excellence in Candidate Experience and Excellence in Internship Programming;
Awarded the Top Employers Award in China for the 8th time;
Great Place to Work (The Great Place to Work® Institute) certification;
Awarded in United Arab Emirates, Oman, Qatar, and Lebanon;
Awarded in India both for Great Place to work and Great Place to work for women (top 100);
Awarded in Turkey for the third year in a row;
Recognized as a Champion of Good by the National Volunteer & Philanthropy Centre (NVPC) in Singapore.
Within our Climate Transition Plan released in 2024, we also acknowledge the impact our ongoing transition has on our own workforce. As we adapt our business to the demands of a low-carbon economy, it is essential that we manage the social implications of this shift.
In recent years, the market for conventional lighting products has declined, leading us to reduce our workforce and close several factories. In 2010, our conventional lighting business employed approximately 18,000 workers worldwide. By 2030, we expect that to be below 500. Inevitably, this means job losses. Where possible, we transfer employees to other jobs within Signify, particularly when they work at factories serving both our conventional and LED lighting businesses.. We estimate that this accounts for around a quarter of employees affected by job losses in recent years. For other employees, we take a from work-to-work approach, helping them find new jobs outside Signify and supporting them in making the transition:
We negotiate detailed social plans with works councils, trade unions and other employee representative groups to provide job-to-job and financial support in line with local regulations;
Employees are also given advanced notice of factory closures and job losses – this depends on location, but generally ranges between 3-6 months. During that period, employees are granted time off to apply for new jobs and offered access to training and outplacement services.
Signify has high standards in areas such as quality, safety and Lean methodology, and we find this helps employees in looking for new positions. Overall, we support decent work and economic growth by creating a fair, inclusive workplace and providing development opportunities for both employees and suppliers. We also offer training and access to finance to entrepreneurs working in the lighting sector in developing countries. In recent years, the clean energy transition has created millions of new jobs and will continue to do so.
Safety at work
S1-14 – Health and safety metrics
At Signify, our commitment to a safe and healthy working environment is embedded in both our Human Rights Policy and our Environment, Health & Safety (EHS) Policy. The EHS Policy, which complements our Sustainability Policy, applies to all our sites, majority-owned joint ventures, and service projects. It covers employees, temporary workers, contractors, and visitors, ensuring that health and safety standards are upheld across our entire operation. These policies reflect our dedication to preventing harm and fostering a safe, supportive environment for all individuals involved in our business activities.
Health and safety is a top priority for us. We are committed to providing a safe working environment for our employees. Our total recordable case (TRC) rate is the central indicator through which we measure our overall safety performance. Targets for this indicator are set and managed at a company-wide level and are tracked at business as well as site levels for our manufacturing sites and distribution centers.
Our annual EHS Week campaign, that aligns with International Labor Organization’s World Day for Safety & Health on April 28th, was dedicated to the topic of “Caring for each other – Reporting Near Misses and First Aid Cases”. As part of this campaign, we held a successful company-wide competition.
We recorded 27 work-related injury cases in 2025 (2024: 41). The TRC rate decreased to 0.12 per 100 FTEs (2024: 0.17) and the rate of recordable work-related accidents decreased to 0.58 (2024: 0.83). In 2025, 72% of our reported industrial sites had no recordable injuries and 44% of industrial sites with no recordable injuries over the last three years, while 65% sites had achieved more than 500 injury-free days.
2024 | 2025 | |
|---|---|---|
Total recordable case rate (per 100 FTE’s) | 0.17 | 0.12 |
Rate of recordable work-related accidents (per 500 FTE’s) | 0.83 | 0.58 |
Work-related illness cases | 0 | 1 |
Work-related injury cases | 41 | 27 |
Severe injuries | 13 | 8 |
Lost workday cases rate | 0.09 | 0.08 |
Days lost to work-related injuries | 1,638 | 1,110 |
Fatalities (including contractors) | 1 | 0 |
As part of our continuous improvement program, we continued our site EHS maturity assessment process in 2025. We conducted 22 corporate on-site assessments that provided a standardized and effective measure to identify improvement opportunities at individual sites and enabled the exchange of best practices across our manufacturing sites.
From 2025 onwards, sites that do not receive on-site assessment are required to complete EHS maturity self-assessment utilizing the same standardized framework.
This year, we also launched company-wide mandatory Health & Safety Essentials e-learning campaign for all employees with access to our learning platform.
Our health and safety management system covers 100% of our headcount and includes all our sites, both manufacturing and non-manufacturing, ensuring consistent safety standards across the organization. Also, we have reinforced our program to ensure all Signify manufacturing sites are certified locally or via the Signify multi-site ISO 14001 and 45001 certifications. At the end of 2025, 93% of our manufacturing sites were ISO 14001 certified and 93% were ISO 45001 certified. The remaining manufacturing sites have procedures in place to foster compliance with local regulations and Signify policies.
Living wage
Since 2017, Signify has implemented its Living Wage Program as part of our commitment to responsible employment. Our aim is to ensure that every employee earns at least a living wage that supports essential daily needs. We offer total compensation aligned with market practices in all countries in which we operate and our compensation framework is built on key principles: competitiveness across labor markets, internal equity, and full living-wage compliance.
Each year, we conduct a global assessment of salaries and benefits against living-wage benchmarks, focusing on regions where risks of non-compliance may be higher. For the 2025 cycle, our analysis covered 33 regions across six countries, representing 74% of our global workforce fully integrated into our systems. Living-wage comparisons are performed using benchmarks from the independent WageIndicator Foundation.
Our living wage commitment is not linked to an IRO and is therefore disclosed on a voluntary basis. It is also distinct from the CSRD concept of an "adequate wage" and should not be interpreted as such. Further details on the living wage methodology and its application are described in the reporting principles section.
The 2025 results confirm that Signify continues to exceed living-wage standards in nearly all the regions assessed. Only one region, representing 0.33% of the population, fell marginally below the benchmark, reflecting a 49% reduction compared to last year’s findings.
Talent, learning and development
S1-13 – Training and skills development metrics
Our talent management philosophy focuses on identifying and developing employees’ skills and capabilities to support professional growth and business impact. This approach is reflected in our talent development, succession planning, and learning initiatives and is underpinned by our Human Rights Policy, which supports employability, continuous development, and a safe and respectful workplace for all employees.
At Signify, we aim to develop our talent from within and be a true talent builder. We focus on hiring at entry‑level positions - with campus hiring as our largest source - and promoting from within. We are committed to continuously identifying and developing our people’s skills and potential, enabling them to make a positive impact at Signify while growing as professionals.
In line with our philosophy, we continue to identify and source talent through high-quality channels:
Internal - last year, approximately 28% of our vacancies, and 27% of our managerial positions were filled internally;
Employee referral - 19% of total external hires came from employee referrals;
Signify careers website - through our content strategy on social media, "Humanizing our employer brand", we saw high engagement driven by our employees sharing content and our stories about why Signify is a great place to work, aligning with our values and EVP.
We continue to foster internal mobility by matching our talent with internal opportunities. In 2025, we strengthened our Talent Management Philosophy, designed to cultivate continuous growth, empower employees to own their development, and strengthen the quality of career conversations across the organization. This philosophy marks a shift from talent planning to activation - ensuring we have the right talent in the right role at the right time with the right skills.
To bring this vision to life, we launched the Workday Career Hub, a centralized platform that offers personalized recommendations for jobs, mentors, learning content, and career paths based on each employee’s skills, interests, and aspirations. It enables employees to identify skill gaps, explore next roles, and connect with peers, while giving managers the tools to recommend targeted development opportunities and stretch assignments.
This launch - to be expanded globally in 2026 - forms part of our broader Skills First transformation, a multi‑year journey to embed skills into our operating model and build a truly skills‑based organization. This approach enriches job profiles, benchmarks against external data, and evolves through validated employee input. With skills at the core of our talent ecosystem, we enable smarter decisions on development, internal mobility, and workforce planning, ensuring employees have access to meaningful, personalized growth opportunities aligned with our strategic priorities.
Learning continues to be a strategic differentiator for Signify, driving talent attraction, retention, and performance. Our learning ecosystem blends on-the-job assignments (experience), coaching and mentoring (exchange), and formally structured learning and online courses (education). The average number of hours spent on training and development per headcount was 16 hours during 2025 (2024: 18).
Average number of learning hours by gender | |
|---|---|
2025 | |
Female | 16 |
Male | 15 |
Not disclosed | 12 |
Total | 16 |
During the year, we also launched Workday Learning as the central learning hub for all employees, providing a seamless and personalized learning experience. To power the platform with high-quality, industry-leading content, we partnered with Skillsoft, enriching our learners’ access to world-class resources and courses that build both technical and leadership capabilities. The first rollout was launched with our Digital team, with a global deployment planned for 2026.
We continued to invest in digital reskilling and skill assessments for skills like Robotic process automation (RPA), Data and analytics (AI, Machine learning, Data analytics), Cloud computing, Information and cyber security, Programming languages, and IT architectures.
As part of our commitment to responsible AI use, we introduced the AI Policy, which ensures that all AI systems developed, deployed, or used by employees adhere to principles of accountability, transparency, fairness, and security. The policy is applicable to all employees and includes training to ensure everyone understands how to apply AI safely and ethically. The training covers essential topics such as safeguarding data privacy, managing AI-related risks, and ensuring compliance with regulatory requirements.
We expanded the INNOLEAD program throughout the Innovation team to strengthen the organization’s long-term capacity for innovation and market responsiveness. The program serves as a Tech Leadership journey aimed at developing a new generation of experts who can lead through expertise, influence, and innovation. INNOLEAD fosters a sustainable culture of agility, evidence-based decision-making, and thought leadership. By equipping participants with advanced capabilities in innovation management, change leadership, and strategic thinking, the program builds a resilient and future-ready community of technical leaders capable of driving meaningful transformation across the organization.
We continued to ensure that our leadership development experiences are aligned with our leadership framework of lead, develop, and inspire.
In 2025, we continued strengthening managerial capabilities through iEDGE and iEDGE+, our people manager development programs launched in 2024. To expand reach, the program was translated and delivered in French and Chinese. A total of 1,384 managers - representing 94% of all eligible people managers - have completed the program.
Structured as a developmental journey aligned with our leadership framework, the program covers the essentials of managing self, teams, and work. It includes eight modules on topics such as emotional intelligence, situational leadership, change management, and unconscious bias.
To sustain and reinforce these skills, we established region-based Communities of Practice. These quarterly sessions offer refresher training and peer coaching, fostering open dialogue around real-life challenges and encouraging practical, collaborative problem-solving.
Diversity, equity & inclusion
S1-9 – Diversity Metrics
We believe diversity and inclusion drive innovation and business success. As an equal-opportunity employer, we celebrate and value all ideas, perspectives, and experiences, ensuring everyone has equal access to opportunities and resources.
Diverse representation helps us connect with customers and attract talent. Operating in 73 countries with over 91 nationalities, our DE&I roadmap embodies our “Greater Together” value, driving innovation, growth, and a strong culture.
Our two global diversity, equity and inclusion priorities are increasing the representation of women and increasing our generational diversity by attracting more Gen Z colleagues to our organization. Diversity challenges vary across markets and geographies. For this reason, we have added an additional local DE&I priority to provide flexibility in meeting market needs, ensuring relevance for each market. We ask leaders to choose a DE&I priority that they will drive in their own market. This is what we call our 2+1 approach, reflecting two global priorities + 1 local priority. As an example, India has identified people with disabilities (PWD) as a key focus area. A dedicated PWD committee has been established with responsibility for introducing new policies that are conducive to the needs of PWD. We are committed to improving diversity at all levels, attracting candidates from more diverse pipelines, and driving development and internal mobility to increase representation across our company.
In line with this commitment, we signed the United Nations (UN) Women’s Empowerment Principles in 2021, reinforcing our pledge to double the percentage of women in leadership roles (defined by CSRD as Top Management) to 34% by the end of 2025, from a baseline of 17% in 2019. In 2025, women represented 42% of Signify’s employees (2024: 40%), 41% of our new hires (2024: 45%) and held 27.5% of leadership roles across the company (2024: 27.8%) with 28 women leaders and 74 men. While we did not fully reach our ambition, we made overall progress since 2019 and remain committed to advancing gender diversity in leadership by continuing to build on our hiring and pipeline initiatives and applying lessons learned.
On generational diversity, 14.2% of Signify employees were Gen Z (2024: 12.2%). As part of our strategy to attract Gen Z talent, we expanded our campus hiring and our internship programs.
The 4 US awards we received from RippleMatch in 2025 highlight our commitment to hiring early career talent, emphasizing diversity and inclusion, and investing in the next generation. As we advance our priorities, we are driving actions to boost diversity recruitment and internal mobility at all levels, including inclusive job postings, diverse shortlists, and hiring panels. We have plans to address gaps and accelerate progress, ensuring our talent pipeline reflects market diversity. To strengthen these efforts, the “license to hire” training has been continued for all people managers to enhance their skills and knowledge during recruitment around DE&I (e.g. fairness of process, fair decision-making, candidate experience, equity).
Our Diversity, Equity & Inclusion Policy, a cornerstone of our Integrity code, underscores our commitment to creating a fair and inclusive workplace. It ensures equitable treatment for all employees, including population at risk, regardless of race, color, age, gender, gender identity or expression, sexual orientation, language, religion, political views, disability, veteran status, national origin, or any other protected characteristic. This aligns closely with our Human Rights Policy, which explicitly addresses non-discrimination and equal treatment, providing prevention, mitigation and remediation guidance.
To maintain a safe and inclusive workplace, our Anti-Harassment and Anti-Discrimination Policy prevents unlawful behavior, promotes accountability, and protects our organization’s reputation. This also includes workplace principles designed to foster flexibility, inspiration, collaboration, and belonging. Employees have the flexibility to work from home as needed and set reasonable boundaries, promoting balance and well-being. Together, these principles create an environment where every employee can thrive and contribute to our shared purpose.
In partnership with Harvard Business Publishing, we educate all employees on topics such as unconscious bias, microaggressions, generational diversity, psychological safety and inclusive leadership. We continue embedding the inclusive Leadership Model into the iEDGE leadership program for people managers.
In March, to honor International Women’s Day, colleagues worldwide organized events under the theme #EmbraceEquity, celebrating achievements and reflecting on challenges within the equity and inclusion space.
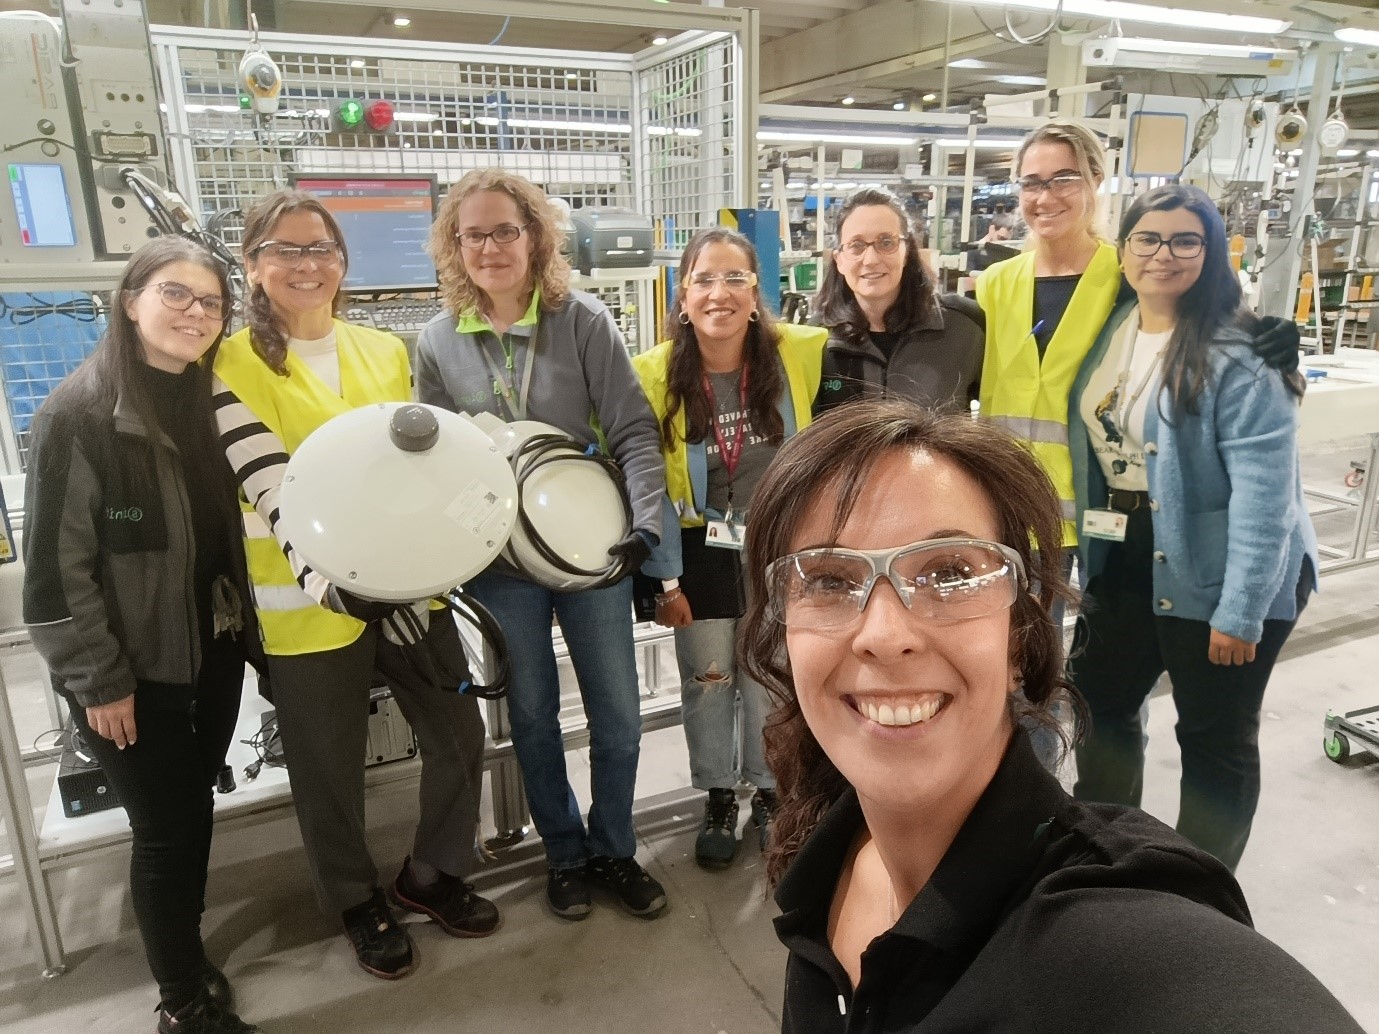
Our Valladolid site launched its first all‑female industrialization team, demonstrating progress in increasing female representation in technical and operational functions. With growing participation of women across departments, we are actively addressing gender imbalances and supporting career development in roles where women remain underrepresented. These efforts reflect our broader ambition to build a more inclusive and diverse workforce across the company.
Our commitment to creating and sustaining an inclusive workplace culture is evidenced in our Diversity Committee, DE&I Champions network, and our Connection Point Groups. These empowered, employee-led and self-governing groups champion our dedication to belonging and well-being. Founded in 2019, our DE&I Board continues to drive our strategic initiatives and the ongoing development and refinement of our multiyear DE&I roadmap.
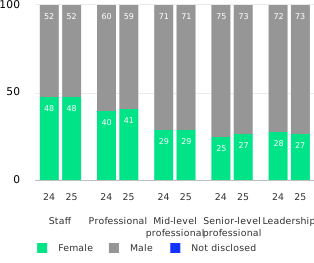
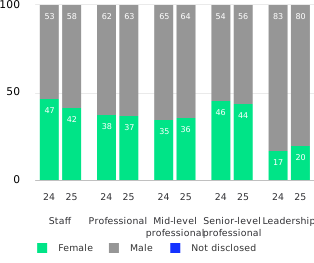
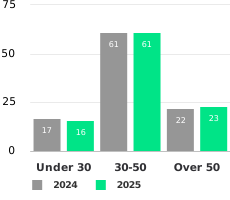
Signify’s commitment to equal pay for equal, or substantially similar, work is anchored in our rewards fundamentals and pay philosophy. We have established robust pay governance frameworks covering hiring, benefits, annual compensation review, and promotion processes to ensure fairness and transparency.
There are two important components in equal remuneration: the adjusted pay gap, and the unadjusted pay gap. The adjusted pay gap reflects pay equity; providing equitable pay for the same or similar jobs when considering differentiating factors such as location, performance, skills and experience, among others, while the unadjusted pay gap refers to the difference in pay between all men and all women in an organization.
Our pay equity journey began in 2017 with our first global analysis, and we have continued to strengthen our approach. In 2024, we partnered with an independent, external pay equity analytics provider to enhance the rigor, objectivity and transparency of our assessments. These annual reviews apply comprehensive statistical methods across all employee groups worldwide. Where meaningful variances are identified, we take prompt and targeted action to address them.
Looking ahead, we are preparing for new pay transparency and pay equity requirements being introduced across multiple jurisdictions. We are embedding these standards into our internal processes and leveraging external expertise to ensure compliance and best practice. Our latest analysis confirms that we continue to ensure equitable pay; men and women performing similar work – such as within the same grade, location, or job family, receive equitable pay.
S1-16 – Remuneration metrics
Creating a workplace where everyone is rewarded fairly for their contributions is central to our values and long-term success. Each year, we review our progress to ensure that our compensation practices remain transparent, equitable, and aligned with our principles. The unadjusted pay gap refers to the difference in earnings between men and women without any adjustments made for factors such as skill set, education, experience, and performance.
Our latest analysis shows that the unadjusted pay gap between men and women is 24%, representing a 3 percentage-point improvement compared to last year. This means that women earn on average 76 cents for every euro earned by men (2024:73 cents). While this progress is encouraging, the gap continues to be primarily driven by the underrepresentation of women in technical roles and senior leadership positions. The calculation is based solely on fixed base salary and excludes variable remuneration components such as bonuses, incentives, equity awards, and benefits. Signify is working to progressively enhance data coverage and the calculation scope in future reporting periods.
Over the past year, we have made progress toward closing this gap. We continued to advance our ambition to double the percentage of women in senior leadership positions as part of our Brighter Lives, Better World 2025 program. Our pay reviews were complemented by advanced analytics through our partnership with Syndio, enabling us to identify and address notable variances promptly. In addition, our International Fair Pay team progressed on the strategic roadmap toward compliance with the EU Pay Transparency Directive, further reinforcing transparency and accountability across our organization. We also expanded training and awareness sessions for managers and HR professionals to embed pay equity principles into everyday equity principles into everyday decision-making.
Looking ahead, closing the gender pay gap will remain a key focus. We will continue to monitor pay practices, strengthen representation of women in technical and leadership roles, and align with forthcoming EU pay-transparency regulations. Our long-term goal is to embed fairness and equity into every aspect of our reward framework, because we believe that equitable pay is not only a legal and ethical obligation - it is also a driver of innovation, engagement, and long-term business success.
S1-16 – Remuneration metrics
The remuneration ratio represents the relationship between the highest-paid individual’s annual base compensation and the median annual base compensation of all employees within the organization. For the reporting year, the Remuneration Ratio - calculated on base compensation only - is 73.
The calculation is based solely on fixed base salary and excludes variable remuneration components such as bonuses, incentives, equity awards, and benefits. As a result, the disclosed Remuneration Ratio does not fully align with the CSRD definition, which is based on total remuneration. Current limitations in the availability and consistency of variable pay and individualized benefits data prevent full application of the CSRD methodology. Subsequently, comparative data is not reported. Signify is working to progressively enhance data coverage and the calculation scope in future reporting periods.
The Remuneration Ratio disclosed in this section differs from the Internal Pay Ratio presented in the Remuneration report (see subsection 10.2.10, Signify's internal pay ratio). Signify’s Internal Pay Ratio is calculated by comparing the CEO’s total compensation with the average total compensation of employees, rather than median compensation, and therefore serves a different reporting purpose.
5.3.2 Workers in the value chain (S2)
Our approach
At Signify, we prioritize the well-being of our employees, workers in our value chain, and the communities we operate in. With direct business relationships with over 3,000 product and component suppliers, we recognize the importance of responsible procurement practices and supply chain management.We aim to build positive relationships with people and organizations, with mutual respect and understanding at the core of all our interactions. This commitment aligns with our fundamental goals of respecting human rights, promoting diversity and inclusion, and maintaining high health and safety standards.
Over the years, Signify has developed and implemented programs to prevent human rights violations within our supply chain. These initiatives follow a due diligence approach and include the assessment and development of supplier sustainability performance through audits and training, as well as responsible minerals sourcing. We are actively working to address our material topics - ensuring that we mitigate risks to workers in our supply chain while also safeguarding our business from the financial and reputational risks that may arise from these issues.
This section is aligned with the ESRS S2 disclosure requirements and outlines our due diligence approach, engagement strategies, and performance metrics for high-risk, high-spend suppliers.
Material impacts, risks and opportunities
S2 SBM-3 - Material IRO and their interaction with strategy and business model
S2-1 - Policies related to value chain workers
The double materiality assessment identified the following material IRO:
Working conditions - potential negative impact- upstream
Human rights - potential negative impact - upstream
The table below summarizes the relevant policies and associated details, as well as their linkage to the S2 IRO. For further information on the DMA, see section 5.1, Brighter Lives, Better World 2025 progress.
The types of value chain workers subject to material impacts are defined in the respective sections below. In addition, we conduct an annual human rights risk assessment, which provides further insights. This is explained in detail in the following section.
Policy | Description | Related IROs | Key stakeholders & scope | Accountability & governance |
|---|---|---|---|---|
Supplier Sustainability Declaration | Supplier Sustainability Declaration sets out the standards and behaviors we require from our suppliers and their suppliers to improve conditions for workers and promote a cleaner environment for local communities. | 1, 2 | The policy covers our direct suppliers both upstream and downstream globally. | The Supplier Sustainability Declaration is overseen by the Head of Procurement and managed by the Supplier Sustainability Manager. |
Human Rights Policy | The policy sets out our commitment to uphold and respect human rights in all aspects of our own operations and across the value chain, as well as our dedication to promoting and protecting human rights and making a positive contribution. | 1, 2 | The policy covers our entire value chain and stakeholders including own workforce, workers in the value chain, consumers and communities, and business partners. | The policy is overseen by the Chief Strategy, Sustainability and Marketing Officer. The implementation responsibility is with the Human Rights Committee. |
Human rights due diligence
S2-3 - Process to remediate negative impacts and channels to raise concerns
Our approach to human rights due diligence is based on the Responsible Business Alliance (RBA) Code of Conduct and focuses on identifying, assessing, managing, and remediating material impacts on workers in our value chain. Through our Supplier Sustainability Audit Program, we evaluate high-risk suppliers to ensure compliance with ethical labor standards.
In 2024, we conducted a comprehensive risk assessment of our supply chain, focusing on key issues such as labor conditions, health and safety, working hours, and forced labor. We conduct this assessment every two years to ensure continuous oversight and identification of emerging risks.
These assessments guide our engagement with suppliers and influence our corporate strategy through a double materiality lens. Audit results feed into our broader human rights risk management strategy, ensuring adverse impacts on workers are effectively mitigated and remediated. We are also exploring direct engagement with relevant downstream suppliers in the future to further enhance our ability to address and mitigate human rights risks across the value chain.
This structured approach allows us to focus on the most salient human rights issues - those with high to critical risks - ensuring that adverse impacts on workers in our value chain are systematically prevented, mitigated, and remediated in alignment with internationally recognized frameworks.
Through our assessment, we identified the following salient issues among our supply chain.
Forced, bonded, or indentured labor: migrant workers, particularly those recruited through third-party agencies, are vulnerable to forced labor practices, including debt bondage and retention of personal documents;
Child labor: the risk of child labor is particularly high in informal mining and unregulated parts of the supply chain. Children face hazardous work conditions that prevent schooling and expose them to harm;
Exploitation of young workers: young workers, typically aged between 16 and 18, are legally permitted to participate in internships or apprenticeships, provided these roles do not involve hazardous tasks. However, there is a risk that such programs may expose them to unsafe working conditions, excessive hours, and physically demanding or dangerous work if not properly regulated;
Excessive working hours: in certain production environments, workers may be required to work extended hours, particularly during periods of high demand. This issue is often influenced by socio-economic factors in specific regions, where workers may voluntarily work additional hours to increase their earnings;
Inadequate wages & benefits: wages below a country’s minimum wage threshold coupled with insufficient benefits can lead to financial insecurity, forcing workers to work excessive hours or multiple jobs to meet basic needs, increasing fatigue and health risks;
Poor working conditions: workers in manufacturing environments face health and safety risks such as exposure to hazardous chemicals, unsafe machinery, and physically demanding tasks like heavy lifting or repetitive motion, leading to injuries, illnesses, and long-term health impacts. Poor access to clean housing and sanitation, including overcrowded accommodations, lack of potable water, and inadequate sanitary facilities, further exacerbates health risks and reduces quality of life;
Lack of emergency preparedness and building safety: manufacturing facilities may lack proper emergency preparedness, fire safety measures, and safe building structures, increasing the risk of injuries or fatalities. Poorly maintained buildings, inadequate fire detection systems, obstructed exits, and insufficient recovery plans further elevate these dangers. Without comprehensive safety procedures and proper facility maintenance, workers' well-being is at significant risk.
Dependency on value chain workers presents an opportunity to enhance fair labor practices and worker well-being, while building a more resilient and transparent supply chain, ultimately contributing to sustainable long-term growth. Signify is dedicated to addressing human rights risks within our supply chain through a structured mitigation plan. Our approach focuses on collaboration with suppliers to ensure compliance with our standards and continuous improvement.
For the risks of forced, bonded, or indentured labor and the use of child labor, Signify maintains a zero-tolerance policy. Suppliers are required to address any such cases immediately upon detection. Failure to comply with our policies and to take immediate corrective action can result in the termination of business relations. More details on how we monitor and follow up with suppliers to ensure compliance and corrective actions are outlined in our programs described below in our action plan for child and forced labor.
In 2023, Signify launched the Supplier Improvement Program (SIP) to address key human rights issues in our supply base through targeted, on-site training conducted by third-party experts. In 2024, the focus was on working conditions, health and safety, and emergency preparedness. In 2025, we delivered a comprehensive supplier training program covering all human rights topics outlined in our Supplier Sustainability Declaration, including labor management, ethics, management systems, health & safety, and environmental management.
The program aimed to strengthen supplier capabilities, promote responsible practices, and support continuous improvement across supplier sites. 29 suppliers attended the training. Suppliers have noted the program’s effectiveness in helping them implement corrective actions and improve facility standards. Through our Responsible Business Alliance (RBA) membership, suppliers also have access to additional training and resources, supporting the adoption of sustainable best practices.
Our supplier rating program, Tritium, supports the development of a strong and resilient supply base built around best-in-class partners. Suppliers are evaluated against a range of criteria aligned with our strategic priorities, enabling continuous improvement in sustainability performance. The system rewards maturity and proactive initiatives on human rights, working conditions, climate action, and responsible mineral sourcing, while non-compliance is addressed and lack of corrective action may affect future business allocation. Ultimately, Tritium ratings directly inform commercial decisions and guide how we allocate business across our supplier network.
Stakeholder engagement
S2-2 - Process for engaging value chain workers about impacts
To ensure effective collaboration and risk mitigation, we actively engage with suppliers, workers, peers, and civil society organizations. These interactions provide critical insights into challenges within our value chain and address inclusive business practices, sustainability initiatives, and targeted strategies. Our key stakeholder engagement activities include.
Supplier Onboarding: we engage potential suppliers through assessments of quality, sustainability, trade compliance, and risk at various onboarding stages. These evaluations, conducted by our internal teams or external partners like SGS, yield insights into industry trends and compliance, informing our business and sustainability strategies.
Supplier Business Review Meetings: regular meetings with key suppliers address pricing, availability, innovation, and sustainability, supported by our supplier rating program Tritium. These discussions, led by our Supplier Account Managers, foster alignment and strengthen relationships, influencing our business allocation strategies based on supplier performance. Sustainability performance is shared with the supplier representatives as proxies.
Supplier Sustainability Audits: we engage with suppliers and value chain workers through periodic audits conducted for high-risk suppliers with over EUR 1 million in spend, in collaboration with an independent certification body. These audits include direct interviews with value chain workers and their representatives to identify any risks or complaints.
Additionally, we are exploring ways to enhance direct engagement, particularly with vulnerable groups, to strengthen our commitment to worker well-being and inclusiveness.
Supplier Trainings: we offer annual training on health, safety, and human rights, promoting compliance and long-term improvements in our supply chain. These trainings are tailored to audit results and are available to all interested suppliers.
By engaging with suppliers, workers, peers, and civil society organizations, we gain valuable insights into the challenges faced by workers within our value chain. This engagement enables us to develop and implement more inclusive business practices, positive opportunities, and commodity strategies that effectively address the specific needs and concerns of value chain workers and vulnerable populations. We maintain the effectiveness of these engagements through ongoing monitoring, audits, and direct interactions such as business reviews and interviews. By adapting our programs based on feedback and audit results, we ensure we stay aligned with the evolving needs of both vulnerable workers and consumers.
Action plan
S2-4 - Taking action on impacts and approaches to managing risks and opportunities
S2-5 - Targets related to managing IRO
At Signify, we prioritize our efforts on suppliers located in high-risk countries, as identified by the SA8000 country risk assessment. The list includes China, Mexico, and India, where most of our suppliers are based. Our current focus is on tier 1 suppliers except for our responsible minerals activities. Key risks, such as excessive working hours and building safety, are actively monitored. Additionally, we face potential risks of forced and child labor in the electronics and mining sectors. Through a zero-tolerance policy and a comprehensive due diligence program, we actively monitor and mitigate these risks, including responsible minerals sourcing. When violations are found, the supplier must address this issue within the shortest possible timeframe. If the supplier is not willing or able to do so, we will terminate the business relationship. The following sections provide details on the programs we have running to address the salient issues and material IROs.
We have established a dedicated team within our procurement organization to implement and monitor the performance of our supplier sustainability and responsible minerals program. Results are assessed against our sustainability targets, which are regularly reviewed by procurement and sustainability senior management. In the event of deviations from our targets, we take proactive corrective measures to realign with our sustainability objectives. This structured approach reflects our commitment to responsible sourcing and continuous improvement in our supply chain practices.
We ensure the protection of human rights through our Supplier Sustainability Declaration, which also forms an integral part of supplier contracts. The policy is signed off by the Head of Sustainability and the Procurement Performance Leader, who also holds oversight of its implementation and overall accountability for ensuring compliance. We expect both upstream and downstream suppliers providing products, components, parts, subassemblies, materials, packaging, services, or solutions to or on behalf of Signify to comply with our Supplier Sustainability Declaration (SSD).
Our policy covers areas such as labor rights, health and safety, and ethics. These standards apply to all workers, including temporary, migrant, and contract workers. The SSD serves as our supplier code of conduct and is derived from the RBA Code of Conduct, outlining the standards that we require from our suppliers and their suppliers.
We are committed to respecting internationally recognized human rights in all our operations and throughout our value chain and are aligned with the United Nations Guiding Principles on Business and Human Rights (UNGPs) and the International Labor Organization (ILO) Declaration on Fundamental Principles and Rights at Work.
We ensure compliance with our Supplier Sustainability Policy through a comprehensive Supplier Sustainability Audit Program designed to assess working conditions, human rights, and occupational health and safety risks across our value chain. The program operates on a three-year cycle and is selective, focusing on suppliers with a higher risk profile. Supplier risk is determined through a set of criteria, including: (i) the country in which production sites are located, based on the SA8000 country risk list; (ii) the type of product or service delivered, with audits focused on finished product and bill-of-materials suppliers; (iii) previous performance, those scoring <70 points are audited annually; (iv) annual spend, with an audit threshold of EUR 1 million, in the previous year, and (v) other relevant inputs, including incidents reported to us directly or indirectly, for example via the media. Suppliers of Klite and other recently acquired Signify entities - representing up to 8% of our total supplier spend - are currently excluded from the audit program. Downstream suppliers, while not subject to audits, are required to commit to our Supplier Sustainability Declaration, Signify Human Rights policy, and Signify Integrity code.
Our supplier audit program is designed to ensure compliance and foster continuous improvement and follows a three-year audit cycle. Suppliers scoring below 90 (out of 100) points during their initial audit are required to implement a Corrective Action Plan (CAP), monitored by an independent audit firm. If the corrective actions have not been implemented within one year, we follow strict consequence management to ensure the progress of our suppliers. To reinforce accountability, we follow a performance-based re-audit schedule. Suppliers scoring below 70 points are audited annually to closely monitor their progress. Those scoring between 70 and 90 are re-audited every three years to encourage consistent compliance efforts. Suppliers achieving scores above 90 points during their initial audits are exempt from re-audits unless concerns are raised by internal or external stakeholders, reflecting their commitment to maintaining high standards.
Furthermore, we encourage our suppliers to obtain certifications such as SA8000, ISO 14001, and ISO 45001. To enhance sustainable practices within our supply chain, we aim to favor suppliers that either pose low risk or implement mature sustainability practices and demonstrate strong performance. The key performance indicator of the supplier sustainability program is the overall compliance rate, defined as the percentage of suppliers scoring >90 points after closure of corrective actions. The annual target for overall compliance is at least 95%, based on suppliers in the audit scope. This KPI is based on the RBA audit framework and tracks the share of suppliers with CAPs successfully closed and no critical non-conformities outstanding after the recovery deadline. The KPI scope is limited to suppliers on the SA8000 risk country list with an annual spend greater than EUR 1 million. Value chain workers or their proxies are not directly involved in target setting and performance tracking.
By the end of 2025, 245 suppliers were part of our audit program representing 65% of our total spend. Among these, 237 suppliers (97%) were compliant, either by passing the audit, resolving identified non-conformities (or are expected to do so within six months), or submitting other social compliance certifications. Eight suppliers (3%) were considered non-compliant due to overdue corrective action plans or audit dates and are being followed up with our consequence management process. Our compliance rate at the end of 2025 was 97% (2024:96%), surpassing our annual target of 95%. Most of the audited suppliers are based in China (73%), followed by Mexico (10%) and Vietnam (7%).
The assurance of freely chosen employment and prohibition of child labor in our supply chain are key elements of our sustainability objectives and SSD. Child and forced labor are considered a zero-tolerance issue and Signify’s Forced and Child Labour Due diligence statement requires immediate remediation if observed. We closely follow the implementation of the US’s Uyghur Forced Labor Prevention Act (UFLPA) and Bill S-211 Fighting Against Forced Labor and Child Labor in Supply Chains Act. Our forced labor working group is responsible for implementing due diligence mechanisms and monitoring the risk within our own operations and supply chain. Our Forced and Child Labour Due diligence statement sets out our commitment to do our utmost to prevent any form of child and forced labor in our business and supply chain.
Supplier performance |
The graphs below present an overview of our suppliers' sustainability performance across three core areas: Labor, Health & Safety, and Management. They highlight overall compliance levels in each area prior to the implementation of corrective actions by the supplier base for the years 2023, 2024, and 2025. Emergency preparedness and occupational health & safety showed a year-on-year improvement in performance, reflecting the positive outcomes of our supplier engagement on workers. At the same time, we observed a slight reduction in total working hours, particularly in China, alongside a decline in industrial hygiene indicators in the region. Addressing industrial hygiene and working hours will therefore be a key focus area for next year’s training and capability-building initiatives. |
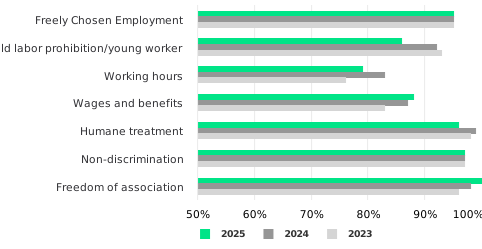
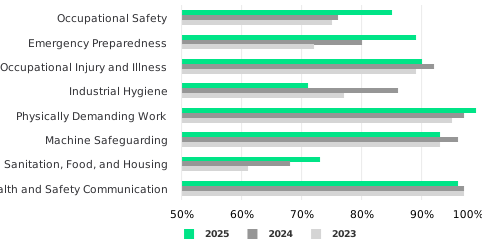
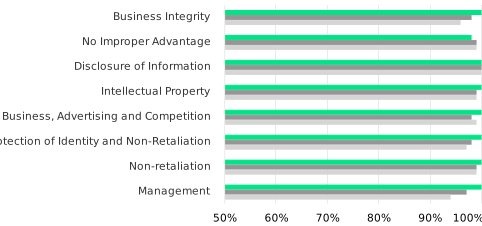
Our commitment to sustainable development extends to the upstream levels of our supply chain, with the aim of preventing human rights abuses and the financing of conflicts in the extractive sector. Global supply chains in our industry are long and complex, often involving multiple tiers between the finished product and the original source of raw materials, yet we believe that progress can be achieved through robust due diligence and strong multi-stakeholder collaboration.
Our products contain minerals and metals that are essential to their functionality, including tin, tungsten, tantalum, and gold (commonly referred to as 3TG, or “conflict minerals”). While we do not use these materials in large quantities, certain applications require them.
As part of the Signify Conflict Minerals program, we implement measures in our supply chain to ensure our products are not directly or indirectly funding atrocities in the Democratic Republic of Congo (DRC). This program is aligned and ensures compliance with Regulation (EU) 2017/821 (the EU Conflict Minerals Regulation) and Section 1502 of the U.S. Dodd-Frank Wall Street Reform and Consumer Protection Act. We support and follow the OECD Due Diligence Guidance for Responsible Supply Chains of Minerals from Conflict-Affected and High-Risk Areas. More information on due diligence process and Signify’s position on Conflict Minerals is available on our website. Our due diligence process is signed off by the Head of Sustainability and the Procurement Performance Leader, who also hold oversight of its implementation and overall accountability for ensuring compliance.
We are an active member of the Responsible Mineral Initiative (RMI) which provides tools and the assurance programs to verify the conflict-free status of smelters, identify sources of 3TG and other materials, and support risk management. We use RMI resources, including the Conflict Minerals Reporting Template (CMRT) and the Responsible Minerals Assurance Process (RMAP).
Each year, we collect and assess supply chain data from 248 in-scope suppliers, and use this information to identify smelters involved in our supply chain. During the annual reporting period, 202 suppliers provided complete, verified, and validated data, enabling the identification of unique smelters within the supply chain. The remaining 46 suppliers were unable to provide sufficient information for analysis.
We identified 354 unique smelters in the reporting period, of which 217 (61%) were conformant with the Responsible Minerals Assurance Process (RMAP). Where non-conformant smelters were identified, we requested corrective actions, encouraged participation in assessment programs, and evaluated the potential for phase-out where necessary.
Due to the complexity of the supply chain, the number of tiers between actors, and the limited number of certified conflict-free smelters globally, it is not always possible to determine the precise origin of all 3TG minerals used in our products. Obtaining accurate data from suppliers remains a challenge, and we continue to encourage suppliers to trace mineral origins, report smelters not listed by the RMI, and support assessments under the RMAP.
Industry-wide challenges persist, including incomplete reporting, declining participation by some smelters in audit programs, and geopolitical disruptions to assessment activities. Nonetheless, collaborative engagement continues to drive gradual improvements, including the transition of suppliers to conflict-free sourcing.
S2-3 - Process to remediate negative impacts and channels to raise concerns
Our approach to addressing concerns and grievances within our value chain is based on transparency, trust, and fair remediation. We are dedicated to continuously improving our processes to ensure appropriate support for affected workers when we have caused or contributed to a negative impact. Through our Supplier Sustainability Declaration, we set clear expectations for our suppliers, emphasizing the need for accessible grievance mechanisms for workers, rights holders, and stakeholders.
We also expect our upstream and downstream suppliers to uphold workers’ freedom to associate. This includes providing channels for workers and their representatives to communicate openly with management about working conditions and practices without fear of discrimination, reprisal, intimidation, or harassment. This commitment is verified for upstream suppliers during our RBA audits through direct interviews with supply chain workers and aligns with our company Integrity Code. Additionally, we are exploring ways to establish direct engagement with downstream suppliers to further promote and ensure adherence to these principles.
All stakeholders, both internal and external, also have access to our Ethics Line, where they can raise concerns confidentially. These concerns are addressed through the general process outlined in G1, with oversight provided by the Integrity Committee to ensure transparency and accountability in resolving issues. No cases were registered by value chain workers in 2025. Details on the process and categorization of complaints is available in section G1.
5.4 Governance
5.4.1 | G1. Business Conduct |
Signify is committed to ethical practices and responsible business conduct. This section covers our corporate culture, value‑chain relationships, and policy advocacy. By fostering integrity, fair and inclusive working conditions, and ethical behavior throughout our operations and value chain, we support SDG 8 on decent work and economic growth. Our climate‑focused advocacy and science‑based decision‑making contribute directly to SDG 13 on climate action. Through transparent due‑diligence processes, engagement with key stakeholders we strengthen responsible business practices that align with SDG 16.
Interact space analysis supports human-centric workplaces
5.4.1 Business Conduct
Our approach
We are committed to the highest standards of ethical business conduct across our operations and value chain. Integrity, accountability, and transparency guide our decisions and form the basis of sound governance.
Our framework sets clear expectations for compliant and responsible behavior, supported by policies such as our Integrity Code, Supplier Code of Conduct, Anti‑corruption and bribery policies, competition law guidelines, and conflict‑of‑interest procedures. These are regularly reviewed to reflect evolving regulations and stakeholder expectations.
To embed ethical conduct throughout the organization, we combine targeted training with strong internal controls designed to prevent, detect, and address misconduct. Reporting channels together with an independently managed whistleblowing mechanism ensure concerns can be raised confidentially.
Our risk‑based due diligence processes further support this by screening business partners, monitoring compliance, and taking corrective action where needed—reinforcing a culture where ethical behavior guides everyday decisions.
G1-IRO-1 - Description of the processes to identify and assess material climate-related IRO
The double materiality assessment identified the following material IRO:
Corporate culture, corruption and bribery - potential financial risk – entire value chain
Political engagement and responsible advocacy – potential positive impact – entire value chain
Corporate culture, corruption and bribery were reclassified from a potential positive impact to a material financial risk following further internal alignment with relevant teams and the ERM process. Although the assessed likelihood of occurrence remains low, the potential magnitude of associated fines would render the impact financially material.
The table below summarizes the relevant policies and associated details, as well as their linkage to the G1 IRO. For further information on the DMA, see section 5.1, righter Lives, Better World 2025 progress.
Policy | Description | Related IROs | Key stakeholders & scope | Accountability & governance |
|---|---|---|---|---|
Integrity Code | Integrity being at the core of how we do business at Signify, our Integrity Code guides us on how to always act with integrity and helps us in protecting our company reputation. | 1, 2 | The Integrity Code applies to Signify’s employees, customers, business partners, shareholders and wider community. | The Integrity Committee oversees the Integrity code. This Committee is chaired by the Chief Legal Officer. Its members include the Chief Executive Officer, Chief Financial Officer, Chief HR Officer, Head of Business Integrity Office and the Head of Legal Compliance |
Reporting Policy | With the Reporting Policy, Signify provides a framework for a reporting procedure and channels for the reporting of any actual or suspected violation of our Integrity code. | 1 | Our Reporting Policy applies to all persons employed by Signify and its subsidiaries and controlled affiliates, irrespective of the contract set-up, be it (a former) employee, director, officer, intern or contingent worker or location of the person. Although this policy does not apply to external parties, Signify encourages third parties to raise complaints and provides open reporting channels to do so. | The Reporting Policy is overseen by the Chief Legal Officer. |
Responsible Advocacy Policy | The Responsible Advocacy Policy promotes ethical, transparent engagement by staying politically neutral, avoiding political contributions, and advancing sustainability and energy efficiency through education, collaboration, and industry partnerships. | 1, 2 | The Responsible Advocacy policy applies to Signify and its employees. | The Responsible Advocacy Policy is overseen by the Chief Strategy, Sustainability and Marketing Officer. |
Corporate culture
GOV-1 - Role of the administrative, supervisory and management bodies
G1-1 - Corporate cutlure and business conduct policies
Corporate governance is the system by which a company is directed and controlled. Good corporate governance derives from, among other things, solid internal controls and high ethical standards.
The Board of Management is responsible for managing the risks associated with the company's activities and for defining the company's risk appetite. The Board of Management is assisted by the company's leadership team, which participates on a quarterly basis in audit, risk and control meetings to identify critical risks and to review progress on the implementation of risk responses. The Audit Committee of the Supervisory Board provides oversight for the system of internal business controls and risk management. Internal and external audits are reported to and discussed by the Audit Committee on a quarterly basis and the internal control self-assessment is reported on a yearly basis. An in-depth description of the company's corporate governance structure can be found in chapter 11, Corporate governance.
The Board of Management of Signify has appointed the Integrity Committee, which is the ultimate body within Signify keeping oversight on the development and implementation of the Integrity code, including the monitoring of its effectiveness. One of the key responsibilities of the Integrity Committee is to coordinate the yearly reporting on compliance with the Integrity code and the underlying policies and submit a consolidated report to the Board of Management and the Audit Committee of the Supervisory Board.
The Integrity Committee is chaired by the Chief Legal Officer. Its members include the Chief Executive Officer, Chief Financial Officer, Chief HR Officer, Head of Business Integrity Office and the Head of Legal Compliance. The members of the Integrity Committee complete the regular mandatory training and the Supervisory Board's members confirm their compliance to the Integrity code annually. Each member of the Integrity Committee has extensive experience with compliance matters throughout their careers, which enhances their ability to oversee the integrity framework effectively.
On an annual basis the Board of Management receives a detailed integrity report over the past year, including statistical analysis of reported concerns, benchmark data as well as key observations as to developments in integrity cases. This annual integrity report is also presented to the Audit Committee. Next to the regular reporting, ad-hoc reports on material cases take place. Read more details on business conduct matters discussed by the Supervisory Board in 2025 in chapter 9, Supervisory Board report.
Acting with integrity is the cornerstone for the success of our business and for achieving our purpose. It is integral to the values that define us as a company. Acting with integrity means making the right choices when faced with ethical dilemmas and holding ourselves and each other to high standards of behavior.
The Integrity Code is approved and adopted by the Board of Management. It is reviewed regularly and revised, when necessary, based on input from stakeholders. It applies to all employees of Signify N.V. and its controlled subsidiaries. We also expect our business partners to comply with the key principles included in our Integrity Code. The Integrity Code formulates minimum standards of behavior. Signify has underlying policies that form an integral part of the Integrity Code, ensuring its alignment with the United Nations Convention against Corruption. These policies are made accessible to all employees through multiple channels, including onboarding programs and internal websites.
Also, to further increase the level of awareness and to create global engagement, the company has established a network of Compliance Officers in countries where the company has a presence, on each significant site, and across the whole organization. The activities and responsibilities of this network are focused on providing expertise and support to managers and employees on Integrity code-related matters. Managers play a crucial role in the prevention and detection of corruption and bribery. Promoting participation in training sessions and leading by example through behavior that shows integrity are key responsibilities. Management is often the first point of contact for employees wishing to raise concerns. Furthermore, the Signify Central Privacy Office safeguards the governance of personal data together with privacy contact points across the organization.
The Integrity Code is supported by mechanisms that ensure standardized reporting, escalation and investigation of concerns. These mechanisms are based on the Integrity code Reporting Policy that urges employees and third parties to report any concerns they may have regarding business conduct in relation to the Integrity code, either through a Compliance Officer or through the Signify Ethics line. The Signify Ethics line enables employees and third parties to report a concern either by telephone or online via a web intake form. All concerns raised are consistently registered in a single database and are investigated in accordance with standardized investigation procedures in a prompt, independent and objective way as specified by the Reporting Policy.
Awareness and training on the Signify Ethics line is part of the regular training and awareness measures of the compliance team. All employees with access to our digital learning platform will have to participate in a mandatory e-learning which includes a section on the Signify Ethics line. For manufacturing sites, awareness of available reporting channels is supported through posters promoting the Ethics line and face‑to‑face training sessions. Once a complaint is registered, independent investigators become involved, separate from management, ensuring an unbiased review. The findings from investigations frequently lead to remedial actions aimed at strengthening controls or processes, preventing future misconduct.
The stipulations of the Reporting Policy contain explicit wording to ensure that employees who report violations in good faith are protected from retaliation, in alignment with the Directive (EU) 2019/1937 of the European Parliament and of the Council. This applies to employees, and, in some cases, third parties connected with the reporter. Any measure of retaliation is a serious violation of the policy, leading to disciplinary action against those responsible. This clear commitment to non-retaliation emphasizes the importance of a safe reporting environment and Signify’s commitment to protecting those who come forward with concerns.
G1 -3 - Prevention and detection of corruption and bribery
The basis of corruption prevention is risk assessment. Based on objective data points, countries are categorized as having a high, medium or low risk of corruption. Countries with a high and medium risk must train their country organization on corruption prevention once a year and countries with a low risk every two years. Anti-corruption training is assigned to the country organizations via the Training Tracker which is accessible to all local Compliance Officers. The Training Tracker lists the functions of the Group to be integrated into the local anti-corruption training of the country organization. The functions are assigned by Corporate Legal Compliance on a risk-based approach. The approach is that all employees who have contact with external business partners or authorities are in scope to receive anti-corruption training. In addition to anti-corruption, compliance trainings also include key topics such as anti-money laundering, antitrust, privacy, and export controls. Also, new employees are required to complete mandatory onboarding training containing a section on anti-corruption upon joining. By maintaining this process, we ensure that all of the most at-risk functions are comprehensively covered by our training programs. Employees in at‑risk functions were required in 2025 to complete two mandatory integrity-related e‑learnings: the “Integrity Code Awareness" training, designed to strengthen understanding of our company policy, which achieved a completion rate of 95% across the targeted population, and the “Speak Up” training, which provides guidance on our reporting channels and expectations for raising concerns, with a completion rate of 96%.
This process is based on Signify's Business Control Framework (BCF), setting the standard for risk management and business controls in the company. The objectives of the BCF are to maintain (i) integrated management control of Signify's operations to ensure the integrity of the financial reporting and related disclosure, and (ii) compliance with applicable laws and regulations. Signify has designed its BCF based on the framework established by the Committee of Sponsoring Organizations of the Treadway Commission (COSO). Signify regularly evaluates and improves its BCF to align with business dynamics and good practices.
As part of our continuous commitment to corporate governance and transparency, we have updated the categories of violations of our Integrity Code to align with the requirements of the Corporate Sustainability Reporting Directive (CSRD). While these categories were not fully aligned with CSRD in 2024, as of January 1, 2025, our new classification is composed of categories that meet CSRD standards.
The primary financial risk associated with governance issues is the imposition of fines for non-compliance with anti-bribery, anti-corruption, and other regulatory requirements. Additionally, non-compliance can result in disqualification from participating in public tenders. These factors can have a significant financial impact on our business, highlighting the importance of our rigorous compliance and risk management practices.
In 2025, no convictions or fines were imposed on Signify for violations of anti-corruption or anti-bribery laws, reflecting our strong commitment to upholding the highest ethical standards.
G1-4 - Confirmed incidents of corruption and bribery
Human resources
The most reported concerns were related to human resources, representing 58% of the total cases reported (55% in 2024). This category includes concerns that, for example, related to equal and fair treatment, harassment, or other human resources related topics.
Business integrity
The second most reported type of concern relates to business integrity. This includes conflicts of interest, fraudulent disbursements or any other fraudulent suspected behavior. The number of complaints reported in this segment represents 28% of the total cases reported in 2025 (29% in 2024).
Security
In 2025, the number of reported cases relating to Security, including IT increased slightly. This category represents 11% of the total cases reported in 2025 (9% in 2024) and relates, for instance, to concerns about unauthorized use of the company’s assets, theft, cyber security or other IT-related concerns.
Substantiated concerns
At the start of 2025, 32 cases were open (2024: 62), and during 2025, a total number of 320 cases were reported (2024: 276). As per December 2025, 43 cases were open (2024: 32). This means that during 2025, we closed 309 cases (2024: 306). Of these 309 cases, 117 were found to be substantiated (2024: 132), which represents 38% of the closed cases.
Substantiated cases involving employees are followed up with remediation actions. These actions can include additional measures, such as training, strengthening of internal controls, creation of additional policies or other measures that aim to promote or enhance a culture of business compliance.
Corrective actions can also take the form of disciplinary action. In 2025, Signify applied disciplinary actions to employees ranging from training and coaching to verbal and written warnings and to termination of employment, depending on the severity of the matter.
Furthermore, when substantiated cases involve external parties, such as suppliers or business partners, Signify reserves the right to terminate business relationships. For instance, in cases of fraud, corruption, or other serious breaches of ethical standards, the company may cease all collaboration to safeguard its integrity and maintain trust with stakeholders.
2024 | 2025 | |
|---|---|---|
Environment, Health or Safety | 5 | 3 |
Human Resources | 151 | 184 |
| 7 | 3 |
| 15 | 10 |
Legal | 8 | 6 |
Privacy/data protection | 1 | 1 |
Business Integrity | 81 | 88 |
| 13 | 13 |
| 9 | 10 |
| 0 | 0 |
Security, including IT | 24 | 36 |
Other | 7 | 3 |
Total | 276 | 320 |
Business conduct with suppliers and value chain
G1-2 - Management of relationships with suppliers
Signify takes a comprehensive and proactive approach to managing its relationships with suppliers, focusing on mitigating risks across its value chain, aimed at enhancing sustainability through – amongst others – its Supplier Sustainability Declaration (SSD) and its risk assessment. For more details on engagement with suppliers, see subsection 5.3.2, S2 Workers in our value chain.
Political influence
G1-5 - Political influence and lobbying activities
The Signify Responsible Advocacy Policy outlines the company's commitment to conducting business with integrity and transparency, emphasizing neutrality in political matters by refraining from making financial or in-kind contributions to political candidates or parties. This policy ensures that Signify remains impartial, focusing instead on advocating for sustainable practices, energy efficiency, and climate action through active participation in industry associations and collaboration with policymakers.
The Signify Climate Transition Plan, released in June 2024, is a comprehensive strategy aimed at driving the transition to renewable energy, reducing carbon emissions, and promoting sustainability across all our global operations. This plan sets ambitious targets for achieving net-zero emissions and outlines specific measures to enhance energy efficiency and support the global fight against climate change. This plan is also a response to our negative material impacts on climate change identified in our DMA process.
The Responsible Advocacy Policy and the Climate Transition Plan are closely connected, as both underscore Signify's dedication to sustainability and ethical business practices. By maintaining political neutrality and concentrating on advocacy efforts that support environmental goals, Signify ensures that its lobbying activities align with its broader mission to create a sustainable future and lead the industry in climate action.
To do so, we commit to annually review the public engagements of all the associations in which we are members, in alignment with our internal Public & Government Affairs policies, on issues such as energy efficiency, climate policy, and the global energy transition. This will allow us to identify and take action on any potential misalignment with our own advocacy in favor of global climate action. This process is a shared responsibility between the Global Head of Public & Government Affairs, the Head of Standards & Regulations and the Head of Sustainability. None of these executives, nor any members of the Board of Management and Supervisory Board, held a comparable position in public administration in the two years preceding their appointments.
At Signify, we recognize that addressing complex sustainability challenges requires coordinated action and long-term partnerships. By leveraging shared expertise and influence, we aim to drive systemic change and deliver measurable impact.
All our businesses are actively engaged in a range of global sustainability initiatives and frameworks. These include participation in high-profile platforms such as:
New York Climate Week
London Climate Action Week
United Nations Climate Change Conference (COP30)
United Nations Global Compact (UNGC)
International Energy Agency’s Annual Global Conference on Energy Efficiency
In alignment with our Responsible Advocacy Policy, Signify did not make any financial or in-kind contributions to political candidates or parties in the reporting period. We also ensure that associations we are a member of are not making political contributions by following a rigorous monitoring process.
Our advocacy activities are concentrated on several key areas that align with our Climate Transition Plan:
Energy efficiency: we advocate for stringent global energy efficiency standards that reduce energy consumption and carbon emissions. We support regulations that promote the adoption of energy efficient lighting solutions, contributing to our renewable energy commitment;
Climate action: we back comprehensive climate policies aligned with the Paris Agreement, advocating for frameworks that facilitate rapid decarbonization across all industries;
Sustainability: we engage in policy discussions to promote circular economy principles, aiming to minimize waste and optimize resource use throughout the product lifecycle.
Signify amplifies its advocacy messages through active membership in various industry associations. These collaborations help us promote sustainable practices and influence policies that support our goals. Our key memberships include:
The Zhaga Consortium: defining luminaire interfaces supporting circularity;
Lighting Europe: promoting the European lighting industry's interests;
IEC TC 111 and IEC TC34, WG24: focusing on environmental standardization for lighting products and systems;
The Corporate Leaders Group Europe: advancing the Green Growth Partnership and the We Mean Business coalition;
The Climate Group: hosting Climate Week NYC in partnership with the United Nations General Assembly;
European Alliance to Save Energy (EUASE): driving the adoption of the EU’s Energy Efficiency Directive (EED) and Energy Performance of Buildings Directive (EPBD).
Through our participation in these groups, we work collaboratively with industry leaders, policymakers, and experts to promote sustainable lighting solutions and advocate for policies that align with our renewable energy and sustainability goals.
Signify is registered in the EU Transparency Register (REG Number: 943095936679-05) underscoring our commitment to transparent and accountable lobbying activities. This registration ensures that our interactions with EU institutions are conducted openly, reflecting our dedication to ethical advocacy.
5.5 Reporting principles
Climate change ESRS E1
Signify adheres to the five key GHG accounting and reporting principles of the GHG Protocol (GHGP) Corporate Accounting and Reporting Standard:
Relevance - the principle of relevance is used for selecting the appropriate GHG inventory boundary that reflects the substance and economic reality of the company’s business relationships, determined by the characteristics of the company, the intended purpose of information, and the needs of the users;
Completeness - all relevant emissions sources within the chosen inventory boundary need to be accounted for so that a comprehensive and meaningful inventory is compiled;
Consistency - the consistency principle is to ensure the consistent application of accounting approaches, inventory boundary, and calculation methodologies is essential to producing comparable GHG emissions data over time, to allow trends analysis and assess the performance of the reporting company. If there are changes in the inventory boundary, methods, data or any other factors affecting emission estimates, they need to be transparently documented and justified. Signify defines a significance threshold of 5% for recalculation, that is a cumulative change of 5% or larger in the total base year emissions (tCO2e), in line with the Science-Based Targets Initiative (SBTi) Target Validation Protocol’s threshold of significance;
Transparency - relates to the degree to which information on the processes, procedures, assumptions, and limitations of the GHG inventory are disclosed in a clear, factual, neutral, and understandable manner based on clear documentation and archives (i.e., an audit trail). Signify’s GHG emissions are assured by an independent third party on the basis of “Reasonable Assurance”;
Accuracy - data should be sufficiently precise to enable intended users to make decisions with reasonable assurance that the reported information is credible. GHG measurements, estimates, or calculations should be systemic, and the quantification process should be conducted in a manner that minimizes uncertainty.
In line with ESRS, Signify accounts for all its Scope 1, 2, and 3 GHG emissions from entities/assets/sites consolidated in its financial statements and there are no additional entities under operational control. It accounts for all seven greenhouse gases under the Kyoto Protocol, namely carbon dioxide (CO2), methane (CH4), nitrous oxide (N2O), hydrofluorocarbons (HFCs), perfluorocarbons (PFCs), sulfur hexafluoride (SF6), and nitrogen trifluoride (NF3), where applicable and expressed in CO2-equivalent. Signify does not have material GHG emissions other than CO2. Signify does not use biomass or biofuels, thus does not have material biogenic emissions.
A detailed list of activities in our GHG inventory is as follows:
Scope 1 - direct GHG emissions, from stationary fuel combustion (including natural gas, diesel, gasoline, propane, LPG, and fuel oil), process emissions, and fugitive emissions from the use of refrigerants.
Scope 2 - indirect GHG emissions, from purchased electricity, heat, and steam. Scope 2 GHG emissions are accounted for using both the location-based method and the market-based method.
Scope 3 - other indirect emissions, from the following categories that are relevant for Signify:
Category 1 – purchased goods and services;
Category 2 – capital goods;
Category 3 – fuel- and energy-related activities not included in Scope 1 or Scope 2;
Category 4 – upstream transportation and distribution;
Category 5 – waste generated in operations;
Category 6 – business travel;
Category 7 – employee commuting;
Category 8 – upstream leased assets: not applicable. According to the GHG protocol definition, this category is not applicable as Signify does not have upstream leased assets;
Category 9 – downstream transportation and distribution;
Category 10 – processing of sold products is not applicable. According to the GHG protocol definition, this category is not applicable to Signify, as Signify does not have sold products that require processing;
Category 11 – use of sold products;
Category 12 – end-of-life treatment of sold products;
Category 13 – downstream leased assets: not applicable. According to the GHG protocol definition, this category is not applicable as Signify does not have downstream leased assets;
Category 14 – franchises: not applicable. According to the GHG protocol definition, this category is not applicable as Signify does not have franchises;
Category 15 – investments: not applicable. According to the GHG protocol definition, this category is not applicable as Signify does not have investments.
Signify voluntarily reports its avoided emissions (not material) to help our stakeholders such as customers and investors understand the environmental benefits associated with Signify’s energy efficient LED-based lighting products and solutions. The avoided emissions are calculated based on LED-based products replacing less energy efficient conventional lighting products. Signify developed the following formula for quantifying avoided emissions:
Avoided emissions = [(weighted average wattage of conventional - weighted average wattage of LED)] * weighted average lifetime of LED * quantity of sold LED * rate of LED replacing conventional * global average electricity emission factor.
Weighted average wattage of conventional: the weighted average wattage of Signify’s conventional products sold in the reporting year as benchmark of market reference for conventional lighting products;
Weighted average wattage of LED: the weighted average wattage of Signify’s LED-based products sold in the reporting year, reflecting what Signify put on the market to facilitate LEDification;
Weighted average lifetime of LED: the weighted average lifetime (in hours) of Signify’s LED-based products sold in the reporting year;
Quantity of sold LED: Signify’s total quantity of products, systems, and services with LED-based technologies sold in the reporting year;
Rate of LED replacing conventional: the global rate of LED-based lighting replacing installed conventional lighting, which is 64% in 2025. The breakdown of the lighting market by technology replacing technology is Signify’s best estimate hereof, based on the market modeling done by the central Market & Competitive Intelligence team;
Global average electricity emission: the global average emissions factor published by IEA in kg CO2e per kWh for the reporting year, including emissions from both total upstream and combustion, as required by the GHG Protocol Scope 3 Calculation Guideline.
GHG accounting methodology The following tables present an overview of Signify’s GHG emissions calculation methods for each category. The Global-warming potential values (GWP) of the 100-year GWP of the latest IPCC Assessment Report (AR6) have been used (when AR6 is not available, AR5 is used). |
Scope | Emissions calculation method and data source | Emission factor source | ||||
|---|---|---|---|---|---|---|
Scope 1 | Emissions are calculated based on the purchased quantities of stationary fuels (such as natural gas and diesel) and refrigerants, multiplied by published emission factors from the listed sources. Primary data is used in the calculation for the all Signify industrial sites and material non-industrial sites, while extrapolation is made for immaterial non-industrial sites, based on the floor area. Activity data is collected, reported, and validated internally. The data is managed in a digital GHG accounting and reporting platform, which also performs the calculations. | IPCC | ||||
Scope 2 | Location-based emissions are calculated based on the purchased electricity, multiplied by the average electricity grid emission factors at the national or regional levels. Primary data is used in the calculation for the majority of Signify industrial and non-industrial sites, while extrapolation is made for immaterial industrial sites as defined in our Environmental Reporting Policy, based on the floor area. Activity data is collected, reported, and validated internally. The data is managed in a digital GHG accounting and reporting platform, which also performs the calculations. | IEA | ||||
Scope 2 | Market-based emissions are calculated based on the purchased electricity, multiplied by the residual emission factors and the emission factors associated with the contractual instruments (namely Power Purchase Agreement, renewable electricity contract, bundled and un-bundled energy attribute certificates), see section, E1, Energy used in operations. Primary data is used in the calculation for the majority of Signify industrial and non-industrial sites, while extrapolation is made for immaterial non-industrial sites as defined in our Environmental Reporting Policy, based on the floor area. Activity data is collected, reported, and validated internally. The data is managed in a digital GHG accounting and reporting platform, which also performs the calculations. | Green-e Residual Mix Emission Factors RE-DISS Residual Mix Emission Factors | ||||
Scope 3 | Upstream (cradle-to-gate) emissions from the extraction, production, and transportation of goods and services purchased by Signify in the reporting year. A spend-based method is applied to calculate emissions for this category based on Signify’s spend per sector in the reporting year, multiplied by the upstream supply chain emission factor by sector. The spend data is collected internally from our financial system and is part of our integral financial statement. | EPA Supply Chain GHG Emission Factors DEFRA Indirect emissions from supply chain | ||||
Scope 3 | Upstream (cradle-to-gate) emissions from the extraction, production, and transportation of capital goods purchased by Signify in the reporting year. A spend-based method is applied to calculate emissions for this category based on Signify’s spend per sector in the reporting year, multiplied by the upstream supply chain emission factors by sector. The spend data is collected internally from our financial system and is part of our integral financial statement. | EPA Supply Chain GHG Emission Factors DEFRA Indirect emissions from supply chain | ||||
Scope 3 | Upstream (cradle-to-gate) emissions from the extraction, production, and transportation of fuels and energy purchased by Signify in the reporting year, not already accounted for in Scope 1 or 2, including upstream emissions of purchased fuels, upstream emissions of purchased electricity, and transmission & distribution (T&D) losses. An average-data method is applied to calculate emissions for this category. The upstream emissions from fuels are calculated based on the purchased fuels, multiplied by the upstream emission factors for each fuel type. The upstream emissions from electricity are calculated based on the purchased electricity multiplied by upstream emission factors at the national level. The emissions from the transmission & distribution (T&D) losses are calculated based on the purchased electricity, multiplied by the T&D losses from DEFRA. The purchased fuels and electricity data is collected as described in Scope 1 & 2. | DEFRA | ||||
Scope 3 | Emissions from transportation and distribution of raw materials, components and finished products purchased by Signify in the reporting year between its tier 1 suppliers and own operations, and between own facilities (in vehicles and facilities not owned or controlled by Signify). This category also includes all transportation and distribution services purchased by Signify in the reporting year, including inbound logistics, outbound logistics (e.g., of sold products), and transportation and distribution between a company’s own facilities (in vehicles and facilities not owned or controlled by Signify.A distance-based method is applied to calculate emissions for this category, which is done by determining the mass, distance, and mode of each shipment, and then multiplied by the appropriate mass-distance emission factor per mode of transport. Emissions from transportation and distribution are calculated per mode of transport, namely ocean transport, air transport, and road transport. The transportation and distribution mass, origin, and destination data at shipment level is primarily collected internally in our TMS (Transport Management System). When not available in TMS, we collect transportation and distribution data directly from the logistic service providers. The transport distance is calculated using the digital GHG accounting and reporting platform based on the origin and destination at shipment level. It is worth noting that the transportation and distribution data collected (from our internal system and from logistic service providers) does not differentiate for upstream and downstream, therefore the emissions from Category 4 (upstream) and Category 9 (downstream) are grouped and reported together in our Annual Report as “Logistics”. | DEFRA | ||||
Scope 3 Category 5 - Waste generated in operations | Emissions from disposal and treatment of waste generated in our own operations in the reporting year (in facilities not owned or controlled by Signify). A waste-type-specific method is applied to calculate emissions for this category, which is done by consolidating mass data for each waste type and for each waste disposal or treatment method, multiplied by the corresponding emission factors primarily from EPA WARM tool, when not available, emission factors from Ecoinvent are used. The waste types include canteen waste, electrical and electronics waste, paper and cardboard, plastics, and wastewater; the waste disposal and treatment methods include recycling, incineration, and landfill. Waste data is collected, reported, and validated internally. The data is managed in a digital GHG accounting and reporting platform. | EPA WARM | ||||
Scope 3 | Emissions from the transportation of employees for business-related activities (in vehicles not owned or operated by Signify), specifically air travel, leased cars, and rental cars in the reporting year. A distance-based method is applied to calculate emissions for air travel, which is done by consolidating the travelled distances of each haulage type and then multiplied by the corresponding haulage emission factors from DEFRA. A distance-based method is applied to calculate emissions for rental cars, which is done by consolidating the travelled distances and then multiplying by the corresponding emission factors from DEFRA. A fuel-based method is applied to calculate emissions for leased cars, which is done by consolidating the amount of fuel consumed during business travel and applying the corresponding emission factor from DEFRA for that fuel. The business travel activity data is collected directly from our business travel service providers and validated internally. The data is managed in a digital GHG accounting and reporting platform; where the calculations are also performed. | DEFRA | ||||
Scope 3 | Emissions from the transportation of employees between their homes and their worksites in the reporting year (in vehicles not owned or operated by Signify), specifically automobile, bus and rail travel. A distance-based average method is applied to calculate emissions for this category, which is done by determining the percentage of employee commuting modes, the distances of each commuting mode, and then multiplied by the corresponding emission factors from DEFRA. The total number of employees (FTE) is collected internally from our HR systems and assured externally. The commuting activity data (percentage of employees per commuting mode and travelled distances) are based on assumptions from the EU, as accurate and detailed data is not consistently available due to, among others, privacy reasons. | DEFRA | ||||
Scope 3 | Emissions from direct use of energy-consuming products that are sold in the reporting year and consume energy (in our case, electricity) over their expected lifetime. This means for sold products that are not energy-consuming, i.e., components, accessories, and lighting controls, or products that consume close to zero energy (e.g., battery‑powered products) — Category 11 emissions are considered zero. The majority (more than 90%) of our value-chain emissions comes from product use. To quantify emissions from Category 11, the following calculation method is the:
Uncertainties and assumptions in the calculation of Category 11 emissions | IEA | ||||
Scope 3 | Emissions from waste disposal and treatment of products sold by the reporting company in the reporting year at the end of their life. A waste-type-specific method is applied to calculate emissions for this category, which is done by consolidating total mass data of sold products and packaging, their material compositions and the waste disposal or treatment methods, multiplied by the corresponding emissions factors primarily from EPA WARM tool, when not available, emission factors from Ecoinvent are used. The product end-of-life waste types include electrical and electronic waste, plastic waste, and glass; the waste disposal and treatment methods include recycling, incineration, and landfill. The mass of sold products and packaging data are collected, reported and validated internally. | EPA WARM |
Circular economy and resource use ESRS E5
Inflows
For our inflow data, we estimate the total weight of materials, the percentage and weight of secondary materials, the percentage and weight of biological materials and the percentage and weight of biological material that is sustainably sourced based on actual data in the purchasing system in combination with supplier declarations. The data relates to all products and materials under eight categories: aluminum – die casting, aluminum – others, glass, metal parts – steel, packaging – paper/cardboard, packaging – plastics, packaging – wood and plastics. The scoping was based on 2024 spend data with these groups representing 19% of total spend, this remained 19% of total spend in 2025. The data is aggregated based on all materials used to manufacture Signify products and services during the reporting period (i.e. bill of materials, systems & services, non-product related). We include the data from all purchased materials which is broader than materials entering manufacturing facilities.
The inflows data is an estimation based on data covering 58% of the spend. For the remaining 42%, we estimated the weight by extrapolating the weight characteristics per category. This was achieved by calculating the average kg/Euro ratio per commodity from the 58% of spend with available weight data. Because the available data reflects only the spend recorded in the internal procurement system, supplementary data from external entities is incorporated. Together, these sources provide a weight estimate covering 96% of total revenue. The remaining 4% is extrapolated to present a dataset representative of 100% of revenue.
With respect to the recycled content of the inflows, we collect a declaration on material content which includes information on virgin, biological, sustainably sourced and recycled content from key suppliers under each inflows category. The percentage of these metrics has been extrapolated to all materials in each respective category.
An exception was applied for the plastics commodity category. Metrics related to recycled content and bio‑based materials were derived from purchasing data, based on the assumption that all procured plastic resins are virgin materials unless explicitly identified as recycled or bio‑based.
Due to the complexity of the inflows’ data and due to the novelty of the data collection process, the reported figures are our best estimation based on the spend data available and our knowledge of the characteristics of the materials. We are investing in setting up additional controls and monitoring the improvements closely.
Biological material is defined as material that can be processed with aerobic (composting) or anaerobic (digestion) treatment of biodegradable waste under controlled conditions using microorganisms to produce, in the presence of oxygen, stabilized organic residues, carbon dioxide and water or, in the absence of oxygen, stabilized organic residues, methane, carbon dioxide and water.
Primary (virgin) material includes previously unused item and material which has never been processed into any form of end-use product. Secondary (recycled) material is defined as post-consumer content and post-consumer material (PCR) which is material generated by households or by commercial, industrial and institutional facilities in their role as end-users of the product which can no longer be used for its intended purpose. This includes returns of material from the distribution chain; material recovered from waste generated by households or by commercial, industrial and institutional facilities in their role as end-users of a finished product. It also includes post-industrial recycled content and pre-consumer material (PIR) which is material diverted from the waste stream during a manufacturing process. With the following excluded: reutilization of materials such as rework, regrind or scrap generated in a process and capable of being reclaimed within the same process that generated it. Material which is not reclaimed and reutilized within the same process that generated it, and which undergoes material preparation is counted as pre-consumer material.
The durability is presented per the following products groups: Professional outdoor LED, Professional indoor LED, Consumer products, OEM products and conventional products. The durability of products is measured in terms of lifetime in hours. Used data on lifetime originates from two main sources; (1) EPD data and (2) Scope 3 data. For the latter, data used to calculate category 3.11 Use of sold products is also relevant to this topic. The two sources are both acknowledged to ensure a maximum completeness in data. Where data is available from both sources, the maximum lifetime is chosen. At the end, lifetime data is multiplied by corresponding sales data to generate a weighted average of the lifetime of our products (instead of counting every product/EPD equally).
Regarding the EPDs, the data is based on the EPDs available by the end of Q3 2025 and covers 13,049 products. By using the EPD as the source of the durability data, we use the assumptions that the lifetime provided in EPD covers the family of products included in the Declaration.
The ‘over time’ performance specifications of our LED based luminaires are calculated using the IEC lifetime metric for LED based lighting products and in accordance with the Lighting Europe guidance paper on “Evaluating performance of LED based luminaires”. Over time life claims are specified at a performance ambient temperature T of 25ºC.
For indoor LED based products, we expect IEC-compliant quality criteria linked with lumen maintenance at median useful life. For average LED indoor products at minimum 50,000 hours (in case of Industry products in addition also at 100,000 hours, e.g. high bay of Philips GentleSpace gen4).
For outdoor LED based luminaires, we expect IEC-compliant quality criteria linked with lumen maintenance at median useful life. For average LED outdoor products at minimum 88,000 hours.
According to LightingEurope our industry reference, for products used in the majority of indoor applications the average installation life (service lifetime) will not exceed 50,000 hours. And for products used in the majority of outdoor applications the average installation life will not exceed 100,000 hours.
The recyclable content data of our products comes from the EPD under secondary materials analyzed within the entire product life cycle, from the procurement of components until product end-of-life. We present this data per the following product groups: Professional outdoor LED, Professional indoor LED, Consumer products, OEM products and Conventional products. In addition to providing the average percentage per product group, we collect the minimum and maximum percentage to represent the full range of what our products contain.
The data is based on the EPDs available by the end of Q3 2025 and cover 13,049 products.
For our 2025 data, we relied on the secondary materials data from our EPD and assume that the secondary materials we use in our product are recyclable. The recyclability of our products components varies based on factors like the type of material, contamination levels, and local recycling capabilities. Our assumption is applicable to specific commodities for which materials can be recycled multiple times (metal, paper, glass). Other materials that are not recyclable were not accounted for in the percentage disclosed for secondary materials (cables, e-components, finished products).
Secondary materials are defined as material recovered from previous use or from waste which substitutes primary materials. It covers the total percentage of recovered material in a product.
This metric is the percentage of a products' packaging materials that can be recycled (raw material stage). The main commodities per volume (total weight) are; namely paper and cardboard (89%), plastic (2%) and wood (6%). All other commodities are not reported, as they are assumed to contain zero recyclable content. The definition for recyclable content for packaging is the same as the definition provided for recyclable content of our products.
Our calculations are based on the weight of each packaging type, recorded in metric tonnes and based on supplier declarations. In total, 21 different suppliers of packaging material declared the recyclability of their most supplied products. This was then used to calculate a weighted average for recyclable content of packaging based on spend per supplier. The weight of secondary packaging material is then calculated by multiplying the weight of the packaging type by the percentage of secondary material.
The assumptions used for this metric are the same as those we relied on for our inflow data as they are both based on the same dataset. More detail is available in the inflows section above.
The waste management data covers all factory and warehouse operations. In factories, waste primarily arises from production activities, resulting in waste streams due to line rejects, human errors, quality and safety testing, and cutting waste. In warehouses, waste is mainly generated through the unpacking of inbound shipment materials, repacking of products and expiration of stock. A smaller proportion of total waste is attributable to employee‑related activities, such as canteen and office waste. The composition of waste in Signify includes the following waste categories: Cantine waste, Chemical waste, Demolition scrap, Electrical and electronic waste, General waste, Glass (line rejects), Metal scrap, Obsolete finished goods, Office waste, Paper/cardboard waste, Plastic waste, Wood waste and Other waste. There are 3 waste disposal pathways tracked: delivered for recycling, landfill and incinerated. Furthermore, both hazardous and non-hazardous waste are tracked separately.
Re-use options and other recovery operations for hazardous or non-hazardous waste types are not currently tracked.
Our calculation approach includes estimation for the December 2025 data, where actual data from December 2024 has been used. It also includes estimation for 4 manufacturing sites for which waste data was not recorded for all quarters. Two of these sites were estimated based on Signify average production data, one of these sites was estimated based on site average production data recorded over previous quarters, and one of these sites was estimated based on actual production data.
Other estimations were done to include data from sites that have not reported data yet as they are newly added within scope. For factories, data is extrapolated to these sites based on waste generated per average Signify factory. For warehouses, data was extrapolated based on waste generated per square meter of warehouse.
Lastly, some data was declared which was missing a disposal route. To include this data the disposal route was assigned based on the average distribution. For warehouses it was assumed that no hazardous waste is generated, as none has been declared.
The waste data reported in 2024 reflected waste generated at manufacturing sites only and did not include warehouse‑related waste streams. In 2024 at the time of reporting, warehouse waste data was not yet being collected, as the data collection process for these waste streams was developed during 2025.
During the 2025 calculation process, the feasibility of revising the 2024 waste figures was assessed. To ensure comparability and representativeness of data, a revision to the 2024 waste data was made. Based on collection warehouse waste data in 2025, estimations have been made for 2024. The number of reported warehouses remains nearly the same, with only one additional warehouse opened in 2025, which is therefore not relevant for reporting in 2024.
The amount of waste sent to landfill is calculated on a quarterly basis and includes waste from all manufacturing locations. To achieve “zero (manufacturing) waste to landfill”, the amount of non-hazardous manufacturing waste being disposed directly to landfill should be <1% of total waste. Our management approach relates to the waste hierarchy principles of recycling and disposal through incineration.
Revenues coming from our circular portfolio meaning lighting products, systems and services that maximize (re)usability, serviceability, and upgradability and minimize value destruction with the aims to preserve value and avoid waste to landfill. Lighting solutions contributing to this definition include:
Serviceable luminaires: luminaire with easily replaceable (using standard, widely accessible tools) driver and controls and LED board to facilitate lifetime prolongation, or designed as circular economy ready luminaires requiring an EPD;
Circular components: replaceable and recyclable LED and conventional drivers and modules, most sensors supporting system functionality, 3D printed housings;
Intelligent assets: lifetime monitoring and preventive maintenance scheduling;
Circular services: services to prolong luminaire lifetimes and managed services with end of contract return options.
The revenues generated from lighting products systems and services falling under the definition above are accounted for and measured against the total annual revenues.
Product tagging is done manually and relies on internally generated data at the inception of a new sustainable product (at the design phase), which may introduce potential uncertainties concerning possible future product changes. This includes a group of legacy products from prior systems, for which limited documentation is available. These products continue to be included in sustainable revenues, assuming they still meet the criteria for sustainable revenues. During the tagging process, reference products are used for each product family, which inherently assumes the reference product is representative for all products within that family.
The data stems from internal documentation based on product attributes and is a manual process, which may lead to inherent uncertainties within the calculation.
Own workforce ESRS S1
The total number of people in the workforce includes all newly acquired companies, temporary workers and contingent workers but excludes interns. Estimates are used for companies that are not fully integrated (CNFI).
The total number of employees includes all newly acquired companies and temporary workers but excludes interns. Unless stated otherwise, social data excludes contingent workers. Where actual data isn't available, we estimate the remaining population to provide a comprehensive total. This method applies mostly to CNFI. Employees can be expressed in headcount and sometimes in Full Time Equivalent (FTE).
Companies Not Fully Integrated refer to entities within Signify’s scope, such as newly acquired companies, manufacturing branches, or other operations, that are not yet fully incorporated into Signify’s governance, processes, or information systems at the reporting date. As a result, data availability, completeness, or alignment with Signify’s methodologies may be limited. For age, gender and new hires, it is assumed that they follow the same distribution as for the rest of the employee population.
The Employee Team survey is performed on a quarterly basis and is calculated through a weighted average for the whole year using the respondents and results. It includes employees with access to a company email address, except contingent workers. The Net Promoter Score methodology is used to measure employee engagement. Employees are asked to rank how likely it is that they would recommend our company as a great place to work in the Employee Team survey. The scoring for this answer is based on a 0 to 10 scale. Those who respond with a score of 9 or 10 are promoters, those who respond with a score of 0 to 6 are detractors. Responses of 7 or 8 are labeled passives. The NPS is calculated by subtracting the percentage of employees who are detractors from the percentage of employees who are promoters.
Health & Safety data is reported by sites with more than 50 FTEs, while sites with fewer than 50 FTEs report this data on a voluntary basis. For the population not covered by our centralized platform, we assume that their inclusion would not materially affect the overall results. This assumption is based on the nature of these sites being mostly offices, which typically present a significantly lower risk of workplace incidents compared to manufacturing sites. Health & Safety data is reported and validated monthly. The focus of reporting is on work-related injuries and illnesses that predominantly occur in industrial operations and lead to a recordable injury or illness case. Recordable cases include all injuries and illnesses sustained at work that result in medical treatment, restricted work, lost workdays, or fatality. All recordable cases and related KPIs are reported for permanent staff and temporary workers, including outsourced workforce and interns. The TRC and LWC rates exclude contractor cases on Signify or project sites. The fatality cases reported include contractor cases on Signify or project sites. Severe cases cover fatalities, in-patient hospitalization of at least 24 hours for treatment purposes, permanent injury or incapacity and bone fracture.
Number of injuries and illnesses sustained during work that result in medical treatment, restricted work, lost workdays, or fatality, per 100 FTEs.
Calculated using the same methodology as the Total Recordable Case Rate but based on 500 FTEs and without the illness cases, in accordance with CSRD reporting standards.
Signify defines a living wage as the gross monthly wage needed to cover the necessary living costs of an individual or a family. It is calculated as the gross income necessary to afford these expenditures. For all countries examined (Poland, Mexico, Netherlands, China, USA, and India, which represents 74% of the workforce), Signify used WageIndicator’s database (date: Q2 2025) to set its baseline. WageIndicator’s database offers different variations of family model (individual, with or without child, national fertility rate) and employment rates (full-time, part-time, national employment rate). To perform its analysis, Signify selected the “Standard family” Living Wage as we believe it reflects better the average family composition across our countries of operation, maintains a stable method of comparison, and is the WageIndicator recommended family variation. The Standard Family Living Wage indicates a gross monthly income range for a full-time equivalent worker at which the total earned family income is sufficient to cover necessary costs. The standard family includes two adults and two children (family 2+2) and the family employment rate is 1.8, which means one adult is a full-time worker and the second adult has a working week of 80% (4 days a week). Signify uses the lower range of the Standard family model for its analysis. The reason for the WageIndicator database selection was the extensive coverage of countries, the sample-method, and the research institutes involved with their study, including Harvard Law School and the University of Amsterdam. Signify does not independently validate data from WageIndicator, thereby causing an inherent uncertainty regarding the accuracy of the data. Statements on living wage pertain to all employee types in all pay grades, including temporary employees, but excludes interns, international assignees, casual, remote and homeworkers and CNFI.
The reported average number of training hours is derived from actual time logged in company online training platforms (Workday Learning and Learning@Signify) by employees with access to a Signify email address. For employees who undergo training exclusively through offline methods, available records (e.g. mandatory training requirements and standard local training programs) indicate that their annual training time is comparable to or greater than that of employees included in the calculation. Accordingly, it is assumed that their average training hours is not lower than the reported average.
The process applies to regular employees with access to a Signify email address, for whom career development and performance reviews are conducted and recorded through Workday. For the remaining employee population, career development and performance reviews may take place through offline processes, which do not allow for systematic tracking and reporting. As a result, the “population taking part in career development and performance reviews” datapoint is calculated as the proportion of employees who completed at least one quarterly check-in during the reporting period, relative to the employee headcount as defined in ESRS S1‑6.
The women in leadership KPI is the percentage of women as a percentage of the total population in grades H22 and above (including Board of Management). It includes employees with or without a defined end date and international assignees who are in Workday. The source of data is Workday. It excludes: employees on long-term leave; contingent workers; newly acquired companies, companies not in Workday and companies not yet integrated into the Signify operating model and therefore cannot be considered for KPIs due to missing data points; employees not in the FTE count (e.g., interns) and factory and warehouse workers are excluded as there are no leadership roles in these groups.
The unadjusted pay gap is calculated as the difference between the average base salary of men and women, expressed as a percentage of men's base salary, with the following formula: (1 -women's average base salary/men's average base salary) x 100%. The base salary data used to calculate the unadjusted pay gap includes all active employees as of December 31, 2025, and excludes international assignees and employees on long-term leave. For CNFI for which salary data was not available, it is assumed that their inclusion would not have a material impact on the outcome. This assumption is based on the fact that a significant share of this population is compensated at standardized set rates, limiting variation between individuals and across genders. All calculations are performed using the Syndio tool.
The total remuneration ratio reported is calculated as the ratio between the gross base annual salary received by the highest paid individual and the median employee gross base annual salary (of the whole employees’ population, excluding the highest paid individual). These figures are annualized for individuals who did not spend the full reported year at Signify. Interns and employees on long-term leave are excluded from this calculation. Our calculation method deviates from the ESRS‑prescribed definition that requires inclusion of base salary, variable remuneration and benefits components.
Workers in the value chain ESRS S2
The supplier sustainability performance rate is defined as the percentage of all active risk suppliers that have had an audit score of at least 90 out of 100 points in the defined timeframe (yearly or every three years based on maturity level). Suppliers are considered compliant either by passing the audit, resolving identified non-conformities (or are expected to do so within six months), or submitting other social compliance certifications.
Supplier Sustainability Audits are based on the standards defined by the Responsible Business Alliance (RBA). RBA is the world's largest industry coalition dedicated to responsible business conduct in global supply chains. Signify is a member of this coalition. The RBA publishes a Code of Conduct, providing internally recognized standards for Labor, Health and Safety, the Environment, and Business Ethics. An external body executes the on-site audits at risk suppliers, assessing the compliance level on these RBA standards. The RBA audit score is based on the number of findings and their criticality (minor, major, critical or zero-tolerance). An overall audit result of less than 90 out of 100 points means a failure and will require a corrective action plan to address the non-conformities. The score per RBA topic is calculated as the percentage of questions within the respective topic with audit result “compliant” (meaning, no non-conformities found).
Governance ESRS G1
Signify’s functions at risk with respect to corruption and bribery include departments such as Brand, Communications & Digital, Corporate Security, Finance, General Management, Human Resources, Intellectual Property, Information Technology, Legal, Marketing, Public Affairs and Government Relations, Procurement, Quality, Regulatory and Compliance, Research & Development, Sales, Supply Chain Management, Service, Strategy, and Sustainability.
Supporting metrics
Revenues coming from our portfolio which benefit society focusing on three main sustainable growth areas:
Food availability: lighting designed to enable the production of more and better-quality food, while optimizing the use of land, water and energy and avoiding pesticides. It includes all dedicated horticulture products and systems, all dedicated urban farming products and systems, all dedicated marine-based and land-based aquaculture products and systems, all dedicated animal farming products and systems;
Safety & security: lighting designed to have a positive effect in reducing crimes such as burglary and theft in cities and houses, as well as increasing safety in traffic and protection against cybercrime and fraud. It includes Interact solution for cities, System solutions for tunnels, outdoor lighting equipped with special sensors, emergency lighting and LiFi systems, black light blue lamps and luminaries;
Health & well-being: lighting designed to support health, well-being and performance of humans through unlocking the visual, biological and emotional benefits of light, and lighting designed to support well-being for wildlife. It includes EyeComfort, lighting for well-being, tunable products during use phase, noninvasive health supporting products and disinfection. Signify's portfolio of products contributing to Brighter lives revenues continues to grow as we drive sustainable innovations across these three focal areas.
The revenues generated from lighting products systems and services falling under the definition above are accounted for and measured against the total annual revenues.
Product tagging is done manually and relies on internally generated data at the inception of a new sustainable product (at the design phase), which may introduce potential uncertainties concerning possible future product changes. This includes a group of legacy products from prior systems, for which limited documentation is available. These products continue to be included in Brighter lives revenues, assuming they still meet the criteria for Brighter lives. During the tagging process, reference products are used for each product family, which inherently assumes the reference product is representative for all products within that family.
The data stems from internal documentation based on product attributes and is a manual process, which may lead to inherent uncertainties within the calculation
In our Brighter Lives, Better World 2025 sustainability program, we commit to doubling the pace of the Paris Agreement's 1.5°C scenario to reduce emissions over our entire value chain by the end of 2025, comparing to the 2019 baseline. This means we aim to achieve the emission reduction goals laid out in the Paris Agreement's 1.5°C scenario for 2031 by 2025, six years early. With this scenario, the Paris Agreement suggests that companies must reduce their emissions by 4.2% year on year. In other words, by the end of 2025, we will reduce our Scopes 1, 2, and 3 emissions by 40% compared to our baseline year 2019. To track progress, we are comparing Signify actual carbon footprint and that required by the Paris Agreement’s 1.5ºC scenario every year from 2021 to 2025.
This table outlines comparative figures for 2024 data, where revisions have been incorporated to ensure consistency with the CSRD Sustainability Statement and to reflect refinements in data methodology. Further information regarding the approach to revisions has been provided in the corresponding reporting principle.
GHG Emissions and intensity in tonnes-CO2e (E1-6) | 2024 | Revision 2024 | (+/-) |
|---|---|---|---|
Category 11: Use of sold products | 162,886,237 | 169,651,064 | 6,764,827 |
Scope 3 total | 163,807,965 | 170,498,561 | 6,690,596 |
Scope 1+2+3 total (market based) | 163,893,547 | 170,584,143 | 6,690,596 |
Scope 1+2+3 total (location based) | 164,012,300 | 170,702,896 | 6,690,596 |
GHG emissions intensity (market-based) (tonnes-CO2e/million euro) | 26,680 | 27,769 | 1,089 |
GHG emissions intensity (location-based) (tonnes-CO2e/million euro) | 26,699 | 27,788 | 1,089 |
Inflows (E5-4) | |||
Total weight of all materials (metric tonnes) | 409,714 | 280,055 | -129,659 |
% of biological materials | 0.01% | 12% | 11.99% |
Weight of secondary materials (metric tonnes) | 103,583 | 52,904 | -50,679 |
% of secondary materials | 25% | 19% | -6.00% |
Outflows (E5-5) | |||
Average durability (service lifetime) of our products in hours | |||
Outdoor professional LED based products | 63,940 | 90,525 | 26,585 |
Indoor professional LED based products | 58,150 | 66,079 | 7,929 |
Consumer products | 32,940 | 20,393 | -12,547 |
OEM products (indoor and outdoor) | 56,560 | 36,000 | -20,560 |
Conventional products | 19,200 | 19,200 | - |
Recyclable content % in products | |||
Professional LED based products | 68% | 42% | -26% |
Consumer products | 45% | 46% | 1% |
OEM products (indoor and outdoor) | 28% | 58% | 30% |
Conventional | 42% | 41% | -1% |
Recyclable content % in packaging | |||
Recyclable content – All selected products packaging | 68% | 98% | 30% |
Paper/cardboard | 87% | 99% | 12% |
Plastic | 13% | 61% | 48% |
Manufacturing waste in metric tonnes | |||
Total waste generated | 35,817 | 38,626 | 2,809 |
Non-hazardous waste diverted from disposal | 31,538 | 34,128 | 2,590 |
Non-hazardous waste diverted from disposal due to recycling | 31,538 | 34,128 | 2,590 |
Non-hazardous waste directed to disposal | 2,613 | 2,832 | 219 |
Non-hazardous waste directed to disposal by incineration | 2,410 | 2,599 | 189 |
Non-hazardous waste directed to disposal by landfilling | 208 | 238 | 30 |
Non-recycled waste | 3,724 | 3,943 | 219 |
5.6 Disclosure requirements and incorporation by reference
The following tables can be used to navigate to information relating to a specific disclosure requirement within this report. For disclosures in sections outside the sustainability statements, incorporation by reference [Inc. by ref.] was used. The table below includes all of the data points that derive from other EU legislation as listed in ESRS 2 appendix B. It indicates where the material data points can be found in our report and which data points are assessed as "material" or "voluntary". The table does not include the list of the minimum disclosures requirements applied to all our material policies, action plans, targets and metrics, as well as, the disclosures that are not applicable (conditional, voluntary and phased-in not disclosed). |
ID code | Name | Materiality and applicability | Page | GRI | SFDR | Pillar 3 | EU Climate law | Benchmark regulation |
|---|---|---|---|---|---|---|---|---|
ESRS2 | ||||||||
BP-1 | General basis for preparation of sustainability statements | Material | 29 | |||||
BP-2 | Disclosures in relation to specific circumstances | Material | 29 | X | ||||
GOV-1 | The role of the administrative, management and supervisory bodies | Material | 30-31, 114, 116, 121, 122 | X | X | |||
GOV-2 | Information provided to and sustainability matters addressed by governing bodies | Material | 30-31, 118 | |||||
GOV-3 | Integration of sustainability-related performance in incentive schemes | Material | 31 | X | ||||
GOV-4 | Statement on due diligence | Material | 31 | X | ||||
GOV-5 | Risk management and internal controls over sustainability reporting | Material | 29 | |||||
SBM-1 | Strategy, business model and value chain | Material | 32 | X | ||||
SBM-2 | Interests and views of stakeholders | Material | 35 | X | ||||
SBM-3 | Material IRO and their interaction with strategy and business model | Material | 37-41 | X | ||||
IRO-1 | Description of the processes to identify and assess material IRO | Material | 36 | X | ||||
IRO-2 | Disclosure requirements in ESRS covered by the sustainability statement | Material | 105-106 | |||||
ESRS E1 | ||||||||
E1 GOV-3 | Integration of sustainability-related performance in incentive schemes | Material | 42, 135 | X | ||||
E1-1 | Transition plan for climate change mitigation | Material | 44 | X | X | X | ||
E1 SBM3 | Material IRO and their interaction with strategy and business model | Material | 42 | |||||
E1 IRO-1 | Description of the processes to identify and assess material climate-related IRO | Material | 53 | |||||
E1-2 | Policies related to climate change mitigation and adaptation | Material | 42-43 | X | ||||
E1-3 | Actions and resources in relation to climate change policies | Material | 45 | X | ||||
E1-4 | Targets related to climate change mitigation and adaptation | Material | 44 | X | X | X | X | |
E1-5 | Energy consumption and mix | Material | 48 | X | X | |||
E1-6 | Gross Scopes 1, 2, 3 and Total GHG emissions | Material | 52 | X | X | X | X | |
E1-8 | Internal carbon pricing | Material | 45 | |||||
Internal metric | Brighter Lives, Better World 2025 target - Cumulative carbon reduction over value chain in million tonnes CO2e | Voluntary | 44 | |||||
ESRS E5 | ||||||||
E5 IRO-1 | Description of the processes to identify and assess material circular economy-related IRO | Material | 59 | |||||
E5-1 | Policies related to resource use and circular economy | Material | 60 | |||||
E5-2 | Actions and resources related to resource use and circular economy | Material | 61 | |||||
E5-3 | Targets related to resource use and circular economy | Material | 61 | |||||
E5-4 | Resource inflows | Material | 62 | X | ||||
E5-5 | Resource outflows | Material | 63-65 | X | X | |||
ESD | Brighter Lives, Better World 2025 target - Circular revenues | Material | 61 | |||||
ESRS S1 | ||||||||
S1 SBM3 | Material IRO and their interaction with strategy and business model | Material | 73 | X | X | |||
S1-1 | Policies related to own workforce | Material | 74 | X | X | |||
S1-2 | Processes for engaging with workers and representatives about impacts | Material | 73 | X | ||||
S1-3 | Processes to remediate negative impacts and channels to raise concerns | Material | 75 | X | X | |||
S1-4 | Taking action on material impacts, and approaches to mitigating risks and pursuing opportunities | Material | 75 | X | ||||
S1-5 | Targets related to managing material IRO | Material | 73 | X | ||||
S1-6 | Characteristics of the undertaking’s employees | Material | 76 | X | ||||
S1-9 | Diversity metrics | Material | 81 | X | ||||
S1-13 | Training and skills development metrics | Material | 80 | X | ||||
S1-14 | Health and safety metrics | Material | 79 | X | ||||
S1-16 | Compensation metrics (pay gap and total compensation) | Material | 83 | X | X | X | ||
S1-17 | Incidents, complaints and severe human rights impacts | Material | 75 | X | X | X | ||
ESRS S2 | ||||||||
S2 SBM3 | Material IRO and their interaction with strategy and business model | Material | 84 | X | X | |||
S2-1 | Policies related to value chain workers | Material | 84 | X | X | |||
S2-2 | Processes for engaging with value chain workers about impacts | Material | 86 | X | ||||
S2-3 | Processes to remediate negative impacts and channels to raise concerns | Material | 84, 89 | X | ||||
S2-4 | Taking action on material impacts, and approaches to mitigating risks and pursuing opportunities | Material | 86-87 | X | X | |||
S2-5 | Targets related to managing IRO | Material | 86-87 | |||||
ESD | Supplier sustainability performance rate | Material | 88 | |||||
ESRS G1 | ||||||||
G1 GOV-1 | The role of the administrative, supervisory and management bodies | Material | 91 | X | ||||
G1-1 | Corporate culture and business conduct policies and corporate culture | Material | 91 | X | ||||
G1-2 | Management of relationships with suppliers | Voluntary | 93 | X | ||||
G1-3 | Prevention and detection of corruption and bribery | Material | 92 | X | ||||
G1-4 | Confirmed incidents of corruption or bribery | Material | 93 | X | X | |||
G1-5 | Political influence and lobbying activities | Material | 94 | X | ||||
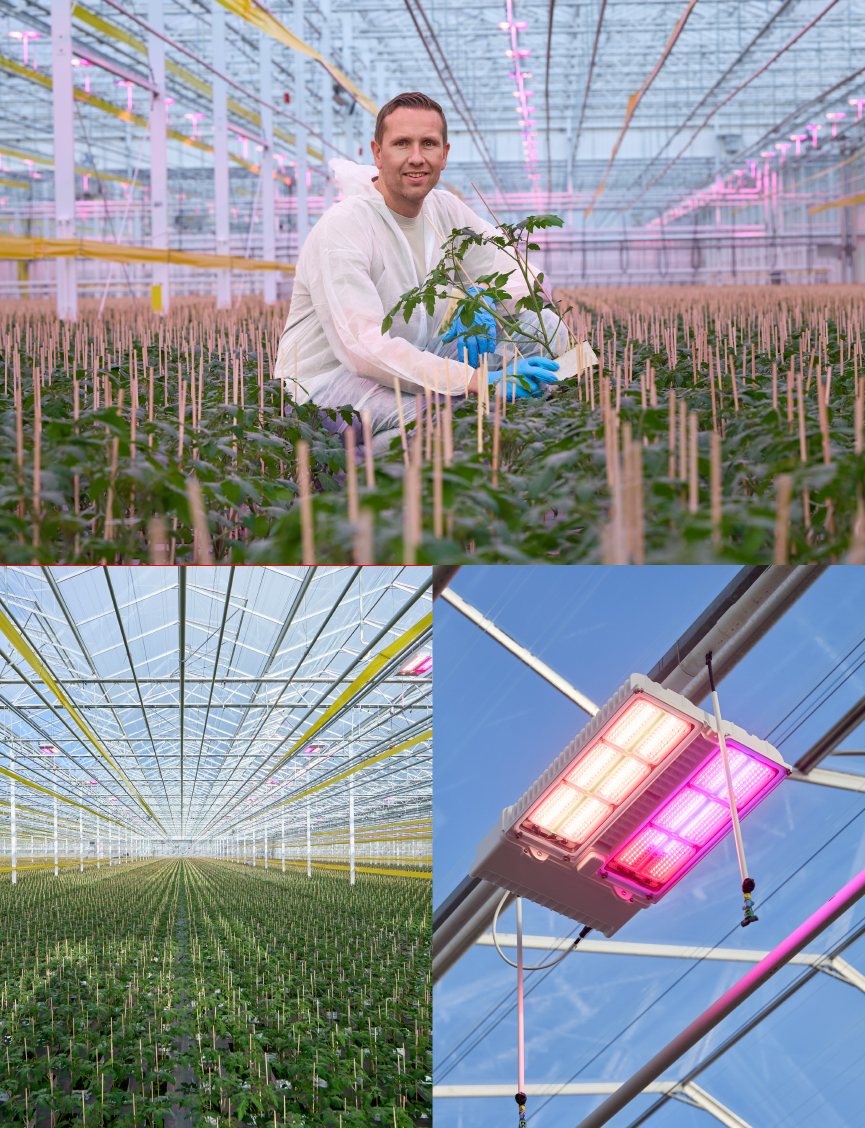
Vreugdenhil-Klugt is a specialist producer of young ornamental and vegetable plants for growers. Operating across six cultivation sites in the Netherlands, the business supplies customers who depend on uniform, robust plants that perform reliably after planting. Achieving that consistency year-round has long been a challenge, particularly during winter months when there is limited natural light.
To address this, Vreugdenhil-Klugt upgraded its lighting infrastructure across 45 hectares, replacing high-pressure sodium installations while remaining fully in production. The scale of the transition required careful planning and close coordination to protect delicate ongoing cultivation cycles.
The company adopted Philips GreenPower LED toplighting force combined with the GrowWise control system. The LED luminaires provide a four-channel spectrum, enabling precise adjustment of red, blue, green and far-red light. This allows growers to steer plant development at each growth stage and to tailor lighting strategies to different crops and zones within the greenhouse.
Precise control
Integration with the existing climate computer was a critical requirement. By linking lighting control to climate management, Vreugdenhil-Klugt can automatically manage light intensity and timing in response to conditions, while optimizing overall energy use. A library of light recipes supports consistent outcomes across sites and seasons.
With Philips GreenPower and GrowWise, Vreugdenhil-Klugt has strengthened its ability to meet customer demand, maintain consistent production, and prepare young plants that are ready to perform once they reach the grower.
“Winter production has always been difficult because of low light. Now we can grow plants that are just as strong as in summer. The ability to fine-tune red, blue, green, and far-red light percentages gives us complete control over how plants grow at every growth stage, and it’s been transformative for our operations.”
John Potters, Head of Vegetable Division, Vreugdenhil-Klugt

As more of India’s consumers adopt smart home technologies, they can now extend their experience into a new category: air circulation. EcoLink, Signify’s value-focused consumer brand in India, responded by expanding into BLDC ceiling fans, building on its strong presence in lighting and the trust it has earned with consumers. In 2025, EcoLink introduced four ceiling fan models: AiroElevate, AiroQuad, AiroGeometry, and AiroJewel. Two models are also available in smart variants powered by WiZ, allowing people to integrate air circulation into their connected home ecosystems. The portfolio was shaped by extensive consumer research to directly understand and address customer needs and pain points.
Research showed that design was a clear differentiator. Each model features a distinct visual identity, from the hollow hub of AiroElevate and the square geometry of AiroQuad, to the triangular shape of AiroGeometry and the diamond-like finish of AiroJewel. A curated palette of color options blends naturally into contemporary interiors, positioning the fans as design elements rather than purely functional appliances.
Precise control
All four models deliver superior performance, with a high speed of 370 RPM and air delivery of 230 CMM, placing them among the strongest performers in the category. Powered by BLDC technology, the fans consume just 35W, around 50% less than conventional induction fans. This translates into meaningful electricity savings for households throughout the year.
For ease of use, a point-anywhere RF remote allows people to operate the fan from anywhere in the room without line-of-sight limitations. Select models feature adjustable mounting options that simplify installation in homes with false ceilings, preserving both product appearance and ceiling finish. Together, the portfolio shows how fresh thinking and market-focused innovation can unlock new growth opportunities by keeping consumers at the center of design decisions.
6 Three-year overview
2023 | 2024 | 2025 | |
|---|---|---|---|
Income statement | |||
Sales | 6,704 | 6,143 | 5,765 |
Comparable sales growth1 | (8.3)% | (6.6)% | (3.4)% |
Nominal sales growth | (10.8)% | (8.4)% | (6.2)% |
Sales of LED-based products (as % of sales) | 85% | 90% | 91% |
Gross margin | 2,558 | 2,442 | 2,271 |
as a % of sales | 38.2% | 39.7% | 39.4% |
Income from operations (or EBIT) | 369 | 477 | 383 |
Net income (loss) | 215 | 334 | 259 |
Adjusted EBITA1 | 670 | 606 | 511 |
as a % of sales | 10.0% | 9.9% | 8.9% |
EBITA1 | 449 | 543 | 439 |
Net income (loss) attributable to shareholders | 203 | 328 | 254 |
Earnings per share in EUR | 1.61 | 2.60 | 2.06 |
Dividend per share in EUR2 | 1.55 | 1.56 | 1.57 |
Balance sheet | |||
Total assets | 8,004 | 7,505 | 6,720 |
Shareholders' equity | 2,817 | 3,162 | 2,673 |
Net debt1 | 1,071 | 920 | 957 |
Working capital1 | 461 | 422 | 329 |
Investments and cash flow | |||
Cash flow from operating activities | 696 | 514 | 531 |
Net Capital expenditure | (110) | (77) | (91) |
Free Cash Flow1 | 586 | 438 | 440 |
- For a reconciliation to the most directly comparable IFRS financial measure, see chapter 18, Reconciliation of non-IFRS financial measures.
- 2025 Dividend subject to approval by the 2026 Annual General Meeting of Shareholders.
2023 | 2024 | 2025 | |
|---|---|---|---|
Sustainable innovation, as a % of adjusted research & development spend | 88% | 95% | 96% |
Brighter Lives revenues, as a % of total sales | 31% | 33% | 35% |
Women in leadership, as a % of total leadership roles | 29% | 28% | 27% |
Employee Net Promoter Score | 26 | 29 | 39 |
Total recordable cases, per 100 FTEs | 0.19 | 0.17 | 0.12 |
Lost workday injuries, per 100 FTEs | 0.12 | 0.09 | 0.08 |
Fatalities | - | 1 | - |
Initial and continual supplier conformance audits, number of audits | 157 | 228 | 245 |
Supplier sustainability performance | 97% | 96% | 97% |
Lives lit, cumulative since 2017 (in million) | 9.4 | 10.5 | 14.8 |
Cumulative carbon reduction over value chain, in million tonnes CO2e1 | 334 | 4982 | 655 |
GHG emissions over value chain, in tonnes CO2e | 192,820,972 | 170,584,1432 | 164,975,579 |
GHG emissions intensity, in tonnes CO2e per million euro sales per year | 28,771 | 27,7692 | 28,607 |
Operational energy consumption, in terajoules | 3,237 | 2,288 | 1,946 |
Operational energy intensity, in terajoules per million euro sales | 0.49 | 0.37 | 0.34 |
Renewable electricity, as a % of total electricity usage | 100% | 100% | 100% |
Circular revenues, as a % of total sales | 33% | 35% | 37% |
Total waste to landfill, in scope of commitment | <1% | <1% | <1% |
ISO 14001 certification, as a % of all reporting | 87% | 95% | 93% |
ISO 45001 certification, as a % of all reporting | 83% | 90% | 93% |
- The cumulative yearly difference between the GHG emissions of Paris Agreement 1.5°C pathway and the actual value chain
emissions of Signify from 2022, 2023, 2024 and 2025. - 2024 figure has been corrected due to a revision of 2025 product data.

VDL ETG Singapore is part of the Dutch VDL Groep, specialized in the design, development, and manufacture of complex, high-tech components and systems for the semiconductor industry. To support growing demand, the company has expanded its footprint with a state-of-the-art new facility designed to raise standards for sustainability and performance. To meet these goals, Signify deployed Interact across more than 1,500 connected luminaires spanning three warehouse floors and four office levels. This seamless, integrated lighting ecosystem enables centralized control, real-time monitoring of energy use, and preventive maintenance planning across the site. Wireless architecture allowed for rapid installation and commissioning, reducing cabling costs and environmental impact. The system delivers energy savings through intelligent features like daylight harvesting and occupancy-based lighting, ensuring light is used only where and when it is needed. The facility is expected to achieve energy savings of around 50% compared to a non-connected LED solution, directly lowering operational costs and supporting VDL ETG’s sustainability objectives. Beyond energy efficiency, Interact enhances daily operations. Improved visibility supports safety and productivity on the production floor, while remote monitoring reduces manual site inspections and enables faster interventions. The solution aligns with Singapore Green Plan 2030 ambitions and GreenMark requirements, and its scalable platform allows for more buildings to be onboarded over time.
“Signify’s on-demand lighting approach has allowed us to cut lighting expenses by half compared to standard options, significantly reducing energy use and CO2 emissions. Moreover, it has helped us reduce the amount of menial actions and run preventive maintenance programs for lighting control, bringing an attractive business case for our total cost of ownership. Feedback from our team has been overwhelmingly positive and we’re excited about how scalable this solution is for our future expansions.”
Joshua Leong, Manager, Facility Management, VDL ETG Singapore

Recognized for its leadership in sustainability and urban innovation, the City of Gothenburg in Sweden has upgraded its public lighting with connected solutions from Signify.
Since 2018, the City of Gothenburg has installed more than 38,000 connected light points across its public lighting network. With Signify Interact, city managers can adjust luminaire brightness in real time, detect faults remotely, and optimize daily operations. The new system is expected to achieve up to 80% energy savings and cut operating costs in half.
An intelligent portfolio
Gothenburg has deployed a range of connected lighting technologies, including the Philips Outdoor MultiSensor, which provides light on demand when people are present.
Tests are being carried out with Tunable White technology, which allows the color temperature of the light to be adapted to specific locations, times of day, and use cases. This allows for brighter, cooler light for early-morning cleaning and maintenance, and warmer, more relaxed lighting in the evening.
In parallel, the city has undertaken the renovation of 300 existing luminaires to meet new specifications, extending asset life and reducing waste.
Gothenburg is one of three European cities participating in trials of a new connected lighting architecture from Signify that brings together technology, environmental performance, and societal benefits.
“We see lighting as part of the city’s intelligence. By connecting and controlling every light point, we gain a tool that allows us to work both more efficiently and more sustainably. It’s not just about saving energy, but about creating a safe, pleasant and future-proof environment for the people of Gothenburg.”
Lars Ocklund, Lighting Planning Manager, Urban Environment Administration, City of Gothenburg
Governance
7 Board of Management
Signify N.V.'s Board of Management is entrusted with the management of the company.
The Board of Management is responsible for the deployment of the company’s strategy and the achievement of the operational and financial objectives of the company, and is chaired by the Chief Executive Officer.
The Board of Management is accountable for its actions and decisions to the Supervisory Board and is answerable to shareholders of the company at the Annual General Meeting of Shareholders. The Rules of Procedure of the Board of Management are published on the company’s website.
The Board of Management currently consists of two members (executives): As Tempelman (CEO) and Željko Kosanović (CFO). [GOV-1_01] Harshavardhan Chitale was a member of the Board of Management throughout 2025.
As announced earlier, he stepped down from the Board of Management on December 31, 2025.
Biographies of the members of the Board of Management are maintained on the company's website.
A full description of the company’s corporate governance structure is published in chapter 11, Corporate Governance.
8 Supervisory Board
The Supervisory Board, in the two-tier structure under Dutch law, is a separate corporate body that is independent of the Board of Management. The Supervisory Board supervises the policies, management and general affairs of Signify. It also provides advice to the Board of Management.
The Rules of Procedure of the Supervisory Board are published on the company’s website. For details on the activities of the Supervisory Board in 2025 see chapter 9, Supervisory Board report, and chapter 10, Remuneration report.
The Supervisory Board currently consists of six members (non-executives). [GOV-1_02]
A skills and expertise matrix of the members of the Supervisory Board is included in chapter 11, Corporate governance [GOV-1_04], and is complemented by the biographies of the Supervisory Board members that are maintained on the company’s website.
 |  |  | ||
|---|---|---|---|---|
Gerard van de Aast | Bram Schot | Sophie Bechu | ||
Chair | Vice-Chair | |||
Committee(s)12 | Committee(s)14 | Committee(s)34 | ||
Former CEO of Imtech and VolkerWessels, and former member of the Executive Board of Reed Elsevier (later: RELX). Currently Chair of the Supervisory Board of KPN. | Former CEO of Audi Group, member of the Management Board of Volkswagen Group and Vice-Chair of Porsche Holding Salzburg. Currently non-executive member of the Board of Directors at Shell, Cognizant and Richemont, senior advisor to different companies, including Carlyle Group, and Associate Professor of Practice Corporate Strategy at Bocconi University, Italy. | Chief Operating Officer Alive Dx. Former Chief Operations Officer on the Executive Committee of Royal Philips and former Vice President, Strategic Outsourcing, North America Delivery at IBM. |
- Member of the Remuneration Committee.
- Member of the Corporate Governance and Nomination & Selection Committee.
- Member of the Audit Committee.
- Member of the Digital Committee.
Supervisory Board
 |  |  | ||
|---|---|---|---|---|
Jeroen Drost | Pamela Knapp | Rita Lane | ||
Committee(s)12 | Committee(s)23 | Committee(s)14 | ||
Former CEO of SHV Holdings, former CEO of NIBC Bank. Currently member of the Supervisory Board of Randstad. | Former CFO of the Power Transmission and Distribution Group of Siemens, former CFO of GfK SE. Currently member of the Supervisory Board of LANXESS and Douglas AG and member of the German Monopolies Commission. | Former Vice President of Operations at Apple Inc. Currently member of the Board of Directors of L3Harris Technologies and Amphenol Corporation. |
- Member of the Corporate Governance and Nomination & Selection Committee.
- Member of the Audit Committee.
- Member of the Remuneration Committee.
- Member of the Digital Committee.
9 Supervisory Board report
Letter from the Chair
I am pleased to present our Supervisory Board report for 2025.
During the year, the Supervisory Board’s agenda was shaped by a number of developments with a direct bearing on the company’s future direction. In this context, the Supervisory Board focused on matters relating to leadership and succession, strategic orientation beyond 2025, and developments in the external environment.
The CEO succession process was a key focus for the Supervisory Board during the year and marks an important milestone. We devoted considerable attention to this process and are pleased to have appointed a new CEO, with confidence that this appointment provides a strong basis for the company’s future development.
Looking ahead, the Supervisory Board recognizes that the company is entering a period that will require clear strategic choices, disciplined execution and continued attention to cost and organizational effectiveness. We will therefore continue to exercise oversight and provide guidance, with a clear focus on leadership continuity, strategic clarity and the safeguarding of long-term value creation.
Chair of the Supervisory Board
9.1 Introduction
This report provides information on how the Supervisory Board and its committees fulfilled their duties in 2025.
During 2025, the composition of the Supervisory Board remained unchanged. The Supervisory Board consisted of six members throughout the year, all of whom (100%) were independent. [GOV-1_07]
The Supervisory Board supervises the policies and management and the general affairs of the company. We also provide advice to the Board of Management.
Our four committees cover key areas in greater detail: the Audit Committee, the Corporate Governance and Nomination & Selection Committee, the Remuneration Committee, and the Digital Committee. The charters of each of the committees are published on the company’s website.
9.2 Key discussion topics and meetings in 2025
In 2025, the Annual General Meeting was held immediately following the publication of the Q1 results, resulting in the Q1 results meeting and the Annual General Meeting being combined. Consequently, the number of Supervisory Board meetings scheduled on separate dates was reduced from seven to six, corresponding to a minimum attendance requirement of 80%.
The Supervisory Board held six regular meetings in 2025, including four meetings dedicated to the quarterly results and meetings in September and December. Most meetings were held in person. The attendance rate of the Supervisory Board meetings in 2025 was 97%. The attendance record matrix in this section provides details for both the Supervisory Board and committee meetings.
In addition to the regular meetings, a combined Supervisory Board and Audit Committee meeting was held ahead of the publication of the Annual Report. During the year, the Supervisory Board also held several ad hoc meetings and calls, primarily in relation to the CEO succession process. These meetings were also well attended.
Each of the Supervisory Board committees regularly convened and reported back on their activities to the full Supervisory Board. In addition, the Chair of the Supervisory Board and the CEO were in regular contact on a variety of matters. Supervisory Board members also interacted individually with members of the Board of Management and senior management outside the Supervisory Board meetings.
Supervisory Board | Audit Committee | Nomination Committee | Remuneration Committee | Digital Committee | |
|---|---|---|---|---|---|
Total meetings | 6 | 7 | 6 | 3 | 4 |
Gerard Van de Aast | 6/6 | 6/6 | 3/3 | ||
Bram Schot | 6/6 | 3/3 | 4/4 | ||
Sophie Bechu | 6/6 | 7/7 | 4/4 | ||
Jeroen Drost | 5/6 | 6/7 | 5/6 | ||
Pamela Knapp | 6/6 | 7/7 | 3/3 | ||
Rita Lane | 6/6 | 6/6 | 4/4 | ||
Total attendance | 97% | 95% | 94% | 100% | 100% |
There were no apparent conflicts of interest of material significance in 2025 that would have required any of the members to abstain from participation in decision-making.
In 2025, the Supervisory Board discussed a broad range of topics. Key areas of focus included leadership, strategy, and execution.
In 2025, we devoted significant attention to the change in leadership at the level of the Chief Executive Officer. In January 2025, we announced that the Supervisory Board and the CEO agreed that the time was right for a leadership transition, and that the CEO would step down after the Annual General Meeting in 2025.
Through our Corporate Governance and Nomination & Selection Committee, we oversaw the succession process in a structured manner. This included defining the successor profile, conducting the search and selection process, and evaluating candidates. We held several ad hoc meetings and calls dedicated to this topic, reflecting the priority given to identifying a suitable successor.
Following completion of the succession process, As Tempelman was appointed as Chief Executive Officer. Throughout the year, the Supervisory Board maintained oversight of the transition to ensure orderly execution and continuity of management.
In September 2025, we held our annual Strategy Review meeting focused on the company’s approach to sustainable long-term value creation. Discussions covered macro-economic and geopolitical developments, as well as market and competitive dynamics shaping the lighting industry.
Within this context, we reviewed the strategic positioning, performance, key trends, strategic choices and initiatives of each business. We discussed the verticalized operating model and how it supports cost efficiency, strengthens customer focus and enhances execution consistency. Particular attention was given to the differentiation between connected and non-connected businesses, as well as opportunities for simplification, portfolio focus and scale.
Throughout the year, management updated the Supervisory Board on a quarterly basis on competitive developments, progress against strategic initiatives, and pending or potential acquisitions and divestments contributing to strategy execution.
In our strategy discussions, we considered the evolving macroeconomic and geopolitical environment and discussed the implications for the company’s markets and cost base, as reflected in strategic priorities and scenario planning.
The Strategy Review was followed by strategic plan discussions in December 2025 and January 2026, during which management presented the 2026–2028 strategic plan, including financial objectives. Within this context, we discussed and approved the company’s financial targets for 2026 as part of the 2026 operating plan.
In connection with the leadership transition and the forward-looking review of the company’s strategic priorities, it was clear that the strategic direction will evolve as the company moves into 2026. The Supervisory Board will be closely involved in overseeing this process, including the further refinement of strategic priorities, portfolio choices and execution focus. Further communication on the strategic direction is expected at the Capital Markets Day planned for June 2026.
On a quarterly basis, we discussed the performance of the group and of each of the four verticalized businesses, covering financial results, execution against plans and short-term outlook. Discussions focused on sales development in a challenging demand environment, margin performance, cost discipline and free cash flow generation, with attention to regional and business-specific dynamics.
Across the group, we reviewed the differing market conditions and performance trends across Professional, Consumer, OEM and Conventional. We discussed performance in the OEM business, including continued demand pressure, competitive intensity and margin development.
We also discussed execution discipline, taking into account the impact of macroeconomic and geopolitical developments on demand and pricing. In addition, we reviewed the quarterly and semi-annual financial and sustainability results, including the related press releases and disclosures.
As part of its strategic review, the Supervisory Board held a dedicated session on the Professional business in September 2025. We discussed the performance of the business, market dynamics, competitive positioning, and strategic priorities with management.
As part of the session, customers of the Professional Europe business were invited to present and share their perspectives. We exchanged views with these customers and discussed insights on customer needs, market developments, and the competitive landscape. Management also provided updates on customer segments, channel developments, and regional differences across Europe.
We further discussed organizational and talent topics within the Professional Europe business. The session supported our ongoing oversight of strategy execution and performance within the Professional Europe business.
We discussed the company’s capital allocation policy and its execution during the year, including the prioritization and balance between shareholder returns, investments in innovation and growth initiatives, and the maintenance of a robust balance sheet. Topics included cash generation, dividend policy, the execution of the share buyback program and the company’s capital structure.
We reviewed financing activities during the year, including the refinancing of bilateral term loans and the renewal of the revolving credit facility. In this context, we discussed the timing and structure of these transactions, the company’s liquidity position, cash management and debt maturity profile, as well as the preservation of financial flexibility in light of market conditions.
Following the publication of the quarterly results, the Investor Relations department provided us with updates on interactions with investors and analysts, developments in the company’s share price and analyst recommendations, as well as changes in the shareholder base. We discussed market feedback and reactions to the company’s financial performance and capital allocation decisions as part of these updates.
Sustainability is an integral part of the company’s strategy. Throughout the year, the Supervisory Board was regularly updated on the company’s sustainability ambitions, targets and performance and progress on climate-related priorities (see subsection 5.2.1 Climate change). In addition to Supervisory Board meetings, individual members of the Supervisory Board maintained regular dialogue on sustainability matters with the Chief of Strategy, Sustainability and Marketing.
In 2025, management developed a new multi-year sustainability program, Brighter Lives, Better World 2030, which will succeed the Brighter Lives, Better World 2025 program. The Supervisory Board closely monitored and discussed the design of this program. Discussions with management in connection to the program focused on ambition, priority themes and alignment with the company’s strategy, operating model and evolving regulatory and stakeholder expectations.
In the context of the EU Corporate Sustainability Reporting Directive (CSRD), management presented the double materiality assessment to both the Audit Committee and the Supervisory Board. The Supervisory Board discussed the identified material impacts, risks and opportunities and how these are reflected in the company’s strategy, risk management and sustainability priorities (see section 5.1, Double materiality assessment).
The full Supervisory Board remains engaged in strategic discussions, including sustainability-related impacts, risks and opportunities, while oversight of sustainability reporting, including CSRD-related processes and disclosures, is embedded within the responsibilities of the Audit Committee. Given this governance structure, the Supervisory Board continues to see no need to establish a separate ESG committee and will monitor sustainability developments within the existing committee framework. For more information on sustainability governance, please see section 5.4, Governance.
Risk management and internal controls were recurring topics on our agenda. As part of the annual Strategy Review, we reviewed the company’s key risks and risk categories, including how these relate to the company’s strategy and its execution. In this context, the Supervisory Board paid particular attention to geopolitical developments, including international trade conditions, sanctions regimes and regional instability, and considered how these factors relate to the company’s risk profile and strategic execution. Cyber security risks formed part of these discussions and were addressed in dedicated sessions and supported by periodic updates.
Via the Audit Committee, we were kept informed of developments in risk management and internal controls, including those reflected in the Statement on Risk Management (SoRM).
We were regularly updated on the company’s digital roadmap and progress on major digital initiatives through direct reporting and via the Digital Committee. Discussions focused on the digital enablement of strategy execution, including digitalizing our customer experience, ERP modernization, platform stabilization and improvements in operational performance and resilience.
We discussed the strategic opportunities and direction of artificial intelligence for innovation, productivity and customer value creation, as well as the associated risks, including data governance, cyber security, ethical considerations, and regulatory compliance.
In addition, we reviewed progress on initiatives to reduce technology-related risks and improve operational efficiency, and considered how digital capabilities support the company’s value proposition, workforce enablement, and long-term competitiveness.
In December 2025, we held a dedicated discussion on the company’s innovation strategy. We reviewed developments in new lighting technologies, the company’s intellectual property and licensing activities, as well as the ventures portfolio. Management also provided demonstrations of recent product and software, including connected lighting solutions, 3D printing developments and AI applications. We discussed the commercialization pathways of these innovations and the importance of maintaining differentiation and revenue potential.
We discussed organizational effectiveness, leadership capability and talent development in the context of the recent change in leadership and the review of the company’s strategic direction. Topics included succession planning below Board of Management level, the development and exposure of next-level leadership and employee engagement.
We reviewed key areas and feedback from the company’s employee survey and discussed the impact of the new organizational structure on the company’s culture. In this context, we exchanged views on how the culture can continue to support effective execution of the company’s strategy and the long-term success of its businesses.
In April 2025, we engaged with a group of employees from across the organization. The session facilitated an open and constructive dialogue on the company’s strategy, culture and ways of working, generating valuable insights into employee perspectives, talent development priorities, and engagement levels across the organization.
9.3 Key activities of the Supervisory Board committees in 2024
9.3.1 Audit Committee
Our Audit Committee assists the Supervisory Board in fulfilling its oversight responsibilities for, among other matters, the quality and integrity of the company’s financial and sustainability reporting, the effectiveness of the design and operation of the internal risk management and control systems, the internal and external audit process, as well as the company's process for monitoring compliance.
Jeroen Drost served as Chair of the Audit Committee throughout 2025. Pamela Knapp and Sophie Bechu were members of the Audit Committee. The Chair of the Supervisory Board generally joined the Audit Committee meetings as a guest.
The Audit Committee had seven regular meetings in 2025: upon the conclusion of each quarter, twice in February (annual report and auditor report; second meeting combined Supervisory Board/Audit Committee) and in December (hard close). The committee reported its findings to the full Supervisory Board after every meeting.
The CEO, CFO, Group Controller, Chief Accountant, Head of Internal Audit, Chief Legal Officer and external auditor (EY Accountants B.V.) generally attended the Audit Committee meetings. Representatives of PricewaterhouseCoopers Accountants N.V. (PwC), the incoming external auditor as from 2026, attended selected meetings in 2025 in an observer capacity to support an orderly audit transition. At the end of each meeting, the committee held a private session with the external auditor, without members of management being present. The Head of Internal Audit was invited to this private session when relevant. Outside of committee meetings, the Chair of the Audit Committee also had regular contact with the CFO, the Head of Internal Audit and the external auditor.
As part of its standing agenda, the Audit Committee reviewed and discussed:
the company’s interim and annual financial statements, key financial developments and forecasts, sustainability statements and related press releases;
the operation and effectiveness of the internal risk management and control systems, including internal control over financial reporting;
internal audit activities, follow-up actions and improvements, and the functioning and effectiveness of the internal audit function;
fraud related risks and investigations;
the company’s tax policy and relevant tax developments;
significant legal matters, material investigations and related provisions;
the company's key risks, together with potential implications;
the annual integrity report and key observations as to developments in integrity cases. For more information, see section 5.4, Governance;
the annual impairment test analysis; and
the external audit process.
In 2025, the Audit Committee also dedicated time to the following matters:
Following the introduction of the new Statement on Risk Management (SoRM) under the revised Dutch Corporate Governance Code, the Audit Committee reviewed the company’s key risks, the enterprise risk management framework and the effectiveness of the internal risk management and control systems, including internal control over financial reporting. In this context, the Audit Committee discussed the preparation of the SoRM for inclusion in the 2025 Annual Report with management and the external auditor, including its scope, wording and consistency with the company’s risk assessments and internal control evaluations.
On this basis, the Supervisory Board oversaw the development, scope and content of the SoRM and reviewed management’s approach to its preparation, including the assessment of the design and effectiveness of the company’s risk management and internal control systems. The Supervisory Board also received regular updates during the year on the operation of the risk management and internal control framework.
For further information on risk management, see chapter 13, Risk factors and risk management, and chapter 14, Statement of the Board of Management.
The committee reviewed the quarterly reporting under the company’s Brighter Lives, Better World 2025 program. In addition, the committee reviewed the sustainability reporting under the EU Corporate Sustainability Reporting Directive (CSRD), including double materiality, taxonomy alignment and assurance. For more information, see chapter 5, Sustainability statements.
The committee reviewed internal audit results, follow-up actions and improvements, discussed the annual internal audit plan and quarterly updates, and assessed the functioning and effectiveness of the internal audit function. The Audit Committee approved the internal audit plan and the internal audit charter. Specific attention was paid to audits relating to tax, inventory, and cyber security related controls.
The committee reviewed the company’s liquidity overview and debt profile during the year. This included discussions on refinancing activities in relation to debt maturities in 2025, the execution and timing of refinancing transactions, and the resulting impact on the company’s liquidity position and maturity profile. These matters were also discussed with the full Supervisory Board.
The committee reviewed developments in significant legal cases, together with related provisions, as well as material investigations. The committee also discussed the annual integrity report and key observations regarding developments in integrity cases.
The committee discussed the external auditor’s audit plan, audit results and independence. In addition, the committee monitored preparations for the transition to PricewaterhouseCoopers Accountants N.V. (PwC) as external auditor as from 2026, with PwC attending selected meetings in 2025 in an observer capacity.
The reporting from the company's external auditor, EY Accountants B.V., relates to the audit plan and the audit results reports, which are shared with management and the Audit Committee. In the reports, the external auditor highlights developments that are relevant for their key audit matters, and provides details on their audit approach, procedures and observations in relation thereto. In the reports, the external auditor also highlights other areas, developments or audit procedures performed, and their observations and considerations on management judgement and estimates applied in the preparation of the financial statements.
In the Audit Committee meetings, the external auditor discussed their reports with management and the committee. The discussions with the external auditors also covered matters related to accounting policies, financial risks, compliance with accounting standards, and compliance with (financial) legal requirements. Other areas of the Audit Committee review included the proposed external audit scope, approach, fees, and the independence of the external auditor. The committee reviewed the professional competence and good standing of the external auditor and its engagement partners. For information on the fees of EY Accountants B.V., refer to chapter 16, Signify N.V. financial statements, note B, Audit fees.
The audit by the external auditor, including a discussion of the key audit matters, is discussed in the auditor's report which is included in chapter 17, Independent auditor's reports.
9.3.2 Corporate Governance and Nomination & Selection Committee
The Corporate Governance and Nomination & Selection Committee assists the Supervisory Board by preparing the selection criteria and appointment procedure for members of the Board of Management and the Supervisory Board, periodically assessing the succession planning for the individual members of these boards and arranging interviews of potential candidates. The committee also supervises the selection and appointment of certain other key management positions. The committee is charged with reviewing the company’s corporate governance. The performance evaluation of the Board of Management and the Supervisory Board is led by the committee.
In 2025, Gerard van de Aast was Chair of the committee, with Jeroen Drost and Rita Lane as members.
The committee held six regular meetings in 2025 and reported its findings to the full Supervisory Board after each meeting. The CEO and Chief Legal Officer generally attend the committee’s meetings. The committee Chair has regular contact with the CEO and the Chief Legal Officer.
As part of its standing agenda, the committee discussed changes in key personnel positions, succession planning, and the functioning of key personnel as well as the Supervisory Board’s performance evaluation procedures. In addition, the committee discussed developments in the Dutch corporate governance landscape and the company’s corporate governance structure.
In 2025, the committee specifically dedicated time to the following matters:
Composition Board of Management
In 2025, the Corporate Governance and Nomination & Selection Committee devoted substantial attention to matters relating to the composition, succession, and continuity of the Board of Management.
In January 2025, the company announced that the Supervisory Board and the Chief Executive Officer had jointly concluded that the time was appropriate for a change in leadership. Following this announcement, the Corporate Governance and Nomination & Selection Committee initiated and led the succession process for the Chief Executive Officer.
After Eric Rondolat stepped down, Željko Kosanović served as interim Chief Executive Officer alongside his role as Chief Financial Officer. In April 2025, Željko Kosanović was appointed as a member of the Board of Management, following his appointment as acting Chief Financial Officer in April 2024.
The Corporate Governance and Nomination & Selection Committee defined the desired successor profile, considering the company’s strategic direction, operating model and leadership requirements, and conducted a structured search and interview process. Both internal and external candidates were assessed, and the committee regularly reported its findings to the Supervisory Board.
Based on this process, the committee nominated As Tempelman as successor. The Supervisory Board discussed the recommendation and decided on his appointment as Chief Executive Officer.
Harsh Chitale, a member of the Board of Management and Chief Executive Officer of Signify’s Professional Business, announced his decision to leave the company. He remained in his role through 31 December 2025.
Throughout the year, the committee continued to review succession planning and leadership development for the Board of Management and other key management positions, taking into account continuity, future leadership needs and the company’s long-term strategy.
Composition Supervisory Board and onboarding
In 2025, the Corporate Governance and Nomination & Selection Committee reviewed the composition of the Supervisory Board against the company’s long-term strategy and the desired Supervisory Board profile. Succession planning was a key focus, including the scheduled end of Rita Lane’s current term and the potential expansion of the Supervisory Board.
As proposed by the committee and the Supervisory Board in 2024, the Annual General Meeting of Shareholders in 2025 re-appointed Gerard van de Aast for a period of two years.
In its considerations regarding (re-)appointments, the committee takes into account the desired Supervisory Board profile, including diversity objectives, the required expertise and experience, and the appropriate size of the Supervisory Board. In the case of re-appointments, the outcomes of individual performance assessments and the Supervisory Board evaluation are also considered.
The Supervisory Board reviews the voting results of each Annual General Meeting. Where voting outcomes reflect differing shareholder perspectives, these are discussed and taken into account in subsequent deliberations and decision-making.
Board size and profile, including diversity
We believe it is of strategic importance that our Board of Management and Supervisory Board are composed in line with Dutch and international corporate governance best practices and that members have the expertise needed for a good understanding of current affairs and longer-term risks and opportunities related to the company’s business, taking into account our objectives that promote diversity at board level. Our boards’ profile and the Supervisory Board skills and expertise matrix reflect the areas that the committee and Supervisory Board regard to be most relevant to address the transition in the lighting industry and the execution of the company's strategy. [GOV-1_05]
In 2025, the committee reviewed the skills and expertise matrix and concluded that currently no categories need to be added nor removed. Every year, the Supervisory Board performs a self-assessment of the skills and expertise of each individual Supervisory Board member. [GOV-1_15] [GOV-1_04]. In the assessment whether a Supervisory Board member has skills and expertise in relation to sustainability, we consider the sustainability matters that are material to the company, such as climate change, circular economy, labor and human rights, and business conduct. [GOV-1_16] [GOV-1_17]
The biographies of the Supervisory Board members maintained on the company's website complement the information included in the matrix.
Skill/experience item1 | Gerard van de Aast | Bram Schot | Sophie Bechu | Jeroen Drost | Pamela Knapp | Rita Lane |
|---|---|---|---|---|---|---|
CEO role | ✓ | ✓ | ✓ | |||
Industrial experience | ✓ | ✓ | ✓ | ✓ | ✓ | ✓ |
Finance, expert level | ✓ | ✓ | ✓ | |||
Sustainability | ✓ | ✓ | ||||
Projects/infrastructure | ✓ | ✓ | ||||
Business transformation | ✓ | ✓ | ✓ | ✓ | ✓ | |
Digital business processes | ✓ | ✓ | ✓ | ✓ | ||
IT, cyber security | ✓ | ✓ | ||||
Technology/innovation | ✓ | ✓ | ||||
Operations/supply chain | ✓ | ✓ | ✓ | |||
Diversity elements: Gender identity, age, nationality | Male | Male | Female | Male | Female | Female |
- Fields in which the members of the Supervisory Board have a particular skill or expertise
The committee also reviewed the Boards profile, including diversity, and concluded that currently no update is required.
For the Supervisory Board members, and in line with Dutch law, we aim that at least one-third are men and at least one-third are women. Our Supervisory Board is currently 50% female and 50% male and thus meets this objective. [GOV-1_05]
For the Board of Management, the company aims for a balanced gender composition, with at least one man and at least one woman in the event the Board of Management consists of three members, and at least two men and at least two women in the event it consists of five members.
In 2025, the Board of Management comprised male members only. Following changes in the composition of the Board of Management during the year, including the appointment of As Tempelman and the departures of Eric Rondolat and Harsh Chitale, the Board of Management currently consists of two members, both of whom are male. As a result, the Board of Management does not currently meet the company’s gender diversity objectives. [GOV-1_05]
Any future selection of candidates for appointment will be based on merit, taking into account the Board of Management profile as well as the company’s diversity objectives. The Supervisory Board remains committed to enhancing the diversity of the Board of Management over time.
For more details on the profile, including the diversity of the Board of Management and Supervisory Board, refer to chapter 11, Corporate governance. For more information on diversity, equality & inclusion in the company, refer to section 5.3, Social, subsection 5.3.1 Own workforce, subsection Diversity, equity and inclusion.
As to the size of the Supervisory Board, the committee concluded that a board of about seven members is a good size for the company. The committee will continue to periodically assess its size and composition, including the desired diversity, and initiate searches where indicated.
The Committee followed up on the outcomes of the prior year’s Supervisory Board performance evaluation by monitoring how these were reflected in the Supervisory Board’s focus and way of working. This included attention to the Supervisory Board’s strategic orientation, succession planning and the composition of both the Supervisory Board and the Board of Management, as well as to the Supervisory Board’s interaction with senior management below the Board of Management and its oversight of the linkage between strategic themes and business performance discussions.
These focus areas were translated into concrete actions during the year, including decisions on leadership succession and targeted engagement with the organization to support effective strategy execution and accountability.
The committee prepared this year's Supervisory Board performance evaluation process. For more details, see section 9.4, Performance evaluation below.
9.3.3 Remuneration Committee
The Remuneration Committee assists the Supervisory Board by, among other matters, reviewing and preparing remuneration policies for the Board of Management and Supervisory Board, remuneration proposals for individual members of the Board of Management and other new key management positions, as well as proposals for targets relevant to the variable compensation of members of the Board of Management and the review of their performance.
In 2025, Bram Schot was the Chair, with Gerard van de Aast and Pamela Knapp as members of this committee. Currently, no member of the Remuneration Committee is a member of the executive management board of another listed company.
In performing its duties and responsibilities, the Remuneration Committee is assisted by an external consultant and in-house remuneration experts.
The Remuneration Committee held three regular meetings in 2025 and reported its findings to the full Supervisory Board after each meeting. The CEO, the Chief HR Officer, the Head of Rewards and the Chief Legal Officer generally attend the committee’s meetings. The committee also consulted with the CEO, the Board of Management and certain other key management employees. Following those consultations, the committee prepared decisions and advised the Supervisory Board.
As part of the standing agenda, the Remuneration Committee discussed, among other matters, base salary levels for the Board of Management, the target setting for variable remuneration, the final and interim performance results on variable remuneration, scenario analyses, disclosure in the remuneration report, stakeholder engagement and AGM voting results on the remuneration report.
Also refer to chapter 10, Remuneration report for further information on the current policies and the implementation thereof in 2025.
9.3.4 Digital Committee
The Digital Committee assists the Supervisory Board by, among other matters, reviewing the company’s digital strategy and roadmap, digital objectives and performance, and the governance for digital and cyber prioritization.
Sophie Bechu is the Chair, and Rita Lane and Bram Schot are the members of the Digital Committee.
The Digital Committee held four regular meetings in 2025 and reported its findings to the full Supervisory Board after each meeting. Members of the Board of Management and senior management, including the Chief Digital and Information Officer (CDIO) and the Head of Corporate Security, generally attended the committee meetings. During the year, a new CDIO was appointed. The Chair of the Digital Committee maintained regular contact with the CDIO.
During 2025, the Digital team had constructive collaboration with the company’s Cybersecurity team. This collaboration supported an integrated view on digital and cyber topics, strengthened mutual understanding of risks and dependencies, and improved alignment between digital initiatives and cybersecurity priorities. Reflecting this development, the committee’s agenda now explicitly includes time to discuss linked digital and cybersecurity matters, ensuring coherent oversight of interrelated topics.
The company’s digital ambition is supported by a multi-year roadmap focusing on digital transformation, operational efficiency, proactive risk reduction, and workforce enablement. As part of its standing agenda, the committee reviewed progress on the company’s digital strategic initiatives, including developments in IT and digital key performance indicators, the status of major digital programs and the governance of digital investments.
During the year, the committee discussed the progress of the company’s ERP transformation program, aimed at simplifying and modernizing core systems, reducing technical debt and supporting business continuity. The committee also reviewed developments in digital automation, data management and system migrations, as well as the robustness of digital controls and cyber security measures. In addition, the committee reviewed the company’s emergency response and escalation procedures for digital disruptions, including roles and responsibilities and communication processes, and followed up on actions to further strengthen preparedness.
Specific attention was given to developments in artificial intelligence, including AI use cases across internal processes and customer-facing applications. The committee discussed the opportunities and risks associated with these developments.
In addition, the committee held deep dives on selected digital topics, including customer relationship management transformation, data and analytics capabilities and digital talent development. The committee monitored how these initiatives support execution of the company’s strategy and enhance transparency, efficiency and decision-making across the organization.
9.4 Performance evaluation
We evaluated the performance of the Board of Management and of the Supervisory Board and its committees in 2025.
The Board of Management evaluated their team and personal targets performance and shared their views with the Chair and Chair of the Remuneration Committee, which were discussed in the Supervisory Board.
The objective of our annual Supervisory Board performance evaluation is to gain better insight into the functioning of the Supervisory Board, to identify strengths that we want to keep and to identify matters that the Supervisory Board or the company can improve. In most years, the evaluation of the Supervisory Board's performance is organized internally, led by the Nomination and Governance Committee. About every four years, the Supervisory Board engages an external party to facilitate the performance evaluation, most recently in 2023. This year the performance evaluation was done internally.
The evaluation started with a questionnaire, which was completed by each of the members of the Supervisory Board and Board of Management as well as the General Secretary. The findings of the questionnaire served as input for a discussion among the Supervisory Board.
Based on the 2025 performance evaluation, the Supervisory Board concluded that it functions effectively as a well-balanced and collaborative team, with an appropriate mix of skills, experience and backgrounds.
The evaluation confirmed that the Supervisory Board devoted substantial attention to the company’s strategy and long-term value creation, supported by constructive interaction between the Supervisory Board and management. The Supervisory Board also reflected on its role in maintaining strategic focus and alignment, with emphasis on supporting delivery against the company’s strategic priorities. The evaluation also identified opportunities to further enhance the effectiveness of Supervisory Board meetings, including improvements to meeting documentation, the quality and timeliness of pre-reading materials, and the focus of discussions.
In addition, the evaluation highlighted the importance of continued learning on digital developments, including artificial intelligence, to support effective oversight of strategy and risk. The Supervisory Board will continue to prioritize strategy execution and performance, including oversight of the operating model, and to engage with management and next-level leadership.
The Supervisory Board operates through four committees: Audit, Remuneration, Digital, and Nomination & Governance. Their functioning was evaluated positively.
9.5 Financial statements 2025 and dividend
Signify’s Consolidated and Company financial statements for 2025, as prepared by the Board of Management, have been audited by EY Accountants B.V. as an independent external auditor appointed by the General Meeting of Shareholders. Its report has been included in section 17.1, Report on the audit of the financial statements 2025 in this Annual Report. We have approved these financial statements.
We recommend the General Meeting of Shareholders adopt the financial statements for 2025 and to adopt the proposed a cash dividend of EUR 1.57 per ordinary share from the 2025 net income.
9.6 Appreciation
The Supervisory Board expresses its appreciation to the Board of Management, and all Signify employees for their efforts and commitment during a year marked by challenging market conditions. Despite ongoing headwinds and the ripple effects of economic developments, the Supervisory Board recognizes the professionalism, dedication and resilience demonstrated across the company throughout the year.
The Supervisory Board also acknowledges the efforts made to reset priorities and sharpen strategic focus during the year. These actions have laid a solid foundation for clear choices, disciplined execution, and a focused agenda going into 2026.
February 24, 2026
Supervisory Board
Gerard van de Aast
Bram Schot
Sophie Bechu
Jeroen Drost
Pamela Knapp
Rita Lane
10 Remuneration report
10.1 Letter from the Remuneration Committee Chair
On behalf of the Supervisory Board, I am pleased to present the 2025 remuneration report, including an explanation of the 2025 remuneration policies for the Board of Management and the Supervisory Board. The realization of these policies is discussed in section 10.2, Remuneration Board of Management and section 10.3, Remuneration Supervisory Board of this report.
Signify had a very challenging year in 2025, resulting in mixed overall performance. The results for 2025 reflected resilience amid reduced demand, tariff impacts and pricing pressures in trade channels. Signify experienced growth in the Professional business in the US market, while Europe declined. With the exception of China, the Consumer business grew in 2025 and is experiencing strong momentum, particularly in the Connected business. The year saw growth in our strategic segments of connected lighting and specialty lighting, which was offset by the decline in over-the-counter channels. Connected lighting and specialty lighting now represent 36% of sales. While top line remained sluggish, Signify delivered a solid gross margin supported by cost discipline and price management, illustrating the resilience demonstrated during the year. However, within this challenging and mixed performance environment, the pace of adapting cost to the top line reality was not as expected.
The Brighter Lives, Better World 2025 program reached its conclusion with outcomes that overall exceeded the five-year targets that were set relative to a 2019 baseline; illustrating that with focus companies can have a positive impact in environmental and social areas. For three of the four areas of the 2025 program – carbon reduction over the value chain ahead of the Paris Agreement, brighter lives revenues and circular revenues, the company overachieved the 2025 program ambitions. In the fourth area, Women in Leadership, a significant increase has been realized relative to the 2019 baseline. However, the 2025 program ambition was not achieved.
Signify customer experience remains stable while the employee experience continues to improve. Signify customers report a customer Net Promoter Score that remained stable over 2025, with a full year outcome of 55 (2024: 55). For Signify employees, 2025 was a challenging year given the mixed business performance and leadership changes. Despite the challenges, the employee Net Promoter Score for the end of 2025 was 39 (2024 year end: 34).
In addition, the company announced a dividend of EUR 1.57 per share for 2025 reflecting the policy of paying an increasing cash dividend year on year.
Per September 1, 2025, As Tempelman was appointed as CEO of the company. The annual base salary of Mr. Tempelman was set at EUR 1,045,223, the same as applied to his predecessor.
The 2025 annual cash incentive was agreed to be paid out pro rata as of the appointment date, based on the achievement of 100% of the targets set for the year.
On the first 2025 grant date after his appointment, October 27, 2025, Mr. Tempelman received performance shares under the Signify Long-term Incentive Plan for the Board of Management with a grant value of EUR 1,045,223, which equals 100% of base salary as per the remuneration policy. On the same date, he also received a one-off equity-based award consisting of restricted share rights with a value of EUR 500,000 under the Signify Restricted Share Rights Plan with a cliff vesting on the regular vesting date in 2028.
The compensation package of Mr. Tempelman is based on competitive benchmarks and in line with the remuneration policy of the Board of Management. In reaching the decision on the annual cash incentive and long-term incentive arrangements for Mr. Tempelman, the Supervisory Board considered the totality of circumstances, including the offset of losses of incentive pay-outs from Mr. Tempelman’s previous employer. The consideration was made to ensure a fair and competitive compensation package that supports the attraction and retention of key talent, while remaining aligned with shareholder interests and long-term value creation.
The 2024 Remuneration Report received a 96.85% advisory vote from the shareholders at the Annual General Meeting of Shareholders, held on April 25, 2025.
In preparation for the 2025 annual Remuneration Report, the Supervisory Board initiated extensive shareholder engagement during 2025 and early 2026. The objective was to understand the expectations of, and solicit feedback from, our broad and geographically diverse shareholder base, including proxy advisors and other stakeholders such as the Dutch Works Council. In this regard, we invited investors representing a total of 57% of our shareholder base to meet with Signify on this topic, and ultimately meetings were held with shareholders representing 22% of the shareholder base, excluding passive investors. These meetings resulted in valuable input for the Remuneration Committee.
We are pleased with the overall ongoing engagement with stakeholders and the degree of dialogue experienced. We trust that stakeholders experience these dialogues positively and appreciate the spirit of transparency and continuous improvement which drives them.
Bram Schot
Chair of the Remuneration Committee
10.2 Remuneration Board of Management
Signify has a long and proud history as the leader in lighting for more than 130 years. The company’s purpose is to unlock the extraordinary potential of light for brighter lives and a better world. Our strategy coupled with our Brighter Lives, Better World programs are as relevant today as when they were first introduced. More than ever, the focus is to drive our leadership in lighting technology, serve our customers, satisfy our stakeholders and continue to lead the way in sustainability. These drivers are important elements of our remuneration policy.
Signify's remuneration philosophy includes providing a competitive and fair remuneration package in the relevant labor markets, reflected in a balanced approach to compensation for all its employees, from its CEO to all employees worldwide. This is reflected in the remuneration policy, which is aimed at driving sustainable value creation, both short-term and long-term. Therefore, the performance measures used in the variable compensation components are linked to quantitative financial, non-financial and sustainability targets. The remuneration policy serves a communication purpose as it clearly stipulates and supports a common approach to deliver on the company’s strategy.
The value created by Signify goes beyond financial performance alone. Through our company purpose and strategy, we aim to address global challenges and our stakeholders’ expectations, while contributing to the achievement of the United Nations Sustainable Development Goals (UN SDGs). Our approach is to optimize long-term value through financial, environmental and social resources. Our focus on the environment and the societal implications of doing business is evidenced in our Brighter Lives, Better World programs. These programs link to our long-term incentive plan and ensures that the interests of the organization, society at large, and our impact on the environment in which we live are key elements in how Signify delivers long-term value creation to stakeholders. Our activities and our way of doing business impact customers, employees, investors and society at large.
The current remuneration policies for the Board of Management and the Supervisory Board were adopted by the Annual General Meeting of Shareholders (AGM) 2024. The effectuation of these policies in 2025 is discussed in section 10.2, Remuneration Board of Management and section 10.3, Remuneration Supervisory Board of this remuneration report.
The report included in this chapter constitutes the remuneration report within the meaning of section 2:135b of the Dutch Civil Code.
The following principles apply for the remuneration policy of the Board of Management:
Signify’s remuneration policy aims to attract, reward and retain qualified leaders to pursue the company’s purpose and long-term strategic objectives, while taking the interest of all the company’s stakeholders into account;
Remuneration levels are to be competitive and in line with the market practice of comparable companies and support a pay-for-performance philosophy with a significant proportion of compensation at risk;
Remuneration should drive long-term value creation from a financial, non-financial and sustainability perspective;
During the policy design and review process, stakeholder feedback and standards of good corporate governance, including the Dutch Corporate Governance Code, are considered.
The compensation package for the members of the Board of Management consists of the following fixed and variable components:
Base salary;
Annual cash incentive;
Long-term equity-based incentive;
Pensions and other benefits.
The combination of a member’s base salary, annual cash incentive and long-term equity-based incentive, together referred to as the “total direct compensation”, is targeted around the median level of a representative labor market peer group and benchmarked on a regular basis.
This labor market peer group is created and reviewed to consist of companies that are of comparable size, complexity, industry, and geographical region. It also reflects companies/industries where Signify may compete for talent. The peer group reflects a balance with 50% of the peer companies representing Dutch cross-industry companies that are typically included in the AEX or AMX, and 50% European sector specific companies.
The labor market peer group currently consists of the following 14 companies:
Labor Market Peer Group | ||
|---|---|---|
Aalberts | DSM-Firmenich | ams OSRAM |
AkzoNobel | KPN | Prysmian |
Arcadis | Legrand | Rexel |
ASMi | Nexans | Rheinmetall Group |
BAM | Nordex |
Compensation Element | 2025 Policy Summary | Application in 2025 Summary | ||||||||||
|---|---|---|---|---|---|---|---|---|---|---|---|---|
Total direct compensation | Base salary |
| Base salary as follows: |
| ||||||||
Annual cash incentive | CEO: | Other BoM members: | Measures: | |||||||||
The Supervisory Board can determine to relate: | Actual payout: | In % of target: | In % of max. opportunity: | |||||||||
| A.C. Tempelman | 100% | 50% | |||||||||
Long-term equity-based incentive | CEO: | Other BoM members: | 2025 grant: |
| ||||||||
|
| |||||||||||
Other compensation | Pension benefit |
| Accumulated annual pension as of Dec 31, 2025: | |||||||||
A.C. Tempelman | EUR 736 | |||||||||||
| ||||||||||||
Additional benefits | Additional benefits, such as expense and relocation allowances, medical insurance, accident insurance and company car arrangements. |
|
| |||||||||
The table below reflects the total remuneration as well as the remuneration costs of each of the individual members of the Board of Management in 2025. |
Base | Annual incentive1 | Performance shares costs2 | Restricted share rights costs3 | Pension allowances | pension scheme costs | Other compensation4 | Termination benefits5 | Total | |
|---|---|---|---|---|---|---|---|---|---|
2025 | |||||||||
A.C. Tempelman6 | 348,408 | 279,490 | 47,189 | 23,871 | 75,619 | 10,063 | 21,701 | — | 806,341 |
E.H.E. Rondolat7 | 336,530 | 263,453 | 668,262 | — | 73,041 | 10,873 | 15,958 | 1,045,223 | 2,413,340 |
Z. Kosanović8 | 803,220 | 135,278 | 208,701 | 25,754 | 149,001 | 33,768 | 39,388 | — | 1,395,110 |
H.M. Chitale9 | 683,220 | 127,079 | 40,640 | — | 136,355 | 33,768 | 39,814 | — | 1,060,876 |
2,171,378 | 805,300 | 964,792 | 49,625 | 434,016 | 88,472 | 116,861 | 1,045,223 | 5,675,667 | |
2024 | |||||||||
E.H.E. Rondolat | 1,014,780 | 365,321 | 679,637 | — | 219,245 | 34,032 | 52,381 | — | 2,365,396 |
H.M. Chitale | 663,320 | 179,096 | 335,970 | — | 131,380 | 34,032 | 33,882 | — | 1,377,680 |
Z. Kosanović10 | 355,553 | 88,639 | 182,701 | 32,419 | 37,831 | 25,524 | 19,357 | — | 742,024 |
F.J. van Engelen Sousa11 | 161,162 | — | 31,378 | — | 31,678 | 8,508 | 7,607 | — | 240,333 |
M.L. Mariani12 | 245,387 | 66,332 | 429,331 | — | 54,584 | 14,180 | 19,269 | 19,339 | 848,422 |
2,440,202 | 699,388 | 1,659,017 | 32,419 | 474,718 | 116,276 | 132,496 | 19,339 | 5,573,855 |
- The annual incentive is related to the performance in the year reported and which is paid out in the subsequent year.
- Costs of performance shares are based on accounting standards (IFRS) and do not reflect the value of the shares at the vesting/release date. The performance share costs for E. Rondolat reflect a pro rata forfeiture of the 2024 grant, and for H. Chitale a forfeiture of the 2024 and 2025 grant, as explained in more detail below.
- Costs of restricted share rights are based on accounting standards (IFRS) and do not reflect the value of the shares at the vesting/release date. These restricted share rights concern the sign-on grant of EUR 500,000 for A. Tempelman, and to one‑third of the 2023 LTI grant, consisting of conditional share rights (RSUs), granted to Z. Kosanovic prior to his appointment to the Board.
- The stated amounts mainly concern (part of) allowances to members of the Board of Management that can be considered as remuneration. In a situation where such a part of an allowance can be considered as (indirect) remuneration (for example, private use of the company car or car allowance), then such part is both valued and accounted for here. The method employed by the fiscal authorities in the Netherlands is the starting point for the value stated. Net allowances are not included.
- E. Rondolat stepped down from the Board of Management per the April 2025 AGM and his services contract ended per October 31, 2025. As per his services contract (which is published on the company’s website), he will receive a lump sum payment of one time the annual base compensation/salary (gross amount of EUR 1,045,223), which was payable in October 2025. Also explained in more detail below.
- Appointed member of the Board of Management per September 1, 2025. Remuneration costs represent the period functioning as member of the Board of Management as of September 1, 2025.
- Stepped down as member of the Board of Management after the AGM of April 25, 2025. The services contract ended per October 31, 2025. The remuneration costs represent the period until April 25, 2025.
- Z. Kosanović had the position of acting CEO from the end of April till the end of August 2025. For each of those four months, he received a temporary increase of his base salary in aggregate by EUR 30,000 gross per month, and his pension allowance in aggregate by EUR 7,500 gross per month, to align with the base salary level for the CEO position. His variable pay was not adjusted for this period.
- Stepped down as member of the Board of Management on January 1, 2026.
- Appointed acting CFO as of April 1, 2024. The remuneration costs represent the period as of the appointment as acting CFO.
- Stepped down as member of the Board of Management on April 1, 2024.
- Stepped down as member of the Board of Management on May 14, 2024.
On January 24, 2025, the company announced that the Supervisory Board and CEO E.H.E. Rondolat agreed that the time was right for a change of leadership, and that E.H.E. Rondolat would step down from the company’s Board of Management after the Annual General Meeting of Shareholders held on April 25, 2025. As of closure of the Annual General Meeting of Shareholders held on April 25, 2025, E.H.E. Rondolat was released from his duties until the termination of his services agreement on October 31, 2025, which date considers the applicable notice period. E.H.E. Rondolat was offered the possibility to leave at any earlier date than October 31, 2025, which possibility he did not use.
The termination arrangements made are in line with the applicable conditions as laid down in the services agreement agreed in 2024. In determining the termination arrangements, the Supervisory Board considered E.H.E. Rondolat’s sustained contribution over a period of thirteen years of continuous service. This tenure was deemed a material factor in the overall assessment, reflecting his long-standing commitment and alignment with the company’s values and long-term objectives.
Up to the termination date of October 31, 2025, E.H.E. Rondolat was entitled to the compensation package in accordance with the conditions of his 2024 services agreement.
E.H.E. Rondolat received a severance payment equal to a one-year annual base salary.
The Supervisory Board agreed that the pay-out of the 2025 annual cash incentive would be prorated for the period until the termination date, based on a 100% performance achievement. The agreement on the annual cash incentive pay-out was made in January 2025, at which time the achievement of the targets was unknown though aimed to be around target.
For the long-term incentives, the Supervisory Board decided, in the context of the LTI performance periods completed and considering E.H.E. Rondolat’s termination date, that the 2023 LTI grant will vest in full, and for the 2024 LTI grant 1/3 will be forfeited. These 2023 and 2024 LTI grants will vest on the regular vesting dates subject to the achieved performance as determined by the Supervisory Board. E.H.E. Rondolat did not receive a long-term incentive (LTI) grant for the year 2025.
For the period E.H.E. Rondolat stepped down from the company’s Board of Management until the termination date (April 26 – October 31, 2025), the base compensation, annual incentive, pension allowances plus pension scheme costs and other compensation represent a value of EUR 534,489, EUR 432,980, EUR 133,274 and EUR 50,773 respectively.
For the long-term incentives for H.M. Chitale, the Supervisory Board decided that the 2023 LTI grant will vest in full given he was in service for the full performance period. The 2024 and 2025 LTI grants were forfeited per the termination date.
10.2.1 Mix of remuneration elements
To support the remuneration policy’s objectives, the total direct compensation for the Board of Management members includes a significant mix of variable components in the form of an annual cash incentive and a long-term equity-based incentive in the form of performance shares. As a result, a considerable proportion of pay is "at risk" through variable incentives and linked to the short-term and long-term performance of Signify. The chart shows the relative on-target value of fixed compensation (base) versus variable compensation (annual cash incentive (AI) and long-term equity incentive (LTI), both for the CEO and the other members of the Board of Management.
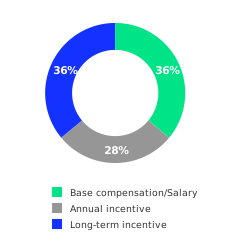
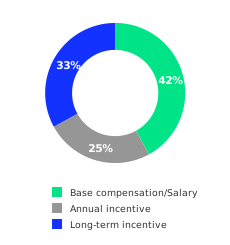
The table below shows the actual remuneration mix in 2025.
Fixed1 | Variable2 | Proportion fixed/ | |
|---|---|---|---|
A.C. Tempelman3 | 455,791 | 279,490 | 62%/38% |
Z. Kosanović3 | 1,025,377 | 135,278 | 88%/12% |
H.M. Chitale3 | 893,157 | 127,079 | 88%/12% |
- Base compensation/salary, pension allowances, pension scheme costs, other allowances as reported in the table "Remuneration and remuneration costs of individual members of the Board of Management" in section 10.2, Remuneration Board of Management.
- Annual incentive realized as reported in the table "Remuneration and remuneration costs of individual members of the Board of Management" in section 10.2, Remuneration Board of Management and long-term incentive value at vesting date in 2025 as reported in the table "Number of performance shares (holdings) in number of shares 2022-2025" in subsection 10.2.5, Long-term equity-based incentive.
- The variable remuneration does not yet include an LTI vesting value as a Board of Management member and therefore the fixed/variable mix differs from that generally applied to the Board of Management members.
Scenario analyses are prepared regularly to estimate future payout levels for appropriateness and as input to policy redesign. Scenarios included minimum, threshold, target and maximum performance all under a 0% share price appreciation assumption. Additional scenarios included maximum performance with both a 50% share price increase and a 100% share price increase. The scenarios considered achievement across all metrics at below threshold, threshold, target and maximum levels of performance and the resulting remuneration. Based on the scenario analyses performed, the Supervisory Board has concluded that the policy supports the pay-for-performance philosophy and leads to appropriate remuneration.
10.2.2 Base salary
The base salary is a fixed cash payment. It is intended to attract and retain qualified leaders and to reflect their experience, skills, scope of responsibilities and contribution within Signify. The Supervisory Board sets and annually reviews the base salary levels. In determining whether an adjustment of the base salary is required, the Supervisory Board will consider salary increases for the collective labor agreement (CLA) population in the Netherlands as an important reference, whilst it may also consider other factors, including developments of salaries in the labor market peer group, salary developments of employees globally, and the Board of Management member’s role, scope, experience and individual contribution within Signify.
For 2025, the Supervisory Board decided to increase the base salary levels for all members of the Board of Management by 3%, in line with the budgets (collective and merit increase) allocated for the CLA population in the Netherlands and the broader employee population.
January 1, 2025 | |
|---|---|
Z. Kosanović1 | 683,220 |
H.M. Chitale | 683,220 |
- Z. Kosanović had the position of acting CEO from the end of April until the end of August 2025. For each of those four months, he received a temporary increase of his base salary in aggregate by EUR 30,000 gross per month, to align with the base salary level for the CEO position. This temporary increase is not reflected in the table above.
A.C. Tempelman was appointed member of the Board of Management per September 1, 2025 and his annual base salary was set at EUR 1,045,223.
10.2.3 Variable remuneration
The variable remuneration of the members of the Board of Management consists of an annual cash incentive and a long-term equity-based incentive.
The design of the incentives aims to achieve a balance between short-term objectives, long-term value creation and sustainable performance. Variable pay is based on both financial and non-financial performance measures. In selecting performance measures, their respective weights and targets for a performance period, the following is considered:
Performance measures are selected based on relevance to the company’s strategy, and in the case of the annual incentive may reflect strategically important focus areas in a particular year;
The company's strategy guides the targets and intervals for the performance measures;
Targets are set ambitiously yet realistically, taking the company’s risk appetite into account;
Alignment with stakeholders’ interests and expectations is essential.
The Supervisory Board determines the target for each of the performance measures of the annual cash incentive and the long-term equity-based incentive. The target definition for these variable remuneration components includes target intervals and correlating payout schemes, being defined in incremental steps in performance and respective payout. In addition, a minimum threshold for the achievement of financial performance measures applies, below which there will be no payout. Following the end of the relevant performance period, the Supervisory Board will assess the actual performance relative to the targets set. On that basis, the Supervisory Board will, at its discretion, determine the achievement per performance measure and target.
10.2.4 Annual cash incentive
Members of the Board of Management are eligible for an annual cash incentive. The annual incentive is designed to reward the achievement of annual financial objectives and team/individual performance. The purpose is to ensure alignment with the company’s annual business plan setting the strategic priorities for that year, which in turn contribute to the company’s long-term objectives.
The Supervisory Board can annually determine to relate 75% to 80% of the annual cash incentive to financial performance measures focusing on the realization of strategic business objectives, and 20% to 25% of the annual cash incentive to team and individual performance measures.
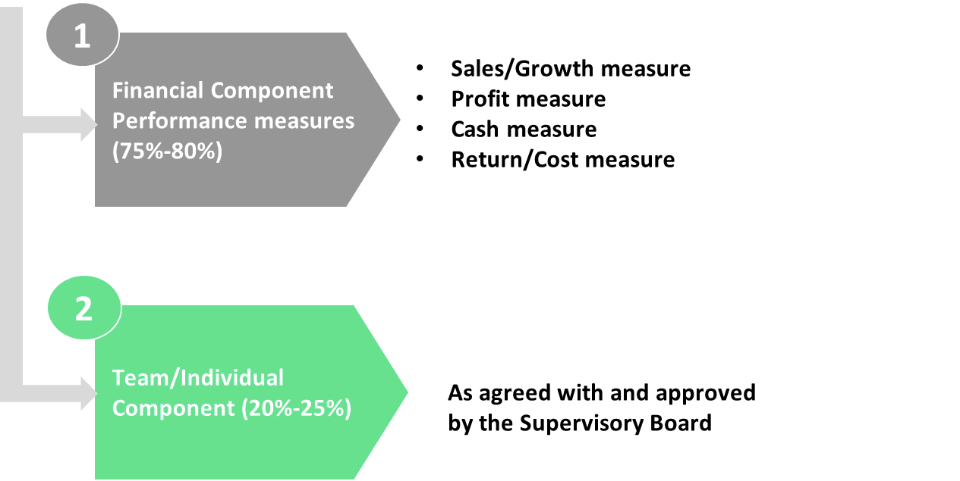
For the financial component, the Supervisory Board can annually select two or three financial performance measures from the following list and determine the weighting per performance measure: sales/growth (such as comparable sales growth or nominal revenue), profit (such as adjusted EBITA or net income), cash (such as working capital) and return/cost measures (such as return on R&D investments or operating expenses).
For the team/individual component, the Supervisory Board can annually determine the performance measures given the strategic priorities for that year. These performance measures are partially shared by the Board of Management as a team and partially focus on the specific role of the individual within the Board of Management. These measures will vary given the strategic focus in a year.
The possibility to annually select financial performance measures from the above list, determine the team/individual performance measures, and determine the weighting between financial performance measures and team/individual performance measures, gives the Supervisory Board a certain level of flexibility to ensure continuous alignment of the performance measures with the company’s strategy and financial and operational objectives for the mid-term.
For 2025, the Supervisory Board decided to select the following financial performance measures: average working capital (40%), adjusted EBITA (40%) and comparable sales growth (20%), measured as a percentage of sales and representing 80% of the total annual incentive opportunity. Team and individual metrics represented 20% of the total annual incentive opportunity for 2025.
The financial targets for 2025 were set within the context of the medium-term objectives of the company at the beginning of the year and did not change over the course of 2025.
The team/individual performance measures are recommended by the CEO and discussed and ultimately approved by the Supervisory Board. For 2025, these measures included, among others, cultural change and people engagement, customer satisfaction and digital transformation program Force. These are explained further in the table on the realized outcomes.
Performance against financial targets are reviewed on a quarterly basis. The assessment of performance under the annual incentive plan is concluded by the Supervisory Board.
Signify had a challenging year in 2025, resulting in mixed overall performance. Signify achieved growth in the US Professional business and the overall Consumer business, while Professional Europe, OEM and the Consumer business in China declined. This mixed performance is reflected in a -3.4% CSG for 2025, below the threshold level of -1.6%, resulting in an annual incentive outcome on this metric of 0%. Signify performance on adjusted EBITA was 8.9%, also below the threshold level of 9.8%, resulting in an outcome of 0% on this metric. Finally, average working capital (aWoCa) achievement for the year was 7.4%, at the threshold level of performance, resulting in an outcome of 50% on this metric. The final weighted outcome across all financial metrics for the Board of Management is 16%.
Finally, the Supervisory Board assessed the achievements of the Board of Management relative to their collective team and individual goals for 2025. With respect to culture change and people engagement, there were positive outcomes. Balancing of the age pyramid continues to improve, with the representation of Generation Z talent increasing to 14% (2024: 9.4%). Representation of women in the workforce increased to 39.9% (2024: 36.4%) of the workforce. Women in leadership however declined to 27.5% (2024: 27.8%) in 2025. Despite the uncertain year, employee NPS reflects the highest score ever achieved of 39 in Q4 (2024: 34 Q4). The customer perspective remains stable with the Customer Net Promoter Score of 55 for the year (2024: 55). Finally, strong progress has been made in the upgrading of the digital landscape in Signify. The Supervisory Board acknowledged the continued volatility and challenging year and assessed the individual and team performance in the context of the year with an outcome of good. As a result, the Supervisory Board has determined that the realized performance on this measure reflected 85% for Z. Kosanović and 75% for H.M. Chitale.
The summarized outcomes realized on all measures are as follows:
Financials (80% weighting) | Weighting | Threshold | Actual | Payout % | Weighted payout % | ||||||
|---|---|---|---|---|---|---|---|---|---|---|---|
Comparable sales growth | 16% | (1.6)% | (3.4)% | —% | —% | ||||||
Adjusted EBITA | 32% | 9.8% | 8.9% | —% | —% | ||||||
Average Working Capital | 32% | 7.4% | 7.4% | 50% | 16% | ||||||
Payout level financials | 20% | 16% | |||||||||
Team and individual objectives (20% weighting) | Minimum | Expected | Exceptional | ||||||||
Description and achievements | Weighted payout % | ||||||||||
Culture change/ people engagement | Employee NPS focus areas/diversity objectives | ● | |||||||||
Customer satisfaction | Customer Net Promotor Score/detractors close loop/survey participation rate | ● | |||||||||
Digital Transformation | Progress against plan and budget | ● | |||||||||
Payout team/individual objectives Z. Kosanović | 85% | 17% | ● | ||||||||
Payout team/individual objectives H.M. Chitale | 75% | 15% | ● | ||||||||
Total payout level Z. Kosanović | 33% | ● | |||||||||
Total payout level H.M. Chitale | 31% | ● | |||||||||
The multiple achieved results in the following payout for each Board of Management members:
Annual base | On-target % of annual base | Multiple achieved1 | Pro rata factor | Realized | |||||
|---|---|---|---|---|---|---|---|---|---|
A.C. Tempelman2 | 1,045,223 | x | 80% | x | 100% | x | 0.33 | = | 279,490 |
E.H.E. Rondolat3 | 1,045,223 | x | 80% | x | 100% | x | 0.32 | = | 263,453 |
Z. Kosanović | 683,220 | x | 60% | x | 33% | x | 1 | = | 135,278 |
H.M. Chitale | 683,220 | x | 60% | x | 31% | x | 1 | = | 127,079 |
- For A.C. Tempelman and E.H.E. Rondolat, as explained in section 10.1, Letter from the Remuneration Committee Chair and in section 10.2, Remuneration Board of Management respectively, the annual cash incentive was agreed to be paid out pro rata based on the achievement of 100% of the targets set for the year.
For Z. Kosanović and H.M. Chitale the assessment of the annual cash incentive achievement is included in the table above. - The realized annual incentive for A.C. Tempelman reflects the pro rata amount from September 1 until December 31, 2025
- The realized annual incentive for E.H.E. Rondolat reflects the pro rata amount until April 25, 2025
10.2.5 Long-term equity-based incentive
Members of the Board of Management are eligible for a long-term equity-based incentive under the Signify Long-term Incentive Plan (LTIP). The objective of the long-term incentive is to link pay with long-term sustainable value creation, by selecting a combination of performance measures that together reflect and balance successful financial and sustainability performance under the company’s strategy. In addition to the Board of Management, approximately 650 employees globally are participants in a similar long-term incentive plan.
The main characteristics of the long-term incentive plan for the Board of Management are as follows:
The long-term incentive is granted in performance shares only and granted annually;
The vesting of performance shares is conditional upon the achievement of performance conditions measured over a period of three financial years and continued Signify employment;
Performance is measured using four performance measures in 2025: relative total shareholder return (25%), free cash flow (25%), return on capital employed (25%) and sustainability (25%);
Payout per performance measure can vary between 0% and 200%.
The vesting of 25% of the shares granted is subject to a relative total shareholder return (TSR) condition. TSR measures the share price growth plus dividends paid over the three-year performance period. Performance is expressed as a percentage. This percentage is compared to the TSR performance of companies included in the peer group specifically compiled for this purpose. The TSR performance is determined for each company in the peer group and the performances are ranked from top to bottom. Signify’s position in the ranking, together with the payout curve, determines the payout level.
The peer group currently consists of the following companies:
TSR Peer Group | ||
|---|---|---|
ABB | Honeywell Int. | ams OSRAM |
Acuity Brands | Hubbell | Panasonic |
Eaton Corporation | Johnson Controls | Schneider Electric |
Fagerhult | Legrand | Signify |
Hitachi | MLS Co Ltd | Zumtobel Group |
The peer group is reviewed on a regular basis to ensure that the companies in the group remain relevant peers. In case a peer needs to be replaced due to a corporate event (merger, acquisition, and so on), the Supervisory Board will ensure that the adjusted peer group remains aligned with the strategic objectives, the geographical spread and the business characteristics of Signify. Per January 1, 2024, Toshiba was replaced by ams OSRAM. This means that:
For the LTI 2023 grant (vesting in 2026), TSR is calculated on a “synthetic combination”, i.e. Toshiba until January 1, 2024, and ams OSRAM as of January 1, 2024;
As of the LTI 2024 grant (vesting in 2027 and thereafter), ams OSRAM replaced Toshiba in the TSR peer group;
Ranking | 15 | 14 | 13 | 12 | 11 | 10 | 9 | 8 | 7 | 6 | 5 | 4 | 3 | 2 | 1 |
|---|---|---|---|---|---|---|---|---|---|---|---|---|---|---|---|
Payout | 0 | 0 | 0 | 0 | 0 | 0 | 0 | 75 | 100 | 125 | 150 | 175 | 200 | 200 | 200 |
The vesting of another 25% of the annual long-term incentive grant is linked to performance measured by a free cash flow target over the three-year performance period. The targets and intervals around these measures are determined by the Supervisory Board, based on the company’s strategic, multi-year plan.
The vesting of the remaining 25% of the annual long-term incentive grant is linked to performance measured by a return on capital employed target. The targets and intervals around these measures are determined by the Supervisory Board, based on the company’s strategic, multi-year plan.
The vesting of 25% of the annual long-term incentive grant is dependent on how well Signify performs against the targets set with respect to the sustainability condition. The targets and intervals around these measures are determined by the Supervisory Board, aligned with the company's multi-year sustainability program, which is developed in pursuance of the company’s strategy. [CSRD GOV-3_01].
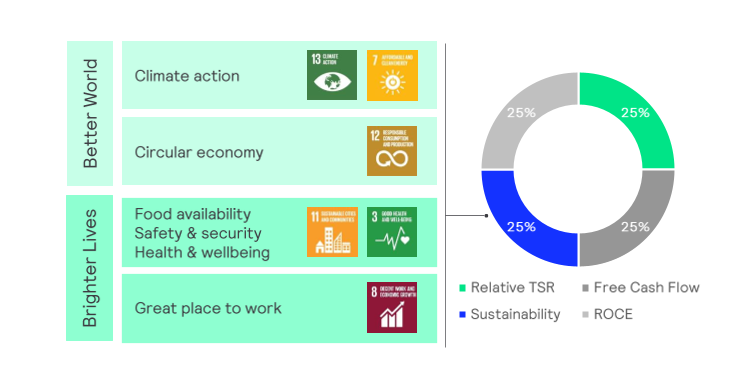
In 2025, performance shares were granted to the members of the Board of Management. These grants are governed by the Signify long-term incentive plan. The grant is made based on the average closing share price of the three months preceding the date of the grant. In this way, the Signify granting policy ensures mitigation of share price volatility.
The following table provides an overview of the Signify shares granted and vested for the Board of Management in 2025.
Grant date | Number of | Value at | Vesting date1 | Unvested | Number of | Number of | Value at | Unvested | |
|---|---|---|---|---|---|---|---|---|---|
A.C. Tempelman | 27.10.2025 | 46,440 | 1,045,223 | 01.05.2028 | — | 46,440 | — | — | 46,440 |
E.H.E. Rondolat2 | 18.05.2022 | 23,256 | 947,330 | 28.04.2025 | 23,256 | — | 8,721 | 169,019 | — |
17.05.2023 | 33,052 | 985,223 | 28.04.2026 | 33,052 | — | — | — | 33,052 | |
15.05.2024 | 36,744 | 985,223 | 01.05.2027 | 36,744 | — | — | — | 24,496 | |
28.10.2024 | 1,372 | 29,557 | 01.05.2027 | 1,372 | — | — | — | 915 | |
H.M. Chitale3 | 17.05.2023 | 17,284 | 515,200 | 28.04.2026 | 17,284 | — | — | — | 17,284 |
15.05.2024 | 19,216 | 515,200 | 01.05.2027 | 19,216 | — | — | — | — | |
28.10.2024 | 716 | 15,456 | 01.05.2027 | 716 | — | — | — | — | |
28.04.2025 | 27,028 | 546,576 | 01.05.2028 | — | 27,028 | — | — | — | |
Z. Kosanović | 28.04.2025 | 27,028 | 546,576 | 01.05.2028 | — | 27,028 | — | — | 27,028 |
M.L. Mariani | 18.05.2022 | 12,172 | 495,884 | 28.04.2025 | 12,172 | — | 4,565 | 88,475 | — |
17.05.2023 | 17,300 | 515,719 | 28.04.2026 | 17,300 | — | — | — | 17,300 |
- Under the long-term incentive plan terms, the vesting date is on the first business day after the publication of Signify's first quarter results in the third anniversary year of the grant date. The dates for 2027 and beyond in this table are for illustrative purposes only.
- E.H.E. Rondolat stepped down as member of the Board of Management after the AGM of April 25, 2025. The services contract ended per October 31, 2025. From the 2024 grant, 1/3 of the shares forfeited per the date the services contract ended. No grant was awarded in 2025.
- H.M. Chitale stepped down as member of the Board of Management as per January 1, 2026, and the shares granted in 2024 and 2025 forfeited.
The three-year performance period for the 2022 performance share grant ended on December 31, 2024. The shares under this grant vested on April 28, 2025, with a vesting percentage of 37.5%.
In 2025, dividend payments on the vested long-term incentive shares held by the members of the Board of Management were paid as cash to E.H.E. Rondolat and Z. Kosanović, and as a re-investment in shares to H.M. Chitale, for which he received 4,108 dividend shares (not reflected in the table above).
At December 31, 2025, the members of the Board of Management held no options on Signify shares.
10.2.6 Realization of the 2023 grant
The three-year performance period for the 2023 performance share grant ended on December 31, 2025. The shares under this grant vest on April 28, 2026. The payout results are set forth below. In determining the achievement of the 2023 grant, the Supervisory Board considered whether any adjustments or discretion should be applied. No discretionary adjustments were made to the results, nor to the original targets set for the 2023 grant for the Board of Management.
Performance conditions | Weighting | Threshold | Target | Maximum | Achievement | Vesting level |
|---|---|---|---|---|---|---|
Relative TSR1 | 25% | 8th position | 7th position | ≥ 3rd position | 13th position | 0% |
Free Cash Flow2 | 25% | 8.0% | 9.0% | 10.0% | 7.9% | 0% |
ROCE | 25% | 12.0% | 14.0% | 16.0% | 8.2% | 0% |
Sustainability1 | 25% | 175% | 43.75% | |||
Total | 43.75% |
- See tables for TSR peer group ranking, and Sustainability outcomes hereafter. [CSRD GOV-3_01]
- Over the three-year performance period, an amount of EUR 1,463 million free cash was generated, representing 7.9% of sales.
The TSR peer group ranking is shown in the following table:
Rank | Company | TSR performance |
|---|---|---|
1 | Hitachi | 263.9% |
2 | Eaton Corporation | 141.5% |
3 | ABB | 121.2% |
4 | Acuity Brands | 105.2% |
5 | Johnson Controls | 99.8% |
6 | Hubbell | 90.6% |
7 | Schneider Electric | 90.2% |
8 | Legrand | 89.8% |
9 | Panasonic | 72.5% |
10 | MLS | 17.8% |
11 | Honeywell | 9.1% |
12 | Fagerhult | 8.3% |
13 | Signify | (14.2)% |
14 | Zumtobel | (36.2)% |
15 | ams OSRAM | (57.8)% |
Status1 | Result 2025 | ||||
|---|---|---|---|---|---|
Better World | Climate action | Cumulative carbon reduction, in million tonnes | Overachieved | 665 | |
Circular economy | Circular revenues | Overachieved | 37% | ||
Brighter Lives | Food availability | Brighter lives revenues | Overachieved | 34% | |
Great place to work | Women in leadership positions | Below target | 27% |
- Status versus Brighter Lives, Better World 2025 doubling targets.
10.2.7 Share ownership guidelines and holding requirement
Under the Signify share ownership guidelines, members of the Board of Management must hold a certain value in shares in the company. These guidelines are designed to further align the interests of the members of the Board of Management (and certain other leaders within Signify) with the interests of its shareholders. For the CEO, the value in Signify shares to be held is 300% of base salary and for the other members of the Board of Management it is 200% of base salary. The guidelines require that all after-tax shares be retained until the required level is met.
In addition, members of the Board of Management shall comply with holding requirements under the Dutch Corporate Governance Code. This effectively means that members of the Board of Management shall hold all after-tax shares received under the long-term incentive plan for a period of at least five years from the date of grant.
Once the requirements under the Signify share ownership guidelines and under the Dutch Corporate Governance Code are met, shares may be sold, subject to insider trading rules.
December 31, | Holdings as | December 31, | Holdings as | |
|---|---|---|---|---|
A.C. Tempelman | n.a. | n.a. | 0 | —% |
Z. Kosanović | n.a. | n.a. | 39,170 | 115.7% |
H.M. Chitale | 82,976 | 269.2% | 64,235 | 189.8% |
- As per the Share Ownership Guidelines, to determine the value of shares on a specific date, the shares held are multiplied by the average of the closing prices of the shares on Euronext Amsterdam in the two months prior to that date (2025: EUR 20.19 and 2024: EUR 21.52).
10.2.8 Pensions and other benefits
The design of the pension plan for the members of the Board of Management is the same as for all other Signify employees in the Netherlands, which is referred to as a collective defined-contribution plan, based on career average salary. The following pension arrangement is in place for the members of the Board of Management:
The flex pension plan in the Netherlands, which is a collective defined-contribution plan with a fixed contribution of 30.3% up to the maximum pensionable salary of EUR 137,800 (2025);
Members of the Board of Management pay an employee member contribution of 2% up to the maximum pensionable salary of EUR 137,800 (2025). As of January 1, 2025, new entrants to the plan pay an employee member contribution of 5% up to the maximum pensionable salary of EUR 137,800 (2025);
The flex pension plan has a target retirement age of 68 (in 2025) and a target accrual rate of 1.85%;
The members of the Board of Management receive a gross pension allowance equal to 25% of the base compensation exceeding EUR 137,800 and can choose to participate in a net pension arrangement by investing the net (after-tax) amount. The net pension arrangement is in line with all other Signify employees in the Netherlands whose pensionable salary exceeds the cap. Participation in this net pension arrangement is voluntary.
As per January 1, 2027, the pension plan will change as a result of the amendment to the Dutch Pension Act ('Wet Toekomst Pensioenen'). The final changes will be included in the Annual Report once finalized and approved by the DNB (De Nederlandsche Bank).
The table below gives an overview of the accumulated annual pension entitlements and the pension costs of the individual members of the Board of Management.
Age at December 31, | Accumulated | Total | Accumulated | Total | |
|---|---|---|---|---|---|
A.C. Tempelman3 | 55 | n.a. | n.a. | 736 | 85,682 |
E.H.E. Rondolat4 | 59 | 51,857 | 253,277 | 56,841 | 83,914 |
Z. Kosanović | 55 | n.a. | n.a. | 18,263 | 182,769 |
H.M. Chitale | 53 | 14,297 | 165,412 | 17,395 | 170,123 |
Pension costs | 418,689 | 522,488 |
- Total of entitlements under applicable pension scheme in Signify, including – if applicable – transferred pension entitlements under pension scheme(s) of previous employer(s).
- Cost includes paid pension allowances as well as pension premium paid by employer to collective defined-contribution plan.
- Costs for A.C. Tempelman are disclosed for the period starting September 1, 2025.
- Total pension-related costs for 2025 for E.H.E. Rondolat are disclosed for the period up to and including April 25, 2025.
When pension rights are granted to members of the Board of Management, necessary payments (if insured) and all necessary provisions are made in accordance with the applicable accounting principles. In 2025, no (additional) pension benefits were granted to former members of the Board of Management.
Members of the Board of Management are also entitled to other benefits, such as expense and relocation allowances, medical insurance, accident insurance and company car arrangements.
10.2.9 Change of the remuneration and company performance
For the purpose of reflecting company performance, free cash flow generation and share price have been selected as the most relevant measures. The following table reflects the annual change of remuneration of the members of the Board of Management, the employee average remuneration, free cash flow and Signify's closing share price at year-end. The information is provided over the past five years.
2021 | 2022 | 2023 | 2024 | 2025 | |
|---|---|---|---|---|---|
A.C. Tempelman1 | - | - | - | - | 806,341 |
Change in % | - | - | - | - | - |
E.H.E. Rondolat1 | 3,228,091 | 2,044,154 | 2,282,804 | 2,365,396 | 1,368,117 |
Change in % | (1)% | (37)% | 12% | 4% | (42)% |
Z. Kosanović1 | - | - | - | - | 1,395,110 |
Change in % | - | - | - | - | - |
H.M. Chitale1 | - | - | 782,608 | 1,377,680 | 1,060,876 |
Change in % | - | - | - | 76% | (23)% |
Employees2 | 51,337 | 53,766 | 63,623 | 62,954 | 62,520 |
Change in % | (1)% | 5% | 18% | (1)% | (1)% |
Free cash flow (in millions of EUR) | 614 | 445 | 585 | 438 | 440 |
Change in % | (25)% | (28)% | 31% | (25)% | 0.5% |
Closing share price on last business day December | 40.78 | 31.38 | 30.32 | 21.58 | 20.96 |
Change in % | 18% | (23%) | (3%) | (29%) | (3%) |
- Remuneration based on total compensation costs as reported in the table "Remuneration and remuneration costs of individual members of the Board of Management" under section 10.2, Remuneration Board of Management. For A.C. Tempelman and E.H.E. Rondolat 2025 does not represent a full year due to respectively appointment to the Board of Management on September 1, 2025, and step down from the Board of Management per April 25, 2025, and excludes the termination benefit for E.H.E. Rondolat.
For H.M. Chitale 2023 does not represent a full year, due to his appointment to the Board of Management on May 16, 2023. - Employee average remuneration based on total employee benefit expenses and average total employees in FTEs (third party workers excluded) as disclosed in chapter 15, Consolidated financial statements, note 4, Employee benefit expenses.
For 2025, the company performance shows a stable or slight decline on the selected measures. Signify's free cash flow was stable year over year at EUR 440 million, representing a slight increase of 0.5%. Signify closing share price at year end reflects a decline of 3% from the 2024 closing share price. With the change of incumbents in the CEO role during 2025, the year over year trend is not comparable as remuneration for both the current and preceding CEO reflect pro rata remuneration. The employee average remuneration remains relatively stable with a slight decline of 1% driven by a 6% reduction in headcount compared with 2024 (chapter 15, Consolidated financial statements, note 4, Employee benefit expenses).
10.2.10 Signify's internal pay ratio
The remuneration design for the members of the Board of Management is an integral part of the overall pay structure within the company. Signify uses the Hay system to evaluate and grade the various positions within its organization. This means that a standardized method for determining the appropriate benefits for each of the respective job levels within the company is utilized. Using the Hay grading system also ensures that the remuneration of the members of the Board of Management is aligned with and is relative to the remuneration of Signify employees holding other positions within the company. The remuneration of senior staff within Signify is based on the same components as the remuneration of the members of the Board of Management.
The Corporate Governance Code requires reporting on the pay ratio. Signify’s pay ratio reflects the average total compensation of the total global employee workforce, relative to the total remuneration package of the CEO. This has resulted in the following outcome:
Fiscal year | CEO total remuneration1 | Average total compensation employees2 | Resulting pay ratio3 |
|---|---|---|---|
2025 | 2,588,551 | 62,520 | 41 |
2024 | 2,365,396 | 62,954 | 38 |
2023 | 2,282,804 | 63,623 | 36 |
2022 | 2,044,154 | 53,766 | 38 |
2021 | 3,228,091 | 51,337 | 63 |
- Remuneration based on annualized total compensation costs as reported in the table "Remuneration and remuneration costs of individual members of the Board of Management" under section 10.2, Remuneration Board of Management.
- Employee average remuneration based on total employee benefit expenses and average total employees in FTEs (third party workers excluded) as disclosed in chapter 15, Consolidated financial statements, note 4, Employee benefit expenses.
- For comparative purposes, when adjusting the CEO total remuneration to exclude the annualized restricted share costs, as these relate to a one-off LTI sign on award rather than recurring annual compensation, the pay ratio amounts to 39.
For transparency and clarity, Signify applies a methodology to calculate the internal pay ratio that is IFRS-driven (i.e. linked to Signify’s notes to the Consolidated financial statements).
In the above table, for 2025 the CEO remuneration reflects the annualized remuneration of A.C. Tempelman, inclusive of the one-off sign on LTI award. For the prior years the CEO remuneration reflects the remuneration of E.H.E. Rondolat. For 2025, average total compensation for employees remains relatively stable, with a slight decline of 1% driven by a 6% reduction in headcount compared with 2024 (Chapter 15, Consolidated financial statements, note 4, Employee benefit expenses).
10.2.11 Claw-back and change of control
The annual cash incentive and the long-term incentive of the members of the Board of Management are subject to adjustment and claw-back provisions. Pursuant hereto, the Supervisory Board may (a) revise an incentive prior to payment if unaltered payment would be unreasonable and unfair, (b) recover an incentive if it was granted on the basis of incorrect information on the fulfillment of the incentive goals or the conditions for payment of the incentive, and (c) recoup an incentive in case of a serious violation of the Signify Integrity code or applicable law, or in circumstances allowing the company to terminate the contract for urgent cause, and (d) recoup an incentive in the other circumstances set forth in the services contract with the member of the Board of Management concerned.
In the event of a change of control of the company, the Supervisory Board can, at its sole discretion, decide to accelerate the vesting of any unvested awards under the long-term incentive, subject to the achievement of the performance conditions up to the date of the completion of the change of control. Unless the Supervisory Board determines otherwise, vesting will take place on a pro rata basis.
No variable remuneration was clawed back in 2025.
10.2.12 Additional arrangements
Unless relevant law provides otherwise, the members of the Board of Management and of the Supervisory Board shall be reimbursed by the company for various costs and expenses, such as reasonable costs of defending claims, as formalized in the Articles of Association. Under certain circumstances, described in the Articles of Association, such as an action or failure to act by a member of the Board of Management or a member of the Supervisory Board that can be characterized as intentional (‘opzettelijk’), intentionally reckless (‘bewust roekeloos’) or seriously culpable (‘ernstig verwijtbaar’), there will be no entitlement to this reimbursement. The company has also provided liability insurance (Directors and Officers) for the persons concerned.
10.2.13 Contractual arrangements
Members of the Board of Management are engaged by a service contract (‘overeenkomst van opdracht’) with a maximum of four years ending on the date of the Annual General Meeting of Shareholders in the fourth calendar year after the appointment. Members of the Board of Management are appointed for a maximum period of four years, subject to re-appointment by the General Meeting of Shareholders. Termination of the services contract is subject to a notice period of six months for either party. The terms and conditions of these service agreements have been aligned with the relevant Dutch Corporate Governance Code provisions.
10.2.14 Severance arrangements
Contractual severance arrangements of members of the Board of Management comply with the Dutch Corporate Governance Code and are capped at one time the annual base salary.
In any event, no severance payment is due upon voluntary resignation of a Member of the Board or if the termination is a result of a serious culpable act or an act of negligence of the Member of the Board.
Any unvested awards granted under the Signify Long-term Incentive Plan shall be forfeited upon termination of the services contract, unless the Supervisory Board decides otherwise or in case of retirement (in which case pro rata vesting shall apply).
10.2.15 Loans
The company does not grant loans to members of the Board of Management.
10.3 Remuneration Supervisory Board
The remuneration of the individual members of the Supervisory Board, as well as the additional remuneration for its chair and the members of its committees, is determined by the General Meeting. The remuneration of a member of the Supervisory Board consists of a fixed amount depending on the member’s position on the board (chair/vice-chair/other board members), an additional fee for the function of chair or member of committees and allowances for travel.
The remuneration of a Supervisory Board member is not dependent on the results of the company. Shares or rights to shares shall not be granted to a Supervisory Board member. The company does not grant loans to members of the Supervisory Board.
The fees and allowances for travel are as follows:
Supervisory Board fixed annual fee | |
|---|---|
Chair | 110,000 |
Vice-Chair | 85,000 |
Member | 75,000 |
Committee fees | |
Audit Committee | |
Chair | 22,500 |
Member | 13,000 |
Digital Committee | |
Chair | 22,500 |
Member | 13,000 |
Remuneration Committee | |
Chair | 15,000 |
Member | 10,000 |
Nomination Committee | |
Chair | 15,000 |
Member | 7,500 |
Allowance for travel | |
Intercontinental | 5,000 |
Continental | 2,500 |
When the activities of the Supervisory Board or other circumstances so require, the Supervisory Board may establish an ad hoc committee formed from among its members and assign certain tasks to such committee. In such event, the Supervisory Board may determine additional fees to be paid to the members of the ad hoc committee. The fees will be in line with the fees for the existing committees.
The following table reflects the total remuneration of each of the members of the Supervisory Board.
Membership | Committees | Other | Total | |
|---|---|---|---|---|
2025 | ||||
G. van der Aast | 110,000 | 25,000 | — | 135,000 |
B. Schot | 85,000 | 28,000 | — | 113,000 |
S. Bechu | 75,000 | 35,500 | 12,500 | 123,000 |
J. Drost | 75,000 | 30,000 | — | 105,000 |
P. Knapp | 75,000 | 23,000 | 15,000 | 113,000 |
R. Lane | 75,000 | 20,500 | 20,000 | 115,500 |
495,000 | 162,000 | 47,500 | 704,500 | |
2024 | ||||
A.P.M. van der Poel2 | 41,250 | 9,375 | — | 50,625 |
G. van der Aast | 100,625 | 26,125 | — | 126,750 |
B. Schot | 81,250 | 27,250 | — | 108,500 |
S. Bechu | 75,000 | 30,625 | 22,500 | 128,125 |
J. Drost3 | 46,875 | 18,750 | — | 65,625 |
P. Knapp | 75,000 | 26,563 | 17,500 | 119,063 |
R. Lane | 75,000 | 20,500 | 25,000 | 120,500 |
F. Lubnau2 | 28,125 | 7,688 | 5,000 | 40,813 |
523,125 | 166,876 | 70,000 | 760,001 |
- The amounts mentioned under other compensation relate to the allowance for (inter-)continental travel.
- Stepped down as member of the Supervisory Board on May 14, 2024.
- Appointment as a member of the Supervisory Board in AGM 2024. The remuneration excludes the observer period. The fee during that period was the same as applies for a Supervisory Board membership, excluding committee fees.
At December 31, 2025, the members of the Supervisory Board held no Signify shares, options on Signify shares nor other Signify securities (2024: nil).
The following table reflects the annual change of remuneration of each of the members of the Supervisory Board over the full financial years over the past five years.
2021 | 2022 | 2023 | 2024 | 2025 | |
|---|---|---|---|---|---|
A.P.M. van der Poel1 | 135,000 | 140,000 | 140,000 | 50,625 | - |
G. van der Aast | 113,000 | 118,000 | 118,000 | 126,750 | 135,000 |
B. Schot | - | 68,125 | 106,000 | 108,500 | 113,000 |
S. Bechu2 | - | - | 78,450 | 128,125 | 123,000 |
J. Drost3 | - | - | - | 65,625 | 105,000 |
P. Knapp | 115,000 | 125,000 | 125,000 | 119,063 | 113,000 |
R.S. Lane | 108,000 | 123,000 | 113,000 | 120,500 | 115,500 |
F. Lubnau1 | 112,500 | 122,500 | 116,575 | 40,813 | - |
- Stepped down as member of the Supervisory Board on May 14, 2024.
- Appointment as a member of the Supervisory Board in AGM 2023. The remuneration excludes the observer period. The fee during that period was the same as applies for a Supervisory Board membership, excluding committee fees.
- Appointment as a member of the Supervisory Board in AGM 2024. The remuneration excludes the observer period. The fee during that period was the same as applies for a Supervisory Board membership, excluding committee fees.
10.4 Remuneration outlook 2026
10.4.1 Base salary
For 2026, the Supervisory Board has determined that the salaries of the Board of Management members will be increased by 2.5% as of January 1, 2026, in line with the global employee population.
January 1, 2026 | |
|---|---|
As Tempelman | 1,071,354 |
Z. Kosanović | 700,301 |
10.4.2 Annual cash incentive
For 2026, the Supervisory Board decided to select the following financial performance measures: comparable sales growth (40%), average working capital (20%), adjusted EBITA (20%), and added as a fourth financial performance metric non-manufacturing costs (20%) to continue to drive cost discipline. All metrics are measured as a percentage of sales and together represent 80% of the total annual incentive opportunity. Team and individual metrics will continue to represent 20% of the total annual incentive opportunity for 2026.
10.4.3 Supervisory Board
No adjustments are foreseen to the remuneration of the members of the Supervisory Board.
11 Corporate governance
Introduction
Signify N.V., a public company with limited liability organized under Dutch law, is the parent company of the Signify group. The ordinary shares of Signify N.V. are listed on Euronext Amsterdam under the ticker symbol “LIGHT”. |
Signify N.V. has a two-tier board structure consisting of a Board of Management responsible for the management of the company and a Supervisory Board that supervises and provides advice to the Board of Management. The two boards are independent of each other and are accountable to the General Meeting of Shareholders (the General Meeting) for the performance of their duties.
The Board of Management and the Supervisory Board are responsible for maintaining an appropriate corporate governance structure of the company.
Signify N.V.’s corporate governance framework is based on the company’s Articles of Association, the requirements of the Dutch Civil Code, the Dutch Corporate Governance Code 2025 (https://www.mccg.nl/english), the Dutch Financial Markets Supervision Act and any other applicable laws and regulations. Additionally, the Board of Management has implemented a code of conduct (the Integrity code), policies, directives and authorization schedules throughout Signify in order to strengthen its governance framework.
In this chapter, the company addresses the main elements of its corporate governance structure, reports on how it applies the principles and best practices of the Dutch Corporate Governance Code and provides the information required by the Dutch governmental decrees on Corporate Governance and Article 10 Takeover Directive. Substantial changes in the corporate governance structure of the company, when deemed necessary in the interests of the company, will be disclosed in this chapter.
In line with the Dutch Corporate Governance Code, other parts of this Annual Report address and explain the strategy and culture of Signify aimed at sustainable long-term value creation. Signify’s strategy is described in more detail in chapter 3, Business and strategy. This chapter also provides an explanation of our value creation model which allows our stakeholders to consider the financial, environmental and social impact of our business activities.
Chapter 3, Business and strategy, highlights how the company’s strategy was executed in 2025. Additionally, refer to chapter 4, Corporate performance, and chapter 9, Supervisory Board report, which describe how the Supervisory Board is involved in the company’s strategy as well as other topics.
As set out in chapter 5, Sustainability statements, Signify’s culture is built on three foundational pillars: its purpose & values, sustainability and building high performance teams, and anchored by the integrity norms described in Signify's Integrity code.
11.1 Signify organization
Signify has an operating model aimed at enhancing customer centricity, specialization, and speed of execution. This model organizes the company into four vertically integrated businesses:
The Professional business offers LED products and connected lighting systems & services to professional customers across the globe.
The Consumer business offers a wide variety of LED lamps, functional LED luminaires to the consumer segment.
The OEM business offers lighting components, such as LED drivers, electronics, modules and sensors to the industry, both to the internal organization and other manufacturers.
The Conventional business offers a range of products, including conventional lamps, electronics, and specialty lighting to consumers, electrical installers, distributors, and professional end-users.
The company operates in many countries through its subsidiaries and affiliated companies as well as via a limited number of branch offices, which primarily act under the Signify trade name.
11.2 Board of Management
The Board of Management is entrusted with the management of the company. The Board of Management is responsible for the continuity of the company and its business and for sustainable long-term value creation by the company and its affiliated enterprises. In performing its duties, the Board of Management is guided by the interests of the company and its affiliated enterprises. The Board of Management takes into account the relevant interests of its stakeholders and has due regard to the effect of the company's actions on people and the environment. The Supervisory Board monitors the Board of Management in this regard.
Among other responsibilities, the Board of Management drives the company’s management agenda, defines and deploys the strategic direction, identifies opportunities and risks connected with its business activities and strategy, pursues the operational and financial objectives of the company, and monitors sustainability matters.
The Board of Management is accountable to the Supervisory Board for its actions and decisions. The Chief Executive Officer and other members of the Board of Management have regular contact with the Chair and other members of the Supervisory Board, attend most parts of the Supervisory Board meetings, and provide the Supervisory Board with the information it needs to fulfil its responsibilities.
Certain decisions of the Board of Management require Supervisory Board approval. These decisions include important proposals for capital expenditures, acquisitions, divestments, decisions concerning financial and operational objectives and strategy to achieve such objectives, changes to corporate policies, as well as the annual operating plan.
The functioning and decision-making within the Board of Management are laid down in its Rules of Procedure which can be found on the company’s website.
Appointment
Members of the Board of Management are appointed by the General Meeting upon a nomination drawn up by the Supervisory Board, which nomination may be binding.
Members of the Board of Management are appointed for a maximum term of four years, it being understood that this term expires at the end of the Annual General Meeting to be held in the fourth year after the year of their appointment. Re-appointment is possible for consecutive terms of four years or, if applicable, until a later retirement date or other termination date in the fourth year, unless the General Meeting resolves otherwise. Members may be suspended by the Supervisory Board and the General Meeting, and dismissed by the latter.
Composition
The composition of the Board of Management follows the board profile which aims for an appropriate combination of knowledge and experience among its members, encompassing industrial, technology & innovation, projects & infrastructure, digital & marketing, financial, economic, IT, social & sustainability aspects of international business and society, in relation to the global character of its business. This profile also applies to the Supervisory Board, and can be found on the company's website. The size of the Board of Management may vary over time, as considered appropriate to support its profile.
There are no formal representatives of employees and other workers at the Board of Management or Supervisory Board. In accordance with the Dutch Corporate Governance Code, both Boards do take into account the interest of relevant stakeholders, including employees and other workers. Signify has processes and engagements in place between workers' representatives and the Board of Management throughout the year. See also subsection 5.3.1, Own workforce.
At the start of 2025, the Board of Management consisted of Eric Rondolat (CEO) and Harshavardhan Chitale. On April 25, 2025 CEO Eric Rondolat stepped down from the Board of Management. On the same day, CFO Željko Kosanović was appointed to the Board of Management. As Tempelman was appointed to the Board of Management, effective September 1, 2025, and he has fulfilled the role of CEO since that date. In the period from April 25, 2025, until September 1, 2025, Željko Kosanović held the CEO position on an interim basis, in addition to his role as CFO. On December 31, 2025, Harshavardhan Chitale stepped down from the Board of Management.
The Board of Management currently consists of two members (executives): As Tempelman (CEO) and Željko Kosanović (CFO). [GOV-1_01] The current female-to-male ratio of the Board of Management is therefore 0:2. [GOV-1_05] [GOV-1_06] For a discussion of the composition of the Board of Management including its diversity, refer to chapter 9, Supervisory Board report.
11.3 Supervisory Board
The Supervisory Board, in the two-tier board structure under Dutch law, is a separate body that is independent of the Board of Management. The Supervisory Board supervises the policies and management and the general affairs of the company. The Supervisory Board also provides advice to the Board of Management. In performing its duties, the members of the Supervisory Board are guided by the interests of the company and the business of the group, taking into consideration the relevant interests of its stakeholders.
The Supervisory Board appoints a Chair and a Vice-Chair from among its members. The Chair ensures the members of the Supervisory Board and its committees function properly in all respects and comply with the Supervisory Board Rules of Procedure. The Chair is the main contact on behalf of the Supervisory Board for the General Meeting.
Independence of the Supervisory Board
The Supervisory Board is a separate corporate body that is independent of the Board of Management. Its independent character is also reflected in the requirement that members of the Supervisory Board can be neither a member of the Board of Management nor an employee of the company. Each member of the Supervisory Board meets the independence requirements as stated in the Dutch Corporate Governance Code, and therefore the percentage of independent Supervisory Board members (non-executives) is 100%. [GOV-1_07]
Appointment
The members of the Supervisory Board are appointed by the General Meeting on the nomination of the Supervisory Board, which nomination may be binding.
The term of appointment of a member of the Supervisory Board will end at the closing of the Annual General Meeting to be held in the fourth year after appointment. In line with the Dutch Corporate Governance Code, the members of the Supervisory Board are eligible for re-appointment for a period of maximum four years. Subsequent re-appointments are possible for a period of two years, which may be extended by a re-appointment of a maximum of two years. The reasons for re-appointment of a member of the Supervisory Board after an eight-year term must be included in the report of the Supervisory Board.
Under Dutch law, a mandatory gender quota applies, requiring supervisory boards to be composed of at least one-third men and one-third women. The Supervisory Board meets this target for the financial year 2025. The gender quota needs to be observed in case of a new appointment of a member of the Supervisory Board and a re-appointment of an acting member of the Supervisory Board after an eight-year term. Any new appointment or re-appointment after an eight-year term resulting in the composition of the Supervisory Board not meeting this gender quota, will be null and void. An appointment or re-appointment that does not contribute to the gender balance will only be allowed under certain exceptional circumstances.
Composition
The composition of the Supervisory Board follows the same board profile that applies to the Board of Management, see paragraph 11.2 above.
There are no formal representatives of employees and other workers at the Board of Management or Supervisory Board, see paragraph 11.2 above. The composition of the Supervisory Board shall also be in accordance with the best practice provisions on independence of the Dutch Corporate Governance Code as well as Dutch law restrictions on the overall number of supervisory positions that a member of the Supervisory Board may hold. Each member shall be capable of assessing the broad outline of the overall management of the company.
The size of the Supervisory Board may vary over time, as considered appropriate to support its profile. The Supervisory Board currently consists of six independent members (non-executives): Gerard van de Aast (Chair), Bram Schot (Vice Chair), Sophie Bechu, Jeroen Drost, Pamela Knapp and Rita Lane. [GOV-1_02] The current female to male ratio of the Supervisory Board of Management is therefore 3:3. [GOV-1_05] [GOV-1_06]
11.4 Supervisory Board Committees
In 2025, the Supervisory Board had four committees: the Audit Committee, the Corporate Governance and Nomination & Selection Committee, the Remuneration Committee and the Digital Committee. Each of the committees has a preparatory and/or advisory role to the Supervisory Board. They report their findings to the full Supervisory Board, which is ultimately responsible for all decision-making. Information on the work and composition of the committees during 2025 is set out in chapter 9, Supervisory Board report.
Each committee has a charter describing its role, responsibilities and functioning. These charters are published on the company’s website. The responsibilities of each Committee are described in more detail below.
Audit Committee
The Audit Committee assists the Supervisory Board in fulfilling its oversight responsibilities for the integrity and quality of the company’s financial and sustainability reporting, the effectiveness of the design and operation of the internal risk management and control systems, the internal and external audit process, the internal and external auditor’s qualifications, its independence and its performance, as well as the company’s process for monitoring compliance with laws and regulations and the Integrity code. It reviews the company’s annual and interim financial statements (including sustainability information) prior to publication and periodically discusses the company's key risks. It maintains contact with and supervises the external auditor and prepares the nomination of an external auditor for appointment by the General Meeting.
The Audit Committee meets at least once before the publication of the company's quarterly and annual results.
Corporate Governance and Nomination & Selection Committee
The Corporate Governance and Nomination & Selection Committee:
prepares the selection criteria and appointment procedures for members of the Supervisory Board and the members of the Board of Management;
periodically assesses the size, composition and diversity policy of the Board of Management and the Supervisory Board and the profile of the Supervisory Board;
periodically assesses the functioning and succession planning of the individual members of the Supervisory Board and Board of Management;
supervises the policy and appointment of the company's leadership team, appointments of which are subject to the Supervisory Board's approval; and
reviews the corporate governance of the company at least once a year.
The Corporate Governance and Nomination & Selection Committee meets at least twice every year.
Remuneration Committee
The Remuneration Committee reviews and prepares proposals for the Supervisory Board on:
the remuneration policies for the Board of Management and Supervisory Board;
the compensation levels and individual remuneration of the members of the Board of Management and leadership team; and
the objectives for the variable remuneration of members of the Board of Management, and reviews their performance against these objectives.
The Remuneration Committee prepares an annual remuneration report, which is included in chapter 10, Remuneration report.
The Remuneration Committee meets at least twice per year.
Digital Committee
The Digital Committee:
reviews the company's digital strategy, roadmap, resourcing and any changes thereto;
supervises the Supervisory Board in supervising the company's policy on digital strategies, tools and operations;
reviews the company's digital objectives and performance, periodically assesses the effectiveness and results of the digital initiatives as well as management skills, capabilities and training; and
reviews the governance for deciding on digital prioritization and spending within the company at least once a year.
The Digital Committee meets at least four times a year.
11.5 Other governance matters related to the Boards
Diversity & inclusion
Signify believes that a diverse workforce and an inclusive working environment are essential to a thriving business and long-term value creation.
In view hereof, Signify aims that the Board of Management and the Supervisory Board comprise members who bring a diversity of skills and expertise relevant for achieving the company’s strategic and business objectives, different views and perspectives as well as different backgrounds: nationality, educational, working experience or otherwise. For the Supervisory Board members, and in line with the Dutch law requirement, Signify aims that at least one-third are men and at least one-third are women. For the Board of Management, Signify aims at having at least one man and at least one woman for a board with three members, and at least two men and two women for a board with five members. [GOV-1_05]
Remuneration
The remuneration of the individual members of the Board of Management is determined by the Supervisory Board based on the remuneration policy adopted by the General Meeting. The remuneration of the individual members of the Supervisory Board, as well as the additional remuneration for its Chair and the members of its committees, is determined by the General Meeting.
Pursuant to Dutch law, the remuneration policies must be adopted by the General Meeting at least every four years. The resolution of the general meeting to adopt the remuneration policy requires a 75% majority of the votes cast, unless the Articles of Association explicitly provide otherwise, which Signify's Articles of Association do not. The remuneration report relating to the previous financial year must be submitted to the General Meeting on an annual basis for an advisory vote.
The current remuneration policies for Board of Management and the Supervisory Board were adopted by the Annual General Meeting in 2024. The composition of the remuneration of the members of the Board of Management and the members of the Supervisory Board and the remuneration policies are described in chapter 10, Remuneration report.
Conflicts of interest
Members of the Board of Management shall not participate in the discussions and decision-making process on a subject or transaction that they have a direct or indirect personal conflict of interest or have a conflict of interest within the meaning of the Dutch Corporate Governance Code. Relevant matters relating to conflicts of interests, if any, must be approved by the Supervisory Board and shall be mentioned in the Annual Report for the financial year in question.
The rules for conflict of interest applicable to the members of the Board of Management also apply to the members of the Supervisory Board. No conflict of interest as referred to in this section occurred during 2025.
Outside positions
Pursuant to Dutch law, a person cannot be appointed as a managing or executive director of a large Dutch company if he or she already holds a supervisory position at more than two other large Dutch companies or if he or she is the chair of the supervisory board or one-tier board of another large Dutch company. Also, a person cannot be appointed as a supervisory director or non-executive director of a large Dutch company if he or she already holds a supervisory position at five or more other large Dutch companies, whereby the position of chair of the supervisory board or one-tier board of another large Dutch company counts twice.
The acceptance by a member of the Board of Management of a position as a member of a supervisory board or a position of non-executive director in a one-tier board at another company requires the approval of the Supervisory Board. The Chair of the Supervisory Board is required to be notified of other important positions (to be) held by a member of the Board of Management. A Supervisory Board member must inform the Chair of the Supervisory Board before accepting a position outside the company.
11.6 General Meeting of Shareholders
The main rights of the General Meeting are to:
appoint, suspend and dismiss members of the Board of Management and the Supervisory Board;
adopt the remuneration policy and approve equity-based incentive plans for members of the Board of Management and adopt the remuneration of the members of the Supervisory Board;
adopt the annual accounts;
declare dividends;
discharge the members of the Board of Management and the Supervisory Board from liability in respect of the performance of their respective duties in the previous financial year;
appoint the external auditor as required by Dutch law;
adopt amendments to the Articles of Association and proposals to dissolve or liquidate the company;
issue shares or rights to shares, restrict or exclude preemptive rights of shareholders and repurchase or cancel outstanding shares; and
approve other important matters, such as major acquisitions or the sale of a substantial part of the company, as required by law.
The Annual General Meeting is held within six months after the end of each financial year to discuss the annual report and decide on the adoption of the financial statements and dividend proposal as well as the discharge of the members of the Board of Management and the Supervisory Board.
The General Meeting can be called by the Board of Management or the Supervisory Board. The Board of Management is entitled to determine the record date in accordance with Dutch law. The agenda, explanatory notes thereto and the procedure for attendance are published on the company’s website. Holders of ordinary shares in the aggregate representing at least 3% of the total issued share capital may submit proposals for the agenda of the General Meeting. Such proposals must be made in writing at least 60 days before the General Meeting to the Board of Management. Any written request must comply with the procedure stipulated by the Board of Management, which is published on the company’s website.
Each ordinary share confers the right to cast one vote at the General Meeting. There are no special statutory rights attached to the shares of the company, and no restrictions on the voting rights of the company’s shares exist. Subject to certain exceptions provided by Dutch law or the Articles of Association, resolutions of the General Meeting are passed by an absolute majority of votes cast. A resolution to amend the Articles of Association requires a simple majority of the votes cast if the resolution is adopted on a proposal of the Board of Management. Otherwise, such resolution requires a majority of at least three-fourths of the votes cast provided that the majority represents more than half of the issued share capital. Pursuant to Dutch law, no votes may be cast at a General Meeting in respect of shares which are held by the company.
Share capital and repurchase and issue of (rights to) shares
The authorized share capital of the company amounts to EUR 6 million, divided into 300 million ordinary shares with a nominal value of one eurocent each and 300 million preference shares, also with a nominal value of one eurocent each. On December 31, 2025, the issued share capital amounted to EUR 1.22 million, divided into 122,581,104 ordinary shares and no preference shares. All shares are fully paid up. The shares are in registered form. There are currently no limitations either under Dutch law or the company’s Articles of Association, as to the transfer of ordinary shares in the share capital of the company.
The Board of Management, to the extent authorized by the General Meeting for a specific period, may resolve to issue or repurchase shares, subject to the approval of the Supervisory Board. The Board of Management may limit or exclude preemptive rights if designated to do so by the General Meeting.
At the Annual General Meeting held on April 25, 2025, the General Meeting resolved to authorize the Board of Management for a period of 18 months, effective as of April 25, 2025, to issue shares or grant rights to acquire ordinary shares as well as to restrict or exclude the preemptive rights accruing to shareholders, in each case up to a maximum of 10% of the issued share capital as at April 25, 2025, and subject to approval from the Supervisory Board. At the same time, the Board of Management was authorized to acquire ordinary shares on the stock exchange or otherwise, subject to the approval of the Supervisory Board, at a price between the nominal value of the ordinary shares and 110% of the market price of the ordinary shares on Euronext Amsterdam, provided that the maximum number of ordinary shares the company may acquire and hold does not exceed 10% of the issued share capital as at April 25, 2025, plus an additional 10% of the issued capital as at that same date in connection with the execution of share repurchases for capital reduction purposes.
11.7 Stichting Continuïteit Signify
Stichting Continuïteit Signify, a foundation ('stichting') incorporated under Dutch law, has been granted a call option right to acquire preference shares in the share capital of the company. The possibility of issuing preference shares in the share capital of the company is a defensive measure. The foundation may resolve to exercise the call option at its sole discretion without the consent of the company. On the exercise of the call option, the foundation is entitled to acquire, and the company shall have the unconditional obligation to issue, preference shares up to a maximum corresponding with 100% of the issued and outstanding share capital of the company. This shall exclude the preference shares as issued and outstanding immediately prior to the exercise of the call option, less one preference share, from which maximum any preference shares already placed with the foundation at the time of the exercise of the call option must be deducted.
The call option can be exercised by the foundation in order to, for example:
prevent, slow down or otherwise complicate an unsolicited takeover bid for and an unsolicited acquisition of shares by means of an acquisition at the stock market or otherwise;
prevent and countervail concentration of voting rights in the General Meeting; and/or
resist unwanted influence by and pressure from shareholders to amend the strategy of the company.
If the foundation exercises the call option, the company issues such number of preference shares as for which the foundation exercised its call option. No preference shares had been issued as of December 31, 2025.
The foundation’s objectives are to further the interests of Signify N.V., the enterprises maintained by the company and the companies affiliated with the company in a group. The foundation will act in such a way that the interests of the company and of those enterprises are optimally safeguarded and that influences which could affect the independence, continuity or identity of the company, the enterprise maintained by the company and the companies affiliated with the company in a group in conflict with those interests are deterred to the best of the foundation’s ability.
The foundation has the right to file a petition with the Enterprise Chamber of the Amsterdam Court of Appeal to commence an inquiry procedure within the meaning of section 2:344 Dutch Civil Code.
As of December 31, 2025, the board of the foundation was composed of the following independent members: Jos Streppel (Chair), Sietze Hepkema and Jan Willem Baud.
Furthermore, it should be noted that also in the event of (an attempt at) a hostile takeover or other attempt to obtain (de facto) control of the company, the Board of Management and the Supervisory Board are authorized to exercise in the interests of Signify all powers vested in them.
11.8 Change of control
The company is not a party to any material agreement that takes effect, alters or terminates upon a change of control of the company following a take-over bid as referred to in section 5:70 of the Dutch Financial Markets Supervision Act, other than its credit agreements consisting of a revolving credit facility and term loans, the Eurobonds issued by the company and the Trade Mark License Agreement entered into with Koninklijke Philips N.V. The credit agreements include a change of control provision which allows the lenders to cancel the commitment and declare any outstanding amounts under the agreement, immediately due and payable whereupon such amounts will become immediately due and payable. The provisions applicable to all Eurobonds issued by the company contain a "Change of Control Put Event". This means that if the company experienced such an event with respect to such bonds, the company might be required to redeem or purchase the bonds at its principal amount, plus accrued and unpaid interest, if any.
11.9 External auditor
Under Dutch law, the external auditor of the company is appointed by the General Meeting. In accordance with the Dutch Corporate Governance Code and Regulation (EU) No. 537/2014, the Supervisory Board selects and nominates an external auditor for appointment, upon advice by the Audit Committee. The Supervisory Board and the Audit Committee assess the functioning of the external auditor, taking the observations from the Board of Management into account. Ernst & Young Accountants LLP (EY) was first appointed as external auditor of the company on May 13, 2016, for the financial years 2016 through 2019. On May 16, 2023, the General Meeting re-appointed EY as external auditor of the company for the financial years 2023 through 2025. In 2024, EY changed its legal form in the Netherlands from LLP to B.V. (a Dutch private company with limited liability)
At the Annual General Meeting held on May 14, 2024, the General Meeting appointed PricewaterhouseCoopers N.V. as external auditor of the company for the financial years 2026 through 2028. At the Annual General Meeting held on April 25, 2025, the General Meeting also appointed PricewaterhouseCoopers N.V. as the company’s assurance provider for 2026 through 2028.
The services provided by the external auditor are pre-approved by the Audit Committee on the basis of the annual audit services engagement agreed with the external auditor. Unless general pre-approval has been given at the beginning of the year, all proposed services require such specific pre-approval.
In principle, the external auditor attends all meetings of the Audit Committee. The findings of the external auditor, the audit approach and the risk analysis are also discussed at these meetings. The external auditor attends the meeting of the Supervisory Board at which the report of the external auditor with respect to the audit of the annual accounts is discussed, and at which the annual accounts are approved. The external auditor may also attend the Annual General Meeting to elaborate on its audit and auditor's report and is available for questions.
Auditor independence
The Audit Committee evaluates at least annually the external auditor’s independence. The lead auditor in charge of the Signify account is changed every five years; such change took place as of the start of the financial year 2021. Furthermore, EU law requires the rotation of the external audit firm after the firm has completed the statutory audit of the company for a period of 10 consecutive years. In view hereof, PricewaterhouseCoopers N.V. will succeed EY as the company’s external auditor.
Prohibition on non-audit services
The Audit Committee reviews the proposed audit scope, approach and fees as well as services that the external auditor provides to the company. Dutch law requires the separation of audit and non-audit services, meaning the company’s external auditor is not allowed to provide prohibited non-audit services.
11.10 Dutch Corporate Governance Code
The company fully endorses the underlying principles of the Dutch Corporate Governance Code, and is committed to adhering to the best practices of the Code as much as possible.
The company fully complies with the Code and applies all its principles and best practice provisions that relate to the Board of Management or the Supervisory Board.
12 Investor relations
12.1 Shareholder engagement
Signify attaches great value to maintaining an open dialog with investors and equity analysts in order to provide transparency and receive valuable feedback. The company conducts extensive investor outreach throughout the year, involving the Investor Relations department and members of the Board of Management, to ensure that the topics that matter most to shareholders can be addressed effectively.
In 2025, Signify reached over 165 unique investment institutions through its Investor Relations activities and covered 70% of its active shareholder base.
Signify has an active investor relations approach aimed at supporting the company’s long-term ambitions by keeping existing and potential shareholders well-informed about its strategy and the latest operational and financial developments. Signify publishes its financial results on a quarterly basis. In addition, the company also organizes earnings calls for research analysts and institutional investors to discuss these results. These earnings calls can be accessed and replayed on Signify's Investor Relations website. The Supervisory Board receives regular updates on share price developments, notable changes in Signify's shareholder base, feedback from investors and equity analysts, giving them a clear understanding of shareholders’ views and other relevant developments.
12.2 Shareholder base
Signify has a broad base of international shareholders, as shown in the chart below. The information is based on an independent shareholder identification analysis performed in December 2025.
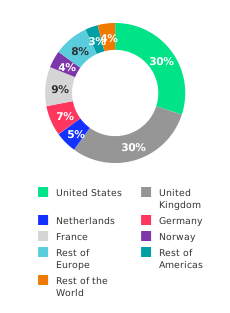
The Dutch Financial Markets Supervision Act requires institutions and individuals holding a (potential) capital and/or voting interest of 3% or more in Signify to disclose such to the Netherlands Authority for the Financial Markets (AFM). The AFM processes these disclosures in its publicly available register, which can be found at www.afm.nl. The table below includes the total interests of 3% or more registered at the AFM on December 31, 2025, and the related actual interests. |
% Actual interest1 | Total % registered2 | |
|---|---|---|
BlackRock Inc. | 7.9% | 8.4% |
Silchester International Investors LLP | 8.0% | 8.0% |
Goldman Sachs Group Inc. | 4.8% | 4.6% |
Pzena Investment Management | 3.1% | 3.1% |
T. Rowe Price Group, Inc. | 3.1% | 3.1% |
Massachusetts Financial Services Company | 3.0% | 3.0% |
Perpetual Limited | 3.0% | 3.0% |
Dimensional Fund Advisors LP | 3.0% | 3.0% |
DWS Investment GmbH | 2.9% | 3.0% |
The JP Morgan Chase & Co | 3.7% | 2.4% |
- The actual interest reflects the % registered interest, excluding potential interests, such as options, futures, forward-rate agreements and other derivatives contracts.
- The total % registered includes the actual and potential interests such as options, futures, swaps, forward-rate agreements and other derivatives contracts.
12.3 Annual General Meeting of Shareholders
The 2026 Annual General Meeting of Shareholders will be held on April 24,2026. The agenda and the explanatory notes to the agenda will be published on the company’s website. The record date for the 2026 Annual General Meeting of Shareholders is March 27, 2026, after processing all settlements of that date. People registered as shareholders in the designated register on that date, and who have registered for the meeting, will be entitled to attend and vote in the meeting.
12.4 Capital allocation
Capital allocation policy
Signify's capital allocation policy is:
Maintain a robust capital structure and maintain an investment grade credit rating;
Pay an increasing annual cash dividend per share year on year;
Continue to invest in organic and inorganic growth opportunities in line with its strategic priorities, and
Provide additional capital return to shareholders with residual available cash
Dividend policy
Signify's dividend policy is to pay an increasing annual cash dividend per share year on year. The payment of dividends, if any, and the amounts and timing thereof depend on several factors, including future sales, profits, financial conditions, general economic and business conditions and prospects. Other factors that the Board of Management may deem relevant, as well as other legal and regulatory requirements, might also impact the amount, timing and payment of future dividends. These might be beyond the control of the company.
Proposed dividend
The company proposes a dividend of EUR 1.57 per share, in cash, from the net income for full-year 2025. This is in line with its dividend policy of paying an increasing cash dividend per share year on year.
The dividend payment is subject to approval by the Annual General Meeting of Shareholders on April 24, 2026. Further details will be provided in the agenda for the AGM. Dividend in cash is, in principle, subject to 15% Dutch dividend withholding tax, which will be deducted from the dividend in cash paid to shareholders.
Ex-dividend date | April 30, 2026 |
Dividend record date | May 4, 2026 |
Dividend payment date | May 11, 2026 |
Share repurchases
Signify repurchased a total of 7,108,671 shares for a total consideration of EUR 150 million. These repurchases were made as part of the company’s repurchase program which was announced on February 4, 2025 and completed on November 28, 2025.
Signify will use 1,345,537 repurchased shares (purchase consideration of EUR 28 million) to cover obligations arising from Signify’s long-term incentive performance share plan and other employee share plans, and 5,763,134 repurchased shares (purchase consideration of EUR 122 million) were cancelled, reducing the company’s capital.
12.5 Debt info
Term loan and revolving credit facility
In July 2025, Signify entered into new long-term loan agreements consisting of EUR 325 million with maturity in August 2028. The proceeds were used to repay, mainly in August 2025, its EUR 325 million short-term loans with original maturity date in October 2025.
As of December 31, 2025, the Company had EUR 400 million of outstanding loans maturing in December 2026, and EUR 325 million long-term loans maturing in August 2028, bearing interest at a variable rate based on EURIBOR plus a fixed margin of 1.30% and 1.00% respectively. In October 2025, Signify signed a new revolving credit facility (RCF) of EUR 600 million with a five-year maturity plus two one-year extension options replacing its EUR 500 million revolving credit facility maturing in January 2027. The new revolving credit facility has similar terms compared to the previous facility.
During 2025, Signify did not draw on either revolving credit facility.
The term loans and RCF agreement include a financial covenant providing that Signify maintains a net leverage ratio of no greater than 3.5x. The net leverage ratio may temporarily increase to 4.0x within 12 months of the closing of material acquisitions. The covenant does not apply if Signify has at least one investment grade rating, which is currently the case, as Signify has two investment grade ratings.
Eurobonds
As of December 31, 2025, Signify had outstanding EUR 600 million of fixed rate notes due in May 2027 with an annual coupon of 2.375%.
Other debt
Other debt includes short-term borrowings which Signify repays ultimately within one year. Borrowings which are drawn and repaid within the same quarter, with a maturity of less than three months, are reported on a net basis in the movement of other debt.
More information about Signify's debt position can be found at https://www.signify.com/global/our-company/investors/shareholder-info/debt-info.
12.6 Share performance
Signify's share price underperformed the AEX index, the S&P capital goods index and the DJ Europe (excl. UK) technology index throughout most of 2025. In the second quarter of the year, Signify's share price showed signs of recovery, narrowing the gap with the S&P Capital goods index and the AEX index. On a full-year basis, Signify's share price underperformed all three indices.
On a full-year basis, Signify's share price declined by 3%, while the DJ Europe (excl. UK) technology index increased by 24%, the S&P capital goods index by 19%, and the AEX index by 8%.
The market capitalization at year-end 2025 was EUR 2.5 billion and Signify's free float was 98%.
12.7 Financial calendar
Report/Activity | Date |
|---|---|
Q1 2026 financial report | April 24 |
Annual General Meeting of Shareholders 2026 | April 24 |
Capital Markets Day | June 23 |
Q2 and first-half 2026 financial report | July 24 |
Q3 2026 financial report | October 23 |
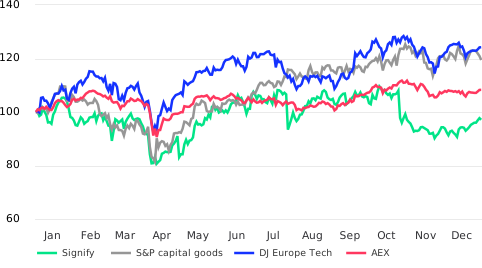
13 Risk factors and risk management
Introduction
At Signify, we recognize that taking risks is an essential aspect of entrepreneurial behavior. By deploying a structured risk management and control system, management can take risks in a controlled manner. The design and operation of our risk management and control systems as well as the key risks that the company faces are described in this chapter. | ||
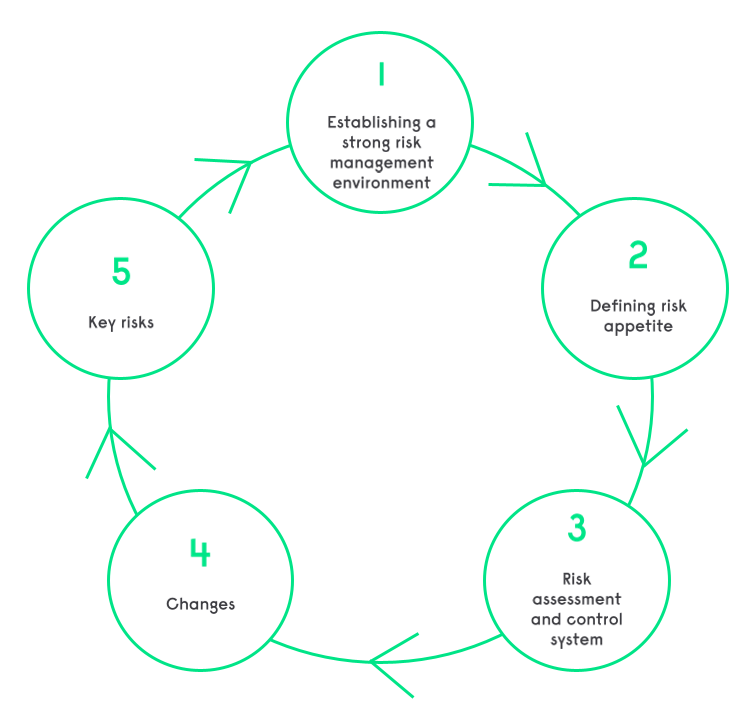 | ||
13.1 Establishing a strong risk management environment
Corporate governance
Corporate governance refers to the system by which a company is directed and controlled. Good corporate governance is supported by solid risk management and internal control systems, and by a culture grounded in high ethical standards.
The Board of Management is responsible for identifying and analyzing the risks associated with the company's strategy and activities, for defining the company's risk appetite and for resolving which measures are put in place to address the risks. The Board of Management is also responsible for establishing and maintaining adequate internal risk management and control statements. The Board of Management is assisted by the other members of its leadership team in identifying risks, designing appropriate mitigation measures and in reviewing the effectiveness thereof.
The Audit Committee and Supervisory Board provide oversight of the effectiveness of the company’s internal risk management and control systems.
An in-depth description of the company's corporate governance structure can be found in chapter 11, Corporate governance, of this Annual Report.
Risk Management
The company has designed its risk management and control systems based on the framework established by the Committee of Sponsoring Organizations of the Treadway Commission (COSO). Another key building block is the Three Lines Model. While the Three Lines Model defines roles and accountability, the COSO framework provides the basis for designing, implementing and assessing internal controls. The company continuously monitors and improves its systems, and at least once a year conducts an overall assessment.
Integrity code
Acting with integrity is the cornerstone for the success of our business and for achieving its purpose. It is integral to the values that define us as a company. Acting with integrity means making the right choices when faced with ethical dilemmas, and holding ourselves and each other to high standards of behavior.
The company’s Integrity code formulates minimum standards of behavior and applies to all employees of Signify and its subsidiaries. By setting minimum standards of behavior for our employees, the Integrity code supports in mitigating and adequately managing the company’s risks.
Whistle-blower procedures are established.
13.2 Defining risk appetite
The following risk categories are distinguished: strategic, operational, financial and reporting (including tax), and legal compliance and regulatory risks.
The Board of Management has determined the risk appetite and seeks to manage risk within these boundaries. The level of risk appetite varies across different risk categories. A higher risk appetite can be accepted to pursue strategic growth opportunities. For financial and reporting risks, and legal compliance and regulatory risks, investor commitment and stakeholder trust necessitate a more cautious approach, emphasizing prudence and acting with integrity.
The determination of the risk appetite per risk category does not ensure that a particular risk exposure remains within that risk appetite. Measures to address the risk are aimed at bringing such risks within the risk appetite determined by the company; however, these measures may prove not be effective or not sufficiently effective. The likelihood and impact of a risk may also change over time.
Strategic risks
Strategic risks often stem from market changes, competition, technology, regulations, external events, economic shifts or political developments.
Regarding strategic risks, a distinction can be made between the decision-making process on the strategy and its implementation. The risk management and control systems do not cover the decision-making on the strategy. Risks associated with the implementation of the strategy may translate into any of the other risk categories, such as operational and compliance risks. Many strategic risks are not susceptible to risk management because they are wholly or partly outside the company’s sphere of influence.
The company has a medium strategic risk appetite and is prepared to take some reasonable strategic risks, balancing the desire to capture returns from opportunities and management of the risks.
Operational risks
Operational risks include adverse unexpected developments resulting from internal processes, people and systems, or from external events that are linked to the running of each business. The company divides its operational risks into security risks and other operational risks.
For security risks, the company has defined and maintains internal security policies, such as related to cyber security, physical security and supply chain security usually based on external standards. The company has a low to moderate risk appetite for these threats, prioritizing efforts to reduce risks from both external and insider sources.
For other operational risks, the company has a moderate risk appetite. The company aims to minimize downside risks to maintain the high quality of its products, systems and services, reliable IT systems ,and sustainability commitments.
Financial and reporting risks
The company faces financial risks outside its control related to treasury, accounting and reporting, pensions, and tax. Here, the risk appetite is low to moderate. Therefore, the company aims to minimize the impact of financial risk, and it follows a conservative risk management approach in these areas.
Furthermore, the company is committed to transparent and truthful accounting and reporting. As such, the financial and reporting risk appetite is low to moderate.
Legal compliance and regulatory risks
These risks cover unanticipated failures to implement, or comply with, appropriate laws and regulations. The company is exposed to risk of fraud and other misconduct in violation of the integrity code and/or applicable laws and regulations, governmental investigation and legal proceedings in relation thereto.
In line with the Integrity code, the company has a low compliance risk appetite. The company is committed to full compliance with relevant laws, regulations, and its Integrity code and has a zero-tolerance policy towards non-compliance in these areas, and therefore acts upon (threatened) violations that it identifies.
Risk Appetite | Low | Moderate | Medium | High | |||||||||||||||||
|---|---|---|---|---|---|---|---|---|---|---|---|---|---|---|---|---|---|---|---|---|---|
Strategic | |||||||||||||||||||||
Operational: | |||||||||||||||||||||
Process, people and systems | |||||||||||||||||||||
Security | |||||||||||||||||||||
Finance & Reporting | |||||||||||||||||||||
Legal Compliance / Regulatory | |||||||||||||||||||||
13.3 Risk management and control system
The company’s risk management and control systems are designed to mitigate risks in a manner that corresponds to its risk appetite. As integral part of the design and operation of its systems, the company monitors its effectiveness and aims to continuously improve its processes and procedures.
It is important to acknowledge that no system or controls, regardless of how well it is designed and operated, can provide certainty that their objectives will be achieved. The level of certainty that they provide is influenced by, among other things, (a) inherent limitations to risk management such as reliance on certain assumptions or assessments that may later prove to be incorrect and on people that the company employs or otherwise engages with or depends on, (b) business considerations such as the company’s risk appetite and the complexity of the company’s operations, and (c) the dynamic nature of the business environment and geographies in which the company is active. Certain risks remain outside the company’s control, for example because they are caused by or dependent on third parties or external circumstances beyond the company’s influence.
Three lines model and COSO framework
The company applies two foundational approaches for its risk management and control system: the Three Lines Model and the COSO Framework.
The Three Lines Model provides clarity in roles, responsibilities, accountability, and transparency across all levels of the organization. It is designed with an objective to effectively manage risks while maintaining robust governance structures.
The company’s first line is represented by its operational management who are responsible for directly managing risks within their respective areas of responsibility. This includes identifying, assessing, and mitigating risks as part of day-to-day operations. The company’s operational management are responsible for embedding controls in business processes to address risks proactively.
The company’s second line consists of risk management, compliance functions and the business process owners. This layer provides specialized expertise, oversight, and support to enhance risk and control measures. It also evaluates the effectiveness of controls and monitors compliance with regulatory and policy requirements.
The third line is the company’s internal audit function, which provides independent assurance on the design, implementation, and performance of the control system. Internal audit assesses whether risks are adequately managed, controls are effective, and governance processes are robust. This function contributes to continuous improvement and risk mitigation efforts.
By integrating the Three Lines Model, the organization pursues that controls are appropriately designed, implemented, monitored, and independently reviewed, fostering accountability and collaboration across all levels.
The framework established by the Committee of Sponsoring Organizations of the Treadway Commission (COSO) provides a robust basis for designing, implementing, and assessing internal controls. The COSO Framework aims to enhance operational efficiency, ensure reliable reporting, and promote compliance with laws, regulations, and internal policies. By aligning the organization’s risk management and control system with the COSO Framework, the company applies a structured approach to risk management and control that supports operational, reporting, and compliance objectives.
Risk management process
The company’s risk management process is designed to identify, assess, prioritize, and mitigate risks that could impact strategic, operational, financial and reporting (including tax) or legal compliance and regulatory objectives. Since 2025, this process is supported by a companywide risk register. For each risk identified by the first and second line, the risk register reports on the potential impact and likelihood, as well as the controls and mitigation actions in place, as appropriate.
As part of the enterprise risk management process that is embedded in the annual strategic review process, the Board of Management, together with the company’s leadership team, determines the company’s key risks once a year. In identifying and reviewing key risks, inputs from the company risk register and external sources are utilized.
Key risks are prioritized based on their potential impact and likelihood, considering both quantitative and qualitative aspects. Together with the company’s leadership team, the Board of Management assesses these risks and determines appropriate mitigation actions, with the aim that the residual risks remain within the organization's risk appetite. For strategic key risks, mitigation actions target associated operational, compliance, and financial and reporting risks. The respective risk owner monitors the effectiveness of the mitigation actions throughout the year. Since the second half of 2025, a review of mitigation actions on all key risks is embedded in quarterly reviews between the company’s businesses and functions with the Board of Management. Where appropriate, adjustments or corrective actions are determined.
These quarterly business reviews also include an update on tax risks and at least once a year, the tax risks as well as any potential changes in regulations are discussed with Signify’s Board of Management and the Audit Committee of the Supervisory Board.
Control System
The control system encompasses the management system (giving structure through policies, processes and operating procedures), and detective mechanisms designed to support effective risk management, governance, and compliance with organizational objectives.
In collaboration with the other members of the leadership team, the Board of Management establishes a company management system. This system is reviewed annually by senior leadership, including the Board of Management, to monitor its ongoing relevance and effectiveness.
Adherence to various company policies that are part of the management system are reviewed in depth through dedicated boards in their respective domains, such as a security board, human rights committee and the integrity committee, reporting to or including members of the Board of Management.
The company has implemented a global standard for its detective control system, which is integrated into its management system. Tax controls are defined from our risk assessment and included in the control framework.
The responsibility for executing and documenting internal controls lies with the employees who execute these processes as part of their first line responsibilities. All reporting units can make use of the companywide available controls. The execution of key controls by material reporting units is actively monitored and reviewed by senior management.
Monitoring of key controls is conducted through self-assessments to identify deficiencies, after which corrective actions are implemented. The central internal control team, in collaboration with financial controllers and business process owners, conducts quality assessments to review the accuracy of self-assessments and identify areas for improvement. Feedback is provided to enhance the quality of process execution.
Finance also prepares a sensitivity analysis as part of the quarterly business review of financial results to highlight potential financial risks.
On an annual basis, senior management’s accountability for business controls is formalized through the issuance of a certification statement on business controls and a letter of representation. These documents are issued by businesses, reporting units, and functional management.
Review effectiveness
Annually, the Board of Management performs a systematic assessment of the design and effectiveness of its internal risk management and control systems, including whether any major failings of these systems have been observed in the year under review. The results of this assessment have been discussed with the Audit Committee, the Supervisory Board and the external auditor.
This annual assessment is based on various assessments and reviews performed within the year. In the assessment, the Board of Management evaluates whether key controls and mitigation actions are reviewed as intended within the year. Therefore, the substantiation is based on process adherence of the control activities described in this chapter, the quarterly assessment of internal controls, including certification statements, the quarterly review of strategic initiatives and mitigation actions of key risks, assessments by review boards, the quarterly review of internal audits and findings by the external auditors as well as the annual management system review.
Extracted from the intra-year assessments and reviews, the Board of Management reviews control weaknesses detected within the year from the control activities described above, together with any other control weaknesses brought to the attention of the Board of Management.
Together with the annual assessment of the effectiveness of the internal risk and control systems, the Board of Management discusses any significant changes made to these systems in the year under review and determines what the improvement areas and actions are to further strengthen the systems. These have also been discussed with the Audit Committee, the Supervisory Board and the external auditor.
The annual systematic assessment by the Board of Management serves as a substantiation of the statements on the company’s key risks and risk management and internal control systems that are included in chapter 14, Statement of the Board of Management, of this annual report.
13.4 Changes in 2025
In 2025, a companywide risk register was implemented. The documentation of the mitigation actions status of key risks was improved, thereby enhancing progress visibility. To drive effectiveness further, additional testing by the second line was implemented on the self-assessments of the detective controls.
Going forward, continuous improvement activities will focus on increasing alignment of assurance activities between the different lines of the three-lines governance model and enhancing efficiencies including automation of controls, leveraging data analytics and artificial intelligence.
13.5 Key risks
The key risks related to the company’s strategy and business are described in the table below. These risks can, separately or in combination, have a material adverse effect on Signify’s business, strategy, ability to achieve its business and sustainability objectives, financial condition, results from operations, cash flow, reputation, or prospects. The company’s risk profile did not materially change compared to last year. The key risks that the company faces did however evolve, which is reflected in the updated descriptions below.
The key risks described below represent the material risks identified by the Board of Management. However, these risks may not include all risks that ultimately affect the company. Risks and uncertainties could cause actual results to vary from those described. Additional risks and uncertainties that are not currently known to the company or currently believed not to be material may individually or cumulatively have a material adverse effect on the company’s business, strategy, ability to achieve its business and sustainability objectives, financial condition, results from operations, cash flow, reputation or prospects. The table also describes the company’s main mitigation strategies and actions deployed, which we believe will help us to manage these risks. However, the company may not be successful in effectively deploying some or all of the mitigation actions described, or the mitigation actions may not achieve the anticipated effect. If specific circumstances occur or are not sufficiently mitigated, our value creation objectives could be materially adversely affected.
The key risks below are presented by risk category: strategic, operational, finance and reporting, and legal compliance and regulatory risks. As explained in section 13.2, Defining risk appetite, many strategic risks are not susceptible to risk management because they lie, in whole or in part, outside the company’s sphere of influence. To the extent that these risks translate into operational, compliance, financial and/or reporting risks, we aim to address these with mitigation strategies and actions as summarized below.
Risk Category | Risk | Risk description | Mitigation actions | ||||
|---|---|---|---|---|---|---|---|
Strategic | Volatile macroeconomic, geopolitical and regulatory conditions | The global macroeconomic, geopolitical, and regulatory landscape remains volatile, posing significant risks to Signify's operations, sales, profitability, cash flows, and overall business resilience. Signify has commercial activities and operations in almost every country, which amplifies its exposure to macroeconomic, geopolitical, and regulatory risks. Geopolitical tensions continue to disrupt global trade and create economic uncertainty. Challenges resulting from geopolitical tensions resulted in and are further compounded by economic slowdowns in Signify’s key markets. In 2025, the company experienced adverse macroeconomic and geopolitical developments that had an adverse effect on the topline. Trade tariffs, especially on imports into the US from various countries negatively affected the lighting industry, including Signify, leading to higher costs and supply chain challenges. In addition, US trade tariffs have triggered a ripple effect, limiting access to the US market and creating overcapacity in China, with excess products flowing into Europe and other regions. Continued adverse economic, geopolitical and regulatory conditions may result in lower customer demand, increased costs and supply chain challenges, and as such may negatively affect the company’s operations, sales, profitability, cash flow and overall business resilience. | At the macro level, Signify actively engages in global forums that promote the benefits of globalization and collaborates with credible industry organizations worldwide to support the stabilization of global trade. To minimize the impact of geopolitical and economic instability, the company closely monitors and reviews (geo)political and economic developments, integrating these insights into its short- and medium-term operational planning. With this approach, Signify aims to anticipate and respond effectively to evolving challenges. To mitigate risks stemming from geopolitical tensions, trade protectionism and potential supply chain inefficiencies, Signify pursues leveraging its global manufacturing footprint and adjusting its sourcing base when necessary. With these measures the company aims to maintain operational agility and resilience in the face of shifting global trade dynamics. Specifically, to address challenges related to tariffs and supply chain disruptions, Signify employs a comprehensive strategy aimed at ensuring compliance, minimizing financial impacts, and maintaining operational stability. Mitigation actions include optimizing supply chain processes designed to increase resilience through a dual-sourcing strategy, pursuing certifications to reduce tariff burdens, negotiating cost-sharing arrangements with suppliers, and relocating production to regions with lower tariff exposure. Additionally, Signify aims to adjust pricing to safeguard profitability, and continuously reevaluates its product portfolio. | ||||
Competitive price pressure | The non-connected market has attracted many competitors, especially from Asia, offering low-priced products. This has led to the commoditization of our non-connected offerings. Heightened price pressure from competitors may negatively affect the company’s revenues, its ability to maintain market share as well as its profitability. In 2025, price pressure was further intensified by evolving market dynamics and competitive behaviors: induced by the US tariffs, Chinese overcapacity was redirected from the US market to Europe and other regions. This created additional price pressure, especially in the professional trade channels in Europe and Asia, where competition has intensified. The competitive intensity has placed additional strain on pricing strategies, demand and financial performance for the more commoditized products. | To address commoditization in the non-connected segment, Signify’s strategy includes production in cost-competitive countries, the implementation of tiered offerings, such as B-brand and private label options, and innovations in the commoditized segment to differentiate compared to competitors, including the A-class LED range. The company also focuses on savings initiatives to strengthen its competitive cost base and on commercial excellence. In general, Signify has a global sales and distribution network which is difficult for competitors to replicate. This network allows the company to quickly roll out innovative products and services on a global scale. | |||||
Technological disruptions | The lighting industry is undergoing rapid transformation driven by the high pace of innovation and the increasing importance of technologies such as artificial intelligence (AI) and the Internet of Things. Whereas these advancements bring opportunities to the company, they also present significant risks to Signify’s competitiveness and positioning, and as such may negatively impact our revenues, cost base and profitability. New technologies are reshaping the competitive landscape by enabling new entrants to rapidly develop innovative, connected solutions, and new or existing players to enhance customer experience, with lower investments in software development expertise or resources. Public and private investments in key geographies may accelerate the developments in AI and its applications for both major firms and startups, creating heightened pressure. | To mitigate risks associated with advancements in AI disrupting the lighting industry, Signify has implemented strategic measures to strengthen its competitiveness and market position. Recognizing the transformative potential of AI, Signify is strategically investing to advance AI maturity across the company by central AI development and deployment, investing in AI tools, building a community of champions, and engaging and training employees on the responsible use of AI. Furthermore, Signify is carefully monitoring the developments in the market, notably any new entrants. | |||||
Operational: process, people and systems | Lower budgets for energy efficiency and sustainability-related funds by governments | Changing government priorities, economic constraints, and broader financial challenges have led to a reduction of budget and a shift away from sustainability initiatives, including energy-efficient lighting projects. Against the backdrop of ongoing economic and geopolitical uncertainty, government spending may continue to move towards other priorities such as security, defense, and regional competitiveness. This could result in fewer funds allocated by governments to energy efficiency and sustainability projects, which may negatively impact the company’s revenues. | The company monitors shifts in governmental funding allocations and seeks to align its business strategies with governmental priorities. By engaging with policymakers, industry stakeholders, and regulatory bodies the company advocates for governmental spending in segments that may include energy efficient lighting systems, and to prioritize its offerings within those segments. The company aims to improve its capabilities, which includes training sessions and regular funnel reviews with its commercial teams, to enhance performance and identify growth prospects. | ||||
Currency risk | The company has commercial activities and operations in almost every country. It is therefore exposed to risks stemming from regulatory and documentation restrictions imposed by various countries, which could constrain the ability to repatriate cash and affect financial operations. Furthermore, currency devaluations in specific regions pose a risk to the value of cash holdings, potentially eroding financial assets. Combined, these factors may challenge the company’s financial flexibility and liquidity management and may negatively impact its ability to respond to changing market conditions or support strategic initiatives effectively. | To mitigate risks associated with regulatory restrictions and currency devaluations, the company aims to minimize working capital for each high-risk country and operating business and conduct thorough cost-benefit assessments to evaluate the feasibility of continuing operations in these countries. From a control perspective, the company regularly performs reviews of inventory levels and accounts receivable, aiming to manage and reduce working capital exposure and aiming to minimize the financial impact of potential risks. | |||||
Effects of environmental crises, climate change and natural disasters | Extreme weather events or climate hazards such as floods, storms, earthquakes, wildfires and volcanic eruptions may cause severe damage to the company’s facilities, disrupt supply chains and impede production and distribution, jeopardizing operational continuity. Additionally, these events may lead to power outages or strain on data centers, hampering essential IT systems and digital operations. As reliance on technology continues to grow, the combined effects of climate hazards and IT-related vulnerabilities may increase costs, reduce efficiency, weaken overall resilience, and threaten business continuity. | The company maintains business continuity and disaster recovery plans based on ISO 31000. As part thereof, Signify sites are required to maintain business continuity plans to mitigate the impact of large-scale disruptions. These plans include strategies such as sourcing from alternative suppliers, nearshoring production, and increasing strategic inventories to ensure operational resilience and safeguard business continuity. Regular risk assessments, trainings and tests are conducted at individual sites, focusing on risks related to climate hazards and water scarcity. The company also conducts risk assessments on business-critical supplier sites and strategic inventory locations aiming to verify and maintain resilience across the company’s supply chain. Signify actively collaborates with governments, NGOs, and other organizations to promote sustainability and climate change mitigation activities. It advocates for policies that support the adoption of energy-efficient technologies, renewable energy, and the transition to a low-carbon economy. | |||||
Operational: Security | Cyber security Risk | A successful cyber-attack could disrupt critical processes, services, and systems necessary for business continuity, potentially leading to operational disruptions, data breaches or ransom demands. Such attacks may also result in the unauthorized disclosure or theft of confidential data held by Signify. As Signify continues to enhance its digitalization efforts, the increasing interconnectivity of devices (IoT), systems, and solutions with cloud-based applications heightens cyber security risks across enterprise IT, operational technology and customer offerings. The deployment of AI technologies in cyber-attacks introduces additional risks, including adversarial attacks that manipulate algorithms with malicious inputs and insider threats from employees or third parties that could compromise security and cause significant disruptions. The cyber security threats are enhanced by the current geopolitical instability which may drive nation state cyber attacks. Cyber security risks extend beyond Signify's operations to third-party vendors, whose vulnerabilities could negatively impact Signify’s business operations and reputation. | Signify has a governance framework in place to actively manage cyber security risks. It has established a security board that reviews cyber risks on a quarterly basis, agrees on the risk appetite and prioritization. The Board of Management and Supervisory Board regularly review cyber risks and mitigation actions. The company’s security policies are based on industry standards and best practices, such as ISA/IEC62443, ISO2700x, and NIST, for the development and protection of its products, software applications and connected ecosystems. Security measures are implemented to detect and mitigate cyber-attacks, safeguarding critical data, systems, and services. Additionally, Signify maintains a security operations team, supported by a managed security service provider, for 24/7 monitoring of security events and incident response within defined Service Level Agreements. All employees must complete an annual security and data protection awareness training to enhance awareness. A vendor assurance program is set up in line with industry standards to review and ensure vendor services are not disrupted. | ||||
Legal compliance and regulatory | Export controls and sanctions | Export controls and sanctions present a multifaceted risk to business operations, compliance, and market dynamics. Government-imposed restrictions can constrain access to key markets, disrupt supply chains, and complicate financial transactions, thereby affecting operational efficiency and profitability. Additionally, the evolving nature of these controls, particularly in regions experiencing heightened geopolitical tensions, increases the complexity of navigating regulatory frameworks. Non-compliance with sanctions or export restrictions can lead to significant legal penalties, reputational harm and threat to the company brand image, interruption of critical business activities, and losing a trustworthy status with national authorities. As global geopolitical landscapes shift, these risks demand heightened vigilance and adaptability to ensure both regulatory adherence and business continuity. | To mitigate risks associated with export controls and sanctions, Signify has developed and maintains compliance measures and processes with the objective to adhere to evolving regulatory frameworks. This includes implementing screening programs to identify restricted parties and high-risk transactions, with centralized systems designed to streamline operations and allow monitoring and escalation. Deliveries to high-risk regions are subject to approval protocols with an aim to minimize exposure to legal and operational disruptions. Furthermore, tailored training and awareness initiatives have been deployed globally aiming to reinforce compliance and ensure alignment with international trade regulations. Signify invests in process automation and technology integration and is committed to further strengthen compliance capabilities and adapt to ongoing challenges in global trade. |
14 Statement of the Board of Management
The Board of Management has prepared this Annual Report in accordance with International Financial Reporting Standards (IFRS) as endorsed by the European Union (EU), the statutory provisions of Part 9, Book 2 of the Dutch Civil Code and additional Dutch disclosure requirements for annual reports. The Sustainability statement, included in this Annual Report, is prepared in accordance with the European Sustainability Reporting Standards (ESRS) pursuant to the EU Corporate Sustainability Reporting Directive (CSRD) 2022/2464/EU and with the specifications adopted pursuant to the EU Taxonomy Regulation.
To the best of our knowledge:
The Consolidated financial statements and the Signify N.V. financial statements included in this Annual Report give a true and fair view of the assets, liabilities, financial position and profit or loss of Signify N.V. and its consolidated undertakings;
Based on the current state of affairs and the company's strategic plan, which forecasts among others the company's future cash flows, it is justified that the financial reporting has been prepared on a going concern basis;
The management report included in this Annual Report gives a true and fair view concerning the position on the balance sheet date and the development and performance of the business of Signify N. V. and the undertakings included in the consolidation taken as a whole during the financial year.
The Board of Management is responsible for establishing and maintaining adequate internal risk management and control systems. During the financial year, the Board of Management has assessed the design and effectiveness of these systems, and the results have been discussed with the Audit Committee, the Supervisory Board, and the external auditor.
The Board of Management recognizes the inherent limitations of internal risk management and control systems. Whilst the company continuously works towards improving its processes and procedures, these systems cannot provide certainty that all risks have been identified or are effectively managed. The level of certainty that they provide is influenced by, among other things, inherent limitations to risk management, business considerations such as the company's risk appetite, the complexity of the company's operations, and the dynamic nature of the business environment. Certain risks remain outside the company's direct control, as they depend on third parties or external circumstances beyond the company's influence.
The key risks the company faces, the company's risk management framework and the company's risk appetite are described in chapter 13, Risk factors and risk management, of this Annual Report.
Based on its assessment and with reference to best practice provision 1.4.3 of the 2025 Dutch Corporate Governance Code, the Board of Management confirms to the best of its knowledge that:
The management report states the material risks, as referred to in best practice provision 1.2.1, and the uncertainties, to the extent that they are relevant to the expectation of the company’s continuity for a period of twelve months after the preparation of this Annual Report;
The management report provides sufficient insights into any major failings in the effectiveness of the internal risk management and control systems;
The internal risk management and control systems provide reasonable assurance that the financial reporting (including tax) included in this Annual Report does not contain material misstatements;
The internal risk management and control systems provide limited assurance that the sustainability reporting included in chapter 5, Sustainability statement, of this Annual Report do not contain material misstatements;
The internal risk management and control systems provide reasonable assurance that the sustainability reporting on our four indicators under our Brighter Lives, Better World 2025 program included in section 5.1, Brighter Lives, Better World 2025 progress of this Annual Report, do not contain material misstatements;
The Board of Management is not aware that for 2025 the internal risk management and control systems do not provide sufficient comfort that the operational and compliance risks identified in section 13.5, Key risks, of this Annual Report are effectively managed considering the company's risk appetite, where “sufficient comfort” is to be read as: comfort considering our risk appetite, the complexity of our enterprise, inherent limitations to these systems and other disclosures on these systems in our management report.
Due to inherent limitations to risk management and control systems, the above does not imply that these systems and procedures provide certainty as to the realization of strategic, operations, compliance and reporting objectives, nor that they can prevent all misstatements, inaccuracies, fraud, operational issues, and non-compliance with laws and regulations.
February 24, 2026
Board of Management
As Tempelman
Željko Kosanović
Corporate statements
15 Consolidated financial statements
Introduction
The audited Consolidated financial statements including the notes thereon have been prepared in accordance with International Financial Reporting Standards (IFRS) as adopted by the European Union (EU) and with the statutory provisions of Part 9, Book 2 of the Dutch Civil Code.
All standards and interpretations issued by the International Accounting Standards Board (IASB) and the IFRS Interpretations Committee effective 2025 have been endorsed by the EU; consequently, the accounting policies applied by Signify also comply with IFRS as issued by the IASB.
The following chapters of this Annual Report form the management report within the meaning of section 2:391 of the Dutch Civil Code:
9, Supervisory Board report, subsection 9.3.2, Corporate Governance and Nomination & Selection Committee
12, Investor Relations, section 12.2, Shareholder base, section 12.4, Capital allocation
For "Additional information" within the meaning of section 2:392 of the Dutch Civil Code, refer to section 11.1, Signify organization and chapter 17, Combined independent auditor’s report.
EY Accountants B.V. has issued an independent auditor’s report on the Consolidated financial statements and the Company financial statements, in accordance with Dutch law, including the Dutch standards on auditing, of Signify N.V., which is set out in chapter 17, Combined independent auditor’s report.
15.1 Consolidated statement of income
Consolidated statement of income in millions of EUR unless otherwise stated
For the years ended December 31
Note | 2024 | 2025 | |
|---|---|---|---|
Sales | 2 | ||
Cost of sales | ( | ( | |
Gross margin | |||
Selling, general and administrative expenses | ( | ( | |
Research and development expenses | ( | ( | |
Impairment of goodwill | 14 | ||
Other business income | 6 | ||
Other business expenses | 6 | ( | ( |
Income from operations | 3 | ||
Financial income | 7 | ||
Financial expenses | 7 | ( | ( |
Results relating to investments in associates and joint vantures | ( | ( | |
Income before taxes | |||
Income tax expense | 8 | ( | ( |
Net income | |||
Attribution of net income for the period: | |||
Net income (loss) attributable to shareholders of Signify N.V. | |||
Net income (loss) attributable to non-controlling interests | |||
Earnings per common share attributable to shareholders | 9 | ||
Weighted average number of ordinary shares outstanding used for calculation (in thousands): | |||
| |||
| |||
Net income attributable to shareholders per ordinary share in EUR: | |||
| |||
|
15.2 Consolidated statement of comprehensive income
Consolidated statement of comprehensive income in millions of EUR
For the years ended December 31
2024 | 2025 | |
|---|---|---|
Net income | ||
Pensions and other post-employment plans: | ||
| ||
| ( | ( |
Total of items that will not be reclassified to the Income statement | ||
Currency translation differences: | ||
| ( | |
| ||
Cash flow hedges: | ||
| ( | |
| ( | |
Total of items that are or may be reclassified to the Income statement | ( | |
Other comprehensive income | ( | |
Total comprehensive income | ( | |
Total comprehensive income attributable to: | ||
| ( | |
| ( |
15.3 Consolidated statement of financial position
Consolidated statement of financial position in millions of EUR
As at December 31
Note | 2024 | 2025 | |
|---|---|---|---|
Non-current assets | |||
Property, plant and equipment | 12 | ||
Goodwill | 14 | ||
Intangible assets, other than goodwill | 14 | ||
Investments in associates and joint ventures | 11 | ||
Financial assets | 27 | ||
Deferred tax assets | 8 | ||
Other assets | 19 | ||
Total non-current assets | |||
Current assets | |||
Inventories | 16 | ||
Financial assets | 27 | ||
Other assets | 19 | ||
Derivative financial assets | 27 | ||
Income tax receivable | 8 | ||
Trade and other receivables | 17 | ||
Cash and cash equivalents | 27 | ||
Assets classified as held for sale | |||
Total current assets | |||
Total assets | |||
Equity | |||
Shareholders’ equity | 21 | ||
Non-controlling interests | 11 | ||
Total equity | |||
Non-current liabilities | |||
Debt | 22 | ||
Post-employment benefits | 24 | ||
Provisions | 23 | ||
Deferred tax liabilities | 8 | ||
Income tax payable | 8 | ||
Other liabilities | 20 | ||
Total non-current liabilities | |||
Current liabilities | |||
Debt, including bank overdrafts | 22 | ||
Derivative financial liabilities | 27 | ||
Income tax payable | 8 | ||
Trade and other payables | 18 | ||
Provisions | 23 | ||
Other liabilities | 20 | ||
Liabilities from assets classified as held for sale | |||
Total current liabilities | |||
Total liabilities and total equity |
15.4 Consolidated statement of cash flows
Consolidated statement of cash flows in millions of EUR
For the years ended December 31
Note | 2024 | 2025 | |
|---|---|---|---|
Cash flows from operating activities | |||
Net income | |||
Adjustments to reconcile net income to net cash provided by operating activities: | |||
| 5 | ||
| 6 | ( | ( |
| 7 | ||
| 8 | ||
| 23 | ||
| 24 | ||
| |||
Changes in working capital: | |||
| 17 | ||
| 16 | ||
| 18 | ( | |
| ( | ||
Changes in other non-current assets and liabilities | ( | ||
Utilizations of provisions | 23 | ( | ( |
Utilizations of post-employment benefits | 24 | ( | ( |
Net interest and financing costs received (paid) | ( | ( | |
Income taxes paid | ( | ( | |
Net cash provided by (used for) operating activities | |||
Cash flows from investing activities | |||
Net capital expenditures: | ( | ( | |
| 14 | ( | ( |
| 12 | ( | ( |
| |||
Net proceeds from (cash used for) derivatives and other financial assets | ( | ( | |
Purchases of businesses and joint ventures, net of cash acquired | 10 | ( | |
Proceeds from disposition of businesses and investments in associates | |||
Net cash provided by (used for) investing activities | ( | ( | |
Cash flows from financing activities | |||
Dividend paid | ( | ( | |
Proceeds from issuance of debt | 22 | ||
Repayment of debt | 22 | ( | ( |
Transactions with minority shareholders | ( | ||
Purchase of treasury shares | 21 | ( | ( |
Net cash provided by (used for) financing activities | ( | ( | |
Net cash flows | ( | ||
Effect of changes in exchange rates on cash and cash equivalents and bank overdrafts | ( | ||
Cash and cash equivalents and bank overdrafts at the beginning of the period | |||
Cash and cash equivalents and bank overdrafts at the end of the period | 28 |
15.5 Consolidated statement of changes in equity
Consolidated statement of changes in equity in millions of EUR
Share | Share | Retained earnings | Currency translation differences | Cash flow hedges | Treasury shares | Total share-holders' equity | Non-controlling interests | Equity | |
|---|---|---|---|---|---|---|---|---|---|
Balance as at January 1, 2024 | ( | ( | ( | ||||||
Net Income | |||||||||
Other comprehensive income (loss) | |||||||||
Total comprehensive income (loss) | |||||||||
Movement in non-controlling interests | ( | ( | |||||||
Dividend distributed | ( | ( | ( | ( | |||||
Purchase of treasury shares | ( | ( | ( | ( | |||||
Delivery of treasury shares | ( | ( | |||||||
Share-based compensation plans | |||||||||
Hyperinflation adjustment | |||||||||
Balance as at December 31, 2024 | ( | ||||||||
Balance as at January 1, 2025 | ( | ||||||||
Net Income | |||||||||
Other comprehensive income (loss) | ( | ( | ( | ( | ( | ||||
Total comprehensive income (loss) | ( | ( | ( | ( | ( | ||||
Dividend distributed | ( | ( | ( | ( | |||||
Purchase of treasury shares | ( | ( | ( | ( | |||||
Cancellation of Treasury shares | ( | ( | |||||||
Delivery of treasury shares | ( | ( | |||||||
Share-based compensation plans | |||||||||
Hyperinflation adjustment | |||||||||
Balance as at December 31, 2025 | ( | ( |
The accompanying notes are an integral part of these consolidated financial statements. |
15.6 Notes to the Consolidated financial statements
In millions of EUR unless otherwise stated
1 General information
As used herein, the term Signify is used for Signify N.V. (‘the Company’) and its subsidiaries.
Basis of preparation
The Consolidated financial statements as at December 31, 2025, have been prepared in accordance with the International Financial Reporting Standards (IFRS) as endorsed by the European Union (EU) and with the statutory provisions of Part 9, Book 2 of the Dutch Civil Code. The Consolidated financial statements are prepared by the Board of Management of the Company and authorized for issue on February 24, 2026, and will be submitted for adoption to the Annual General Meeting of Shareholders on April 24, 2026. The Consolidated financial statements have been prepared on a going concern basis.
Basis of measurement
The Consolidated financial statements have been prepared on a historical cost basis, except for certain financial instruments, including derivatives (measured at fair value), assets held for sale (measured at the lower of carrying amount and its fair value less costs to sell), and defined-benefit pension plans (plan assets are measured at fair value).
Functional and presentation currency
The Consolidated financial statements are presented in euros (EUR), which is the functional and presentation currency of Signify N.V. All amounts are presented in EUR million and have been rounded to the nearest EUR million, unless otherwise stated. Due to rounding, amounts may not add up to totals provided.
Critical accounting judgments and key sources of estimation uncertainty
The preparation of the Consolidated financial statements requires management to make judgments, estimates and assumptions that affect the application of accounting policies and the reported amounts of assets, liabilities, income and expenses. These estimates inherently contain a degree of uncertainty. Actual results may differ from these estimates.
These judgments and estimates are evaluated on an ongoing basis and are based on historical experience, current and expected future outcomes, third-party evaluations and various other assumptions that are considered reasonable under the circumstances. The results of these estimates form the basis for making judgments about the carrying values of assets and liabilities, as well as identifying and assessing the accounting treatment with respect to commitments and contingencies. Signify revises material estimates if changes occur in the circumstances or if there is new information or experience on which an estimate was or can be based.
The areas where the most significant judgments and estimates are made are:
Revenue recognition - note 3, Income from operations;
Income tax and deferred tax assets including recoverability of deferred tax assets and non-current income tax payables - note 8, Income taxes;
Determination of lease term of contracts with renewal options - note 13, Leases;
Valuation of goodwill - note 14, Intangible assets;
Inventory valuation and obsolescence provision - note 16, Inventories ;
Impairment of trade receivables and contract assets - note 17, Trade and other receivables;
Provisions and insurance cover asset recoverability - note 17, Trade and other receivables and note 23, Provisions;
Employee benefit obligations - note 24, Post-employment benefits.
For further discussion on these significant judgments and estimates, reference is made to the respective notes within these Consolidated financial statements that relate to the above topics.
Climate-related matters
The impact of climate change generates opportunities as well as challenges for Signify’s existing and future lighting products and solutions portfolio. Sustainability is an integral part of Signify's strategy, aiming to address global challenges by focusing on sustainable growth areas, based on low-carbon technological innovation. Through its global leadership in energy-efficient lighting, Signify's portfolio is uniquely positioned to mitigate transition risks and capture opportunities related to climate change. In 2024, Signify released its Climate Transition Plan to reduce greenhouse gas (GHG) emissions by 90% across its entire value chain against a 2019 baseline and reach net-zero by 2040.
Signify did not identify any significant financial investment required because the plan is integrated into our current business processes and strategy. In addition, Signify did not identify any significant impacts resulting from the commitments made in this respect in the valuation of its property, plant and equipment and intangible assets (including goodwill) and did not identify any material additional provisions for environmental liabilities and risks beyond the ones already provided for.
We performed our annual double materiality assessment and climate physical and transition risk assessment (see, subsection 5.2.1, Climate change) which resulted in one material physical risk. However, based on our resilience analysis we concluded that we have no significant financial exposure in 2025.
Professional and Consumer
The Professional and Consumer businesses benefit from the global transition away from conventional lighting toward high‑efficiency LED and connected solutions. In Europe, regulatory momentum is creating an especially strong tailwind. The Clean Industrial Deal, the revised Energy Performance of Buildings Directive (EPBD), and renewed impetus on energy efficiency across both public and private sectors are setting higher performance standards and encouraging the adoption of sustainable, digitally enabled lighting technologies. Together, these trends create a multi‑year strategic opportunity for Signify, as its global product portfolio is well positioned to capture growth as customers modernize their infrastructure and accelerate their sustainability commitments.
Conventional
The conventional lamps market is expected to continue to decline in the coming years due to the ongoing adoption of LED lighting technologies and regulatory changes. While the overall conventional market continues to decline, Conventional's focus is on further increasing its leading market share in key segments and markets. The specialty lighting products see a much slower conversion rate to LED. The business continues to proactively manage its manufacturing footprint and reduce operational costs to optimize free cash flow.
Developments on climate-related matters were considered in preparing the Consolidated financial statements. Specifically, the key assumptions used in the annual goodwill impairment test for Conventional have taken into account external market assumptions, including potential phase out of products due to market conditions and legislation likely to be ratified. In the 2025 annual goodwill test, the estimated recoverable amount of Conventional exceeded its carrying value, therefore no impairment loss was recognized. For further details, refer to note 14, Intangible assets. In addition, Property, Plant and Equipment of Conventional were reviewed for impairment triggering events. Where applicable, assets were impaired to their recoverable amounts, and useful lives were adjusted accordingly.
Macroeconomic environment
The current macroeconomic environment poses risks and uncertainties which are closely monitored by Signify. Such risks, uncertainties and other important factors include but are not limited to adverse economic and geopolitical developments, supply chain disruptions, cost inflation, and the potential impact of trade tariffs. To mitigate risks, the company has taken measures and executed longer-term structural actions, such as diversifying its sourcing and manufacturing footprint.
Goodwill
The annual impairment test performed in the fourth quarter did not result in an impairment loss being recognized. The key assumptions of the goodwill impairment test include sales growth rates, EBITA and the rates used for discounting the projected cash flows. All key assumptions were updated to reflect management’s current best estimates. For further details, refer to note 14, Intangible assets.
Intangible assets, other than goodwill
Signify monitors changes in the economic environment which could indicate that the carrying amount of the asset may not be recoverable, and performs an impairment test when an impairment trigger is identified. No material impairment was identified based on the procedures performed.
Assumptions for post-employment benefits
Macroeconomic developments impacted underlying assumptions of post-employment liabilities such as interest rates and investment performance. Signify performed an updated quantification of the net defined benefit liability as at December 31, 2025, based on the most recent assumptions. Details of the underlying assumptions used can be found in note 24, Post-employment benefits.
Deferred taxes
In the context of macroeconomic developments, Signify has also assessed whether it is still probable that deferred tax assets recognized on the balance sheet will be realized. No material derecognition as a result of this assessment was recorded.
Inventories
Signify’s inventories are stated at the lower of cost or net realizable value. In determining the appropriate level of value allowance, Signify has considered the impact of the macroeconomic environment, including trade tariffs. Refer to note 16, Inventories for further disclosure.
Material accounting policies
General
The accounting policies set out below have been consistently applied by Signify to all periods presented in these Consolidated financial statements. Material accounting policies relating to specific financial statement items are included in the respective notes within these Consolidated financial statements.
Basis of consolidation
The Consolidated financial statements comprise the financial statements of Signify N.V. and all subsidiaries it controls (i.e. when it is exposed or has rights to variable returns from its involvement with the investee and has the ability to affect those returns through its power over the investee). The existence and effect of potential voting rights are considered when assessing whether the Company controls another entity. Subsidiaries are fully consolidated from the date that control commences until the date that control ceases. All intercompany balances and transactions have been eliminated in the Consolidated financial statements.
Foreign currency translation
Items included in the financial statements of each of the Signify entities are measured using the currency of the primary economic environment in which the entity operates ("the functional currency").
Foreign currency transactions are translated into the functional currency using the exchange rates prevailing at the dates of the transactions or valuation when items are re-measured. Foreign exchange gains and losses resulting from the settlement of such transactions and from the translation at year-end exchange rates of monetary assets and liabilities denominated in foreign currencies are recognized in the Consolidated statement of income, except when deferred in Other comprehensive income as qualifying cash flow hedges. The exchange differences are presented as part of Cost of sales, except for tax items and Financial income and expenses, which are recognized in the same line item as they relate to.
Upon consolidation, the assets and liabilities of non-euro entities, including goodwill and fair value adjustments at the time of the acquisition, are translated into euros at the year-end rates of exchange. The items of the statement of income of foreign activities are translated at the rates which are approximating the rates at the dates of transactions. The resulting translation differences of the net investments in foreign operations are recognized in Other comprehensive income.
Assets held for sale
Signify classifies a non-current asset (or disposal group) as held for sale if the carrying amount is expected to be recovered primarily through sale rather than through continuing use. The asset or disposal group should be available for immediate sale in its present condition, and the sale should be highly probable, evidenced by Signify's commitment to sell the asset or disposal group within one year from classification date. Signify's actions to complete the sale should demonstrate that withdrawal from the plan is unlikely. The assessment of the held for sale criteria requires judgment. Non-current assets held for sale are carried at the lower of carrying amount or fair value less cost to sell. Comparatives in the balance sheet are not changed when a non-current asset is classified as held-for-sale.
Hyperinflationary economies
When the economy of a country in which Signify operates is deemed hyperinflationary and the functional currency of a Signify entity is the currency of that hyperinflationary economy, the financial statements of such entity are adjusted so that they are stated in terms of the measuring unit current at the end of the reporting period. This involves adjustment of historical cost in purchasing power caused by inflation from the date of initial recognition to the balance sheet date. The hyperinflation adjustment is recognized directly in equity. Comparative amounts are not adjusted.
Consolidated statement of cash flows
The Consolidated statement of cash flows is prepared using the indirect method. Cash flows from derivative instruments that are accounted for as cash flow hedges are classified in the same category as the cash flows from the hedged items. Cash flows from other derivative instruments are classified consistent with the nature of the instrument. Cash flows in foreign currencies have been translated into euros using the exchange rate at the date of the cash flow. Borrowings which are repaid within the quarter, with a maturity of less than three months, are reported on a net basis in cash flows from financing activities.
Cash and cash equivalents
Cash and cash equivalents include all cash balances and short-term highly liquid investments with an original maturity of three months or less that are readily convertible into known amounts of cash. Bank overdrafts form an integral part of Signify’s cash management and often fluctuate from being positive to overdrawn and are included as a component of cash and cash equivalents for the purpose of the statement of cash flows.
Changes in accounting policy
New and amended standards adopted
Signify has applied the following amendment for the first time to its annual reporting period commencing January 1, 2025:
Amendments to IAS 21 The Effects of Changes in Foreign Exchange Rates: Lack of Exchangeability
Signify changed its accounting policies in accordance with the amendment listed above. The change did not have any significant impact on the amounts recognized in the prior period and current period.
New and amended standards not yet adopted
Several new standards or amendments to existing standards that are mandatory for reporting periods commencing on or after January 1, 2026, have been published. IFRS 18 Presentation and Disclosure in Financial Statements was issued in April 2024, replacing IAS 1 Presentation of Financial Statements. The standard will be effective on January 1, 2027. Signify is in the process of reviewing the impact of this new standard. The initial expected material impact on Signify's financial statements is as follows:
Certain items in financial income and expenses will be reclassified as "investing" or "financing" category in profit and loss;
Interest received and paid will be classified in investing and financing activities, respectively, in the statement of cash flows.
Other new standards or amendments are not expected to have a material impact on Signify in the current or future reporting periods and on foreseeable future transactions. Signify has not early adopted any of these new standards or amendments.
2 Information by segment and main country
Operating segments are components of Signify’s business activities about which separate financial information is available that is evaluated regularly by the chief operating decision maker (the Board of Management of Signify).
Signify's reportable segments are Professional, Consumer, OEM and Conventional. The reportable segments are based on customer type (Professional, Consumer, OEM), except for Conventional, which is dedicated to conventional lighting technologies.
The Professional business offers LED lamps, luminaries, connected lighting systems and services to customers in the professional segment;
The Consumer business offers LED lamps, luminaries, and connected products, including Philips Hue and WiZ, to customers in the consumer segment;
The OEM business offers lighting components to the industry;
The Conventional business offers special lighting, digital projection, and lamp electronics.
The Consumer and Professional reportable segments include operating segments, organized based on geography, which are aggregated to form the reportable segments. The aggregated operating segments are similar in respect of the nature of products, production processes, customer and distribution method. In addition, long-term gross margins relative to sales are expected at a similar level.
"Other" reflects the P&L of Signify's venture business and centrally incurred costs not allocated to the operating segments, which mainly includes costs related to exploratory research and audit activities.
The following is an overview of Signify revenues and results by segment. Sales between the segments mainly relate to the supply of goods. The pricing of such transactions is determined on an "arm’s length basis". |
Professional | Consumer | OEM | Conventional | Other1 | Inter-segment | Signify | |
|---|---|---|---|---|---|---|---|
2025 | |||||||
Sales to external customers | 3,767 | 1,274 | 355 | 327 | 42 | 5,765 | |
Sales including intersegment | 3,769 | 1,351 | 461 | 328 | 45 | (190) | 5,765 |
Depreciation and amortization2 | (84) | (32) | (11) | (8) | (56) | (192) | |
Adjusted EBITA | 334 | 135 | 17 | 53 | (27) | 511 | |
Adjusted EBITA as a % of sales | 8.9% | 10.6% | 4.8% | 16.1% | 8.9% | ||
Restructuring | (73) | ||||||
Acquisition-related charges | 7 | ||||||
Incidental items | (7) | ||||||
EBITA3 | 439 | ||||||
Amortization4 | (56) | ||||||
Income from operations | 383 | ||||||
Financial income and expenses | (61) | ||||||
Results from investments in associates and joint ventures | (1) | ||||||
Income before taxes | 321 | ||||||
2024 | |||||||
Sales to external customers | 3,933 | 1,297 | 437 | 437 | 39 | 6,143 | |
Sales including intersegment | 3,938 | 1,413 | 541 | 439 | 40 | (230) | 6,143 |
Depreciation and amortization2 | (80) | (23) | (10) | (13) | (63) | (189) | |
Adjusted EBITA | 367 | 144 | 48 | 78 | (32) | 606 | |
Adjusted EBITA as a % of sales | 9.3% | 11.1% | 11.1% | 17.9% | 9.9% | ||
Restructuring | (74) | ||||||
Acquisition-related charges | 5 | ||||||
Incidental items | 7 | ||||||
EBITA3 | 543 | ||||||
Amortization4 | (66) | ||||||
Income from operations | 477 | ||||||
Financial income and expenses | (82) | ||||||
Results from investments in associates and joint ventures | (1) | ||||||
Income before taxes | 394 |
- Considering the nature of Other, Adjusted EBITA as a % of sales for Other is not meaningful.
- Excluding amortization and impairments of acquisition-related intangible assets and goodwill.
- Income from operations excluding amortization and impairments of acquisition-related intangible assets and goodwill (“EBITA”).
- Amortization and impairments of acquisition-related intangible assets and goodwill.
The key segmental performance measure is Adjusted EBITA. Adjusted EBITA is not a recognized measure of financial performance under IFRS, and represents income from operations excluding amortization and impairments of acquisition-related intangible assets and goodwill, restructuring costs, acquisition-related charges, and other incidental items.
Incidental items of EUR 7 million for the year ended December 31, 2025 were related to environmental provision for inactive sites and discounting effect of long-term provisions (EUR 10 million loss, mainly in Professional and Other), impairment of development assets (EUR 10 million loss in Consumer), and gain on real estate transactions (EUR 14 million, in Professional).
Incidental items of EUR 7 million gain for the year ended December 31, 2024 were mainly related to the one-day FX loss from the devaluation of the Egyptian Pound by the Egyptian government (EUR 10 million, mainly in Professional), environmental provisions for inactive sites and the discounting effect of long-term provisions (EUR 7 million, mainly in Other), gains from the movements in the indemnification positions with Koninklijke Philips N.V. originating from the separation (EUR 9 million, in Other), and gain on real estate transactions (EUR 15 million, in Conventional).
The table below presents the sales, tangible and intangible assets of Signify by main countries. Signify has no external customer that represents 10% or more of total sales.
Sales | Tangible and intangible assets1 | |||
|---|---|---|---|---|
2024 | 2025 | 2024 | 2025 | |
Netherlands | 510 | 456 | 583 | 587 |
United States | 2,095 | 1,999 | 2,590 | 2,241 |
China | 381 | 372 | 264 | 232 |
Germany | 347 | 347 | 7 | 7 |
India | 265 | 261 | 49 | 31 |
Other countries | 2,544 | 2,331 | 586 | 586 |
Total countries | 6,143 | 5,765 | 4,079 | 3,683 |
- Includes goodwill.
3 Income from operations
Revenue from the sale of goods is recognized at the point in time when the customer obtains control over the goods. For standard sale of products, control generally passes to the customer when the product is delivered and accepted, depending on the delivery conditions and incoterms. For products for which a right to return exists during a defined period, revenue is recognized by considering the historical pattern of actual returns. Return policies are typically based on customary return arrangements in local markets.
Signify accounts for cloud-enabled services, extended warranties and lifecycle services as separate performance obligations. Control over these services is transferred over time and revenue is recognized, in most cases, on a straight-line basis over the duration of the service period.
The transaction price is the amount of consideration to which Signify expects to be entitled in exchange for transferring promised goods or services to a customer. The transaction price excludes amounts collected on behalf of third parties, such as sales taxes.
For contracts with multiple performance obligations, the total consideration of the contract is allocated to all distinct performance obligations in the contract based on their stand-alone selling prices. Stand-alone selling prices are determined based on other stand-alone sales transactions that are directly observable, when possible. If no direct observable prices are available, the stand-alone selling price is normally based on the expected cost plus a margin approach.
The transaction price may be variable due to discounts, rebates or similar arrangements. Revenue is only recognized for the part of the consideration for which it is highly probable that a significant reversal in the amount of cumulative revenue recognized will not occur. Judgment is required in determining the probability and level of discounts and rebates that will be granted. The estimate is updated throughout the term of the contract.
Signify does not adjust the transaction price for the effects of significant financing component if, at contract inception, it is expected that the period between customer payment and the transfer of goods or services is one year or less. This applies to most sales transactions.
Payments made to customers for distinct goods or services are excluded from revenue recognized and recorded as part of Selling, general and administrative expenses.
Signify may incur costs for obtaining a contract, including payments made to agents that depend on winning the contract. Signify applies the practical expedient from IFRS 15, allowing the incremental costs of obtaining a contract to be expensed if the associated amortization period is 12 months or less.
Signify applies accrual accounting. This means that expenses are recognized when incurred and Income is recognized when earned, irrespective of the actual cash flows.
Consideration received from customers for shipping and handling is recognized as Sales. Shipping and handling expenses related to sales to third parties are generally recorded as Selling, general and administrative expenses. When shipping and handling are distinct performance obligations, then the related expenses are recorded as Cost of sales.
Advertising and promotion costs and costs related to the brand license fee are included in Selling, general and administrative expenses.
The company has sales promotions-related agreements with distributors and retailers designed to promote the sale of products. Among the programs are arrangements under which rebates and discounts can be earned by attaining agreed upon sales levels or for participating in specific marketing programs. Management estimates the sales-related accruals associated with these arrangements based on a combination of historical patterns and future expectations regarding promotional targets to be met. Accrued customer rebates are presented as other current liabilities, unless there is a right to offset against the respective accounts receivable.
A breakdown by nature of the income (loss) from operations is as follows:
Note | 2024 | 2025 | |
|---|---|---|---|
Sales | 2 | 6,143 | 5,765 |
Cost of materials used1 | (2,472) | (2,350) | |
Employee benefit expenses | 4 | (1,757) | (1,638) |
Depreciation and amortization | 5 | (255) | (248) |
Shipping and handling | (363) | (358) | |
Advertising and promotion | (135) | (144) | |
Lease-related expenses | 13 | (30) | (26) |
Other operational costs | (691) | (650) | |
Other business income, net | 6 | 38 | 31 |
Income from operations | 477 | 383 |
- Cost of materials used includes EUR 14 million (2024: EUR 20 million) of net foreign exchange losses.
Total sales consist primarily of the sales of goods to customers (2025: 97%, 2024: 97%). Remaining sales include revenue from services, and sales- and usage-based royalties. The amount of revenue recognized for the year ended 2025, from performance obligations satisfied (or partially satisfied) in previous periods, amounts to EUR 40 million (2024: EUR 59 million).
Other operational costs contain items which are dissimilar in nature and individually insignificant in amount to disclose separately. These costs contain, among others, sales-related expenses, outsourcing services, mainly in IT and HR, third-party workers, utilities and repair and maintenance for fixed assets.
4 Employee benefit expenses
Contributions to defined-contribution plans are recognized in the Consolidated income statement in Personnel expenses as incurred.
Termination benefits are payable when employment is terminated by Signify before the normal retirement date, or whenever an employee accepts voluntary redundancy in exchange for these benefits. Signify recognizes termination benefits when they are demonstrably committed to a termination and when they have a detailed formal plan to terminate the employment of current employees without possibility of withdrawal.
Personnel expenses by nature as included in the Consolidated statement of income:
Note | 2024 | 2025 | |
|---|---|---|---|
Salaries and wages | (1,127) | (1,064) | |
Social securities | (197) | (203) | |
Defined contribution plans | (73) | (63) | |
Cost of termination plans | (61) | (57) | |
Temporary personnel | (83) | (76) | |
Share-based compensation | 25 | (31) | (20) |
Other | (185) | (155) | |
Total | (1,757) | (1,638) |
Other personnel expenses mainly relate to travel expenses, incentives and other personnel related costs. For further details on the cost of termination plans, refer to note 23, Provisions.
The average number of full-time equivalent (FTE) employees is summarized as follows:
2024 | 2025 | ||
|---|---|---|---|
Employees | 26,591 | 24,984 | |
Third-party workers | 4,228 | 3,209 | |
Total1 | 30,819 | 28,192 |
- 1,615 FTEs work in the Netherlands (2024: 1,819); the remaining FTEs work abroad.
5 Depreciation, amortization and impairment
Note | 2024 | 2025 | |
|---|---|---|---|
Property, plant and equipment | 12 | (146) | (134) |
Software | 14 | (14) | (16) |
Other intangible assets | 14 | (66) | (56) |
Product development | 14 | (28) | (41) |
Total | (255) | (248) |
6 Other business income and expenses
Other business income and expenses include gains and losses on the sale of businesses, gains and losses on the sale of property, plant and equipment, and other gains and losses not related to the company's operating activities.
2024 | 2025 | |
|---|---|---|
Disposal of businesses | 0 | 6 |
Disposal of fixed assets | 18 | 15 |
Other remaining businesses | 20 | 10 |
Other business income and expenses | 38 | 31 |
Total other business income | 41 | 35 |
Total other business expense | (3) | (3) |
In 2025, the result on disposal of businesses includes EUR 4 million income related to a prior year's disposal.
In 2025, the result on disposal of fixed assets includes EUR 14 million income from a sale of a factory in the United States, in Professional. In 2024, it mainly relates to a sale of a factory in China, in Conventional.
In 2025, the result on other remaining businesses includes EUR 7 million income from the release of a warranty provision related to balances of prior acquisitions. In 2024, it includes EUR 9 million income related to prior years acquisitions and EUR 9 million income from the movements in the indemnification positions with Koninklijke Philips N.V. originating from the separation.
7 Financial income and expenses
Interest income and expenses are recognized as they accrue, using the effective interest method.
Note | 2024 | 2025 | |
|---|---|---|---|
Interest income | 38 | 15 | |
Change in fair value of financial assets at fair value through profit or loss | 27 | 2 | 3 |
Other financial income | 2 | 4 | |
Financial income | 42 | 22 | |
Interest expense | 22 | (71) | (46) |
Interest on the net defined-benefit obligation | 24 | (14) | (9) |
Interest expense on lease liabilities | 13 | (9) | (9) |
Change in fair value of financial assets at fair value through profit or loss | 27 | (14) | (7) |
Net foreign exchange gains (losses) | (2) | (1) | |
Monetary gains (losses)1 | (4) | (3) | |
Other financial expenses | 22 | (11) | (6) |
Financial expenses | (124) | (83) | |
Financial income and expenses | (82) | (61) |
- The monetary loss relates to hyperinflation in Turkey.
8 Income taxes
Income tax comprises current and deferred tax. Income tax is recognized in the Consolidated statement of income except to the extent that it relates to items recognized directly within equity or in Other comprehensive income. Current tax is the expected tax payable on the taxable income for the year, using tax rates enacted or substantially enacted at the reporting date, and any adjustment to tax payable in respect of previous years.
Deferred tax assets and liabilities are recognized, using the balance sheet method, for the expected tax consequences of temporary differences between the carrying amounts of assets and liabilities and the amounts used for taxation purposes. Deferred tax is not recognized for the following temporary differences: the initial recognition of goodwill, the initial recognition of assets and liabilities in a transaction that is not a business combination and that affects neither accounting nor taxable profit, and differences relating to investments in subsidiaries to the extent that they probably will not reverse in the foreseeable future.
Deferred tax is measured at the tax rates that are expected to be applied to temporary differences when they reverse, based on the laws that have been enacted or substantially enacted by the reporting date.
Deferred tax assets and liabilities are offset if there is a legally enforceable right to offset current tax liabilities and assets, and they relate to income taxes levied by the same tax authority on the same taxable entity or on different tax entities, but they intend to settle current tax liabilities and assets on a net basis or their tax assets and liabilities will be realized simultaneously.
Deferred tax liabilities for withholding taxes are recognized for subsidiaries in situations where the income is to be paid out as dividend in the foreseeable future and for undistributed earnings of unconsolidated companies to the extent that these withholding taxes are not expected to be refundable or deductible.
Signify has applied the IAS 12 exception to recognize and disclose information about deferred tax assets and liabilities related to Pillar Two income taxes. Changes in tax rates are reflected in the period when the change has been enacted or substantially enacted by the reporting date.
A deferred tax asset is recognized for unused tax losses, tax credits and deductible temporary differences, to the extent that it is probable that future taxable profits will be available against which they can be utilized. The evaluation of the recoverability of deferred tax assets requires judgment about the future taxable profitability of the legal entity holding the tax loss carry forward. The ultimate realization of deferred tax assets is dependent upon the generation of future taxable income in the countries where the deferred tax assets originated and during the periods when the deferred tax assets become deductible. Management considers the scheduled reversal of deferred tax liabilities, projected future taxable income and tax planning strategies in making this assessment. A lack of future taxable profits or taxable profits below the level of current estimates may cause deferred tax assets to be impaired.
The ultimate tax effects of transactions may be uncertain for a considerable period of time, requiring management to estimate the related current and deferred tax treatments. In assessing the uncertainty, Signify considers whether it is probable that a taxation authority will accept or revise the uncertain tax treatment. Income tax payable includes liabilities for uncertain tax positions which are recognized when it is probable that tax will be due. To the extent uncertain tax positions relate to deferred tax assets, these are offset against each other. Actual tax assessments in relation to these uncertain tax positions may significantly deviate from estimates.
In determining the amount of current and deferred income tax, Signify takes into account the impact of uncertain tax positions and whether additional taxes and interest may be due. This assessment relies on estimates and assumptions and may involve a series of judgments about future events. New information may become available that causes Signify to change its judgment regarding the adequacy of existing tax liabilities; such changes to tax liabilities will impact the income tax expense in the period that such a determination is made.
The components of income tax expense were as follows:
2024 | 2025 | |
|---|---|---|
Current tax expense | (37) | (45) |
Prior year benefit (expense) | (15) | 4 |
Current tax expense | (52) | (41) |
2024 | 2025 | |
|---|---|---|
Origination and reversal of tax losses, tax credits and temporary differences | 5 | (3) |
Change in tax losses, tax credits and temporary differences recognized | (16) | (13) |
Tax rate changes | - | - |
Prior year benefit (expense) | 2 | (5) |
Deferred tax benefit (expense) | (9) | (21) |
Signify’s operations are subject to income taxes in various jurisdictions. The statutory income tax rates vary from 9% to 35%, which results in a difference between the weighted average statutory income tax rate and the Netherlands’ statutory income tax rate of 25.8% (2024: 25.8%).
A reconciliation of the weighted average statutory income tax rate to the effective income tax rate is as follows:
2024 | 2025 | |||
|---|---|---|---|---|
Income before taxes | 394 | 321 | ||
Weighted average statutory income tax rate | (100) | (25%) | (75) | (23%) |
Non-deductible expenses | (14) | (5%) | (11) | (3%) |
Tax incentives and exempt income | 22 | 6% | 23 | 7% |
Deferred tax expense related to (de)recognition of deferred tax assets - net | (16) | (4%) | (14) | (4%) |
Changes in the liability for uncertain tax positions | 62 | 16% | 11 | 3% |
Prior year tax benefit (expense) | (13) | (3%) | (1) | 0% |
Changes in tax rates | - | -% | - | 0% |
Other | (2) | (1%) | 5 | 1% |
Income tax expense recognized in Consolidated | (61) | (15%) | (62) | (19%) |
The weighted average statutory income tax rate decreased due to changes in the geographic distribution of profits.
The effective tax rate was 19% in 2025 (2024: 15%) which is below the statutory income tax rate of 25.8% in the Netherlands. The difference is primarily due to tax incentives and exempt income and changes in the liability for uncertain tax positions. Tax incentives and exempt income include a favorable foreign currency impact on income tax-related items. This is partly offset by non-deductible expenses and changes to recognition of temporary differences, which mostly represents deferred tax assets not fully recognized in the Netherlands.
Compared with 2024, the effective tax rate increased mainly because the tax benefit recognized from releases of uncertain tax positions was lower than in the prior year. In 2024, the income tax expense included a tax benefit from the resolution of tax uncertainties relating to multiple prior years in the Netherlands partly offset by a prior year tax expense in connection with this resolution.
Recognized deferred tax assets and liabilities
Assets | Liabilities | Net | |
|---|---|---|---|
2025 | |||
Intangible assets | 138 | (51) | 87 |
Property, plant and equipment | 8 | (37) | (29) |
Inventories | 37 | - | 37 |
Other receivables and assets | 23 | (1) | 22 |
Post-employment benefits | 33 | (1) | 32 |
Provisions | 41 | - | 41 |
Other liabilities | 56 | (15) | 41 |
Deferred tax assets on tax attributes1 | 107 | - | 107 |
Total allocations | 443 | (105) | 338 |
Set-off of deferred tax | (90) | 90 | - |
Net deferred tax assets | 353 | (15) | 338 |
2024 | |||
Intangible assets | 177 | (49) | 128 |
Property, plant and equipment | 11 | (33) | (22) |
Inventories | 45 | (1) | 44 |
Other receivables and assets | 32 | (13) | 19 |
Post-employment benefits | 38 | (1) | 37 |
Provisions | 45 | - | 45 |
Other liabilities | 64 | (15) | 49 |
Deferred tax assets on tax attributes1 | 74 | - | 74 |
Total allocations | 486 | (112) | 374 |
Set-off of deferred tax | (95) | 95 | - |
Net deferred tax assets | 391 | (17) | 374 |
- Tax loss carryforwards (including tax credit carryforwards)
The net deferred tax assets of EUR 338 million (2024: EUR 374 million) consist of deferred tax assets of EUR 353 million (2024: EUR 391 million) in countries with a net deferred tax asset position and deferred tax liabilities of EUR 15 million (2024: EUR 17 million) in countries with a net deferred tax liability position. An amount of EUR 21 million of deferred tax assets relates to several tax jurisdictions in which Signify has suffered a loss in the current or preceding period. Management projections support the assumption that it is probable that the results of future operations will generate enough taxable income to utilize these deferred tax assets.
Movement in deferred tax balances during 2025 and 2024 were as follows:
Balance | Recognized | Other | Balance | |
|---|---|---|---|---|
2025 | ||||
Intangible assets | 128 | (44) | 3 | 87 |
Property, plant and equipment | (22) | (8) | 1 | (29) |
Inventories | 44 | (5) | (2) | 37 |
Other receivables and assets | 19 | 3 | - | 22 |
Post-employment benefits | 37 | (4) | (1) | 32 |
Provisions | 45 | (4) | - | 41 |
Other liabilities | 49 | (2) | (6) | 41 |
Tax loss carryforwards (including tax credit carryforwards) | 74 | 43 | (10) | 107 |
Net deferred tax assets | 374 | (21) | (15) | 338 |
2024 | ||||
Intangible assets | 106 | 25 | (3) | 128 |
Property, plant and equipment | (30) | 7 | 1 | (22) |
Inventories | 50 | (8) | 2 | 44 |
Other receivables and assets | 16 | 3 | 0 | 19 |
Post-employment benefits | 49 | (12) | 0 | 37 |
Provisions | 48 | (3) | (1) | 44 |
Other liabilities | 58 | (8) | (1) | 49 |
Tax loss carryforwards (including tax credit carryforwards) | 85 | (13) | 2 | 74 |
Net deferred tax assets | 382 | (9) | 1 | 374 |
“Other” includes foreign currency translation differences and the impact of the remeasurement of the deferred tax balances relating to post-employment benefits.
At December 31, 2025, the temporary differences associated with investments, including potential income tax consequences on dividends for which no deferred tax liabilities are recognized, aggregate to EUR 271 million (2024: EUR 271 million).
At December 31, 2025, net operating loss carryforwards expire as follows:
Total | 2026 | 2027 | 2028 | 2029 | 2030 | After 2030 but not unlimited | Unlimited |
|---|---|---|---|---|---|---|---|
751 | 0 | 1 | 9 | 7 | 4 | 21 | 709 |
Unrecognized tax losses and tax credits
At December 31, 2025, the amount of operating loss and tax credit carryforwards for which no deferred tax assets have been recognized in the balance sheet was EUR 495 million (2024: EUR 497 million).
Out of EUR 495 million, an amount of EUR 455 million should not be limited in time, EUR 2 million will expire by 2026, EUR 1 million will expire by 2027, EUR 5 million will expire by 2028, EUR 6 million will expire by 2029, EUR 3 million will expire by 2030, and EUR 23 million expires after 2030, but carryforward is limited in time.
Unrecognized deductible temporary differences
At December 31, 2025, the amount of deductible temporary differences for which no deferred tax asset has been recognized in the balance sheet is EUR 173 million (2024: EUR 142 million).
Classification of the income tax payable and receivable is as follows:
2024 | 2025 | |
|---|---|---|
Income tax receivable under other current assets | 52 | 37 |
Income tax receivable under other non-current assets | 1 | 1 |
Income tax payable under current liabilities | (19) | (20) |
Income tax payable under non-current liabilities | (68) | (48) |
Global tax developments - Pillar Two
Signify is within the scope of the OECD Pillar Two model rules, and it applies the IAS 12 exception to recognize and disclose information about deferred tax assets and liabilities related to Pillar Two income taxes. Under this legislation, the group is liable to pay a top-up tax for the difference between its GloBE effective tax rate in each jurisdiction and the 15% minimum rate. For the financial year 2025, Signify can apply a transitional safe harbor in all of the jurisdictions it operates. The income tax expense related to Pillar Two was EUR nil million in 2025 (2024: EUR nil million).
Tax risks
Signify is exposed to tax uncertainties for which, if deemed probable, a liability is recognized in the income tax payable under non-current liabilities, and when tax uncertainties relate to deferred tax assets, these are offset against each other. These uncertainties include, among others, the following:
Transfer pricing uncertainties
Signify has issued transfer pricing directives, which are in accordance with international guidelines, such as those of the OECD. As transfer pricing has a cross-border effect, potential adjustments by local tax authorities on implemented transfer pricing procedures in a country may have an impact on results in another country. To reduce the transfer pricing uncertainties, monitoring procedures are carried out by Group Tax and Internal Audit to safeguard the correct implementation of the transfer pricing directives.
Tax uncertainties on general and specific service agreements and licensing agreements
Due to the centralization of certain activities in a limited number of countries (such as research and development, IT, group functions and head office), costs are also centralized. Consequently, these costs and/or revenues must be allocated to the beneficiaries, i.e. the various Signify entities. This could lead to discussions with local tax authorities if they do not accept these charges. For that purpose, service contracts such as intra-group service agreements and licensing agreements are signed with Signify group entities. Tax authorities review these intra-group service and licensing agreements and may reject the implemented intra-group charges.
Tax uncertainties due to permanent establishments
Signify may encounter tax uncertainties because of potential permanent establishments in countries where new operations are started or business models are altered. This could happen when operations in a country involve a foreign Signify organization. There is a risk that tax claims could arise on these operations in both countries.
When Signify has cross-border operations, there is a risk that tax claims will arise in all relevant countries.
Assessing the amount of tax liabilities for these tax uncertainties is highly judgmental and the timing of possible outflows, if any, is uncertain. Signify has considered the merits of its filing position in its overall evaluation of potential tax liabilities and believes it has adequate tax liabilities recorded in its Consolidated financial statements for exposures on these matters. Based on its evaluation of the potential tax liabilities and the merits of Signify's filing positions, it is unlikely that potential tax exposures over the amounts currently recorded as liabilities in its Consolidated financial statements will be material to its financial condition or future results of operations.
Tax uncertainties also include exposures with a risk assessment which are deemed lower than probable, but possible. The best estimate of the maximum amount in connection with these uncertainties is EUR 57 million (2024: EUR 55 million). Signify believes that in connection with these uncertainties it is probable that no additional taxes will be due. Therefore, no income tax payable is recognized.
9 Earnings per share
Signify presents basic and diluted earnings per share (EPS) data for its ordinary shares. Basic EPS is calculated by dividing the Net income (loss) attributable to shareholders of Signify N.V. by the weighted average number of ordinary shares outstanding during the period, adjusted for own shares held. Diluted EPS is determined by adjusting the weighted average number of ordinary shares outstanding during the period, adjusted for own shares held, for the effects of all dilutive potential ordinary shares, which comprises of restricted shares, conditional shares and performance shares granted to employees.
In millions of EUR, unless otherwise stated | 2024 | 2025 |
|---|---|---|
Net income attributable to shareholders of Signify N.V. | 328 | 254 |
Weighted average number of ordinary shares outstanding (after deduction of treasury shares) during the year | 126,221,752 | 123,089,869 |
Plus incremental shares assumed from conversions of: | ||
| 873,987 | 1,017,639 |
| 414,250 | 612,553 |
| 25,632 | 95,403 |
Diluted weighted average number of ordinary shares outstanding (after deduction of treasury shares) during the year | 127,535,620 | 124,815,464 |
Net income attributable to shareholders per ordinary share in EUR: | ||
| 2.60 | 2.06 |
| 2.57 | 2.03 |
10 Acquisitions and divestments
Business combinations are accounted for using the acquisition method. Under the acquisition method, the identifiable assets acquired, liabilities assumed and any non-controlling interest in the acquiree are recognized at the acquisition date, which is the date on which control is transferred to Signify.
Signify measures goodwill at the acquisition date as:
The fair value of the consideration transferred; plus
The recognized amount of any non-controlling interest in the acquiree; plus
If the business combination is achieved in stages, the fair value of the existing equity interest in the acquiree; less
The net recognized amount (generally fair value) of the identifiable assets acquired and liabilities assumed.
Costs related to the acquisition, other than those associated with the issue of debt or equity securities, are expensed as incurred. Non-controlling interests are measured at their proportionate share of the acquiree’s identifiable net assets at the date of acquisition.
There were no acquisitions and divestments material to the Consolidated financial statements in 2025.
11 Interests in entities
Refer to “Basis of consolidation” in note 1, General information.
Investments in subsidiaries
The Consolidated financial statements comprise the assets and liabilities of approximately 150 legal entities. Set out below is a list of material subsidiaries, in alphabetical order, representing more than 5% of either the consolidated company sales, income from operations or net income (before any intra-company eliminations). All the entities are 100% owned.
Legal entity name | Principal country of business |
|---|---|
Cooper Lighting Netherlands B.V. | Netherlands |
Cooper Lighting, LLC | United States |
Genlyte Thomas Group LLC | United States |
Signify (China) Investment Co., Ltd. | China |
Signify France | France |
Signify GmbH | Germany |
Signify Holding B.V. | Netherlands |
Signify Netherlands B.V. | Netherlands |
Signify North America Corporation | United States |
Signify Poland Sp. z.o.o. | Poland |
Signify does not have subsidiaries that have non-controlling interests that are material for its Consolidated financial statements.
Investments in associates and joint ventures
Signify has investments in several associates and joint ventures, none of which are regarded as individually material. In aggregate, the carrying amount, share of profit and other comprehensive income of the associates are shown in the Consolidated statement of financial position, Consolidated statement of income and Consolidated statement of comprehensive income.
12 Property, plant and equipment
Property, plant and equipment are measured at cost less accumulated depreciation and accumulated impairment losses. The useful lives and residual values are evaluated annually. The costs of property, plant and equipment comprise all directly attributable costs (including the cost of materials and direct labor). Government grants for assets are deducted from the cost of the related asset.
Depreciation of property, plant and equipment, other than freehold land, is calculated using the straight-line method taking into account the residual values and estimated useful lives and is primarily included in Cost of sales. Freehold land is not depreciated. Gains and losses on the sale of property, plant and equipment are included in Other business income and expense. Costs related to repair and maintenance activities are expensed in the period in which they are incurred unless leading to an extension of the original lifetime of capacity.
The expected useful lives in years of property, plant and equipment are as follows:
Building | from 5 to 50 |
Machinery and installations | from 3 to 20 |
Other equipment | from 2 to 10 |
Right-of-use assets | from 2 to 20 |
For a description of the accounting policies for asset impairment, refer to note 14, Intangible assets, which equally apply to property, plant and equipment.
Owned assets | Right-of-use assets | Property, plant and equipment | |||||||
|---|---|---|---|---|---|---|---|---|---|
Land and buildings | Machinery and installations | Other equipment | Assets under construction | Total | Land and buildings | Other equipment | Total | Total | |
Balance as at January 1, 2024 | |||||||||
Cost | 559 | 1,041 | 415 | 39 | 2,054 | 461 | 71 | 532 | 2,586 |
Accumulated amortization / impairment | (344) | (919) | (369) | - | (1,632) | (275) | (46) | (321) | (1,953) |
Book value | 215 | 122 | 46 | 39 | 422 | 186 | 25 | 211 | 633 |
Change in book value: | |||||||||
Capital expenditure | 2 | 2 | 1 | 43 | 49 | 28 | 12 | 40 | 88 |
Assets available for use | 7 | 23 | 18 | (48) | - | - | - | - | - |
Transfer to assets classified as held for sale and other disposals | (10) | (2) | (0) | 0 | (13) | 0 | (1) | (1) | (14) |
Depreciation | (24) | (34) | (18) | - | (77) | (55) | (11) | (66) | (143) |
Impairment | (3) | (1) | (0) | (0) | (4) | (1) | - | (1) | (5) |
Reversal of impairment | - | 2 | 0 | - | 2 | - | - | - | 2 |
Translation differences and other movements | 1 | 2 | (4) | 2 | 1 | 2 | 4 | 6 | 7 |
Total changes | (27) | (8) | (4) | (3) | (42) | (26) | 4 | (23) | (65) |
Balance as at December 31, 2024 | |||||||||
Cost | 535 | 1,001 | 378 | 37 | 1,950 | 492 | 85 | 577 | 2,527 |
Accumulated depreciation / impairment | (347) | (887) | (335) | - | (1,569) | (332) | (58) | (390) | (1,959) |
Book value | 188 | 114 | 43 | 37 | 382 | 159 | 27 | 186 | 568 |
Change in book value: | |||||||||
Capital expenditure | 3 | 3 | 3 | 58 | 67 | 84 | 9 | 93 | 159 |
Assets available for use | 12 | 20 | 19 | (51) | 0 | - | - | - | 0 |
Acquisitions | 0 | 0 | 0 | - | 0 | 2 | - | 2 | 2 |
Transfer to assets classified as held for sale and other disposals | (4) | (4) | (0) | (0) | (8) | (1) | (1) | (1) | (10) |
Depreciation | (20) | (27) | (18) | (0) | (65) | (52) | (11) | (63) | (127) |
Impairment | (2) | (3) | (1) | (0) | (6) | (0) | - | (0) | (6) |
Translation differences and other movements | (8) | (6) | (3) | (5) | (23) | (6) | (0) | (6) | (29) |
Total changes | (19) | (17) | (0) | 2 | (35) | 27 | (3) | 24 | (11) |
Balance as at December 31, 2025 | |||||||||
Cost | 479 | 741 | 342 | 38 | 1,601 | 481 | 92 | 572 | 2,174 |
Accumulated amortization / impairment | (311) | (644) | (300) | - | (1,255) | (295) | (67) | (362) | (1,617) |
Book value | 169 | 97 | 42 | 38 | 347 | 186 | 24 | 210 | 557 |
In 2025, the additions in land and buildings under right-of-use assets relate mostly to new real estate lease contracts, mainly in the Netherlands, Australia and the United States.
13 Leases
Signify entered into contracts that convey the right to use the identified asset and as such Signify accounted for these contracts as a lessee.
Signify recognizes right-of-use assets at the commencement date of the lease (i.e. the date the underlying asset is available for use). Right-of-use assets are initially measured at cost, less any accumulated depreciation and impairment losses, and adjusted for any remeasurement of lease liabilities. The cost of right-of-use assets includes the amount of lease liabilities recognized, initial direct costs incurred, and lease payments made at or before the commencement date less any lease incentives received. The recognized right-of-use assets are depreciated on a straight-line basis over the shorter of its estimated useful life and the lease term. Right-of-use assets are subject to impairment.
Signify applies the short-term lease recognition exemption to its short-term leases for real estate (i.e. those leases that have a lease term of 12 months or less from the commencement date and do not contain a purchase option). It also applies the lease of low-value assets recognition exemption to leases of office equipment that are considered of low value. Lease payments on short-term leases and leases of low-value assets are recognized as an expense on a straight-line basis over the lease term.
Signify determines the lease term as the non-cancellable term of the lease, together with any periods covered by an option to extend the lease if it is reasonably certain to be exercised, or any periods covered by an option to terminate the lease, if it is reasonably certain not to be exercised. When determining the lease term, Signify considers all relevant facts and circumstances that create an economic incentive to exercise an extension option, or not to exercise a termination option. These circumstances include Signify’s strategic plans, the industrial footprint of Signify and divisions and the importance of the site to Signify’s operations.
The carrying amounts, depreciation charge and additions to right-of-use assets are disclosed in note 12, Property, plant and equipment. The movements of the related lease liabilities are disclosed in note 22, Debt. For maturity analysis on lease liabilities, refer to note 27, Financial risk management.
The following are the amounts recognized in profit or loss and cash flow:
Note | 2024 | 2025 | |
|---|---|---|---|
Short-term lease expenses | 3 | (21) | (19) |
Low value lease expenses | 3 | (9) | (7) |
Interest expense on lease liabilities | 7 | (9) | (9) |
Repayment of lease liabilities | 22 | (71) | (66) |
Total cash outflow for leases | (110) | (102) |
14 Intangible assets
The measurement of goodwill at initial recognition is described under the Business combinations accounting policy in note 10, Acquisitions and divestments. Goodwill is subsequently measured at cost, less accumulated impairment losses.
The fair value of other intangible assets, which mainly consist of customer relations, brand names and technology-based intangibles acquired through business combinations is determined using a valuation technique that estimates the fair value of an asset based on market participants' expectations of the cash flows associated with that asset over its remaining useful life. Acquired finite-lived intangible assets are amortized using the straight-line method over their estimated useful life. The useful lives are evaluated annually. Intangible assets are initially capitalized at cost, with the exception of intangible assets acquired as part of a business combination that are capitalized at their acquisition-date fair values.
Expenditure on development activities, whereby research findings are applied to a plan or design for the production of new or substantially improved products and processes, is capitalized as an intangible asset when Signify can demonstrate that: the product or process is technically and commercially feasible, the costs can be reliably measured, Signify has sufficient resources and the intention to complete the development.
The development expenditure capitalized comprises all directly attributable costs (including the cost of materials and direct labor). Other development expenditures and expenditures on research activities are recognized in the Consolidated statement of income. Capitalized development expenditure is stated at cost less accumulated amortization and impairment losses. Amortization of capitalized development expenditure is charged to the Consolidated statement of income on a straight- line basis over the estimated useful lives of the intangible assets in Research and development expenses.
Amortization of other intangible assets is reported in Selling, general and administrative expenses for brand names and customer relationships and in Cost of sales for technology-based and other intangible assets.
The expected useful lives in years of intangible assets excluding goodwill are as follows:
Product development | from 2 to 5 |
Software | from 3 to 10 |
Technology | from 2 to 20 |
Customer relations | from 5 to 20 |
Brand names | from 5 to 20 |
Other | from 2 to 10 |
Goodwill and intangible assets not yet ready for use are not amortized but tested for impairment annually and whenever impairment indicators require impairment testing. Signify performed and completed annual impairment tests in the last quarter of the financial year. Judgment is required when analyzing impairments triggers and tests of goodwill and intangible assets not yet ready for use. These analyses are based on the estimation of the recoverable amount. The review for impairment is carried out at the level where cash flows occur that are independent of other cash flows.
An impairment loss is recognized in the Consolidated statement of income whenever and to the extent that the carrying amount of a cash-generating unit exceeds the unit’s recoverable amount, which is the greater of its value in use and fair value less costs of disposal.
Property, plant and equipment and finite-lived intangible assets are reviewed for impairment whenever events or changes in circumstances indicate that the carrying amount of the asset may not be recoverable. Recoverability of assets to be held and used is assessed by a comparison of the carrying amount of an asset with the greater of its value in use and fair value less costs of disposal. Value in use is measured as the present value of future cash flows expected to be generated by the asset. If the carrying amount of an asset is deemed not recoverable, an impairment charge is recognized in the amount by which the carrying amount of the asset exceeds the recoverable amount. The review for impairment is carried out at the level where cash flows occur that are independent of other cash flows.
Impairment losses recognized in prior periods are assessed at each reporting date for any indications that the loss has decreased or no longer exists. An impairment loss is reversed if and to the extent there has been a change in the estimates used to determine the recoverable amount. The loss is reversed only to the extent that the asset’s carrying amount does not exceed the carrying amount that would have been determined, net of depreciation or amortization, if no impairment loss had been recognized. Reversals of impairment are recognized in the Consolidated income statement.
The cash flow projections used in the value in use calculation for the annual impairment test for goodwill require significant judgment and estimations, which are further disclosed in this note.
Goodwill | Customer relationships | Technology based | Brand names | Product development | Software | Other | Total | |
|---|---|---|---|---|---|---|---|---|
Balance as at January 1, 2024 | ||||||||
Cost | 3,466 | 1,034 | 354 | 393 | 205 | 103 | 38 | 5,594 |
Accumulated amortization / impairment | (711) | (730) | (300) | (249) | (124) | (62) | (21) | (2,199) |
Book value | 2,755 | 304 | 54 | 144 | 81 | 41 | 17 | 3,396 |
Change in book value: | ||||||||
Additions | - | - | - | - | 41 | 7 | 2 | 49 |
Amortization | - | (36) | (16) | (12) | (27) | (14) | (3) | (107) |
Acquisitions | - | - | - | - | - | - | - | - |
Impairment | - | - | - | - | (2) | - | (0) | (2) |
Translation differences and other movements | 148 | 15 | 1 | 8 | 2 | 0 | 0 | 174 |
Total changes | 148 | (21) | (15) | (4) | 15 | (7) | (1) | 115 |
Balance as at December 31, 2024 | ||||||||
Cost | 3,641 | 1,082 | 367 | 412 | 251 | 109 | 40 | 5,902 |
Accumulated depreciation / impairment | (737) | (798) | (329) | (272) | (155) | (75) | (24) | (2,391) |
Book value | 2,903 | 283 | 39 | 140 | 96 | 34 | 16 | 3,511 |
Change in book value: | ||||||||
Additions | - | - | - | - | 47 | 19 | 0 | 66 |
Amortization | - | (26) | (16) | (11) | (29) | (13) | (3) | (99) |
Acquisitions | 10 | - | - | - | - | - | - | 10 |
Impairment | - | - | - | - | (12) | (3) | (0) | (15) |
Translation differences and other movements | (299) | (28) | (1) | (15) | (5) | (5) | 5 | (348) |
Total changes | (288) | (54) | (16) | (26) | 1 | (2) | 1 | (385) |
Balance as at December 31, 2025 | ||||||||
Cost | 3,301 | 976 | 339 | 370 | 273 | 121 | 44 | 5,424 |
Accumulated amortization / impairment | (687) | (747) | (317) | (256) | (176) | (89) | (26) | (2,298) |
Book value | 2,615 | 229 | 22 | 114 | 96 | 31 | 18 | 3,126 |
Goodwill
Goodwill as of December 31, 2025, was EUR 2,615 million. During the year ended December 31, 2025, a translation difference of EUR 296 million was mainly due to the change in the USD/EUR rate, which impacted the goodwill denominated in USD.
For impairment testing, goodwill is allocated to cash-generating units, which represent the lowest level at which the goodwill is monitored internally for management purposes. The cash-generating units correspond to the operating segments.
Goodwill allocated to the cash-generating unit Professional (main geographies) is considered to be significant in comparison to the total book value of goodwill of Signify at December 31, 2025. The goodwill allocated to each of the cash-generating units as of December 31, 2024, and December 31, 2025, is presented below.
In millions of EUR | 2024 | 2025 |
|---|---|---|
Professional (main geographies) | 2,379 | 2,124 |
Consumer (main geographies) | 144 | 133 |
Other1 | 380 | 358 |
Book value | 2,903 | 2,615 |
- Represents operating segments with a lower goodwill balance
The basis of the recoverable amount used of the cash-generating units is the value in use. In the annual impairment test performed in the fourth quarter of 2025, the estimated recoverable amount of the tested cash-generating units exceeded the carrying value of the units. Therefore, no impairment loss was recognized.
The key assumptions used in the impairment tests were the sales growth rates and the discount rates applied to the projected cash flows, while EBITA reflects the combined effects of sales growth and cost measures. These cash flow projections cover an initial period with specific estimates from 2026 to 2028. Projections were extrapolated with declining growth rates for a period of five years, after which a terminal value was calculated. The sales growth rates and EBITA used to estimate cash flows are based on past performance, external market growth assumptions, taking into account current market conditions, and industry long-term growth averages. The applied discount rates are determined based on the weighted average cost of capital, which reflects the risks relevant to the cash-generating units. These estimates inherently contain a degree of uncertainty as they relate to future events. Actual results may differ from these estimates.
EBITA (excluding impact for uncommitted restructurings) assumed for Professional (main geographies) is expected to increase over the projection period due to volume growth, positive sales mix and cost efficiencies. Cash flow projections for the impairment tests in 2025 and 2024 were based on the key assumptions included in the table below:
Compound sales growth rate1 | ||||
|---|---|---|---|---|
Initial period | Extrapolation period | Used to calculate terminal value | Pre-tax discount rates | |
Professional (main geographies) 2025 | (0.1)% | 1.8% | 0.5% | 11.3% |
Professional (main geographies) 2024 | n.a. | 2.0% | 0.5% | 11.0% |
- Compound sales growth rate is the annualized steady growth rate over the forecast period.
Based on the annual impairment test of Professional (main geographies), the estimated recoverable amount exceeds the carrying amount by approximately EUR 300 million. The following changes could, individually, cause the value in use to fall to the level of the carrying value, with all other assumptions held constant:
Key assumption | Deviation |
|---|---|
Compound sales growth rate – initial period | Decrease of more than 3 percentage points |
Compound sales growth rate – extrapolation period | Decrease of more than 4.5 percentage points |
Pre-tax discount rate | Increase of more than 0.9 percentage point |
Terminal growth rate | Decrease of 1 percentage point |
Other intangible assets
The additions for 2025 contain internally generated assets of EUR 47 million for product development and EUR 19 million for software.
The capitalized product development costs and software, for which amortization has not yet commenced, amounted to EUR 61 million as of December 31, 2025 (December 31, 2024: EUR 54 million).
As of December 31, 2025, the carrying amount of the customer relationships originating from the Cooper Lighting acquisition was EUR 202 million with a remaining amortization period of 14.8 years (2024: EUR 245 million; 15.8 years).
15 Objectives, policies and processes for managing capital
Signify generated cash flows from operating activities of EUR 531 million in 2025. During 2025, the total cash position decreased by EUR 12 million and gross debt increased by EUR 25 million.
In line with its commitment to maintain a robust capital structure and an investment grade credit rating, as of December 31, 2025, the net leverage ratio was 1.5x (December 31, 2024: 1.3x).
Signify manages free cash flow performance by continuous structural working capital initiatives and gradual costs optimization, including post-merger integration costs related to previous acquisitions.
Signify is subject to certain debt covenants, for details refer to note 22, Debt.
Free cash flows for the year ended December 31, 2025, and comparative information are presented below:
2024 | 2025 | |
|---|---|---|
Cash flows from operating activities | 514 | 531 |
Cash flows from investing activities | (72) | (110) |
Cash flows before financing activities | 442 | 421 |
Cash flows from operating activities | 514 | 531 |
Net capital expenditures: | ||
| (48) | (64) |
| (51) | (68) |
| 22 | 40 |
Free cash flows | 438 | 440 |
Working capital position as at December 31, 2025, and comparative information are presented below:
2024 | 2025 | |
|---|---|---|
Inventories | 1,035 | 929 |
Trade and other receivables1 | 1,018 | 848 |
Trade and other payables | (1,588) | (1,363) |
Other working capital items | (43) | (85) |
Working capital | 422 | 329 |
- Excludes insurance receivables of EUR 45 million (2024: EUR 48 million) for which a legal provision is recognized for the same amount.
16 Inventories
Inventories are stated at the lower of cost and net realizable value. The cost of inventories comprises all costs of purchase, costs of conversion and other costs incurred in bringing the inventories to their present location and condition. The costs of conversion of inventories include direct labor and fixed and variable production overheads, considering the stage of completion and the normal capacity of production facilities. Costs of idle facility and abnormal waste are expensed. The cost of inventories is determined using the first-in, first-out (FIFO) method. On each reporting date, management performs an analysis of net realizable values and determines the lower of cost and net realizable value to measure its inventories. The write-down is included in Cost of sales.
Due to price erosion and technological developments, inventory valuation requires forward-looking estimates on future sales levels, future price erosion and related expected gross margin percentages.
2024 | 2025 | |
|---|---|---|
Raw materials and components | 406 | 328 |
Finished goods | 629 | 601 |
Total | 1,035 | 929 |
The write-down of inventories to net realizable value amounted to EUR 42 million for the year ended December 31, 2025 (2024: EUR 44 million), which includes EUR 3 million (2024: EUR 5 million) related to restructuring programs.
17 Trade and other receivables
A financial asset is recognized when Signify becomes a party to a contract that is a financial instrument. Regular way purchases and sales of financial instruments are accounted for at the trade date. Initial measurement of financial assets and liabilities is at fair value. Dividend income is recognized when declared. After initial recognition, these financial assets are measured at amortized cost using the effective interest method, less loss allowance and net of discounts given or agreed to, if the offset requirements are met.
A financial asset (or, where applicable, a part of a financial asset or part of a group of similar financial assets) is primarily derecognized when:
The rights to receive cash flows from the asset have expired; or Signify has transferred its rights to receive cash flows from the asset or has assumed an obligation to pay the received cash flows in full without material delay to a third party under a "pass-through" arrangement;
and either (a) Signify has transferred substantially all the risks and rewards of the asset, or (b) Signify has neither transferred nor retained substantially all the risks and rewards of the asset but has transferred control of the asset.
When Signify has neither transferred nor retained substantially all of the risks and rewards of the asset, nor transferred control of the asset, Signify continues to recognize the transferred asset to the extent of its continuing involvement. In that case, Signify also recognizes an associated liability. The transferred asset and the associated liability are measured on a basis that reflects the rights and obligations that Signify has retained.
Financial assets arising from insurance contracts are only recognized when it is virtually certain that reimbursement will be received if Signify settles the obligation. Signify recognizes the reimbursement as a separate financial asset.
Signify estimates lifetime expected loss allowance for all Trade receivables and Contract assets via calculating the expected credit losses. Trade receivables and contract assets are grouped based on shared credit risk characteristics and the days past due whereby the lifetime expected credit loss on the Trade receivables is recognized based on a matrix model calculated per country, which utilizes historical recoverability data and default probability per country.
As soon as individual trade accounts receivable can no longer be collected in a normal course of business and are expected to result in a loss, they are designated as doubtful trade accounts receivable and valued at the expected collectible amounts. They are written off when they are deemed to be uncollectable because of bankruptcy or other forms of receivership at the debtors. Any previously recognized expected loss is offset against the carrying amount of such trade receivable and the difference is taken as a loss accounted for within Selling, general and administrative expenses.
2024 | 2025 | |
|---|---|---|
Trade receivables | 966 | 805 |
Other receivables | 100 | 89 |
Total receivables, net of value allowance | 1,066 | 894 |
The aging of trade receivables, representing current and overdue, net of loss allowance, is as follows:
2024 | 2025 | |
|---|---|---|
Current | 917 | 760 |
Overdue 1-30 days | 27 | 18 |
Overdue 31-180 days | 22 | 27 |
Overdue >180 days | - | - |
Trade receivables, net | 966 | 805 |
The changes in loss allowance for accounts receivable are as follows:
2024 | 2025 | |
|---|---|---|
Balance as at January 1 | (83) | (78) |
Additions charged to expense | (3) | (3) |
Utilizations | 9 | 4 |
Translation differences and other movements | (2) | 5 |
Balance as at December 31 | (78) | (73) |
As per December 31, 2025, the loss allowance for accounts receivable included allowances for individually impaired receivables of EUR 67 million (2024: EUR 72 million).
18 Trade and other payables
Trade and other payables are initially measured at fair value and subsequently at amortized cost. Trade payables are derecognized when the contractual obligation is either discharged, cancelled or expired.
The Company classifies financial liabilities that arise from supplier finance arrangement within Trade and other payables in the statement of financial position if they have a similar nature and function to trade payables. This is the case if the supplier finance arrangement is part of the working capital used in the Company’s normal operating cycle, the level of security provided is similar to trade payables and the terms of the liabilities that are part of the supply chain finance arrangement are not substantially different from the terms of trade payables that are not part of the arrangement.
Cash flows related to liabilities arising from supplier finance arrangements that are classified in Trade and other payables in the consolidated statement of financial position are included in operating activities in the consolidated statement of cash flows.
2024 | 2025 | |
|---|---|---|
Payables to suppliers | 1,042 | 915 |
Amounts payable to employees | 171 | 120 |
Customer rebates and refunds related | 176 | 146 |
Marketing and sales related | 72 | 59 |
Materials and fixed assets related | 47 | 46 |
Other payables | 79 | 77 |
Trade and other payables | 1,588 | 1,363 |
Certain Signify suppliers factor their trade receivables from Signify with third parties through supplier finance arrangements. As of December 31, 2025, approximately EUR 136 million (2024: EUR 149 million) of the Signify accounts payable were known to have been sold onward under such arrangement, of which suppliers have received payments for EUR 120 million (2024: EUR 149 million). The liabilities under supplier finance arrangements are due on average 124 days (2024: 117 days) after invoice date, while comparable trade payables that are not part of the supplier finance arrangements are due on average 123 days (2024: 118 days) after invoice date.
Signify continues to recognize these liabilities as Payables to suppliers and will settle the liabilities in line with the original payment terms of the related invoices.
19 Other assets
Contract assets mostly comprise of unbilled positions, where Signify has, partially or in full, satisfied performance obligations but not yet billed the customer. These are recorded under either Other current assets or Other non-current assets. The contract assets are transferred to receivables when the rights become unconditional, which is mostly when the customer is billed. For accounting policy on the impairment of contract assets, refer to note 17, Trade and other receivables.
2024 | 2025 | |
|---|---|---|
Contract assets | 41 | 35 |
Indirect taxes | 55 | 34 |
Prepayments | 43 | 50 |
Other assets | 35 | 21 |
Total | 173 | 140 |
From which current | 147 | 112 |
From which non-current | 26 | 28 |
20 Other liabilities
Contract liabilities, recorded under Other current liabilities and Other non-current liabilities, consist of customer payments received in advance, for which Signify still needs to satisfy (part of) the performance obligations. Contract liabilities mainly consist of recurring services performance obligations, such as extended warranties, life-cycle services and cloud-enabled services as well as advances for projects.
2024 | 2025 | |
|---|---|---|
Contract liability | 224 | 208 |
Other tax liabilities | 79 | 76 |
Other liabilities | 39 | 72 |
Total | 342 | 356 |
From which current | 196 | 201 |
From which non-current | 145 | 155 |
Out of the total amount of EUR 224 million recognized in contract liabilities at the end of 2024 (2023: EUR 226 million), EUR 41 million has been recognized as revenue for the year ended December 31, 2025 (2024: EUR 55 million). The non-current portion of contract liabilities is recognized over time over the duration of the contract, generally beyond 1 and up to 15 years.
21 Equity
Ordinary shares are classified as equity. Incremental costs directly attributable to the issuance of shares are recognized as a deduction from equity. Dividends are recognized as a liability in the period in which they are declared. The income tax consequences of dividends are recognized when a liability to pay the dividend is recognized.
Treasury shares that are reacquired are recognized at cost, representing the market price on the acquisition date, and deducted from equity until the shares are cancelled or reissued. When reissued, shares are removed from treasury shares on a first-in, first-out (FIFO) basis. When treasury shares are delivered under Signify’s share plans, the difference between the market price of the shares delivered and the cost is recorded in retained earnings, the market price is recorded in share premium. Upon cancellation, treasury shares are deducted from the share capital at their nominal value of EUR 0.01 per share and retained earnings for the difference.
Costs including dividend withholding tax in connection with Signify’s purchase of treasury shares for capital reduction purposes are recorded in retained earnings.
Share capital
The Company has an authorized share capital of EUR 6 million, divided into 300,000,000 ordinary shares with a nominal value of EUR 0.01 per share and 300,000,000 preference shares with a nominal value of EUR 0.01 per share.
On December 31, 2025, the issued and fully paid share capital consisted of 122,581,104 ordinary shares with a nominal value of EUR 0.01 per share (2024: 128,344,238).
As a defense measure, Stichting Continuïteit Signify, a foundation organized under the laws of the Netherlands, has been granted the right to acquire preference shares in the Company. As of December 31, 2025, this right had not been exercised therefore no preference shares have been issued.
Dividend distribution
A proposal will be submitted to the 2026 Annual General meeting of Shareholders to pay a dividend of EUR
In May 2025, the Company distributed a dividend of EUR
Treasury shares
The following table shows the movements in the outstanding number of shares over the last two years:
2024 | 2025 | |
|---|---|---|
Balance as at January 1 | 126,315,101 | 126,169,871 |
Purchase of treasury shares | (513,800) | (7,202,664) |
Delivery of treasury shares | 368,570 | 575,442 |
Balance as at December 31 | 126,169,871 | 119,542,649 |
The following table shows the share transactions to cover obligations arising from share-based compensation plans (for further details refer to note 25, Share-based compensation):
2024 | 2025 | |
|---|---|---|
Shares acquired | 513,800 | 1,439,530 |
Average market price | EUR 26.29 | EUR 20.36 |
Amount paid | EUR 14 million | EUR 29 million |
Shares delivered | 368,570 | 575,442 |
Average price (FIFO) | EUR 45.57 | EUR 43.72 |
Cost of delivered shares | EUR 17 million | EUR 25 million |
Total shares in treasury at year-end | 2,174,367 | 3,038,455 |
Total cost | EUR 78 million | EUR 83 million |
In January 2025, the company announced a share repurchase program in line with its capital allocation policy. The repurchase program in 2025 included an allocation to cover share-based remuneration obligations, with the remainder allocated for the cancellation of shares.
The following table shows the transactions that took place to reduce share capital in 2025. There were no transactions in 2024.
2024 | 2025 | |
|---|---|---|
Shares acquired | - | 5,763,134 |
Average market price | - | EUR 21.26 |
Amount paid | - | EUR 122 million |
Cancellation of treasury shares (number of shares) | - | 5,763,134 |
Cancellation of treasury shares (cost) | - | EUR 122 million |
Legal reserves
In accordance with the Dutch Civil Code and statutory requirements in other countries, in certain circumstances legal reserves need to be established. Legal reserves are not available for distribution to the Company’s shareholders. The currency translation reserve, cash flow hedging reserve and other reserves included in retained earnings include non-distributable amounts. If any reserve has a negative balance, distributions to shareholders are restricted to the extent of the negative amount.
The total distributable reserves as at December 31, 2025, amounted to EUR 2,405 million (2024: EUR 2,777 million). For further details of legal reserves, see note D, Shareholders' equity, in chapter 16, Signify N.V. financial statements.
22 Debt
Debt is initially measured at fair value net of directly attributable transaction costs. Subsequently, debt is measured at amortized cost using the effective interest rate method. Debt is derecognized when the obligation under the liability is discharged, cancelled or has expired.
Lease liabilities are measured at the present value of lease payments to be made over the lease term, discounted using the incremental borrowing rate. Lease payments include (in-substance) fixed payments (less any lease incentives), variable lease payments that depend on an index or a rate, the exercise price of a purchase option reasonably certain to be exercised and payments of penalties for terminating a lease. Lease liabilities increase to reflect the accretion of interest and decrease for the payments made. Lease liabilities are remeasured if there is a modification or reassessment of the lease.
2024 | 2025 | |
|---|---|---|
Term loan (EUR) | 724 | 724 |
Eurobonds | 597 | 599 |
Lease liabilities | 207 | 227 |
Other debt | 23 | 29 |
Subtotal | 1,553 | 1,578 |
Bank overdrafts | 1 | 0 |
Gross debt | 1,553 | 1,579 |
Cash and cash equivalents | (633) | (621) |
Net debt (cash) | 920 | 957 |
Total equity | 3,267 | 2,767 |
Net debt and total equity | 4,187 | 3,725 |
Net debt divided by net debt and total equity (in %) | 22% | 26% |
Total equity divided by net debt and total equity (in %) | 78% | 74% |
Movements of debt were as follows:
Term loans | Eurobonds | Lease liabilities | Other debt | Bank overdrafts | Total | |
|---|---|---|---|---|---|---|
Balance as at January 1, 2024 | 704 | 1,271 | 237 | 18 | - | 2,230 |
Acquisitions | - | - | - | - | - | - |
Financing cash flows: | ||||||
| 504 | - | - | 10 | - | 513 |
| (488) | (675) | (71) | (4) | - | (1,238) |
Translation differences | 5 | - | 2 | - | - | 6 |
Other movements1 | (0) | 2 | 40 | - | 1 | 42 |
Balance as at December 31, 2024 | 724 | 597 | 207 | 23 | 1 | 1,553 |
From which current | 325 | - | 67 | 23 | 1 | 416 |
From which non-current | 399 | 597 | 140 | - | - | 1,137 |
Balance as at January 1, 2025 | 724 | 597 | 207 | 23 | 1 | 1,553 |
Acquisitions | - | - | 2 | - | - | 2 |
Financing cash flows: | ||||||
| 325 | - | - | 34 | - | 359 |
| (325) | - | (66) | (26) | - | (417) |
Translation differences | - | - | (10) | (2) | - | (13) |
Other movements1 | - | 1 | 94 | - | (0) | 95 |
Balance as at December 31, 2025 | 724 | 599 | 227 | 29 | 0 | 1,579 |
From which current | 400 | - | 60 | 29 | - | 489 |
From which non-current | 324 | 599 | 167 | - | - | 1,090 |
- Other movements mainly include additions of leases which are non-cash transactions.
Term loans and revolving credit facility
In July 2025, Signify entered into new long-term loan agreements consisting of EUR 325 million with maturity in August 2028. The proceeds were used to repay mainly in August 2025 its EUR 325 million short-term loans with original maturity date in October 2025.
As of December 31, 2025, the Company had EUR 400 million of outstanding loans maturing in December 2026, and EUR 325 million long-term loans maturing in August 2028, bearing interest at a variable rate based on EURIBOR plus a fixed margin of 1.30% and 1.00% respectively. In October 2025, Signify signed a new revolving credit facility (RCF) of EUR 600 million with a five-year maturity plus two one-year extension options replacing its EUR 500 million revolving credit facility maturing in January 2027. The new revolving credit facility has similar terms compared to the previous facility.
During 2025, Signify did not draw on either revolving credit facility.
The term loans and RCF agreement include a financial covenant providing that Signify maintains a net leverage ratio of no greater than 3.5x. The net leverage ratio may temporarily increase to 4.0x within 12 months of the closing of material acquisitions. The covenant does not apply if Signify has at least one investment grade rating, which is currently the case, as Signify has two investment grade ratings.
Eurobonds
As of December 31, 2025, Signify had outstanding EUR 600 million of fixed rate notes due in May 2027 with an annual coupon of 2.375%.
Lease Liabilities
Signify entered into new lease contracts mainly related to real estate in the Netherlands, Australia and the United States.
Other debt
Other debt includes short-term borrowings which Signify repays ultimately within one year. Borrowings which are drawn and repaid within the same quarter, with a maturity of less than three months, are reported on a net basis in the movement of other debt.
23 Provisions
Provisions are recognized if, as a result of a past event, Signify has a present legal or constructive obligation, it is probable that an outflow of economic benefits will be required to settle the obligation and a reliable estimate can be made of the amount of the obligation. Provisions are measured at the present value of the expenditures expected to be required to settle the obligation using a pre-tax discount rate that reflects current market assessments of time value of money. The increase in the provision due to passage of time is recognized as interest expense. Significant judgment is required in determining the amount and probability of resources outflow and discount rates used to calculate the present value of this outflow. A liability is recognized if the timing and amount of the settlement can be reliably estimated.
The accounting and presentation for some of Signify’s provisions is as follows:
Environmental provisions - Measurement of liabilities associated with environmental obligations is based on current legal and constructive requirements. The carrying amount of environmental provisions is regularly reviewed and adjusted for new facts and changes in law;
Restructuring related provisions - The provision for restructuring relates to the estimated costs of programs that are planned and controlled by management that materially change the scope of Signify's business or the manner in which it is conducted. A provision is recognized when Signify has a detailed formal plan for the restructuring and has raised a valid expectation that it will carry out the restructuring by starting to implement the plan, or by announcing the plan's main features to those affected by it;
Product warranty - A provision for product warranty is recognized at the time of revenue recognition and reflects the estimated costs of replacement and free-of-charge services that will be incurred by Signify with respect to the products. The provision is based on historical warranty data and a weighing of possible outcomes against their associated probabilities. Manufacturing of Signify’s products involves complex processes and defects might occur. In addition, it is possible that some of Signify’s products may not perform as expected (for example, in terms of estimated life span and projected energy savings). These defects or shortfalls may cause Signify to incur significant warranty, support and replacement costs;
Legal provisions – Liabilities and expected insurance recoveries, if any, are recorded separately. Balances are transferred to Other liabilities when the amount and timing of cash flows are no longer uncertain;
Onerous contract provisions - Provisions are recognized for a contract if it is onerous. The present obligation under the contract is measured and recognized as a provision. An onerous contract is a contract under which the unavoidable costs of meeting the obligations under the contract exceed the economic benefits expected to be received under it.
By their nature, the recognition and measurement of provisions involve the use of estimates and assumptions regarding the timing and the amount of outflows of resources. The main areas requiring significant estimation are as follows:
Estimates for environmental remediation may change significantly due to the emergence of additional information regarding the extent or nature of the contamination, the need to utilize alternative technologies, actions by regulatory authorities as well as changes in judgments and discount rates. Signify is exposed to environmental risks, mainly because it has been in the business of manufacturing products for more than a century. During that period, Signify has opened, discontinued and acquired many manufacturing plants and sites. Some of these plants and sites have been used for industrial purposes for decades and as such, there is a latent risk that these premises may have environmental conditions that require corrective actions as a result of such use. The environmental provisions include accrued costs recorded with respect to environmental remediation in various countries.
Provisions for product warranty reflect the estimated costs of replacement and free-of-charge services that will be incurred by Signify with respect to products sold.
Signify and certain of its group companies are involved in legal proceedings and claims relating to various matters including commercial transactions, alleged intellectual property infringement and product liability claims for property damage and personal injury, alleged to have been caused by failure or malfunction of Signify products. The outcome of asserted claims and proceedings, or the impact of any claims that may be asserted in the future, cannot be predicted with certainty. Provisions for legal claims are recognized when it is probable that an outflow of resources will be required to settle an obligation, taking into account the advice from internal and external counsels, and a reliable estimate of the amount can be made.
Restruct-uring | Environ-mental | Product warranty | Legal | Other | Total | |
|---|---|---|---|---|---|---|
Balance as at January 1, 2024 | 121 | 99 | 103 | 50 | 95 | 470 |
Acquisitions | - | - | - | - | - | - |
Additions | 69 | 11 | 45 | 2 | 13 | 141 |
Utilizations | (133) | (14) | (52) | (1) | (15) | (215) |
Reclassifications | 0 | (1) | 0 | (0) | (0) | (1) |
Releases | (12) | (0) | (9) | (2) | (3) | (26) |
Changes in discount rate | - | (1) | - | - | 0 | (0) |
Accretion | - | 4 | - | 2 | 1 | 7 |
Translation differences and other movements | 0 | 1 | 4 | 3 | 2 | 10 |
Balance as at December 31, 2024 | 46 | 100 | 91 | 55 | 93 | 384 |
Short-term | 34 | 45 | 44 | 48 | 22 | 192 |
Long-term | 12 | 56 | 47 | 6 | 71 | 192 |
Balance as at January 1, 2025 | 46 | 100 | 91 | 55 | 93 | 384 |
Acquisitions | - | - | 0 | - | 0 | 0 |
Additions | 59 | 14 | 42 | 2 | 12 | 129 |
Utilizations | (54) | (15) | (48) | (0) | (15) | (132) |
Reclassifications | 1 | (0) | - | (0) | (1) | (0) |
Releases | (5) | (1) | (10) | (0) | (6) | (23) |
Changes in discount rate | - | (2) | - | - | 0 | (2) |
Accretion | - | 3 | - | 3 | 1 | 7 |
Translation differences and other movements | (1) | (4) | (7) | (6) | (4) | (22) |
Balance as at December 31, 2025 | 46 | 95 | 66 | 53 | 80 | 341 |
Short-term | 41 | 18 | 30 | 47 | 20 | 156 |
Long-term | 5 | 77 | 36 | 6 | 60 | 185 |
Restructuring
During the year ended December 31, 2025, additions to restructuring provision included programs in Professional, Other (mainly in Belgium) and Conventional (mainly in Belgium). Utilizations of restructuring provision included payments related to restructuring programs in Professional and Conventional (mainly in Belgium).
Environmental
Signify expects the provision will be mainly utilized within the next five years.
Product warranty
Signify expects the provision will be mainly utilized within the next two years.
Legal
The legal provisions were mainly related to the legal case as described below. Signify expects the provision will be mainly settled within a year.
On October 5, 2022, a jury in trial court in Connecticut awarded compensation of USD 90 million in a lawsuit against Signify relating to a workplace accident that occurred in September 2017 in a warehouse leased and operated by a Signify customer, where the customer's employee was injured when struck by a pallet of Signify products that was pushed off a storage rack by a temporary worker operating a forklift at the warehouse. In Q1 2023, the court issued an order reducing the jury’s damages award (as allocated to Signify) to approximately USD 42 million.
Signify continues to exercise all its rights to appeal the verdict issued in this case. Signify's appeal to the Connecticut Appellate Court, challenging its liability in this matter, is currently pending.
Signify has comprehensive global liability insurance and has confirmation that the case is fully covered without reservations of rights, including interest and other costs. Both the legal provision and the insurance cover asset have been adjusted in the balance sheet as per year end without any net profit and loss impact.
Other
Other provisions mainly comprise provisions for onerous contracts, other taxes, self-insurance, decommissioning and provision for employee jubilee funds. Other provisions are expected to be utilized mainly within the next five years.
24 Post-employment benefits
Signify’s retirement benefit obligation is calculated by an independent actuary, using the projected unit credit method. This calculation is performed separately for each plan by estimating the amount of the benefit that employees have earned in relation to their past services. The measurement date for all defined benefit plans is December 31. For plans with a relatively low defined-benefit obligation, Signify may decide to calculate the defined-benefit obligation with a lower frequency. The liability recognized in the Consolidated statement of financial position is the present value of these benefits at the end of the reporting period (defined-benefit obligation) less the fair value of plan assets. The defined-benefit obligation is determined by discounting the estimated future cash flows using a discount yield curve of high-quality corporate bonds with durations matching the terms of the benefits.
Pension costs in respect of defined benefit post-employment plans primarily represent the increase of the actuarial present value of the obligation for post-employment benefits based on employee service during the year. The increase in the defined-benefit obligation due to the passage of time and the expected return on plan assets, using the same interest rate as for the defined-benefit obligation, are included in the pension costs. Interest on the net defined-benefit obligation is recognized in Financing income and expenses in the Consolidated statement of income.
Past-service costs are recognized immediately in the Personnel costs in the Consolidated statement of income. Actuarial gains and losses arising from experience adjustments and changes in actuarial assumptions are charged or credited to equity via other comprehensive income in the period in which they arise.
When a plan is changed, settled or when a plan is curtailed, the resulting change in the defined-benefit obligation that relates to past-service or the gain or loss on curtailment is recognized immediately in the Consolidated statement of income. Signify recognizes gains and losses on the settlement of a defined-benefit plan when the settlement occurs.
Signify presents all net defined-benefit post-employment obligations on one line within non-current liabilities on the Consolidated statement of financial position.
The valuation of defined benefit obligations is based on actuarial calculation that require specific assumptions, which are disclosed in this note.
Post-employment benefits covered in this note relate to defined-benefit pension and other post-retirement benefit plans, including defined-benefit retiree medical plans. The benefits provided by these plans are based on employees’ years of service and compensation levels. Employee post-employment defined-benefit plans have been established in several countries in accordance with the legal requirements, customs and local practice.
Net defined-benefit liabilities per country
2024 | 2025 | |||||
|---|---|---|---|---|---|---|
Obligation | Plan assets | Net Liability | Obligation | Plan assets | Net Liability | |
Germany | 154 | (15) | 139 | 141 | 15 | 126 |
United States | 51 | - | 51 | 35 | - | 35 |
Other Countries | 112 | (47) | 65 | 106 | 43 | 63 |
Total Countries | 317 | (62) | 255 | 282 | 58 | 224 |
United States
Signify has an unfunded pension plan in place for higher salaried employees with a net liability of EUR 13 million and a post-retirement welfare plan with a net liability of EUR 22 million. Signify expects cash outflows of EUR 4 million in 2026 for the unfunded plans.
Germany
For employees with a salary above a certain salary threshold, there is a funded defined-benefit pension plan which has a deficit of EUR 4 million. This plan has been closed for new entrants since January 1, 2018. Since 2016, Signify no longer makes any contributions to this plan but funds the liabilities when these are paid out to retirees. New employees accrue pension benefits through a defined-contribution plan. For other closed defined-benefit plans, Signify had an unfunded liability of EUR 122 million as at December 31, 2025. Signify expects cash outflows of EUR 15 million in 2026 for the pension plans. Cash outflows for the defined-benefit plans in countries other than the USA and Germany are expected to total EUR 11 million in 2026.
Risks related to defined-benefit plans
The defined-benefit plans expose Signify to various demographic and economic risks, such as longevity, investment, currency and interest rate risks and, in some cases, inflation risk. The latter plays a role in the assumed wage increase and in some plans with pension indexation.
The larger plans are governed by either independent boards, committees or trustees who have a legal obligation to evenly balance the interests of all stakeholders and operate under the local regulatory frameworks. These bodies are responsible for and have full discretion over the investment strategy of the plan assets; in general they manage pension fund risks by diversifying the investments of plan assets and by (partially) matching interest rate risk of liabilities.
Signify has an active de-risking strategy in which it constantly looks for opportunities to reduce the risks associated with its defined-benefit plans.
Movements of net defined-benefit liability
2024 | 2025 | |||||
|---|---|---|---|---|---|---|
Obligation | Plan assets | Net Liability | Obligation | Plan assets | Net Liability | |
Balance as at January 1, 2024 | 705 | (383) | 322 | 317 | (62) | 255 |
Service Costs | 9 | - | 9 | 6 | - | 6 |
(Negative) past service cost | (1) | - | (1) | 2 | - | 2 |
Admin expenses paid | - | 3 | 3 | - | - | - |
Settlements | (2) | - | (2) | - | - | - |
Plan amendments | (1) | (1) | (1) | - | (1) | |
Recognized in employee benefit expenses | 4 | 3 | 7 | 7 | - | 7 |
Interest (cost)/income | 19 | (6) | 13 | 10 | (2) | 8 |
Included in Statements of Income | 23 | (3) | 21 | 17 | (2) | 15 |
Actuarial gains/(losses) | 0 | 0 | 0 | |||
| - | - | - | - | - | - |
| (11) | (1) | (13) | (3) | 2 | (1) |
| 2 | - | 2 | (2) | - | (2) |
Exchange rate differences | 4 | (7) | (2) | (8) | 1 | (7) |
Included in Statements of comprehensive income | (5) | (8) | (13) | (13) | 3 | (10) |
Employee contributions | 1 | (1) | - | 1 | (1) | - |
Employer contributions | - | (44) | (44) | - | (4) | (4) |
Benefits paid: | 0 | |||||
| (30) | (30) | (25) | 0 | (25) | |
| (52) | 52 | - | (8) | 8 | - |
Reclassification | (1) | - | (1) | (7) | - | (7) |
Derecognition | (324) | 324 | - | - | ||
Other | (406) | 331 | (75) | (39) | 3 | (36) |
Balance as at December 31 | 317 | (62) | 255 | 282 | (58) | 224 |
During 2025, US interest rates decreased by some 49 bps and this has been reflected in lower discount rates. For the Eurozone, the interest rates were some 47bps higher at 31 December than the year before. As such, the unfunded defined benefit plans in the US and the German plans experienced respectively losses and gains on the financial assumptions.
Plan assets allocation
The plan assets at 31 December 2025 consisted of 90% unquoted assets, mainly related to insurance contracts. The remaining 10% of plan assets was invested in debt securities EUR 3 million and equities EUR 2 million. Plan assets in 2025 did not include property occupied by, or financial instruments issued by Signify.
At 31 December 2024, plan assets mainly related to insurance contracts.
Assumptions
The mortality tables used for Signify’s major schemes are:
US: Base table PRI-2012 White Collar mortality table, projected forward with future mortality improvements according to Scale MP-2021;
Germany: Richttafeln 2018 G K. Heubeck.
The weighted averages of the assumptions used to calculate the defined-benefit obligation as of December 31, 2025, are shown in the table below. The assumptions for pension cost, healthcare cost, and wage increases are only relevant for a limited number of plans.
2024 | 2025 | |
|---|---|---|
Discount rate | 4.6% | 4.7% |
Pension cost increases | 1.0% | 1.0% |
Healthscare cost increases | 1.1% | 0.9% |
Wage increases | 2.3% | 2.5% |
The average duration of the defined-benefit obligation of the defined-benefit plans is 7.4 years.
For the defined-benefit plans in the US and Germany, the average duration is respectively 6.4 years and 6.7 years. The average discount rates for the plans in these countries are respectively 4.9% and 3.8%. The pension cost increase rate assumption for the German defined-benefit plans is 2.0%.
Sensitivity analysis
The table below illustrates the approximate impact on the defined-benefit obligation if Signify were to change key assumptions. The defined-benefit obligation was recalculated using a change of 1% in the respective assumptions which overall is considered a reasonably possible change. The impact on the defined-benefit obligation of changes in discount rate is for funded plans normally accompanied by offsetting movements in plan assets, especially when using matching strategies.
2024 | 2025 | |
|---|---|---|
Increase | ||
Discount rate (1% movement) | (23) | (19) |
Wage change (1% movement) | 3 | 4 |
Pension indexation change (1% movement) | 8 | 10 |
Longevity (see explanation) | 9 | 8 |
Healthcare cost change (1% movement) | 2 | 3 |
Decrease | ||
Discount rate (1% movement) | 25 | 22 |
Wage change (1% movement) | (5) | (3) |
Pension indexation change (1% movement) | (7) | (9) |
Longevity (see explanation) | (12) | (7) |
Healthcare cost change (1% movement) | (2) | (2) |
Longevity also impacts the post-employment defined-benefit obligation which is illustrated in the above sensitivity table for the impact of a 10% increase and a 10% decrease in the assumed rates of mortality for Signify’s major schemes. A 10% decrease in assumed mortality rates equals improvement of life expectancy by six months to a year. Vice versa, an increase in the assumed mortality rates equals a reduction of life expectancy.
25 Share-based compensation
The cost of equity-settled transactions is determined by the fair value at the grant date using an appropriate valuation model.
The grant-date fair value of equity-settled share-based payment awards granted to employees is recognized as personnel expense, with a corresponding increase in equity, over the vesting period of the award. The cumulative expense recognized for equity-settled transactions at each reporting date reflects Signify’s best estimate of the number of equity instruments that will ultimately vest.
Service and non-market performance conditions are not considered when determining the grant date fair value of awards, but the likelihood of the conditions being met is assessed as part of Signify’s best estimate of the number of equity instruments that will ultimately vest. Market performance conditions are reflected within the grant date fair value.
No expense is recognized for awards that do not ultimately vest because non-market performance and/or service conditions have not been met. Where awards include a market or non-vesting condition, the transactions are treated as vested irrespective of whether the market or non-vesting condition is satisfied, provided that all other performance and/or service conditions are satisfied.
The total share-based compensation costs for the period ended December 31, 2025, amounted to EUR 20 million (period ended December 31, 2024: EUR 31 million).
Long-term Incentive Plan
Under the Signify Long-term Incentive Plan (LTIP), which is equity settled, eligible employees are granted both conditional and performance shares. Conditional shares have a three-year cliff vesting period and will vest if a grantee is still employed with Signify at the vesting date.
Vesting of performance shares is conditional on the achievement of performance conditions measured over a period of three years. The performance condition measurement is based on four measures, each one of them with an equal weight of 25% of the shares:
Total shareholder return (TSR);
Free cash flow (FCF);
Sustainability;
Return on capital employed (ROCE).
For the Board of Management and certain members of senior management, the LTIP consists of performance shares only. Shares are conditionally granted annually.
In addition to shares awarded under the Signify LTIP, Signify may in individual cases, such as in the hiring process of members of (senior) management, also grant restricted shares. Restricted shares have either a three-year cliff vesting period or vest gradually over the vesting period of one, two or three years.
Under the terms of the employee stock purchase plan (ESPP), employees are eligible to purchase a limited number of Signify shares at discounted prices through payroll withholdings.
Performance shares
The fair value of shares granted with the market performance condition of relative TSR is measured based on Monte Carlo simulation. The closing share price at grant date is adjusted for the present value of expected dividends during the vesting period, as participants are not compensated for Signify dividend payouts. Monte Carlo simulation takes into account market conditions expected to impact relative Total Shareholders’ Return performance in relation to selected peers and the following weighted-average assumptions:
2025 | |
|---|---|
Risk-free interest rate | 1.8% |
Expected share price volatility | 32.0% |
The assumptions were used for these calculations only and do not necessarily represent an indication of Signify management’s expectation of future developments for other purposes. Historic volatility was measured over the same timeframe as the simulation period (weighted average 2.6 years).
The amount calculated as an expense for TSR shares is not adjusted for actual performance.
FCF, Sustainability, and ROCE related measurements are non-market performance conditions. Fair value of shares granted under FCF, Sustainability, and ROCE objective conditions equals the closing share price on the grant date, adjusted for the present value of expected dividends during the vesting period.
The amount calculated as an expense for shares granted with a non-market performance condition is adjusted for actual performance.
A summary of Signify performance shares movements and outstanding balance is presented below.
2024 | 2025 | |||
|---|---|---|---|---|
EUR-denominated | Shares | Weighted average grant-date fair value | Shares | Weighted average grant-date fair value |
Balance as at January 1 | 674,102 | 29.68 | 1,617,228 | 24.73 |
Granted | 678,141 | 22.02 | 850,282 | 16.08 |
Vested | (167,301) | 45.25 | (366,947) | 32.90 |
Forfeited | (149,062) | 27.47 | (242,312) | 20.92 |
Performance adjustment | 581,348 | 28.77 | (54,327) | 28.58 |
Balance as at December 31 | 1,617,228 | 24.73 | 1,803,923 | 19.39 |
The performance adjustment originates from updates in the number of shares which are expected to vest in relation to the mentioned non-market performance conditions.
On December 31, 2025, estimated unrecognized costs related to non-vested performance shares amounted to EUR 14 million. These costs are expected to be recognized over a weighted-average period of 1.8 years.
Conditional shares
Fair value of conditional shares is determined by subtracting the present value of expected dividends from the closing share price on the grant date as participants are not compensated for Signify dividend payouts.
A summary of Signify conditional shares movements and outstanding balance is presented below.
2024 | 2025 | |||
|---|---|---|---|---|
EUR-denominated | Shares | Weighted average grant-date fair value | Shares | Weighted average grant-date fair value |
Balance as at January 1 | 724,544 | 31.16 | 949,269 | 24.38 |
Granted | 470,520 | 22.43 | 602,756 | 15.07 |
Vested | (175,908) | 46.26 | (191,763) | 32.88 |
Forfeited | (69,887) | 26.45 | (102,688) | 21.10 |
Balance as at December 31 | 949,269 | 24.38 | 1,257,574 | 18.89 |
On December 31, 2025, estimated unrecognized costs related to non-vested conditional shares amounted to EUR 10 million. These costs are expected to be recognized over a weighted-average period of 1.8 years.
Restricted shares
Fair value of restricted shares is determined by subtracting the present value of expected dividends from the closing share price on the grant date as participants are not compensated for Signify dividend payouts.
In 2025, Signify granted 172,806 restricted shares with weighted average grant date fair value of EUR 15.52.
On December 31, 2025, estimated unrecognized costs related to non-vested restricted shares amounted to EUR 3 million. These costs are expected to be recognized over a weighted-average period of 1.8 years.
26 Information on remuneration
Signify considers the Board of Management and the Supervisory Board to be key management personnel as defined in IAS 24 "Related parties".
In 2025, the total remuneration costs relating to the members of Key Management amounted to EUR 6,380,167 (2024: EUR 6,333,856).
Remuneration of the Board of Management
In 2025, the total remuneration costs relating to the members of the Board of Management amounted to EUR 5,675,667 (2024: EUR 5,573,855).
2024 | 2025 | |
|---|---|---|
Salary/Base compensation | 2,440,202 | 2,171,378 |
Annual incentive1 | 699,388 | 805,300 |
Long-term equity-based Incentive2 | 1,691,436 | 1,014,417 |
Pension allowances | 474,718 | 434,016 |
Pension scheme costs | 116,276 | 88,472 |
Other compensation3 | 132,496 | 116,861 |
Termination benefits4 | 19,339 | 1,045,223 |
Total costs | 5,573,855 | 5,675,667 |
- Related to the performance in the year reported which is paid out in the subsequent year.
- Costs of performance shares are based on accounting standards (IFRS) and do not reflect the value of the shares at the vesting/release date. The performance share costs for E. Rondolat reflect a pro rata forfeiture of the 2024 grant, and for H. Chitale a forfeiture of the 2024 and 2025 grant, as explained in more detail in section 10.2, Remuneration Board of Management.
- Mainly concern (part of) allowances to members of the Board of Management that can be considered as remuneration. In a situation where such a part of an allowance can be considered as (indirect) remuneration (for example, private use of the company car), then such part is both valued and accounted for here. The method employed by the fiscal authorities in the Netherlands is the starting point for the value stated. Net allowances are not included.
- E. Rondolat stepped down from the Board of Management per the April 2025 AGM and his services contract ended per October 31, 2025. As per his services contract (which is published on the company’s website), he will receive a lump sum payment of one time the annual base compensation/salary (gross amount of EUR 1,045,223), which was payable in October 2025. Also explained in more detail in section 10.2, Remuneration Board of Management.
For further information on remuneration costs, see chapter 10, Remuneration report.
Remuneration of the Supervisory Board
The remuneration costs of the members of the Supervisory Board amounted to EUR 704,500 (2024: EUR 760,001).
2024 | 2025 | |
|---|---|---|
Membership | 523,125 | 495,000 |
Committees | 166,876 | 162,000 |
Other compensation1 | 70,000 | 47,500 |
Total costs | 760,001 | 704,500 |
- Relates to the allowance for (inter-)continental travel.
27 Financial risk management
The classification and subsequent measurement of financial assets and liabilities depends on Signify’s business model for managing the financial assets and liabilities, the contractual terms of the cash flows and the solely payments of principal and interest (SPPI) test. Signify performs the analysis on an instrument-by-instrument basis. Financial assets and liabilities are classified into one of the following categories:
Financial assets at amortized cost: The business model for these instruments is to hold them to collect contractual cash flows. This financial asset category mainly consists of Trade and other receivables;
Financial assets at fair value through profit or loss (FVTPL): The business model for these instruments is to hold them for trading. This financial asset category mainly consists of Signify's participations in Virtual Power Purchase Agreements and other Derivatives;
Financial assets at fair value through other comprehensive income (FVOCI): The business model for these instruments is to hold them to collect contractual cash flows and to sell them. Fair value gains and losses are subsequently not reclassified to profit or loss following the derecognition of the investment. This category consists of minor equity investments;
Financial liabilities at fair value through profit or loss mainly consists of Derivatives and Contingent consideration in a business acquisition, to which IFRS 3 applies. Contingent consideration is subsequently measured at fair value with changes recognized in profit or loss;
All financial liabilities except for financial liabilities at fair value through profit and loss are classified and subsequently measured at amortized cost. This financial liability category primarily consists of Debt and Trade and other payables.
Signify presents financial assets and financial liabilities on a gross basis as separate line items in the Consolidated statement of financial position, unless the offset criteria are met.
The offsetting criteria are met if Signify has a legal right to offset financial assets with financial liabilities and if Signify intends either to settle on a net basis or to realize the asset and settle the liability simultaneously. To meet the requirement, the right of set-off should be available today and not contingent on a future event and it should be legally enforceable for all counterparties in a normal course of business, as well as in the event of default, insolvency or bankruptcy.
At inception of the hedge relationship, Signify documents the economic relationship between hedging instruments and hedged items including whether changes in the cash flows of the hedging instruments are expected to offset changes in the cash flows of hedged items. Signify documents its risk management objective and strategy for undertaking its hedge transactions.
For foreign currency forwards, Signify designates the spot component of the change in fair value in cash flow hedge relationships. The spot component is determined with reference to the relevant spot market exchange rates. The differential between the contracted forward rate and the spot market exchange rate is defined as forward points. It is discounted, where material. Changes in the fair value related to forward points are continuously recognized in the statement of profit or loss.
Translation exposure of foreign-currency equity invested in consolidated entities is generally not hedged. However, if a hedge is entered into, it is accounted for as a net investment hedge. Signify designates the full instrument in the hedge relationship. The result of hedging of the translation risk, using net investment hedges is recognized in the Currency translation differences within equity, as can be seen in the Consolidated statement of comprehensive income if the hedge is effective.
Signify measures all derivative financial instruments at fair value derived from market prices of the instruments or calculated as the present value of the estimated future cash flows based on observable interest yield curves, basis spread and foreign exchange rates. These calculations are tested for reasonableness by comparing the outcome of the internal valuation with the valuation received from the counterparty.
Signify monitors that the economic relationship between the hedged item and hedging instrument and hedge ratio is the same as the one Signify uses for risk management purposes. A prospective effectiveness test is performed to prove that the hedge is effective.
If the hedge ratio for risk management purposes is no longer optimal due to the different timing or amount of the underlying transaction, but the risk management objective remains unchanged and the hedge continues to qualify for hedge accounting, Signify performs re-balancing of the hedge relationship by adjusting either the volume of the hedging instrument or the volume of the hedged item, so that the hedge ratio aligns with the ratio used for risk management purposes. Gains and losses that were accumulated in equity related to an ineffective portion of hedge, Signify records immediately in the Consolidated statement of income when such ineffectiveness occurs.
The derivatives related to transactions are, for hedge accounting purposes, split into hedges of on-balance-sheet accounts receivable/payable and forecasted sales and purchases. Gains or losses arising from changes in fair value of derivatives are recognized within Cost of sales in the Consolidated statement of income, except for derivatives that are effective and qualify for cash flow hedge accounting which are recorded in Other comprehensive income until the Consolidated statement of income is affected by the variability in cash flows of the designated hedged item. Changes in the fair value of hedges related to intercompany loans and deposits are recognized within Financial income and expenses in the Consolidated statement of income.
The derivatives used by Signify can be subject to master netting and set-off agreements with financial counterparties. In case of certain termination events, under the terms of these Master Agreements, Signify can terminate the outstanding transactions and aggregate their positive and negative values to arrive at a single net termination sum (or close-out amount). This contractual right is, among others, subject to the following:
The right may be limited by local law if the counterparty is subject to bankruptcy proceedings;
The right applies on a bilateral basis.
When the potential cash outflow is possible or remote and the risk covered by a guarantee is not a financial risk, Signify applies off-balance sheet treatment to such guarantees. For example, environmental remediation and legal proceedings. When the expectation of the cash outflow becomes probable, such guarantees become provisions, see guidance above.
When guarantees are covering credit risk or any other financial risk they are accounted for as financial assets and liabilities.
Fair value of financial instruments
The summary of all financial assets and liabilities, including their classification and measurement and fair value hierarchy is presented below: |
Carried at | Gross amount recognized on the balance sheet | Amounts not offset on the balance sheet, but are subject to master netting arrangements | Net amount | Fair value hierarchy level | Estimated fair value | |
|---|---|---|---|---|---|---|
Balance as at December 31, 2024 | ||||||
Non-current financial assets1 | amortized cost | 23 | - | 23 | 23 | |
Unquoted equity shares | fair value (FVOCI) | 5 | - | 5 | 3 | 5 |
Trade and other receivables1 | amortized cost | 1,066 | - | 1,066 | 1,066 | |
Derivative financial assets designated as hedging instruments | fair value (FVTPL) | 17 | (8) | 9 | 2 | 17 |
Current derivative financial assets not designated as hedging instruments | fair value (FVTPL) | - | - | - | 1 | - |
Non-current derivative financial assets not designated as hedging instruments | fair value (FVTPL) | 10 | - | 10 | 3 | 14 |
Cash and cash equivalents | 633 | - | 633 | 633 | ||
Debt (Eurobonds) | amortized cost | (597) | - | (597) | 1 | (591) |
Debt (excluding Eurobonds)1 | amortized cost | (956) | - | (956) | 2 | (956) |
Derivative financial liabilities designated as hedging instruments | fair value (FVTPL) | (11) | 8 | (3) | 2 | (11) |
Trade and other payables1 | amortized cost | (1,586) | - | (1,586) | (1,586) | |
Contingent considerations | fair value (FVTPL) | (2) | - | (2) | 3 | (2) |
Balance as at December 31, 2025 | ||||||
Current financial assets | amortized cost | 2 | 2 | 2 | ||
Non-current financial assets1 | amortized cost | 19 | - | 19 | 19 | |
Unquoted equity shares | fair value (FVOCI) | 4 | - | 4 | 3 | 4 |
Trade and other receivables1 | amortized cost | 894 | - | 894 | 894 | |
Derivative financial assets designated as hedging instruments | fair value (FVTPL) | 11 | (5) | 5 | 2 | 11 |
Non-current derivative financial assets not designated as hedging instruments | fair value (FVTPL) | 5 | - | 5 | 3 | 7 |
Cash and cash equivalents | 621 | - | 621 | 621 | ||
Debt (Eurobonds) | amortized cost | (599) | - | (599) | 1 | (596) |
Debt (excluding Eurobonds)1 | amortized cost | (980) | - | (980) | 2 | (980) |
Derivative financial liabilities designated as hedging instruments | fair value (FVTPL) | (7) | 5 | (1) | 2 | (7) |
Trade and other payables1 | amortized cost | (1,360) | - | (1,360) | (1,360) | |
Contingent considerations | fair value (FVTPL) | (3) | - | (3) | 3 | (3) |
- In view of the nature, maturity or the magnitude of the amounts, Signify considers the fair value of non-current financial assets, trade and other receivables, debt (excluding Eurobonds), trade and other payables not materially different from their carrying value.
The estimated fair value of financial instruments has been determined by Signify using available market information and appropriate valuation methods. The estimates presented are not necessarily indicative of the amounts that will ultimately be realized by Signify upon maturity or disposal. The use of market assumptions and/or estimation methods may have a material effect on the estimated fair value amounts.
The following hierarchy is applied to classify the financial assets and liabilities:
Level 1
Instruments included in Level 1 are comprised primarily of listed Eurobonds classified as financial liabilities at amortized cost. The fair value of financial instruments traded in active markets is based on quoted market prices at the balance sheet date. A market is regarded as active if quoted prices are readily and regularly available from an exchange, dealer, broker, industry group, pricing service, or regulatory agency, and those prices represent actual and regularly occurring market transactions on an arm’s length basis.
Level 2
The fair value of financial instruments that are not traded in an active market (for example, over-the-counter derivatives) are determined by using valuation techniques. These valuation techniques maximize the use of observable market data where it is available and rely as little as possible on entity specific estimates. If all significant inputs required to fair value an instrument are based on observable market data, the instrument is included in Level 2.
The fair value of derivatives is calculated as the present value of the estimated future cash flows based on observable interest yield curves, basis spread and foreign exchange rates.
Level 3
If one or more of the significant inputs are not based on observable market data, the instrument is included in Level 3.
This applies for Derivative financial assets not designated as hedging instruments, which mainly relate to Signify’s participation in Virtual Power Purchase Agreements. These contracts are accounted for as financial instruments (FVTPL) under IFRS 9 and valued by an external valuator on a quarterly basis. The fair value is calculated as the net forecasted cash inflows or outflows discounted to the present value. The unrealized loss in fair value of EUR 4 million (2024: EUR 12 million loss) is recorded in financial income or expense, refer to note 7, Financial income and expenses. Unobservable input data is the volume of generated wind power and the price curves of the respective electricity market.
Financial Risk management
Signify is exposed to several types of financial risks, as they arise in the normal course of business: interest rate risk, liquidity risk, currency risk, commodity price risk, credit risk and country risk. This note comprises the disclosures on Signify's financial risk management objectives, policies and procedures to monitor and manage these risks.
Interest rate risk
Interest rate risk is the risk of the fair value or future cash flows of a financial instrument fluctuating because of changes in the market interest rates. Financial instruments included in the debt position create an inherent interest rate risk. Failure to effectively hedge this risk could negatively impact financial results.
Signify monitors interest rate coverage, short-term and long-term interest rate developments and has the flexibility to opt for different short-term interest periods for the variable debt instruments at roll-over dates and/or could enter into derivative financial instruments to fix interest rates for a certain period of time. As of December 31, 2025, Signify had a ratio of fixed-rate debt to total outstanding debt of approximately 52% (2024: 52%).
A sensitivity analysis conducted at reporting date shows that if interest rates were to increase instantaneously by 1% from their level of December 31, 2025, with all other variables held constant, the annualized net interest expense would decrease by EUR 1 million. This impact was based on the outstanding net floating debt position as of December 31, 2025.
Liquidity risk
Liquidity risk is the risk that an entity will encounter difficulty in meeting obligations associated with financial liabilities.
Liquidity risk for Signify is monitored through the Treasury Risk Committee which tracks the development of the actual cash flow position and uses input from a number of sources in order to forecast the overall liquidity position.
The table below analyzes Signify's financial liabilities into relevant maturity groupings based on their contractual maturities. The amounts disclosed in the table are the contractual undiscounted cash flows. Balances due within 12 months equal their carrying balances as the impact of discounting is not significant. Interest on long-term debt is based on floating rate adjustments according to market expectations.
Payments due by period | ||||
|---|---|---|---|---|
Total | Less than | Between | Over | |
Debt, including bank overdrafts | 1,352 | 429 | 923 | - |
Interest on debt | 63 | 41 | 22 | - |
Trade and other payables | 1,363 | 1,363 | - | - |
Lease liability | 268 | 66 | 137 | 65 |
Derivative liabilities | 7 | 7 | - | - |
Off-balance sheet commitments | 120 | 40 | 80 | - |
Purchase obligations1 | 358 | 148 | 208 | 2 |
Contractual cash obligations 2025 | 3,530 | 2,093 | 1,370 | 67 |
Contractual cash obligations 2024 | 3,805 | 2,234 | 1,513 | 58 |
Revolving credit facility (RCF) | 600 | - | - | - |
- Signify has commitments related to the ordinary course of business which in general relate to contracts and purchase order commitments for less than 12 months. In the table, only the commitments for multiple years are presented, including their short-term portion.
Signify invests surplus cash primarily in money market deposits with investment graded financial institutions, and with maturities up to three months, to ensure sufficient liquidity is available to meet liabilities when due.
Signify has various sources to mitigate liquidity risk. Signify pools cash from subsidiaries to the extent legally and economically feasible; cash not pooled remains available for operational or investment needs. The table below shows details of cash and cash equivalents and bank overdrafts as of the reporting date:
2024 | 2025 | |
|---|---|---|
Cash at banks and in hand | 250 | 245 |
Short-term deposits | 359 | 363 |
Other cash equivalents | 24 | 13 |
Cash and cash equivalents | 633 | 621 |
Bank overdrafts | (1) | (0) |
Cash and cash equivalents and bank overdrafts | 633 | 621 |
Signify has a EUR 600 million revolving credit facility that can be used for general purposes. As of December 31, 2025, Signify did not have any amounts drawn under this facility.
Currency risk
Currency risk is the risk that reported financial performance, or the fair value or future cash flows of a financial instrument, will fluctuate because of changes in foreign exchange rates.
Signify operates in many countries and currencies and therefore currency fluctuations may inevitably impact its financial results. Signify is exposed to currency risk in the following areas:
Transaction exposures related to anticipated sales and purchases and on-balance-sheet receivables/payables resulting from such transactions;
Financing exposure arising from foreign currency intercompany and external debt and deposits;
Translation exposure of net income in foreign entities;
Translation exposure of foreign currency denominated equity invested in consolidated companies and goodwill;
Translation exposure to equity interests in non-functional-currency investments in associates and financial assets at fair value.
It is Signify’s policy to reduce the volatility caused by foreign currency movements on its net earnings by hedging the anticipated net exposure of foreign currencies resulting from foreign currency sales and purchases. In general, net anticipated exposures are hedged during a period of 9 months in layers of 25% up to a hedge ratio of 75%, using derivatives.
Signify’s policy requires significant committed foreign currency exposures to be fully hedged, generally using forwards. However, not every foreign currency can or shall be hedged as there may be regulatory barriers or prohibitive hedging cost preventing Signify from effectively and/or efficiently hedging its currency exposures. As a result, hedging activities cannot and will not eliminate all currency risks for anticipated and committed transaction exposures.
The following table outlines the estimated nominal value in millions of EUR for transaction exposures and related hedges for Signify’s most significant currency exposures as per the hedging policy horizon:
Receivables / Sales | Payables / Purchases | |||
|---|---|---|---|---|
Exposure | Hedges | Exposure | Hedges | |
Balance as at December 31 | ||||
Exposure currency | ||||
CNY | 2 | (2) | (534) | 349 |
PLN | 37 | (37) | (108) | 81 |
USD | 170 | (170) | (113) | 113 |
EUR1 | 52 | (52) | (18) | 18 |
CAD | 79 | (45) | - | - |
MXN | 5 | (5) | (16) | 16 |
Others | 57 | (57) | (5) | 5 |
Total 2025 | 402 | (369) | (793) | 581 |
Total 2024 | 570 | (540) | (902) | 684 |
- EUR exposures in non-EUR denominated functional currencies.
As of December 31, 2025, a gain of EUR 1 million was deferred in equity as a result of these hedges (2024: gain of EUR 5 million). The result deferred in equity will be released to earnings in 2026 at the time when the related hedged transaction affects the Consolidated statement of income. During 2025, EUR nil million (2024: EUR nil million) was recorded within cost of goods sold in the Consolidated statement of income as a result of ineffectiveness on certain anticipated cash flow hedges.
The total net fair value of hedges related to transaction exposure as of December 31, 2025, was an unrealized asset of EUR 2 million (2024: asset EUR 2 million). An instantaneous 10% increase in the value of euro against all currencies, with all other variables held constant, would lead to a decrease of EUR 19 million in the value of the derivatives. The above sensitivity analysis includes a loss of EUR 5 million that would impact the income statement, which would partially offset the opposite revaluation effect on the underlying accounts receivable and payable, and the remaining loss of EUR 14 million would be recognized in equity to the extent that the cash flow hedges were effective.
Foreign exchange exposure also arises from loans and deposits. Where Signify enters into such arrangements the financing is generally provided in the functional currency of the subsidiary. The currency of Signify’s external funding and liquid assets is matched with the required financing of subsidiaries either directly through external foreign currency loans and deposits or synthetically by using foreign exchange derivatives. In certain cases, where Signify subsidiaries may also have external foreign currency debt or liquid assets, these exposures are also hedged using foreign exchange derivatives. As of December 31, 2025, the fair value of these hedges was an unrealized asset of EUR 2 million (2024: asset EUR 4 million). An instantaneous 10% increase in the value of euro against all currencies, with all other variables held constant, would lead to a decrease of EUR 50 million in the value of the derivatives.
Translation exposure of foreign-currency equity invested in consolidated entities is generally not hedged. However, if a hedge is entered into, it is accounted for as a net investment hedge. As at December 31, 2025, no net investment hedges were outstanding (2024: nil). Signify may enter into further net investment hedges to partially offset these risks in the future. The unrealized loss on translation differences in 2025 of EUR 415 million (2024: unrealized gain of EUR 176 million) related primarily to the impact of translating US dollar-denominated investments into euros.
Commodity price risk
Commodity price risk is the risk that the fair value or future cash flows of a financial instrument will fluctuate because of changes in commodity prices.
Signify is a purchaser of certain base metals, precious metals and energy. Signify could hedge certain commodity price risks using derivative instruments to minimize significant, unanticipated earnings fluctuations caused by commodity price volatility. As of December 31, 2025, Signify had EUR 5 million of commodity derivatives recognized in the Statement of financial position (2024: EUR 10 million), which relate to Virtual Power Purchase Agreements. An increase of the energy prices by 10% will lead to the commodity derivatives value increase by EUR 3 million (2024: EUR 5 million increase).
Credit risk
Credit risk represents the loss that would be recognized at the reporting date if counterparties failed completely to perform their payment obligations as contracted. Credit risk is present within Signify trade and other receivables and contract assets. To have better insights into the credit exposures, Signify performs ongoing evaluations of the financial and non-financial condition of its customers and adjusts credit limits when appropriate. In instances where the creditworthiness of a customer is determined not to be sufficient to grant the credit limit required, there are a number of mitigation tools that can be utilized to close the gap, including reducing payment terms, cash on delivery, prepayments and pledges on assets.
Signify invests available cash and cash equivalents and enters into financial derivative instruments with various financial institutions and is exposed to credit risk with these counterparties. Signify does not enter into any financial derivative instruments to protect against default by financial institutions.
Where possible, Signify requires all financial institutions to complete legally enforceable netting agreements under an International Swap Dealers Association master agreement or otherwise prior to trading, and whenever possible, to have a solid credit rating from generally accepted rating agencies. Signify also regularly monitors the development of the credit risk of its financial counterparties.
Signify minimizes this risk by limiting the deposits made with any single bank and by making deposits, the majority of which are with banks that have strong credit ratings.
Maximum credit risk exposure for Signify equals carrying amounts of all financial assets recognized in the Statement of financial position plus off-balance sheet guarantees provided.
Country risk
Country risk is the risk that political, legal, or economic developments in a single country could adversely impact Signify's performance. The country risk per country is defined as the sum of the equity of all subsidiaries and associated companies in country cross-border transactions, such as intercompany loans, accounts receivable from third parties and intercompany accounts receivable.
As of December 31, 2025, Signify had country risk exposure of EUR 2.5 billion in the United States and EUR 1.5 billion in the Netherlands. Countries where the risk exceeds EUR 200 million but was less than EUR 500 million are Belgium (EUR 478 million), Poland (EUR 435 million), China including Hong Kong (EUR 424 million) and France (EUR 246 million). Countries where the risk exceeded EUR 50 million but was less than EUR 200 million are Mexico, Saudi Arabia, Spain, Canada, United Kingdom, Australia and Germany. The degree of risk of a country is taken into account when new investments are considered. Signify does not, however, use financial derivative instruments to hedge country risk, except for the net investment hedge as described in the currency risk.
28 Events after the balance sheet date
On January 30, 2026, Signify announced that the company will structurally reset its cost base and establish continuous productivity improvements, while remaining committed to its operating model. To drive this, Signify announced a EUR 180 million cost reduction program, which will impact 900 roles across Signify. The majority of savings will be delivered through 2026, with the full benefit realized in 2027.
No other subsequent events occurred that are material to Signify.
16 Signify N.V. financial statements
Introduction
The sections Consolidated financial statements and Signify N.V. financial statements contain the statutory financial statements of Signify N.V. (the "Company").
A description of the activities of the Company, its subsidiaries and Company structure are included in the Consolidated financial statements. The corporate seat of the Company is in Eindhoven, the Netherlands, and its registered office is at High Tech Campus 48, 5656 AE Eindhoven, the Netherlands. Signify N.V. is registered in the Commercial Register of the Chamber of Commerce under number 65220692.
A list of all Signify N.V. subsidiaries and affiliated companies, prepared in accordance with the relevant legal requirements (Dutch Civil Code, Book 2, Sections 379 and 414), forms part of the notes to the statutory financial statements and is deposited at the Chamber of Commerce in Eindhoven, the Netherlands.
The financial statements of the Company included in this section are prepared in accordance with Part 9 of Book 2 of the Dutch Civil Code. Section 362 (8), Book 2, Dutch Civil Code, allows companies that apply the International Financial Reporting Standards (IFRS) as endorsed by the European Union, in their consolidated financial statements to use the same measurement principles in their company financial statements. The Company has prepared these Company financial statements using this provision.
The accounting policies are described in chapter 15, Consolidated financial statements, note 1, General information and are deemed incorporated and repeated herein by reference. Investments in subsidiaries in the Company financial statements are accounted for using the equity method.
The Statement of financial position included in these Company financial statements has been prepared before the appropriation of results.
16.1 Statement of income
Statement of income in millions of EUR
For the years ended December 31
Note | 2024 | 2025 | |
|---|---|---|---|
Other expenses | (3) | (2) | |
Financial income | 28 | 4 | |
Financial expenses | (69) | (44) | |
Share in results of subsidiaries | 372 | 295 | |
Net income | A | 328 | 254 |
16.2 Statement of financial position before appropriation of results
Statement of financial position before appropriation of results in millions of EUR
As at December 31
Note | 2024 | 2025 | |
|---|---|---|---|
Non-current assets | |||
Financial assets | C | 4,028 | 3,803 |
Other non-current assets | - | 1 | |
Total non-current assets | 4,028 | 3,804 | |
Current assets | |||
Other assets | 0 | 0 | |
Amounts due from subsidiaries | 486 | 205 | |
Cash and cash equivalents | 3 | 0 | |
Total current assets | 489 | 205 | |
Total assets | 4,517 | 4,010 | |
Shareholders’ equity | D | ||
Share Capital | 1 | 1 | |
Share premium | 2,142 | 2,150 | |
Legal reserve: currency translation differences | 104 | (310) | |
Legal reserve: cash flow hedges | 4 | 1 | |
Legal reserve: other | 275 | 265 | |
Other reserve: treasury shares | (78) | (83) | |
Other reserve: retained earnings | 386 | 394 | |
Net income | 328 | 254 | |
Total shareholders' equity | 3,162 | 2,673 | |
Non-current liabilities | |||
Debt | E | 997 | 923 |
Total non-current liabilities | 997 | 923 | |
Current liabilities | |||
Debt | E | 325 | 400 |
Derivative financial liabilities | 20 | - | |
Trade and other payables | 13 | 14 | |
Total current liabilities | 358 | 414 | |
Total liabilities and shareholders' equity | 4,517 | 4,010 |
16.3 Statement of changes in equity
Statement of changes in equity in millions of EUR
Legal reserves | Other reserves | |||||||||
|---|---|---|---|---|---|---|---|---|---|---|
Share | Share | Currency translation | Cash flow | Other | Treasury shares | Retained | Net income | Total share-holders' | ||
Balance as at January 1, 2024 | 1 | 2,120 | (72) | (1) | 266 | (82) | 382 | 203 | 2,817 | |
Appropriation of prior year result | - | - | - | - | - | - | 203 | (203) | - | |
Net income | - | - | - | - | - | - | - | 328 | 328 | |
Net current period change | - | - | 176 | 6 | - | - | 8 | - | 191 | |
Legal reserves reclassifications | - | - | - | - | 9 | - | (9) | - | - | |
Dividend distributed | - | - | - | - | - | - | (196) | - | (196) | |
Purchase of Treasury shares | - | - | - | - | - | (14) | (0) | - | (14) | |
Delivery of Treasury shares | - | (9) | - | - | - | 17 | (7) | - | - | |
Share-based compensation plans | - | 31 | - | - | - | - | - | - | 31 | |
Hyperinflation adjustment | - | - | - | - | - | - | 4 | - | 4 | |
Balance as at December 31, 2024 | 1 | 2,142 | 104 | 4 | 275 | (78) | 386 | 328 | 3,162 | |
Balance as at January 1, 2025 | 1 | 2,142 | 104 | 4 | 275 | (78) | 386 | 328 | 3,162 | |
Appropriation of prior year result | - | - | - | - | - | - | 328 | (328) | - | |
Net income | - | - | - | - | - | - | - | 254 | 254 | |
Net current period change | - | - | (415) | (3) | - | - | 2 | - | (416) | |
Legal reserves reclassifications | - | - | - | - | (9) | - | 9 | - | - | |
Dividend distributed | - | - | - | - | - | - | (195) | - | (195) | |
Purchase of Treasury shares | - | - | - | - | - | (152) | (2) | - | (154) | |
Cancellation of Treasury shares | (0) | - | - | - | - | 122 | (122) | - | - | |
Delivery of Treasury shares | - | (11) | - | - | - | 25 | (14) | - | - | |
Share-based compensation plans | - | 20 | - | - | - | - | - | - | 20 | |
Hyperinflation adjustment | - | - | - | - | - | - | 3 | - | 3 | |
Balance as at December 31, 2025 | 1 | 2,150 | (310) | 1 | 265 | (83) | 394 | 254 | 2,673 | |
16.4 Notes to the Company financial statements
In millions of EUR unless otherwise stated
A Statement of income
Other expenses consist of remuneration costs of the directors of the Company and the Supervisory Board, which were mostly recharged to the subsidiaries of the Company.
Financial income of EUR 4 million (2024: EUR 28 million) relates mainly to interest income on a loan of USD 500 million to one of its subsidiaries. This loan matured in January 2025.
Financial expenses of EUR 44 million (2024: 69 million) relate mainly to interest paid on Debt and related amortization of expenses.
Share in results of subsidiaries represents the share of the Company in the results of its affiliated companies.
B Audit fees
A summary of Audit fees from EY Accountants B.V. is shown below.
2024 | 2025 | |
|---|---|---|
Audit fees1 | 6.5 | 6.7 |
| 3.6 | 3.7 |
| 2.9 | 3.0 |
Audit-related fees | 1.0 | 0.8 |
| 0.9 | 0.7 |
| 0.1 | 0.1 |
Total2 | 7.5 | 7.5 |
- The audit fees included in 2025 represent the fees in relation to the audit of the 2025 financial statements.
- Fees charged by the Dutch organization of EY were EUR 3.4 million (2024: EUR 3.4 million).
C Financial assets
The Company has one directly owned subsidiary, Signify Holding B.V. This investment is presented as a financial asset in the Statement of financial position using the equity method. Goodwill paid upon acquisition of investments in subsidiaries is included in the net equity value of the investment and is not shown separately on the face of the Statement of financial position.
In 2020, the Company entered into an uncommitted revolving credit facility agreement of USD 500 million with one of its subsidiaries. As at December 31, 2024, the loan was classified under Current assets, in the line Amounts due from subsidiaries, in the Statement of financial position. On January 31, 2025, the loan reached its final maturity date and the outstanding balance was repaid by the subsidiary. As at December 31, 2025, the Company had not entered into any further long term uncommitted revolving credit facilities with its subsidiaries. The amount of EUR 205 million as at December 31, 2025 in the line Amounts due from subsidiaires relates primarily to revolving short term funding with its subsidiary, Signify Holding BV.
The unrealized loss on translation differences in 2025 of EUR 416 million (2024: unrealized gain of EUR 204 million) related primarily to the impact of translating US dollar-denominated investments into euros.
The following table shows the movements in Financial assets.
Investments | Loans1 | Total | |
|---|---|---|---|
Balance as at January 1, 2024 | 4,128 | 452 | 4,580 |
Dividends received | (688) | - | (688) |
Share in results of subsidiaries | 372 | - | 372 |
Translation differences | 176 | 29 | 204 |
Other movements | 40 | - | 40 |
Balance as at December 31, 2024 | 4,028 | 480 | 4,508 |
Repayments | - | (480) | (480) |
Dividends received | (115) | - | (115) |
Share in results of subsidiaries | 295 | - | 295 |
Translation differences | (415) | (1) | (416) |
Other movements | 10 | - | 10 |
Balance as at December 31, 2025 | 3,803 | (0) | 3,803 |
- The loan maturity date was January 31, 2025, as such the amount was classified under Current assets in the line Amounts due from subsidiaries in the Statement of financial position as at December 31, 2024.
D Shareholders’ equity
The Company has an authorized share capital of EUR 6 million, divided into 300,000,000 ordinary shares with a nominal value of EUR 0.01 per share and 300,000,000 preference shares with a nominal value of EUR 0.01 per share.
On December 31, 2025, the issued and fully paid share capital consisted of 122,581,104 ordinary shares with a nominal value of EUR 0.01 per share (2024: 128,344,238).
As a defense measure, Stichting Continuïteit Signify, a foundation organized under the laws of the Netherlands, has been granted the right to acquire preference shares in the Company. As of December 31, 2025, this right had not been exercised therefore no preference shares have been issued.
A proposal will be submitted to the 2026 Annual General meeting of Shareholders to pay a dividend of EUR 1.57 per ordinary share, in cash, from the 2025 net income.
In May 2025, the Company distributed a dividend of EUR 1.56 per ordinary share, representing a total value of EUR 195 million including costs.
The following table shows the movements in the outstanding number of shares over the last two years:
2024 | 2025 | |
|---|---|---|
Balance as at January 1 | 126,315,101 | 126,169,871 |
Purchase of treasury shares | (513,800) | (7,202,664) |
Delivery of treasury shares | 368,570 | 575,442 |
Balance as at December 31 | 126,169,871 | 119,542,649 |
The following table shows the share transactions to cover obligations arising from share-based compensation plans (for further details refer to chapter 15, Consolidated financial statements, note 25, Share-based compensation).
2024 | 2025 | |
|---|---|---|
Shares acquired | 513,800 | 1,439,530 |
Average market price | EUR 26.29 | EUR 20.36 |
Amount paid | EUR 14 million | EUR 29 million |
Shares delivered | 368,570 | 575,442 |
Average price (FIFO) | EUR 45.57 | EUR 43.72 |
Cost of delivered shares | EUR 17 million | EUR 25 million |
Total shares in treasury at year-end | 2,174,367 | 3,038,455 |
Total cost | EUR 78 million | EUR 83 million |
In January 2025, the company announced a share repurchase program in line with its capital allocation policy. The repurchase program in 2025 included an allocation to cover share-based remuneration obligations, with the remainder allocated for the cancellation of shares.
The following table shows the transactions that took place to reduce share capital in 2025. There were no transactions in 2024.
2024 | 2025 | |
|---|---|---|
Shares acquired | - | 5,763,134 |
Average market price | - | EUR 21.26 |
Amount paid | - | EUR 122 million |
Cancellation of treasury shares (number of shares) | - | 5,763,134 |
Cancellation of treasury shares (cost) | - | EUR 122 million |
In accordance with the Dutch Civil Code and statutory requirements in other countries, in certain circumstances legal reserves need to be established. Legal reserves are not available for distribution to the Company’s shareholders. The currency translation reserve, cash flow hedging reserve and other reserves include non-distributable amounts. If any reserve has a negative balance, distributions to shareholders are restricted to the extent of the negative amount.
The following table shows the limitations in the distribution of Shareholders' equity and the total distributable reserves:
2024 | 2025 | |
|---|---|---|
Shareholders' equity as at December 31 | 3,162 | 2,673 |
Issued Share capital | 1 | 1 |
Currency translation reserve | 104 | - |
Cash flow hedges reserve | 4 | 1 |
Restrictions on subsidiaries to transfer funds to parent company | 137 | 129 |
Capitalized development costs reserve | 125 | 128 |
Revaluation reserve | 9 | 6 |
Reserves required by Articles of Association | 3 | 3 |
Limitations in the distribution of shareholders' equity | 385 | 268 |
Total distributable reserves as at December 31 | 2,777 | 2,405 |
E Debt
In July 2025, Signify entered into new long-term loan agreements consisting of EUR 325 million with maturity in August 2028. The proceeds were used to repay mainly in August 2025 its EUR 325 million short-term loans with original maturity date in October 2025.
As of December 31, 2025, the Company had outstanding EUR 400 million short-term loans maturing in December 2026 and EUR 325 million long-term loans maturing in August 2028, bearing interest at a variable rate based on EURIBOR plus a fixed margin of 1.30% and 1.00% respectively. In October 2025, Signify signed a new revolving credit facility (RCF) of EUR 600 million with a five-year maturity plus two one-year extension options replacing its EUR 500 million revolving credit facility maturing in January 2027. The new revolving credit facility has similar terms compared to the previous facility.
During 2025, Signify did not draw on either revolving credit facility.
The term loans and RCF agreement include a financial covenant providing that Signify maintains a net leverage ratio of no greater than 3.5x. The net leverage ratio may temporarily increase to 4.0x within 12 months of the closing of material acquisitions. The covenant does not apply if Signify has at least one investment grade rating, which is currently the case, as Signify has two investment grade ratings.
As of December 31, 2025, Signify had outstanding EUR 600 million of fixed rate notes due in May 2027 with an annual coupon of 2.375%.
For the movements in debt refer to the following table.
Term loans | Eurobonds | Total | |
|---|---|---|---|
Balance as at January 1, 2024 | 704 | 1,271 | 1,975 |
New borrowings | 504 | - | 504 |
Repayments | (488) | (675) | (1,163) |
Translation differences | 4 | - | 4 |
Other movements | (0) | 2 | 2 |
Balance as at December 31, 2024 | 724 | 597 | 1,322 |
From which current | 325 | - | 325 |
From which non-current | 399 | 597 | 997 |
Balance as at December 31, 2024 | 724 | 597 | 1,322 |
New borrowings | 325 | - | 325 |
Repayments | (325) | - | (325) |
Other movements | (0) | 1 | 1 |
Balance as at December 31, 2025 | 724 | 599 | 1,322 |
From which current | 400 | - | 400 |
From which non-current | 324 | 599 | 923 |
F Employees
The number of persons employed by the Company at year-end 2025 was three (2024: two); all were employed in the Netherlands. From January 1, 2026, there are two persons employed by the Company. For the remuneration of past and present members of both the Board of Management and the Supervisory Board, refer to chapter 15, Consolidated financial statements, note 26, Information on remuneration, which is deemed incorporated and repeated herein by reference.
G Contingent liabilities not appearing in the balance sheet
General guarantees as referred to in section 403, Book 2, of the Dutch Civil Code, have been given by the Company on behalf of other group companies in the Netherlands. The liabilities of these companies to third parties amounted to EUR 523 million as at December 31, 2025, (2024: EUR 494 million).
There have been no other general guarantees or credit guarantees given on behalf of unconsolidated companies and third parties.
For corporate income tax purposes, the Company is the parent of a fiscal unity that includes the most significant Dutch wholly owned group companies. The Company is therefore jointly and severally liable for the corporate income tax liabilities of the tax unity.
H Events after the balance sheet date
For the disclosure of events after the balance sheet date, reference is made in chapter 15, Consolidated financial statements, note 28, Events after the balance sheet date, which is deemed incorporated and repeated herein by reference.
On February 24, 2026, the Board of Management authorized the statutory financial statements for issue. The statutory financial statements as presented in this report are subject to the adoption by the Annual General Meeting of Shareholders, to be held on April 24, 2026.
February 24, 2026
Board of Management
As Tempelman
Željko Kosanović
Supervisory Board
Gerard van de Aast
Bram Schot
Sophie Bechu
Jeroen Drost
Pamela Knapp
Rita Lane
17 Independent auditor’s reports
17.1 Report on the audit of the financial statements
Our opinion
We have audited the accompanying financial statements 2025 of Signify N.V. based in Eindhoven, the Netherlands. The financial statements comprise the consolidated financial statements and the company financial statements.
In our opinion:
The consolidated financial statements give a true and fair view of the financial position of Signify N.V. as at December 31, 2025 and of its result and its cash flows for 2025 in accordance with International Financial Reporting Standards as adopted in the European Union (EU-IFRSs) and with Part 9 of Book 2 of the Dutch Civil Code
The company financial statements give a true and fair view of the financial position of Signify N.V. as at December 31, 2025 and of its result for 2025 in accordance with Part 9 of Book 2 of the Dutch Civil Code
The consolidated financial statements comprise:
The consolidated statement of financial position as at December 31, 2025
The following statements for 2025: the consolidated statement of income, the consolidated statements of comprehensive income, changes in equity and cash flows
The notes comprising material accounting policy information and other explanatory information
The company financial statements comprise:
The company statement of financial position as at December 31, 2025
The company statement of income for 2025
The notes comprising a summary of the accounting policies and other explanatory information
Basis for our opinion
We conducted our audit in accordance with Dutch law, including the Dutch Standards on Auditing. Our responsibilities under those standards are further described in the Our responsibilities for the audit of the financial statements section of our report.
We are independent of Signify N.V. in accordance with the EU Regulation on specific requirements regarding statutory audit of public-interest entities, the Wet toezicht accountantsorganisaties (Wta, Audit firms supervision act), the Verordening inzake de onafhankelijkheid van accountants bij assurance-opdrachten (ViO, Code of Ethics for Professional Accountants, a regulation with respect to independence) and other relevant independence regulations in the Netherlands. Furthermore, we have complied with the Verordening gedrags- en beroepsregels accountants (VGBA, Dutch Code of Ethics for Professional Accountants).
We believe the audit evidence we have obtained is sufficient and appropriate to provide a basis for our opinion.
Information in support of our opinion
We designed our audit procedures in the context of our audit of the financial statements as a whole and in forming our opinion thereon. The following information in support of our opinion and any findings were addressed in this context, and we do not provide a separate opinion or conclusion on these matters.
Our understanding of the business
Signify N.V. (Signify or the company, and, together with its consolidated subsidiaries, ‘the group’) is a global provider of lighting solutions. Signify is structured into four businesses: Professional, Consumer, Original Equipment Manufacturer (OEM) and Conventional. The group is structured in components and we tailored our group audit approach accordingly. We paid specific attention in our audit to a number of areas driven by the operations of the group and our risk assessment.
We determined materiality and identified and assessed the risks of material misstatement of the financial statements, whether due to fraud or error in order to design audit procedures responsive to those risks and to obtain audit evidence that is sufficient and appropriate to provide a basis for our opinion.
Materiality | EUR 21 million (2024: EUR 24 million). |
Benchmark applied | Approximately 4% of adjusted earnings before interest, tax and amortization (Adjusted EBITA). |
Explanation | We considered that users of the financial statements of a for-profit entity typically focus on earnings-based measures as the most appropriate basis to determine materiality. Furthermore, we note that adjusted EBITA is commonly used in Signify’s external communication to report on financial performance. Adjustments are made to earnings before interest, taxes and amortization for elements that are not directly related to the operational performance of the company as disclosed in chapter 18, Reconciliation of non-IFRS financial measures, of the Annual Report. We determined materiality consistent with prior financial year. |
We have also taken into account misstatements and/or possible misstatements that in our opinion are material for the users of the financial statements for qualitative reasons.
We agreed with the Supervisory Board that misstatements in excess of EUR 1,050 thousand, which are identified during the audit, would be reported to them, as well as smaller misstatements that in our view must be reported on qualitative grounds.
Scope of the group audit
Signify N.V. is at the head of a group of entities. The financial information of this group is included in the financial statements.
We are responsible for planning and performing the group audit to obtain sufficient appropriate audit evidence regarding the financial information of the entities or business units within the group as a basis for forming an opinion on the financial statements. We are also responsible for the direction, supervision, review and evaluation of the audit work performed for purposes of the group audit. We bear the full responsibility for the auditor’s report.
Based on our understanding of the group and its environment, the applicable financial framework and the group’s system of internal control, we identified and assessed risks of material misstatement of the financial statements and the significant accounts and disclosures. Based on this risk assessment, we determined the nature, timing and extent of audit work performed, including the entities or business units within the group (components) at which to perform audit work. For this determination we considered the nature of the relevant events and conditions underlying the identified risks of material misstatements for the financial statements, the association of these risks to components and the materiality or financial size of the components relative to the group. We communicated the audit work to be performed and identified risks through instructions for component auditors as well as requesting component auditors to communicate matters related to the financial information of the component that is relevant to identifying and assessing risks.
We have:
Performed audit procedures ourselves in respect of accounting areas that are managed centrally such as goodwill, legal claims, employee incentives, pension provisions, warranty provisions, environmental provisions, cash and cash equivalents and financing arrangements;
Performed audit procedures ourselves at 11 components and selected 18 components outside the Netherlands to perform audits for group reporting purposes because we identified a significant risk of material misstatement for one or more account balances and/or disclosures
This resulted in a coverage of 67% of revenue and 83% of total assets. For other components, we performed specified audit procedures and analytical procedures to corroborate that our risk assessment and scoping remained appropriate throughout the audit.
We performed site visits to meet with local management and component teams, observe the component operations, discuss the group risk assessment and the risks of material misstatements components assigned a scope. We reviewed and evaluated the adequacy of the deliverables from component auditors and reviewed key working papers for selected components to address the risks of material misstatement. We held planning meetings, key meetings required based on circumstances and we attended closing meetings with local management and component teams for components assigned a scope. During these meetings and calls, amongst others, the planning, procedures performed based on risk assessments, findings and observations were discussed and any further work deemed necessary by the primary or component team was then performed.
By performing the audit work mentioned above at the entities or business units within the group, together with additional work at group level, we have been able to obtain sufficient and appropriate audit evidence about the group’s financial information to provide an opinion on the financial statements.
We ensured that the audit teams both at group and at component levels included the appropriate skills and competences which are needed for the audit of a listed client in the lighting industry. We included specialists in the areas of IT audit, forensics, treasury, and income tax and have made use of our own experts in the areas of valuations and actuaries.
Our focus on climate-related risks and the energy transition
Climate change and the energy transition are high on the public agenda. Issues such as CO2 reduction impact financial reporting, as these issues entail risks for the business operation, the valuation of assets and provisions or the sustainability of the business model and access to financial markets of companies with a larger CO2 footprint. The Sustainability statements summarize, among other topics, Signify’s commitments and obligations and how the company is addressing climate-related and environmental risks.
As part of our audit of the financial statements, we evaluated the extent to which climate-related risks and the effects of the energy transition, are taken into account in estimates and significant assumptions as disclosed in note 1 General Information, section Critical accounting judgments and key sources of estimation uncertainty, to the consolidated financial statements, as well as in the design of relevant internal control measures. Furthermore, we read the report of the Board of Management and considered whether there is any material inconsistency between the non-financial information in chapter 5, Sustainability statements and the financial statements.
Based on the audit procedures performed, we do not deem climate-related risks to have a material impact on the financial reporting judgements, estimates or significant assumptions as at December 31, 2025.
Our focus on fraud and non-compliance with laws and regulations
Our responsibility
Although we are not responsible for preventing fraud or non-compliance and we cannot be expected to detect non-compliance with all laws and regulations, it is our responsibility to obtain reasonable assurance that the financial statements, taken as a whole, are free from material misstatement, whether caused by fraud or error. The risk of not detecting a material misstatement resulting from fraud is higher than for one resulting from error, as fraud may involve collusion, forgery, intentional omissions, misrepresentations, or the override of internal control.
Our audit response related to fraud risks
We identified and assessed the risks of material misstatements of the financial statements due to fraud. During our audit we obtained an understanding of the company and its environment and the components of the system of internal control, including the risk assessment process and the Board of Management’s process for responding to the risks of fraud and monitoring the system of internal control and how the Supervisory Board exercises oversight, as well as the outcomes.
We refer to chapter 13, Risk factors and risk management for the Board of Management’s (fraud) risk assessment and section 9.2 of the Supervisory Board report in which the Supervisory Board reflects on this (fraud) risk assessment.
We evaluated the design and relevant aspects of the system of internal control and in particular the fraud risk assessment, as well as the code of conduct, whistle blower procedures and incident registration. We evaluated the design and the implementation of internal controls designed to mitigate fraud risks.
As part of our process of identifying fraud risks, we evaluated fraud risk factors with respect to financial reporting fraud and misappropriation of assets. As Signify N.V. is a global company, operating in multiple jurisdictions, we also considered the risk factors of bribery and corruption. We work closely together with our forensic specialists, during the fraud risk assessment (where we evaluated whether these risk factors could indicate a risk of material misstatement due to fraud) as well as during the execution phase of the audit.
We incorporated elements of unpredictability in our audit. We also considered the outcome of our other audit procedures and evaluated whether any findings were indicative of fraud or non-compliance.
We addressed the risks related to management override of controls, as this risk is present in all organizations. For these risks we have, among other things, performed procedures to evaluate whether the selection and application of accounting policies by the company, particularly those relating to subjective measurements and complex transactions, as disclosed in note 1 General Information, section Critical accounting judgments and key sources of estimation uncertainty, to the consolidated financial statements, may be indicative to fraudulent financial reporting. We have also used data analysis to identify and address high-risk journal entries and other adjustments made in the financial reporting process. We evaluated the business rationale (or the lack thereof) of significant extraordinary transactions, including those with related parties.
The following fraud risk identified required significant attention during our audit:
Fraud risk | We presumed that there are risks of fraud in revenue recognition. We evaluated that revenue from sales of goods gives rise to such risks, specifically related to cut-off. We describe the audit procedures responsive to the presumed risk of fraud in revenue recognition in the description of the key audit matter “Improper revenue recognition”. |
We considered available information and made enquiries of the Board of Management and other relevant executives, directors (including internal audit, legal, compliance and heads of Businesses) and the Supervisory Board.
The fraud risks we identified, enquiries and other available information did not lead to specific indications for fraud or suspected fraud potentially materially impacting the view of the financial statements.
Our audit response related to risks of non-compliance with laws and regulations
We performed appropriate audit procedures regarding compliance with the provisions of those laws and regulations that have a direct effect on the determination of material amounts and disclosures in the financial statements. Furthermore, we assessed factors related to the risks of non-compliance with laws and regulations that could reasonably be expected to have a material effect on the financial statements from our general industry experience, through discussions with the Board of Management, reading minutes, inspection of internal audit and compliance reports, and performing substantive tests of details of classes of transactions, account balances or disclosures.
We also inspected lawyers’ letters and correspondence with regulatory authorities and remained alert to any indication of (suspected) non-compliance throughout the audit. Finally, we obtained written representations from the Board of Management and management of operating companies that all known instances of non-compliance with laws and regulations have been disclosed to us.
Our audit response related to going concern
As disclosed in note 1 General Information, section Basis of preparation, to the consolidated financial statements, the financial statements have been prepared on a going concern basis. When preparing the financial statements, the Board of Management made a specific assessment of the company’s ability to continue as a going concern and to continue its operations for the foreseeable future.
We discussed and evaluated the specific assessment with the Board of Management exercising professional judgment and maintaining professional skepticism. We considered whether the Board of Management’s going concern assessment, based on our knowledge and understanding obtained through our audit of the financial statements or otherwise, contains all relevant events or conditions that may cast significant doubt on the company’s ability to continue as a going concern. If we conclude that a material uncertainty exists, we are required to draw attention in our auditor’s report to the related disclosures in the financial statements or, if such disclosures are inadequate, to modify our opinion.
Based on our procedures performed, we did not identify material uncertainties about going concern or Board of Management’s use of the going concern basis of accounting. Our conclusions are based on the audit evidence obtained up to the date of our auditor’s report. However, future events or conditions may cause a company to cease to continue as a going concern.
Key audit matters are those matters that, in our professional judgment, were of most significance in our audit of the financial statements. We have communicated the key audit matters to the Supervisory Board. The key audit matters are not a comprehensive reflection of all matters discussed.
The key audit matter Valuation of uncertain tax positions (assets and liabilities) which was included in our last year’s auditor’s report, is not considered a key audit matter for this year as the size, complexity and related uncertainties of these positions have decreased.
As a result of reduced demand and pricing pressure in the OEM Business during 2025 and pressure on (future) profitability, we identified a higher risk for impairment of the OEM Business goodwill and incorporated the OEM Business in the key audit matter Valuation of Goodwill – Professional (main geographies) included in our last year’s auditor’s report.
We identified the following key audit matters:
Key audit matter | Risk | Our audit approach | Key observations |
|---|---|---|---|
Improper revenue recognition | Revenue from the sale of goods is recognized at the point in time that the customer obtains control of the goods. For standard sale of products, control generally passes to the customer at the time the product is delivered and accepted, depending on the delivery conditions. The company focuses on sales as one of the key performance measures which could create an incentive to recognize revenues in the incorrect period due to the pressure employees may feel to achieve desired results. Further reference is made to note 3 Income from operations to the consolidated financial statements. We assessed that improper revenue recognition for the sale of goods, specifically related to cut-off, represents a key audit matter. | Our audit procedures included:
| We concur with the revenue recognized in the financial statements. |
Valuation of goodwill - Professional (main geographies) and OEM | At December 31, 2025, the total carrying value of goodwill amounted to EUR 2,615 million, representing 39% of total assets. Goodwill is allocated to Cash Generating Units (CGUs), which correspond to the operating segments as disclosed in note 2 Information by segment and main country to the consolidated financial statements. Goodwill is tested for impairment annually and whenever impairment indicators are identified. We specifically identify the impairment risk to Professional (main geographies) and OEM, as these businesses are most affected by current market developments and the headroom between the estimated recoverable amounts and the respective carrying amounts is relatively low. All other CGU’s have sufficient headroom available to cover variations in assumptions. Further reference is made to note 14 Intangible assets of the consolidated financial statements. The determination of the recoverable amount is complex, given the significant judgment and estimation uncertainty related to assumptions in the model used to determine whether the recoverable amount of a CGU is appropriate. The most significant assumptions used within the model to support the recoverable amount of goodwill are sales growth rates and discount rates applied to the projected cash flows, while EBITA reflects the combined effect of sales growth and cost measures. Therefore we consider this a key audit matter. | We assessed and tested the key assumptions, methodologies, and data used by the company in its impairment test, by comparing these to external data such as the Company’s share price, market growth and inflation rate expectations, discount rates and implied growth rates. We validated that the forecasted cash flows used in the valuation are consistent with the approved strategic plans and evaluated the historical accuracy of the Board of Management’s estimates that drive the assessment, such as the expected sales growth rates and discount rates. We performed sensitivity analyses by stress testing the most significant assumptions in the impairment test to determine the degree to which these assumptions would need to change before the carrying amount exceeds its recoverable amount. We included valuation experts in our team to assist us in these audit activities. We assessed the adequacy of the company’s disclosure around goodwill as included in note 14 Intangible assets to the consolidated financial statements as well as the company’s accounting policies which are more critical in nature as included in note 1 General information to the consolidated financial statements. | We concur with the Board of Management’s conclusion that no impairment of goodwill is required as at December 31, 2025 and with the related disclosures in the financial statements. |
Report on other information included in the Annual Report
The Annual Report contains other information in addition to the financial statements and our auditor’s report thereon.
Based on the following procedures performed, we conclude that the other information:
Is consistent with the financial statements and does not contain material misstatements
Contains the information as required by Part 9 of Book 2 of the Dutch Civil Code for the management report (excluding the sustainability statement) and the other information as required by Part 9 of Book 2 of the Dutch Civil Code and as required by Sections 2:135b and 2:145 sub‑section 2 of the Dutch Civil Code for the remuneration report.
We have read the other information. Based on our knowledge and understanding obtained through our audit of the financial statements or otherwise, we have considered whether the other information contains material misstatements. By performing these procedures, we comply with the requirements of Part 9 of Book 2 and Section 2:135b sub-Section 7 of the Dutch Civil Code and the Dutch Standard 720. The scope of the procedures performed is substantially less than the scope of those performed in our audit of the financial statements.
The Board of Management is responsible for the preparation of the other information, including the management report in accordance with Part 9 of Book 2 of the Dutch Civil Code and other information required by Part 9 of Book 2 of the Dutch Civil Code. The Board of Management and the Supervisory Board are responsible for ensuring that the remuneration report is drawn up and published in accordance with Sections 2:135b and 2:145 sub‑section 2 of the Dutch Civil Code.
Description of responsibilities regarding the financial statements
Responsibilities of the Board of Management and the Supervisory Board for the financial statements
The Board of Management is responsible for the preparation and fair presentation of the financial statements in accordance with EU-IFRSs and Part 9 of Book 2 of the Dutch Civil Code. Furthermore, the Board of Management is responsible for such internal control as the Board of Management determines is necessary to enable the preparation of the financial statements that are free from material misstatement, whether due to fraud or error.
As part of the preparation of the financial statements, the Board of Management is responsible for assessing the company’s ability to continue as a going concern. Based on the financial reporting framework mentioned, the Board of Management should prepare the financial statements using the going concern basis of accounting unless the Board of Management either intends to liquidate the company or to cease operations, or has no realistic alternative but to do so. The Board of Management should disclose events and circumstances that may cast significant doubt on the company’s ability to continue as a going concern in the financial statements.
The Supervisory Board is responsible for overseeing the company’s financial reporting process.
Our responsibilities for the audit of the financial statements
Our objective is to plan and perform the audit engagement in a manner that allows us to obtain sufficient and appropriate audit evidence for our opinion.
Our audit has been performed with a high, but not absolute, level of assurance, which means we may not detect all material misstatements, whether due to fraud or error during our audit.
Misstatements can arise from fraud or error and are considered material if, individually or in the aggregate, they could reasonably be expected to influence the economic decisions of users taken on the basis of these financial statements. The materiality affects the nature, timing and extent of our audit procedures and the evaluation of the effect of identified misstatements on our opinion.
We have exercised professional judgment and have maintained professional skepticism throughout the audit, in accordance with Dutch Standards on Auditing, ethical requirements and independence requirements. The Information in support of our opinion section above includes an informative summary of our responsibilities and the work performed as the basis for our opinion.
Our audit further included among others:
Performing audit procedures responsive to the risks identified, and obtaining audit evidence that is sufficient and appropriate to provide a basis for our opinion
Obtaining an understanding of internal control relevant to the audit in order to design audit procedures that are appropriate in the circumstances, but not for the purpose of expressing an opinion on the effectiveness of the company’s internal control
Evaluating the appropriateness of accounting policies used and the reasonableness of accounting estimates and related disclosures made by the Board of Management
Evaluating the overall presentation, structure and content of the financial statements, including the disclosures
Evaluating whether the financial statements represent the underlying transactions and events in a manner that achieves fair presentation
We communicate with the Supervisory Board regarding, among other matters, the planned scope and timing of the audit and significant audit findings, including any significant findings in internal control that we identify during our audit.
In this respect we also submit an additional report to the audit committee of the Supervisory Board in accordance with Article 11 of the EU Regulation on specific requirements regarding statutory audit of public-interest entities. The information included in this additional report is consistent with our audit opinion in this auditor’s report.
We provide the Supervisory Board with a statement that we have complied with relevant ethical requirements regarding independence, and to communicate with them all relationships and other matters that may reasonably be thought to bear on our independence, and where applicable, related safeguards.
From the matters communicated with the Supervisory Board, we determine the key audit matters: those matters that were of most significance in the audit of the financial statements. We describe these matters in our auditor’s report unless law or regulation precludes public disclosure about the matter or when, in extremely rare circumstances, not communicating the matter is in the public interest.
Report on other legal and regulatory requirements and ESEF
Engagement
We were engaged by the Supervisory Board as auditor of Signify N.V. on July 15, 2016, as of the audit for the year 2016 and have operated as statutory auditor ever since that date.
No prohibited non-audit services
We have not provided prohibited non-audit services as referred to in Article 5(1) of the EU Regulation on specific requirements regarding statutory audit of public-interest entities.
European Single Electronic Reporting Format (ESEF)
Signify N.V. has prepared the Annual Report in ESEF. The requirements for this are set out in the Delegated Regulation (EU) 2019/815 with regard to regulatory technical standards on the specification of a single electronic reporting format (hereinafter: the RTS on ESEF).
In our opinion the Annual Report prepared in the XHTML format, including the (partially) marked-up consolidated financial statements as included in the reporting package by Signify N.V., complies in all material respects with the RTS on ESEF.
The Board of Management is responsible for preparing the Annual Report, including the financial statements, in accordance with the RTS on ESEF, whereby the Board of Management combines the various components into a single reporting package.
Our responsibility is to obtain reasonable assurance for our opinion whether the Annual Report in this reporting package complies with the RTS on ESEF.
We performed our examination in accordance with Dutch law, including Dutch Standard 3950N, ”Assurance-opdrachten inzake het voldoen aan de criteria voor het opstellen van een digitaal verantwoordingsdocument” (assurance engagements relating to compliance with criteria for digital reporting). Our examination included amongst others:
Obtaining an understanding of the entity’s financial reporting process, including the preparation of the reporting package
Identifying and assessing the risks that the annual report does not comply in all material respects with the RTS on ESEF and designing and performing further assurance procedures responsive to those risks to provide a basis for our opinion, including:
Obtaining the reporting package and performing validations to determine whether the reporting package containing the Inline XBRL instance document and the XBRL extension taxonomy files, has been prepared in accordance with the technical specifications as included in the RTS on ESEF
Examining the information related to the consolidated financial statements in the reporting package to determine whether all required mark-ups have been applied and whether these are in accordance with the RTS on ESEF.
Amsterdam, February 24, 2026
EY Accountants B.V.
A.E. Wijnsma
17.2 Assurance reports on the sustainability statements
17.2.1 Limited assurance report on the sustainability statement
Our conclusion
We have performed a limited assurance engagement on the consolidated sustainability statement for 2025 of Signify N.V. based in Eindhoven (hereinafter: the company or Signify) in section sustainability statement of the accompanying management report including the information incorporated in the sustainability statement by reference (hereinafter: the sustainability statement).
Based on our procedures performed and the evidence obtained, nothing has come to our attention that causes us to believe that the sustainability statement is not, in all material respects:
prepared in accordance with the European Sustainability Reporting Standards (ESRS) as adopted by the European Commission and compliant with the double materiality assessment process carried out by Signify to identify the information reported pursuant to the ESRS; and
compliant with the reporting requirements provided for in Article 8 of Regulation (EU) 2020/852 (Taxonomy Regulation).
Our conclusion has been formed on the basis of the matters outlined in this limited assurance report.
Basis for our conclusion
We have performed our limited assurance engagement on the sustainability statement in accordance with Dutch law, including Dutch Standard 3810N, “Assurance-opdrachten inzake duurzaamheidsverslaggeving” (Assurance engagements relating to sustainability reporting), which is a specified Dutch standard that is based on the International Standard on Assurance Engagements (ISAE) 3000 (Revised), “Assurance engagements other than audits or reviews of historical financial information”.
Our assurance engagement was aimed to obtain a limited level of assurance that the sustainability statement is free from material misstatements. The procedures vary in nature and timing from, and are less in extent, than for a reasonable assurance engagement. Consequently, the level of assurance obtained in a limited assurance engagement is substantially lower than the assurance that would have been obtained had a reasonable assurance engagement been performed.
Our responsibilities in this regard are further described in the section ‘Our responsibilities for the limited assurance engagement on the sustainability statement’ of our report.
We are independent of Signify N.V. in accordance with the Verordening inzake de onafhankelijkheid van accountants bij assurance-opdrachten (ViO, Code of Ethics for Professional Accountants, a regulation with respect to independence) and other relevant independence regulations in the Netherlands. This includes that we do not perform any activities that could result in a conflict of interest with our independent assurance engagement and we are not involved in the preparation of the sustainability statement, as doing so may compromise our independence. Furthermore, we have complied with the Verordening gedrags- en beroepsregels accountants (VGBA, Dutch Code of Ethics for Professional Accountants). The ViO and VGBA are at least as demanding as the International code of ethics for professional accountants (including International independence standards) of the International Ethics Standards Board for Accountants (the IESBA Code) as relevant to limited assurance engagements on sustainability statements of public interest entities in the European Union.
We believe that the assurance evidence we have obtained is sufficient and appropriate to provide a basis for our conclusion.
Inherent limitations associated with measurement or evaluation of sustainability information
Significant uncertainties affecting the quantitative metrics and monetary amounts
Section Reporting Principles in the sustainability statement identifies the quantitative metrics and monetary amounts that are subject to a high level of measurement uncertainty and discloses information about the sources of measurement uncertainty and the assumptions, approximations and judgements Signify has made in measuring these in compliance with the ESRS.
Comparability may be limited for entity-specific sustainability information
Signify provides additional entity-specific sustainability information as referenced in Section Material impacts, risks and opportunities description. The comparability of entity-specific sustainability information between entities and over time may be affected by the absence of a uniform practice or availability of external information sources to measure or evaluate this information that can support comparability. This allows for the application of different, but acceptable, measurement techniques.
Inherent limitations of a double materiality assessment process
The sustainability statement may not include every impact, risk and opportunity or additional entity-specific disclosure that each individual stakeholder (group) may consider important in its own particular assessment.
Inherent limitations of forward-looking information
In reporting forward-looking information in accordance with the ESRS, the Board of Management describes the underlying assumptions and methods of producing the information, as well as other factors that provide evidence that it reflects the actual plans or decisions made by Signify (actions). Forward-looking information relates to events and actions that have not yet occurred and may never occur. The actual outcome is likely to be different since anticipated events frequently do not occur as expected.
Comparative information not assured
Sustainability information for reporting years prior to 2024 included in the sustainability statement, has not been part of this limited assurance engagement. Consequently, we do not provide any assurance on the comparative information and thereto related disclosures in the sustainability statement for reporting years prior to 2024.
With regards to the Company’s sustainability information, the 2019 baseline is based on Signify’s best estimates available at the time of the start of the Brighter Lives, Better World 2025 doubling commitments in 2021. The 2019 baseline assumptions are excluded from the scope of our assurance engagement. We refer to chapter 5, Sustainability statements, subsection 5.1 of the Annual Report for more information.
Our conclusion is not modified in respect of this matter.
Responsibilities of the Board of Management and the Supervisory Board for the sustainability statement
The Board of Management is responsible for the preparation of the sustainability statement in accordance with the ESRS, including the double materiality assessment process carried out by Signify as the basis for the sustainability statement and disclosure of material impacts, risks and opportunities in accordance with the ESRS. As part of the preparation of the sustainability statement, the Board of Management is responsible for compliance with the reporting requirements provided for in Article 8 of Regulation (EU) 2020/852 (Taxonomy Regulation).
The Board of Management is also responsible for selecting and applying additional entity-specific disclosures to enable users to understand Signify’s sustainability-related impacts, risks or opportunities and for determining that these additional entity-specific disclosures are suitable in the circumstances and in accordance with the ESRS.
Furthermore, the Board of Management is responsible for such internal control as it determines is necessary to enable the preparation of the sustainability statement that is free from material misstatement, whether due to fraud or error.
The Supervisory Board is responsible for overseeing the sustainability reporting process including the double materiality assessment process carried out by Signify.
Our responsibilities for the limited assurance engagement on the sustainability statement
Our responsibility is to plan and perform the limited assurance engagement in a manner that allows us to obtain sufficient and appropriate assurance evidence for our conclusion.
We apply the applicable quality management requirements pursuant to the Nadere voorschriften kwaliteitsmanagement (NVKM, regulations for quality management) and the International Standard on Quality Management (ISQM) 1, and accordingly maintain a comprehensive system of quality management including documented policies and procedures regarding compliance with ethical requirements, professional standards and other relevant legal and regulatory requirements.
Our limited assurance engagement included amongst others:
Performing inquiries and an analysis of the external environment and obtaining an understanding of relevant sustainability themes and issues, the characteristics of the company, its activities and the value chain and its key intangible resources in order to assess the double materiality assessment process carried out by the company as the basis for the sustainability statement and disclosure of all material sustainability-related impacts, risks and opportunities in accordance with the ESRS
Obtaining, through inquiries, a general understanding of the internal control environment, the company’s processes for gathering and reporting entity-related and value chain information, the information systems and the company’s risk assessment process relevant to the preparation of the sustainability statement and for identifying Signify’s activities, determining eligible and aligned economic activities and prepare the disclosures provided for in Article 8 of Regulation (EU) 2020/852 (Taxonomy Regulation), without obtaining assurance information about the implementation or testing the operating effectiveness of controls
Assessing the double materiality assessment process carried out by Signify and identifying and assessing areas of the sustainability statement, including the disclosures provided for in Article 8 of Regulation (EU) 2020/852 (Taxonomy Regulation), where misleading or unbalanced information or material misstatements, whether due to fraud or error, are likely to arise (‘selected disclosures’). Designing and performing further assurance procedures aimed at assessing that the sustainability statement is free from material misstatements responsive to this risk analysis.
Considering whether the description of the double materiality assessment process in the sustainability statement made by the Board of Management appears consistent with the process carried out by Signify
Determining the nature and extent of the procedures to be performed for the group components and locations. For this, the nature, extent and/or risk profile of these components are decisive. Performing analytical review procedures on quantitative information in the sustainability statement, including consideration of data and trends
Assessing whether Signify’s methods for developing estimates are appropriate and have been consistently applied for selected disclosures. We considered data and trends, however our procedures did not include testing the data on which the estimates are based or separately developing our own estimates against which to evaluate the Board of Management’s estimates
Analyzing, on a limited sample basis, relevant internal and external documentation available to Signify (including publicly available information or information from actors throughout its value chain) for selected disclosures
Reading the other information in the annual report to identify material inconsistencies, if any, with the sustainability statement
Considering whether the disclosures provided to address the reporting requirements provided for in Article 8 of Regulation (EU) 2020/852 (Taxonomy Regulation) for each of the environmental objectives, reconcile with the underlying records of Signify and are consistent or coherent with the sustainability statement, appear reasonable, in particular whether the eligible economic activities meet the cumulative conditions to qualify as aligned and whether the technical screening criteria are met, and whether the key performance indicators disclosures have been defined and calculated in accordance with the Taxonomy delegated acts, and comply with the reporting requirements provided for in Article 8 of Regulation (EU) 2020/852 (Taxonomy Regulation), including the format in which the activities are presented
Considering the overall presentation, structure and fundamental qualitative characteristics of information (relevance and faithful representation: complete, neutral and accurate) reported in the sustainability statement, including the reporting requirements provided for in Article 8 of Regulation (EU) 2020/852 (Taxonomy Regulation)
Considering, based on our limited assurance procedures and evaluation of the evidence obtained, whether the sustainability statement as a whole, is free from material misstatements and prepared in accordance with the ESRS.
We communicate with the Supervisory Board regarding, among other matters, the planned scope and timing of the assurance engagement and significant findings that we identify during our assurance engagement.
Amsterdam, February 24, 2026
EY Accountants B.V.
Signed by A.E. Wijnsma
17.2.2 Reasonable assurance report on selected indicators
Our opinion
We have performed a reasonable assurance engagement on selected indicators in the accompanying Annual Report for the year 2025 of Signify N.V. (hereinafter: Signify) in Eindhoven.
In our opinion, the selected indicators are prepared, in all material respects, in accordance with the applicable criteria as included in the section ‘Criteria’.
The selected indicators consist of:
Total Greenhouse gas emissions (scope 1, 2 and 3) (as included in table: Signify carbon footprint in tonnes-CO2e in chapter 5.2)
Brighter lives revenues (as included in chapter 5.1)
Circular revenues (as included in chapters 5.1 and 5.2.2)
Percentage of women in leadership (as included in chapters 5.1 and 5.3.1.)
Basis for our opinion
We have performed our reasonable assurance engagement on the selected indicators in accordance with Dutch law, including Dutch Standard 3000A ’Assurance-opdrachten anders dan opdrachten tot controle of beoordeling van historische financiële informatie (attest-opdrachten)’ (Assurance engagements other than audits or reviews of historical financial information (attestation engagements)). Our responsibilities in this regard are further described in the section ‘Our responsibilities for the assurance engagement on the selected indicators’ of our report.
We are independent of Signify N.V. in accordance with the “Verordening inzake de onafhankelijkheid van accountants bij assurance-opdrachten” (ViO, Code of Ethics for Professional Accountants, a regulation with respect to independence). This includes that we do not perform any activities that could result in a conflict of interest with our independent assurance engagement. Furthermore, we have complied with the “Verordening gedrags- en beroepsregels accountants” (VGBA, Dutch Code of Ethics for Professional Accountants).
We believe that the assurance evidence we have obtained is sufficient and appropriate to provide a basis for our opinion.
Criteria
The criteria applied for the preparation of the selected indicators are the criteria developed by Signify and are disclosed in section 5.5 Reporting Principles of the Annual Report.
The comparability of selected indicators between entities and over time may be affected by the absence of a uniform practice on which to draw, to evaluate and measure this information. This allows for the application of different, but acceptable, measurement techniques. Consequently, the selected indicators need to be read and understood together with the criteria applied.
Corresponding information not assured
The selected indicator ‘Total Greenhouse gas emissions (scope 1, 2 and 3)’ for the period prior to 2022 has not been part of a reasonable assurance engagement. Consequently, the corresponding selected indicator and thereto related disclosures for the period prior to 2022 is not assured with reasonable assurance. Our opinion is not modified in respect of this matter.
Limitations to the scope of our assurance engagement
Our assurance engagement is restricted to the selected indicators. We have not performed assurance procedures on any other information as included in the Annual Report in light of this engagement.
The selected indicators include prospective information such as ambitions, strategy, plans, expectations and estimates. Prospective information relates to events and actions that have not yet occurred and may never occur. We do not provide assurance on the assumptions and achievability of this prospective information.
The references to external sources or websites are not part of our assurance engagement on the selected indicators. We therefore do not provide assurance on this information.
Our opinion is not modified in respect of these matters.
Responsibilities of the Board of Management and the Supervisory Board for the selected indicators
The Board of Management is responsible for the preparation of the selected indicators in accordance with the criteria as included in the section “Criteria”. The Board of Management is also responsible for selecting and applying the criteria and for determining that these criteria are suitable for the legitimate information needs of the intended users, considering applicable law and regulations related to reporting. The choices made by the Board of Management regarding the scope of the selected indicators and the reporting policy are summarized in section ‘5.5 Reporting Principles’ of the Annual Report.
Furthermore, the Board of Management is responsible for such internal control as it determines is necessary to enable the preparation of the selected indicators that are free from material misstatement, whether due to fraud or error.
The Supervisory Board is responsible for overseeing the reporting process of the selected indicators of Signify.
Our responsibilities for the assurance engagement on the selected indicators
Our responsibility is to plan and perform the assurance engagement in a manner that allows us to obtain sufficient and appropriate assurance evidence for our opinion.
Our assurance engagement has been performed with a high, but not absolute, level of assurance, which means we may not have detected all material misstatements, whether due to fraud or error, during our assurance engagement.
We apply the applicable quality management requirements pursuant to the Nadere voorschriften kwaliteitsmanagement (NVKM, regulations for quality management) and the International Standard on Quality Management (ISQM) 1, and accordingly maintain a comprehensive system of quality management including documented policies and procedures regarding compliance with ethical requirements, professional standards and other relevant legal and regulatory requirements.
Our assurance engagement included amongst others:
Performing an analysis of the external environment and obtaining an understanding of the sector, relevant sustainability themes and issues, and the characteristics of the company as far as relevant to the selected indicators
Evaluating the appropriateness of the criteria applied, their consistent application and related disclosures on the selected indicators. This includes the evaluation of the reasonableness of estimates made by the Board of Management
Obtaining an understanding of the systems and processes for collecting, reporting and consolidating the selected indicators, including obtaining an understanding of internal control environment relevant to our assurance engagement, but not for the purpose of expressing an opinion on the effectiveness of the company’s internal control
Identifying and assessing the risks that the selected indicators are misleading or unbalanced, or contain material misstatements, whether due to fraud or error, designing and performing further assurance procedures responsive to those risks, and obtaining assurance evidence that is sufficient and appropriate to provide a basis for our opinion. These procedures consisted amongst others of:
Making inquiries of management and/or relevant staff at corporate level responsible for the sustainability strategy, policy and results relating to the selected indicators
Interviewing relevant staff responsible for providing the information for, carrying out controls on, and consolidating the data in the selected indicators
Obtaining assurance evidence that the selected indicators reconcile with underlying records of Signify
Evaluating, on a sample basis, relevant internal and external documentation to determine the reliability of the selected indicators
Evaluating the data and trends
Sampling the used calculated wattages and lifetime in the product dataset to obtain suitable assurance evidence (internal documentation such as product leaflets) that reported information reconciles with underlying records of the company and to confirm the source data is in line with the reporting criteria;
Reconciling the relevant financial information with the financial statements
Reading the information in the Annual Report that is not included in the scope of our assurance engagement to identify material inconsistencies, if any, with the selected indicators
Evaluating whether the selected indicators are presented and disclosed free from material misstatement in accordance with the criteria applied
Amsterdam, 24 February 2026
EY Accountants B.V.
Signed by A.E. Wijnsma
18 Reconciliation of non-IFRS financial measures
Explanation of non-IFRS financial measures
Certain parts of this Annual Report contain non-IFRS financial measures and ratios, such as comparable sales growth, adjusted gross margin and indirect costs, EBITA, adjusted EBITA, free cash flow, Net debt, Working capital, Brighter lives revenues, Circular revenues and other related ratios, which are not recognized measures of financial performance or liquidity under IFRS.
The company uses these measures to monitor the underlying performance of its business and operations. Furthermore, these measures might not be indicative of the company’s historical operating results, nor are such measures meant to be predictive of the company’s future results. These measures are presented in this Annual Report because the company considers them an important supplemental measure of its performance and believes that these and similar measures are widely used in the industry in which it operates as a means of evaluating a company’s operating performance and liquidity.
Comparable sales growth
The company discloses comparable sales growth as a supplemental non-IFRS financial measure, as the company believes that the presentation of comparable sales growth is a meaningful measure for investors to evaluate the performance of the company’s business activities over time. As a result of significant foreign currency sales and currency movements during the periods presented, the effects of translating foreign currency sales amounts into euros could have a material impact on the comparability of sales between periods. In addition, the years presented can be affected by consolidations and de-consolidations. Therefore, when presenting comparable sales growth, these currency and (de)consolidation effects are excluded. Comparable sales growth is used by the company as a key financial measure to assess the operational performance of the businesses.
Comparable growth | Currency effects | Consolidation effects | Nominal growth | |
|---|---|---|---|---|
2025 versus 2024 | ||||
Professional | (1.4) | (2.8) | 0.0 | (4.2) |
Consumer | 1.4 | (3.1) | (0.0) | (1.7) |
OEM | (16.5) | (2.3) | 0.0 | (18.8) |
Conventional | (23.1) | (2.1) | 0.0 | (25.2) |
Signify | (3.4) | (2.8) | 0.0 | (6.2) |
2024 versus 2023 | ||||
Professional | (5.8) | (1.8) | 0.1 | (7.6) |
Consumer | (1.2) | (2.2) | 0.0 | (3.4) |
OEM | (2.0) | (2.5) | 0.0 | (4.5) |
Conventional | (29.2) | (1.0) | 0.0 | (30.2) |
Signify | (6.6) | (1.8) | 0.0 | (8.4) |
EBITA and Adjusted EBITA
The company discloses EBITA, Adjusted EBITA and Adjusted EBITA margin as supplemental non-IFRS financial measures, as the company understands that these measures are used by analysts, rating agencies and investors in assessing the company’s performance. The company believes that EBITA makes its underlying performance more transparent by factoring out the amortization and impairment of acquisition-related intangible assets and goodwill, which arise when acquisitions are consolidated by the company. In addition, the company presents Adjusted EBITA and Adjusted EBITA margin by business, as the company believes that these measures make the underlying performance of its businesses more transparent by factoring out restructuring costs, acquisition-related charges and other incidental items which are not directly related to the operational performance of the businesses. Adjusted EBITA and Adjusted EBITA margin are also used by the company as key segmental financial measures to assess the operating performance of the businesses.
Signify | Professional | Consumer | OEM | Conventional | Signify Other | |
|---|---|---|---|---|---|---|
2025 | ||||||
Adjusted EBITA | 511 | 334 | 135 | 17 | 53 | (27) |
Restructuring | (73) | |||||
Acquisition-related charges | 7 | |||||
Incidental items | (7) | |||||
EBITA | 439 | |||||
Amortization1 | (56) | |||||
Income from operations (EBIT)2 | 383 | |||||
2024 | ||||||
Adjusted EBITA | 606 | 367 | 144 | 48 | 78 | (32) |
Restructuring | (74) | |||||
Acquisition-related charges | 5 | |||||
Incidental items | 7 | |||||
EBITA | 543 | |||||
Amortization1 | (66) | |||||
Income from operations (EBIT)2 | 477 |
- Amortization and impairments of acquisition related intangible assets and goodwill.
- For a reconciliation to income before taxes, refer to note 2, Information by segment and main country, in chapter 15, Consolidated financial statements.
Adjusted gross margin and Adjusted indirect costs: Adjusted SG&A costs and Adjusted R&D costs
The company discloses Adjusted gross margin, Adjusted SG&A costs and Adjusted R&D costs as supplemental non-IFRS financial measures. The company believes they are a meaningful measure to evaluate the company’s gross margin, Adjusted SG&A costs and Adjusted R&D costs on a comparable basis over time. The measures factor out restructuring costs, acquisition-related charges and other incidental items attributable to cost of sales, SG&A and R&D costs which are not directly related to the operational performance of the company. Adjusted gross margin, Adjusted SG&A and Adjusted R&D are also used by the company as key financial measures to assess the operating performance of the company.
Reported | Restructuring1 | Acquisition related charges | Incidental items2 | Adjusted | |
|---|---|---|---|---|---|
2025 | |||||
Sales | 5,765 | - | - | - | 5,765 |
Cost of sales | (3,494) | 41 | - | (2) | (3,455) |
Gross margin | 2,271 | 41 | - | (2) | 2,310 |
Selling, general and administrative expenses | (1,669) | 25 | 1 | 12 | (1,631) |
Research and development expenses | (250) | 6 | - | 10 | (234) |
Indirect costs | (1,919) | 32 | 1 | 22 | (1,864) |
Impairment of goodwill | - | - | - | - | - |
Other business income | 35 | - | (9) | (14) | 11 |
Other business expenses | (3) | - | 1 | 0 | (2) |
Income from operations | 383 | 73 | (7) | 7 | 455 |
Amortization3 | (56) | - | - | - | (56) |
Income from operations excluding amortization (EBITA) | 439 | 73 | (7) | 7 | 511 |
2024 | |||||
Sales | 6,143 | - | - | - | 6,143 |
Cost of sales | (3,701) | 47 | 1 | 11 | (3,642) |
Gross margin | 2,442 | 47 | 1 | 11 | 2,501 |
Selling, general and administrative expenses | (1,736) | 25 | 4 | 6 | (1,701) |
Research and development expenses | (266) | 2 | - | - | (265) |
Indirect costs | (2,002) | 27 | 4 | 6 | (1,965) |
Impairment of goodwill | - | - | - | - | - |
Other business income | 41 | - | (10) | (25) | 7 |
Other business expenses | (3) | - | - | 0 | (3) |
Income from operations | 477 | 74 | (5) | (7) | 540 |
Amortization3 | (66) | - | - | - | (66) |
Income from operations excluding amortization (EBITA) | 543 | 74 | (5) | (7) | 606 |
- For the year ended December 31, 2025, restructuring costs consisted of EUR 54 million of employee termination benefits (mainly in Professional, Consumer and Conventional), EUR 11 million of assets impairment, EUR 3 million of inventories write-down, and EUR 6 million of other costs related to restructuring programs.
For the year ended December 31, 2024, restructuring costs consisted of EUR 57 million of employee termination benefits (mainly in Professional and Conventional), EUR 9 million of assets impairment, EUR 5 million of inventories write-down and EUR 3 million of other costs related to restructuring programs. - Incidental items of EUR 7 million loss for the year ended December 31, 2025 were mainly related to environmental provisions for inactive sites and the discounting effect of long-term provisions (EUR 10 million loss, mainly in Professional and ‘Other’), impairment of development assets (EUR 10 million loss in Consumer) and gain on real estate transactions (EUR 14 million in Professional).
Incidental items of EUR 7 million gain for the year ended December 31, 2024 were mainly related to one-day FX loss from the devaluation of the Egyptian pound by the Egyptian government (EUR 10 million, mainly in Professional), environmental provisions for inactive sites and the discounting effect of long-term provisions (EUR 7 million, mainly in 'Other'), gains from movements in the indemnification positions with Koninklijke Philips N.V. originating from the separation (EUR 9 million, in 'Other'), and gain in real estate transactions (EUR 15 million, in Conventional). - Amortization and impairments of acquisition-related intangible assets and goodwill.
Free cash flow
The company discloses free cash flow as a supplemental non-IFRS financial measure, as the company believes it is a meaningful measure to evaluate the performance of the company’s business activities over time. The company understands that free cash flow is broadly used by analysts, rating agencies and investors in assessing the company’s performance. The company also believes that the presentation of free cash flow provides useful information to investors regarding the cash generated by the company’s operating activities after deducting cash outflows for additions of intangible assets, capital expenditures on property, plant and equipment and proceeds from disposal of property, plant and equipment. Therefore, the measure gives an indication of the long-term cash generating ability of the company’s business. In addition, because free cash flow is not impacted by purchases of businesses, it is less volatile than the total of cash flows from operating and investing activities. Free cash flow is also used by the company as a key financial measure to assess the operating performance of the company.
2024 | 2025 | |
|---|---|---|
Cash flows from operating activities | 514 | 531 |
Cash flows from investing activities | (72) | (110) |
Cash flows before financing activities | 442 | 421 |
Cash flows from operating activities | 514 | 531 |
Net capital expenditures: | ||
| (48) | (64) |
| (51) | (68) |
| 22 | 40 |
Free cash flows | 438 | 440 |
2024 | 2025 | |
|---|---|---|
Professional | 397 | 379 |
Consumer | 147 | 123 |
OEM | 81 | 14 |
Conventional | 55 | 42 |
Other1 | (243) | (119) |
Signify total | 438 | 440 |
- Non-allocated free cash flow items (e.g. tax, interest and costs in 'Other' not allocated to the businesses).
Net debt
Net debt is the sum of short-term debt, long-term debt minus cash and cash equivalents.
The net debt position as a percentage of the sum of the company’s equity (shareholders’ equity and non-controlling interests) and net debt are presented to express the financial strength of the company. The company uses this measure to assess the company’s financial position and understands it has similar use for analysts, rating agencies and investors.
2024 | 2025 | |
|---|---|---|
Short-term debt | 416 | 489 |
Long-term debt | 1,137 | 1,090 |
Gross debt | 1,553 | 1,579 |
Cash and cash equivalents | (633) | (621) |
Net debt | 920 | 957 |
Shareholders' equity | 3,162 | 2,673 |
Non-controlling interests | 105 | 94 |
Total equity | 3,267 | 2,767 |
Net debt and total equity | 4,187 | 3,725 |
Net debt divided by net debt and total equity (in %) | 22% | 26% |
Total equity divided by net debt and total equity (in %) | 78% | 74% |
Working capital
The company discloses working capital as a supplemental non-IFRS financial measure, as the company believes it is a meaningful measure to evaluate the company’s ability to maintain a solid balance between growth, profitability and liquidity. Working capital is broadly analyzed and reviewed by analysts and investors in assessing the company’s performance. This measure serves as a metric for how efficiently a company is operating and how financially stable it is in the short term. It is an important measure of a company’s ability to pay off short-term expenses or debts.
2024 | 2025 | |
|---|---|---|
Working capital | 422 | 329 |
Eliminate liabilities comprised in WoCa: | ||
| 1,588 | 1,363 |
| 11 | 7 |
| 196 | 201 |
Include assets not comprised in WoCa: | ||
| 4,541 | 4,111 |
| 52 | 37 |
| - | 2 |
| 633 | 621 |
| 13 | 2 |
| 48 | 45 |
Total assets | 7,505 | 6,720 |
- Excludes insurance receivables of EUR 45 million (2024: EUR 48 million) for which a legal provision is recognized for the same amount.
Other key performance indicators
Amongst others, management uses the following key performance indicators to monitor progress on our Brighter Lives, Better World 2025 sustainability program:
Brighter lives revenues represent the percentage of total revenues coming from all products, systems and services contributing to Food availability, Safety & security, or Health & well-being;
Circular revenues represent the percentage of total revenues coming from products, systems and services designed to preserve value and avoid waste categorized as Serviceable luminaires (incl. 3D printing), Circular components, Intelligent systems or Circular services.
2024 | 2025 | |
|---|---|---|
Brighter lives revenues as a % of total sales | 33% | 34% |
Circular revenues, as a % of total sales | 35% | 37% |
19 Definitions and abbreviations
Acquisition-related charges
Costs that are directly triggered by the acquisition of a company, such as transaction costs, purchase accounting related costs and integration-related expenses.
Adjusted EBITA
EBITA excluding restructuring costs, acquisition-related charges and other incidental items.
Adjusted EBITA margin
Adjusted EBITA divided by sales to third parties (excluding intersegment). "Operational profitability" also refers to this metric.
Adjusted gross margin
Gross margin, excluding restructuring costs, acquisition-related charges and other incidental items attributable to cost of sales.
Adjusted indirect costs
Indirect costs, excluding restructuring costs, acquisition-related charges and other incidental items attributable to indirect costs.
Adjusted research and development (R&D) expenses
Research and development expenses, excluding restructuring costs, acquisition-related charges and other incidental items attributable to research and development expenses.
Adjusted selling, general and administrative (SG&A) expenses
Selling, general and administrative expenses, excluding restructuring costs, acquisition-related charges and other incidental items attributable to selling, general and administrative expenses.
Ballasts
Lamp control gear inserted between the supply and one or more discharge lamps, which, by means of inductance, capacitance or a combination of inductance and capacitance, serves mainly to limit the current of the lamp(s) to the required value.
Capital employed
The sum of equity and net debt (excluding pension liabilities).
Compact fluorescent light (CFL)
CFLs usually combine a fluorescent light with an incandescent fixture.
Comparable sales growth
The period-on-period growth in sales excluding the effects of currency movements and changes in consolidation.
Consolidation effects
In the event a business is acquired (or divested), the impact of the consolidation (or de-consolidation) on the company’s figures is included (or excluded) in the calculation of the comparable sales growth figures.
Conventional lamps
Non-LED based light-emitting light sources, including incandescent lamps, halogen lamps, fluorescent lamps and high-intensity discharge lamps.
Conventional luminaires
Light fixtures with a conventional socket (e.g. a screw socket for a conventional lamp or LED lamp).
Currency effects
Calculated by translating the foreign currency financials of the previous period and the current period into euros at the same average exchange rates.
Custom duties
Tax imposed on imports and exports of goods charged to Signify's Consolidated Statement of Income. Typically, these are reflected in customs declarations and tend to be payable, and are paid, regularly (often monthly) throughout the year, shortly after the submission of the declaration. These form part of operating costs.
EBIT
Income from operations.
EBITA
Income from operations excluding amortization and impairment of acquisition-related intangible assets and goodwill.
EBITDA
Income from operations excluding depreciation, amortization and impairment of non-financial assets.
Electronics
Units that regulate the current going through a light source.
Employees
Employees of Signify at the end of the period expressed on a full-time equivalent (FTE) basis.
Fluorescent lamp
A lamp which produces light with an electric current conducted through an inert gas producing ultraviolet light that is invisible to the human eye.
Free cash flow
Net cash provided by operating activities minus net capital expenditures. Free cash flow includes interest paid and income taxes paid.
Global Reporting Initiative (GRI)
The Global Reporting Initiative is a network-based organization that pioneered the world’s most widely used sustainability reporting framework. GRI is committed to the framework’s continuous improvement and application worldwide. GRI’s core goals include the mainstreaming of disclosure on environmental, social and governance performance.
Gross debt
The sum of short-term debt and long-term debt.
Gross margin
Sales minus cost of sales.
Halogen lamp
A type of incandescent lamp with a capsule that holds a special halogen gas composition around the heated filament to increase the efficacy of the incandescence.
High-intensity discharge lamp (HID)
A type of conventional lamp that uses electricity arcs between two electrodes to create an intensely bright light where mercury, sodium or metal halide gas act as the conductor.
Incidental items
Any item with an income statement impact (loss or gain) that is deemed to be both significant and not part of normal business activity. Other incidental items might extend over several quarters within the same financial year.
Incandescent lamp
A conventional lamp that produces visible light by heating a tungsten filament inside a glass bulb usually filled with an inert gas.
Income tax paid
Income tax paid by Signify in tax jurisdictions, based on income on a cash basis.
Indirect costs
The sum of Selling, general and administrative and Research and development expenses.
International Standardization Organization (ISO)
The International Standardization Organization is the world’s largest developer and publisher of International Standards. ISO is a network of the national standards institutes of more than 160 countries, one member per country, with a Central Secretariat in Geneva, Switzerland, that coordinates the system. ISO is a nongovernmental organization that forms a bridge between the public and private sectors.
LED
Light-emitting diode.
LED-based sales
Sales provided by products, systems and services based on LED lighting technologies.
LED drivers
Lighting electronics that convert input power into a current that remains constant despite fluctuations in voltage.
LED lamp
A solid-state semiconductor device that converts electrical energy directly into light.
LED luminaires
Light fixtures where LED modules are integrated into the luminaire as a light source and cannot be separated from the luminaire by the user.
LED modules
Light generating units around which luminaires are built for the purpose of emitting distributed patterns of light.
Light-as-a-Service contract
Contracts enabling an integrated solution for customers where customers pay for the provision of light to their premises, while the company plans and builds the lighting infrastructure and ensures its performance until the end of the contract.
Lighting services
Services offered to customers building on a lighting system and enabled by data.
Lighting systems
The combination of luminaires, controls and software. The automation and related controls of lighting within a room, building or outdoor facilities for end users.
Luminaire
Electrical devices that produce, control and distribute light. Also called light fixtures. They consist of one or more light sources, lamps or sockets that connect the lamps to the electrical power (as well as drivers in some luminaires), and the mechanical components required to support or attach the housing.
Net capital expenditures
Additions of intangible assets, capital expenditures on property, plant and equipment and proceeds from disposal of property, plant and equipment.
Net debt
Short-term debt, long-term debt minus cash and cash equivalents.
Net leverage ratio
The ratio of consolidated reported net debt to consolidated reported EBITDA for the purpose of calculating the financial covenant.
Non-governmental organization (NGO)
A non-governmental organization is any nonprofit, voluntary citizens’ group which is organized at a local, national or international level.
OEM
Original equipment manufacturer.
Other taxes
Other taxes comprise environmental taxes, property taxes, and other contributions to governments in the form of taxes. This also includes dividend withholding tax payments on behalf of our shareholders.
Payroll taxes
This comprises all payroll taxes including social security contributions, both in Signify’s capacity of employer, which form part of operating costs, and in the form of remittance to government on behalf of employees. Typically, these taxes are reflected in payroll tax returns made to governments and tend to be payable, and are paid, regularly (often monthly) throughout the year, shortly after the submission of the return.
R&D expenses
Research and development expenses.
Renewable electricity
Percentage of total electricity usage from renewable sources.
Responsible Business Alliance (RBA)
The Responsible Business Alliance (RBA, formerly known as Electronic Industry Citizenship Coalition) was established in 2004 to promote a common code of conduct for the electronics and information and communications technology (ICT) industry. The RBA now includes more than 100 global companies and their suppliers.
Restructuring costs
The estimated costs of initiated reorganizations that have been approved by the company, and which generally involve the realignment of certain parts of the organization. Restructuring costs include costs for employee termination benefits for affected employees and other costs directly attributable to the restructuring, such as impairment of assets and inventories.
Return on capital employed
Income from operations adjusted for tax at the effective tax rate, divided by the year-on-year average capital employed.
SG&A expenses
Selling, general and administrative expenses.
Signify
Signify N.V. (the “Company”) and its subsidiaries, within the meaning of section 2:24b of the Dutch Civil Code.
SOFR
Secured overnight financing rate (SOFR) administered by the Federal Reserve Bank of New York (or any other person which takes over the administration of that rate) published by the Federal Reserve Bank of New York (or any other person which takes over the publication of that rate).
Switch
Wall-mounted devices designed to (i) change the electric connections among its terminals or (ii) engage with the pins of a plug and having terminals for the connection of cables or cords (i.e. socket contacts).
VAT
Value-added tax (VAT) including similar indirect taxes such as Goods and Service tax (GST) and Sales tax. The VAT contributions in a jurisdiction is the balance between output VAT and input VAT. These taxes form part of a VAT tax return made to the government and tend to become payable, and are paid, regularly (often quarterly) throughout the year shortly after submission of the VAT tax returns.
Weighted average statutory income tax rate
The aggregation of the result before tax multiplied by the applicable statutory tax rate without adjustment for losses, divided by the company result before tax.
Women in leadership
Percentage of women in relation to the total population in compensation grades H22 and above. It includes employees with or without a defined end date, international assignees and members of the Board of Management.
Working capital
The sum of Inventories, Trade and other receivables (excluding insurance receivables for which a legal provision is recognized for the same amount), Other current assets, Derivative financial assets minus the sum of Trade and other payables, Derivative financial liabilities and Other current liabilities (excluding dividend-related payables).
20 Forward-looking statements and other information
Forward-looking statements and risks & uncertainties
This document contains forward-looking statements that reflect the intentions, beliefs or current expectations and projections of Signify N.V. including statements regarding strategy, estimates of sales growth and future operational results.
By their nature, these statements involve risks and uncertainties, and there may be many factors that could cause actual results or outcomes to differ materially from those expressed in or implied by these statements. These risks, uncertainties and other factors include macroeconomic volatility, geopolitical and regulatory changes including trade tariffs, competitive price pressure, technological disruptions, reduced governmental funding for energy efficiency and sustainability, currency risks, changes in international tax laws, effects of environmental crises, climate change and natural disasters, cyber security risk, and export controls and sanctions.
Refer to chapter 13, Risk factors and risk management, for a discussion of Signify's key risks. Such risks, uncertainties and other important factors should be read in conjunction with the information included in this Annual Report. The risks described in this Annual Report may not include all factors that ultimately affect Signify. Additional risks and uncertainties that are currently not known to Signify or not considered material may have a material adverse effect on the business, strategy, results of operations, financial condition and prospects of Signify, or prevent the forward-looking events discussed from occurring. Signify undertakes no duty to and will not necessarily update any of the forward-looking statements in light of new information or future events, except to the extent required by applicable law.
Market and industry information
All references to market share, market data, industry statistics and industry forecasts in this document consist of estimates compiled by industry professionals, competitors, organizations or analysts, of publicly available information or of the Group's own assessment of its sales and markets. Rankings are based on sales unless otherwise stated.
Non-IFRS financial measures
Certain parts of this document contain non-IFRS financial measures and ratios, such as comparable sales growth, adjusted gross margin and indirect costs, EBITA, Adjusted EBITA, free cash flow, Net debt, Working capital, Brighter lives revenues, Circular revenues and other related ratios, which are not recognized measures of financial performance or liquidity under IFRS. The non-IFRS financial measures presented are measures used by management to monitor the underlying performance of Signify's business and operations. Not all companies calculate non-IFRS financial measures in the same manner or on a consistent basis and these measures and ratios may not be comparable to measures used by other companies under the same or similar names. A reconciliation of these non-IFRS financial measures to the most directly comparable IFRS financial measures is contained in this document. For further information on non-IFRS financial measures, see chapter 18, Reconciliation of non-IFRS financial measures.
Fair value information
In presenting Signify's financial position, fair values are used for the measurement of various items in accordance with the applicable accounting standards. These fair values are based on market prices, where available, and are obtained from sources that are deemed to be reliable. Readers are cautioned that these values are subject to changes over time and are only valid on the balance sheet date. When quoted prices or observable market values do not exist, fair values are estimated using valuation models that we believe are appropriate for their purpose. They require management to make significant assumptions with respect to future developments that are inherently uncertain and might therefore deviate from actual developments.
Critical assumptions used are disclosed in the financial statements. In certain cases, independent valuations are obtained to support management’s determination of fair values.
IFRS basis of presentation
The financial information included in this document is based on International Financial Reporting Standards (IFRS) as endorsed by the European Union (EU), as explained in significant accounting policies, unless otherwise indicated.
CSRD sustainability statements
The Sustainability statement included in this document is prepared in accordance with the European Sustainability Reporting Standards (ESRS) pursuant to the European Corporate Sustainability Directive 2022/2464/EC (CSRD) and with the specifications adopted pursuant to the EU Taxonomy Regulation.
Statutory financial statements
Chapter 15, Consolidated financial statements and chapter 16, Signify N.V. financial statements, contain the statutory financial statements of Signify N.V.
Regulated information
This document contains regulated information within the meaning of the Dutch Financial Markets Supervision Act.
High Tech Campus 48
5656 AE Eindhoven
The Netherlands
E-mail: IR@signify.com
www.signify.com
Dutch Chamber of Commerce
registration no. 65220692
VAT NL8560.25.823.B.01