
This document is the PDF/printed version of the 2025 Annual Report of BNG and has been prepared for ease of use. The 2025 Annual Report was made publicly available pursuant to section 5:25c of the Dutch Financial Supervision Act (Wet op het financieel toezicht), and was filed with Netherlands Authority for the Financial Markets in European single electronic reporting format (the ESEF package). The ESEF package is available on the company’s website at https://www.bngbank.nl/over-bng/resultaten-en-jaarverslagen/jaarverslagen and includes a human-readable XHTML version of the 2025 Annual Report. In any case of discrepancies between this PDF version and the ESEF package, the latter prevails. |
Foreword
Connecting force behind public investments
The Netherlands faces major investment challenges. There is an urgent need for affordable housing, accelerated energy transition, innovation in education, quality healthcare, and infrastructure renewal. Public investment will be crucial for achieving this, and BNG is making the difference.

More than a bank
For over a century, we've played a crucial role as a stable financier and partner for governments and (semi-)public institutions. We know the public sector down to the finest details, oversee the playing field, and facilitate investments in areas such as housing, energy, education, healthcare, and infrastructure. We collaborate with our clients on more than just financing, building connections and thus enabling them to achieve their social goals faster and more effectively.
Every euro of BNG's equity creates approximately thirty euros in public investment opportunities—from affordable housing and strong neighborhoods to sustainable energy, future-proof schools, and healthcare institutions. These investments may seem obvious, but they're not. They're directly tangible for the residents of the Netherlands, contributing to livable, resilient communities, both now and in the future.
Loan portfolio and profit development
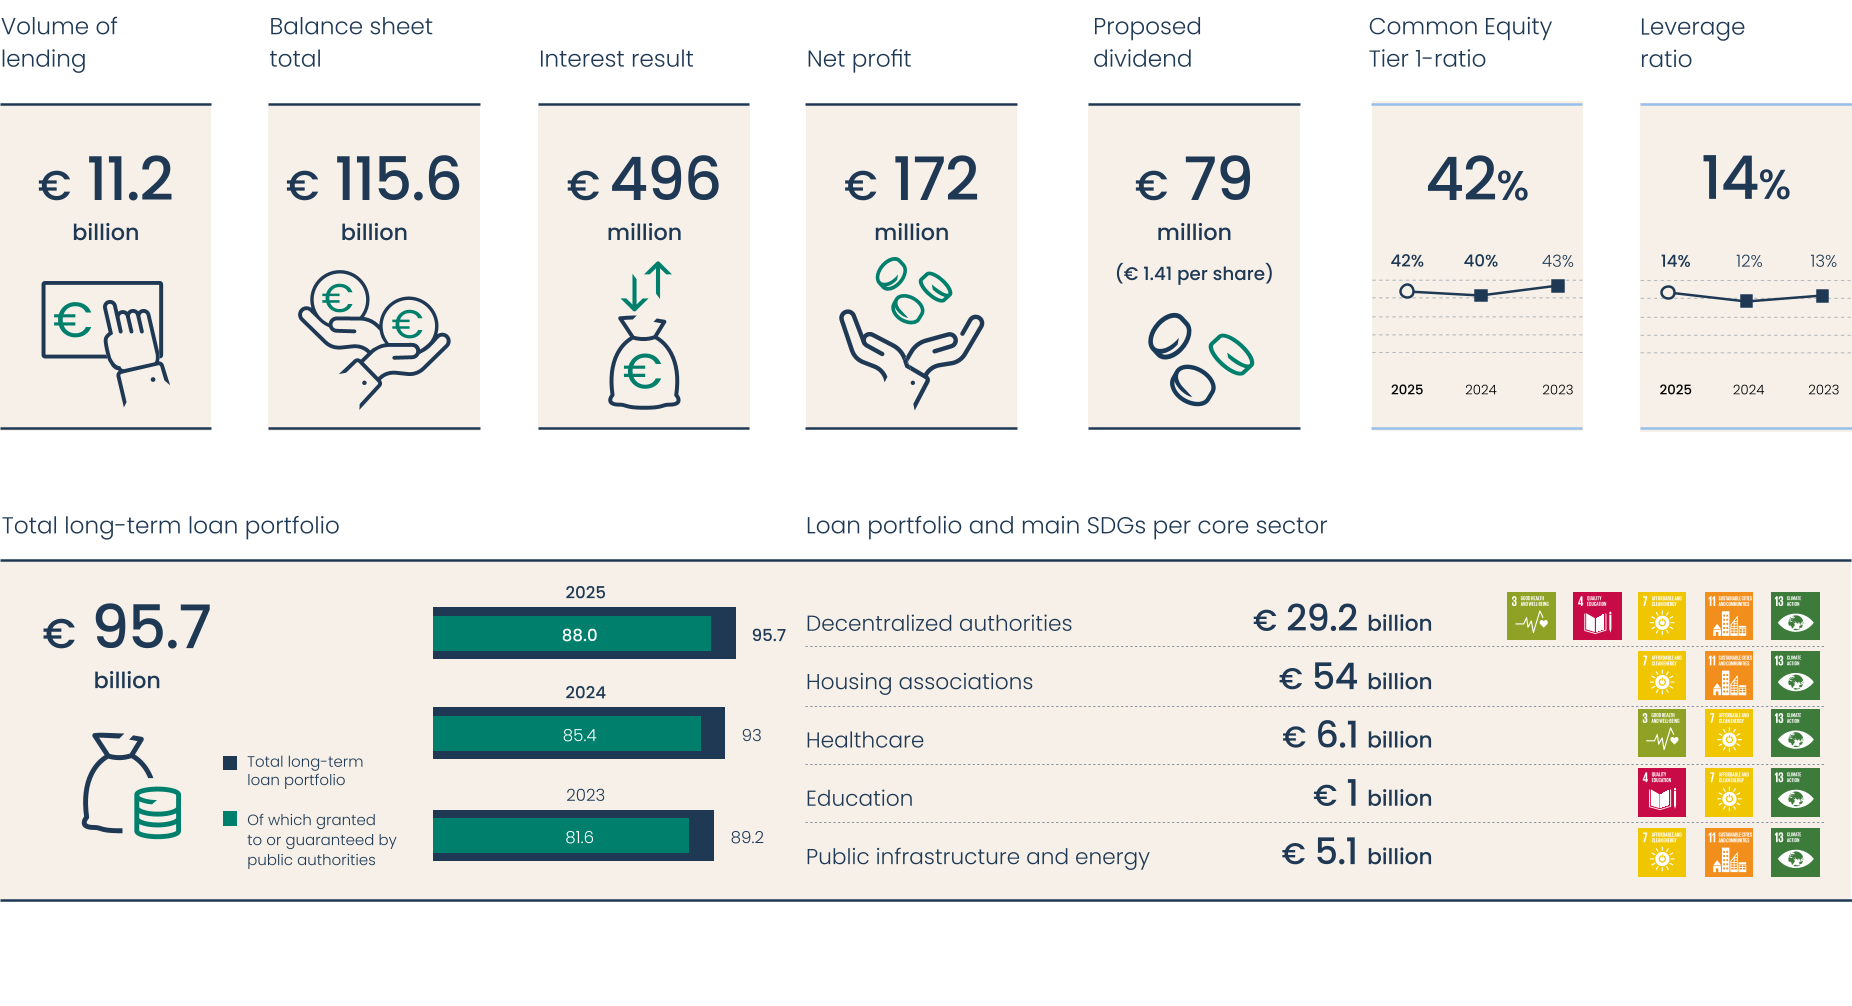
The steadily growing demand from our clients also formed the basis for further growth of our loan portfolio in 2025. We issued EUR 11.2 billion in new long-term loans, and the size of the loan portfolio increased from EUR 93 billion in 2024 to EUR 95.7 billion in 2025. Despite volatile market conditions and geopolitical tensions, demand for credit remained high, particularly from municipalities and housing associations. To facilitate this, we attracted EUR 16.6 billion in long-term financing. A significant portion, EUR 5.4 billion, was in ESG bonds, further strengthening our leading position in sustainable financing.
We achieved a net profit of EUR 172 million, EUR 122 million lower than in 2024, as a result of both external factors and deliberate strategic decisions. Lower interest result, a negative result on financial transactions, higher total operating expenses and impairments contributed to the decline in net profit.
Accelerate where it counts
In 2025, we took additional steps forward in the areas of housing and energy transition – two urgent societal challenges with significant impact. The housing market is stuck, with a shortage of nearly 400,000 homes. This hinders mobility, livability, and growth. Municipalities and housing associations want to accelerate this process but are hampered by complex regulations, rising costs, and infrastructure bottlenecks. We are actively contributing to addressing the shortage of social and mid-range rental housing. We do this by making loans available and putting solutions for these obstacles on the agenda of relevant decision-makers and policymakers. In this way, we contribute to a smoother housing market and accelerate construction.
At the same time, the energy transition requires clear plans, collaboration, and financial strength. We want green energy to remain accessible and affordable for everyone, so that households on a tight budget can also participate. Therefore, we are taking the lead in collaborating with the sector to create tools and frameworks, for example, through the revision of the Dutch Heat Act (Warmtewet) and a guarantee scheme for sustainable energy projects.
On the way to transition
Starting in 2026, we will launch a three-year transition program aimed at increasing our social value. We will do this by expanding our loan portfolio, intensifying partnerships with our clients, and simultaneously reducing costs.
We remain committed to contributing to increasing the supply of affordable housing and accelerating the energy transition. Our goal is to become the strategic partner for our clients, collaborating with them to design solutions, structure investment projects, and then finance them. We also want to connect clients from various sectors at the regional level and actively engage with regional investment projects, so that together we can achieve a sustainable impact.
These steps forward also require adjustments within our organisation. In 2025, we began simplifying and professionalising our internal organisation. The reorganisation we are currently undertaking will lay the foundation for greater effectiveness and productivity, accelerate digitalisation, and reduce costs. As usual, this requires temporary investments, resulting in higher short-term costs.
Our ultimate goal is to continue delivering our social and green added value. Together we make the Netherlands stronger, more livable, and more future-proof.
On behalf of the Executive Committee,
Philippine Risch
CEO
Key figures 2025
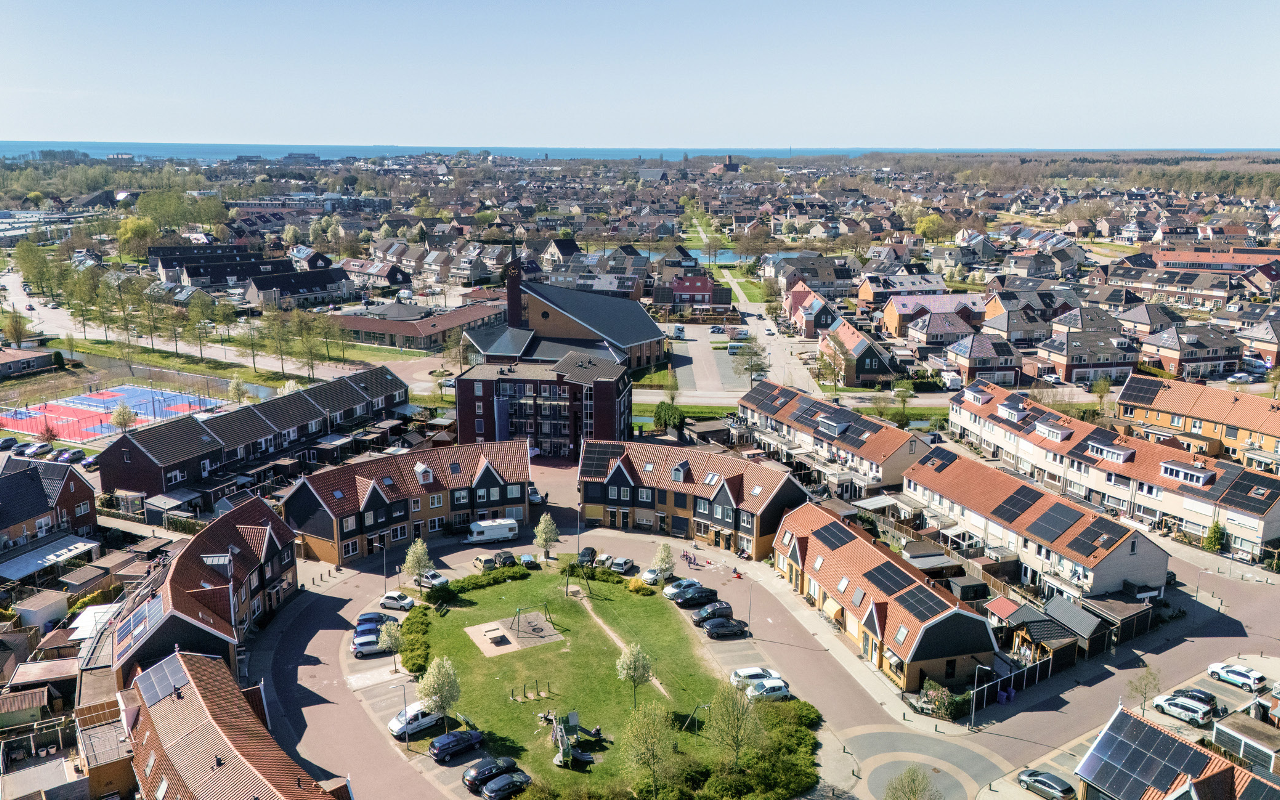
From a polluting economy to a climate-positive society, from a housing shortage to livable residential environments, and from vulnerable neighborhoods to future-proof neighborhoods – these societal transitions demand cooperation and concrete, meaningful steps. BNG is more than just a financier; we collaborate with housing associations, municipalities, healthcare institutions, and other public organisations on a sustainable future. We use our financial resources specifically to strengthen green spaces, well-being, and social progress. We view financing not just as money, but as a powerful tool for positive change. In this way, BNG positions itself as a partner in impact: bank of added value.

1.1 Social progress
We are committed to lasting social progress. As a trusted partner in the public sector, we strengthen organisations that are building a more social and sustainable Netherlands. Together, we give financial resources meaning by deploying them where they truly make a difference.
As one of the world's three safest banks and with Triple-A rating, we offer financing that is not only affordable and accessible but also contributes to sustainability and social impact. Whether it's affordable housing, improved healthcare facilities, or investments in climate-resilient living environments, we facilitate solutions that create lasting social value. In this way, together with our clients, we contribute to a resilient and future-proof society.
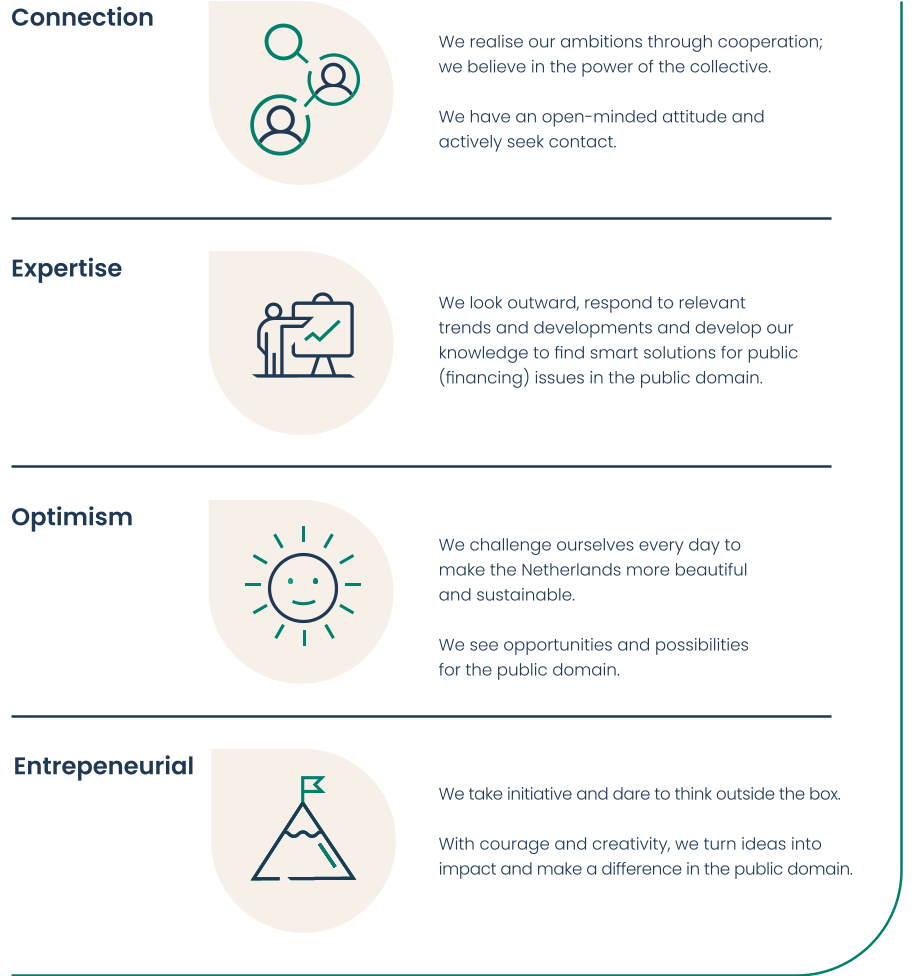
1.2 The world around us
Economies, technologies, international relations, and society are changing rapidly. This dynamism demands agility and offers room for innovation and sustainable financing. We see a huge investment challenge in and for the public domain, a point confirmed by the Wennink report. Moreover, European regulations are changing, challenging us to constantly adapt. By closely monitoring trends and deploying our capital effectively, we develop products that help clients achieve sustainable and financial prosperity. This is how we remain a stable and committed partner for the Netherlands.
 Politics
Geopolitics
Geopolitical tensions—from Ukraine to Gaza and global trade tensions—continue to put pressure on financial markets. Polarisation and fragmentation in major economies are hampering policy consensus, increasing uncertainty for investors. Since the change of power in the United States, the predictability of a major trading partner has further declined, leading to increased volatility worldwide. At the same time, concerns about concentration risks are growing as large American tech companies increasingly dominate. For a Dutch systemically important bank like BNG, this combination of geopolitical uncertainty, volatility, and market dominance means that prudent risk management, broad funding diversification, and further strengthening of the balance sheet remain essential. At the same time, BNG is seen as a safe haven in turbulent times, making us a stable factor in the financial system and contributing to market confidence and continuity.
Politics in the Netherlands
The fall of the Schoof cabinet ultimately had little direct impact on the progress of policy themes that enjoy broad political support. Regardless of party affiliation, there remains consensus on the need to invest in the public sector, particularly in affordable housing. Accelerating construction projects and supporting municipalities also remain priorities, which aligns well with our own strategic themes. Mid-market rental housing is playing an increasingly important role in this, both for politicians and for our bank. We will continue to closely monitor developments surrounding the new coalition agreement to anticipate the consequences for our clients in a timely manner. It is encouraging that the European Commission decided at the end of 2025 that Member States may provide state aid for mid-range rental housing.
Defense and Cybersecurity
The focus on defense, resilience, and strategic independence is increasing due to geopolitical tensions and high global debt ratios; the Netherlands is relatively well-positioned and can therefore invest more in defense and digital infrastructure. Structural investments in cybersecurity remain necessary for the financial sector due to ongoing attacks on critical infrastructure, which permanently increases costs for banks. Meanwhile, the focus in the debate about technological dependency is shifting from efficiency to concentration on large cloud providers and the need for digital autonomy.
Regulation
Regulatory focus in the banking sector is strongly on ESG risk management, with new European guidelines requiring banks to implement risk management practices, in which ESG risks play a significant role, alongside increasing geopolitical and macroeconomic uncertainties. New European guidelines require banks to systematically identify, measure, and report ESG risks. At the same time, stricter capital requirements are being introduced under the latest Basel III regulations, and operational resilience to digital risks has been strengthened through the Digital Operational Resilience Act (DORA). These regulations require significant invesments in risk management and reporting systems, further strengthening the sector's stability and transparency in a complex and changing environment. We are also focusing on Risk Data Aggregation and Risk Reporting (RDARR), focused on collecting and reporting risk data, which will have implications for our processes.
 Economic, ecological and social
Monetary policy
Central banks are easing their policies again now that inflation is stabilising. The ECB and the Fed have gradually lowered their interest rates as the yield curve normalises. Customers are benefiting from lower borrowing costs and more short-term loans. From a risk management perspective, this is beneficial due to lower refinancing risks, although it results in slightly lower returns for the bank.
Ecology & Sustainability
Expectations regarding sustainability and social impact for financial institutions are changing due to the varying approaches to ESG in different parts of the world. We recognise these international trends and, as a bank, adhere to our own ESG agenda because we consider it important for our social contribution. We are strongly focussing on housing and the energy transition.
We have had our environmental goals independently validated by the Science Based Targets initiative (SBTi). With our impact-driven strategy, we actively respond to societal and demographic changes, in keeping with our role in a changing world.
Labor market
The labor market remains tight, and attracting talent is challenging, especially in digital and technology fields. Labor force participation is stable, with a slight increase among older employees due to adjustments in pension policies. Diversity and inclusion remain important priorities for employers and require ongoing commitment to achieve visible changes in participation rates. We expect our strong purpose to contribute to this. It already appeals to a broad group of professionals, which helps us attract and retain specialist staff. These developments require us to continuously invest in training and job satisfaction to remain competitive.
 Digitisation and technological developments
Digitisation and technology
Digitisation remains a driving force in the financial sector. Banks are investing heavily in digital transformation and cybersecurity to improve customer experience and modernise technological platforms. Generative AI offers significant opportunities for productivity and revenue growth. At our bank, digitisation remains a high priority, with stability and security always prioritised. At the same time, as a bank, we choose to focus primarily on proven technologies. This ensures reliability and stability, while carefully and purposefully implementing digital innovations.
Efficient processes
Due to technological advancements and new ways of working, banks are increasingly striving for efficiency in their processes. This means that many manual tasks are being automated, allowing employees to focus on activities that add more value for customers. BNG strives to improve service at lower costs through more efficient processes. To achieve this, we have initiated a reorganisation that will result in a more dynamic, efficient, and agile organisation.
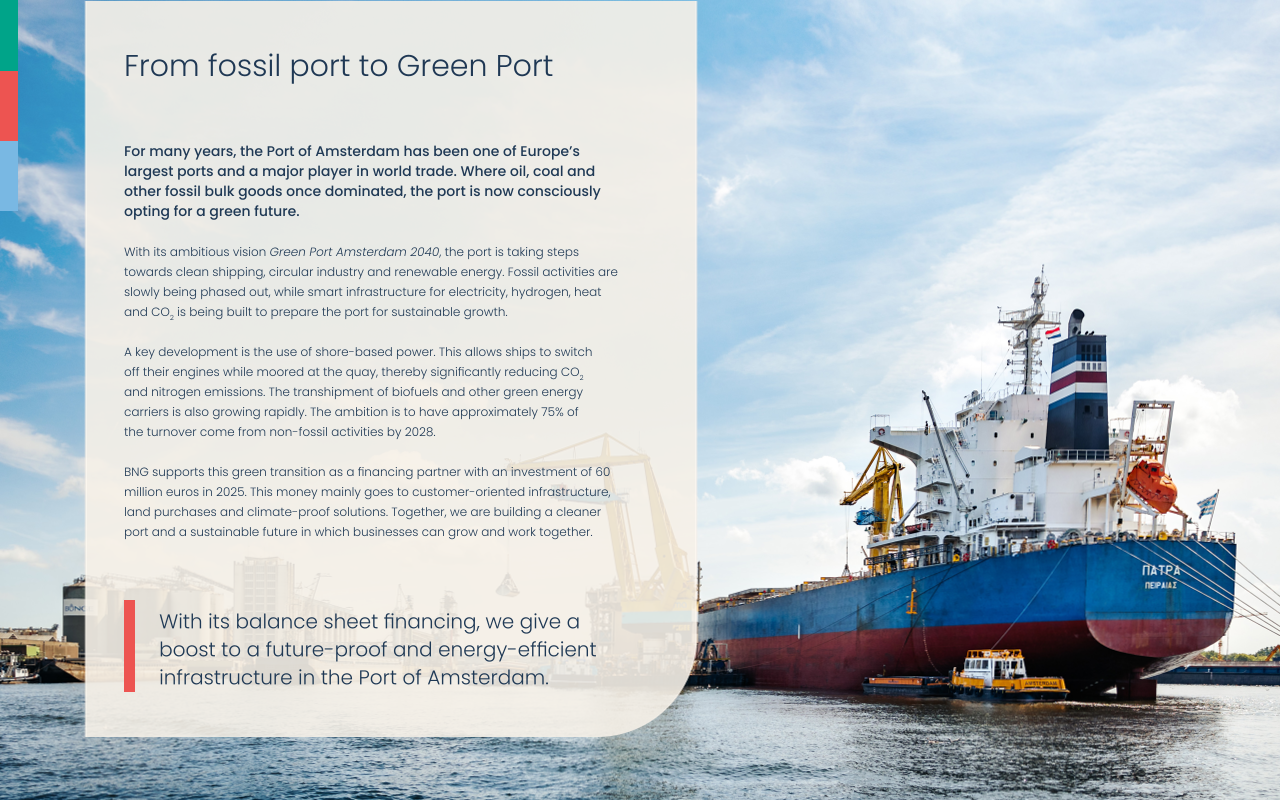
1.3 Strategy
SWOT analysis
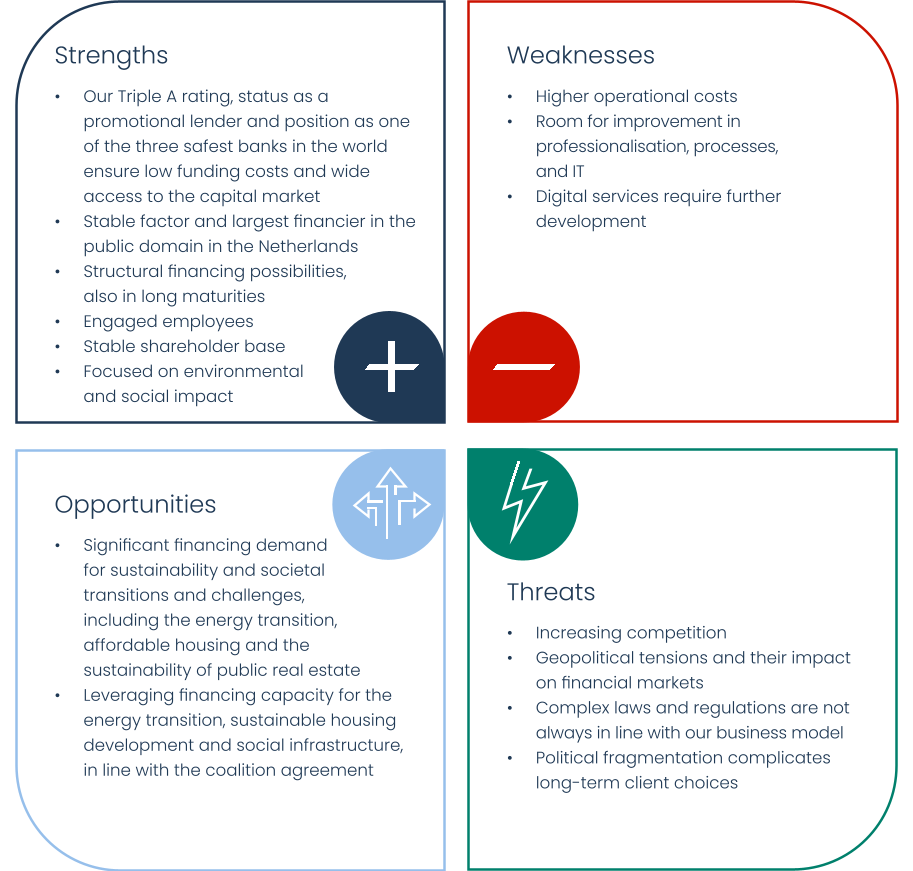
Our market-leading position is no reason to rest on our laurels. To maintain this strong position, we actively respond to new developments. With our current strategic choices, including contributing to the acceleration of housing construction and the energy transition, and further professionalisation, we are improving our organisation and working methods to remain future-proof.
We continuously review our business model and ensure that our resources and capabilities align with current needs. This allows us to manage risks and seize new opportunities. The overview below summarises our key insights and demonstrates how we maintain our strong position in a changing environment.
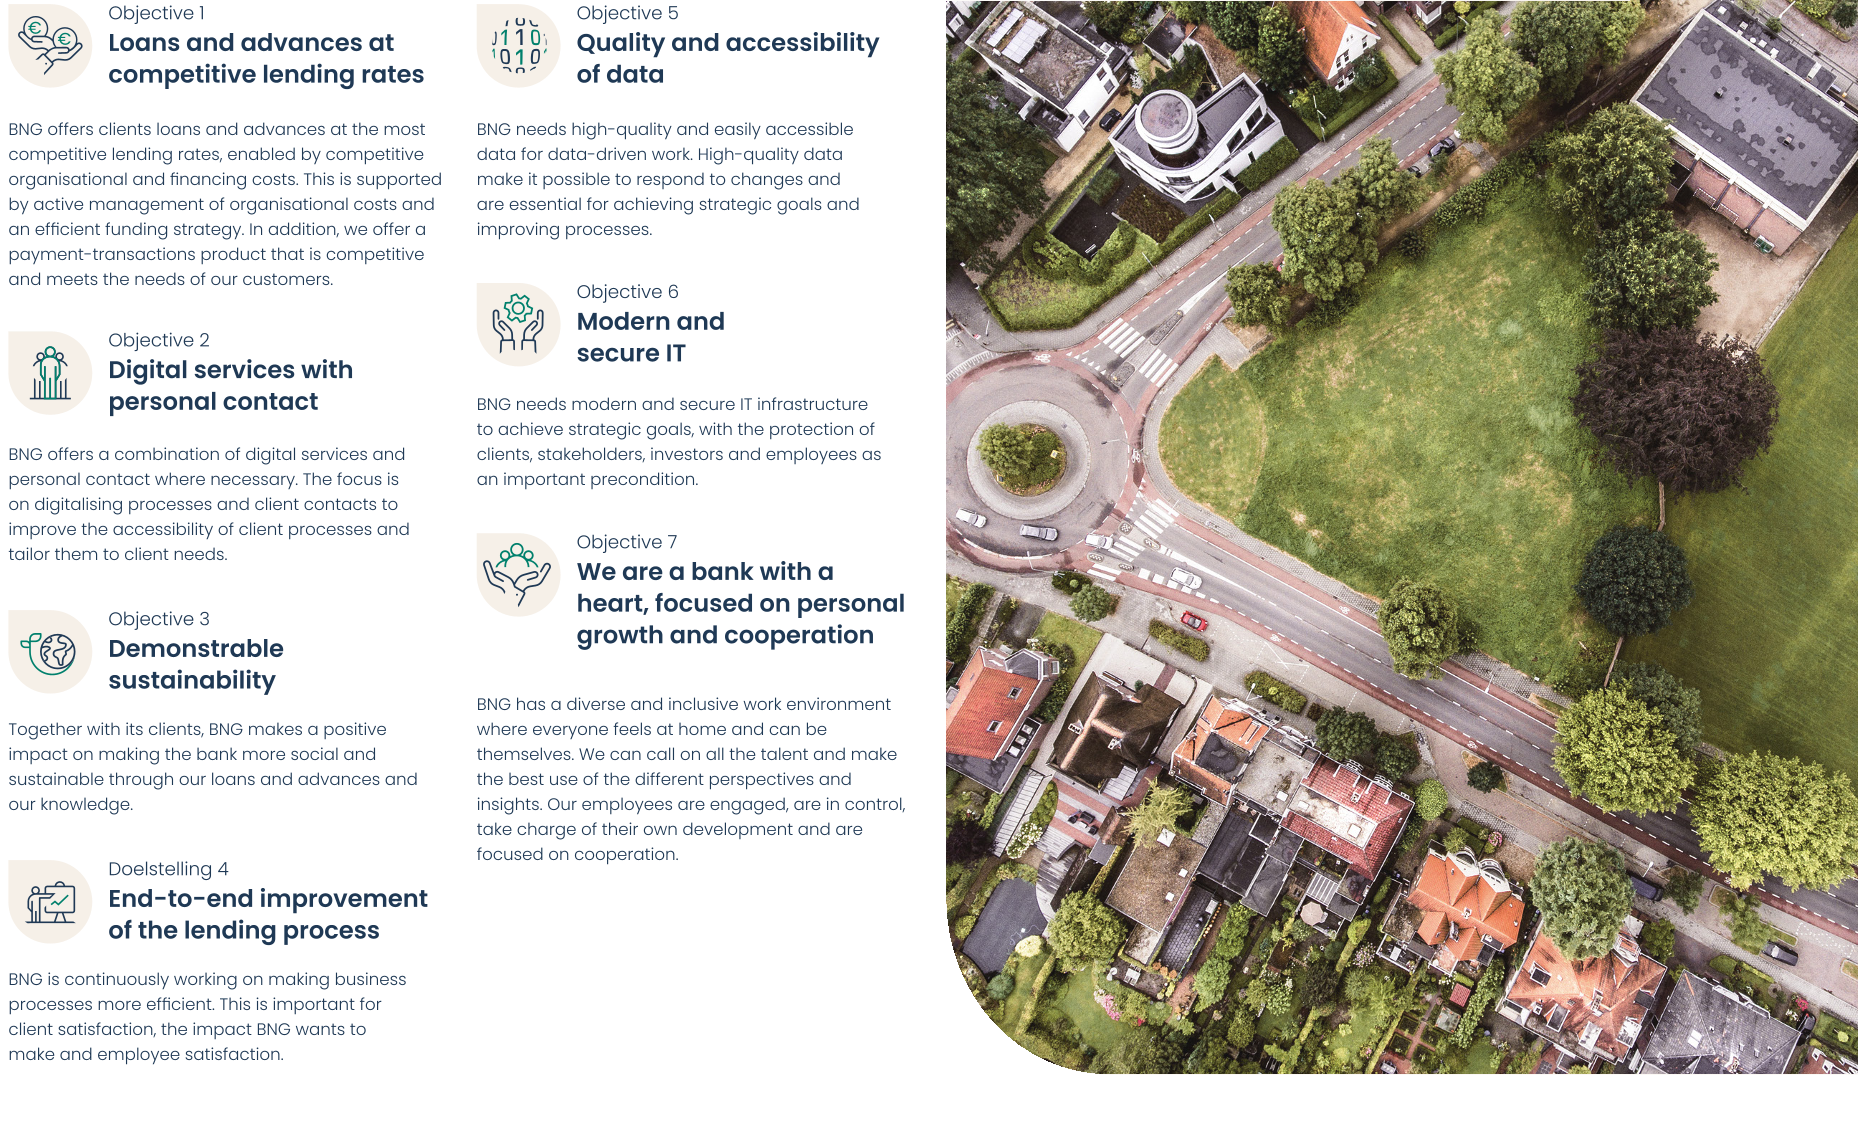
Our Road to Impact (2024-2025)
The Our Road to Impact strategy ran from 2024 to 2025. Within this strategy, we formulated clear goals to increase our social impact and optimally support our clients. Its core consisted of seven strategic objectives, as published on the previous page and of which we report on in this Annual Report.
Road to More Added Value (2026-2028)
2025 was a transitional year in which we laid the foundation for our transformation initiative toward a more modern and agile organisation. Through a strategic and competitive analysis, we clearly identified our strengths and areas for improvement. In discussions with stakeholders, clients, and investors, we updated our understanding of strengths, weaknesses, opportunities, and threats.
We explicitly addressed future trends, stakeholder expectations, and external risks such as ESG factors. This allows us to better understand the implications of these developments for the sustainability of our business model and our strategic choices.
With clear choices, we collaborate with clients to finance sustainable improvements and attract capital that aligns with investors' impact needs. In doing so, we are developing a strategy that responds to the opportunities and challenges of today and tomorrow.
This analysis has led to a new strategy and a sharpened ambition: creating more value with fewer resources. In 2025, we launched various improvement initiatives in the areas of strategy, structure, people, and processes. This will prepare our organisation for the transformation to a new business model, which is essential for achieving our revised strategic ambitions.
Effective 2026, the "Our Road to Impact" strategy will be replaced by a new, bank-wide strategy called "Route to More Added Value."
Our refined strategy is clear: BNG is the bank for social and green added value. We remain the reliable financier of affordable loans to the public sector, with a focus on financing solutions for the most urgent social issues. By investing in the energy transition, affordable housing, and sustainable social real estate, we are committed to concrete progress for people and communities. We are also actively exploring new financing opportunities for social challenges in the Netherlands, such as investments in defense.
2026 is the first year of a three-year transformation. The transformation focuses on the following strategic priorities:
Strengthening our position in the broader public sector, with a greater focus on:
Accelerating the transition to affordable energy
Increasing financing for affordable, social, and mid-range rental housing
A streamlined organisation with a low hierarchy and clear responsibilities.
A workforce with highly qualified and motivated employees and a culture that is highly professional, collaborative, optimistic, and entrepreneurial.
Customer-focused, simplified, efficient, and more digitalised processes, supported by data, data analytics, and AI.
A future-proof technology landscape and supporting processes.
1.4 Materiality analysis
Business Model and Strategy
As a bank of and for the public sector, we focus on increasing social value for our clients and other stakeholders. Sustainability is an integral part of our activities and is closely linked to our strategy, decision-making, and products. The materiality analysis helps us determine which sustainability topics are most relevant to BNG and its stakeholders and where we can exercise our responsibility and influence. This chapter provides an overview of the material impacts, risks, and opportunities, their relationship to our strategy (of 2025) and business model, and the methodology used for the Double Materiality Assessment (DMA).
The Double Materiality Analysis
In 2025, we conducted our first double materiality analysis in line with the requirements of the European Sustainability Reporting Standards (ESRS). In previous years, we based our materiality analysis on the GRI guidelines. The key difference is that we now assess both impact materiality and financial materiality.
A sustainability topic is considered material when it meets the criteria for impact materiality, financial materiality, or both.
Impact Materiality (Inside-Out Perspective)
This perspective considers the actual and potential positive and negative effects of our activities on people and the environment. For BNG, this includes, for example, the effects of the activities we finance, the contribution of our investments to social goals, and the direct impact of our products and services through our business relationships.
Financial Materiality (Outside-In Perspective)
This perspective focuses on the risks and opportunities for BNG arising from changes in society and the environment. For us, these include climate- and environment-related risks that could impact our financial position, strategy, and ability to create social value.
Our material themes
In assessing sustainability topics, we based our assessment on the ESRS themes. In addition, BNG-specific themes have been added to explicitly demonstrate how our activities contribute to social impact in the public domain, such as affordable financing and sufficient housing.
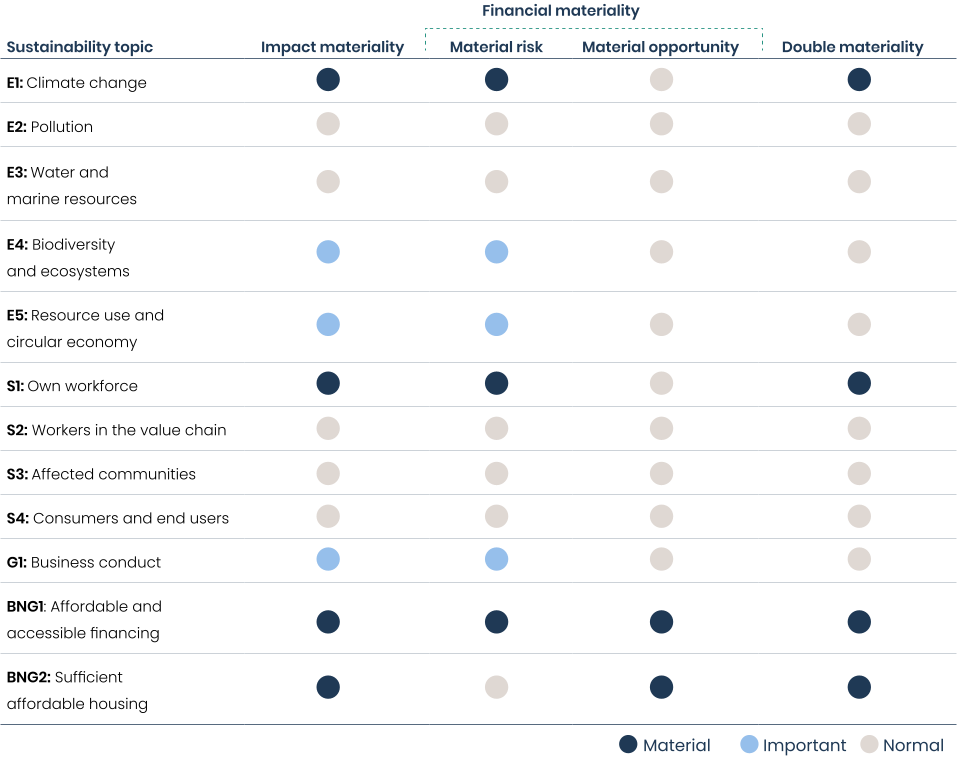
Climate change
BNG is aware of the negative impact that financing emission-intensive clients and sectors can have on CO2 emissions. Risks include reputational risks and potential fines for insufficient climate mitigation policies. At the same time, the transition to a sustainable economy offers opportunities to encourage clients to make climate-friendly investments.
Our own employees
Our employees are the core of our organisation. Diversity, inclusion, training, and equal treatment have a positive impact on employee satisfaction. At the same time, it is important that BNG continues to strive for good employment practices by paying sufficient attention to knowledge development and work-life balance in order to limit operational and financial risks.
Affordable and accessible financing
BNG focuses on making affordable financing available to the public sector. Through our competitive terms and focus on social clients, we create a positive impact on public facilities and encourage sustainable investments through Sustainability and Social Bonds. At the same time, we ensure that internal costs do not affect BNG's competitive position. The increasing need for investment in the public sector also offers opportunities to expand our services.
Sufficient affordable housing
Housing associations are a key sector within BNG. Through affordable and accessible financing, we support the sustainability improvements of existing homes and the construction of new social housing. At the same time, we see opportunities due to the growing demand for credit for sustainability improvements and new construction, allowing BNG to make a tangible contribution to affordable and sustainable housing in the Netherlands.
The overview below shows how each material topic contributes to societal value, which risks we identify, and which opportunities arise to further increase our impact.
IRO type | Description | Upstream | Mainstream | Downstream |
|---|---|---|---|---|
Climate change | ||||
Impact |
| X | ||
Risk |
| X | ||
| X | |||
Own workforce | ||||
Impact |
| X | ||
| X | |||
| X | |||
| X | |||
| X | |||
Risk |
| X | ||
Affordable and accessible financing | ||||
Impact |
| X | ||
| X | |||
| X | |||
Risk |
| X | ||
Opportunity |
| X | ||
Sufficient affordable housing | ||||
Impact |
| X | ||
| X | |||
Opportunity |
| X | ||
| X | |||
1.5 Stakeholder engagement and value creation
Stakeholder engagement
We actively engage with stakeholders. These conversations are often part of our daily work and take place at various levels within the organisation. The table below provides an overview.
Stakeholder | Involvement |
|---|---|
Clients | We have regular conversations with our clients, where, in addition to financial matters, social impact and sustainability are playing an increasingly prominent role. |
Shareholders | General Meeting, Extraordinary General Meeting and discussions with ministries, provinces and municipalities. |
Supervisory Board | The Supervisory Board oversees the activities and policies of the Executive Committee, as well as the way it implements our strategy. An overview of the activities and topics discussed by the Supervisory Board can be found in Chapter 8 of this Annual Report. |
Employees | We hold a weekly 'Week-Up meeting' where the ExCo or other invitees present relevant matters to all staff. We involve the staff in our Strategy through, among other things, the meetings in which all employees are present. Furthermore, we conduct a pulse survey among the staff twice a year and employees are involved in the bank's direction via the Works Council (OR). |
Investors | We have an active investor relations strategy. Throughout the year, we hold discussions with investors via Teams, at conferences, or in face-to-face meetings. In these conversations, we cover a range of topics: strategy, ESG, the funding program, financial performance, clients, and the macroeconomy. |
Supervisory authorities | We consult regularly with the supervisory authorities, including the European Central Bank (ECB), the Dutch Central Bank (DNB) and the Netherlands Authority for the Financial Markets (AFM) on both financial and non-financial issues. |
Rating agencies | Meetings with a range of rating agencies are held at least once per year. In these conversations, we address, among other things, the bank's financial performance and developments in the Dutch public sector. |
Guarantee funds | Regular consultations take place with the Social Housing Guarantee Fund (WSW) and the Healthcare Sector Guarantee Fund (WfZ) |
Sector organisations and trade associations | We participate in working groups of the Association of Netherlands Municipalities (VNG) and regularly hold discussions with the association of Dutch housing corporations Aedes. |
Value creation
We aim to remain the leading financier of the Dutch public sector and contribute to a more social and greener Netherlands. We operate based on a central principle: Bank of Added Value. Social impact and the value we create together are central to everything we do. In the model below, we apply the six-capital model of the International Integrated Reporting Council (IIRC). This model provides insight into the outcomes of our strategy we strive for and the value we add for our stakeholders and society.
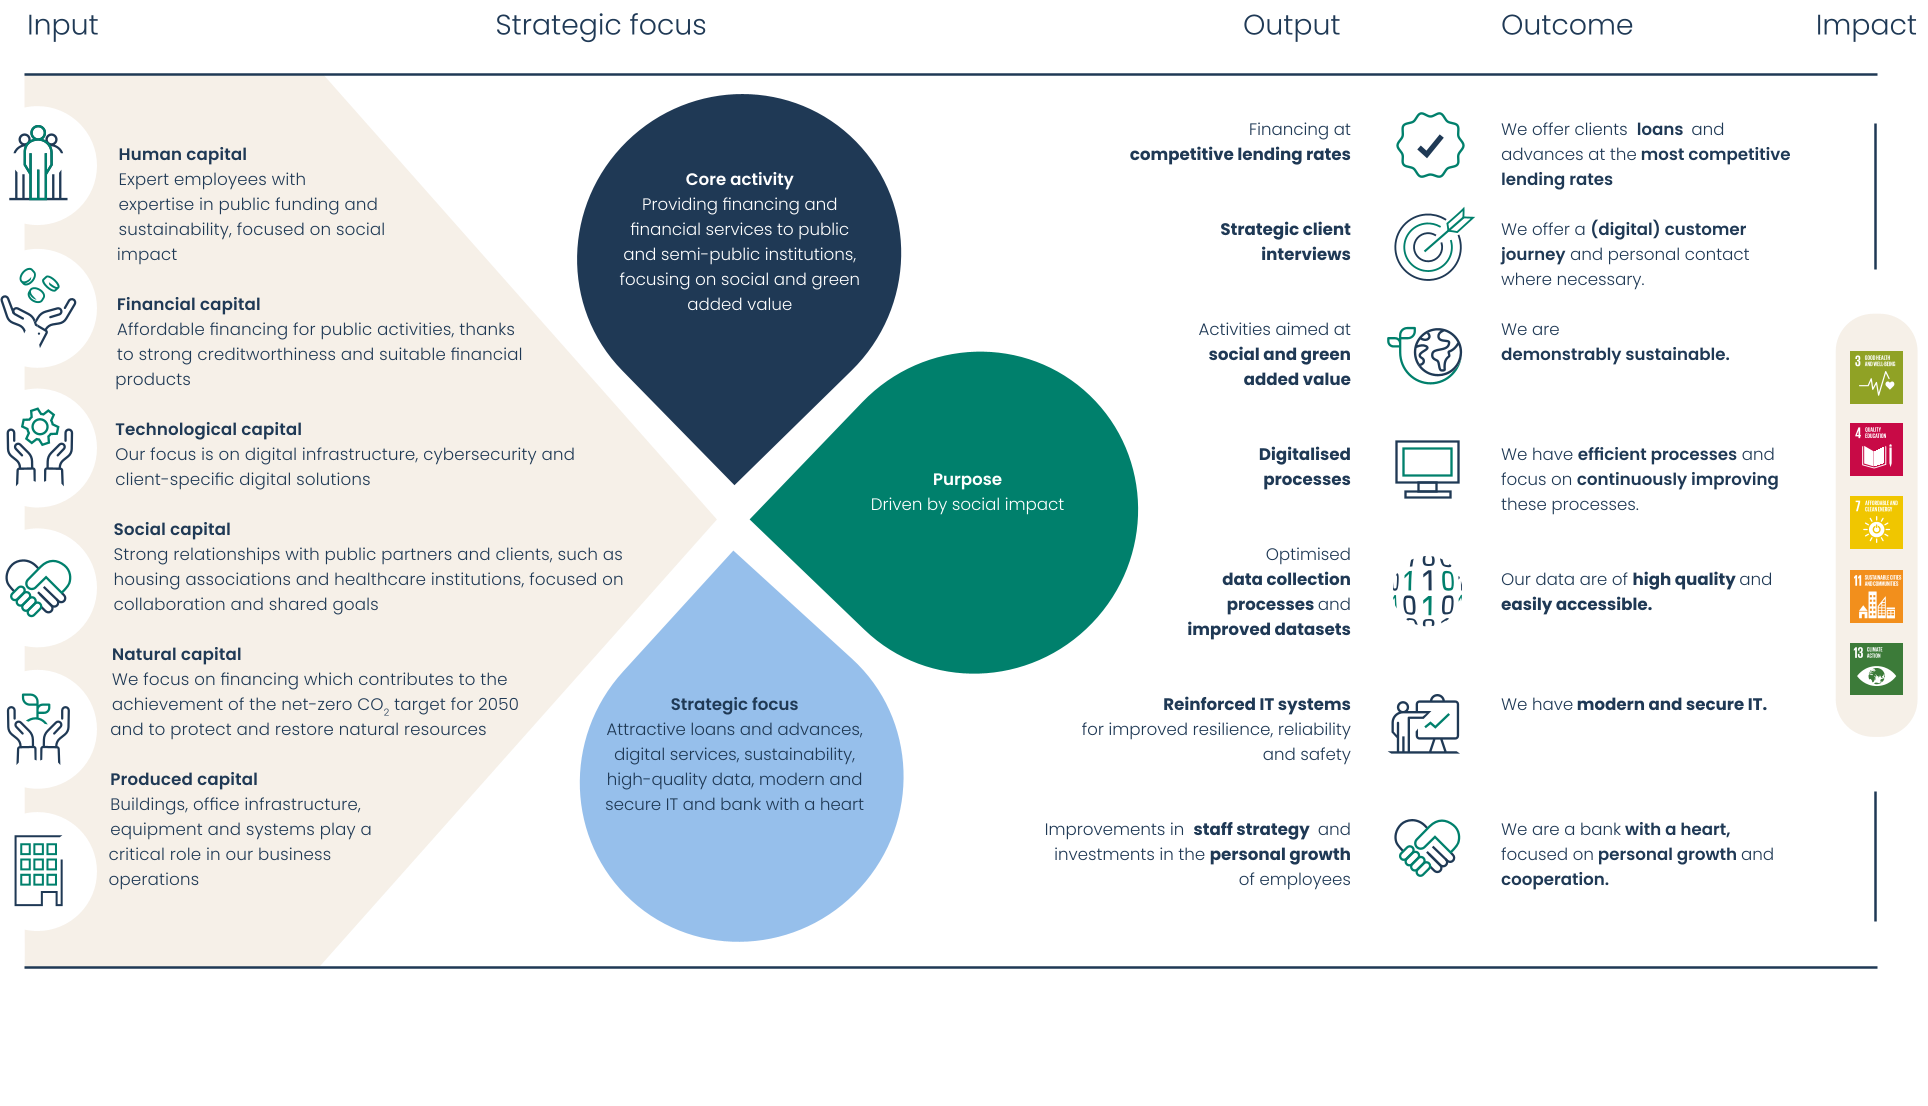
Since 2021, we have been reporting in accordance with the guidelines of the Global Reporting Initiative (GRI) in our Annual Report and have also done so for 2025. In this context, it is essential to map out the material themes for the organisation properly. We evaluate these themes annually and report on our progress based on identified KPIs. We focus actively on the following themes:
Material theme | KPI | Objective | Score for 2025 | Outcome and effectiveness of management actions |
|---|---|---|---|---|
Affordable and available financing | Score percentage for long-term loans in client sectors: Public Sector, Healthcare, and Education | >60% | Red | Intervene in prices in accordance with pricing policy to achieve set objectives. |
Sufficient affordable housing | Share of BNG in new loans granted to housing associations in the past year | >60% | Green | Intervene in prices in accordance with pricing policy to achieve set objectives. |
Climate Change | Financed Emissions, Scope 1 and 2 | -25% compared to 2018 | Green | For the 2024 measurement year, the absolute amount of financed emissions (ktCO₂e) within the loan portfolio – of the sectors we have been measuring since 2018 – in Scope 1 and 2 decreased by 0.6% compared to 2023 and by 25.5% compared to 2018. |
Own Personnel | Male/Female Ratio, Senior Management | >40% = <60% | Green | We are seeing a visible positive trend towards gender balance within senior management. This KPI can be influenced when filling vacancies, women are nominated, and in cases of equal suitability, preference is given to a woman. |
Own Personnel | Male/female ratio, all staff | >35% =<65% | Red | We are seeing a visible positive trend towards gender balance. This KPI is influenceable when filling vacancies; women are nominated, and preference is given to women when equally qualified. |
Own Personnel | Sickness absence | <3% | Red | We started working with a new occupational health and safety service in 2025. |
An explanation of the scores in 2025 can be found in the appendix in paragraph 9.2


Our clients make the difference in society. We connect them with financing, knowledge, and experience to help them realise their socially valuable activities more quickly. As a leading financier of the public sector, we bring public organisations and the capital market together.
Whether it concerns affordable housing, better healthcare facilities, or climate-resilient living environments: thanks to our strong financial position, we offer competitive financing that we pass on directly to municipalities, housing associations, healthcare and educational institutions, and organisations in infrastructure and energy. We actively think along with our clients and help provide feasible, sustainable solutions that create long-term impact.
Sustainability is an integral part of our collaboration. We support clients in achieving their goals and provide insight into their progress, enabling them to increase their social impact. We build long-term relationships as a reliable partner that works carefully and transparently. That trust forms the foundation for success.
2.1 Local authorities
In 2025, we strengthened our position as a trusted financing partner for local governments. Our involvement helped municipalities, provinces, and other public institutions not only ensure their financial continuity but also achieve ambitious social goals.
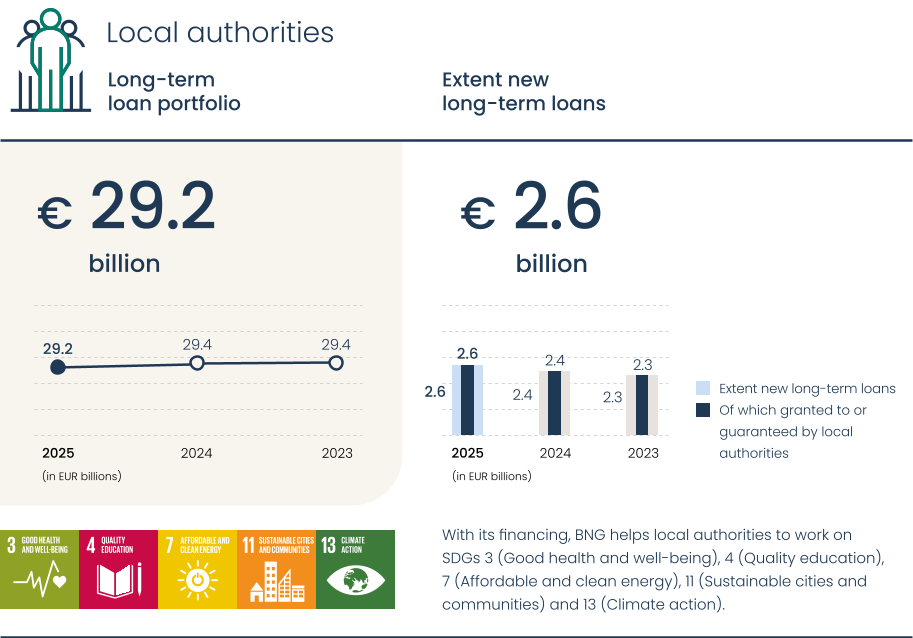
As primary banker, we offer a wide range of financial services, from payment transactions to lending. This enables us to facilitate investments in essential public services, such as social infrastructure, housing, educational facilities, and energy transition projects.
Challenges and sustainable investments
The financial pressure on local governments remained noticeable in 2025. Rising costs and uncertainties required careful consideration. The financial cliff year has now shifted to 2028, but municipalities must already make smart choices to enable major renovations and sustainability projects. In the past year, we developed and implemented suitable financing solutions for many of our municipal clients.
We went beyond just financing. By holding strategic discussions on topics such as energy transition and social issues, we helped municipalities clearly formulate their long-term ambitions. Sustainability is central to us. This is evident in our payment transactions contracts, which include social return as standard. With these contracts, we offer opportunities to people distanced from the labor market and support local initiatives.
Primary banking services
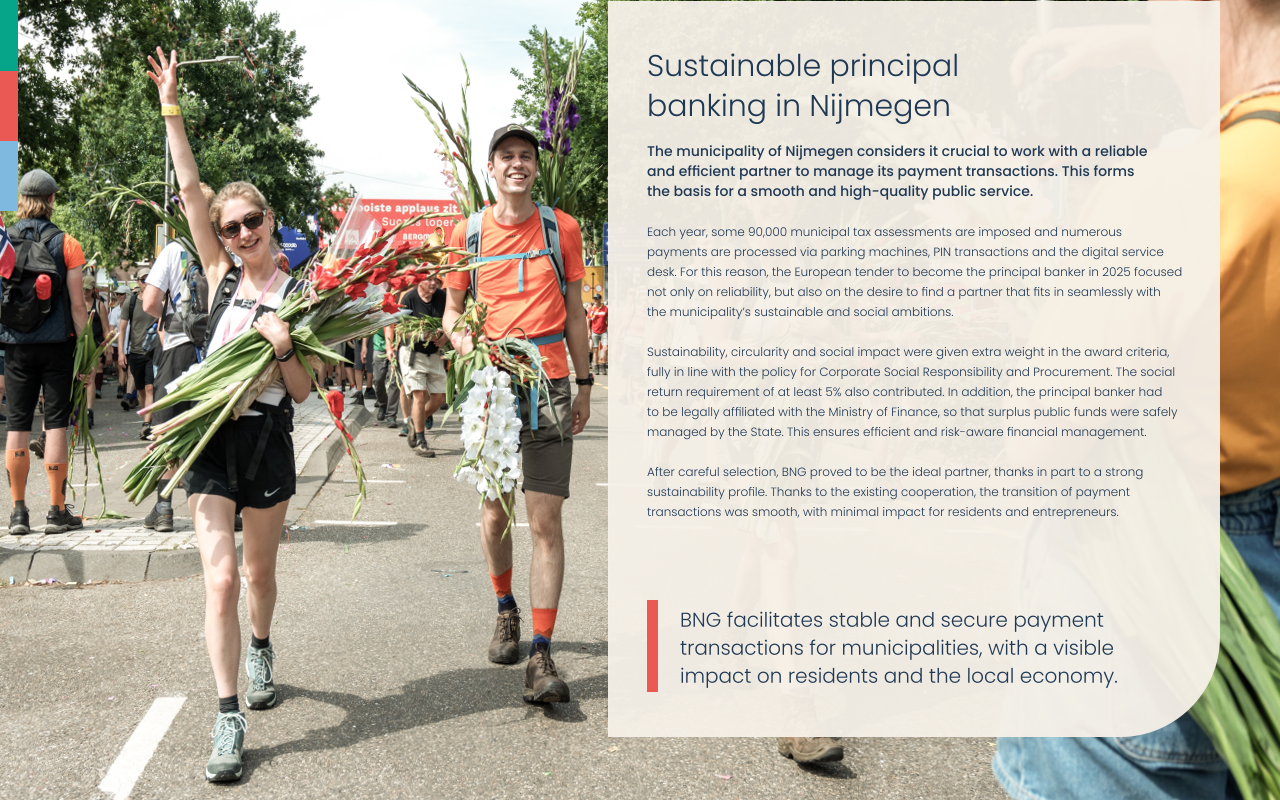
In 2025, municipalities again confirmed their confidence in us as their primary bank. We were proud that municipal tax office Twente and the municipalities of Enschede and Hengelo-Losser extended their primary banking contracts with us. We also won the tender from the municipality of Nijmegen.
Our primary banking is about more than just products. We act as a partner that supports government financial processes and aligns with their social responsibilities. With dedicated contacts, short lines of communication, and modern digital tools, we ensure efficient and committed service.
Customer meetings
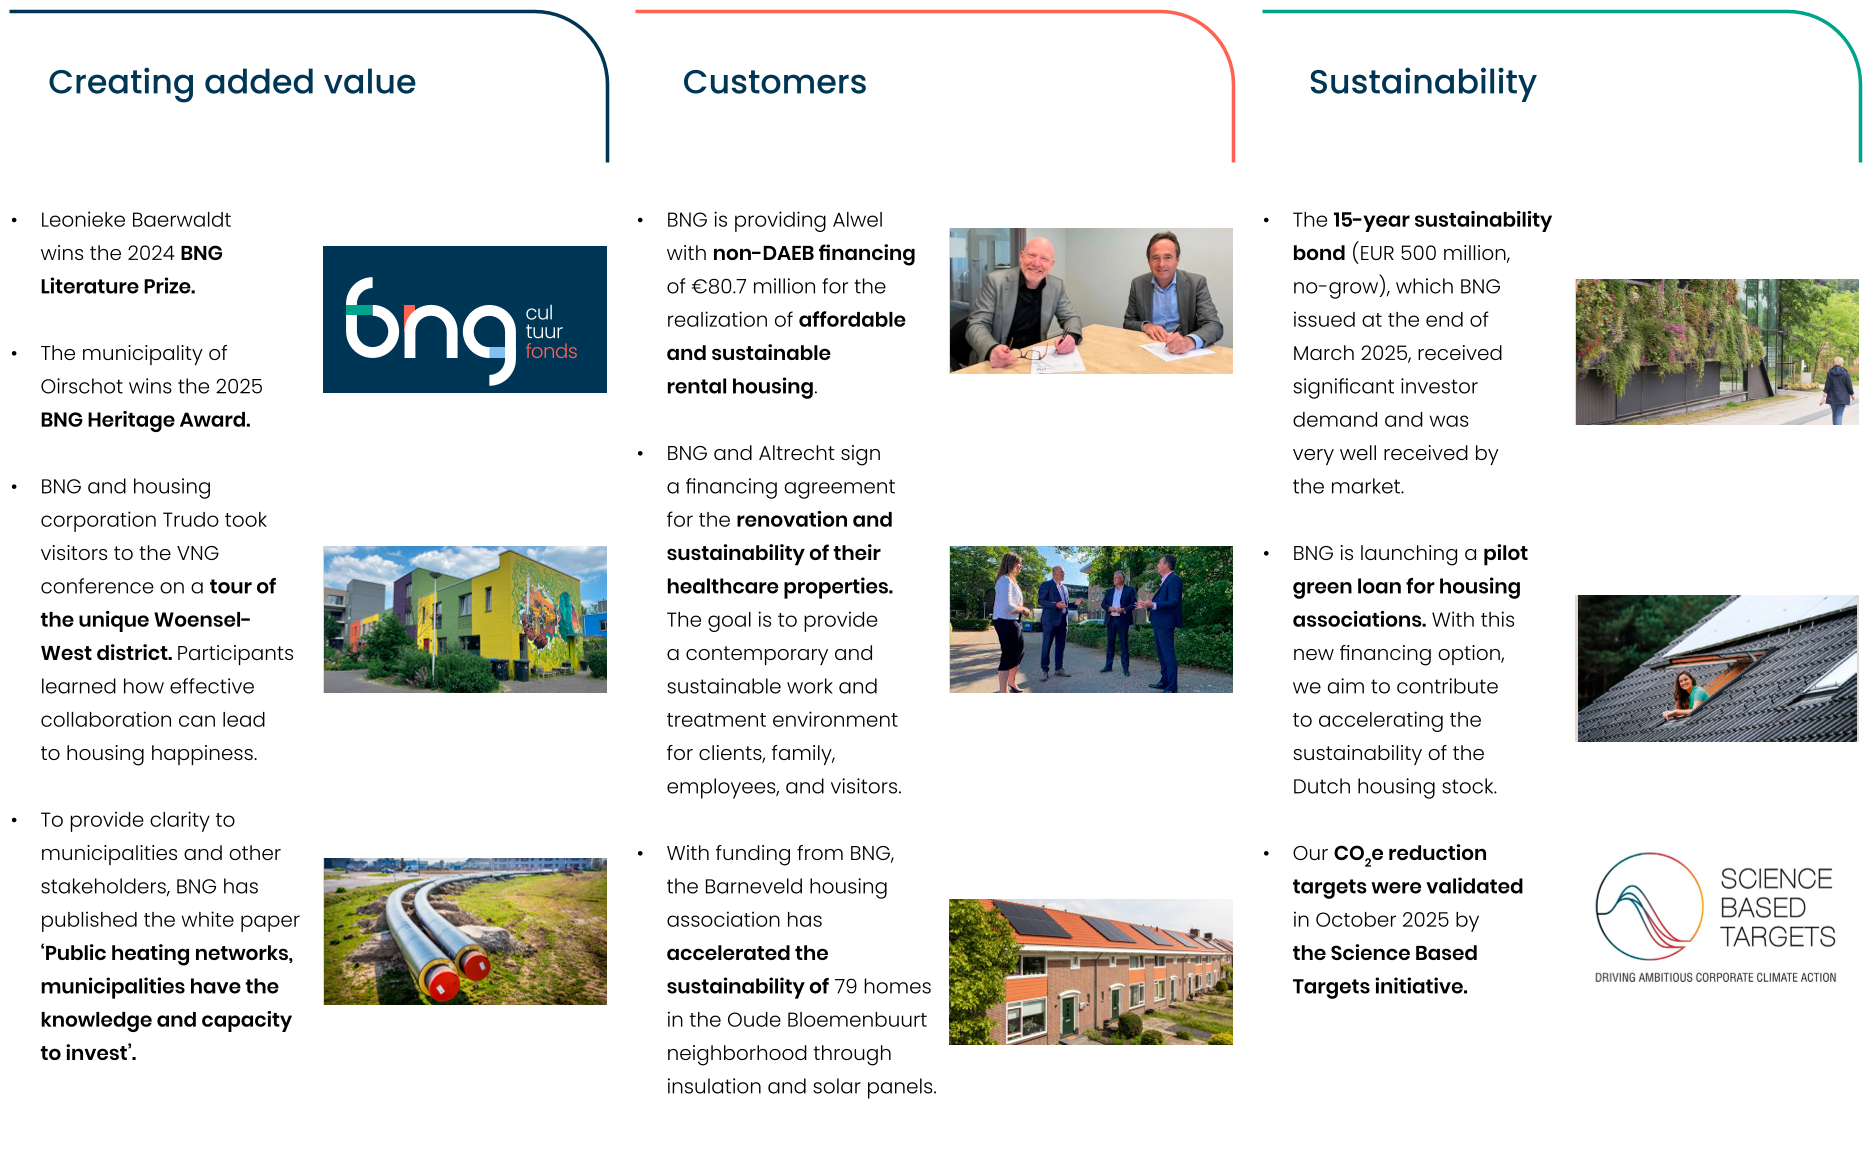
To optimally support municipalities and other local government bodies, we organised various meetings and webinars in 2025. In addition to sharing knowledge, the aim is to jointly develop visions and shape solutions. The focus was on current financial issues and practical tools for municipal financial teams. For example, we organised conferences for medium-sized municipalities, for municipalities with up to 40,000 residents, and for municipalities with more than 100,000 residents. During the Association of Netherlands Municipalities (VNG) conference in June, we focused on "From housing shortage to living pleasure." Together with housing association Trudo and the municipality of Eindhoven, we organised an excursion to Woensel-West in Eindhoven, a neighborhood that has been successfully transformed through intensive collaboration and sustainable innovation. We also focused on sustainability by organising a special Sustainability Afternoon for financial professionals, focusing on knowledge sharing and best practices.
2.2 Housing associations
With over 2.4 million affordable rental homes, the rental sector plays a crucial role in the Netherlands. As the largest financier of housing associations, we contribute to affordable and sustainable housing.
Financing
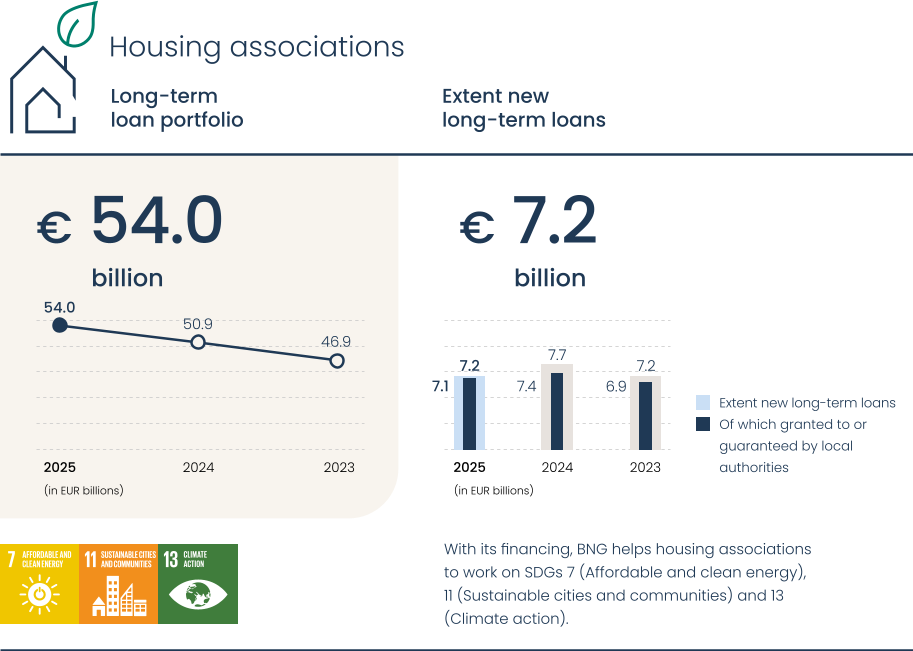
We support housing associations with financing for the construction of new socialand mid-market rental housing and the sustainability improvements to existing homes. In 2025, our loan portfolio again grew significantly in this sector. In total, we provided EUR 7.2 billion in new long-term loans, and the portfolio grew by EUR 3.1 billion to EUR 54.0 billion.
Investment capacity and new construction
The investment capacity of housing associations is under pressure because many investments are unprofitable due to the growing gap between rental income and rising costs. To maintain investment power in the long term, a future-proof revenue model is needed, with more room for rent increases, lower costs such as corporate tax adjustments, and more opportunities for selling assets. The National Performance Agreements aim for housing associations to ultimately build 30,000 homes per year. Although new construction production rose to 21,761 homes in 2024, it remains uncertain whether this level can be structurally achieved from 2029 onwards due to bottlenecks in locations, procedures, and infrastructure.
Mid-rent housing
We provided EUR 385 million in financing in the mid-rental segment. We did this across both urban and regional areas. The mid-rental segment is crucial for meeting the housing needs of middle-income earners. These homes also facilitate greater mobility from social housing and contribute to mixed neighborhoods. It is now widely recognised in Europe that mid-rental housing may receive government support. Financing mid-rental housing and how to already anticipate possible future funding from the WSW (Social Support Act) is a topic of discussion with our clients. This is also a frequent topic in presentations we give, such as for members of "De Vernieuwde Stad," the partnership of housing associations operating in urban areas.
Sustainability
In addition to new construction, sustainability remains a core priority within the social housing sector, with particular attention to making homes energy-efficient (including through insulation) and making them natural gas-free. Regarding insulation and the phasing out of E, F, and G labels, the sector is on track with the National Performance Agreements. However, there are still significant challenges surrounding the long-term natural gas-free transition in homes. For example, the rollout of district heating networks is proceeding slower than necessary. Therefore, we strongly support sustainability, both financially and in our dialogue with our clients. ESG criteria are a natural part of our strategy. Last year, we introduced new options, including a pilot for green loans with ESG criteria for housing associations. This green loan will be introduced more broadly in the sector in 2026. We also actively attended conferences and meetings on this topic, such as our own BNG Corporatiemiddag.
2.3 Healthcare
We help healthcare institutions finance investments, such as healthcare real estate. We work closely with clients from various sectors: hospitals, mental healthcare, elderly care, disability care, and youth care. Thanks to our strong market position and stable risk profile, we are a reliable partner for real estate financing and sustainable investments in the healthcare sector.

Developments
Major issues continue to put pressure on healthcare institutions: staff shortages, lagging investments, rising healthcare expenditures, and political uncertainty about how to address these issues. For many healthcare institutions, 2025 was a year of recovery plans. We supported this movement with financing and strategic advice, contributing to important projects within various healthcare sectors.
Creditworthiness of the sector
The credit risk profile of the healthcare sector has further improved over the past year. The sector has been able to effectively absorb the accumulation of challenges since 2022. The overall risk picture is now comparable to the pre-COVID period. Structurally higher housing rates from 2026 and compensation for inflation by health insurers support new investments, particularly in healthcare. There is confidence in the continuation of the necessary transitions and in the government's continued support for crucial healthcare. This means that the risks for the coming years are clear and acceptable, although legitimate concerns about the long-term sustainability of the healthcare system remain.
Sustainability
Sustainability in healthcare is gaining momentum, but not progressing quickly enough everywhere. ESG risks are becoming more visible, and institutions are taking steps, although progress varies considerably by subsector. In care sector, sustainability is somewhat lagging behind that of hospitals. In various subsectors, we see investments in energy savings, circular construction, and the reuse of materials. After a relatively quiet 2024, demand for sustainable projects increased in 2025, especially in new construction and renovations. Commitment to the Green Deal ensures that the sector is actively working on CO2 reduction and more sustainable operations. BNG plays a key role as a partner in stimulating and supporting this sustainability drive.
Technological developments
Technology offers opportunities to make healthcare processes more efficient and reduce workload. Automation, AI, and robotisation are increasingly being explored and applied, particularly to support routine tasks. By 2025, the focus will be on deploying smart sensors, the Internet of Things, and predictive analytics to collect real-time data and thus better plan care and resources. These technological trends can contribute to a future-proof and more effective healthcare sector, although broad implementation is still in development.
2.4 Education
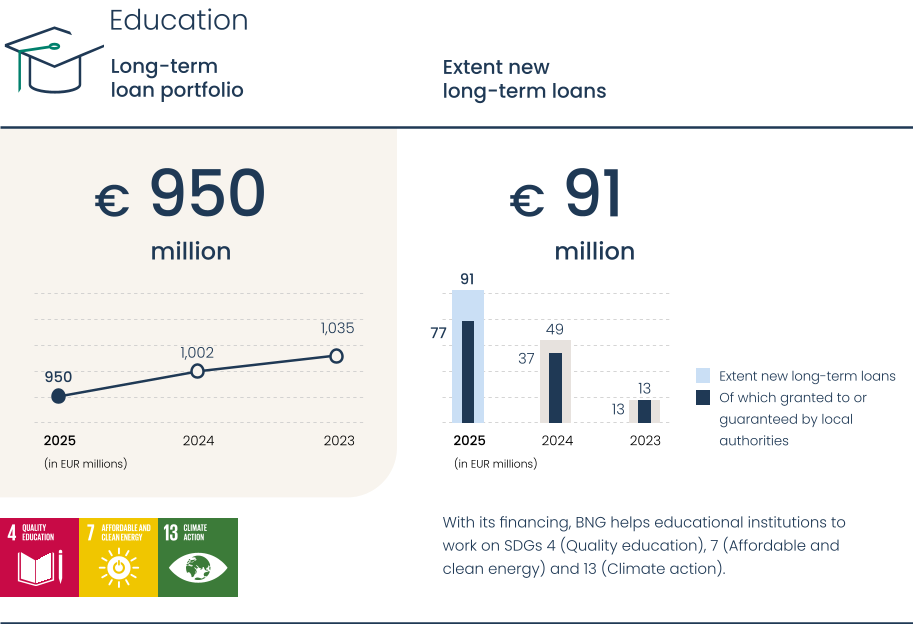
In 2025, we remained a key financing partner for the education sector, with a focus on primary and secondary education. Financing was provided via municipalities, or directly to educational institutions or entities responsible for educational housing. We also provide direct support to educational institutions in secondary vocational education (VET), higher vocational education, and universities. We offer financing that balances affordability with support for the sustainability and innovation goals of educational institutions. Thanks to our sector-specific knowledge and experience, we are a partner our clients can rely on.
Sustainability as a driver of innovation in education
Sustainability will continue to play a central role in educational housing in 2025. The education sector is increasingly focusing on making school buildings more sustainable by (where possible) creating gas-free and energy-neutral schools and improving the indoor climate. With thousands of school buildings requiring renovation or replacement, this presents a significant and urgent challenge, especially in primary education, where the need for healthy, sustainable, and future-proof schools is greatest. This challenge calls for an accelerated, integrated approach. Circular construction is receiving increasing attention, with economies of scale and efficiency being stimulated through collaboration and innovative financing models.
In 2025, BNG contributed to education housing, including by expanding the financing arrangement for BreedSaam, a social real estate organisation. These investments support primary and special education in Breda. We also expanded funding for Building Breda, for sustainable and future-proof housing for secondary education in Breda. Furthermore, we supported the financing of integrated childcare centers in Wijhe through the Social Real Estate Foundation.
Innovative financing and collaboration
The education sector is increasingly open to efficient, scalable, and cost-saving financing structures. These innovative financing methods enable investments in educational housing to better align with long-term sustainability goals and the budgetary frameworks of municipalities and educational institutions.
Knowledge sharing and collaboration as a foundation
We continue to actively contribute to accelerating the approach to educational housing challenges by promoting knowledge sharing, standardisation, and scaling up. Dialogue with all stakeholders involved is essential in this regard. In 2025, we organised the annual Education Afternoon in Heerhugowaard, a successful platform for collaboration and knowledge exchange. We also provided various workshops/presentations on financing options for educational housing. Furthermore, we collaborated intensively with various stakeholders and shared our knowledge and experience to realise a programmatic and integrated approach to educational housing, enabling scaling up and accelerating implementation.
2.5 Public infrastructure and energy
Also in the Public Infrastructure and energy sector, we collaborate with our clients on sustainable solutions. We offer financing that helps them address societal challenges and create impact.
The energy and heating transition, the transition to a circular economy, and the development of sufficient space for living and working require significant investments. Together with (utility) companies, municipalities, and the national government, we ensure that public facilities remain future-proof. This requires long-term investments that are often passed on to society through cost-based tariffs.
We offer financing on attractive terms. We provide both unsecured and public sector-guaranteed loans. We also develop and finance (guarantee) funds. With our focus on vital public infrastructure– such as water, electricity, and heat networks, renewable energy production, waste processing, and spatial planning – we support important social goals. At the same time, we strengthen the effectiveness of our stakeholders, such as municipalities, housing associations, and healthcare and educational institutions.
Client partnership in the sector
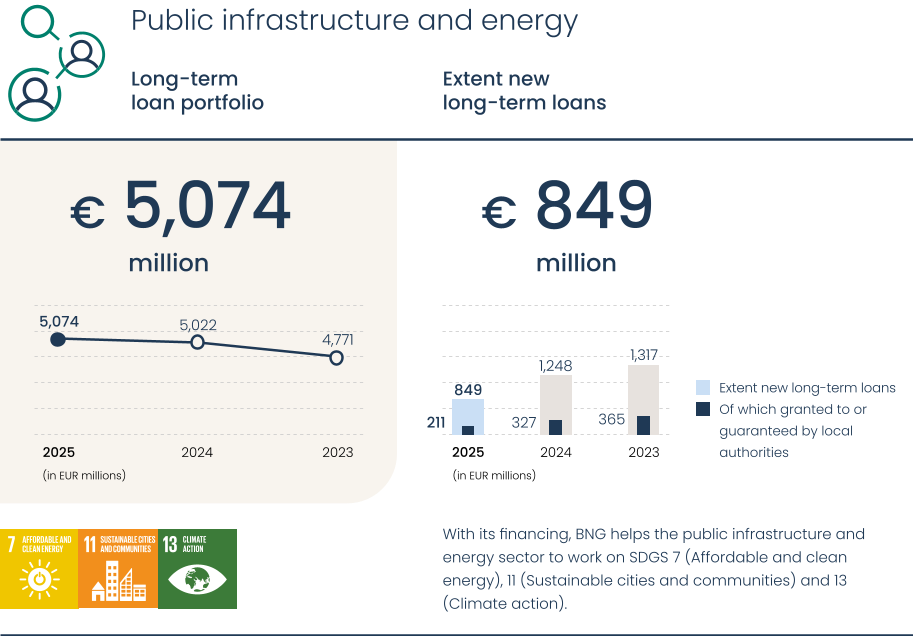
By 2025, we will have further strengthened our position as a financier of the Public Infrastructure and Energy sector. This year was characterised by both large and small financing transactions, with a total outstanding portfolio of EUR 5,074 million, an increase of EUR 52 million compared to 2024.
Networks
At Networks, the focus is on making energy, drinking water, and heat management systems more sustainable. We play an active role in this through financing of and collaboration with public and private partners. In 2025, the Collective Heat Act (WCW) was passed by the Senate and House of Representatives. The Heat Guarantee Scheme (GRW) is expected to be implemented in mid-2026. In 2025, municipalities continued to establish municipal energy and/or heat companies. Further steps were also taken to create regional heat network companies to achieve market consolidation in the long term. BNG is and will remain actively involved with all parties to contribute to the optimal implementation of the relevant legislation and to add value to important developments and transactions in the heat network sector. In 2026, we will continue our role as a partner with municipalities, the national government, and other public parties in the sector.
Energy
In 2025, the energy sector continued to grow, despite significant challenges such as grid congestion and price fluctuations in the energy market. In the Netherlands, significant sustainable energy generation capacity has been added in recent years, such as wind farms and rooftop and ground-mounted solar farms. This has led to greater discrepancies between electricity supply and demand, resulting in more frequent periods of negative electricity prices. This dynamic has a direct impact on existing business cases, including for projects financed by BNG. As a result, well-fitting
financing solutions are becoming increasingly important. The realisation of new wind and solar projects is also challenging due to a lack of suitable space. New large-scale rooftop solar projects are scarcer because the most suitable roofs have already been occupied. Attention to sufficient local support is becoming more important. We are increasingly seeing local governments taking the initiative to set up energy projects and remaining involved in the operational phase. BNG aims to make a difference specifically in these projects, as our focus is on energy projects in which the public sector has a direct or indirect interest.
The "Future-Proof Maintenance Fund" initiative, established in 2024 and financed by BNG, focuses on energy savings while simultaneously offering housing associations the opportunity to invest in mixed homeowners' associations (VvEs). The fund has provided 23 loans totalling EUR 4.7 million. Thanks to these loans, 639 flat owners were able to invest in (overdue) maintenance and sustainability improvements to their homes. The fund thus contributes to the further sustainability and energy efficiency of real estate in the Netherlands.
As a social bank, we feel a clear responsibility to contribute to making the Netherlands more sustainable. Financing the energy transition – such as investments in renewable energy, energy-efficient buildings and infrastructure – is closely aligned with our purpose and our role in society. These projects contribute to climate goals and have a demonstrable positive impact on our customers' living environment.
At the same time, we recognise that the energy transition is not without risk: technologies are developing rapidly in markets that are not always fully predictable or mature, with long depreciation and payback periods, and where the risks are sometimes heavily concentrated in the start-up phase.
Examples of (still) immature markets are the solar and (to a lesser extent) wind energy sectors, where a lack of network and storage capacity means that generated electricity cannot always be sold, which has clearly changed the original business case.
Examples of long maturities with large(r) upfront risks include investments in geothermal energy and heat networks, where a more risky investment phase is usually followed by a (long and) more stable payback phase. This creates a tension with our very conservative risk profile, which is in line with the business model of a bank such as BNG. The stability and creditworthiness of our loan portfolio are paramount. This means that we must constantly weigh up how much scope there is to support impactful, but sometimes riskier projects, without compromising our solid credit position. This balance requires ongoing dialogue, sharp risk analyses and clear choices.
Environment
In the Environment department, we provided various financing options last year that contribute to making waste collection and processing more sustainable. For example, we provided financing to collectors such as Reinigingsbedrijf Midden Nederland and De Meerlanden for further electrification of small equipment and their fleet. For collector Blink, we financed the land on which their new headquarters is planned. A significant milestone was reached last June for processor Twence, where, after a construction period of almost three years, one of the first carbon capture facility was officially opened by Her Majesty Queen Máxima. As part of the consortium, BNG financed this plant at the end of 2023.
Mobility
In the Mobility department, we provided various financing options last year that directly contribute to making public transport and the major seaports and airports in the Netherlands more sustainable. With our financial support, we help these sectors achieve ambitious climate goals, which are essential in the broader energy transition. Our financing plays a key role in enabling sustainable projects and innovations. A prime example of such financing is our sustainability-linked loan to the Port of Amsterdam (Port Authority). This EUR 60 million loan is linked to sustainability goals, encouraging the port authority to take concrete steps to reduce CO2 emissions.
In addition, we are the main financier of regional transport in the two major metropolitan areas of the Netherlands: the Amsterdam Transport Region (VRA) and the Rotterdam-The Hague Metropolitan Region (MRDH). Together, VRA and MRDH account for approximately 28% of bus transport in the Netherlands. Throughout the Netherlands, approximately 39% of buses are now emission-free (24% in MRDH and 74% in VRA). These customers are therefore well on their way to emission-free public transport, and BNG is contributing with its financing, which is used to purchase these emission-free buses. This makes us an important partner for these transport operators in transforming their bus fleets to be completely emission-free, and we support the sector-wide commitment to make bus transport completely zero-emission by 2030.
Besides focusing on green investments, such as electric buses and sustainable infrastructure, we also recognise the importance of "gray investments" to keep the mobility industry operational. While the transition to sustainable mobility is essential for reducing the CO2 footprint, existing systems must continue to function reliably during this transition. Our role as a financier is therefore twofold: we stimulate the energy transition and ensure continuity in the mobility sector.
Spatial planning
With the ambition to build over 900,000 homes by 2030, area development is more relevant and important than ever. This challenge requires significant investments in both new housing developments and the redevelopment of existing (business) sites. We fulfill a trusted role as a public sector financier and provide the financial basis to make large-scale projects possible. The challenge with area development is that major investments in infrastructure, public space, and amenities are required before homes or business locations reach their final location. Therefore, we work closely with public partners such as provinces, municipalities, and Regional Development Agencies (ROMs). We also deploy our expertise in Public-Private Partnerships (PPPs) where this offers added value. In 2025, we financed a wide range of projects in the field of area development. For example, in the Amersfoort region, we refinanced the new phase of a development site for EUR 100 million through a public-private partnership (PPP). We also financed the redevelopment of a port site for EUR 14 million in collaboration with a regional development company. Furthermore, we are actively involved in the planning phase of area developments throughout the Netherlands. Our projects range from development sites for housing to the redevelopment of business parks. These investments not only contribute to a livable residential environment but also strengthen the economic capacity of regional governments. By future-proofing infrastructure and facilities, we support the broader ambitions of the Netherlands regarding sustainability and resilience.

3.1 Solid foundation in money and capital markets
Developments in 2025
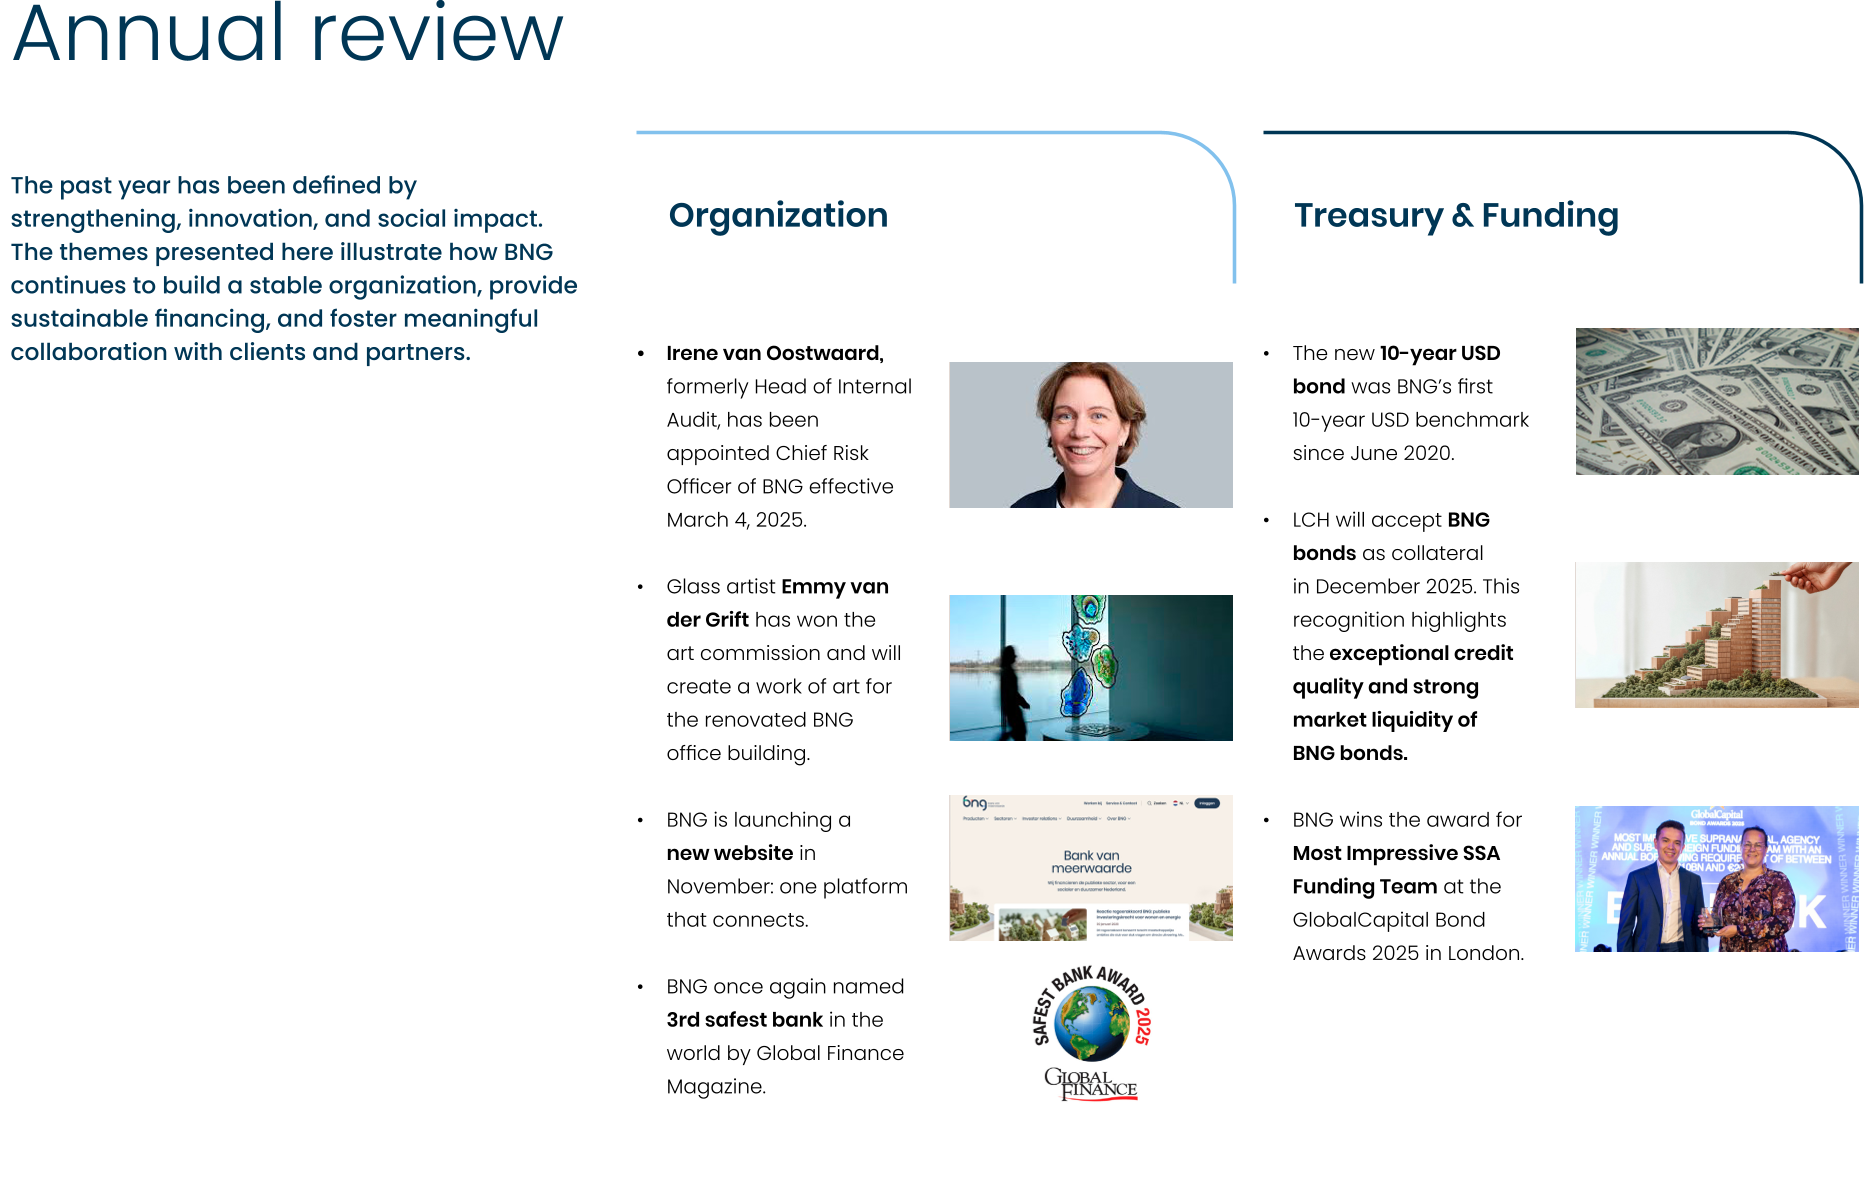
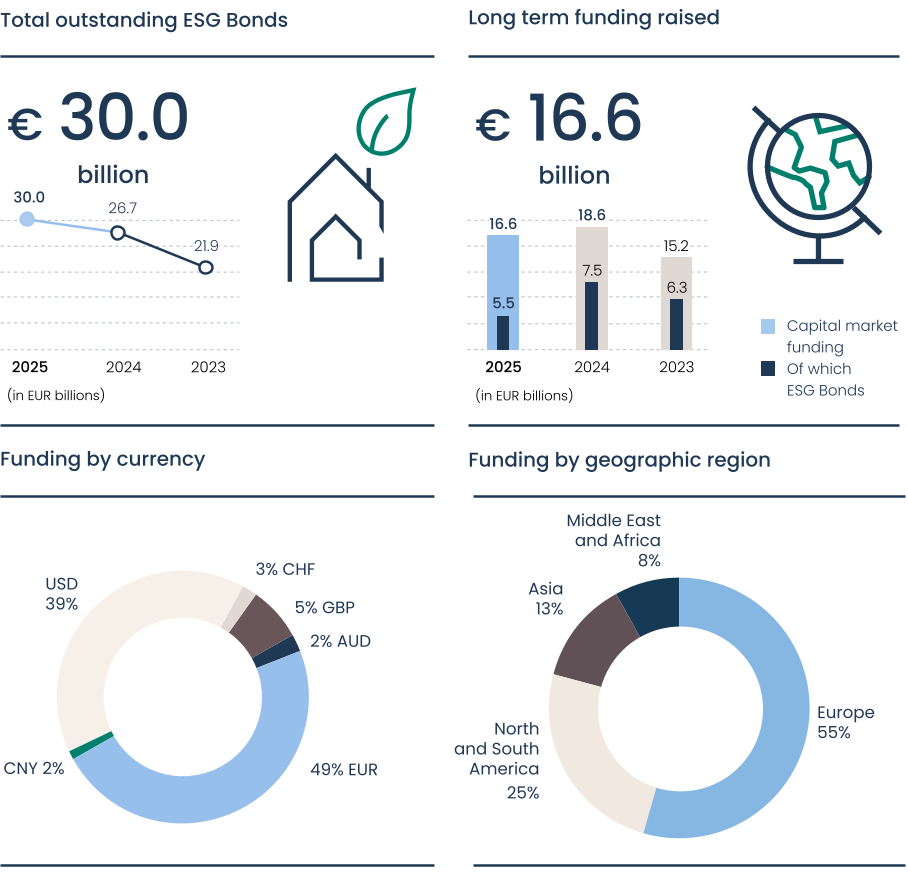
In 2025, we raised EUR 16.6 billion in long-term funding with an average maturity of 6.9 years. Despite market volatility, partly due to geopolitical tensions, BNG has good access to funding with medium and long-term maturities on the capital market throughout the year. Our triple A ratings play a crucial role in this regard. The total amount of funding raised is in line with the average for recent years, but the premiums were higher on average than the previous year. Part of the funding raised is, again, composed of several large syndicated bond issues, the so-called benchmarks. This year, we made three new benchmark issues in EUR and three new benchmark issues in USD, underscoring our ambition to maintain a robust and liquid benchmark curve for both currencies. We also issued two large bonds denominated in CHF and were active in GBP and AUD. We also underscored our presence in Asian markets by returning to the Chinese yuan. This is in line with our aim to achieve a high level diversity in our investors, both in terms of geography and type. The principal investor interest in 2025 confirms that we are achieving this diversity successfully.
Importance of ESG bonds
Demand for ESG bonds continued to be strong in 2025. Since our first issue in 2014, we have now issued more than EUR 38 billion in ESG bonds. We do so through sustainability issues for municipalities and through social issues for housing associations. The issues are covered by our Sustainable Finance Framework, according to which the bond income is used to finance municipalities and housing associations. Under this framework, municipal budgets and expenditure by housing associations are linked to the green and social bond categories of the International Capital Market Association (ICMA) and the Sustainable Development Goals (SDGs) of the United Nations. Our ambition is to ensure that a substantial part of our funding is raised through ESG bonds. This proportion has grown sharply in recent years: while in 2020 it was still 14% of the total bond issue, in recent years it was from 30% to over 40%. This year, we issued a significant volume of EUR 5.5 billion in ESG bonds (33%), both through new issues and by increasing existing bonds.
Keyfigures for funding
3.2 Financial results
Results and return
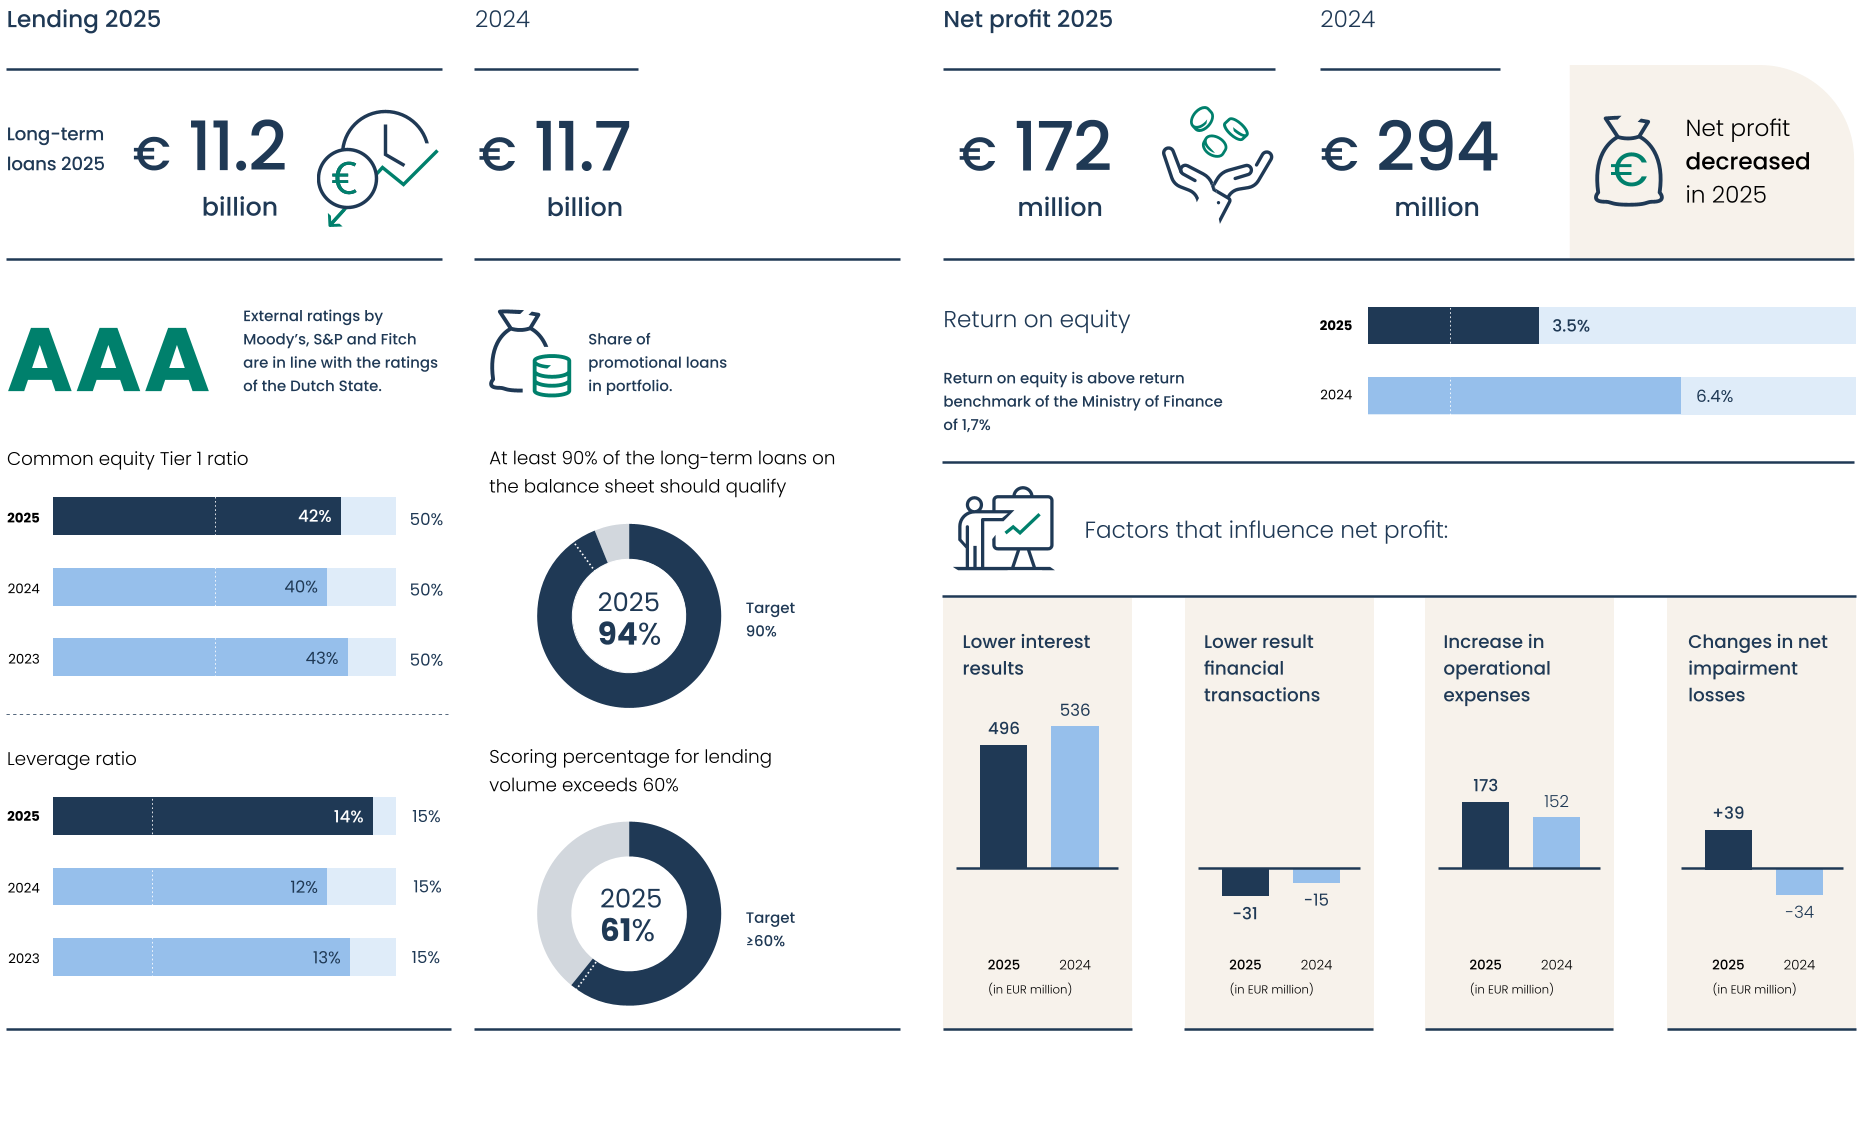
Over the 2025 reporting year, BNG recorded a net profit of EUR 172 million. This is EUR 122 million less than in 2024. This result was also reflected in a lower return on equity of 3.5%, compared with the return on equity for the previous year (6.4%). A lower interest result, a negative result on financial transactions, higher total operating expenses and impairments contributed to the decline in net profit.
BNG achieved an interest result of EUR 496 million. This result is EUR 40 million lower than the result for 2024. Due to changes in the interest rate curve, customers have borrowed with shorter maturities. This has resulted in lower margins on new loans granted. We have also applied a deliberate pricing strategy, using part of the profit to give discounts back to our customers. Higher margins on funding have led to an increase in interest expenses. Furthermore, in 2025, we decided to start phasing out the non-strategic portfolio. In 2025, a number of transactions were settled, which led to a decrease in interest income.
In 2025, compared to the previous year, the commission result decreased by EUR 7 million to EUR 23 million. This decrease is due to one-off fee income in 2024 that was related to treasury activities. Commission income from payment transaction commissions invoiced to customers remained stable.
The result on financial transactions amounts to EUR 31 million negative (in 2024: EUR 15 million negative). The non- effective portion of hedge accounting yields a negative result of EUR 44 million (2024: EUR 6 million negative). The vast majority of our derivatives and assets and liabilities are involved in hedge accounting. We use hedge accounting to eliminate an accounting mismatch. This was 99.2% effective in 2025. The realised sales results amounted to EUR 6 million negative (2024: EUR 18 million negative) and relate to sales in the liquidity portfolio. We have a liquidity portfolio of EUR 16 billion to absorb shocks in liquidity. Managing this portfolio involves regularly selling and buying bonds to keep it liquid. The negative sales results that must be recognised directly in the result under IFRS are offset by new liquid bonds with high returns in the coming years. The other unrealised market value changes yield a result of EUR 19 million positive (2024: EUR 9 million positive) and are caused by market volatility that affects the valuation of financial instruments.
The consolidated operating expenses for BNG amounted to EUR 173 million on balance. These have increased by EUR 21 million compared to 2024. This is the result of the inclusion of a restructuring provision of EUR 15 million. This reorganisation provision is necessary to achieve the objectives of the Route to More Added Value. This will enable us to strengthen our execution capabilities, collaborate in a chain-oriented manner, invest in leadership and professionalise. In addition, staff costs have increased as a result of the collective labour agreement and investments have also been made in the strengthening of the current IT infrastructure. On the other hand, the resolution fund did not call for additional contributions as in 2024.
The result from the impairments on financial assets in 2025 is EUR 41 million negative (2024: EUR 35 million positive). These impairments relate in particular to the solar energy sector. These items were provided in the years 2018 to 2020 with Sustainable Energy Transition Incentive (SDE) subsidies. This scheme did not provide sufficient compensation for negative energy prices, causing these projects to run into difficulties. Most of these items have been classified as non-strategic items. The bank’s total provisions for expected credit losses increased by EUR 41 million to EUR 98 million by the end of 2025.
The effective tax burden for 2025 was 28.2%, at a nominal corporate income tax rate of 25.8%. The bank levy amounted to EUR 36 million in 2025, EUR 5 million higher than in 2024. This increase was caused by the fact that current and long-term debts were higher at year-end 2024 than in the year before.
The balance sheet total for BNG in 2025 was EUR 116 billion, which is EUR 12 billion lower than in 2024. This is due, among other things, to the repayment of short-term funding. As a result, the balance sheet item Debt securities has decreased by EUR 9 billion.
The size of the long-term loan portfolio is EUR 95.7 billion, of which EUR 7.7 billion is subject to solvency requirements. The increase in the portfolio by EUR 2.7 billion compared to the end of 2024 is almost entirely free of solvency requirements. In 2025, EUR 11.2 billion in new long-term loans and advances were granted, which is EUR 0.5 billion less than in 2024. The increase in the portfolio is particularly due to high demand in the housing sector. The housing sector portfolio increased by EUR 3.1 billion to EUR 54.0 billion in 2025.
BNG maintains a target of at least 90% solvency-free exposures in the total loan portfolio. The target was achieved at 92.0% in 2025. In addition, we aim for a success rate of at least 60% on solvency-free long-term lending to local authorities, housing associations and healthcare institutions. In 2025, 61% of loan applications were granted by us and the target of 60% was met.
Liquidity ratios remain strong, with a net stable funding ratio of 143% in 2025 (139% in 2024) and a liquidity coverage ratio of 159% (217% in 2024). These ratios are also well above the minimum levels and reflect our prudent risk management.
At year-end 2025, BNG’s equity stood at EUR 4.9 billion. Of this amount, EUR 0.3 billion is additional Tier 1 capital. The bank’s solvency ratios remain strong. The Common Equity Tier 1 ratio is 42%. In 2024, this figure was 40%. At the end of 2025, the leverage ratio was 14%, which is 2% higher than the 12% at year-end 2024. The CET1 and leverage ratios are well above the minimum values imposed by the regulator.
Dividend
A dividend of EUR 79 million for 2025 will be proposed at the Annual General Meeting (EUR 140 million in 2024). In line with our policy, this is 50% of the net profit, adjusted for the payout on the additional Tier 1 capital.

3.3 Financial outlook
As in previous years, BNG's funding policy will continue to be focused on ensuring permanent access to the money and capital markets at the terms and volumes required and at the lowest possible rates. BNG expects to raise approximately EUR 15 to 17 billion in funding in 2026. Over the next year, we again intend to raise a substantial part of its long-term funding from ESG bonds.
We do not expect to pay a contribution to the Single Resolution Fund in 2026. The fund has been fully paid up since 2023 and requests for it to be supplemented are only made in the event of a bankruptcy of a European bank.
BNG is expected to remain financially strong in 2026, as well. Strong capitalisation, healthy profitability combined with a high market share and good funding conditions are also providing a solid financial foundation for the future.
The total amount of net profit is subject to uncertainty because we cannot forecast the development of unrealised market value adjustments. We are unable to reliably estimate the net profit for 2026 for that reason.


Although BNG clients are mainly active in the social field, they also have a role to play in the field of the environment and energy transition. The climate crisis, stricter EU legislation on sustainability and increasing pressure on the public domain call for substantial investments and innovative solutions to climate issues. This underlines the urgent need for financial institutions to deal effectively using the resources available.
Our impact-driven strategy responds to this. We aim to achieve net-zero CO2e emissions within our value chain by 2050. In doing so, we are focusing primarily on making our lending more sustainable, with specific reduction targets for 2025 and 2030. In addition, we are also taking measures within our own business operations, such as the use of renewable energy, when renovating our office and policy regarding business travel and lease cars.
Responsible financing for a sustainable society
Climate change entails significant risks, such as physical damage from extreme weather conditions and transition risks from the transition to a sustainable economy. An example of this is the depreciation of buildings that do not meet the sustainability requirements. Through strategic cooperation, we are supporting our clients in their transition to a more sustainable economy, while also working actively to limit risks.
Although we only have an indirect influence on our clients’ emissions, we encourage sustainability by means of targeted financing, strategic discussions and conditions that encourage sustainability. Examples of this are the financing of the heat supply in the Westland region and the provision of green loans aimed at promoting sustainability among housing associations.
We are actively contributing to the energy transition by financing renewable energy, such as wind and solar energy, energy-efficient buildings, electric mobility and CO2e storage infrastructure. Network operators play a crucial role in this, which is why we also support investments in expanding and strengthening the energy network.
Financed emissions
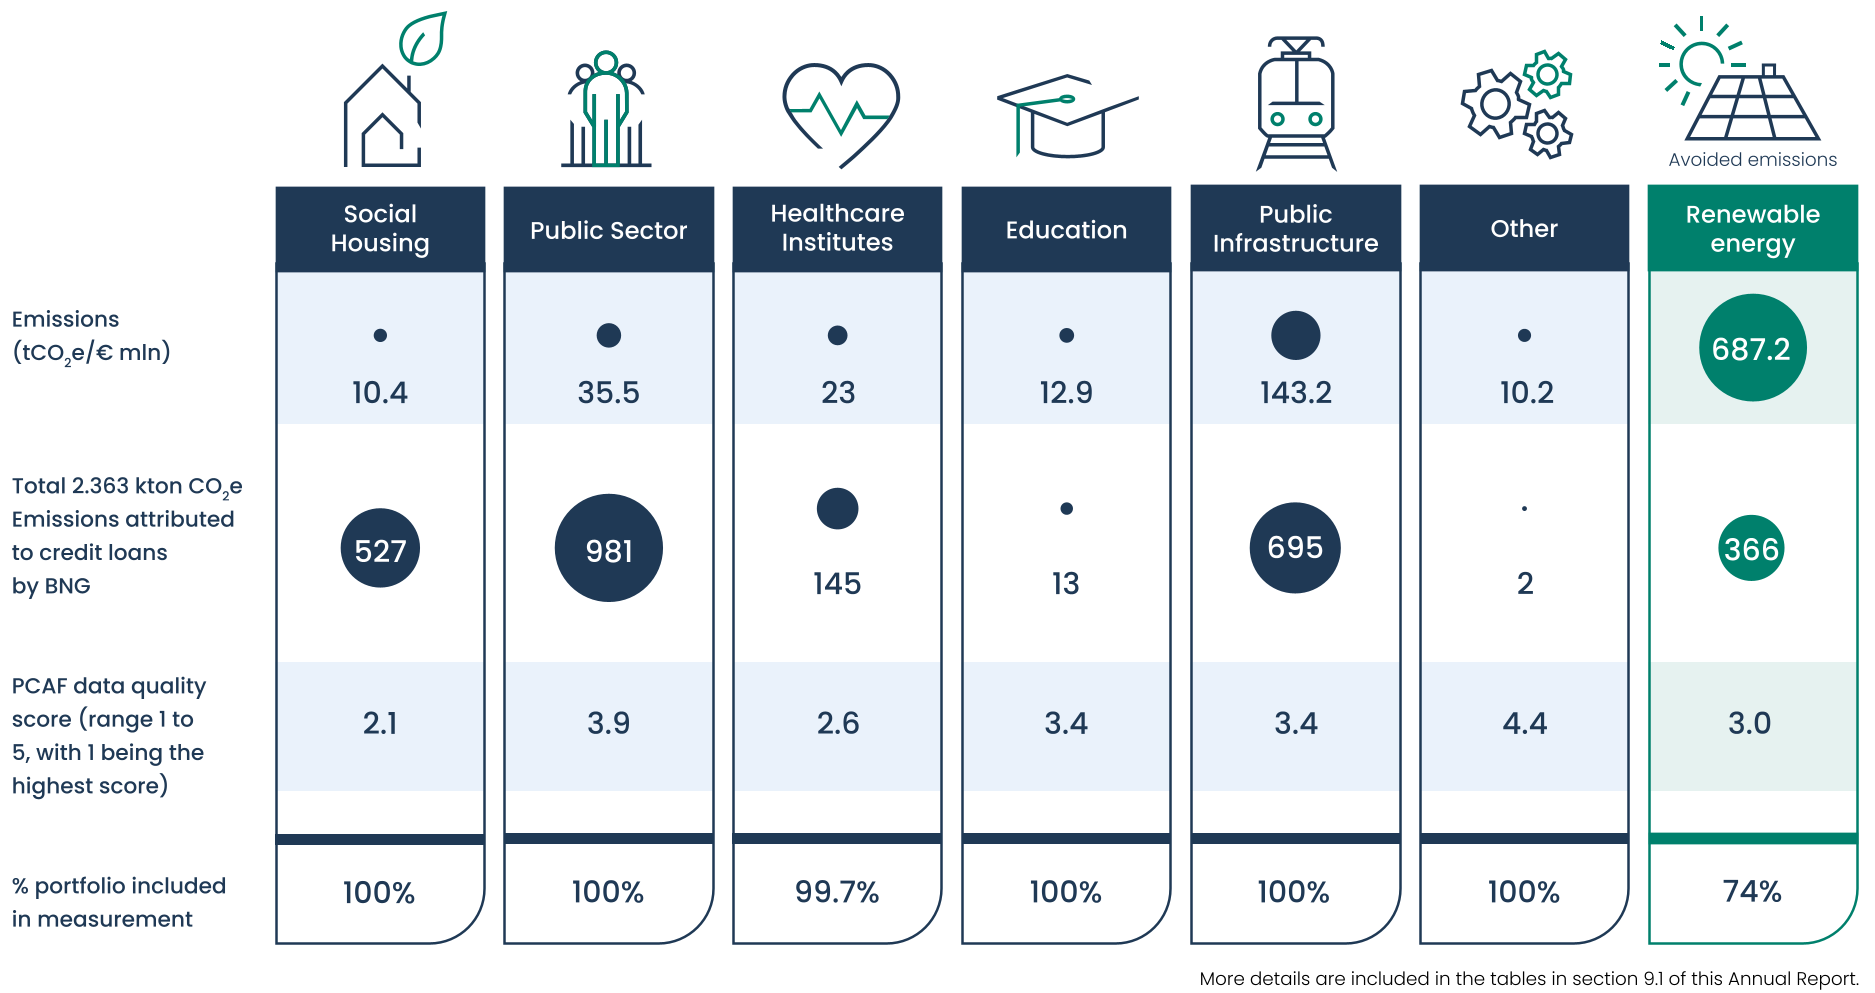
We are aiming for a 25% reduction in CO2e emissions from financed emissions in 2026 compared to 2018. Based on the measurement year 2024, a reduction of 25.5% has been achieved compared to 2018. This means we are well on track to achieve our reduction target for 2025. Since 2018, we have been measuring the CO2e emissions caused by our financing. This is based on the method developed by the PCAF (the Partnership for Carbon Accounting Financials). The outcome of this measurement and the methodology and data used are described in detail in our report ‘Greenhouse Gas Emissions of BNG’s Assets’, which can be found on our website. In this annual report, we will provide an update on the financed emissions associated with the outstanding long term loans as at 31 December 2024. Chapter 9.1 of this annual report explains the most important elements of the methodology and data.
In our ‘Going Green’ climate plan, we have set targets for our financed emissions. The short-term objectives of BNG were validated by the Science-Based Targets Initiative (SBTi) in September 2025. Every year, we report on the progress made on these targets in our Climate Progress Report, which we publish as a separate document at the same time as this annual report.
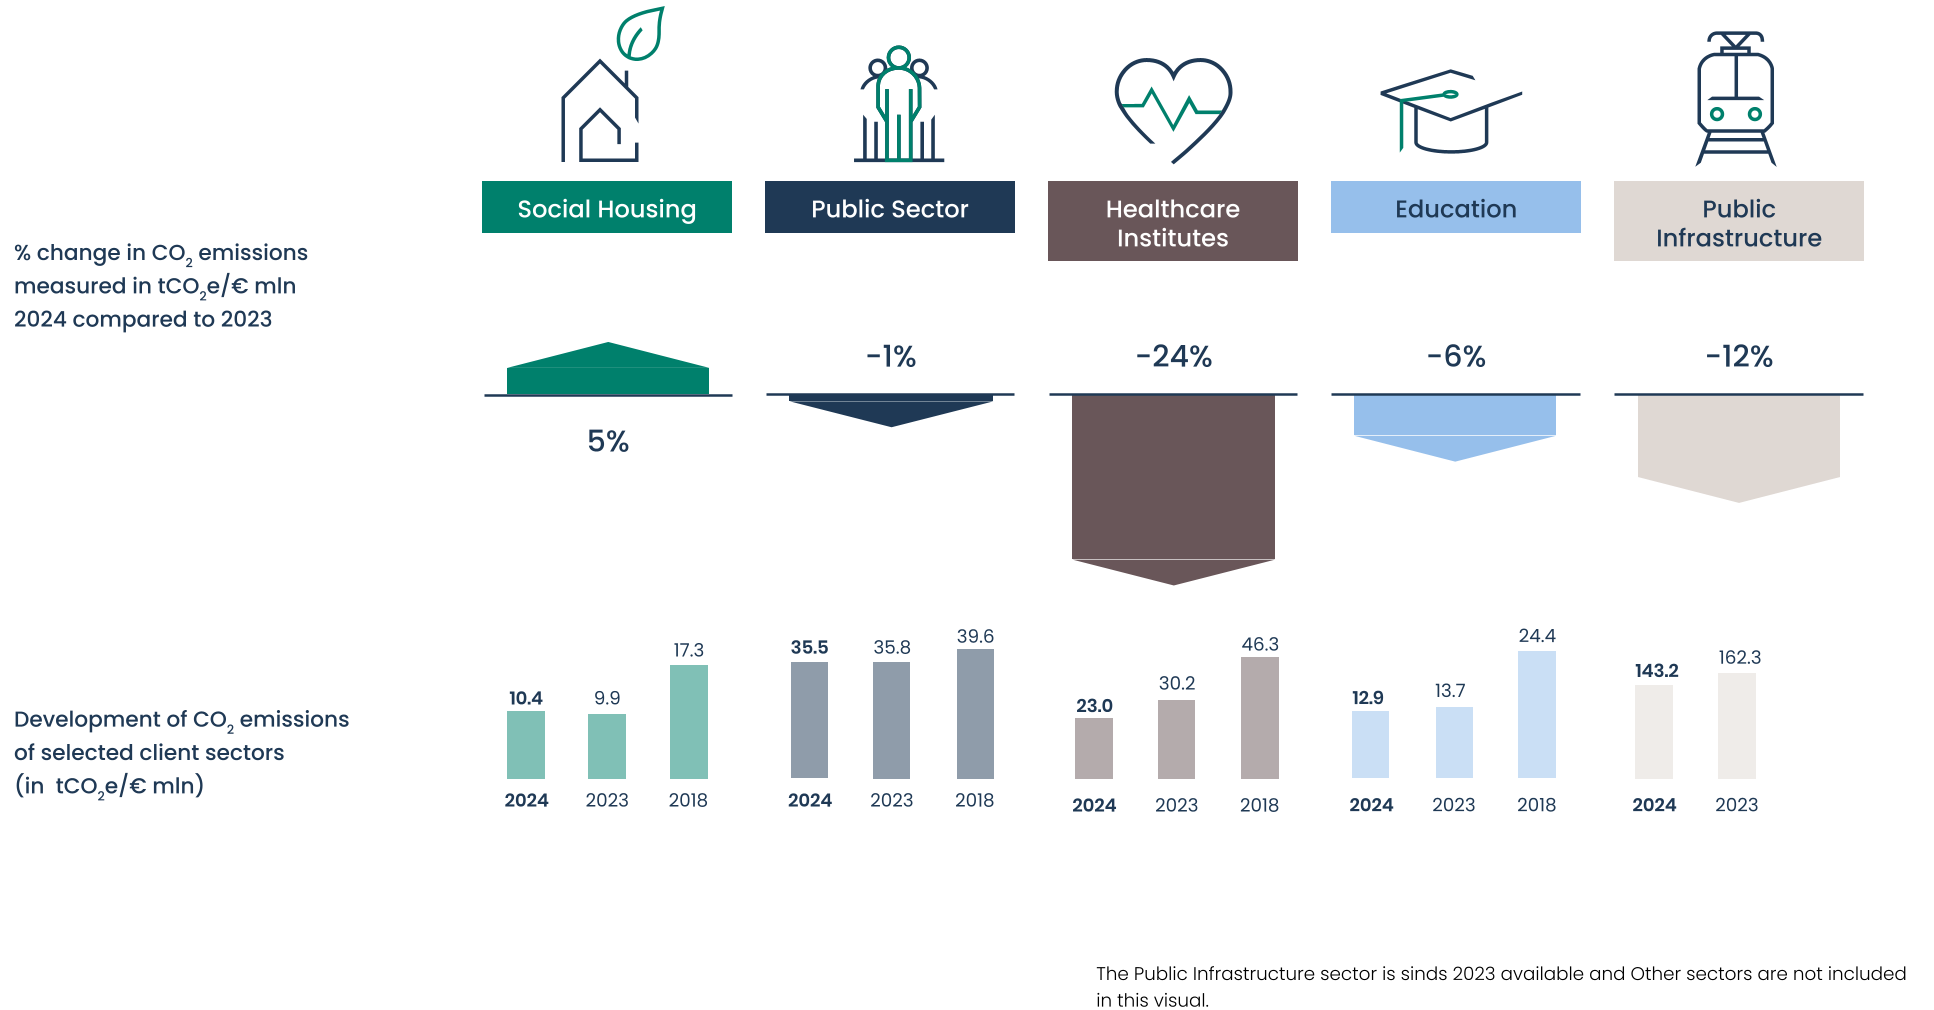
Absolute financed emissions originating from our entire loan portfolio decreased from 2,417 kt CO2e in 2023 to 2,363 kt CO2e in 2024 (-2.2%). This decrease is mainly attributable to the decrease in emissions in the Care sector, which is caused in particular by a change in methodology1. The coverage ratio of our measurement remained virtually unchanged from 99.6% in 2023 to 99.7% in 2024. The loan portfolio also grew by 4.4% from EUR 87.8 billion in 2023 to EUR 91.7 billion in 2024. This resulted in 26.0 tCO2e per financed million euros, a decrease of 6.5% compared to 2023 (2023: 27.8 tCO2e/EUR million).
In our Climate Progress Report, we look more closely at the client groups that we finance within this sector. If we limit ourselves to the sectors we measure from 2018, these will generate 18.8 tCO2e per financed million euros, a decrease of 3.6% compared to 20232. Only the sectors that we have been measuring since 2018 have been included for the calculation of the KPI on a percentage decrease of the absolute scope 1 and 2 emissions. These relate to housing associations, municipalities, provinces, water boards, healthcare, education and drinking water companies.The absolute emission measurement for scope 1 and 2 for these sectors is 835 ktCO2e in 2024, 840 ktCO2e in 2023 and 1,121 ktCO2e in 2018. This represents a decrease of 0.6% in 2024 compared to 2023 and 25.5% compared to 2018.
In the previous year, we mapped out the financed emissions for our bond portfolio for the first time. These are bonds that we have purchased from governments, supranational and multilateral development banks, municipalities and companies in the Public Infrastructure and Energy sector. Emissions were able to be measured for 62% of this portfolio in 2024.
These results are explained in more detail in the Climate Progress Report.

- For the Healthcare, Education and Municipalities sectors, the methodology has been adjusted or different source data has been used; see Chapter 9.1 for more details. These adjustments have been applied retroactively to the 2018 and 2023 emissions. For Healthcare, it was not possible to apply this to all items in 2018 and 2023.
- The base year for the Housing Associations, Municipalities, Provinces, Water Boards, Care and Education sectors is 2018. The base year for Drinking Water Companies is 2020.
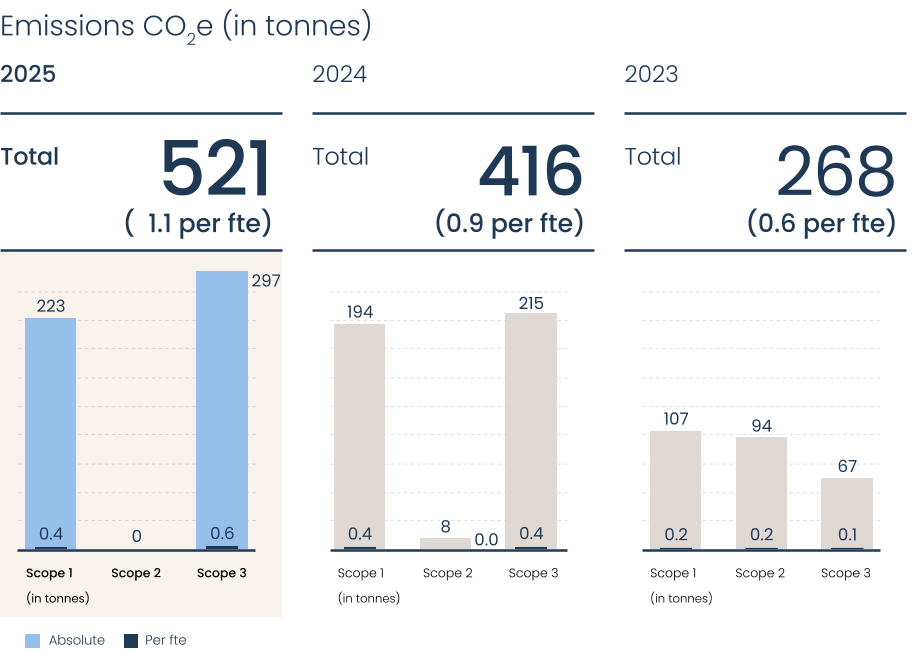
In addition to our external impact, we aim to achieve CO2e neutrality and the responsible use of materials within our own operations. We report our scope 1, 2 and 3 emissions annually in accordance with the Greenhouse Gas Protocol (GHG).
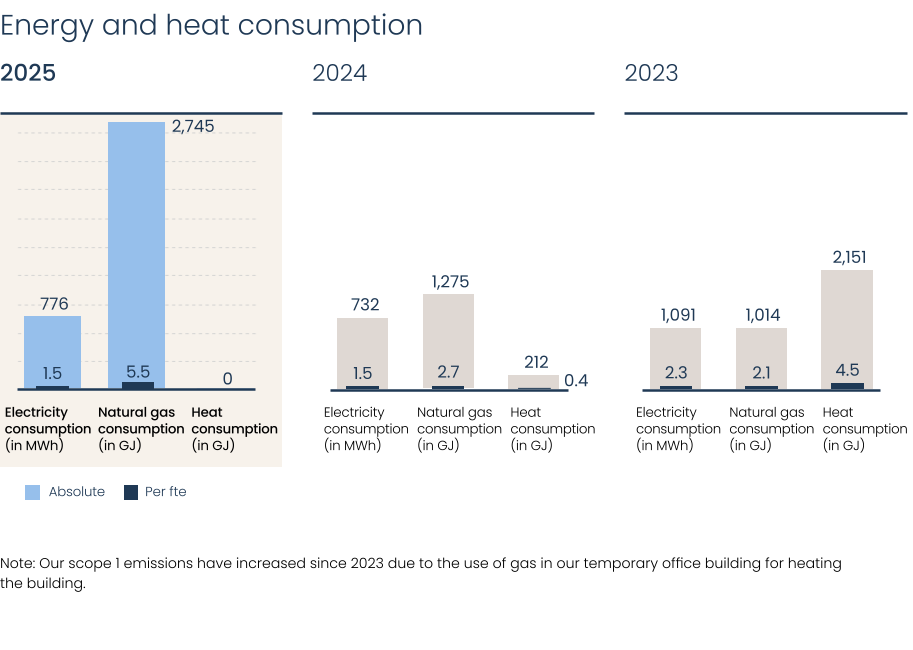
In 2023, we started renovating our office building on Koninginnegracht. The building will be preserved further and will meet the highest energy efficiency standards after delivery (energy label A++). During the renovation period, we are using temporary accommodation that runs partly on gas, which has led to a temporary increase in scope 3 emissions. Nevertheless, the electricity supply remains completely green. We will return to our renovated and more sustainable office building in the beginning of 2027.
Scope 1 & 2
By 2025, the targets for scope 1 and 2 of our own business operations will have been validated by SBTi. These targets concern: a 100% reduction in absolute CO2e emissions and BNG will continue to purchase only renewable electricity until 2030.
Our lease policy changed last year, which means that employees will only be able to lease electric cars in the future. As a result, we will see a decrease in our Scope 1 emissions for this category in the coming years. Due to the expiry of lease contracts for cars with a combustion engine, our Scope 1 emissions will be zero from 2029. At year-end 2025, there were no longer any diesel-powered lease cars and two-thirds of the lease cars were fully electric.
Scope 3
Our policy on business travel has changed. For journeys of up to 750 kilometres, train travel will in principle be the standard from 2024 onwards. This will be reflected in the CO2e emissions from our air travel. This year, for the first time, we have mapped out the emissions from our employees' commuting. In 2026, we will make our mobility policy even more sustainable and investigate how we can further facilitate and encourage employees to make sustainable choices. Starting this year, on the advice of SBTi, we are reporting the electricity consumption of electric lease cars under scope 3, as we have no influence on the electricity mix of charging points outside BNG. This item was reported under scope 2 last year.

5.1 Employees
Our people: the heart of the bank
Our employees make a difference and are the beating heart of BNG. This is also reflected in our strategy, in which we state: ‘We are a bank with a heart, focused on personal growth and cooperation.’
Strategic priorities
Our HR policy is focused on realising the strategic course "Road to More Added Value" by strengthening executive effectiveness, supply chain-oriented collaboration, and sustainable employability. By investing in leadership, expertise, and entrepreneurship, we make our strategy concrete through the development and deployment of our people. Our HR policy seamlessly aligns with the corporate strategy, using our core values as the foundation for our daily actions and collaboration. In 2025, we therefore added the core value "entrepreneurial," in line with the Route to More Added Value. This new value emphasises a new way of working, with greater executive effectiveness and proactivity. Our core values "expert, connecting, optimistic, and enterprising" form a solid foundation for our policy.
Our strategy needs to be tightened up with concrete and measurable objectives. Each quarter, we reported on progress and impact through identified KPIs. These quarterly reports are an important way to show successes and take further steps. In the fourth quarter of 2025, we developed the ambitions for our strategic objective further in programme plans for 2026 and targets through to 2028.
Delivering added value is a lasting objective and a driving force that is visible in our culture, results and growth. The KPIs for this objective are now also anchored in the Performance Management System, through which joint results targets for management will be integrated across the bank by 2026.
Personnel policy and reorganisation
Our human resources policy focuses on creating an inclusive, sustainable and fair working environment. This policy is based on our human rights policy, which applies to lending, liquidity management and procurement. It promotes equal opportunities and fair pay, regardless of gender, race, religion or employment relationship.
In 2025, we implemented important policy updates to strengthen our human resources strategy. In cooperation with the works council, for example, we have implemented a new job centre, consisting of seventeen job families, which promotes internal flow. This gives employees more insight into the knowledge, skills and competences required for development within or outside their job family. This transparency contributes to engagement and growth and supports management in strategic workforce planning.
The Road to More Added Value strategic course of action revolves around a sharper focus and a new way of working. We are taking measures to future-proof the organisation in order to reinforce this course of action. One of these measures is the reorganisation, which is taking place in two phases: first the top structure, then the broader organisation. The RfA (request for advice) for the top structure (phase 1) was completed in the summer of 2025. The RfA for the rest of the organisation (phase 2) was submitted in December 2025 and will be completed in the first quarter of 2026. The implementation of the new organisation will take place in the second quarter of 2026. For this reorganisation, we have taken a restructuring provision of over EUR 15 million.
Personal growth
We invested fully in the development of our employees again in 2025. We stimulated more internal mobility and saw a growing use of our learning and development platform, which is a part of the ‘Unlimited Learning’ concept. This concept reflects our ambitions to continuously support employees in their personal and professional growth. The BNG Academy was introduced in 2025, offering a mix of mandatory e-learning modules and tailor-made learning tracks on specific themes, such as onboarding. These provide an overview of learning activities for each position or role that will help our employees to develop their knowledge, skills and conduct. Each employee sets themselves personal development goals for the coming year through our Performance Management system. To strengthen talent development, we continued the Personal Leadership Journey in 2025. This process built on previous leadership initiatives, for which forty employees had been selected based on their development potential.
Diversity and inclusion
Diversity and inclusion took centre stage in 2025. In line with the SER Charter Diversity signed in 2024, the action plan has been submitted and we are monitoring this annually. As part of this plan, we established an ambassador group that actively works to promote diversity and inclusion within the organisation. These efforts received additional support from a range of events, including the initiatives during Diversity Day and workshops such as “Unconscious bias” and “Dilemma training”. These events contributed to raising awareness and engagement among employees. The results of our Pulse Survey in the last quarter of 2024 and 2025 provided important insights into social safety. We shared the team results across all teams and discussed actions and improvements together. In addition, we have identified a number of bank-wide topics in 2025 that we will work with on a structural basis in 2026.
Recruitment, selection and onboarding
We optimised our recruitment and selection activities in 2025. We are reinforcing our presence on social media and deploying our employees as ambassadors through the referral programme. 9 new employees have been recruited via the referral programme. The time needed to fill vacancies (time to hire) increased in the first half of 2025, but decreased in the second half. We have increasingly filled vacancies through internal flow, recommendations and our own recruitment efforts. As a result, the share of external agencies in our recruitment activities continued to decrease. We have improved our onboarding programmes in 2025 to integrate new employees more quickly, regardless of their employment relationship. These programmes help them feel connected to our organisational culture. They contribute to a smooth start and reinforce the sense of involvement in BNG as an attractive employer.
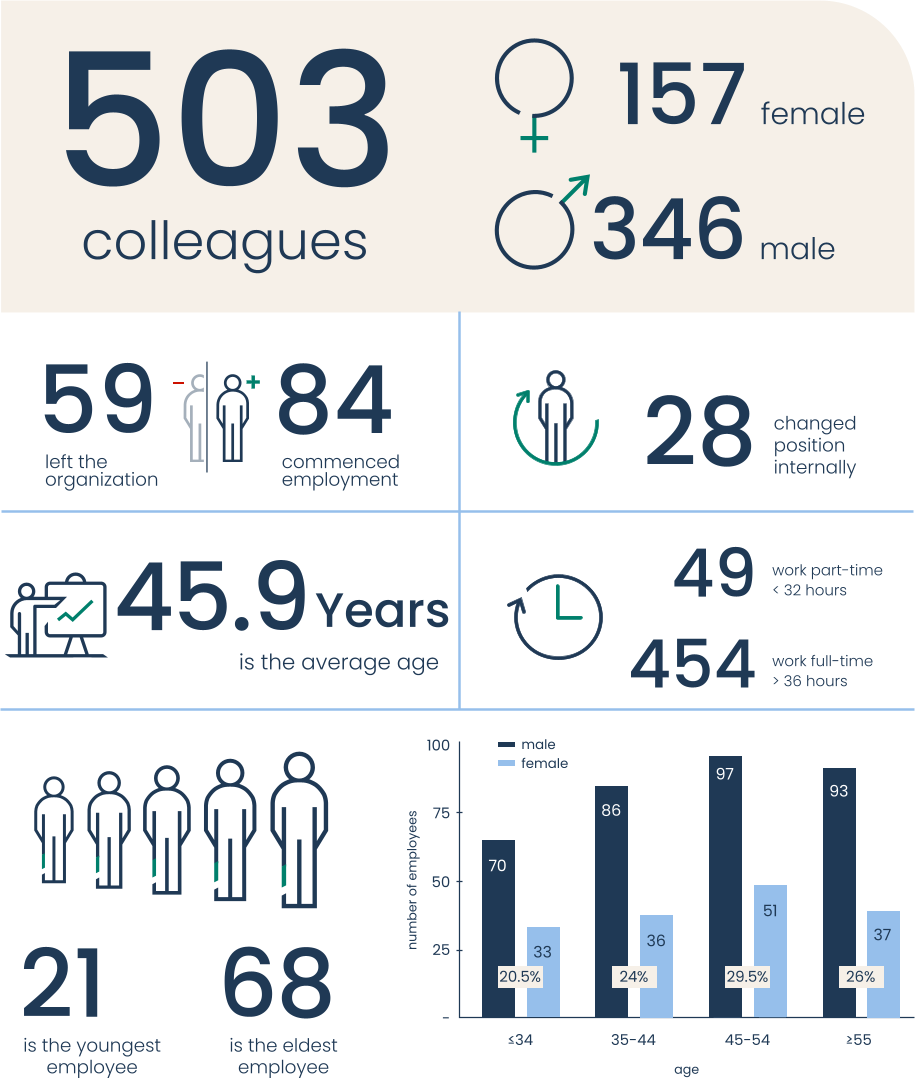
As at 31 December 2025, our workforce consists of 503 in-house staff (measured in FTEs). The number of external staff stands at 124 FTEs as at 31 December 2025. This represents a decrease of 45 FTEs compared with the figure as at 31 December 2024. The externally hired staff consist of individuals on self-employed contracts and seconded staff, who are primarily working on strengthening and modernising our IT organisation. The decrease in the number of externally hired staff in 2025 is due to the transition from external to internal staff and the completion of IT projects.
Sustainable employability and green employment conditions
Sustainability is an essential aspect of our human resources policy. We are inspired in this instance by the UN Guiding Principles on Business and Human Rights and the OECD Guidelines for Multinational Enterprises. This is reflected in sustainable employment relationships, ‘green employment conditions’ and sustainability of our mobility and lease policies. To promote the sustainable employability of employees, we offer facilities such as a sports budget, bicycle plan and vitality leave. These contribute to the vitality and long-term commitment of our employees. Absenteeism was 4.35% in 2025, higher than in 2024 (4.0%). This higher rate of absenteeism is mainly due to higher absenteeism in the fourth quarter. Long-term absenteeism is largely medically related.
Key figures HR
Remuneration policy
BNG is a member of the Employers’ Association for Banks (WVB) and applies the Collective Labour Agreement Banks. Of all BNG employees, 95% are covered by the Dutch Collective Labour Agreement Banks (CAO Banken).
Based on the agreements in this CLA, salaries and salary scales were increased by 4% on 1 January 2025 and then by 1% on 1 July 2025. In addition to many other schemes, the collective labour agreement also includes a parental leave scheme that can be detailed further by the organisation.
BNG has a parental leave scheme where the first four weeks of the partly paid parental leave (a total of nine weeks can be taken) can be topped up to a maximum of 100% of the salary. Thirteen employees (10 men and 3 women) made use of the scheme in 2025. All employees whose parental leave ended returned to their jobs.
The Collective Labour Agreement Banks also has a vitality scheme. Based on a number of criteria and with retention of part of their salary, employees can take two months’ leave. Eleven employees made use of this scheme in 2025. In addition, the vitality scheme has a so-called 80-80-100 scheme, in which the employee works 80% hours at 80% salary but retains 100% pension accrual. Within BNG, two employees participated in this scheme.
All employees participate in the ABP pension scheme. As the employer, BNG contributes 70% to pensions, while the employee contributes 30%. All figures mentioned are as of the end of 2025.
BNG aims for a restrained remuneration policy that corresponds with our identity and strategy. We want the remuneration policy to discourage taking more risk than is acceptable. The remuneration policy must also not lead to incentives for dishonest behaviour. Employees and members of the Executive Committee and Supervisory Board do not receive variable remuneration.
The Supervisory Board monitors the bank’s remuneration policy. The general principles of the remuneration policy for Executive Committee and employees have been approved by the Supervisory Board. Each year, the implementation of the remuneration policy is reported to the Supervisory Board and the Supervisory Board assesses whether the policy meets the principles for a restrained remuneration policy. For that purpose, Risk Management carries out a risk analysis for various components of the remuneration policy.
The Annual General Meeting adopts the remuneration policy for the statutory members of the Executive Committee and the remuneration scheme for members of the Supervisory Board. In 2025, the salary of the highest-earning member of the Executive Committee was 3.72 times the median salary of employees at BNG (3.87 in 2024). The average salary (wage bill) increased by 8.7% compared with 2024. The salary of the highest-paid ExCo member increased by 7.8% in 2025. The remuneration policy and the remuneration report are published on the website. The remuneration of Executive Committee and Supervisory Board members in 2025 is reported in the financial statements.
5.2 Compliance
The integrity of BNG is essential to safeguarding the trust of our stakeholders and to achieving our strategic objectives. This integrity starts with compliance with laws and regulations and the enforcement of a common set of standards. To promote this integrity, we agree on rules that guide our actions.
Governance
Risks that threaten the integrity of BNG are described as the bank's compliance risk. We divide this risk into four sub-risks that relate to financial economic crime, behaviour, fraud and regulatory compliance. Managing these risks is the responsibility of the entire bank. As an independent second-line compliance function, the Compliance department provides support in this regard based on a compliance cycle. This cycle is in line with the generic risk management cycle of BNG and is laid down in the Compliance Charter..
Compliance cycle
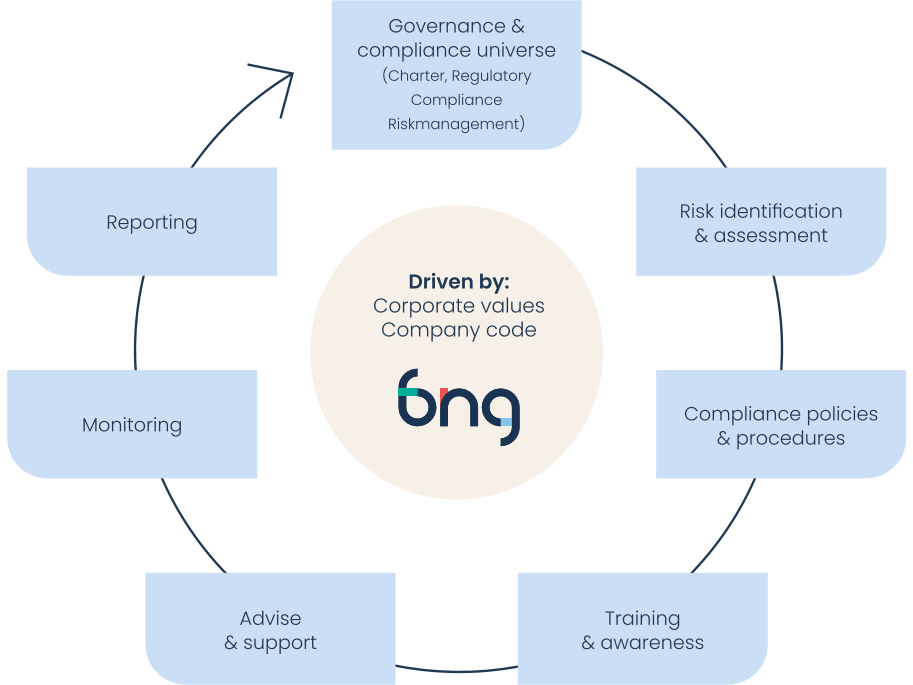
Developments in 2025
In 2025, BNG focused on improving the demonstrability of the management of compliance risks. This creates a more complete and objective view of the risks. Where we identify gaps in our risk picture, we perform further analysis, including the Systematic Integrity Risk Analysis (SIRA). We also identify opportunities for improvements and tightening in our risk management. We will discuss the main developments in 2025 for each sub-risk below.
Financial and economic crime
An important condition for our integrity is that BNG is not involved directly or indirectly in money laundering, terrorist financing, sanction violations, bribery or corruption. The client integrity policy forms the basis for mitigating this risk. Based on this policy, we assess counterparts in the international money and capital markets, clients in the Dutch public domain and other relationships. In addition, we use this policy as a foundation for our transaction monitoring programme, which allows us to detect unusual transactions.
The Anti-Money Laundering and Terrorist Financing Act (Wwft) and the Sanctions Act (SW) form important frameworks in this policy for client integrity. In 2025, BNG made qualitative improvements to the implementation of this policy and the systems used in the implementation of the policy.
Bribery or corruption are fundamental offences that lead to money laundering. Managing these risks in relationships is part of the due diligence process for these relationships. Within BNG, we screen our employees and have a code of conduct to which employees commit. We assess the inherent risks of corruption or bribery as limited both in our commercial processes and in our internal processes. Therefore, BNG does not specifically offer of anti-corruption training. We also did not register any incidents of corruption in 2025.
Conduct risk
Conduct risk includes the risk of actions by BNG, its employees or its relations that are contrary to our standards, legal requirements or social standards. Our code of conduct is the starting point for managing this risk. This code gives employees direction in their actions and is an important building block in the integrity of BNG.
New employees (internal and external) go through an onboarding programme when they start work with us. In this training, they are given an explanation of the code of conduct, take the banker's oath and the second-line compliance function provides an introduction to the regulations that employees must comply with. In addition, new employees must take in-depth training courses to mitigate conduct risks in the first weeks after commencement of employment.
Employees who are already employed can always consult the policy internally. Through additional training courses, intranet reports, stand-ups, management focus and employee surveys, BNG monitors whether employees remain aware of the standards of conduct that we agree upon with each other. Managers, HR and Compliance are ready to provide consultancy or answer questions about this policy. In addition, employees can report potential irregularities via an incident process, a complaints procedure or a reporting procedure. In this way, we bear responsibility for the integrity of BNG jointly.
In the case of clients, counterparties and other third parties, the code of conduct is the starting point. BNG wants to support positive social transitions and promote ethical action among these stakeholders. The code of conduct is the starting point in a supplementary policy that is aimed at these external stakeholders. These stakeholders can also provide feedback on BNG's actions, for which there is a complaints procedure (link).
BNG did not receive reports or identify incidents in which conduct risks with a significant impact materialised in 2025.
Fraud risk
We monitor fraud risk as a separate sub-risk due to the nature of this risk and the impact that a fraud incident can have on confidence in BNG or the financial sector as a whole. This risk includes both internal fraud by employees and external fraud directed against BNG or our business relations. We ensure the detection and settlement of fraud cases through our separate fraud risk management framework. Developments in existing or new fraud risks form part of the SIRA.
BNG did not identify any cases of internal fraud or external fraud against BNG in 2025. We detect signs of external fraud at or through our relationships using management measures, such as transaction monitoring. Here too, the number remained limited in 2025 and these signals were reported, where necessary. Fraud in payment transactions continues to be a focus point for financial institutions in 2025. BNG’s clients are less susceptible to fraud in payment transactions due to the nature of their business and the fact that this type of fraud is often directed against consumers.
Regulatory compliance risk
Finally, BNG has defined the risk of breaches of laws and regulations as a separate risk. The new regulatory compliance risk management policy provides a framework for identifying and reporting on compliance risks. We identify material compliance risks through analyses and monitoring within the compliance cycle. Information from first-line monitoring, audit reports and discussions with the supervisory authorities provide input into this analysis and monitoring.
A number of new or amended laws entered into force in 2025 and the volume of legal obligations remains extensive. In 2025, BNG prioritised activities that manage regulatory compliance risks more highly. Implementing the obligations under the Digital Operational Resilience Act (DORA) has been given absolute priority in this regard. These activities not only reduce the regulatory compliance risk, but also reduce the operational risks of BNG in this area.
Data security is a component of DORA. As a result, these activities also increase the maturity of BNG in its compliance with the General Data Protection Regulation (GDPR).
The Capital Requirements Regulation, BCBS239 and the Wwft/SW remain important legislative files with regard to regulatory compliance risks arising from other regulations. The Instant Payments Regulation and the Artificial Intelligence Act were added in 2025. BNG remains committed to compliance with all obligations based on a risk-based approach. If structural solutions for compliance require additional time to implement, BNG uses temporary mitigating measures.
BNG remained in close contact with regulators in 2025 about regulatory compliance risks. These contacts include informal discussion, as well as formal information requests, notifications and inspections. We did not receive any fines or penalties and were not involved in any legal proceedings due to non-compliance. There were also no outstanding fines or sanctions from previous years.
Customer privacy
BNG attaches great value to the privacy of persons, employees, applicants and other data subjects associated with clients.
We took steps to increase our level of privacy maturity in 2025:
We have set up a Privacy Office to further strengthen the privacy framework.
The Privacy Policy has been revised and supplemented with a range of guidelines and procedures.
At the launch of our new website, we implemented a cookie consent mechanism and a cookie statement, in accordance with the instructions of the Dutch Data Protection Authority (DPA) for clear cookie banners.
Data breaches
Under the GDPR, BNG must register data leaks internally and, depending on the severity, report them to the DPA and data subjects. A data breach is a security incident, in which personal data is accidentally or unlawfully destroyed, lost, modified, provided, made accessible or temporarily unavailable. We registered 29 data breaches in 2025 (2024: 23). Only two of them were reported to the AP (as many as in 2024). One report was later withdrawn, as further investigation revealed that there was no risk to data subjects. The data breach reported concerned access rights set incorrectly, which meant that data was too widely accessible internally. There was no unauthorised external access. There were no data leaks requiring reporting to data subjects.
Rights of data subjects
In 2025, BNG introduced a new procedure that provides frameworks for handling requests from data subjects to exercise their privacy rights under the GDPR. BNG received one request in 2025: a removal request from an applicant. In addition, BNG did not receive any complaints about breaches of the privacy of data subjects.
5.3 Risk Management
BNG strengthens civil society organisations with financial clout. We do this not to maximise profits, but to make a positive impact. The risk that we are prepared to take on this must fit in with the strategic principles and is based on a long-term and prudent risk profile.
Identifying, analysing and managing risks is inherent in our activities. We manage and control risks through an extensive Risk Management Framework (RMF), which integrates risk management in all our business activities, from strategic planning to daily operational activities. This is aimed at safeguarding and maintaining the bank's secure risk profile and protecting our reputation. Taking balanced risks that are adjusted to the risk appetite is essential for our managed business operations.
Risk Management Framework
The RMF is the set of policy documents that outline the risk management principles at BNG. The framework brings together a range of elements that play a role in our risk management. Our RMF is shown in the overview below.
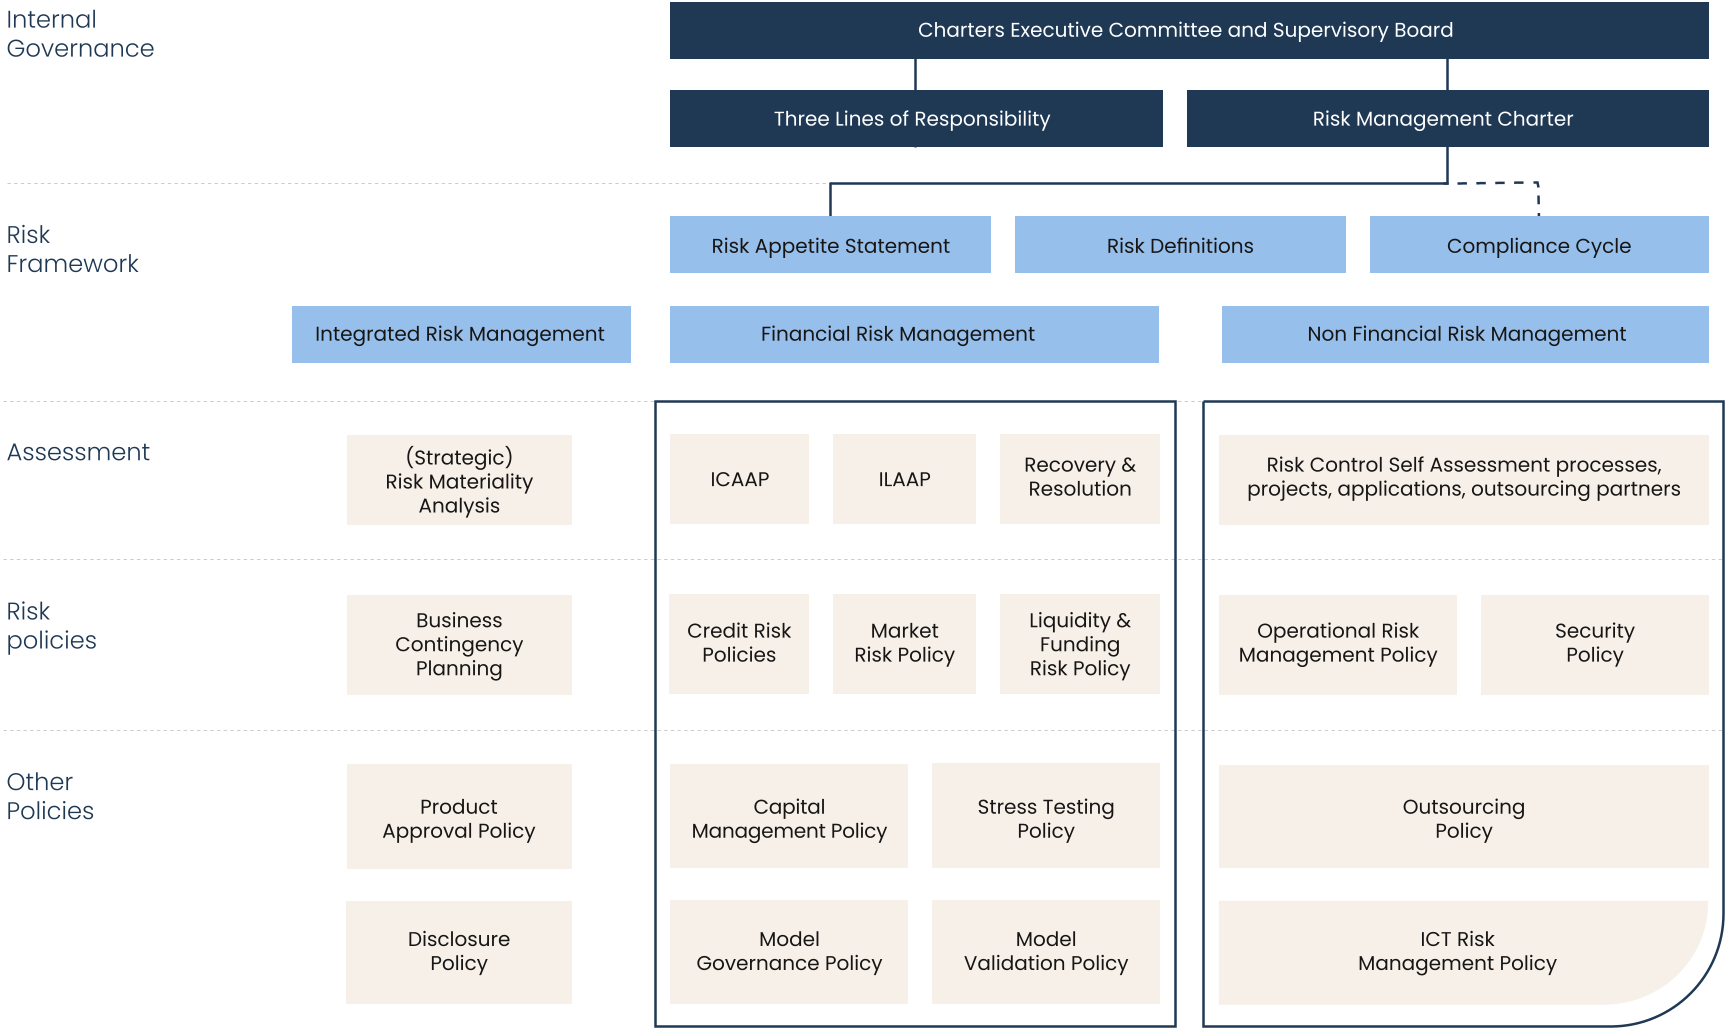
Risk-related committees
The Executive Committee determines the risk management frameworks with the approval of the Supervisory Board. The Asset & Liability Committee (ALCO), Credit Committee (CC), Credit Policy Committee (CPC), Credit Committee Treasury (CCT), Sustainability Banking Committee (SBC), Non-Financial Risk Committee (NFRC) and Client Acceptance and Review Policy Committee (CARPC) make decisions on the risk management of the bank. The Supervisory Board (SB) and, in particular, the Risk Committee (RC) of the SB, evaluate the risk management. This is an important part of his supervisory role.
See the overview of risk-related committees beside:
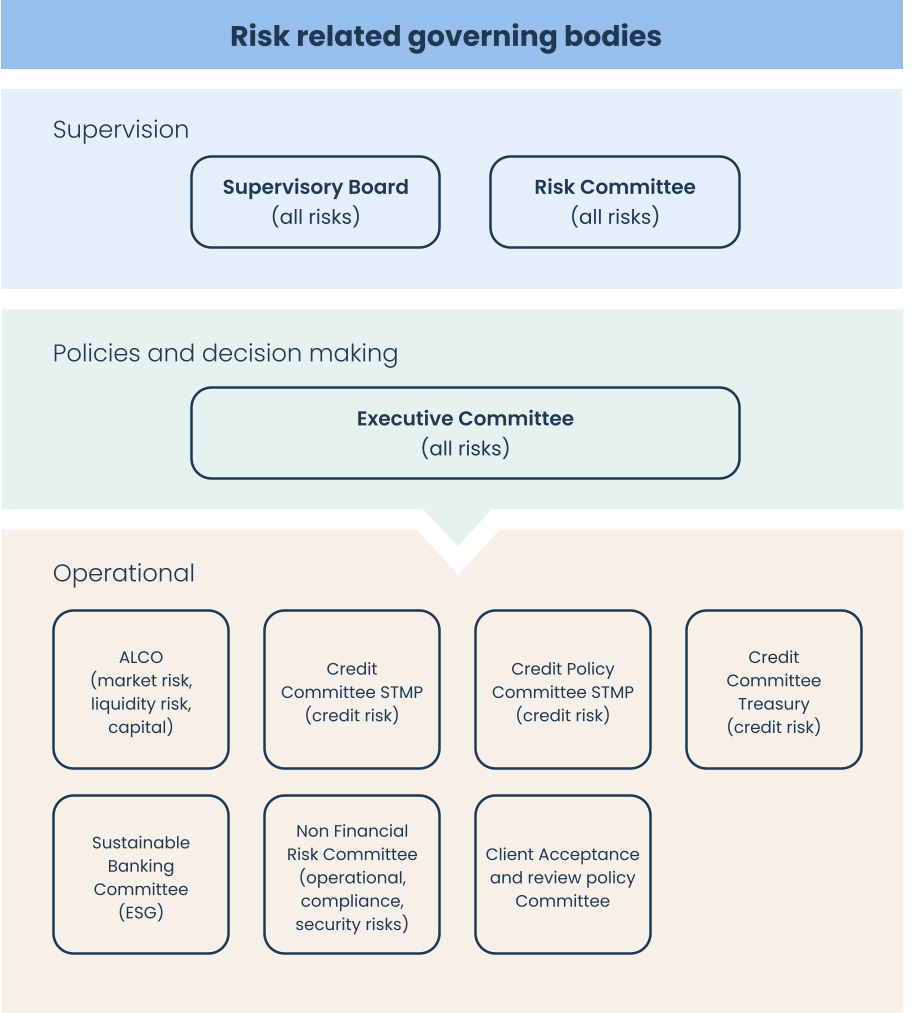
The purpose and powers of the Risk Management and Compliance departments are laid down in the Risk Management Charter and Compliance Charters respectively. Risk Management and Compliance are is represented in the risk-oriented ExCo committees and takes part in meetings held by the SB’s Risk Committee. The Compliance and Risk Management department heads are accountable to the CRO, the ExCo and have a reporting line to the SB.
A summary of the roles of the Exco committees per risk type is set out in the table:
Committee | Responsible for risk type limits/objectives | 2nd line reporting |
|---|---|---|
Executive Committee | Strategic Risk and monitoring of all risks | Integrated Risk report |
ALCO | Liquidity risk and market risk Capital limits (covering multiple risks) | Market risk dashboard Liquidity risk dashboard Share capital dashboard |
CC/CPC STMP | Credit risk for legally defined market parties | STMP Credit Risk Monitoring Report |
CC Treasury | Credit risk of financial counterparties, Treasury portfolios | Treasury credit risk monitoring report |
NFRC | Operational Risk, security risk and compliance risk | Operational risk report, Compliance report, Security report |
SBC | Overarching ESG risk. Coordinating ESG-related activities and analysing the potential effects of strategic ESG risks.1 | ESG risk dashboard |
CARC | Integrity risk related to financial-economic crime | Monitoring results and consultancy |
- ESG risks that fall specifically in a traditional risk category are subject to the same risk governance. For example, ESG risks related to credit risks are handled by the sub-committee of the Executive Committee that monitors credit risks.
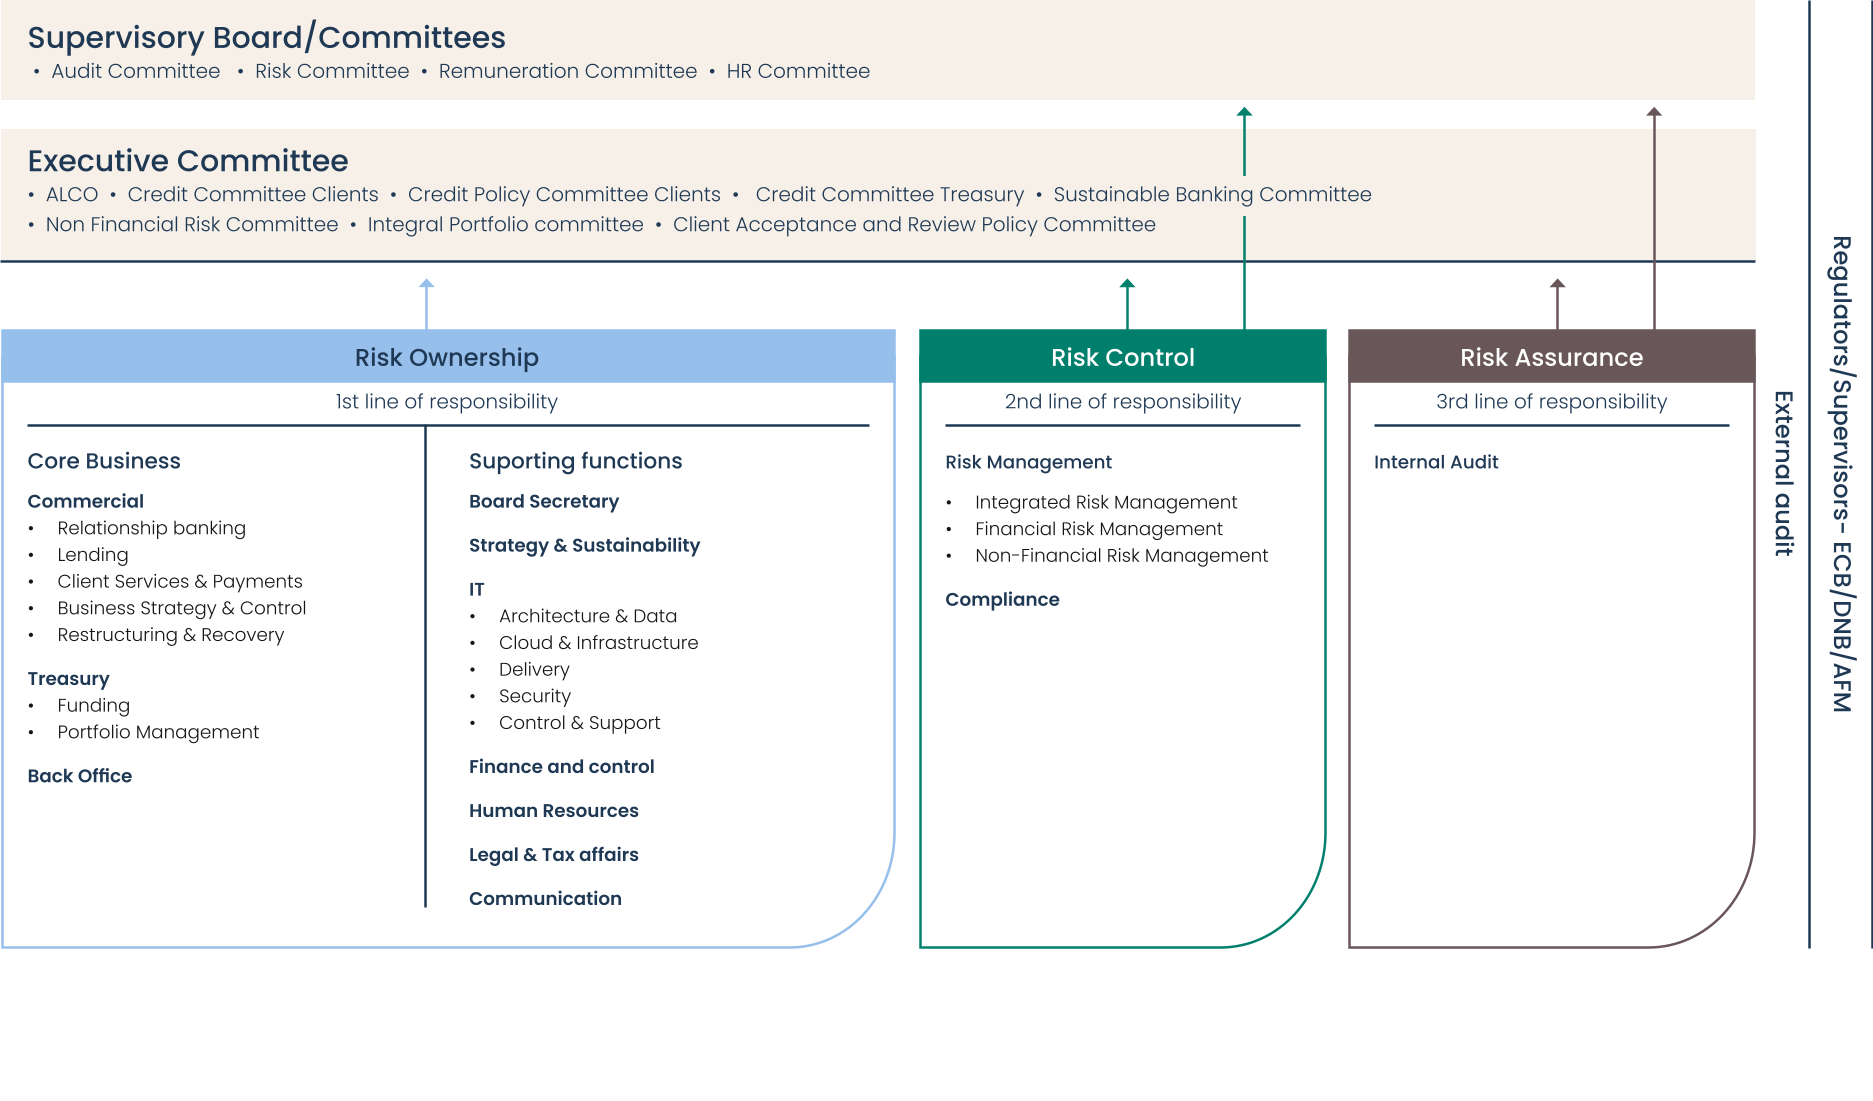
BNG uses the 3LoR model as its governance framework for risk management. Each line has a specific role and defined responsibilities in managing and controlling risks. The figure below shows the allocation of departments within BNG to the three lines.
Lines | Roles | Responsibilities |
|---|---|---|
1st line | Risk Ownership | Business departments. Responsibility for identifying, assessing, measuring, limiting and monitoring risks and developing, implementing and carrying out effective audit measures to control these risks. |
2nd line | Risk Control | Risk Management departments and Compliance. Responsible for advising, facilitating and supporting, monitoring and challenging the first line. The first line remains responsible for the risk, together with management. These second line departments support the Executive Committee in implementing BNG’s risk management policy. |
3rd line | Risk Assurance | Internal Audit. The IAD periodically conducts operational- and IT audits to evaluate the design and operating effectiveness of the bank’s risk management systems and to assess whether the currently applicable laws and regulations are properly complied with. |
The responsibilities in the second line are fulfilled by three Risk Management departments and Compliance, which operate independently of the first line. The purpose and powers of the Risk Management and Compliance departments are laid down in the Risk Management and Compliance Charters respectively.
Integrated Risk Management (IRM) is responsible for oversight of bank-wide risks, including strategic and reputational risk. The IRM department is responsible for, among other things, the bank-wide Risk Management Framework and underlying policy, drawing up the Risk Appetite Statement (RAS) in line with the risk taxonomy and cascading the RAS to Key Risk Indicators (KRIs), integrated risk reporting, coordination of Pillar 3 reporting, and monitoring and advising on prudential laws and regulations.
Financial Risk Management (FRM) subdivided into the following sub-departments:
Asset Liability Management (ALM): The ALM department is responsible for market and liquidity risk and carries out the coordination of the ICAAP and ILAAP and the recovery plan and coordinates the bank-wide stress testing.
Credit Risk Management (CRM) CRM is responsible for credit risk at portfolio and client level from the second line. The tasks include providing a second-line challenge and an opinion on credit proposals and reviews of individual clients, financial counterparties and investments.
Model Risk Management (MRM) is responsible for model risk as a subcategory of operational risk and carries out the model management, including model governance and validation of the bank's models.
Non-Financial Risk Management (NFRM): The NFRM department is responsible for monitoring all operational risks (including IT-related risks) and provides support in identifying, qualifying, and quantifying operational risks in regular business activities and change programs. NFRM is also responsible for bank-wide coordination of the investigation and follow-up of operational incidents.
Compliance: The Compliance department is responsible for monitoring compliance risks, monitors compliance with rules, laws and internal policies and promotes the integrity of the organisation, its clients, its employees and the markets in which BNG operates. See 5.2 Compliance for further details.
Risk Appetite Statement and taxonomy
Risk Appetite
The Risk Appetite Statement (RAS) describes the risk appetite that we accept to achieve our strategic objectives. It defines the risk management principles within BNG and sets limits on all different types of risk.
The risk appetite is described qualitatively for BNG relevant risk types and elaborated in key risk indicators with defined limits. The risk appetite is evaluated annually and adjusted if necessary, to keep it in line with current developments and BNG’s strategic objectives.
The Executive Committee, after discussion and approval by the Supervisory Board, determines the RAS and ensures that our operational activities remain within the risk parameters identified with the support of the risk departments.
Taxonomy
The main risks that apply to BNG are recorded and described in the risk taxonomy. A distinction is made between financial risks, non-financial risks, strategic risks, ESG risks and reputational risks. Where applicable, main risks (level 1) and sub-risks (level 2) have been defined within these categories. The diagram below shows the relevant risks, without indicating the scale of the risk for each type. The overview shows that ESG risk and strategic risk are spread across financial and non-financial risks and that reputational risk is always the result of not managing other risks correctly.
The BNG’s risk taxonomy is shown as follows:
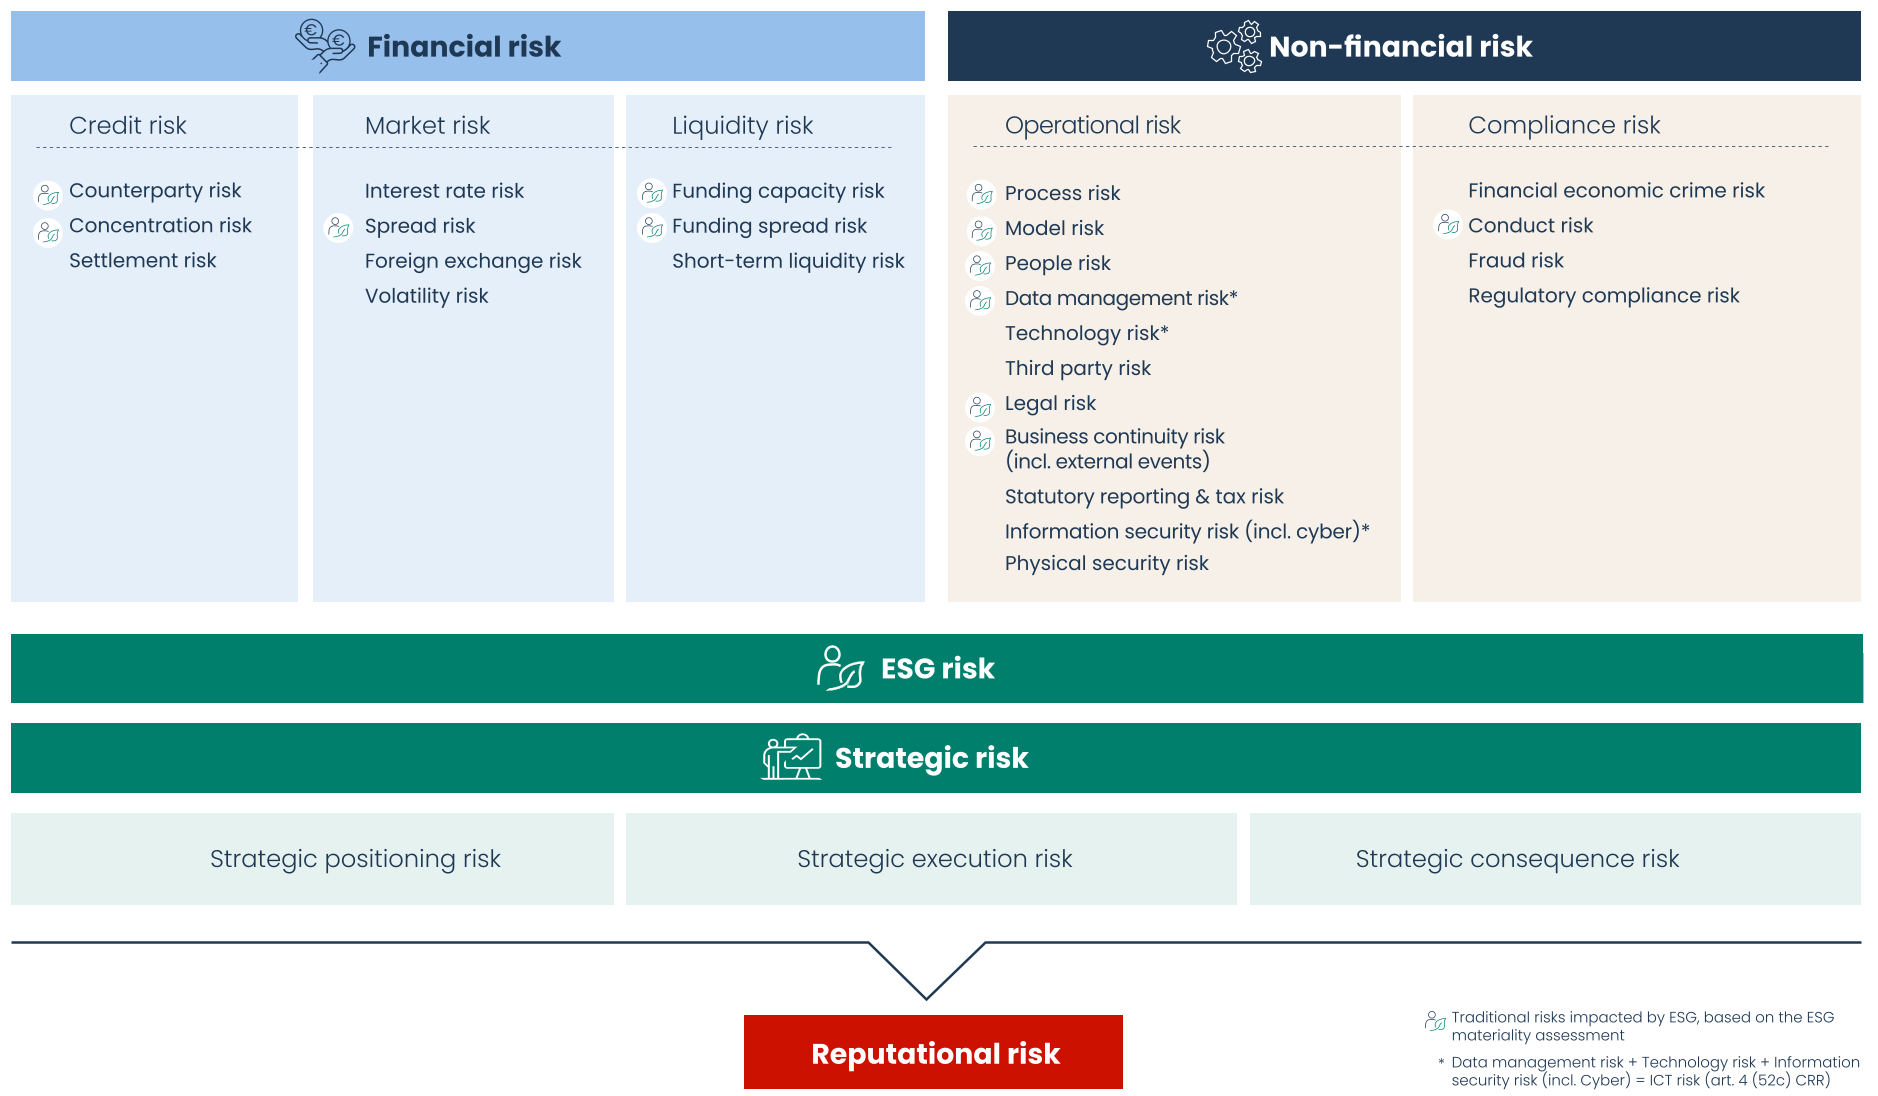
Explanation of the main risks
This section examines the main risk categories that BNG has included in its risk taxonomy. If these risks materialise, they may have a material impact on BNG’s reputation, the achievement of its strategic objectives or on the bank’s financial results. A brief description is included for all major risks of the definition, the risk appetite, the way in which BNG deals with this risk and the most important developments.
Strategic risk
Strategic risks are defined as risks that affect or are created by the bank’s business strategy and strategic objectives. This concerns risks resulting from internal and external causes that could prevent us from successfully achieving our strategic objectives. The Executive Committee and the Supervisory Board have formulated a number of strategic preconditions within which we must operate in order to be of added value to our clients, shareholders and other stakeholders.
Organisational structure
Strategic risks are inherent in the bank’s strategic plans and may also be influenced by external factors. The strategic risks are usually closely related to other risk types. How we deal with strategic risks is detailed in the organisational strategy and annual plansof the individual departments.
These risks matter are also addressed in the stress test programme and are covered in the Capital Management Plan (as part of the mandatory internal capital adequacy assessment process (ICAAP)).
The identification of strategic risks is part of the strategic decision-making process and of strategic risk assessment methodologies. Appropriate measures are taken to mitigate strategic risks where possible. Monitoring and reporting on strategic risks is an integral part of the periodic risk management cycle.
Developments 2025
Geopolitical developments in 2025 are an important focus for BNG. The impact of these developments on BNG appears limited for the time being, but is being closely monitored and analysed. Where necessary, BNG has conducted ad hoc risk assessments to determine whether additional measures were needed to deal with these developments and limit the risk to the bank.
Environmental, Social and Governance (ESG) risk
BNG considers Environmental, Social, and Governance (ESG) risk to be a factor for traditional risk categories. These factors relate to the negative effects of the environment and climate (E), society (S), and governance (G) on the bank's financial performance, continuity, and reputation. We focus in particular on climate and environmental risks. We consider social and governance factors to be less material for the bank. This is because BNG’s exposure is mainly located within the Netherlands and the Netherlands has good institutions and governance practices.
Identification, assessment and management of ESG Risks
BNG uses the ESG Risk Identification & Materiality Assessment (ESG RI&MA) to identify the significant ESG risks to which BNG is or may be exposed. In the materiality assessment, we assess how ESG risks affect traditional risks, such as credit risk, market risk or operational risk. By identifying the material ESG risks, we ensure the integration of ESG risk into our existing risk management.
Internal ESG rating
The ESG factors that are assessed as material in the sector analyses form the basis for the assessment of ESG-related credit risks at the individual client level.
We use an ESG rating to measure ESG risk at the client level. This includes the ESG risk drivers established by the RMAs.
The ESG rating, together with the regular credit rating, forms part of the individual credit assessment process and, thus, contributes to the risk appetite. It also provides input into the ICAAP process and into climate-related stress tests and scenario analyses.
ESG assessment and management
The risk assessment based on the ESG rating forms the basis for the client view of ESG risks. Critical ESG outcomes are discussed with the client in order to make them open to discussion. The focus here is on the efforts of the client to get within the path to acceptance. This can lead to the creation of performance targets. These targets may, for example, be linked to the reduction of energy consumption or CO2 emissions. In an extreme case, when the ESG risks are assessed as being too high, this may lead to rejection of the credit application or a transfer to high risk for credit reviews. This approach ensures that climate and environmental risks are taken into account fully in our credit policy, which contributes to a responsible and future-proof loan portfolio.
KPIs and Reporting
To measure the performance of our clients on sustainability, our focus is on emissions and energy consumption KPIs (Key Performance Indicator), where we focus on the (committed) CO2 reduction targets.
We mainly use independent emissions data sources for this purpose. In this way, it is possible to compare clients according to factors relevant to the sector, including emissions related to the building. Divergent values are identified within the ESG risk reports, after which they are discussed with the client based on the regular periodic credit assessment process.
Organisational structure
ESG risk management is an integral part of the RMF, and the tasks and responsibilities are assigned in accordance with risk governance and the 3 LoR policy. The impact of ESG factors on the bank in terms of lending to customers, assets within the portfolios, and positions with financial counterparties is identified and managed. Decision-making regarding ESG risks takes place at board level and in the existing committees, including the CC, CPC, ALCO, and NFRC. The SBC determines and oversees our integrated sustainability policy. This includes both our long-term environmental and social contribution and the identification of material ESG risks that may negatively impact our performance. To help it implement the strategic sustainability objectives, the SBC is supported by two other bodies. The Sustainability Task Force (STF) consists of representatives from the most relevant departments within the bank. The ESG Regulatory Change Framework (RCF) Task Force identifies upcoming ESG legislation and its impact on the bank.
Developments 2025
We are continuing to refine our ESG risk management framework, while anticipating new regulations such as the CRR3/CRD6 Directive. Our focus is on improving our data quality further, expanding our scenario analyses and strengthening our commitment with clients to jointly mitigate ESG risks. In addition, the bank is working on expanding and deepening its understanding of the physical risks and their further integration into the risk management framework. Through this holistic approach to ESG risk management, we aim to enhance our resilience, protect our stakeholders and contribute to a sustainable future.
The focus of ESG risk on climate and environmental risks will be developed further by the CRR3/CRD6 and EBA Directives for the social and governance components.
Reputation risk
Reputation risk is the risk that BNG's market position could deteriorate due to a negative reputation among stakeholders:
Internally caused reputational risk: the risk that BNG's reputation could be negatively affected by the impact of other (poorly managed) risks.
Externally caused reputational risk: the risk that BNG's reputation could be negatively affected by altered external expectations that are not well managed in the strategic process (strategic positioning risk).
Organisational structure
As part of the risk management cycle, reputational risk is periodically analysed and reported in the integrated risk report and discussed with the Executive Committee and the Supervisory Board.
Credit risk
Credit risk is the risk that a borrower or a financial counterparty will fail to meet its contractual obligations or will not do so on time. This risk is divided into three subcategories:
Counterparty risk: The risk that a borrower or counterparty fails to meet payment obligations arising from a financial transaction at the time they are due.
Concentration risk: The risk of credit losses from exposure to a group of borrowers or counterparties with comparable characteristics.
Settlement risk: The risk of loss if a party to the settlement of a contract (or group of contracts) does not meet the agreed conditions.
ESG risks as a part of credit risk
ESG risks are an integral part of credit risk. The way in which a counterparty deals with environmental, social and governance aspects within its business operations has a direct influence on its creditworthiness. A higher ESG risk score may result in a lower credit rating, as these factors materially affect a company’s financial stability and future prospects. ESG criteria are, therefore, an essential part of the credit analyses and rating methodologies. When managing ESG risks as part of credit risk, the focus is on transition and physical risks. The material ESG credit factors are determined per sector in the Risk ESG Identification and Materiality Assessment (ESG RIMA).
Creation and mitigation of credit risk
Credit risk arises from a range of activities, including lending to the public sector, hedging currency and interest rate risks through derivative transactions with financial counterparties, money market liquidity management operations and investments in interest-bearing securities of issuers.
The credit risks arising from lending are usually mitigated by government guarantees via the WSW (Social Housing) and Wfz (Care) guarantee funds, which are guaranteed by the Dutch State via backstop arrangements. Focusing our lending on the Dutch public sector, which is inherent in the business model, entails concentration risk.
Settlement risk arises in the settlement of foreign currency issue transactions with financial counterparties. Due to the size of these transactions, the settlement risk may potentially be high. To mitigate these risks, arrangements are made with counterparties on the maximum size of individual settlements, in accordance with the applicable internal limits. Large settlements are processed in sub-steps, with the next part being provided only after the previous part has been settled. Settlement dates for new transactions with counterparties are also spread over time to avoid unnecessary concentrations in one day.
Monitoring and assessment
The credit risk of a borrower or counterparty is determined periodically based on a credit assessment. Internal credit assessments are carried out annually for all borrowers to evaluate their creditworthiness and take appropriate measures where necessary. In addition to the periodic credit assessment process, ongoing monitoring of the financial performance of borrowers takes place, including by monitoring early warning indicators and unlikeliness to pay indicators.
For financial counterparties and investments, external credit assessments and investor report data are also included in the assessment. Four external rating credit rating agencies approved within the Eurosystem are used for this purpose.
Developments in 2025
Our loan portfolio remained stable in 2025, partly thanks to a tightened customer strategy and a further decline in the “Financial Restructuring and Recovery portfolio”. We have continued to focus on integrating climate and ESG risks into our credit assessments and reports, in line with increasing social and regulatory requirements.
Market risk
Market risk is the risk of loss of profit and capital as a result of fluctuations in market prices. There are various forms of market risk: interest rate risk, currency risk, fluctuations in credit and liquidity spreads and volatility risk.
Interest rate risk: the risk of loss of profit or capital due to unfavourable movements in interest rates.
Currency risk: the risk of loss of profit or capital due to unfavourable fluctuations in exchange rates.
Credit and liquidity spreads risk: the risk of loss of profit and capital due unfavourable spread fluctuations.
Volatility risk: the risk of loss of profit or capital due to unfavourable movements in the implied volatility of market interest rates or exchange rates. This risk applies only to interest rate instruments that operate under a principle similar to that of options (for example, caps and floors).
The most recent Risk Identification & Materiality Assessment concluded that there are no material ESG factors relating to market risk and its sub-risks. For credit and liquidity spread risk, we nevertheless capitalise on ESG factors, because capital is based on historical movements of these spreads, where ESG factors are included.
Risk appetite
We are applying a prudent approach to managing market risks:
The bank hedges interest rate risk positions in the banking book with interest rate swaps. The bank models the equity in such a way that the required return of the shareholders is achieved1[1], which is an ongoing investment in 10-year paper of the Dutch State;
We fully hedge against risks arising from value adjustments of financial instruments that may result from the change in an index, such as inflation, with index-related derivatives.
The bank hedges currency risk with cross-currency swaps and foreign exchange swaps.
Developments 2025
During the reporting year, the bank's market risk profile was characterised by increased volatility in credit and liquidity spreads. This led to manageable, unrealised losses in the capital position and the associated risk measurements.
Interest rate risk remained within the established limits, with the short-term interest rate position (0–1 year) being actively managed. In combination with further improvements in governance and model development, market risk remained controlled and within the established risk appetite.
Liquidity risk
Liquidity risk is he risk of loss of profit or capital due to the possibility that the bank is at any time unable meet its payment obligations without incurring unacceptable costs or losses. Liquidity risk can be broken down further into various subcategories (short and long term):
Short-term risk: the risk that the bank will not be able to raise sufficient funds to meet its payment obligations.
Funding capacity risk: the risk that, as a consequence of its funding capacity, the bank will not be able to raise sufficient funds to meet its funding requirement over the long term, which would jeopardise the continuity of its business operations.
Refinancing risk: The risk that, as a consequence of our own creditworthiness or changing market conditions, the bank will have to raise financing or refinancing on the basis of unfavourable financing spreads that will jeopardise future profits.
Within the liquidity risk, the bank focuses on the transition and physical risks within the sub-risks of liquidity risk as far as ESG factors are concerned. The bank has established that the ESG risk is not material for the short-term liquidity risk.
Risk appetite
In order to meet our payment obligations at all times, including in stressful situations, we pursue a prudent liquidity policy and the bank accepts liquidity risks at short notice only if there are sufficient liquidity buffers in return. The bank has a substantial liquidity buffer for this purpose.
The public sector largely consists substantially of institutions with a long investment horizon. This means that loans often have very long maturities. up to several decades in some cases. As there are no acceptable funding rates available for these long maturities, the bank attracts funding for somewhat shorter maturities and we accept a funding mismatch. This mismatch is monitored daily and is subject to strict liquidity and capital limits.
Limits or warnings apply for a range of liquidity risk measures, such as the liquidity gap analysis, liquidity stress scenarios, the Liquidity Coverage Ratio (LCR), the NSFR (Net Stable Funding Ratio) and Contingency Funding Plan (CFP) triggers.
Liquidity risk instruments
As a bank, we want to maintain continuous access to money and capital markets, together with the continuous maintenance of attractive, varied and sufficiently large issuance programmes for investors, because we want to meet the credit demand of our clients – even in difficult times.
In addition, liquidity buffers are required, so that we have access to liquidity in stressful times. The liquidity buffer is mainly formed from a cash position at the ECB, level 1 high-quality liquid interest-bearing securities (which are explicitly held for liquidity purposes and known as the liquidity portfolio) and the ECB eligible interest-bearing securities and loans deposit with the ECB . The management of the size and composition of the liquidity portfolio is one of the liquidity measures taken to meet the external requirement for anLCR of at least 100%. The bank also holds a large amount of collateral in the ECB deposit, allowing it to obtain short-term financing immediately. Since we, as a bank, can deposit ECB eligible interest-bearing securities and loans as collateral with the ECB, this collateral can be extended further in cases of prolonged stress. The size of the buffers is tested in the liquidity stress tests, which are monitored monthly. Furthermore, the financing plan and the related planned liquidity gap are tested in unfavourable normative stress scenarios for the LCR and NSFR ratios.
Most of the funding is obtained from international capital markets. We distinguish between short-term and long-term financing. We maintain a number of issuance programmes that allow access to funding at competitive levels at any time. We are committed to proactive relationship management with investors who support these efforts. The main currencies for the bank are the euro and the US dollar.
We are aware of a number of funding sources. We use the following resources for short-term financing (money markets):
Commercial paper: The bank has a European commercial paper programme (ECP) of EUR 20 billion and a US commercial paper programme (USCP) of USD 20 billion. Under normal market conditions, a significant margin is maintained between the maximum size allowed by the programme and the actual use by the bank.
Unsettled repo transactions with interbank parties under a Global Master Repurchase Agreement (GMRA), where the bank's liquidity portfolio is used as collateral.
Deposits from institutional money market parties.
We have the following programmes available for long-term financing (capital markets):
a debt issuance programme (DIP) of EUR 110 billion. This is our most important source of funding. ESG bonds are also issued under this programme.
AUD 15 billion Kangroo-Kauri programme specifically for the Australian and New Zealand markets. ESG bonds are also issued under this programme.
Namen-Schuld-Verschreibungen (registered debt securities, NSV), bond issues under German law.
private loan agreements under various legislations.
We may also use the following alternative sources of funding:
European Central Bank financial instruments.
‘Global’ loans from the European Investment Bank and the Council of the European Development Bank.
guaranteed investment contracts (GICs).
We do not enter into transactions with private individuals.
We have a funding plan, in which the desired funding mix is described in detail. Part of the funding plan is the annual issue in benchmark size to maintain a“BNG curve” in the market. These large-scale issues by an issuer with a creditworthiness linked to the Dutch State ensure that we have a secure profile among investors, allowing us to maintain access to investors, even in times of market stress. The actual realisation of this desired funding mix or the reason for deviating from this is monitored and evaluated by the ALCO, by means of a funding plan drawn up by Treasury and reviewed on a quarterly basis.
Developments 2025
During the reporting year, the bank's liquidity risk remained under control, with good access to money and capital markets throughout the year. Although there was volatility in the financial markets and geopolitical uncertainties, no limits or targets were exceeded and there were no structural tensions in the liquidity position. The development of the liquidity gap remained within the established framework, partly due to active management of the maturities of new turnover and the timely attraction of long-term funding. The refinancing risk also remained within the established risk appetite. Through continuous monitoring, robust stress tests and the use of contingency indicators, the liquidity risk remained within the established risk appetite.
Operational risk
Operational risk is defined as the risk of loss of income or capital resulting from deficiencies of internal processes, people and systems, or from external events. Operational risk includes various level 2 risks, including risks relating to processes, technology, information security, data management, third parties, legal affairs and business continuity. Within operational risk, we focus on transition and physical risks in terms of ESG factors.
Risk appetite
Operational risks are inherently linked to the business operations of BNG. Although BNG is committed to a high standard of quality and reliability in its business operations, measures to mitigate operational risks are taken based on a balance between costs and economic income. In view of the great importance of BNG’s reputation, the bank applies and monitors qualitative limits to strengthen its risk management framework.
Given its role as a system bank, BNG is not prepared to accept high or critical operational and security risks, nor medium-sized operational and security risks that are expected to materialise once every three years or even more frequently.
With regard to ESG‑risk, BNG takes into account increased process risks, data management risks, model risks and legal risks that may arise from non-timely compliance with internal and external requirements (e.g. as a result of missing ESG‑data). The risk of external ESG‑related events that may have an impact on BNG is also estimated.
Non-Financial Risk Management instruments
We use a range of tools to manage operational risks, including:
Key Risk Indicators: The bank’s risk appetite for operational risk results in a risk tolerance that is primarily focused on reputation and internal business operations. The bank’s exposure to operational risk is measured using Key Risk Indicators (KRIs) with set limits. The KRIs relate to all categories of operational risk. The measured KRIs are compared with the risk appetite and reported to the NFRC on a quarterly basis in the operational risk report.
Risk Control Self-Assessments (RCSAs): The RCSAs are performed on the business processes, with the second line playing a facilitating, but also challenging, role. The inherent and residual risks identified and the corresponding management measures are assessed at least annually, based on probability and impact scales. The RCSA results provide the input for our monitoring programmes, including the periodic testing of the effectiveness of the most important control measures.
Incident management: We record all operational incidents that occur and investigate the root causes of incidents with a medium or high or critical impact. The process owners must carry out this investigation and initiate remedial actions. In order to prevent similar incidents in the event of future incidents, the process owner examines together with the 2nd line whether adjustments are necessary in the process, the systems and/or the working method. Incidents are reported to the NFRC, the Executive Committee and the Supervisory Board’s Risk Committee.
Scenario analysis: A scenario analysis of operational risks is performed annually. These scenarios also provide input to substantiate the economic capital allocation for operational risk.
Developments in 2025
In 2025, it was established that three focus areas have not yet reached the desired level of maturity. In order to achieve this, improvement programmes have been launched with intensive management focus and periodic reporting. These focus areas are as follows:
ICT risk2: A secure and stable IT landscape is essential for the continuity of our services and the trust of our clients. BNG applies an integrated approach to managing ICT risks that is aimed at ensuring the confidentiality, integrity and availability of information. This approach includes clear responsibilities within the organisation and guidelines for suppliers and other parties with whom data is exchanged. In 2025, further steps were taken to modernise our IT environment and the IT risk framework, taking into account the requirements of the DORA Regulation and other relevant regulations. BNG continues to invest in secure and future-proof digital infrastructure. New technological developments, including artificial intelligence, are monitored carefully and, where appropriate, integrated to enhance the robustness of the IT landscape.
Process risk: Efficient and effective business operations are necessary to achieve the objectives of BNG. Continuous improvement and optimisation of internal work processes is a top priority. BNG launched several initiatives in 2025 that make a concrete contribution to this and, at the same time, aim to reduce operational costs. Through a chain-wide approach, processes are simplified, more robust and, where possible, automated. The quarterly management review based on measurable results gives focus to this and thus facilitates effective cooperation throughout the entire organisation.
Data management risk: Effective data management is an essential part of BNG’s strategic objectives. It forms the basis for innovation, further digitisation and compliance with laws and regulations. In addition, good data management supports timely and reliable reporting on both existing and emerging risks, including on ESG aspects. BNG is working continuously on strengthening its data management capabilities, so that BNG demonstrably meets the requirements of RDARR and BCBS 239. The focus is on the accuracy and completeness of data, a broader application of data-driven work within the organisation and a further improvement of the availability and management of data by means of appropriate systems and processes.
- The component of the required return that is related to the Euribor.
- ICT Risk has an impact on the following BNG risk taxonomies: 1) Technology Risk, 2) Information Security Risk (incl. Cyber Risk), 3) Third Party Risk, 4) Business Continuity Risk.
5.4 Digitalisation, IT and cybersecurity
BNG is fully committed to modernising its IT infrastructure and increasing digital resilience. Through smart cloud migration, tighter security against increasingly complex cyber threats and strengthening cooperation in the chain, we are building a flexible and robust IT organisation. At the same time, innovative applications, such as targeted AI solutions, must ensure that we can work more quickly and cleverly. This means that we will remain agile, safe and ready for the challenges of tomorrow.
Cloud migration and infrastructure modernisation
This year, we were able to take advantage of the digital workplace and the integration platform that were implemented successfully, with which we can link applications flexibly. In addition, we have brought payment transactions back to our own organisation and started renewing the payment transaction system. Steps have also been taken towards further cloud adoption, in which we have prepared components from our IT landscape for migration or have already successfully transferred them. This modernisation ensures greater scalability, better performance and a future-proof infrastructure in line with our strategic ambitions.
Resilience to complex threats
The cyber threat landscape is becoming increasingly complex. Technological developments, such as the malicious use of AI, and geopolitical tensions, are increasing the threat. This requires a coherent approach to prevention, monitoring and response.
Within BNG, the Security department is working on strengthening digital resilience, both within its own organisation and across the entire chain. The focus is on testing measures, crisis and communication management and practising a number of scenarios together with IT partners.
In the event of an increased threat or special circumstances, cooperation with external parties will be intensified further. An example of this is the coordination in the run-up to the NATO summit in 2025, in which, among other things, we worked together with the municipality of The Hague.
In addition to technical improvements, such as the faster identification of deviant behaviour, investments have also been made in organisation-wide awareness. Through joint exercises and a clear division of roles, the bank can respond quickly and effectively to cyber incidents.
Compliance and cooperation in the chain
In order to comply with increasingly stringent regulations, such as the Digital Operational Resilience Act (DORA) and the NIS2 Directive, we have tightened our processes further and made them more professional. In July 2025, we launched the Fortica transformation programme, a bank-wide initiative aimed at strengthening our IT risk management sustainably and making our (chain) organisation future-proof.
With project Fortica, we are working on a distinctly higher level of operational resilience. We are improving governance, streamline processes and modernise our technological infrastructure. Thanks to this integrated approach, we will meet the highest internal and external standards, while at the same time aligning well with the needs of our public customers who rely on our continuity and reliability.
Innovation and AI
We are focussing on small, concrete AI applications that can be deployed quickly within the organisation and offer immediate value, such as automatic analysis or support for daily tasks. A working group is investigating the AI initiatives which have the most potential and are both easy and secure to apply. This allows us to innovate step by step without risks to privacy or intellectual property. Collaboration and knowledge sharing are important, such as during the Servicenow Agentic AI Hackathon Event, where we are converting ideas into smart IT solutions with colleagues and partners.
Artificial intelligence offers great opportunities to make our processes more efficient, faster and more error-proof. Applications such as automated data processing, predictive models and smart employee support can lead to improved service and lower operational costs. As an organisation that values quality and reliability, we recognise the potential of AI to strengthen lending processes, risk assessments and customer contact.
At the same time, the use of AI brings new challenges and risks, especially for a bank operating under strict European supervision. Systemic banks are subject to high standards of reliability, transparency, explainability and operational risk management. This means that the introduction of AI must be carried out carefully, step by step and with robust controls. It requires a conservative approach, in which innovation is given room to flourish, but never at the expense of stability, compliance and the security of our services.
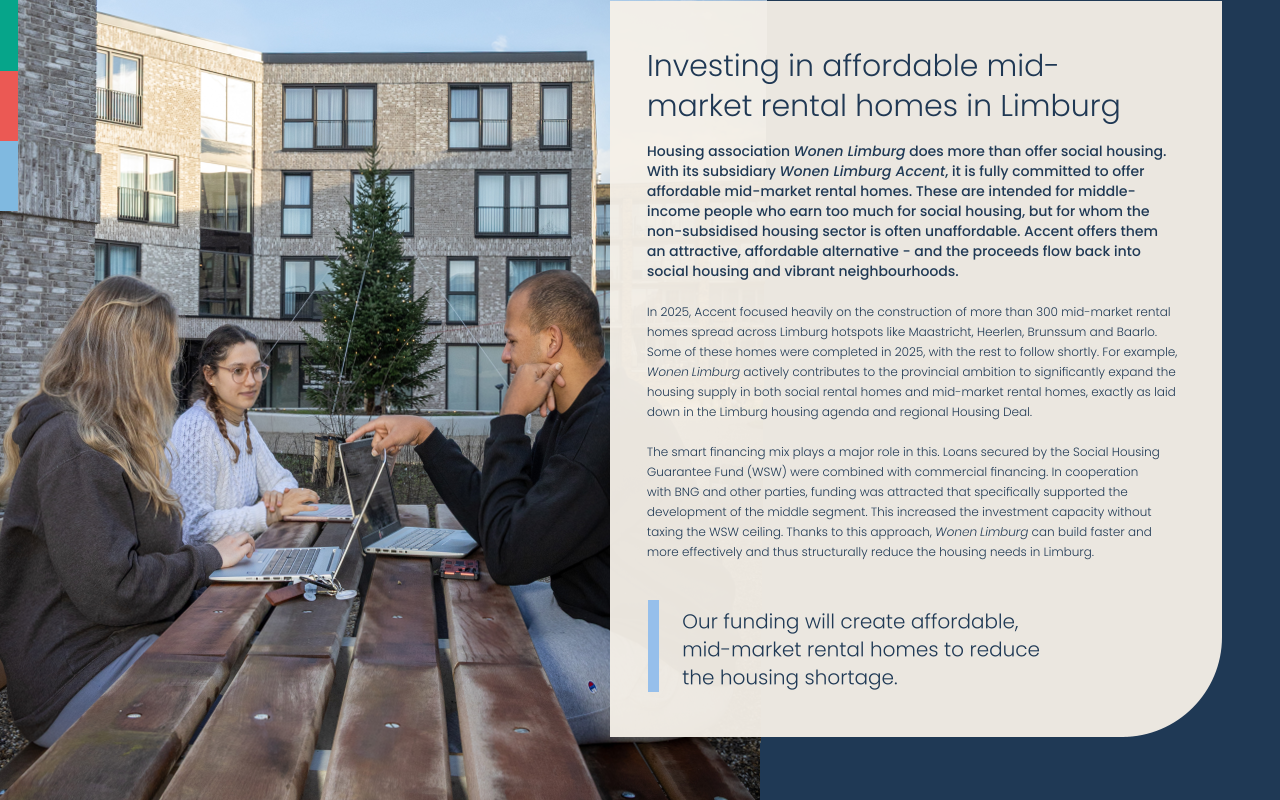


6.1 Corporate structure
We are a public statutory two-tier company under Dutch law and provide all our services under the name BNG Bank N.V. Our shareholders are exclusively governments. Half of the bank’s share capital is held by municipal authorities, provincial authorities and one water board. The other half is held by the Dutch government. We receive no financial assistance or other benefits from the government. As a systemically important bank at a national level, we are supervised directly by the European Central Bank (ECB). We are the fourth-largest bank in the Netherlands in terms of balance sheet total. We carry out our activities from our office in The Hague. Our size, structure, ownership and chain did not change significantly in 2025.
History
In 1914, the Association of Dutch Municipalities (VNG) established the Municipal Credietbank. This bank gave municipalities the financial clout they needed to tackle social problems at a time of high levels of poverty and pressing social-societal issues. The Municipal Credietbank grew into BNG. This original mission – contributing to societal solutions – is still at the heart of our activities.
We provide financing to the public sector on competitive terms and for all maturities. We are continuing to support our clients in difficult times, as well. Until now, we have always succeeded in doing so. More than 90 per cent of our loans go to or are guaranteed by government agencies. These loans, referred to as solvency loans, have a risk weighting of 0 per cent. We also take care of payment transactions for our clients. Thanks to the shareholding by Dutch governments and our focus on solvency loans, clients and partners see us as a safe bank. We have the highest external credit ratings (Moody's: Aaa; Fitch Ratings: AAA; S&P Global: AAA). This provides us with a strong funding position on international money and capital markets. This position allows us to attract short and long-term funding at low prices in different currencies. As a result, we offer our clients loans at low lending rates.
Business model
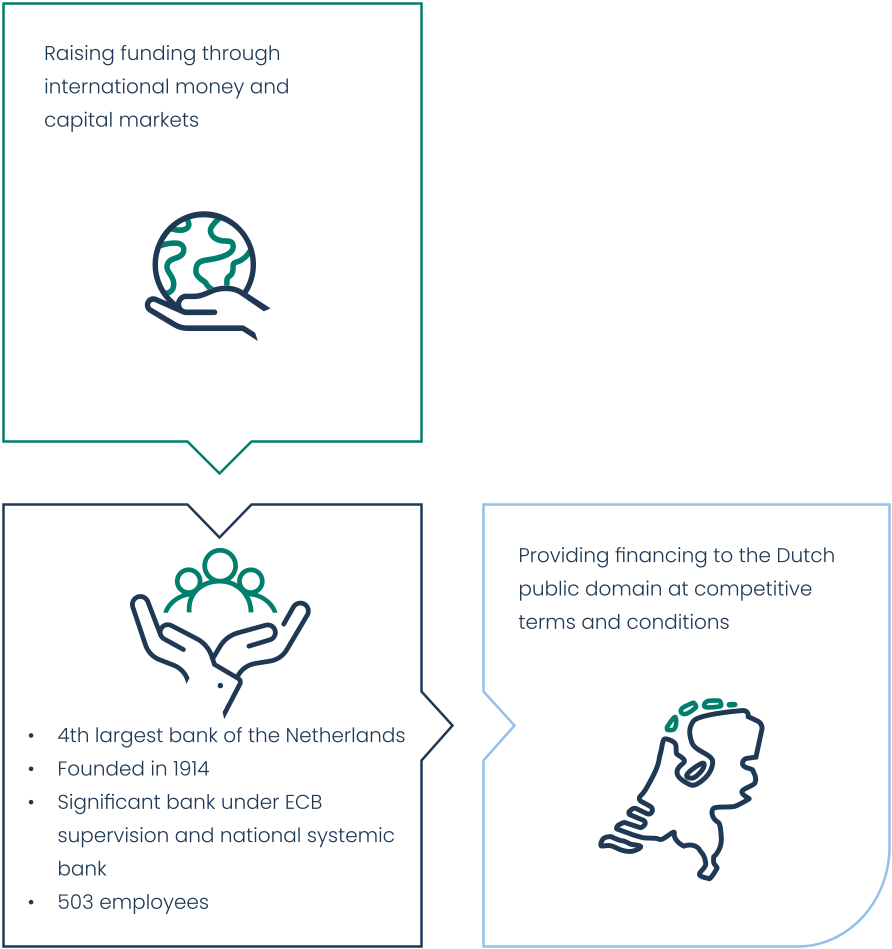
Governance structure
Our two-tier governance structure is comprised of a Supervisory Board (SB) and an Executive Committee (ExCo). The Executive Committee has, at the moment, five directors, three of whom form the statutory board. On 7 May 2026, the ExCo will be expanded to include a sixth director, namely a CIO. The Supervisory Board appoints and dismisses the members of the Management Board. The Executive Committee constitutes the management body with an executive function as defined in the Capital Requirements Directive (2013/36/EU). It is responsible for the day-to-day management, the general course of affairs and the continuity of BNG. The Executive Committee has set up committees to provide consultancy or carry out specific tasks.
These committees are:
Asset & Liability Committee
Credit Policy Committee
Credit Committee
Treasury Credit Committee
Non-Financial Risk Committee
Integral Portfolio Committee
Sustainable Banking Committee
Client Acceptance & Review Policy Committee (“Policy CARC”)
The regulations of the Management Board/Executive Committee and their committees can be found on our website.
The Supervisory Board is the supervisory body as indicated in the Capital Requirements Directive. The Supervisory Board supervises the policy of the Executive Committee and the general course of affairs within the organisation. The members of the Supervisory Board are appointed and dismissed by the General Meeting. The Supervisory Board has four committees that prepare the decision-making process:
Audit Committee
Risk Committee
HR Committee
Remuneration Committee
The regulations of the Supervisory Board and its committees have also been published on our website.
ESG policy governance
The CEO is accountable for the strategy, including the ESG strategy. Management takes care of the implementation of this. The Strategy & Sustainability department and the Executive Committee Sustainable Banking Committee (SBC) prepare proposals for changes in the purpose, strategy, ESG policy and ESG objectives. The Executive Committee decides on these proposals. The SBC ensures that BNG has, implements it and reports on an integrated sustainability policy. ESG factors with an impact on an existing risk are managed by the relevant ExCo committee. The Strategy & Sustainability department reports each quarter on the progress of the strategy, including the material topics. Measuring the impact that BNG has through its clients is part of the ESG policy. This task lies with the Strategy and Sustainability department. We report annually in our annual report on the impact on society through our clients. More information is provided in Chapter 4 of this report.
Stakeholders
Our principal stakeholders are clients, investors, shareholders and employees. We invest in long-term relationships by engaging with them regularly. We do this through consultations, regional meetings, sector meetings and investigations. These dialogues give us insight into their expectations and the value we can create for them. Stakeholders’ responses are used to improve our products, services and processes. For municipal clients, we organise annual meetings on current topics. We also make substantive contributions to meetings concerning real estate in the healthcare, education, municipal and housing association sectors. We are a member of the Dutch Banking Association (NVB), the European Association of Public Banks (EAPB), the European Banking Federation (EBF), the International Securities Dealer Association (ISDA) and the International Capital Market Association (ICMA).
Subsidiaries and associates
BNG Gebiedsontwikkeling B.V. is the only BNG subsidiary specialising in risk-based participation in land development, process design and process guidance for municipalities and other public or semi-public organisations. In March 2018, the SB of BNG Area Development and the then Executive Board of BNG decided no longer to engage in new activities and projects within BNG Area Development. The projects within the existing portfolio will, therefore, be completed in the coming years.
6.2 Composition of the management body and organisation
BNG is managed by an Executive Committee (ExCo) of five members and by six members as of 7 May 2026. The portfolios of the Executive Committee members have been allocated in such a way that the Three Lines of Responsibility policy can be fully implemented.
In 2025, there were two changes in the composition of the Executive Committee. At the beginning of 2025, Jaco van Goudswaard (COO) and Cindy van Atteveldt (CRO) announced that they would leave the bank. Irene van Oostwaard (former head of Internal Audit at BNG) was appointed CRO on 4 March 2025 and Amir Arooni was appointed acting COO on 1 April 2025 for a one-year period. Furthermore, Olivier Labe was reappointed for the third time to 1 May 2027.
In the context of the renewed BNG organisation, Norbert Siegers started as a quarter maker on 5 January 2026 and will take on the role of COO on 7 May 2026.
Name | Gender | Year of birth | Nationality | Date of first appointment | Date of reappointment |
|---|---|---|---|---|---|
Philippine Risch, CEO | F | 1972 | NL | 01-10-2024 | |
Olivier Labe, CFO | M | 1969 | Fr/NL | 01-05-2015 | 01-05-2019, 01-05-2023 and 01-05-2025 |
Irene van Oostwaard, CRO | F | 1974 | NL | 04-03-2025 | |
Amir Arooni, COO | M | 1963 | NL | 01-04-2025 | |
Peter Nijsse, CCO | M | 1969 | NL | 01-05-2024 |
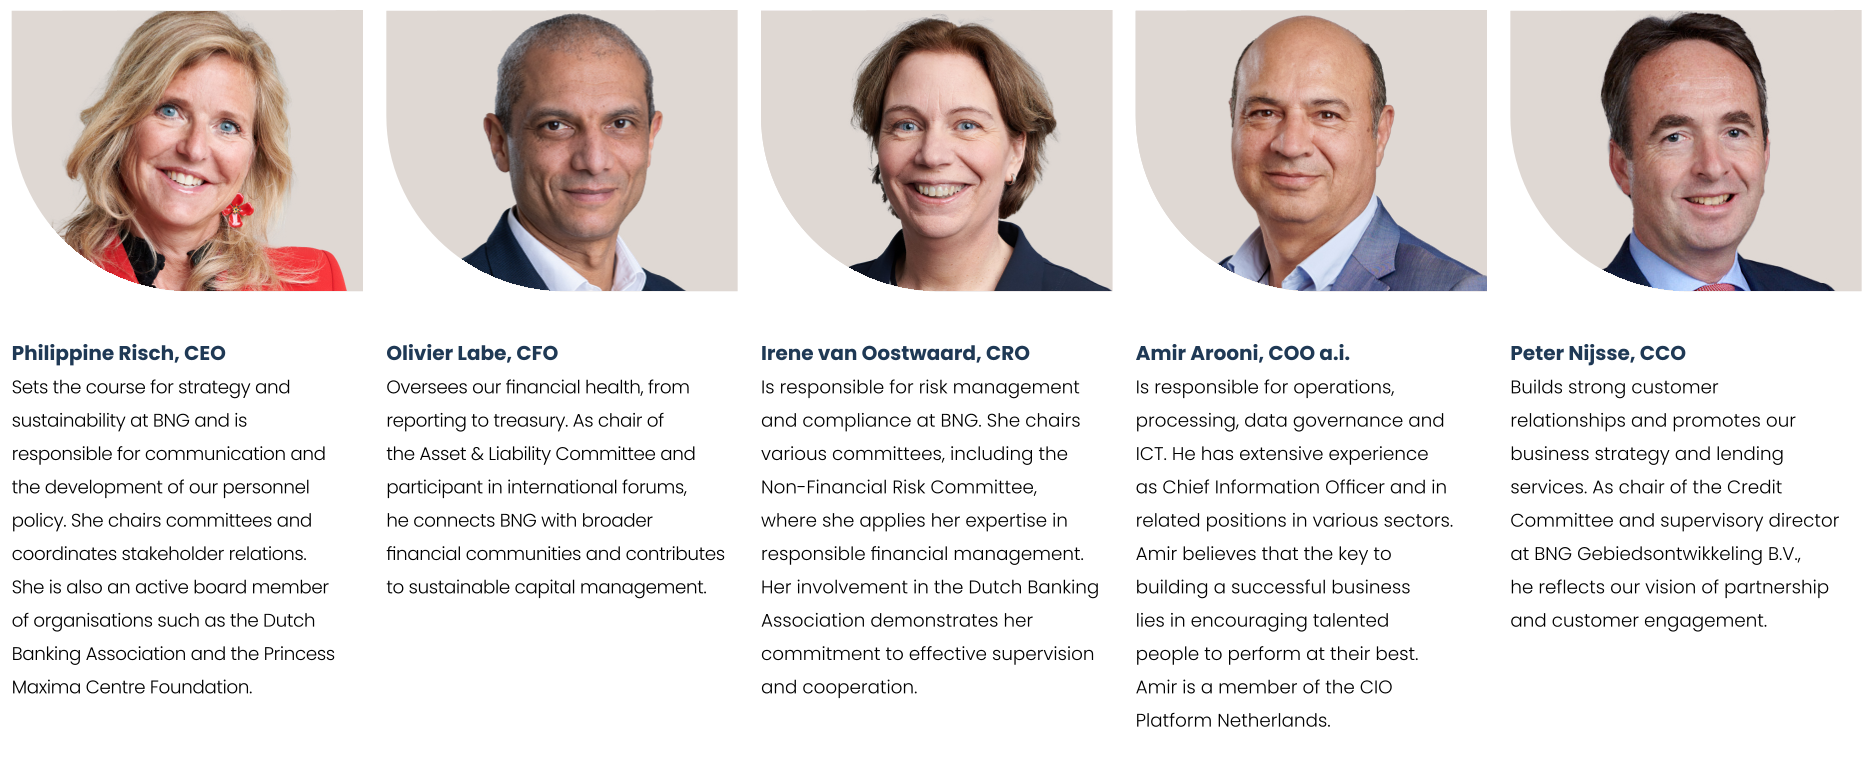
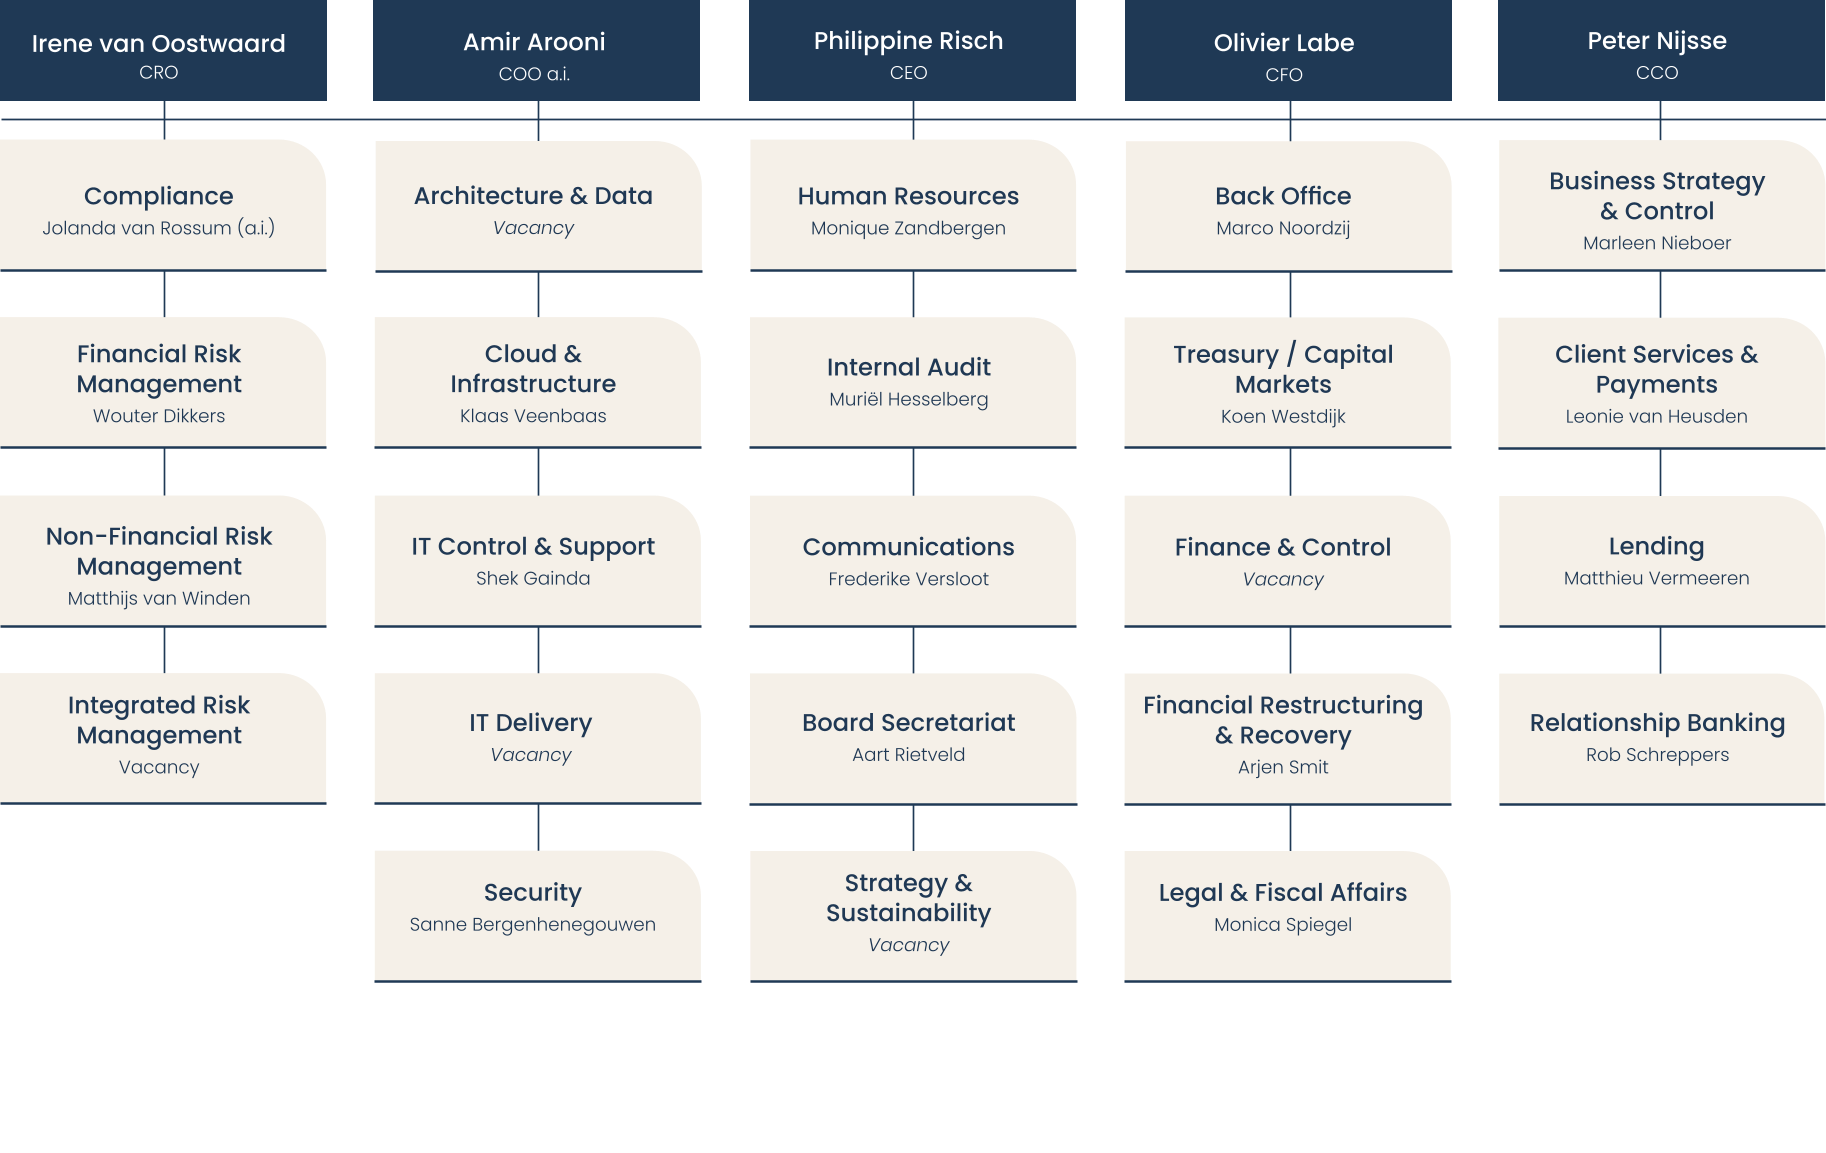


The internal risk management and control systems are an important point of attention within BNG. The Risk Governance Framework forms the basis for all risk management activities within our bank. It clarifies the principles behind the internal control and risk management system. The Risk Appetite Statement describes the risks we wish to accept in order to achieve our objectives. The various risks attendant on the bank’s activities are discussed each year in BNG’s Annual Report. The process owners or department heads responsible for the primary and key supporting processes annually issue an ‘In Control Statement’ to the Executive Committee, in which they highlight the risks in relation to the risk appetite, the management of risks and any deficiencies in this respect. All process owners or department heads provide ‘in control’ information in their quarterly reports. In the annual plans, they also explain how they aim to fulfil their responsibility of meeting the bank’s risk appetite. At various times during the year, the second line reports to the Executive Committee on compliance with the Risk Appetite. This overall framework is closely linked to the bank’s Capital Management Policy, which is periodically reviewed and discussed with the supervisory authority.
Audits by the Internal Audit Department (IAD) focus on independently determining the structure and function of the internal risk management and control systems. The external auditor audits the financial statements and evaluates internal control in respect of the financial reporting insofar as relevant to an efficient and effective audit of the financial statements. The findings of the IAD and the external auditor are reported to the Executive Committee and to the Supervisory Board. The head of the IAD and the external auditor attend the meetings of both the Audit Committee and the Supervisory Board where the financial statements are discussed.
The annual report provides sufficient insight into deficiencies in the operating effectiveness of BNG’s internal risk management and control systems. The aforementioned systems provide a reasonable degree of certainty that the financial reporting contains no inaccuracies of material importance. These systems alone are of course incapable of providing absolute assurance as to the achievement of the company’s objectives and the prevention of all misstatements, instances of fraud and non-compliance with laws and regulations. A detailed explanation is provided in the ‘Risk’ section of the notes to the financial statements. The consolidated financial statements have been prepared on the basis of the going-concern principle. No material risks or uncertainties were identified that could hinder continuity for a period of twelve months following the preparation of the report.
In the opinion of the Management Board under the Articles of Association, the financial statements provide a true and fair view of the assets, liabilities, financial position and profit or loss for the year of BNG and its consolidated subsidiaries. The annual report provides a true and fair view of the bank’s position, and the current balance sheet reflects performance during the reporting year and the expected developments of BNG and its consolidated subsidiaries. Figures belonging to these subsidiaries have been included in the consolidated financial statements. The Annual Report also describes the material risks facing BNG.
The Hague, 20 March 2026
Management Board under the Articles of Association
Philippine Risch (CEO)
Olivier Labe (CFO)
Irene van Oostwaard (CRO)

8.1 Foreword
Over the past year, the world changed rapidly due to the new leadership in the United States and geopolitical tensions. Fluctuations in the financial markets affected the playing field for international lending. However, this was not a major obstacle for BNG. Thanks to our strong position, we remained resilient and were able to fulfil our role very well in these challenging times. In doing so, we underlined our stability and reliability in a dynamic market.
Our loan portfolio has developed strongly over the past year. Despite the pressure on our net interest income and rising costs, which are partly due to investments in IT and organisation, we have managed to achieve our investment objectives. Thanks to our sound liquidity and a strong capital position, we were able to attract financing and make it available on favourable terms this year, as well.
Investing in social challenges
The Netherlands has many opportunities to invest in social areas, such as housing, energy, infrastructure, high-tech innovation and defence. The public domain works closely with public and private financiers to enable and accelerate these investments.
A clear investment structure is essential. The recent announcement of the merger of Invest NL and Invest International into a single national investment institution highlights the strong level of cooperation within the Dutch financing landscape. This new institution will focus on investments with higher risk, while BNG will continue to focus on low risk financing, preferably with a guarantee profile. In this context, we welcome the decision in Brussels to make it possible to secure the financing of medium-sized rental homes. This strengthens our position and actually helps us to advance the investment task for housing construction.
Future-proof organisation
With the arrival of CEO Philippine Risch, a restructuring of BNG was initiated in 2025. After a thorough introduction to the organisation, she presented a sharpened strategy in April. The central theme is the transition from a traditional, column structure to a chain-oriented form of cooperation. This new facility increases the effectiveness, efficiency and governability of BNG.
This trend is accompanied by necessary cost reductions and a gradual reduction in staff numbers until 2029. At the same time, there is still room for attracting new talent in line with the competencies required for the new way of work.
Changes have also taken place within the Executive Committee. During the year, Cindy van Atteveldt (Chief Risk Officer) and Jacco van Goudswaard (Chief Operating Officer) left the organisation to take on a new challenge elsewhere. The Supervisory Board is grateful for their commitment and contribution. Irene van Oostwaard will succeed Cindy van Atteveldt as Chief Risk Officer and Amir Arooni will provisionally take on the role of Chief Operating Officer. We are excited about the experience and energy that they bring.
Strengthening our IT
One of the priorities is to strengthen and restructure the IT organisation. IT was largely outsourced to one external party until the end of 2024. A strategic change has been chosen to reduce this dependence and spread IT services more and partly bring them back in house. With this approach, we also aim to improve the effectiveness and efficiency of our IT and optimise risk management.
An important milestone is the removal of the processing of payment traffic to our own organisation. At the same time, we have started to renew the outdated payment system. The transition to the new system, scheduled for 2026, is proceeding according to schedule.
Social and green added value
ESG is a central starting point in our organisation and our client relationships, in which environmental awareness and action are an essential theme. BNG is actively taking measures to reduce its own ecological footprint and that of its clients. A good example is our office building on the Koninginnegracht in The Hague, which is undergoing a large-scale and sustainable renovation. The work has been delayed due to market conditions, but we are looking forward to a modern and inspiring working environment with an A+++ energy label.
In discussions with the Executive Committee, the Supervisory Board has devoted considerable attention over the past year to stimulating clients on ESG themes. The aim is to create more social and green added value. Forms of financing, such as sustainability bonds and a pilot with green loans, emphasise this ambition. In 2025, we also entered into a dialogue with a housing association and the Social Housing Guarantee Fund to deepen cooperation.
Building success together
We express our great appreciation for the hard work, commitment and passion of the Executive Committee, all BNG employees, suppliers and partners. Their commitment makes the difference and forms the basis of our success. With confidence and a strong sense of connection, we look forward to the challenges and opportunities that the future brings.
On behalf of the Supervisory Board,
Huub Arendse, Chair
The Hague, 20 March 2026
8.2 Composition of the Supervisory Board and committees
The Supervisory Board is composed of seven members and has extensive knowledge and experience of the markets relevant to BNG. The following pages list the main position or most recent main position held by each member of the Supervisory Board. The relevant other positions of the supervisory directors are also included in this annual report. A register with all of the ancillary positions reported has been published on the website. All of the Supervisory Board members are independent within the meaning of the best-practice provisions of the Dutch Corporate Governance Code.
The Supervisory Board monitors the policy of the Executive Committee, the way in which the Executive Committee implements the strategy and oversees general affairs within the company. The Supervisory Board focuses on both long term sustainable value creation for BNG clients and for the society. The Supervisory Board also monitors the effectiveness of the internal risk management and control systems, as well as the integrity and quality of the financial and non-financial reporting. Depending on the situation, the Supervisory Board fulfils the role of supervisor, employer or adviser for the Executive Committee.
The Supervisory Board has four committees, namely the Audit Committee, the Risk Committee, the HR Committee and the Remuneration Committee. The committees prepare decisions for the Supervisory Board and report verbally and in writing to the Supervisory Board. In addition, the relevant committees advise the Supervisory Board whether approval of the Supervisory Board is required.
BNG has an onboarding programme for new members of the Supervisory Board. This programme will be made specific to each new member, as knowledge and experience will change. The purpose of the onboarding is to ensure that the new members have sufficient knowledge of BNG, its strategy and activities, so that the new members can fulfil their role.
In 2025, the attendance rate for the Supervisory Board meetings reached 86% (2024: 100%) and for committee meetings 96% (2024: 96%). The combined attendance rate for all meetings was 91% (2024: 98%).
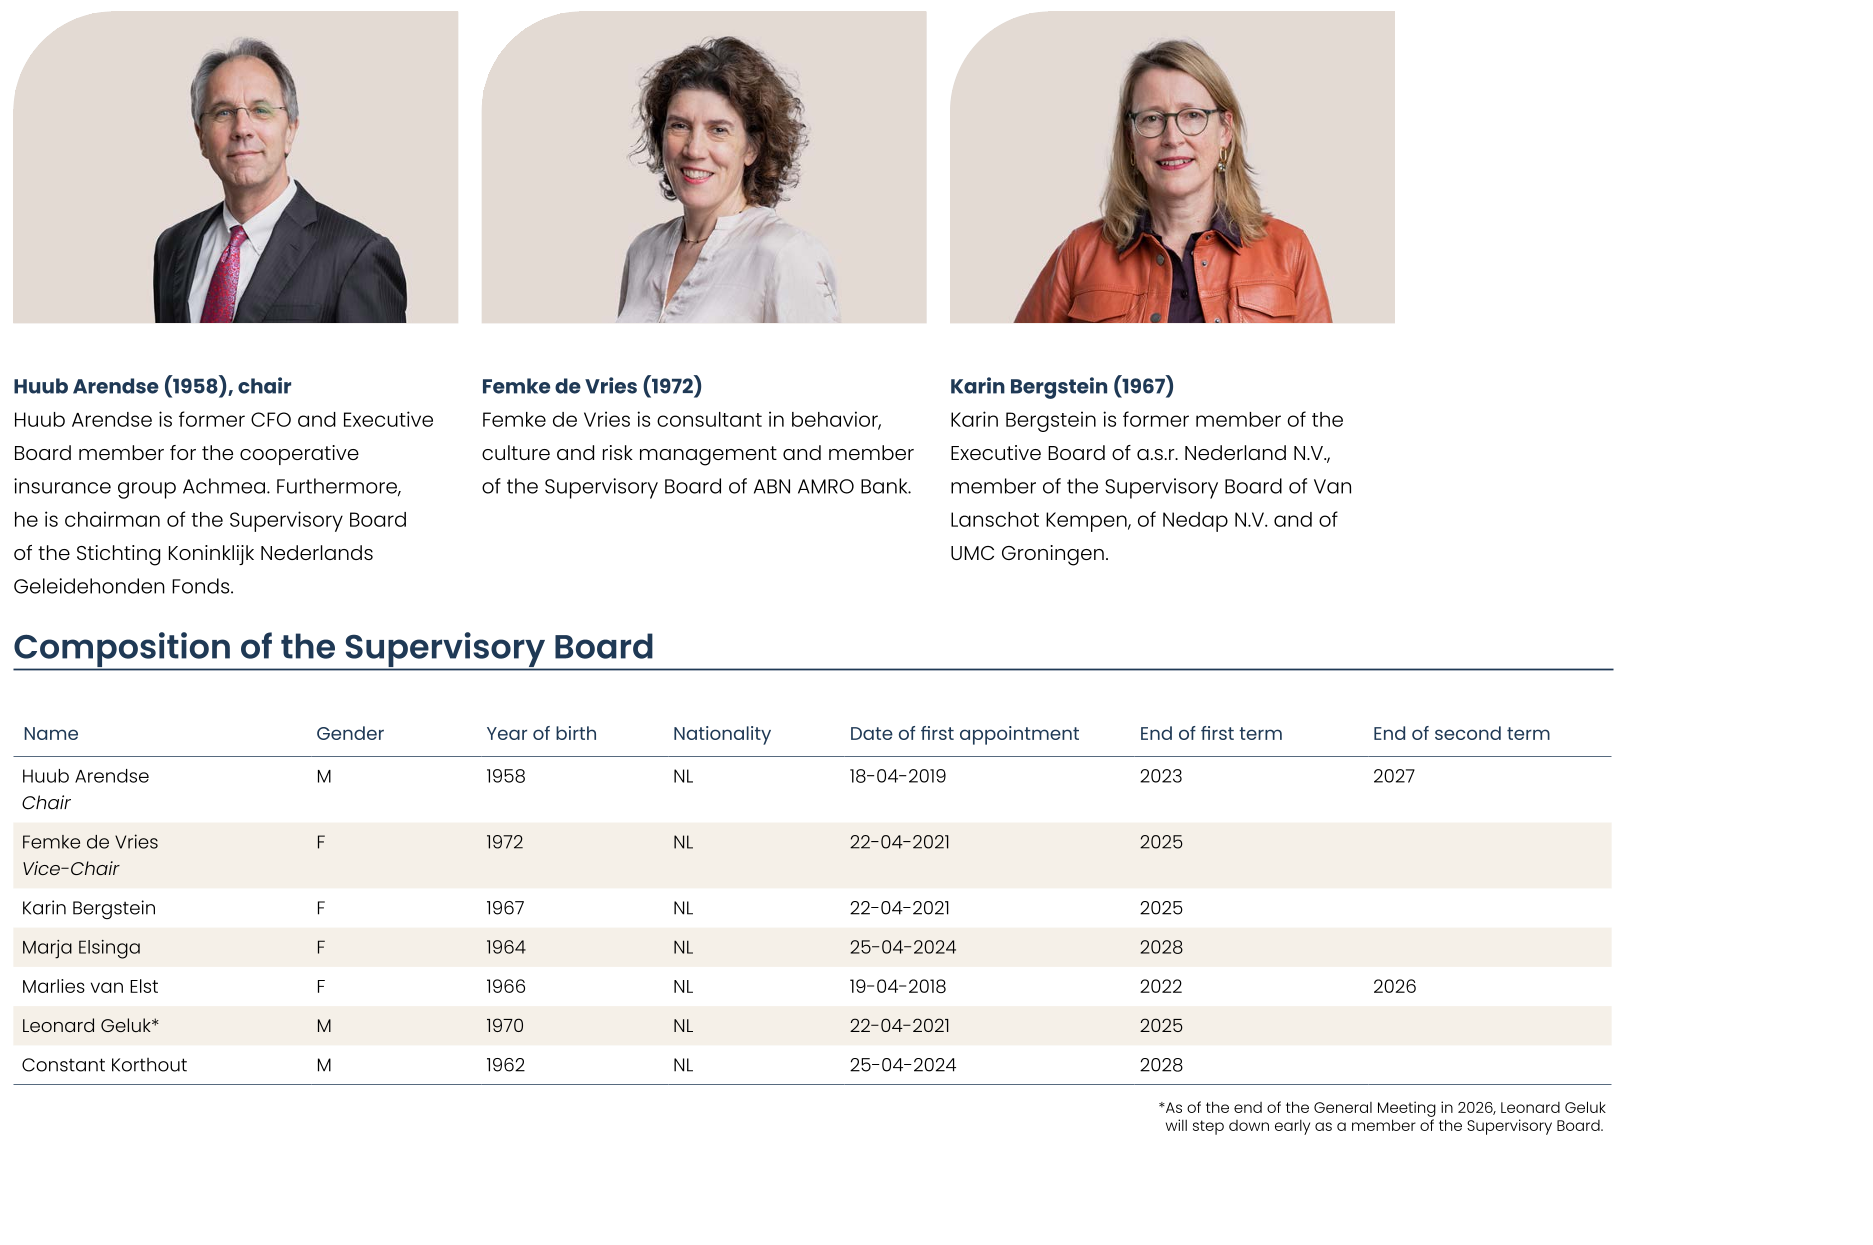
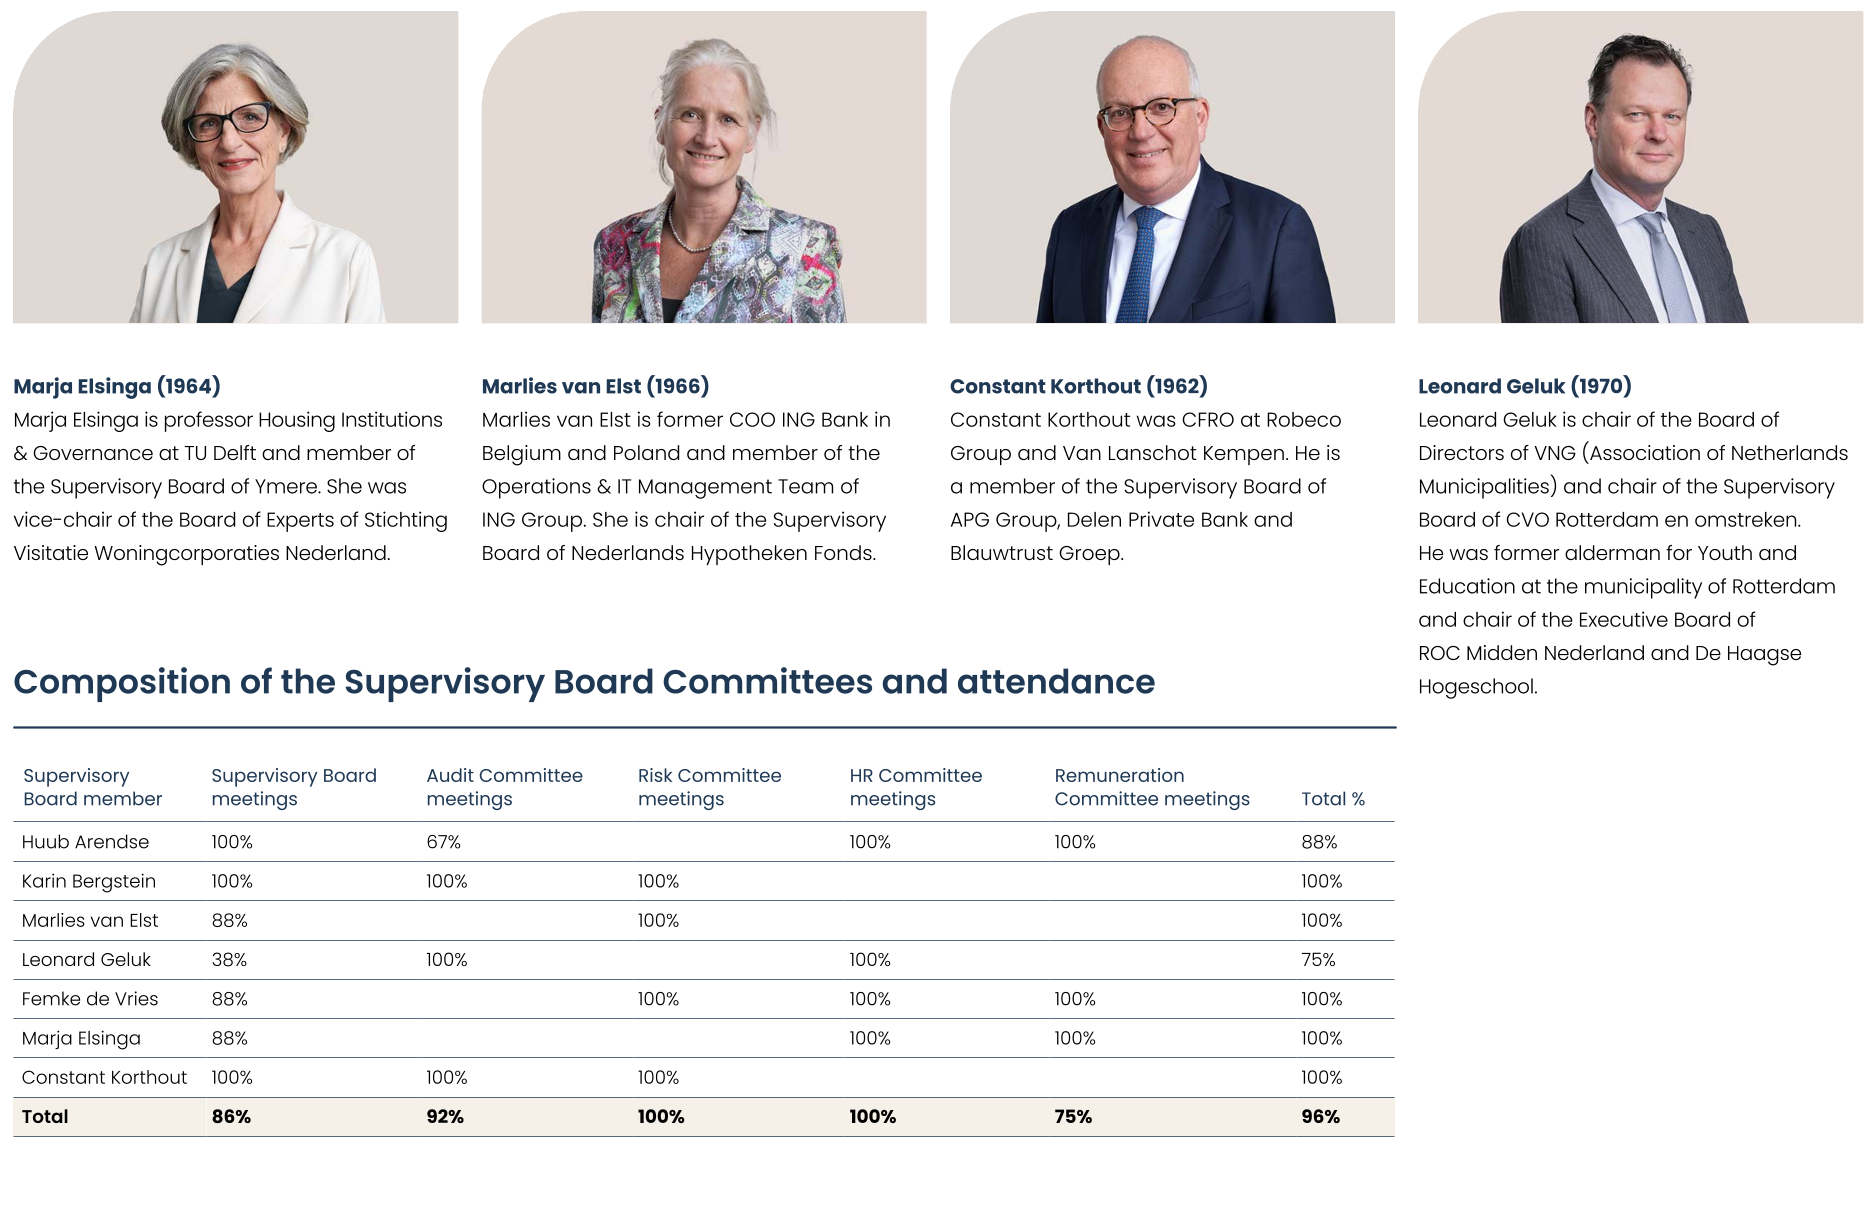
8.3 Activities of the Supervisory Board
The Supervisory Board met eight times in 2025. The ExCo is present at the meetings with the exception of the "private session" that precedes the meetings. The regular topics are financial information, (commercial) developments in the various client segments, IT, Risk, Compliance, operational progress, the budget, progress on implementation of the funding plan, corporate governance and HR-related topics. Finally, this year the renovation of the office at the Koninginnegracht and the reorganisation – including the expansion of the Executive Committee with a sixth director, the CIO, and the reclassification of several divisions within the bank – were a periodic item on the agenda of the Supervisory Board.
The Supervisory Board has reviewed and approved the Annual Report 2025 and the financial results for 2025. PwC audited the report and the financial statements. We convene the General Meeting (AGM) to approve the annual figures and to grant discharge to the Executive Committee and the Supervisory Board for execution and supervision respectively in 2025.
In addition, the following topics were discussed at the Supervisory Board meetings in 2025:
‘Route to More Added Value’ strategy
The Annual Report on the Climate Action Plan and the Sustainability Policy 2025.
Update on CSRD progress and update on the Double Materiality Analysis (DMA)
Progress on strategic projects, including DORA and IT Risk
Annual Report 2024, dividend proposal for 2024 and Pillar 3 report
The impact on BNG of the revision of the Dutch Corporate Governance Code in 2025, in particular the new Risk Management Statement.
Establishment of the 2025 half-year figures
Determination of the Risk Appetite Statement 2026 (RAS); the system of limits, targets and information figures. The risk definitions were also established.
The remuneration report 2024 and the risk analysis govern remuneration policies for BNG and BNG GO.
SIRA 2024
SREP letter 2025 from the ECB
The (re-calibration) of the 2025 Budget and the 2025 Funding Plan, as well as the multiannual commercial plan, including a competitive analysis. In addition, the Supervisory Board adopted the 2026 Funding Plan.
Fill the CIO vacancy and vacancy for the Head of IAS
Status of non-strategic exposures and the solar energy portfolio
Developments regarding a new payment system and the selection of a new supplier
Developments arising from ECB supervision and the On-site investigations of the supervisory authority
Update on the Debt Issuance Programme (DIP) 2025
Definition of the external KPIs for a period of three years (2026-2028)
The BNG Shareholder Contact Policy
Approval of the biennial update of the Rules of Procedure of the Supervisory Board as well as the Rules of Procedure of the Supervisory Board committees
The results of the periodic employee survey
The Supervisory Board received the information necessary to perform its duties. In addition, the Supervisory Board received information from the external auditor, with whom a confidential meeting also took place twice per year. Employees from the organisation regularly attend topic briefings, which also introduces the Supervisory Board to senior management. This is important for the purposes of internal succession planning. In addition, there is an annual topic lunch with the entire Works Council, during which we discuss a current subject.
This year, a visit was made to the Eigen Haard housing association during the annual ‘outside meeting’ – a meeting in which Supervisory Board and Executive Committee discuss the challenges they face with several customers in a segment. In addition to an explanation and dialogue about Eigen Haard’s strategy, a visit to one of its projects was planned. It is a great opportunity to see first-hand what activities are being made possible with the resources of BNG.
In addition, the Executive Committee and the Supervisory Board took part in three continuing education sessions. The regulatory landscape ECB and the WSW guarantee system were topic areas, as well as a DORA boardroom training. The Supervisory Board members also discussed the Standard Pricing model in an in-depth session.
Twice per year, two members of the Supervisory Board contact representatives of the Ministry of Finance as part of the government’s 50% interest in BNG. Regular discussions are also held with the supervisory authority about, among other things, the SREP (Supervisory Review and Evaluation Process) and ‘on site’ investigations.
The Supervisory Board values structural self-evaluation to learn from and become more effective. In addition to evaluation at the end of a meeting, one self-evaluation is carried out per year. This is carried out once every three years by an external party. This took place in 2025. The Supervisory Board discussed the outcome of this self-assessment in a private session in 2025, and a follow-up to the findings will be provided in 2026. The general picture that emerged from the self-evaluation is positive and an encouragement to continue on the path taken. The Supervisory Board intends to focus even more explicitly on putting the strategy into practice and to monitor the progress of projects more actively. In addition, the Supervisory Board will continue bilateral consultations with individual Executive Committee members. The Supervisory Board has asked the Executive Committee to give extra attention to succession planning and fleet planning in the HR Committee and to pay attention to cultural and behavioural elements.
The Supervisory Board is also responsible for the evaluation of the functioning of the ExCo and the assessment of the ExCo members. This is done using individual performance and development targets for each ExCo member. Discussions on the individual targets took place with all Executive Committee members in 2025.
There were no situations in which there was a conflict of interest. In order to maintain a focus on this, this is determined at the start of each meeting.
8.4 Audit Committee
Composition and engagement
The Audit Committee consists of Karin Bergstein (chair), Constant Korthout, Leonard Geluk (until 1 July 2025) and Huub Arendse as of 1 July 2025. The committee supports and advises the Supervisory Board on the design and operating effectiveness of the internal risk management and control systems, the internal and external audit process, material considerations regarding financial and sustainability reporting and material risks and uncertainties of the company and its affiliated company.
Working method
In addition to the members of the Audit Committee – including the chair of the Risk Committee – the CEO, CFO and the CRO, the head of IAS, the head of Finance & Control and the external auditor participate in the meetings of the Audit Committee. The chair of the Supervisory Board was present at the discussion of the annual report and half-yearly report and on 1 July 2025 – with the resignation of Leonard Geluk – he has temporarily taken over the vacant position in the committee. The Audit Committee holds a private session with the external auditor and the head of IAD prior to some of the meetings. Prior to the regular meetings, the chair shall speak separately with the head of IAS and with the external auditor. The Audit Committee met four times in 2025 and in two joint meetings with the Risk Committee.
The Audit Committee discussed the financial statements and the 2025 Annual Report and gave the Audit Committee positive advice on the approval of the financial statements and the management statement included in the Annual Report. The committee also provided a positive consultancy on the proposal to make a dividend of 50% of the net profit for 2025 available for distribution.
Recurring topics in 2025
In preparation for the discussion by the full Supervisory Board, the Committee dealt with the following recurring topics.
During the year under review, the committee was informed of key trends, developments and prospects in the areas of business, profitability, solvency, capital, liquidity and funding, as well as progress on non-financial KPIs (so-called DSs) through quarterly reports. In discussing the quarterly reports, the committee paid particular attention to competitiveness and standard pricing, the interest result, costs, financial transaction results and GRI reporting. With the transition to the Route to More Added Value, the committee also discussed the form and content of the accounting for each value chain.
Specifically, the Commercial Multi-Year Plan, Financial Multi-Year Plan and the budget were discussed in terms of content.
The mid-year report 2025, after discussing the findings of the external auditor, the committee issued a positive recommendation to the Supervisory Board.
The Pillar 3 Disclosure report for 2024 was discussed and submitted to Supervisory Board with positive consultancy. At the beginning of November, the Supervisory Board approved the publication on the BNG website of the interim report 2025 and its provision to the supervisory authority.
The Audit Committee follows the work of the IAD during each meeting. The most important findings of the IAD and their follow-up are also discussed.
The Committee frequently discussed the management of the IT General Controls (ITGCs).
The 2026 Funding Plan was submitted to the Supervisory Board with a positive recommendation.
Key points for attention
The Audit Committee has been informed to report on the basis of the GRI for the financial year 2025. In addition, the Committee has no objection to continuing this reporting standard for the financial year 2026 and, thus, to applying an unchanged reporting methodology for 2026. In addition, the committee discussed the report on progress on the impacts, risks and opportunities of the material themes (DMA) and the external KPIs that are directly linked to them. The Committee presented the external KPIs for the period 2026-2028 to the Supervisory Board with positive advice.
Prior to discussing the financial statements in the full Supervisory Board, the Audit Committee also discussed its board report on the financial statements with the external auditor. The audit scope, materiality and key audit issues were of interest: loan provisions, the value of financial instruments and the ITGCs.
The determination of the provisions for loans and debtors is a key audit matter, because BNG's loan portfolio contains not only guaranteed, but also unguaranteed loans. The calculation of the provisions is complex and also requires judgement. The Audit Committee was informed of the calculation methods used and the results and the manner in which the external auditor formed an opinion on them. Based on the discussion and taking into account an acceptable range in the uncertainties, the AC agreed with the Management Board that the provisions reported give a true and fair view of the credit risks in the loan portfolio.
The valuation of financial instruments is a key audit matter, because market information is not available on all instruments or because the models used are complex. Regarding the first category, the Audit Committee discussed with the external auditor how it challenged and assessed the assumptions and method used. Regarding the second category, the external auditor explained to the Audit Committee the independent valuation of a number of positions that it had performed. The AC has been informed that the system used has not changed and has been assessed as adequate. The AC discussed the adjustment of the presentation of the result in relation to derivatives, with the aim of providing a better insight.
The Committee was informed about the On Site Inspection on Market Risk and the application of the voluntary deduction in accordance with Article 3 of the CRR, in particular.
The IT general controls are also a key audit matter. With a view to auditing the financial statements, the Committee also directs its attention to the reliability and continuity of automated data processing. In the year under review, the Audit Committee paid specific attention to projects aimed at improving IT controls, data governance and data quality.
The Committee was informed about the On-site Inspection on Market Risk and, in particular, the application of the voluntary deduction under Article 3 of the CRR.
After discussion with the external auditor – the Committee took note with approval of the audit plan for 2025 and the audit engagement as laid down in the engagement letter for 2025.
The Audit Committee was periodically informed in detail about the content of the funding plan and the progress of the funding programme. The Committee also received a report on the course of the non-strategic exposures.
The Committee paid extensive attention to the progress of ongoing strategic projects relating to Identity & Access Management and RDARR. The Committee was also informed about the implementation of CRRIII and CRD6. Furthermore, the Audit Committee was informed about the follow-up of the findings of the IAS, the external account and the supervisory authority.
The ILAAP and ICAAP were discussed in a joint meeting with the Risk Committee, after which the Capital Adequacy Statement and the Liquidity Adequacy Statement were approved.
The Audit Committee was informed of the progress made in the transition of the audit activities from Pwc to EY.
The committee issued a positive opinion on the proposed appointment of the Head of IAS.
Finally, the Audit Committee gave positive advice on the biennial update of the Audit Committee Regulations.
8.5 Risk Committee
Composition and engagement
The Risk Committee is composed of Constant Korthout (chair), Marlies van Elst, Karin Bergstein and Femke de Vries. The Risk Committee prepares the decision-making process for the Supervisory Board on the way in which the company and its affiliated company have structured its risk management and the management of all of the different risks and risk areas in mutual connection. The Risk Committee periodically discusses, among other things, the functioning of the internal risk management and control systems, the internal risk governance framework and the risk management organisation.
Working method
In addition to the members of the Risk Committee, the CRO, CEO, the head of Financial Risk Management, the head of Non-Financial Risk Management, the head of Integrated Risk Management and the head of Compliance participate in the meetings of the Risk Committee. Depending on the subject, the chair of the Supervisory Board, the COO, the CCO and the head of IAD also participate in the meeting.
At least once per year, the chair of the Risk Committee speaks additionally and separately to the head of Risk Management (Financial and/or Non-Financial), or to the head of Compliance. In addition, meetings are held between the chair of the Risk Committee and the CRO and the head of Compliance, prior to the meetings of the Risk Committee. The Risk Committee met five times in the reporting year, and also twice in a joint meeting with the Audit Committee. Prior to each meeting, the RC holds a ‘private session’ with the committee members.
Recurring topics
In preparation for the discussion by the full Supervisory Board, the Committee dealt with the following recurring topics.
The Committee discussed the 2025 annual plans for Financial Risk Management, Integrated Risk Management and Non-Financial Risk Management. The 2025 charters for Risk Management and Compliance were also discussed.
Every quarter, the Risk Committee discussed the Integrated Risk Report, a report on Financial, Integrated and Operational Risk and Compliance, including the opinion and advice of the CRO column. The Integrated Risk Report reports on compliance with the Risk Appetite; it also reflects the bank's risk positions and reports on the most important events from a risk perspective. Further details are provided on the development of the credit, market and liquidity-based risks, as well as the bank’s operational and strategic risks. Climate & Environmental Risks is an increasingly important issue. Compliance reports on Financial Economic Crime, Conduct (Privacy risk), Fraud and on compliance with existing laws and regulations, as well as on the preparation and implementation of new laws and regulations.
The Committee is informed of the risks in the area of money laundering and the financing of terrorism, including the management of both types of risk.
The Risk Committee has been informed extensively about a new approach to the Risk Appetite Statement (RAS), the system of limits, targets and information figures that forms the basis for the Risk Report. In response to this, the Committee discussed Operational Risk, Strategic Risk and Sustainability Risk. On the basis of this new set-up, the Committee prepared the annual adoption of the RAS 2026 by the Executive Committee and recommended it positively.
The Compliance and Risk Section in the 2024 Annual Report were discussed by the Committee and submitted to the Supervisory Board for approval with positive consultancy.
The Risk Committee discussed the outcome of the Systematic Integrity Risk Analysis (SIRA) 2024 and found that the SIRA has become embedded in the organisation. It is important that all of the action points remain well in view and are carried out as planned. In addition, the Committee discussed the SIRA at Financial & Economic Crime (FEC) and the scenarios and business rules, in particular.
The Committee discusses developments with regard to the supervisory authority in its meetings every quarter. This concerns the annual Supervisory Review and Evaluation Process (SREP) 2025, but also the On Site Inspections and the broader dialogue with the supervisory authority. The outcomes and key points for attention and their possible follow-up will be discussed in more detail in the meetings of the Risk Committee.
Key points for attention
The Risk Committee was informed in a comprehensive manner of BNG's cyber security threat landscape. The various threats and the relationship between the threat analysis and the Risk Control Self-Assessment were discussed.
The committee discussed the state of play regarding privacy within BNG, including the most important gaps and the safeguarding of privacy within BNG (governance) on the basis of an action plan.
The Risk Committee also approved the proposal to transfer the role of the Wwft policymaker from the CEO to the CCO, including the associated tasks and responsibilities.
The committee paid extensive attention to the progress of ongoing strategic projects in relation to, among other things, payment transactions and IT Risk.
In general, the Risk Committee discussed the functioning and legal context of the WSW guarantee system. In particular, the committee discussed in-depth sessions on transaction monitoring, including business rules, the implementation of DORA and finally a deep dive on refinancing risk and excess returns.
Finally, the Risk Committee gave positive advice on the biennial update of the Risk Committee Regulations.
8.6 HR Committee
Composition and engagement
The HR Committee consists of Huub Arendse (chair), Marja Elsinga, Femke de Vries and Leonard Geluk (until 1 April 2025). The HR Committee's responsibilities include the recruitment and selection of members of the Supervisory Board and statutory members of the ExCo, the periodic evaluation of the performance of the Supervisory Board and the ExCo as a whole and the assessment of the performance of individual statutory members of the Supervisory Board and the ExCo. The HR Committee also supervises the broader HR policy of BNG and the Diversity & Inclusion policy for the Supervisory Board and the Executive Committee. The HR Committee prepares the Supervisory Board's decision-making and supports the Supervisory Board in its role as employer.
Working method
In addition to the members of the HR Committee, the CEO and the head of HR participate in the meetings of the HR Committee. The HR Committee met four times in 2025.
Recurring topics
A recurring topic in the meetings was the progress of the HR strategy, on which BNG reports quarterly in the HR Dashboard. As a result, the employee satisfaction survey (ENPS), the lead time for filling vacancies, Diversity & Inclusion KPIs and absenteeism due to illness were discussed. In the second half of the year, the committee discussed a new HR Dashboard to bring the report more into line with the tasks of the committee.
The HR Committee discussed the outcomes of the periodic employee satisfaction survey extensively, in particular the results on results on enthusiasm, social safety, diversity & inclusion and the eNPS.
The committee discussed the completion of the vacancies that will arise in 2026 as a result of the early retirement of Leonard Geluk and the retirement of Marlies van Elst and prepared the filling of both vacancies.
The Continuing Education Executive Committee and Supervisory Board programme was discussed and submitted to the Supervisory Board for approval with input from the committee. The annual self-assessment of the Supervisory Board was also prepared.
Finally, in the context of the new organisation of BNG, the committee dealt with the expansion of the ExCo with the CIO function and the related search as of Q2 2026. In line with this, we also discussed the term of office of Amir Arooni that applies to the acting COO role he holds.
Special topics
The committee discussed the (progress of) the reorganisation in the context of the Route to More Added Value and the reorganisation of a positive recommendation to the Supervisory Board. The HR Vision and Strategy BNG 2026-2028 was also discussed. In addition, the committee set up in-depth sessions for 2026 in order to be able to discuss a specific topic in greater depth. Finally, the HR Committee gave positive advice on the biennial update of the HRC and RemCie regulations.
8.7 Remuneration Committee
Composition and engagement
The Remuneration Committee is composed of Femke de Vries (Chair), Huub Arendse, Marja Elsinga and Leonard Geluk (until 1 April 2025). The Remuneration Committee is responsible for preparing the decision-making in the Supervisory Board concerning the remuneration of the Supervisory Board, the ExCo and identified staff, including decisions about remuneration that have consequences for risk management within the company. As is the case for the activities of the HR Committee, this primarily centres around the employer role of the Supervisory Board.
Working method
In addition to the members of the Remuneration Committee, the CEO and the head of HR participate in the meetings of the Remuneration Committee. The Remuneration Committee met once in 2025.
Recurring topics
The committee discussed the implementation of the remuneration policy for the ExCo and the employees for 2024 and advised the Supervisory Board positively on its approval.
The committee also took note of the outcome of the annual risk analysis of the controlled remuneration policy. This did not reveal any points for attention on which decision-making by Supervisory Board was necessary or desirable; the remuneration policy contributes to effective risk management and does not invite taking more risk than is acceptable.
The committee advised the Supervisory Board positively on the Remuneration Report (published on the website). In it, the SB reports on the remuneration policy of the ExCo and the employees and on the implementation of the remuneration scheme for the SB.
Special topics
The Remuneration Committee has been informed of the progress and status of the Future-oriented Job Centre process.


9.1 Reporting principles
In its 2025 annual report, BNG accounts for its activities during the 2025 financial year. The annual report represents a balanced and complete analysis of the situation on the balance sheet date and the development and the results during the financial year and it contains financial and non-financial performance indicators.
Guidelines and definition of the reporting used
Legislation and reporting guidelines
Legislation and reporting guidelines BNG prepares the annual report in accordance with Section 2:391 Dutch Civil Code and the EU directives “Annual financial statements, consolidated financial statements and related reports of certain types of companies” (2013/34/EU) and is in accordance with the GRI Standards (Sustainability Reporting Guidelines of the Global Reporting Initiative). The report provides an overview of the principal developments and the performance of BNG in 2025, and shows how the bank deals with opportunities, risks and uncertainties. The Annual Report is based on the topics designated as material by the ExCo and stakeholders.
Defining the scope of the Annual Report
Non-financial information for the 2025 calendar year is included in the 2025 annual report. This is done to inform stakeholders about the public role of BNG in relation to its mission, strategy and objectives. The information in this report relates to BNG Bank N.V., including its subsidiaries. There were no (potential) acquisitions in 2025. The performance of suppliers, sources of funding, clients and other parties in the chain is not included in the figures.
Codes and guidelines observed
BNG endorses a number of codes of conduct and international conventions and guidelines. BNG undertakes to comply with the Dutch Banking Sector Agreement on international responsible business conduct regarding human rights (2016). As of 2020, and pursuant to the latter agreement, BNG has applied the Equator Principles, a Risk Management Framework for determining, assessing and managing environmental and social risk in projects. Along with other financial institutions, BNG has committed to the Climate Agreement in 2019. BNG endorses the future-oriented banking package of the Dutch Banking Association (NVB), which brings together the Social Charter, the Dutch Banking Code and a set of rules of conduct associated with the banker’s oath. Through this, the banking sector explicitly states how strives for service-orientated and sustainable banking. BNG adheres to the recommendations under the UN Global Compact, the UN Guiding Principles on Business and Human Rights and the OECD Guidelines for Multinational Enterprises, and has implemented these recommendations in its relevant procedures. These codes and guidelines contribute to the successful conduct of due diligence investigations, in which the precautionary principle is also applied.
Under the law, BNG is not obliged to apply the Dutch Corporate Governance Code (the ‘Code’). With only public authorities as shareholders, BNG voluntarily applies the provisions of the Code as adopted in 2022 (the ‘2022 Code’), among other things by bringing its working methods into line with the Code as much as possible. This is in line with the Central Government Participation Policy Memorandum. BNG will use 2026 to assess the impact of the updated Code, as adopted in 2025 (the ‘2025 Code’) on BNG as an unlisted company in order to implement it in an appropriate manner, specifically with regard to the introduction of the amended statement on risk management as included in the 2025 Code. BNG reports on its compliance with the principles and best practices of the Code on its website.
Data collection
The quantitative and qualitative information in this annual report was collected on the basis of desk research and through interviews. Sources of data include staff records, financial reports, incident registration, and the registration of reports from internal confidential counsellors and the Compliance Officer. Information was provided by the Compliance, Finance & Control, HR, Risk Management, Security and Treasury & Capital Markets departments. In addition, interviews were conducted with employees of the departments of Business Strategy & Control, Relationship Banking and Lending. BNG follows the GRI Standards for the quality of the data included in this annual report. The non-financial data in this report relates to 2025. Where possible, data and results are also reported for previous years.
Management cycle
The ExCo is responsible for strategy, company objectives, content and implementation of policy. Senior management, which reports directly to the ExCo, is responsible for achieving the objectives in accordance with the policy frameworks and for measuring performance. The ExCo monitors policy implementation and the achievement of objectives on the basis of monthly or quarterly reports. This takes place on the basis of reports prepared by senior management, heads of department and control functions. Where necessary, adjustments are made on the basis of progress against the objectives. Performance against the objectives set is externally reported in the annual report. In turn, the ExCo and senior management evaluate policy as well as the designated objectives in preparation for the annual management cycle. The lessons drawn from the evaluation are incorporated into the subsequent management cycle and reported to the Supervisory Board. New policy and procedures are assessed in terms of coherence with existing policy and procedures, and implemented by means of work meetings and publication on the intranet. The policies, procedures and support systems of BNG and its subsidiaries are subject to internal audits.
Reporting on sustainability
An important objective of the European Commission resulting from the European Green Deal is to promote the financing of sustainable activities. To achieve this, legislation and regulations have been published, with which (financial) institutions are increasingly required to comply. The CSRD (Corporate Sustainability Reporting Directive) is European legislation that requires companies to report extensively on sustainability, including environmental, social and governance issues. In February 2025, the European Commission presented the so-called Omnibus I package. The package contains a directive that provides for substantive changes of, inter alia, the CSRD. The most important change for BNG is that the reporting obligation for 2025 and 2026 has been postponed by two years due to the stop-the-clock scheme. In addition, a political agreement was reached in the European Parliament on 16 December 2025 to limit the CSRD reporting obligation to companies with more than 1,000 employees and a net turnover of more than EUR 450 million. BNG does not meet these criteria and, therefore, falls outside the CSRD reporting obligation. A decision on whether to report voluntarily on sustainability based on the CSRD will only be made by the Executive Committee once the regulations have been finalised.
BNG, therefore, is continuing to apply the GRI (Global Reporting Initiative) standard as the basis for the sustainability reporting in the 2025 annual report. This standard provides a structured framework that allows us to report transparently on our impact on the environment, society and governance (ESG). In order to respond even more effectively to the specific information needs of our stakeholders, we are combining the GRI guidelines with elements that are important to our organisation.
The EU Taxonomy was drawn to define sustainable activities in a uniform manner. BNG endorses the objective of the EU Taxonomy. Because of the public nature of the bank, we are playing an important role in the transition to a more sustainable society. At the same time, the EU Taxonomy does not seem to be properly applicable to BNG’s business model as a public bank. BNG’s clients are mainly government institutions or institutions affiliated to the government (including housing associations), to which balance sheet financing is provided. The vast majority of these clients do not fall within the scope of the EU Taxonomy and, therefore, fall outside the scope of the activities that can be classified as green for the purposes of determining the Green Asset Ratio (GAR). The GAR for BNG for the 2025 financial year is, therefore, expected to be very low.
To be able to report on its implementation of the EU Taxonomy on a voluntary basis, BNG relies on the willingness and capacity of borrowers to provide information voluntarily. Many clients (sectors) were only be able to do so in 2025 to a very limited extent or not at all yet. BNG is discussing with the various sectors how and to what extent this can be implemented in the future.
Principles and methods used in determining the CO2e emissions of the loan portfolio
Methodology
The PCAF methodology was used to calculate the greenhouse gas emissions caused by our loan portfolio. This is what BNG has been doing since the annual report of 2019, in which calculations were made about the financed emissions from our lending in 2018. The methodology uses estimates and assumptions that are subject to uncertainties regarding external data.
Based on the general principles of the PCAF, BNG uses the following principles in its working method:
where possible, the seven greenhouse gases from the Kyoto Protocol have been included in the calculation and converted to their CO2 equivalents;
absolute emissions are expressed in metric tonnes of CO2 equivalents (tCO2e);
relative emissions are expressed in metric tonnes of CO2 equivalent per million euros (tCO2e/EUR million);
to calculate the greenhouse gas footprint of BNG's loan portfolio, emission factors were used to calculate the emissions per tonne of greenhouse gas emissions. The emission factors from CO2emissiefactoren.nl were used. This list of emission factors was developed by the Dutch government, SKAO, Stimular, Connekt and Milieu Centraal.
the attribution method is used. This means that we only report our share of the client’s emissions. This share is determined by comparing the financing provided by BNG with the balance sheet total of the client or project. This share is also called the attribution factor. The emissions of the client that are to be allocated to BNG are calculated by multiplying the attribution factor of that client (or the project) by the total emissions of that client. To calculate the attribution factor, all types of financing provided (both shares and loans) must be taken into account in the calculation. Any deviations from this must be explained;
in principle, the scope 1, scope 2 and relevant parts of scope 3 activities of the client are involved in the emission calculation. When this approach is deviated from, the reasons for this must be explained;
in order to monitor the development in the financed emissions, it is important that the annual emissions data reported is consistent and comparable. The methodology for the emissions calculation is still under development. Continuous improvement of data availability and/or methodological progress will allow more accurate calculations in the future. In the event of a change in the methodology whereby the emissions are no longer comparable between years, BNG will, if possible, recalculate the emissions for both the penultimate year and the basis year (2018) on the basis of the new methodology;
‘follow the money’ is the starting point in the CO2e emissions of financial assets. Funding should be monitored as far along the chain as possible to mitigate the impact of CO2e emissions on the economy. This means that BNG also tries to calculate scope 3 emissions for clients and other assets.
The methodology used in the current provision is based on a number of reporting standards: The Greenhouse Gas Protocol, A corporate accounting and reporting standard, revised edition, The harmonised approach for the financial sector in the Netherlands and The global GHG accounting & reporting standard. The general reporting requirements and recommendations are:
Principles: GHG calculations and reporting by financial institutions should be based on the following principles: relevance, completeness, consistency, transparency and accuracy.
Objective: The reporting by a financial institution should be aligned with its specific business objectives; for example, to identify and manage climate-related transition risks or to achieve a specific emission reduction target.
Frequency: Financial institutions shall disclose the report at least annually and at a fixed time in accordance with the financial accounting cycle. Financial institutions should ensure that the timing chosen gives a representative picture of the issues for that reporting year and should disclose transparently whether major changes close to (before or after) the reporting date have affected the results.
Recalculation and significance thresholds: Financial institutions should, in accordance with the requirements of the GHG Protocol Corporate Value Chain (Scope 3) Accounting and Reporting Standard, establish a basic recalculation policy to define the circumstances under which a recalculation of (reference year) financed emissions is necessary to ensure the consistency, comparability and relevance of reported greenhouse gas emissions data over time. As part of this recalculation policy for reference year emissions, financial institutions should identify and disclose the significance threshold that triggers reference year emission recalculations.
Reporting form: Financial institutions should include issue data in publicly available reports, such as annual and semi-annual reports, website articles or other publicly available sources that are considered appropriate by the financial institution.
Past performance: Where appropriate and relevant to their business objectives, financial institutions should disclose their financed emissions for several similar time periods, e.g. years.
As of reporting year 2024, we are reporting avoided emissions. Avoided emissions concern activities that reduce CO2e emissions without falling directly within BNG control. The net avoided emissions reported only cover sustainable solar and wind energy projects financed by BNG. The calculation of avoided emissions is based on the total energy production of these projects multiplied by the applicable grey electricity emission factor in 2024. This concerns the gross avoided emissions. Net avoided emissions are the gross avoided emissions minus the emissions generated during the production, installation, maintenance and disassembly of the solar panels and wind turbines.
Data used
Owing to the availability of data, reported financed CO2e emissions are based on data from the year prior to the bank's reporting year. The emission calculation for the reporting year 2025 is, therefore, based on the bank’s outstanding loans as at year-end 2024. Data for 2024 was used to calculate the emissions linked to these loans.
An emission calculation was made for 99.7 per cent of the loan portfolio. The graphic in Chapter 4 ‘COe emissions for 2024 linked to the loan portfolio’ shows per segment the percentage of the portfolio that is included in the emission calculation. BNG aims for a 100 per cent coverage of the loan portfolio in the near future. Since reporting year 2024, we have been mapping CO2e emissions for virtually all of our loans to public infrastructure companies, joint schemes and other public institutions. Public infrastructure companies include, for example, air and sea ports, network operators and waste processing companies. Consequently, this portfolio is diverse and mainly includes non-property-related emission sources. As a result, we were unable to adopt the same approach as in the other sectors. Where possible, we used emission data from clients’ annual reports. As many clients do not yet report their emissions, we have calculated a share of the emissions using a sectoral approach. This approach has a lower PCAF data quality score than that of the other sectors. In the coming years, we will work on improving data quality for the emission measurements of these clients.
The financed emissions of BNG are calculated by the research agency Het Pon & Telos. Our clients’ emissions are derived from or calculated on the basis of public data from, among others, three network managers (Enexis, Liander and Stedin), Statistics Netherlands (CBS), the Land Registry, the Inspectorate for the Environment and Transport (ILT), CBIG, the Department for Implementation of Training (DUO), Vivet (CBS, Kadaster) and sustainability reports from the financed institutions. In most cases, the emission factors of www.CO2emissiefactoren.nl were used.
Every year, BNG, together with Het Pon & Telos, tries to improve the methodology further, for example, by changing the calculation method or using alternative data sources.
The following changes in method were made for the reporting year 2025:
Municipalities/education: The national ratios for energy use of social real estate were used for scope 1 and 2 emission calculations that were made available by Vivet (CBS, Kadaster).
Healthcare: This year, the methodology of emission calculation for the healthcare sector has been changed to improve data quality. This was done by using the publicly available data from the Environmental Barometer for as many healthcare institutions as possible. This data comes directly from the institutions themselves. Not all healthcare institutions publish sustainability data on the Environmental Barometer. Therefore, a combination of methods was used to achieve the results. The aim is to increase the use of the Environmental Barometer in the coming years.
For more detail on the data used per customer segment please refer to the PCAF BNG 2025 report on the website.
Data quality
The PCAF platform has drawn up an assessment framework per asset class for the quality of the data, based on which it is given a score. This score runs from 1 to 5, with 1 being the highest score. The PCAF BNG 2025 report describes the PCAF data quality score per component of the emissions calculation. For example, the data quality per segment can differ for the scope 1, 2 and 3 emission calculation. By means of a weighted average, these different quality scores are combined into one PCAF data quality score per segment. These can be found in the visual in Chapter 4 'CO2e issues 2024 linked to the loan portfolio' and in the last table in this paragraph.
The weighted average data quality of the portfolio improved slightly from 2.8 in 2023 to 2.7 in 2024. The greatest positive impact on the data quality score was caused by the method change for the Healthcare sector as described above.
The table below shows the loan portfolio and the part of it has been included in the emission calculations.
Market Segment | Sector | Total loan portfolio (million euro) | Coverage ratio by GHG footprint of total loan portfolio (%) | ||||
|---|---|---|---|---|---|---|---|
2018 | 2023 | 2024 | 2018 | 2023 | 2024 | ||
Housing | Social housing associations | 38,947 | 45,957 | 50,013 | 94.0 | 100.0 | 100.0 |
Housing related | 496 | 784 | 884 | - | 100.0 | 100.0 | |
Public sector | Municipalities | 26,066 | 25,104 | 24,993 | 99.8 | 100.0 | 100.0 |
Provinces | 137 | 449 | 584 | 100.0 | 100.0 | 100.0 | |
Water boards | 233 | 220 | 237 | 100.0 | 100.0 | 100.0 | |
Joint arrangements | 1,362 | 1,303 | 1,290 | - | 100.0 | 100.0 | |
Other public institutions | 768 | 510 | 493 | - | 100.0 | 100.0 | |
Healthcare | Healthcare | 7,031 | 6,629 | 6,329 | 87.7 | 100.0 | 99.7 |
Education | Educational institutions | 979 | 1,035 | 1,002 | 55.9 | 100.0 | 100.0 |
Public infrastructure | Public transport | 909 | 1,153 | 1,409 | - | 100.0 | 100.0 |
Infrastructure | 1,220 | 1,056 | 934 | 72.6 | 100.0 | 100.0 | |
Waste collection and processing | 754 | 697 | 756 | - | 100.0 | 100.0 | |
Drinking water companies | 811 | 677 | 933 | - | 92.2 | 99.0 | |
Spatial planning | 754 | 592 | 513 | - | 100.0 | 100.0 | |
Network companies (energy, telecom) | 451 | 486 | 319 | - | 100.0 | 100.0 | |
Other | Other | 381 | 281 | 239 | - | 100.0 | 100.0 |
Energy | Wind and Solar energy | 255 | 690 | 647 | - | 77.2 | 82.3 |
Biomass and geothermal | 54 | 118 | 76 | - | - | - | |
Sustainability projects | 19 | 52 | 49 | - | - | - | |
Total | 81,629 | 87,765 | 91,702 | 86.5 | 99.6 | 99.7 | |
The following table shows the absolute and relative financed issues of the credit portfolio and the data quality.
Market segment | Sector | Scope | Loan portfolio (clients with GHG footprint) (million euro) | Financed GHG emissions (ktCO2e) | Relative financed GHG emissions (tCO2e/million euro) | Data quality1 | ||||||
|---|---|---|---|---|---|---|---|---|---|---|---|---|
2018 | 2023 | 2024 | 2018 | 2023 | 2024 | 2018 | 2023 | 2024 | 2024 | |||
Housing | Social housing associations | 1-2 | 36,617 | 45,957 | 50,013 | 635 | 459 | 522 | 17.3 | 10.0 | 10.4 | 2.0 |
Housing related | 1-2-3 | - | 784 | 884 | - | 5 | 6 | - | 6.9 | 6.3 | 5.0 | |
Public sector | Municipalities | 1-2-3 | 26,006 | 25,104 | 24,993 | 1,002 | 842 | 835 | 38.5 | 33.6 | 33.4 | 3.8 |
Provinces | 1-2-3 | 137 | 449 | 584 | 9 | 13 | 19 | 63.6 | 27.9 | 33.1 | 4.0 | |
Water boards | 1-2-3 | 233 | 220 | 237 | 34 | 14 | 16 | 144.4 | 64.6 | 66.2 | 2.8 | |
Joint arrangements | 1-2-3 | - | 1,303 | 1,290 | - | 86 | 80 | - | 66.1 | 62.0 | 5.0 | |
Other public institutions | 1-2-3 | - | 510 | 493 | - | 32 | 30 | - | 62.7 | 61.5 | 5.0 | |
Healthcare | Healthcare | 1-2-3 | 6,167 | 6,629 | 6,310 | 285 | 200 | 145 | 46.3 | 30.2 | 23.0 | 2.6 |
Education | Educational institutions | 1-2 | 547 | 1,035 | 1,002 | 13 | 14 | 13 | 24.4 | 13.7 | 12.9 | 3.4 |
Public infrastructure | Public transport | 1-2-3 | - | 1,153 | 1,409 | - | 46 | 64 | - | 40.0 | 45.3 | 3.6 |
Infrastructure | 1-2-3 | 885 | 1,056 | 934 | 14 | 269 | 212 | 15.8 | 255.0 | 227.2 | 3.8 | |
Waste collection and processing | 1-2-3 | - | 697 | 756 | - | 270 | 264 | - | 387.3 | 349.3 | 2.6 | |
Drinking water companies | 1-2-3 | - | 624 | 923 | - | 22 | 35 | - | 34.8 | 37.5 | 2.3 | |
Spatial planning | 1-2-3 | - | 592 | 513 | - | 66 | 61 | - | 112.2 | 118.8 | 5.0 | |
Network companies (energy, telecom) | 1-2-3 | - | 486 | 319 | - | 74 | 59 | - | 152.7 | 185.6 | 4.0 | |
Other | Other | 1-2-3 | - | 253 | 239 | - | 3 | 2 | - | 10.9 | 10.2 | 4.4 |
Total | All Sectors | 70,593 | 86,856 | 90,900 | 1,992 | 2,417 | 2,363 | 28.2 | 27.8 | 26.0 | 2.7 | |
Energy | Renewable energy (net avoided emissions) | 3 | - | 533 | 533 | - | - | - | - | - | ||
- For an explanation of data quality, see the following table.
Data quality (highest to lowest) | Description |
|---|---|
1 | Audited GHG emission data or actual primary energy data |
2 | Non-audited GHG emission data, or other primary data |
3 | Averaged data that is peer/(sub)-sector-specific |
4 | Proxy data on the basis of region or country |
5 | Estimated data with very limited support |
For more detailed information on the PCAF data quality score per component of the emissions calculation, please refer to paragraph 2.3 of the PCAF BNG 2025 report.
9.2 Supplementary information on material topics
Process for determining material impacts, risks and opportunities
The double materiality analysis was carried out using a four-step process:
Identifying the value chain and key stakeholder relationships in the value chain.
Stakeholder interviews and desk research to draw up a long list of ESG topics.
Carrying out the double materiality analysis.
Governance and approval by the Executive Committee (ExCo) and Supervisory Board.
Step 1 Our value chain
In the double materiality analysis, we identify impacts, risks and opportunities related to our value chain, both the upstream and downstream. As a financial institution, our loan portfolio is the most important segment with an impact on sustainability issues, because we contribute to the economy and social development through financing. The analysis focuses primarily on direct contractual relationships, such as business and public customers.
Our value chain includes suppliers, investors, employees, regulators, ESG rating agencies, shareholders, customers and society. We distinguish between:
Upstream: Supply chain: parties that enable our activities, such as suppliers, investors and regulators.
Own business operations: our employees and internal processes.
Downstream: parties that benefit from our services, such as customers, shareholders and society.
Value chain
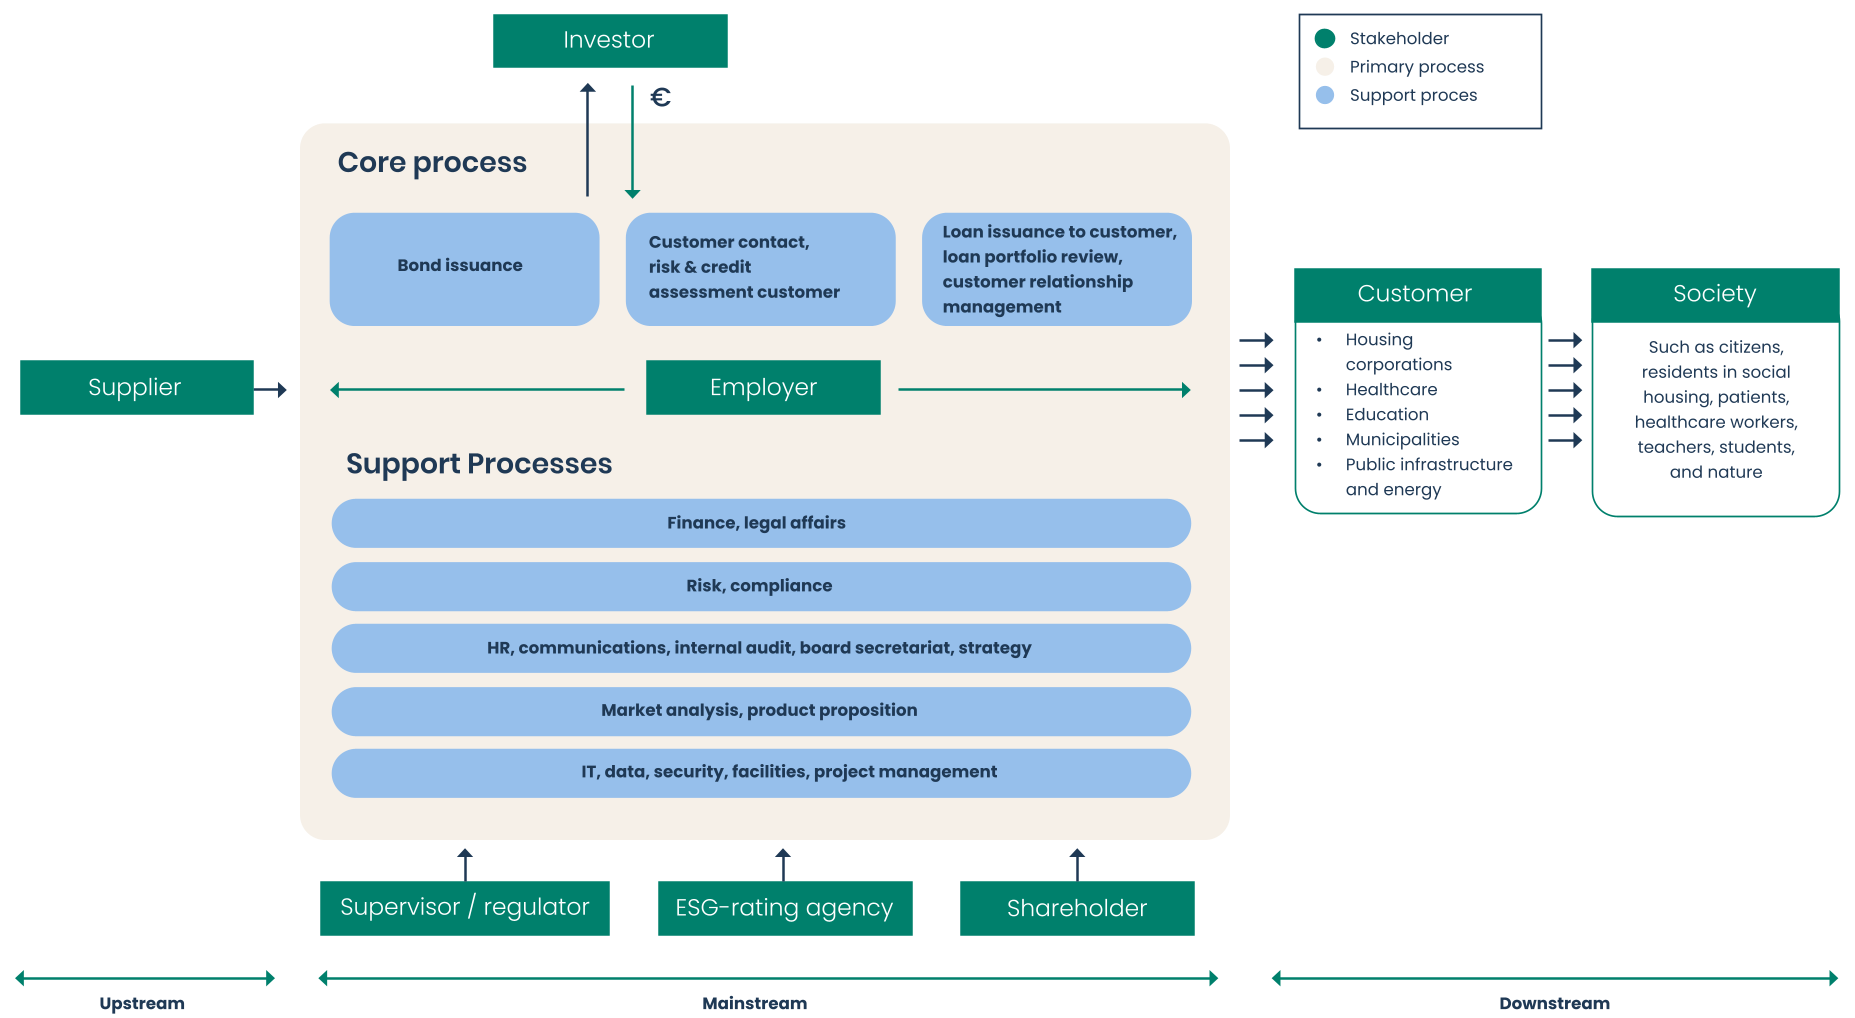
Step 2 Stakeholder interviews and desk research for drawing up a long list of ESG topics
Feedback was collected through surveys, interviews and workshops and analysed for consistency, relevance and substantiation.
Step 3 Performing the double materiality analysis
Impacts, risks and opportunities were identified and scored for each topic. Impacts were assessed in terms of magnitude, scope, reversibility and probability. Financial materiality was assessed in terms of the magnitude and probability of risks and opportunities, including dependencies on natural, human and social resources. Risks were analysed within existing risk categories, including transition and physical climate risks. Opportunities were defined as developments that could strengthen the business model or strategic objectives.
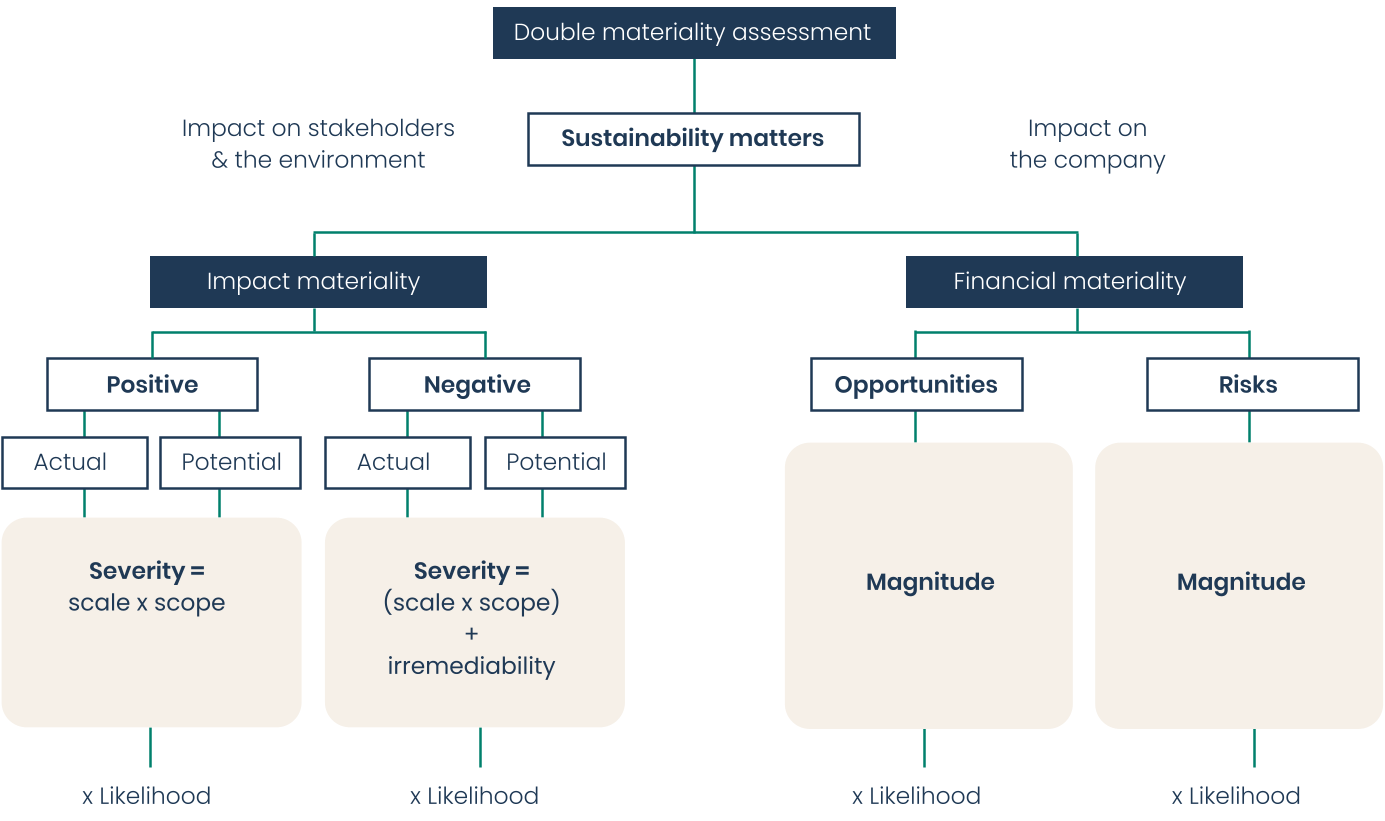
Step 4 Governance and approval
The methodology and results of the double materiality analysis have been approved by relevant governance bodies, including the Sustainability Task Force, the Sustainable Banking Committee, with approval by the ExCo and the Supervisory Board.
According to the GRI, the previously identified material themes served as important input in determining the material themes within our double materiality analysis (DMA). While the GRI themes provide a broad overview of strategic and societal priorities, the DMA makes these topics concrete and measurable in line with the ESRS requirements.
This means that subjects such as market leadership in the public domain, sustainability, data security, organisational efficiency and social involvement have been translated into specific DMA themes that reflect the social impact, risks and opportunities of BNG in the short, medium and long term. For example, broad GRI priorities have been fleshed out in themes such as affordable and available funding, climate change, sufficient and affordable housing and in-house staff.
In this way, the DMA ensures that our material sustainability topics are directly aligned with our core activities and social role, while being in line with the requirements of the CSRD/ESRS.
DMA scoring method
BNG uses external data sources, internal information, voluntary reports and statutory disclosures to assess the impacts, risks and opportunities of its activities and value chain.
Impact materiality
For impact materiality, we assess both the positive and negative impacts, which can actually or potentially occur. In doing so, we look at:
Scale: how large or serious the impact is;
Scope: how many people, sectors or areas are affected;
Recoverability: the extent to which negative impacts can be repaired.
In addition, we assess the probability of an impact occurring in the short, medium and long term.
Financial materiality
Financial materiality is determined on the basis of the possible financial consequences for BNG. We look at the magnitude and probability of these effects, for example through dependencies of natural, social and human resources, business relationships, and reputation. Data indicators are supplemented by the opinion of sector and risk specialists.
Risks and opportunities
In the case of risks, we combine negative impacts, dependencies and external context factors to determine whether these are material for our portfolio. Where possible, we use internal data and scenario analyses. For opportunities, we look at potential financial and non-financial benefits, such as new funding opportunities, cost savings or reputational benefits. In doing so, we also assess the extent to which BNG itself invests in order to take advantage of these opportunities.
Scoring and thresholds
The analyses lead to a combined score on a scale of 1 (very low) to 5 (very high). A sustainability issue is considered material if, based on this scoring, it is assessed as ‘significant’ or ‘critical’ according to the conversion matrix applied.
Material topics
The table below shows the progress of the material topics from 2024 to 2025.
Material topics for 2024 | Decision | Notes | Material topics 2025 |
|---|---|---|---|
Market leader in the public sector | Tighten up | The strategic ambition of market leadership has been translated into concrete social impact. | Affordable and available funding |
Tighten up | Housing associations form an important sector in our financing portfolio. That is why the theme “Sufficient and affordable housing” has been included explicitly s a DMA material theme, with which we are making the social impact of BNG on the public domain concrete. | Sufficient and affordable housing | |
We are demonstrably sustainable | Tighten up | Broad sustainability ambition is materialised in climate-related material themes and measurable effects | Climate change |
Data security and high-quality data | Remove | Important for governance and internal processes, but not an independent material sustainability topic under ESRS | N/A |
Efficient organisation | Remove | Operational efficiency contributes indirectly to sustainability, but is not recognised as a separate material issue. | N/A |
We are a bank with a heart | Tighten up | BNG ensures equal treatment and opportunities for everyone and encourages a healthy work/private balance | Own staff |
Policy and actions
The table below shows the policy and actions relating to the material subjects.
Material topic | Impact | Involvement | Policy and Commitments 2025 | Management actions taken |
|---|---|---|---|---|
Affordable and available funding | Actual, positive | Activities | BNG has a pricing policy that leaves room for interventions when the market situation requires it. | Adjusting prices in accordance with pricing policy in order to achieve set objectives. |
Sufficient and affordable housing | Actual, positive | Activities | BNG has a pricing policy that leaves room for interventions when the market situation requires it. | Adjusting prices in accordance with pricing policy in order to achieve set objectives. |
Climate change | Potential, positive | Activities | The CO2e emissions of our clients and ourselves is decreasing | Temporary acceptance of an increase in our own CO2e emissions because we are in a temporary building during the renovation of our own office building. |
Own staff | Actual positive | Activities | In the coming years, we want to achieve our ambition by seeing a positive movement in the areas of diversity and inclusiveness, the involvement of employees, direction on our own development and cooperation compared to the previous year | The focus was set on diversity and inclusion and attracting employees who are at a distance from the labour market. The Archipel learning platform has been developed further. We started working with a new occupational health and safety service in 2025. |
Definitions color score KPIs 2025
Material theme | KPI | Colour of KPI score | Definition of colour score |
|---|---|---|---|
Affordable and available funding | Long-term lending scoring percentage | Green | Scoring percentage is more than 60% |
Orange | Scoring percentage is 60% | ||
Red | Scoring percentage is less than 60% | ||
Sufficient and affordable housing | BNG share in new loans granted to housing associations in the past year | Green | BNG share is more than 60% |
Orange | BNG share is 60% | ||
Red | BNG share is less than 60% | ||
Climate change | Financed issues, scope 1 and 2 | Green | Reduction is more than 25% |
Orange | Reduction is 25% | ||
Red | Reduction is less than 25% | ||
Own staff | Male/female ratio, senior management | Green | Ratio is greater than 40% and less than 60% |
Orange | Ratio is 40% and 60% | ||
Red | Ratio is less than 40% and greater than 60% | ||
Own staff | Male/female ratio, all staff | Green | Ratio is greater than 35% and less than 65% |
Orange | Ratio is 35% and 65% | ||
Red | Ratio is less than 35% and greater than 65% | ||
Own staff | Sickness absence | Green | Percentage is less than 3% |
Orange | Percentage is 3% | ||
Red | Percentage is higher than 3% |
9.3 Glossary
Asset & Liability Committee (ALCO): The Asset & Liability Committee manages and monitors the bank's liquidity, market, refinancing and solvency risks.
Bond: Negotiable evidence of participation in a loan, with a fixed nominal value on which interest, usually fixed, is paid. The loan is repaid at the end of the term.
CEO: Chief Executive Officer, chair of the ExCo and the statutory board.
CCO: Chief Commercial Officer, member of the ExCo.
CFO: Chief Financial Officer, member of the ExCo and the statutory board.
Compliance: Complying with laws and regulations and working according to the standards and rules that an institution has drawn up itself.
Compliance Risk: The risk of insufficient compliance with or recognition of companyvalues, codes of conduct, generally accepted social norms and values, laws and regulations, and supervisory requirements. Compliance risk includes integrity risk and regulatory compliance risk.
Compliance Management Framework (CMF): Policies, working conditions, roles and responsibilities to ensure that BNG properly complies with applicable laws and regulations, thereby reducing and manageable the risk of financial or reputational loss due to insufficient compliance with laws and regulations.
COO: Chief Operating Officer, member of the ExCo.
Corporate governance: Corporate governance is the system of principles and best-practice provisions regulating relations between the Executive Committee, the Supervisory Board and the Annual General Meeting. The Dutch corporate governance model is characterised by the two-tier board structure, which provides for a Supervisory Board with supervisory duties and a managing body with executive management duties.
Credit Committee STMP: The Credit Committee for statutory market partners is tasked with taking individual credit decisions within the Credit Committee's mandate.
Credit Committee Treasury: The Credit Committee Treasury is mandated to set and manage the credit policy of financial counterparties and to approve individual agreements with financial counterparties.
Credit Policy Committee STMP: The Credit Policy Committee for statutory market partners is mandated to establish and manage the credit risk policy for statutory market partners and to monitor the implementation of this policy.
CRO: Chief Risk Officer, member of the ExCo and the statutory board.
Customer Due Diligence Policy (CDD): A policy to ensure that banks know and monitor their clients well in order to prevent and combat financial and economic crime. This policy enables banks to fulfil their important gatekeeper function, the aim of which is to prevent funds obtained through financial and economic crime from gaining access to the financial banking system.
ESG (Environmental, Social, Governance): A set of environmental, social and governance criteria used, among other things, to assess sustainability and social impact in terms of risks and opportunities, to shape a sustainability strategy and to guide lending and investment decisions.
ESG bond: Bonds issued by BNG under its Sustainable Finance Framework. These comprise two types of ESG bonds: social bonds and sustainability bonds. BNG uses social bonds to finance housing associations and sustainability bonds to finance local authorities. The expenditure of local authorities and housing associations is linked to the UN SDGs and the ICMA categories for the use of proceeds.
ESG rating (internal): This is the rating that BNG gives to clients as part of the identification, assessment and management of ESG risks.
Executive Committee (ExCo): BNG’s management body in its executive function.
Full-time equivalent (FTE): A unit to measure the scope of an employment contract or the workforce. Within BNG, one FTE represents one employee with a full-time working week of 36 hours.
Funding: Raising short-term and long-term capital in various currencies in international money and capital markets.
Global Reporting Initiative (GRI): Sustainability guidelines for reporting on economic, social and environmental performance.
Integral Portfolio Committee (IPC): The Integral Portfolio Committee's task is to maintain an overview, insight into and to monitor the manageability of BNG's total change portfolio.
Integrated Reporting: Reporting framework originating from the International Integrated Reporting Council (IIRC) resulting in an integrated report covering value creation: the external environment influencing the organisation, the incoming and outgoing resources and the way that the organisation interacts with the external environment. The value creation model is used to record the results.
Leverage ratio: The ratio between a bank's Tier 1 capital and the adjusted balance sheet total.
Liquidity risk: The risk of losses to earnings and capital due to the possibility, at any given time, that the bank will not be able to fulfil its payment obligations without incurring unacceptable costs or losses. Liquidity risk comprises of short-term liquidity risk and long-term liquidity risk (or refinancing risk).
Loans subject to solvency: Loans for which regulations require a certain amount of equity to be held as a buffer against the risk of non-repayment.
Long-term lending: The provision of loans with a term of more than one year.
Market leader in the public domain: BNG wants to be market leader in the public domain by financing governments and public/social organisations. The scoring percentage for new long-term loans is higher than 60% in 2025. This is calculated as the volume of actually concluded long-term loans divided by the volume of loans that clients requested a quotation for.
Market risk: The risk of losses to earnings and capital due to the fluctuation of market prices. Market risk includes the interest rate risk, exchange risk and fluctuations in credit spreads and liquidity spreads.
Material topics: Topics identified using the 'materiality analysis' which are sufficiently important to be reported on in the Annual Report.
Materiality analysis: Process in which it is determined with input from stakeholders which topics, known as 'material topics', are sufficiently important to be reported on in the Annual Report.
Net promoter score (NPS): In order to calculate the NPS, BNG asks how likely it is that a client recommends the bank to a colleague or relation. Clients can answer with a score on a 0-10 scale, with the following distribution: promoters (9 or 10); passives (7 or 8); detractors (0-6). NPS is calculated as the percentage promoters minus the percentage detractors.
Non-Financial Risk Committee: The Non-Financial Risk Committee (NFRC) supports the ExCo on issues that fall under operational, compliance and security risks, including the impact that ESG factors may have on this risk.
Operational risk: The risk of losses of earnings or capital due to shortcomings of internal processes, people and systems, or as a result of external events. Operational risk comprises process risk, people risk, model risk, IT risk, data management risk, outsourcing risk, legal risk, business continuity risk and external event risk.
Promotional loan: A loan granted directly or via an intermediary credit institution, by a credit institution under public law or an entity established by the central, regional or local government of a member state, on a non-competitive, not-for-profit basis, in order to promote the policy objectives of the central, regional or local government of a member state of the European Union.
Rating: Rating of the creditworthiness of banks, the ability of banks to meet their obligations. The assessment is carried out by independent credit rating agencies, such as the recognised credit rating agencies Moody's, Fitch and Standard & Poor's.
Return on equity (ROE): Calculated by dividing the net profit minus the distributed dividend on additional Tier 1 capital divided by the aggregate of the equity minus the additional Tier 1 capital and the unrealised reserves at the start of the financial year. The unrealised reserves are the revaluation reserve, the cash-flow hedge reserve, the own credit adjustment and the cost of hedging reserve.
Risk Appetite Framework (RAF): Includes policy, processes, controls and systems used to determine, communicate and monitor the bank’s risk appetite, including the Risk Appetite Statement, risk limits and an overview of the roles and responsibilities of those who supervise the implementation and monitoring of the framework.
Risk Appetite Statement (RAS): Description of the risks that the bank wishes to accept in order to achieve its objectives.
Risk Management Framework (RMF): Consists of overarching policy on general and specific risk-related topics: risk governance, risk appetite framework and specific risks, and is tailored to the specific company profile. The framework forms part of the Internal Governance Framework.
Scope 1: Direct CO2 emissions caused by fuels that the institution itself purchases and consumes. This concerns emissions from the institution's own buildings and transport and production-related activities.
Scope 2: Indirect CO2 emissions in the business operations of the institution. This concerns the consumption of electricity and heat, physically generated elsewhere.
Scope 3: Other indirect CO2e emissions for which the institution does not itself handle procurement, as well as direct emissions beyond the institution's direct control. This includes, among other things, the commuting by employees of the institution without lease cars and the consumption by external parties from which the institution procures services (such as air travel).
Scoring percentage: The volume of actually concluded long-term loans divided by the volume of loans that clients requested a quotation for.
Social impact: BNG’s impact on social issues, translated into SDGs.
Solvency-free loans: Loans for which no equity is required because they are considered to be (virtually) free of credit risk. Loans to or under guarantee from the Dutch government are considered to be (nearly) free of credit risk.
Stakeholders: Groups or individuals who can reasonably be expected to be significantly affected by the institution's activities, products or services and/or whose actions affect the ability of the institution to implement its strategies or achieve its objectives.
Strategic risk: The risk that an organisation’s strategic decisions result in losses of earnings and capital due to changes beyond its control with regard to political climate, regulatory developments, reputation, business climate and ESG.
Supervisory Board (SB): BNG’s management body in its supervisory function.
Sustainable Banking Committee (SBC): The SBC's mission is to ensure that BNG has, implements and reports on an integrated sustainability policy.
Sustainable Development Goals (SDGs): 17 sustainability goals aimed at ensuring peace and prosperity for people and the planet, now and in the future. These goals are endorsed by all member states of the United Nations in 2015.
Sustainable Finance Framework: Framework in line with which various types of sustainable financial instruments can be issued, such as bonds, loans, commercial papers and deposits.
Sustainable financing (in general): Financing in the form of balance sheet or project financing for the purpose of achieving public sector social policy objectives that are in line with the United Nations Sustainable Development Goals (SDGs), such as the realisation of affordable housing, investments in climate-proof living environments and the energy transition, and making social real estate more sustainable. BNG also provides specific sustainable financing products, such as green loans to housing associations aimed at making social and mid-range rental housing more sustainable, and sustainability-linked loans.
Three Lines of Responsibility model: Risk management framework that spreads responsibility for operational risk management across three roles. Line management in the first line is the owner of and directly manages risks. The second line supervises the first line, determines policy, defines risk tolerance limits and ensures that these are observed. The third line, consisting of internal audit, provides independent assurance of the first two lines.
Time to hire: The lead time for recruiting internal staff for a permanent position.
Value creation and the value creation model: Value creation models in integrated reporting provide stakeholders with an understanding how the business model of a company create value on the short-, medium- and long term.

- 10.1 Consolidated financial statements
- Consolidated balance sheet
- Consolidated income statement
- Consolidated statement of comprehensive income
- Consolidated cash flow statement
- Consolidated statement of changes in equity
- Accounting principles for the consolidated financial statements
- Notes to the consolidated financial statements
- Hedging of risks with derivatives
- Fair value of financial instruments
- Risk section
- Institutional risk management approach
- Credit risk
- Market risk
- Liquidity and funding risk
- Capital and solvency
- Other notes
- Related parties
- Off-balance sheet positions
- Encumbered financial assets and liabilities
- Liability of Board members
- Proposed profit appropriation
- Joint ventures
- Summarised financial information
- Involvement in non-consolidated structured entities
- Events after the balance sheet date
- Closing
- 10.2 Company financial statements
10.1 Consolidated financial statements
Consolidated balance sheet
Amounts in millions of euros | NOTE | 31-12-2025 | 31-12-2024 |
|---|---|---|---|
Assets | |||
Cash and balances held with central banks | |||
Amounts due from banks | |||
Cash collateral posted | |||
Financial assets at fair value through the income statement | |||
Derivatives | |||
Financial assets at fair value through other comprehensive income | |||
Interest-bearing securities at amortised cost | |||
Loans and advances at amortised costs | |||
Value adjustments on loans in portfolio hedge accounting | - | - | |
Joint ventures | |||
Property and equipment | |||
Current tax assets | |||
Other assets | |||
Total assets | |||
Liabilities | |||
Amounts due to banks | |||
Cash collateral received | |||
Financial liabilities at fair value through the income statement | |||
Derivatives | |||
Debt securities | |||
Funds entrusted | |||
Subordinated debts | |||
Current tax Liabilities | |||
Deferred tax liabilities | |||
Provisions | |||
Other liabilities | |||
Total liabilities | |||
Equity | |||
Share capital | |||
Share premium reserve | |||
Retained earnings | |||
Revaluation reserve | - | ||
Cash flow hedge reserve | - | ||
Own credit adjustment | |||
Cost of hedging reserve | - | ||
Net profit | |||
Equity attributable to shareholders | |||
Additional Tier 1 capital | |||
Total equity | |||
Total liabilities and equity |
Consolidated income statement
Amounts in millions of euros | NOTE | 2025 | 2024 |
|---|---|---|---|
| |||
| |||
Total interest revenue | |||
| |||
| |||
Total interest expenses | |||
Interest result | |||
| |||
| |||
Commission result | |||
Result on financial transactions | - | - | |
Other results | |||
Total income | |||
Staff costs | |||
Other administrative expenses | |||
Depreciation | |||
Other operating expenses | |||
Total operating expenses | |||
Net impairment losses on financial assets | - | ||
Net impairment losses on joint ventures | - | ||
Contribution to resolution fund | |||
Bank levy | |||
Total other expenses | - | ||
Profit before tax | |||
Income tax expense | |||
Net profit | |||
| |||
|
The references refer to the notes to the consolidated financial statements. The notes to the consolidated financial statements are an integral part of the consolidated financial statements.
Consolidated statement of comprehensive income
Amounts in millions of euros. All figures in the statement are after taxation. | 2025 | 2024 |
|---|---|---|
Net profit | ||
Other comprehensive income | ||
Changes in cash flow hedge reserve: | ||
- Unrealised value changes | - | |
- Realised value changes transferred to the income statement | ||
| - | ||
Changes in cost of hedging reserve: | ||
- Unrealised value changes | - | |
- Realised value changes transferred to the income statement | - | - |
| - | ||
Changes in the revaluation reserve for financial assets at fair value through other comprehensive income: | ||
- Unrealised value changes | - | |
- Realised value changes transferred to the income statement | ||
| - | ||
Total recyclable results | - | |
Non-recyclable results recognised directly in equity: | ||
Change in fair value attributable to change in credit risk of financial liabilities at fair value through profit or loss | - | |
Total non-recyclable results | - | |
Total other comprehensive income | - | |
Total | ||
- of which attributable to the holders of Additional Tier 1 capital | ||
- of which attributable to shareholders |
Consolidated cash flow statement
Amounts in millions of euros | 2025 | 2024 |
|---|---|---|
Cash flow from operating activities | ||
Profit before tax | ||
Adjusted for: | ||
| ||
| - | |
| - | |
Changes in operating assets and liabilities: | ||
| - | |
| ||
| - | - |
| - | |
| - | |
Corporate income tax paid | - | - |
Other changes from operating activities | - | |
Net cash flow from operating activities | ||
Cash flow from investing activities | ||
Investments and acquisitions pertaining to: | ||
| - | - |
| - | - |
| - | - |
| - | - |
Disposals and redemptions pertaining to: | ||
| ||
| ||
| ||
| ||
Net cash flow from investing activities | - | |
Cash flow from financing activities | ||
Amounts received on account of: | ||
| ||
| ||
Amounts paid on account of: | ||
| - | - |
| - | - |
| - | - |
| - | - |
Net cash flow from financing activities | - | |
Net change in cash and cash equivalents | - | |
Cash and cash equivalents as at 1 January | ||
Cash and cash equivalents as at 31 December | ||
Cash and cash equivalents as at 31 December: | ||
Cash and balances held with central banks | ||
Cash equivalents in the Amount due from banks item | ||
Cash equivalents in the Amount due to banks item | ||
Notes to cash flow from operating activities | ||
Interest income received | ||
Interest expenses paid | - | - |
Consolidated statement of changes in equity
Amounts in millions of euros. All figures in the statement are after taxation. | Share capital | Share premium reserve | Revaluation reserve | Cashflow hedge reserve | Own credit adjustment | Cost of hedging reserve | Retained earnings | Unappropriated profit | Equity attributable to shareholders | Additional Tier 1 capital | Total |
|---|---|---|---|---|---|---|---|---|---|---|---|
Balance as at 01/01/2024 | - | ||||||||||
Total comprehensive income | - | ||||||||||
Dividend distribution to the bank’s shareholders | - | - | - | ||||||||
Compensation to holders of Additional Tier 1 capital | - | - | - | ||||||||
Appropriation from previous year’s profit | - | ||||||||||
Balance as at 31/12/2024 | - | ||||||||||
Total comprehensive income | - | - | - | ||||||||
Dividend distribution to the bank’s shareholders | - | - | - | ||||||||
Compensation to holders of Additional Tier 1 capital | - | - | - | ||||||||
Appropriation from previous year’s profit | - | ||||||||||
Balance as at 31/12/2025 | - | - |
BNG has not recognised any results from minority interests in the consolidated equity which is attributable to third parties. With the exception of Additional Tier 1 capital, the entire equity is attributable to the shareholders.
Accounting principles for the consolidated financial statements
General company information
The consolidated financial statements were prepared and issued for publication by the Executive Board on 20 March 2026 and will be presented to the General Meeting of Shareholders for adoption on 23 April 2026.
Applicable laws and regulations
The consolidated financial statements are prepared in accordance with IFRS Accounting Standards as adopted in the European Union, and with Part 9, Book 2 of the Dutch Civil Code.
Critical accounting principles applied for valuation and the determination of the result
Going concern
The consolidated financial statements are prepared on the basis of the going-concern principle. The Executive Board considers this to be appropriate considering that the bank is liquid, has a high quality loan portfolio with impairments that are limited in size and number and proven track record of stability. This is supported by the triple A rating of the bank, the high Core Equity Tier 1 capital and Liquidity Coverage Ratio. No substantial changes are expected based on the outcome of BNG's funding plan, forecast and budget process.
Valuation of balance sheet items
Most balance sheet items are valued at amortised cost. The balance sheet items Financial assets at fair value through the income statement, Financial assets at fair value through other comprehensive income, Derivatives and Financial liabilities at fair value through the income statement are recognised at fair value. The balance sheet item joint ventures is stated according to the equity method. The balance sheet item Property and equipment is stated at cost less accumulated depreciation.
Accounting principles for determining the result
Income is recognised if it is more likely than not that the economic benefits will accrue to BNG and the income can be reliably determined. Expenses are allocated to the period in which the services were provided or to the related income counterbalancing these expenses. For a detailed description, please refer to the accounting principles for the individual balance sheet items.
Reporting currency
The euro is the functional and reporting currency used by BNG. All amounts in the consolidated financial statements are stated in millions of euros, unless stated otherwise.
Accounting principles for consolidation
Each year, BNG prepares, as the parent company, the consolidated financial statements for the company and its subsidiary BNG Gebiedsontwikkeling B.V. the financial statements of the parent company and its subsidiary which are used to prepare the consolidated financial statements are drawn up at the same reporting date, and are based on uniform principles.
All intra-group transactions and balances, including income, expenses and dividends, have been fully eliminated in the consolidated financial statements. The consolidated financial statements comprise all subsidiaries over which BNG has control. The consolidation base subject to prudential regulation (CRR/CRD IV) is identical to the consolidation base under International Financial Reporting Standards (IFRS). We refer to the disclosure note 'Related parties' for more details.
Control exists if BNG is exposed as an investor to variable returns due to its involvement and is able to influence these returns by exercising power over the relevant activities of the investment. Group companies are consolidated in full from the date that control has been acquired until such time as control ceases to exist. In determining whether BNG has control over investment funds in which it holds units or shares, the financial interests held by BNG as a participant are taken into consideration.
Impact of events on Financial Statements
In 2025, BNG’s excellent capital and liquidity position continued to contribute to the bank’s ability to provide public domain clients with funding at competitive rates.
The main driver behind our net profit is the net result on interest. Compared to last year, net profits are lower due to the decrease in interest result, an increase in the negative result on financial transactions, higher staff costs, a restructuring provision and an increase in impairments due to higher stage 3 impairments. Also, BNG had higher bank levies due to a higher balance sheet amount in 2024 compared to 2023.
Throughout the year, BNG monitors the credit worthiness developments in the various sectors we operate in and whether clients are experiencing financial difficulties. The credit worthiness of BNG’s portfolio remains high.
If relevant, further details of the impact on significant estimates and methods used are provided in the relevant notes.
Involvement in non-consolidated structured entities
BNG assesses involvement in non-consolidated structured entities on a case-by-case basis, with due regard for the nature, purpose, size and activities of those entities. Investments in investment funds through participating interests or in securitisation positions and covered bond programmes (issued by ‘special-purpose entities’) are non-consolidated structured entities for BNG. Due to its involvement in these entities, BNG is exposed to variable returns, partly based on their performance. These structured entities have been designed so that voting or similar rights are not the dominant factor in deciding who controls the entity, but rather control is determined by contractual provisions. As a result, BNG does not have control over these non-consolidated entities, in which it only acts as an investor.
Accounting estimates and judgements
The most significant accounting estimates and judgements applied in these consolidated financial statements relate to fair value measurement of financial instruments, impairment of financial assets and provisions.
The most important methods and estimates relate to the fair value measurement of financial instruments for which there is no active market (for a more detailed description, see section 'Fair value of Financial Instruments’). BNG uses generally accepted valuation models to measure the fair value of these financial instruments. For level 2 instruments, BNG uses observable inputs to determine forward curves, discounting curves, volatility curves, inflation curves and spread curves. For level 3 instruments, the main unobservable inputs relate to recovery rates and correlation factors for bonds with credit and liquidity spreads. The results of these models are based on various assumptions, including the discount rate and the future expected cash flows. Differences in the assumptions may have an effect on the reported values.
For the estimates and judgements to determine the impairment of financial assets we use internal estimation techniques to determine forward-looking information, Probability of Default (PD), Loss Given Default (LGD), Exposure At Default (EAD) and Significant Increase Credit Risk (SICR). Furthermore, for non-performing assets the bank assesses the net present value of expected future cash flows (including the valuation of underlying collateral) for three probability weighted scenarios. For further details please refer to 'Impairment of financial assets'. For recognised provisions in the balance sheet see specific topic on provisions.
Other provisions, for example the restructuring provision, are recognised based on reliable estimates, see the specific topic on provisions.
For a detailed description of the methods and assumptions used, please refer to the accounting principles for the individual balance sheet items or topics. BNG periodically evaluates the estimates and assumptions that it applies. Any revisions are reported in the year in which the estimate is revised.
Balance sheet netting
Financial assets and financial liabilities are only netted on the balance sheet if and insofar it is certain that the net and simultaneous settlement of the amount receivable and the amount payable can be legally enforced under normal circumstances as well as in the event of default, insolvency and liquidation, and if there is a distinct intention to settle either the net amount as such, or both items simultaneously. Balance sheet item Amounts due from banks include a netted amount of repos. These items are only netted when there is an enforceable master agreement. For derivatives and taxes, please refer to the specific additional netting rules for the relevant balance sheet items.
Foreign currency
Foreign currency transactions are translated into functional currency on initial recognition at the exchange rate applicable on the transaction date. At the balance sheet date, foreign currency monetary assets and liabilities are translated into functional currency at the closing rate. Exchange rate results are recognised at the balance sheet date in the income statement, under the Result on financial transactions item, with the exception of (the effective portion of) the foreign currency transactions that were designated in a cash flow hedge accounting relationship. These exchange rate differences are recognised in the cash flow hedge reserve.
Segmented information
When deciding on the deployment of resources and performance measurement, BNG distinguishes between lending activities and area development activities. In the management and set-up of its lending operations, BNG does not distinguish between different segments or business units. The bank’s area development activities are not material compared with its lending activities. Therefore, no segmented information is included in this Annual Report.
New and Amended Standards Issued by the International Accounting Standards Board (IASB)
Applied accounting standards adopted by the EU effective on or after 1 January 2025
BNG applied the mandatory IFRS standards, amendments and interpretations stated below, as issued by the IASB and adopted by the European Union effective 1 January 2025, to our 2025 financial statements.
Amendments to IAS 21 The Effects of Changes in Foreign Exchange Rates: Lack of Exchangeability: issued by the IASB on 15 August 2023 and is endorsed by the EU on 12 November 2024. These amendments became effective per 1 January 2025. There is no impact on BNG as BNG uses foreign currencies to fund or finance the activities, as BNG uses mostly exchangeable currencies.
Accounting standards endorsed by the EU effective on or after 1 January 2026
BNG has decided against early application of amended standards and interpretations endorsed by the EU whose application is mandatory for the financial years on or after 1 January 2026.
There are amendment to IFRS 7 'Financial Instruments: Disclosure' and IFRS 9 'Financial Instruments', BNG will apply these standards to the disclosures and policy in 2026.
Accounting standards not yet adopted by the EU which are not yet applied
There are two standards, not yet adopted and endorsed by the EU:
IFRS 18 'Presentation and Disclosure in Financial Statements' that is expected to be endorsed in the first half of 2026 and to be effective in 2027. BNG has analysed the impact of this standard, and the impact is limited.
IFRS 19 'Subsidiaries without Public Accountability: Disclosures'. BNG will analyse the impact of this standard and it is expected to be limited, as BNG has limited subsidiaries.
Summary of material accounting policies
Classification and measurement of financial instruments
BNG classifies its financial assets into the following measurement categories:
those to be measured at fair value (either through other comprehensive income, or through the income statement); and those to be measured at amortised cost.
The classification depends on BNG’s business model for managing financial assets and the contractual terms of the financial assets’ cash flows.
BNG classifies its financial liabilities at amortised cost, unless it has designated liabilities at fair value through the income statement or it is required to measure liabilities at fair value through the income statement, such as derivative liabilities.
Financial assets measured at amortised cost
Financial instruments are measured at amortised cost where they:
have contractual terms that give rise to cash flows on specified dates, which represent solely payments of principal and interest (SPPI test) on the principal amount outstanding; and
are held within a business model whose objective is achieved by holding to collect contractual cash flows.
These instruments are initially recognised at fair value plus directly attributable transaction costs and subsequently measured at amortised cost. The measurement of credit impairment is based on the three-stage expected credit loss model described below under Impairment of financial assets. Financial assets measured at amortised cost are included in the balance sheet items Cash and balances held with central banks, Amounts due from banks, Cash collateral posted, Interest-bearing securities at amortised cost and Loans and advances at amortised cost. Interest revenue from these financial assets is included in Interest revenue calculated using the effective interest method.
Financial assets measured at fair value through other comprehensive income
Investments in debt instruments are measured at fair value through other comprehensive income where they:
have contractual terms that give rise to cash flows on specified dates, which represent solely payments of principal and interest (SPPI test) on the principal amount outstanding; and
are held within a business model whose objective is achieved by both collecting contractual cash flows and selling financial assets.
These debt instruments are initially recognised at fair value plus directly attributable transaction costs and subsequently measured at fair value. Gains and losses arising from changes in fair value are included in other comprehensive income within a separate component of equity, except for the recognition of impairment gains and losses, interest revenue and foreign exchange gains and losses. Interest revenue from these financial assets is included in Interest revenue calculated using the effective interest method. Impairment losses or reversals and foreign exchange gains and losses are also recognised in the income statement.
Upon disposal, the cumulative gain or loss previously recognised in other comprehensive income is reclassified from equity to the income statement. The measurement of credit impairment is based on the three-stage expected credit loss model as applied to financial assets at amortised cost. The expected credit loss model is described below under Impairment of financial assets.
Financial assets or liabilities at fair value through the income statement
Items at fair value through the income statement comprise:
debt instruments with contractual terms that do not represent solely payments of principal and interest (mandatory);
items specifically designated at fair value through the income statement on initial recognition;
derivatives; and
equity instruments.
Financial instruments held at fair value through the income statement are initially recognised at fair value, with transaction costs recognised in the income statement as incurred. Subsequently, they are measured at fair value and any gains or losses are recognised in the income statement within result on financial transactions as they arise. Interest revenue or expenses from these financial assets and liabilities (except for derivatives involved in hedge accounting) are included in Other interest revenue or Other interest expenses. Interest revenue or expenses from derivatives involved in hedge accounting are included in Interest revenue using the effective interest method or Interest expenses using the effective interest method.
Derivatives are measured at fair value, including market value changes due to the counterparty credit risk (Credit Valuation Adjustment) and due to own credit risk (Debit Valuation Adjustment) for derivative transactions without a daily or limited exchange of collateral.
Financial instruments designated as measured at fair value through the income statement
Upon initial recognition, financial instruments may be designated as measured at fair value through the income statement. A financial asset may only be designated at fair value through the income statement if doing so eliminates or significantly reduces measurement or recognition inconsistencies (i.e. it eliminates an accounting mismatch) that would otherwise arise from measuring financial assets or liabilities on a different basis.
A financial liability may be designated at fair value through the income statement if it eliminates or significantly reduces an accounting mismatch or:
if a host contract contains one or more embedded derivatives; or
if a group of financial assets and liabilities are both managed and their performance evaluated on a fair value basis in accordance with a documented risk management or investment strategy.
Where a financial liability is designated at fair value through the income statement, the movement in fair value attributable to changes in the bank’s own credit quality is calculated by determining the changes in credit spreads above observable market interest rates and is recognised separately in other comprehensive income within equity.
Equity instruments
BNG does not make use of the option under the standard to measure equity instruments at fair value through other comprehensive income. As a result, investments in equity instruments are measured at fair value through the income statement.
Derecognition of financial instruments
A financial asset is derecognised if:
the contractual right to receive cash flows from the asset has expired; or
BNG has retained the right to receive cash flows from the asset but has assumed a contractual obligation to pass on these cash flows, in full and without material delay, to a third party pursuant to a special arrangement; or
the contractual rights to receive cash flows from the asset and virtually all the risks and benefits of this asset have been transferred, i.e. when control over the asset has been transferred.
A write-off is regarded as a derecognition event and is recognised when BNG has no reasonable expectations of recovering (a portion of) the contractual cash flows on a financial asset. In case of a write-off, BNG will directly reduce the gross carrying amount of the financial asset.
If the terms of a financial asset are modified, BNG evaluates whether the cash flows of the modified asset are substantially different. If the cash flows are substantially different, the contractual rights to cash flows from the original financial asset are deemed to have expired. In this case, the original financial asset is derecognised and a new financial asset is recognised at fair value.
BNG derecognises a financial liability when its terms are modified and the cash flows of the modified financial liability are substantially different. In this case, a new financial liability based on the modified terms is recognised at fair value. The difference between the carrying amount of the financial liability extinguished and the new financial liability with modified terms is recognised in profit and loss. A financial liability is also derecognised when the obligation specified in the contract has been discharged or cancelled or has expired.
In case of partial derecognition of financial instruments, BNG applies the First In, First Out (FIFO) principle. The difference between the amount settled and the carrying amount of the asset or liability is immediately and fully recognised in the income statement. If an existing financial asset or liability is contractually exchanged for another contract with the same counterparty on substantially the same terms, the new asset or liability is treated as a continuation of the existing asset or liability. No result is recognised in this case.
Collateral (bonds) furnished by BNG under standard repurchase agreements and securities lending and borrowing transactions are not derecognised because BNG retains all the risks and rewards on the basis of the predetermined repurchase price, and the criteria for derecognition are therefore not met.
Transfer of financial assets
BNG retains the financial assets transferred on its balance sheet if all or most of the risks and benefits attached to (components of) the financial assets transferred are retained. For example, the bank may transfer financial assets while retaining all or nearly all of the risks and benefits in the context of repurchase transactions.
Impairment of financial assets
BNG has assessed the current loan portfolio with regards to the macro economic factors. These macro economic factors are used to translate historical PDs into forward looking PDs, as required per IFRS 9 standard. These factors are determined on a portfolio basis. An overlay has been applied on the Project Finance PD model, based on the observed defaults in the past years.
BNG assesses whether the credit risk on an exposure has increased significantly on an individual basis. The expected credit losses (ECL) is calculated for the following categories of financial assets that are not measured at fair value through the income statement:
debt instruments measured at amortised cost;
debt instruments measured at fair value through other comprehensive income;
loan commitments; and
financial guarantee contracts.
Financial assets migrate through the following three stages based on the change in credit risk since initial recognition. When a modification of a financial asset results in the derecognition of the existing financial asset and the subsequent recognition of the modified asset, the date of modification shall be regarded as the date of initial recognition.
Stage 1: 12-month ECL
BNG recognises an ECL allowance reflecting default events that are possible within the next 12 months for exposures without a significant increase in credit risk (SICR) since initial recognition. In addition, BNG makes use of the Low Credit Risk Exemption (LCRE). This avoids exposures with a low credit risk to move to Stage 2 even when there is a SICR, provided that the increase is such that the total credit risk is still low. In both cases, a 30-day past due period acts as a backstop indicator for movement to Stage 2. The 12-month ECL allowance is calculated for all individual exposures as a function of the Exposure At Default (EAD), Probability of Default (PD) and Loss Given Default (LGD) and incorporates forward-looking information.
Stage 2: lifetime ECL – performing exposures
BNG recognises an ECL allowance reflecting default events that are possible during the remaining lifetime of the financial assets for exposures which have had a significant increase in credit risk since initial recognition, but which are not considered credit-impaired. This mainly includes exposures with a credit rating that is not considered to be investment grade and for which the credit rating dropped at least one notch since initial recognition.
In addition, it also includes exposures with payment arrears between 30 and 90 days, as well as exposures subject to forbearance measures. Other qualitative factors considered are significant adverse changes in business, financial and/or economic conditions in which the borrower operates and actual or expected significant adverse change in operating results of the borrower.
The Stage 2 lifetime ECL is calculated for all individual exposures as a function of the Exposure At Default (EAD), Probability of Default (PD) and Loss Given Default (LGD) and incorporates forward-looking information.
Stage 3: lifetime ECL – non-performing exposures
BNG assesses on an individual exposure level whether exposures are non-performing which is fully aligned with the definition of default. This assessment is based on whether one or more events have occurred that have a detrimental impact on the estimated future cash flows of that asset. This includes, but is not limited to, exposures with payment arrears exceeding 90 days. In the event that BNG determines that a counterparty is in default, all related financial assets are considered to be in Stage 3. For exposures that have become non-performing, the bank recognises a lifetime ECL that is determined by taking into account all relevant information, including any collateral or guarantees that apply to the exposure at hand. An instrument is considered to no longer be in default (i.e. to have cured) when it no longer meets any of the default criteria. This will be assessed for each instrument individually.
Determining the stage for impairment
At each reporting date, the bank assesses whether there has been a significant increase in credit risk for exposures since initial recognition by comparing the risk of default occurring over the remaining expected life from the reporting date and the date of initial recognition. The bank considers reasonable and supportable information that is relevant and available without undue cost or effort for this purpose. This includes quantitative and qualitative information, as well as forward-looking analysis. BNG also makes use of the Low Credit Risk Exemption (LCRE) in order to avoid exposures to move to Stage 2 even when there is a significant increase in credit risk, as long as the total credit risk is still low. An exposure will always migrate to a higher probability of default as asset quality deteriorates.
If asset quality improves up to a point that there is no longer any question of SICR since origination, the ECL allowance reverts from lifetime ECL to 12-month ECL. The allowance for these financial assets is based on a 12-month ECL. When an asset is uncollectible, it is written off against the related provision.
Such assets are written off after all the necessary procedures have been completed and the amount of the loss has been determined. Subsequent recoveries of amounts previously written off reduce the amount of the expense in the income statement.
Classification of ECL
The classification of the ECL depends on the type of instrument and is as follows:
Financial assets that are performing at the reporting date: as the present value of all cash shortfalls over the expected life of the financial asset discounted by the effective interest rate. The cash shortfall is the difference between the cash flows due to BNG in accordance with the contract and the cash flows that the bank expects to receive.
Financial assets that are non-performing at the reporting date: as the difference between the gross carrying amount and the present value of estimated future cash flows discounted by the effective interest rate.
Undrawn loan commitments: as the present value of the difference between the contractual cash flows that are due to the bank if the commitment is drawn down and the cash flows that the bank expects to receive.
Financial guarantee contracts: as the expected payments to reimburse the holder less any amounts that the bank expects to recover.
ECLs are recognised using the net impairment losses on financial assets line items in the income statement. In the case of debt instruments measured at fair value through other comprehensive income, the measurement of ECLs is based on the three-stage approach as applied to financial assets at amortised cost. The bank recognises the impairment charge in the income statement, with the corresponding amount recognised in other comprehensive income, with no reduction in the carrying amount of the asset in the balance sheet.
Hedge accounting
The bank’s derivative instruments used to manage interest rate and currency risk are recognised on a trade-date basis at fair value as derivative either on the asset or on the liability side of the balance sheet. The goal is to achieve stability of the annual result, in particular the interest result and to manage the unrealised gains and losses. BNG applies micro hedge accounting in accordance with IFRS 9 and portfolio hedging in accordance with IAS 39 when the conditions set out by the standard are met. Hedge accounting is based on a clearly documented relationship between the hedged item and the hedging instrument. When there is a high (negative) correlation between the hedging instrument on the one hand and the value change of the hedged item or the cash flows generated by the hedged item on the other hand, the hedge is regarded as effective. The hedging relationship is documented at the time that the hedge transaction is entered into. The hedging relationship is then continually tested in order to assess whether it meets the hedge accounting requirements.
In principle, BNG only uses derivatives as hedging instruments. They are mandatorily measured at fair value in the balance sheet. The counterpart in the hedging relationship is the hedged item, which is generally recognised at amortised cost. Insofar as the hedge accounting relationship is effective, hedge accounting enables the bank to neutralise the difference in measurement and result recognition between the hedging instruments and the hedged items. BNG applies both fair value and cash flow hedge accounting.
Fair value hedge accounting
BNG applies two types of fair value hedge accounting: micro hedge accounting and portfolio hedge accounting.
Micro hedge accounting
When a derivative is designated as the hedging instrument in a hedging relationship, the changes in the fair value of the derivative are recognised immediately in the income statement together with changes in the fair value of the hedged item that are attributable to the hedged risk. Sometimes, a derivative may be a component of a hybrid financial instrument that includes both the derivative and a host contract. Such embedded derivative instruments are part of a structured financing transaction that is hedged against changes in fair value by means of matching swap contracts. In such cases, both the hedged item and the hedging derivative instrument are recognised at fair value with changes in fair value in the statement of comprehensive income or as a value adjustment of the hedged item. Currently the bank’s fair value hedges mainly relate to swapping fixed to floating rate transactions. The balance sheet items financial assets measured at fair value through other comprehensive income, financial assets measured at amortised cost, funds entrusted and debt securities are involved.
If the hedging instrument expires or is sold, terminated or exercised, or when the hedge no longer meets the criteria for hedge accounting, or BNG decides to voluntarily discontinue the hedging relationship, the hedge relationship is discontinued prospectively. If the relationship does not meet the hedge effectiveness criteria, BNG discontinues hedge accounting from the last date on which compliance with hedge effectiveness was demonstrated.
Portfolio hedge accounting
Portfolio hedge accounting concerns a group of transactions in euros that are hedged for interest rate risk using a portfolio of derivatives. BNG applies portfolio hedge accounting to the majority of long-term fixed rate loans and a limited number of fixed rate securities. There is no direct relationship between individual hedged items and hedging instruments, but it is shown at the portfolio level that the derivatives involved offset the value changes in the related assets arising from interest rate movements.
Due to the lack of a direct relationship between the assets and the derivatives used for hedging, the value adjustments of the hedged interest rate risk are recognised in the Value adjustments on loans in portfolio hedge accounting balance sheet item.
Cash flow hedge accounting
When a derivative is designated as the hedging instrument in a cash flow hedge relationship, the effective portion of changes in the fair value of the derivative is recognised directly in other comprehensive income and presented in the cash flow hedging reserve within equity. Any ineffective portion of changes in the fair value of the derivative is recognised immediately in the income statement.
The amount recognised in the cash flow hedge reserve is reclassified to the income statement as a reclassification adjustment in the same period as the hedged cash flows affect the income statement. BNG applies cash flow hedge accounting on floating foreign currency transactions and the credit spread of fixed foreign currency transactions. The balance sheet line items Funds entrusted and Debt securities are involved. If the hedge accounting relationship is terminated, the accumulated fair value hedge adjustment is amortised over the remaining term of the financial instrument. If the hedged item is derecognised, the unamortised fair value adjustment is recognised immediately in the income statement.
Foreign currency basis spread
Following the adoption of IFRS 9 the forward component of a hedging instrument is no longer part of the hedge relationship. The foreign currency basis spread of a cross-currency interest rate swap is accounted for the same way as the forward element of a forward contract. The change in the foreign currency basis spread of this derivative that relates to the hedged item is recognised in the cost of hedging reserve within equity. The amount accumulated in the cost of hedging reserve is reclassified to the income statement at the same time as the hedged item affects the income statement.
Discontinuance of hedge accounting
The hedge accounting relationship is discontinued when it no longer meets the conditions for hedge accounting, or when the hedged item or hedging instrument is sold or matures. The difference between the preceding balance sheet value and the amortised cost of the hedged item is amortised over the remaining period of the hedged item, to the extent that it is retained on the balance sheet. If all or part of a hedged item is sold or purchased, the relevant portion of the cumulative fair value changes is taken into account in the income statement when determining the result on sales.
Recognition and accounting of financial assets and liabilities
Financial assets and liabilities are recognised at settlement date. This means that they are recognised from the moment that the bank is entitled to the benefits or is liable for the obligations arising from the contractual provisions of the financial instrument. This includes both traditional financial instruments (loans, interest-bearing securities and debt securities) and derivatives. Financial assets and liabilities are initially recognised at the transaction price, in other words the fair value plus the transaction costs that are directly attributable to the acquisition of the financial asset or the issuance of the financial liability, with the exception of the transactions recognised at fair value. The transactions recognised at fair value are measured at fair value without taking into account the transaction costs.
If the value of transactions recognised at fair value differs from the transaction price on initial recognition, the profit or loss is included as follows:
For fair value level 1 or 2 transactions, the difference is recognised directly in the Result on financial transactions item of the income statement.
For fair value level 3 transactions, the difference is included in the balance sheet as a transitory item, and amortised over the term of the transaction.
After initial recognition, financial assets and liabilities are measured at either amortised cost or fair value, depending on the classification of the transaction. In addition to the notional amount, the amortised cost consists of accrued interest, settled transaction costs and/or premiums or discounts distributed in accordance with the effective interest method over the interest rate maturity of the transaction.
Recognition and accounting of derivative financial instruments
Derivative financial instruments are contracts whose value is derived from one or more underlying prices, indexes or other variables, and typically comprise instruments such as swaps, forward rate agreements, futures and options. From initial recognition, derivatives are in principle carried at fair value and classified as held for trading. The carrying value of a derivative is remeasured at fair value throughout the life of the contract and any fair value movements are recognised under the Result on financial transactions item in the income statement. Derivatives are included under assets if they have a net positive fair value or under liabilities for a net negative fair value, with the exception of derivative transactions entered under a central clearing house. For these derivatives, netting takes place of the fair value of all derivatives with a financial counterparty that acts as an intermediary between the bank and the central clearing house. If the derivative transactions are entered under a central clearing house and are also part of a Settle to Market (STM) derivative contract the derivative position is also netted with the collateral posted/received.
Separated derivatives embedded in financial liabilities
Derivatives embedded in financial liabilities are classified and valued separately if all of the following conditions have been met:
there is no close relationship between the economic characteristics and risks of the embedded derivative on the one hand and those of the financial instrument;
the financial instrument is not carried at fair value, with value movements recognised through the income statement; and
a separate derivative instrument on the same terms would match the definition of a derivative.
Derivatives that meet these conditions are recognised in the Derivatives balance sheet item and carried at fair value. Contracts are only reassessed if there is a change in the contractual terms which materially affects the expected cash flows.
Non-separated derivatives embedded in financial liabilities
Derivatives that do not meet the conditions to be separated are included in the balance sheet item where the financial instrument is recognised. This usually concerns options relating to early redemption. The measurement of these derivatives follows the measurement of the financial instrument. If this is the amortised cost, the option is in principle measured at zero. In all other cases, the option is measured at fair value.
Fair value of financial instruments
The fair value is the price (not adjusted for transaction costs) which, regardless of the company’s intention or capability, would be received if a financial asset was sold, or the price that would be paid if a financial liability was transferred in an orderly transaction between market participants as at the measurement date under the current market conditions. The starting point is that the valuation must be viewed from the perspective of market parties, for which only the specific characteristics and limitations of the financial instrument may be taken into consideration. Fair value is based on quoted market prices in active markets or, if unavailable, on modelled valuation techniques.
Valuation techniques are generally used to determine the fair value of unlisted assets and liabilities and over-the-counter (OTC) derivatives. This concerns generally accepted techniques and methods such as option pricing models, discounted cash flows, forward pricing and credit and liquidity spreads. Contractual conditions are taken into account and available objective market data are used, such as market-based yield curves for discounting, correlations, volatilities, cross-currency basis spreads, credit spreads, valuation adjustments and other factors, estimates and assumptions which market parties would use to determine the price. Fair value Level 3 valuations are based in part on assumptions that are not observable in the market. For a detailed description of how the fair value measurement is determined, please refer to section 'Fair value of financial instruments' in the consolidated financial statements.
Value adjustments on loans in portfolio hedge accounting
This balance sheet item includes value adjustments resulting from the fair value portfolio hedge accounting. This refers to the effective portion of movements in market value resulting from hedging the interest rate risk in financial assets at the portfolio level. The value adjustments recognised are amortised over the maturity period of the hedged financial assets in the income statement.
Amounts due to banks, cash collateral received, debt securities, funds entrusted and subordinated debts
Borrowings (including repurchase transactions) and debt securities are carried in the balance sheet at amortised cost unless the liabilities are measured at fair value through the income statement. As regards transactions in Debt securities and Funds entrusted that are involved in a micro fair value hedge accounting relationship, the amortised cost is adjusted for the effective portion of the movements in fair value arising from interest rate risk. Any repurchased obligations are removed from the balance sheet, and the difference between the carrying amount and the transaction value is recognised in the income statement.
Joint ventures
Joint ventures are stated according to the equity method. Joint ventures are collaborations in which BNG and other parties with joint control over the contractual agreements have contractual entitlements to the net assets. These contractual agreements are structured by means of separate legal entities. The joint control of the arrangement is contractually agreed and only exists if the relevant activities under the arrangement require the unanimous consent of the parties sharing control. For a description of the bank’s Joint ventures, please refer to section 'Joint ventures' of this document.
Property and equipment
All property and equipment owned by the bank is valued at cost less accumulated depreciation. Property relates to land, buildings and technical installations. Equipment relates to office machinery, inventory, furniture, hardware, software and artworks. Right-of-use asset are presented under property and equipment and represents the right to use the underlying leased asset.
The depreciation period is determined on the basis of the estimated useful life of the assets (see note 11 to the consolidated financial statements). The estimated useful life and residual value are reviewed annually. Depreciation is calculated on a straight-line basis and charged to the income statement. The right-of-use assets are depreciated over the lease term on a straight-line basis. Land and buildings under construction are not depreciated.
Estimated useful life | |
|---|---|
Buildings | 30 years |
Technical installations | 15 years |
Machinery and inventory | 5 years |
Right-of-use asset | 1-5 years |
Hardware and software | 3 years |
Impairment of non-financial assets
The carrying amount of BNG’s non-financial assets (property and equipment, investments in joint ventures), with the exception of deferred tax assets, is assessed when there is an objective indication of impairment. To determine impairments, an estimate is made of the realisable value and individual assets are divided into groups at the lowest level at which future cash flows can be identified (cash flow generating units). BNG has not recognised any goodwill. The realisable value of an asset or cash flow generating unit is equal to the higher of the value in use and the fair value minus selling costs.
In determining the value in use, the present value of the estimated future cash flows is calculated using a discount rate before tax which reflects both the current market appraisals of the time value of money and the specific risks relating to the asset. Impairments recognised in respect of cash flow generating units are first offset against the carrying amount of any goodwill allocated to the units and subsequently offset pro rata against the carrying amount of the other assets of the unit (or group of units). Non-financial assets which were subject to impairment are reassessed at each balance sheet date. Impairment of a non-financial asset, with the exception of goodwill included in non-financial assets, is reversed through the income statement (Impairments item) if it is possible to establish reliably that the negative effects of the indication for the impairment recognised earlier are mitigated. An impairment is only reversed to the extent that the carrying amount of the asset does not exceed the carrying amount minus depreciation or amortisation, which would have been determined if no impairment had been recognised.
Provisions: restructuring provisions
A provision is recognised when there is a current liability, outflow of resources is more probable than not, and reliable estimate can be made. More specific for a restructuring provisions: there is a detailed formal plan for a reorganisation (without possibility of withdrawal), when it is expected that this impacts employees and when there is a reliable estimate of the outflow of resources, in this case employee termination benefits.
Employee pensions
The bank classifies its multi-employer pension plan as a defined contribution plan. Under this plan, the members bear almost all of the actuarial and investment risks, while the employer members of the plan are under no obligation to make any supplementary contributions if a deficit occurs in the fund. The obligation consists of payment of the contribution determined by the pension fund. The pension fund determines the contribution each year based on the information contained in its own dataset, taking account of the parameters and requirements specified by the regulatory authority. The obligation to pay a contribution takes effect upon becoming a pension fund member in the relevant year, and not from membership in previous years. The employer’s share of the pension contribution and any supplementary amounts are charged to the result in the year to which the contribution relates.
Other employee benefits
Other employee benefits are classified as defined benefit plans for which separate provisions have been formed. These other employee benefits include the future costs of interest rate discounts on mortgage loans for the benefit of both active and retired BNG employees.
The level of the provision is determined on the basis of calculations using the Projected Unit Credit Method (PUCM). The provision associated with the mortgage interest rate discount is stated under the provisions balance sheet item. The costs relating to the employee benefits are recognised as staff costs in the income statement. This item also includes a provision for a vitality leave scheme. Under this scheme, active employees with seven or more years of service can take two consecutive months of leave once every seven years while retaining part of their monthly income. The vitality leave scheme is recognised as a defined benefit plan and the costs are recognised as staff costs in the income statement.
Taxes
The nominal tax amount is calculated on the basis of the statutory nominal tax rates and the tax legislation in force. Tax rate adjustments relating to previous years, participation exemptions and non-deductible costs are also applied when determining the effective tax amount in the income statement. Group companies that form part of the fiscal unit use the applicable nominal tax rate.
Deferred tax assets and deferred tax liabilities are both carried at nominal value. All deferred tax assets and liabilities are stated in the accounts of the parent company of the fiscal unit. Deferred tax assets and liabilities are recognised as temporary differences between the carrying amounts on the one hand and the tax bases of assets and liabilities on the other. The bank has registered deferred tax assets and liabilities for the actuarial results for the employee benefits provision, for the revaluation reserve, for own credit adjustments and for the cash flow hedge reserve.
These deferred tax assets and liabilities are measured at the tax rates that are expected to apply to the periods in which they are expected to be realised. Differences in deferred tax assets and liabilities resulting from a change in tax rates are recognised in the income statement. Deferred tax assets are recognised only to the extent to which taxable profits are expected to be available in the near future to compensate for these temporary differences. Tax assets and liabilities, both current and deferred separately, are netted if they concern the same tax authority and the same type of tax and if netting of these assets and liabilities is permitted by law.
Global minimum top-up tax
The bank does not expect a top-up tax because the effective tax rate is above the minimum tax rate. BNG does not have any operations in other countries.
Equity
The balance sheet is drawn up before profit appropriation. This means that the total net result for the financial year is presented in equity. The revaluation reserve for financial assets at fair value through other comprehensive income and the cash flow hedge reserve are adjusted by recognising a deferred tax liability.
Additional Tier 1 capital
Additional Tier 1 capital concerns perpetual loans involving an annual non-cumulative discretionary payment on the outstanding principal amount, subject to temporary write-down in the event that the CET1 ratio falls below 5.125%. In case of write-down, this amount will be transferred to the Retained earnings. Write-down from the Retained earnings can be reversed (write-up) under certain conditions at the moment that the trigger ratio is back above 5.125% again. BNG is entitled to distribute the interest payment on a discretionary basis in the form of a compensation charged to the Retained earnings. The compensation is determined on the basis of the prevailing principal amount.
BNG has the unilateral contractual option to call the Additional Tier 1 capital issued. As from May 2022, the tranches issued in 2016 (a nominal amount of EUR 309 million) can be redeemed every year in May.
Revaluation reserve
Equity includes a revaluation reserve in which the unrealised changes in fair value of Financial assets at fair value through other comprehensive income, net of tax, are recognised. In the event of a sale of a financial instrument, the cumulative revaluation is recognised in Results on financial transactions. The effective portion of fair value changes in transactions involved in hedge accounting is either credited or charged to the income statement during the period in which the transactions are involved in a hedge accounting relationship.
Own credit adjustment
Financial liabilities at fair value through the income statement are recognised at the relevant funding curve, including the spread for own credit risk. The bank recognises the amount related to changes in fair value attributable to change in credit risk of financial liabilities designated at fair value through the income statement as Own credit adjustment (net of deferred tax assets and liabilities) in Other Comprehensive income within equity.
Cost of hedging reserve
Under IFRS 9, the foreign currency basis spread of a hedging instrument is no longer part of a hedge relationship. The cost of hedging reserve records movements in foreign currency basis spreads in cross-currency (interest rate) swaps involved in hedge accounting. The amount accumulated in the cost of hedging reserve is reclassified to the income statement at the same time as the hedged item affects the income statement.
Cash flow hedge reserve
Furthermore, equity includes a cash flow hedge reserve, in which the effective portion of the unrealised changes in the fair value of derivatives in cash flow hedge accounting, net of taxes, resulting from changes in the foreign exchange rates and the credit spread component is recognised. The ineffective portion of the hedged risk for cash flow hedge accounting is recognised under Results on financial transactions.
Interest revenue and interest expenses
Interest revenue and Interest expenses for all interest-bearing instruments included in the balance sheet are calculated on the basis of the effective interest rate. This method is used for calculating the amortised cost of a financial asset or a financial liability and for allocating the interest income or interest expense to the relevant period. Interest income is calculated by applying the effective interest rate to the gross carrying amount of a financial asset except for financial assets that subsequently become credit-impaired. For credit impaired financial assets, the effective interest rate is applied to the net carrying amount of the financial asset (after deduction of the loss allowance). If a transaction measured at amortised cost is sold, the difference between the carrying amount and the net proceeds of the sale is recognised under Interest result.
Commission income and commission expenses
In this item, the commission and fees paid or received are recognised in the period in which the services were provided.
Result on financial transactions
This item comprises unrealised market value changes in:
all financial instruments due to foreign exchange rate fluctuations;
derivatives measured at fair value, including market value changes due to the counterparty credit risk (Credit Valuation Adjustment) and due to own credit risk (Debit Valuation Adjustment) for derivative transactions without a daily or limited exchange of collateral;
financial instruments measured at fair value, with changes in fair value recognised through the income statement;
effective portions of the hedged interest rate risk in financial assets and liabilities involved in a fair value hedge accounting relationship;
the amortisation of the balance sheet item Value adjustments on loans in portfolio hedge accounting; and
the ineffective portion of the hedged risk for cash flow hedge accounting.
This item also includes sales and buy-out results for financial instruments measured at fair value. These realised results consist of the difference between the net proceeds of the sale and the carrying amount, including the release of value movements accumulated in equity. Returns from the participating interests (equity instruments) measured at fair value are also recognised under this item. Finally, differences between the fair value on initial recognition and the transaction price regarding to level 1 and 2 financial instruments measured at fair value are also included.
Results from joint ventures
This item includes the results from joint ventures, valued in accordance with the equity method. Dividend payments are recognised in the income statement when they are received.
Other results
The other results includes the results not relating to BNG’s core operational activities. This mainly consists of income from consultancy services provided by BNG Gebiedsontwikkeling B.V.
Depreciation
Please refer to the Property and equipment section.
Contribution to resolution fund
The European resolution regime is based on the EU Bank Recovery and Resolution Directive (BRRD). The full amount payable will be charged to the income statement in the month of payment. The annual contribution to the European resolution fund is recognised in the income statement under the item Contribution to resolution fund.
Bank levy
In accordance with the Banking Tax Act, banks are required to pay a bank levy in October each year. The full amount payable will be charged to the income statement in the month of payment. The annual levy is recognised in the income statement under the item Bank levy.
Consolidated statement of comprehensive income
The consolidated statement of comprehensive income presents the aggregate net result of the reporting period and the direct changes in equity, net of taxes where applicable. In the statement, the amounts net of taxes are presented in groups of items that can be reclassified from equity to the income statement in the future on the one hand and items that can never be reclassified on the other.
Consolidated cash flow statement
The consolidated cash flow statement has been drawn up in accordance with the indirect method. The cash flows are categorised as cash flows from operating, investing and financing activities. Cash and cash equivalents include cash at hand, the available balances with banks and central banks and overnight interbank loans. These funds have less than three months’ maturity from the date of acquisition, are readily convertible into a known amount of cash and are subject to a negligible risk of changes in value. The changes in loans and advances, funds entrusted, derivatives, cash collateral posted and received, and amounts due from and due to banks are included in the cash flow from operating activities. Investing activities comprise purchases, sales and redemptions in the investment portfolio, purchases and sales of joint ventures as well as property and equipment. Drawdowns and repayments of subordinated debt and bond loans, as well as the dividend paid, are presented as financing activities.
Notes to the consolidated financial statements
Amounts in millions of euros.
1 Cash and balances held with central banks
31-12-2025 | 31-12-2024 | |
|---|---|---|
Cash on hand | 0 | 0 |
Current account balances with the central bank (due on demand) | 1,831 | 6,625 |
Total | 1,831 | 6,625 |
2 Amounts due from banks
The amounts due from banks item includes all receivables from banks measured at amortised cost.
31-12-2025 | 31-12-2024 | |
|---|---|---|
Short-term loans and current account balances | 2 | 2 |
Long-term lending | 702 | 800 |
Repos | 0 | 2 |
Total | 704 | 804 |
We refer to section 'Credit Risk' for a detailed overview of repos under netting conditions.
3 Cash collateral posted
The cash collateral amounts of EUR 3,721 million (2024: EUR 3,545 million) is posted with third parties under credit support annexes in netting agreements and as such is not freely available to BNG.
4 Financial assets at fair value through the income statement
This item includes:
Financial assets mandatorily measured at fair value through the income statement. This concerns financial assets that have failed to pass the SPPI test; and
Financial assets designated as measured at fair value through the income statement.
31-12-2025 | 31-12-2024 | |
|---|---|---|
Mandatorily measured at fair value through the income statement | ||
Loans and advances | 29 | 31 |
Designated as measured at fair value through the income statement | ||
Loans and advances | 174 | 210 |
Interest-bearing securities | 82 | 516 |
Total | 285 | 757 |
The total redemption value of these loans and advances and interest-bearing securities at year-end 2025 is EUR 285 million (2024: EUR 757 million). The interest-bearing securities decreased due to sale of the Inflation-Linked Bond portfolio.
5 Derivatives
This balance sheet item includes the derivatives with a positive fair value.
31-12-2025 | 31-12-2024 | |
|---|---|---|
Derivatives not involved in a hedge accounting relationship | 32 | 476 |
Derivatives involved in a portfolio hedge accounting relationship | 1,340 | 1,195 |
Derivatives involved in a micro hedge accounting relationship | 759 | 2,259 |
Receivables related to STM derivative contracts | 7 | 49 |
Total | 2,138 | 3,979 |
6 Financial assets at fair value through other comprehensive income
This includes purchased interest-bearing securities that are held within the Hold-to-Collect and Sell business model and for which the bank has not used the fair value option.
31-12-2025 | 31-12-2024 | |
|---|---|---|
Governments | 5,577 | 5,478 |
Supranational organisations | 2,148 | 2,556 |
Credit institutions | 4,070 | 2,908 |
Other institutions | - | 380 |
Total | 11,795 | 11,322 |
At year-end 2025, BNG had transferred EUR 321 million (2024: EUR 325 million) financial assets at fair value through other comprehensive income in repurchase transactions without derecognition.
7 Interest-bearing securities at amortised cost
This includes purchased interest-bearing securities that are held within the Hold-to-Collect business model and for which the bank has not used the fair value option.
31-12-2025 | 31-12-2024 | |
|---|---|---|
Governments | 1,282 | 1,299 |
Supranational organisations | 1,983 | 2,443 |
Credit institutions | 3,313 | 4,145 |
Non-financial corporations | 1,527 | 1,246 |
Allowance for credit losses | -0 | -0 |
Total | 8,105 | 9,133 |
At year-end 2025, BNG had transferred EUR 2,088 million (2024: EUR 2,049 million) interest-bearing securities at amortised cost in repurchase transactions without derecognition.
8 Loans and advances at amortised costs
The Loans and advances item includes short-term and long-term loans to clients insofar as they pass the SPPI test, as well as current account debit balances held by clients. All positions are held within the Hold-to-Collect business model.
31-12-2025 | 31-12-2024 | |
|---|---|---|
Short-term loans and current account balances | 1,591 | 1,182 |
Long-term lending | 96,134 | 93,412 |
Total loans and advances | 97,725 | 94,594 |
Allowance for credit losses | -98 | -57 |
Total | 97,627 | 94,537 |
At year-end 2025, the collateral value of the portion of the loans and advances contributed as collateral to DNB amounted to EUR 33.8 billion (2024: EUR 32.2 billion).
9 Value adjustments on loans in portfolio hedge accounting
This refers to the value adjustments of the effective portion of the hedged interest rate risk of hedged assets involved in a portfolio hedge accounting relationship.
2025 | 2024 | |
|---|---|---|
Movements of value adjustments on loans in portfolio hedge accounting | ||
Opening balance | -2,953 | -5,037 |
Movements in the unrealised portion in the financial year | -8,220 | 1,719 |
Amortisation in the financial year | 461 | 352 |
Movements in the realised portion in the financial year | -1 | 13 |
Closing balance | -10,713 | -2,953 |
10 Joint ventures
31-12-2025 | 31-12-2024 | |
|---|---|---|
Balance sheet value | ||
Joint ventures | ||
Various participations | 5 | 16 |
Total | 5 | 16 |
BNG Gebiedsontwikkeling B.V. is, as a 100% subsidiary, part of the consolidated financial statements. The joint ventures referred to are held by BNG Gebiedsontwikkeling B.V. For summarised financial information on joint ventures, please refer to the 'Joint ventures'-section of the consolidated financial statements.
11 Property and equipment
2025 | 2024 | 2025 | 2024 | 2025 | 2024 | 2025 | 2024 | |
|---|---|---|---|---|---|---|---|---|
Property | Equipment | Right-of-use-asset | Total | |||||
Historical cost | ||||||||
Opening balance | 13 | 50 | 19 | 29 | 4 | 4 | 36 | 83 |
Investments | 26 | 5 | 0 | 1 | 1 | 0 | 27 | 6 |
Divestment | - | -42 | -13 | -11 | - | - | -13 | -53 |
Value as at 31 December | 39 | 13 | 6 | 19 | 5 | 4 | 50 | 36 |
Depreciation | ||||||||
Accumulated depreciation as at 1 January | - | 40 | 17 | 26 | 2 | 2 | 19 | 68 |
Depreciation during the year | - | 2 | 2 | 2 | 0 | 0 | 2 | 4 |
Divestments depreciation | - | -42 | -13 | -11 | - | - | -13 | -53 |
Accumulated depreciation as at 31 December | - | - | 6 | 17 | 2 | 2 | 8 | 19 |
Total | 39 | 13 | 0 | 2 | 3 | 2 | 42 | 17 |
Renovation of our office
Our office on Koninginnegracht 2 is being renovated. As per November 2023, the office is temporarily moved to another location in The Hague. The expenses of the current renovation are capitalized, resulting in investments of EUR 26 million in property in 2025 (2024: EUR 5 million). The investments will be depreciated once the building is in use.
No property or equipment is pledged as security of liabilities.
12 Other assets
The other assets at year-end 2025 of EUR 24 million (2024: EUR 104 million) and comprise amounts receivable from lending to clients and reconciling of prepaid license fees.
13 Amounts due to banks
31-12-2025 | 31-12-2024 | |
|---|---|---|
Current account balances | 0 | 0 |
Deposits | 420 | 917 |
Private loans | 683 | 722 |
Repos | 1 | - |
Total | 1,104 | 1,639 |
14 Cash collateral received
The cash collateral at year-end 2025 of EUR 710 million (2024: EUR 1,533 million) is received from third parties under credit support annexes as opposed to netting agreements and as such is not freely available to BNG.
15 Financial liabilities at fair value through the income statement
This item includes debt securities and deposits designated as measured at fair value with changes in fair value recognised through the income statement.
31-12-2025 | 31-12-2024 | |
|---|---|---|
Debt securities | 225 | 238 |
Deposits | 7 | 16 |
Total | 232 | 254 |
The total redemption value of these debt securities and deposits at year-end 2025 is EUR 213 million (2024: EUR 219 million). The difference between the financial liability's carrying amount and the redemption value at year-end 2025 is EUR 19 million (2024: EUR 35 million). Financial liabilities are measured at fair value through the income statement on the relevant funding curve including a mark-up for own credit risk. The total change in value (before tax) was EUR 8 million positive (2024: EUR 12 million positive). Changes in fair value due to own credit risk are recognised through other comprehensive income. These changes are determined by comparing the valuation using the relevant funding curve including a mark-up for own credit risk and the valuation using the relevant funding curve without this mark-up.
16 Derivatives
This balance sheet item includes the derivatives with a negative fair value.
31-12-2025 | 31-12-2024 | |
|---|---|---|
Derivatives not involved in a hedge accounting relationship | 45 | 279 |
Payables related to STM derivative contracts | 14 | - |
Derivatives involved in a portfolio hedge accounting relationship | 1,764 | 3,698 |
Derivatives involved in a micro hedge accounting relationship | 3,186 | 1,569 |
Total | 5,009 | 5,546 |
17 Debt securities
This includes bonds and other issued debt securities with either fixed or variable interest rates. Any sold portion of an issue is deducted from the relevant bond.
31-12-2025 | 31-12-2024 | |
|---|---|---|
Bond loans | 91,984 | 91,844 |
Privately placed debt securities | 1,898 | 1,922 |
Commercial Paper | 498 | 9,617 |
Total | 94,380 | 103,383 |
18 Funds entrusted
31-12-2025 | 31-12-2024 | |
|---|---|---|
Current account balances | 3,415 | 3,857 |
Short-term deposits | 1,790 | 2,331 |
Long-term deposits | 3,811 | 4,329 |
Total | 9,016 | 10,517 |
19 Subordinated debt
31-12-2025 | 31-12-2024 | |
|---|---|---|
Subordinated debt | 21 | 19 |
Total | 21 | 19 |
20 Taxes
The bank has registered deferred tax liabilities for the actuarial results for the employee benefits provision, the revaluation reserve, the own credit adjustment, the compensation on additional Tier 1 capital and for the cash flow hedge reserve, for which the movements are recognised through equity.
31-12-2025 | 31-12-2024 | |
|---|---|---|
Current tax | -30 | 55 |
Deferred tax liabilities | -3 | -39 |
Total | -33 | 16 |
BNG and the Dutch tax authorities have concluded a bilateral agreement (‘vaststellingsovereenkomst’) on 14 February 2024 that the financial figures based on IFRS 9 can be applied for tax purposes for the period 2024-2026. The bilateral agreement applies to the BNG fiscal unit. Pursuant to the agreement, all financial instruments are stated – for both reporting and tax purposes – in accordance with the IFRS principles of valuation, with the exception of transactions classified as Financial assets at fair value through other comprehensive income. All transactions within this category are valued for tax purposes at the lower of either the cost price or the market value. The result for tax purposes differs from the result for reporting purposes if, on balance, unrealised gains have arisen.
The reconciliation between the effective tax rate and the nominal tax rate is as follows:
2025 | 2024 | |
|---|---|---|
Nominal and effective tax rate | ||
Profit before tax | 240 | 403 |
Tax levied at the nominal tax rate | -62 | -104 |
Tax adjustment from previous years | 0 | 0 |
Participation exemption | 0 | 0 |
Deductible interest on Additional Tier 1 capital | 4 | 4 |
Non-deductible costs (bank levy) | -10 | -9 |
Effective tax | -68 | -109 |
Nominal tax rate | 25.8% | 25.8% |
Effective tax rate | 28.2% | 27.0% |
In 2025 there is no change in tax rates and the upper tax rate is equal to the rate in 2024: 25.8%.
The deferred taxes are measured at the tax rates that are expected to apply to the period when the asset is realised or the liability is settled.
2025 | ||||
|---|---|---|---|---|
Opening balance | Changes through equity | Changes through the income statement | Closing balance | |
Changes in deferred taxes | ||||
Revaluation reserve FVOCI | - | -6 | - | -6 |
Cash flow hedge reserve | -3 | 8 | - | 5 |
Own Credit Adjustment | -3 | 1 | - | -2 |
Cost of hedging | -33 | 33 | - | 0 |
Additional Tier 1 capital | -2 | - | 0 | -2 |
Employee benefits provision | 0 | - | 0 | 0 |
Property | 2 | - | - | 2 |
Total | -39 | 36 | 0 | -3 |
2024 | ||||
|---|---|---|---|---|
Opening balance | Changes through equity | Changes through the income statement | Closing balance | |
Changes in deferred taxes | ||||
Cash flow hedge reserve | -3 | 0 | - | -3 |
Own Credit Adjustment | -1 | -2 | - | -3 |
Cost of hedging | -14 | -19 | - | -33 |
Additional Tier 1 capital | -2 | 0 | 0 | -2 |
Employee benefits provision | 0 | - | 0 | 0 |
Property | 1 | 1 | - | 2 |
Total | -19 | -20 | 0 | -39 |
21 Provisions
The provisions consist of a restructuring provision, an employee benefit provision and other provisions.
In 2025 BNG announced a reorganisation related to the strategy 'Route naar Meer Meerwaarde' (‘Route to added value’) and, as a result, recognised a restructuring provision of EUR 15 million. The strategy 'Route to added value' aims to professionalize the organization and embed chain management. The main drivers of the resutructuring provision are the continued payment of wages for a period 6 months and a transition compensation acoording to the social arrangement.
The employee benefits provision comprises two components: a provision of EUR 0.5 million (2024: EUR 1 million) for interest rate discounts on mortgage loans granted to active and retired employees, and a provision of EUR 1 million (2024: EUR 1 million) for vitality leave. Both provisions are long‑term in nature. The bank no longer offers mortgage loans to employees. Other provisions are related to commitments and guarantees.
31-12-2025 | 31-12-2024 | |
|---|---|---|
Restructuring provision | 15 | 1 |
Employee benefits provision | 1 | 2 |
Other provisions | 0 | 1 |
Total | 16 | 4 |
The movements in the present value of the provisions in relation to restructuring provisions, the defined benefit obligations for the mortgage interest rate discount and the vitality leave provision are as follows:
2025 | 2024 | 2025 | 2024 | 2025 | 2024 | 2025 | 2024 | |
|---|---|---|---|---|---|---|---|---|
Restructuring provision | Employee benefits provision | Other provisions | Total | |||||
Provision as at 1 January | 1 | 10 | 2 | 3 | 1 | 6 | 4 | 19 |
Utilised | -1 | -9 | -1 | -1 | 0 | 0 | -2 | -10 |
Additions | 15 | - | 0 | 0 | 0 | 0 | 15 | 0 |
Releases | - | - | 0 | 0 | -1 | -5 | -1 | -5 |
Provision as at 31 December | 15 | 1 | 1 | 2 | 0 | 1 | 16 | 4 |
22 Other liabilities
31-12-2025 | 31-12-2024 | |
|---|---|---|
Amounts received in advance | 141 | 152 |
Other liabilities | 39 | 78 |
Total | 180 | 230 |
Amounts received in advance consists of a compensation for the lower return on cash collateral payments that has been received due to a discounting switch from EONIA to €STR that has taken place at clearing houses as part of the Interest Rate Benchmark Reform in 2020. This compensation is amortised over the weighted average of underlying derivatives at the moment of the switch. EUR 11 million will be amortised in the next year (2024: EUR 11 million).
The remaining other liabilities are mainly composed of amounts payable related to derivatives and other financial transactions which are settled in the next period.
Lease liability for right-of-use assets
The following amounts represent the future lease liabilities for the right-of-use assets:
in thousands | 2025 | 2024 | ||
|---|---|---|---|---|
Maturity | Property-lease | Car-lease | Property-lease | Car-lease |
within 1 year | 835 | 602 | 1,049 | 555 |
1 to 2 years | - | 519 | 379 | 469 |
2 to 3 years | - | 455 | - | 428 |
3 to 4 years | - | 101 | - | 221 |
4 to 5 years | - | - | - | - |
More than 5 years | - | - | - | - |
Total lease liabilities | 835 | 1,677 | 1,428 | 1,673 |
23 Group equity
Since BNG has no minority interests after consolidation, the entire consolidated equity, excluding Additional Tier 1 capital, is attributable to shareholders. The items included in equity are explained in note 23 of the company financial statements.
31-12-2025 | 31-12-2024 | |
|---|---|---|
Share capital | 139 | 139 |
Share premium reserve | 6 | 6 |
Revaluation reserve | 17 | -172 |
Cash flow hedge reserve | -13 | 9 |
Own Credit Adjustment | 6 | 9 |
Cost of hedging | -2 | 94 |
Retained earnings | 4,229 | 4,089 |
Unappropriated profit | 172 | 294 |
Equity attributable to shareholders | 4,554 | 4,468 |
Additional Tier 1 capital | 309 | 309 |
Total | 4,863 | 4,777 |
2025 | 2024 | |
|---|---|---|
Number of paid-up shares outstanding | 55,690,720 | 55,690,720 |
Proposed dividend per share in euros | 1.41 | 2.51 |
Proposed dividend pursuant to the Articles of Association | 79 | 140 |
The proposed dividend distribution for 2025 is EUR
Share capital
The authorised capital is divided into 100 million shares with a nominal value of EUR 2.50 each, of which 55,690,720 shares have been issued and fully paid up. The number of shares in circulation remained unchanged during the financial year. BNG and its subsidiaries hold no company shares. None of the shares carry preferential rights, nor are they subject to restrictions. There are no options that can be exercised to obtain entitlement to the issue of shares.
Share premium reserve
There were no movements in 2025 and 2024.
Revaluation reserve
At year-end 2025, the revaluation reserve includes EUR 264 million in unrealised value changes (2024: EUR 135 million), excluding the value of the hedged part of the interest-rate risk of interest-bearing securities involved in hedge accounting, which is a part of the Financial assets at fair value through other comprehensive income. The revaluation reserve has been adjusted for taxes. Upon the sale of these assets, the associated cumulative result recognised in equity is transferred to the income statement.
Cash flow hedge reserve
The effective portion of the unrealised changes in the value of derivatives involved in a cash flow hedge relationship, resulting from changes in the foreign exchange rates, are recognised in the cash flow hedge reserve. The cash flow hedge reserve is adjusted for taxes.
Own credit adjustment
The Own credit adjustment amounts to EUR 6 million net of taxes (2024: EUR 9 million). This adjustment relates to changes in credit risk of financial liabilities measured at fair value through the income statement.
Cost of hedging reserve
The cost of hedging reserve records movements in foreign currency basis spreads in cross currency swaps involved in hedge accounting and is amortised over the life of the hedge. The cumulative movements will reduce to nil by maturity of the hedging instrument.
Retained earnings
After determination of the distributable profit appropriation pursuant to the Articles of Association, the General Meeting of Shareholders decides which portion of the remaining profit is added to the Retained earnings. In 2025, payment of dividend of EUR 140 million for 2024 to the bank’s shareholders were scheduled. Payments took place in April 2025 and an amount of EUR 14 million (before tax) was distributed to the holders of the Additional Tier 1 capital in 2025 (2024: EUR 15 million) and charged to the Retained earnings.
Unappropriated profit
The balance sheet is prepared prior to profit appropriation. This item represents the total result achieved after deduction of corporate income tax.
Additional Tier 1 capital
As per 31 December 2025 the bank’s Additional Tier 1 capital amounts to EUR 309 million. The instruments are structured in line with CRR requirements and the EBA guidelines and qualify as Additional Tier 1 capital. Additional Tier 1 capital concerns perpetual loans involving an annual non-cumulative discretionary payment on the outstanding principal amount, subject to temporary write-down in the event that the CET1 ratio falls below 5.125%. In case of write-down, this amount will be transferred to the Retained earnings. Write-down from the Retained earnings can be reversed (write-up) under certain conditions at the moment that the trigger ratio is back above 5.125% again. BNG is entitled to distribute the interest payment on a discretionary basis in the form of a compensation charged to the retained earnings. The compensation is determined on the basis of the prevailing principal amount. The distributed compensation is deductible for corporate income tax. BNG has the unilateral contractual option to call the Additional Tier 1 capital issued. The tranches issued in 2016 (a nominal amount of EUR 309 million) can be redeemed every year from May 2022. The bank chose not to redeem the tranche in 2025.
24 Interest result
Interest revenue calculated by using the effective interest method includes all positive interest results from both financial instruments and derivatives involved in hedge accounting, including negative interest expenses on financial liabilities. In addition, other credit-related income received is included in this item. Interest revenues on assets that were subject to impairment are recognised on the original effective interest percentage, as long as the expected interest cash flows are received.
Interest expenses calculated by using the effective interest method include all negative interest results from both traditional financial instruments and derivatives involved in hedge accounting, including negative interest revenue on financial assets. The costs of borrowing as well as other interest-related charges are also recognised as interest expenses calculated by using the effective interest method.
Other interest revenue and expenses consist mainly of interest results of derivatives not involved in hedge accounting and interest results of financial assets and liabilities measured at fair value.
2025 | 2024 | |||
|---|---|---|---|---|
Interest revenue | ||||
Interest revenue calculated by using the effective interest method: | ||||
- Financial assets at amortised cost | 3,009 | 3,425 | ||
- Financial assets at fair value through other comprehensive income | 287 | 251 | ||
- Derivatives involved in hedge accounting | 1,897 | 2,990 | ||
- Negative interest expenses on financial liabilities | 15 | 25 | ||
5,208 | 6,691 | |||
Other interest revenue: | ||||
- Financial assets designated at fair value through the income statement | 26 | 40 | ||
- Financial assets mandatory at fair value through the income statement | 1 | 1 | ||
- Derivatives not involved in hedge accounting | 200 | 201 | ||
- Other | 13 | 13 | ||
240 | 255 | |||
Total interest revenue | 5,448 | 6,946 | ||
Interest expenses | ||||
Interest expenses calculated by using the effective interest method: | ||||
- Financial liabilities at amortised cost | 3,059 | 3,177 | ||
- Derivatives involved in hedge accounting | 1,802 | 3,050 | ||
- Interest expenses on financial assets | 40 | 121 | ||
4,901 | 6,348 | |||
Other interest expenses | ||||
- Financial liabilities designated at fair value through the income statement | 8 | 9 | ||
- Derivatives not involved in hedge accounting | 33 | 43 | ||
- Other | 10 | 10 | ||
51 | 62 | |||
Total interest expenses | 4,952 | 6,410 | ||
Total interest result | 496 | 536 | ||
25 Commission result
Commission income
This item includes income from services provided to third parties.
2025 | 2024 | |
|---|---|---|
Income from loans and credit facilities | 16 | 24 |
Income from payment services | 9 | 10 |
Total | 25 | 34 |
Commission expenses
This item comprises expenses totalling EUR 2 million (2024: EUR 4 million) relating to services rendered by third parties in relation to loans, credit facilities and payment services.
26 Result on financial transactions
This item includes the result on financial transactions broken down into realised and unrealised market value adjustments.
2025 | 2024 | |||
|---|---|---|---|---|
Market value changes in financial assets at fair value through the income statement resulting from changes in credit and liquidity spreads, consisting of: | ||||
- Interest-bearing securities | 1 | 5 | ||
- Structured loans | 2 | -7 | ||
3 | -2 | |||
Result on hedge accounting | ||||
- Portfolio fair value hedge accounting | -78 | 39 | ||
- Micro fair value hedge accounting | 34 | -46 | ||
- Micro cash flow hedge accounting | 0 | 1 | ||
-44 | -6 | |||
Change in counterparty credit risk of derivatives (CVA/DVA) | 8 | -2 | ||
Realised sales and buy-out results | -6 | -18 | ||
Other market value changes | 8 | 13 | ||
Total | -31 | -15 | ||
The result from market value changes in financial assets at fair value through the income statement increased to EUR 3 million positive in 2025 (2024: EUR 2 million negative). Lower credit and liquidity spreads had a positive impact on the market value changes of interest-bearing securities compared to 2024.
The result on hedge accounting contains the fair value movements of the derivatives in hedge accounting relationships and the fair value movements of the hedged items. The result decreased to EUR 44 million negative in 2025 (2024: EUR 6 million negative). The result on hedge accounting is due to ineffectiveness of hedge relationships. This is due to increased long term interest rates, volatile foreign currencies, realised sales of interest-bearing securities.
The realised sales and buy-out results of EUR 6 million negative (2024: 18 million negative) are mainly due to on balance results on the sales of interest-bearing securities from the liquidity portfolio of the bank.
27 Other results
The other results of EUR 0.4 million (2024: EUR 1 million) consist mainly of income from consultancy services provided by BNG Gebiedsontwikkeling B.V.
28 Staff costs
2025 | 2024 | |
|---|---|---|
Wages and salaries | 51 | 48 |
Pension costs | 7 | 7 |
Social security costs | 6 | 5 |
Additions to the employee benefits provision | 0 | 0 |
External employees | 32 | 34 |
Other staff costs | 23 | 7 |
Total | 119 | 101 |
The increase in staff costs is mainly due to the increase in the number of internal employees during 2025. Expressed in FTEs, the number of employees with a fixed or indefinite contract at year-end 2025 is 503.5 FTE (2024: 479.9 FTEs).
There was no variable remuneration of identified staff members in 2025 and 2024. We refer to section 'Related parties' for the remuneration of the Executive Committee.
Other staff costs includes the reorganisation provision of EUR 15 million recognised in 2025. See note 21 Provisions for more information.
29 Other administrative expenses
These expenses include, among other things, outsourcing costs, maintenance costs of property and equipment, consultancy costs, training expenses and IT expenses. The total other administrative expenses for 2025 amounted to EUR 52 million (2024: EUR 47 million).
The fees paid to independent auditors are also included in Other administrative expenses.
In conformity with Section 382a of Part 9, Book 2 of the Dutch Civil Code, a breakdown of the fees paid to the independent auditors for audits and audit-related and non-audit-related services is given in note 34 to the consolidated financial statements.
30 Depreciation
A breakdown of this item is included in the note on Property and equipment (note 11). In total, the depreciation charges amounted to EUR 2 million in 2025 (2024: EUR 4 million).
31 Net impairment results on financial assets
The impairments in 2025 amounted to an expense of EUR 41 million in the income statement (2024: EUR 35 million income).
Per December 2025 BNG applied a Project Finance overlay which led to an impairment expense of EUR 7 million per December 2025. The Project Finance rating model was found to underestimate credit risk. A credit rating adjustment has been applied in Q4 2025 whereby all Project Finance exposures are downgraded by three rating notches. This adjustment aligns model‑implied probabilities of default with observed defaults over the period 2022–2024. This change results in an estimated increase in expected credit losses of approximately EUR 7 million and due to this downgrade, part of the loans moved to stage 2.
Also per December 2025 BNG impaired 37 million of Solar farm exposures. This due to worsening market conditions in the renewables sector.
2025 | ||||
|---|---|---|---|---|
Stage 1 | Stage 2 | Stage 3 | Total | |
Impairment results due to movements in allowances: | ||||
- Increases in allowances due to origination and acquisition | 1 | 0 | 12 | 13 |
- Changes in allowances due to changes in credit risk (net) | 1 | 14 | 33 | 48 |
- Decreases in allowances due to derecognition | 0 | -1 | -21 | -22 |
2 | 13 | 24 | 39 | |
Impairment results not due to movements in allowances: | ||||
- Impairment result due to closings (no write-off) | - | - | 1 | 1 |
- Reversal of impairment due to cash flows received from past write-offs | - | - | 0 | 0 |
- | - | 1 | 1 | |
Net impairment result on financial assets | 2 | 13 | 25 | 40 |
2024 | ||||
|---|---|---|---|---|
Stage 1 | Stage 2 | Stage 3 | Total | |
Impairment results due to movements in allowances: | ||||
- Increases in allowances due to origination and acquisition | 1 | 0 | 0 | 1 |
- Changes in allowances due to changes in credit risk (net) | -2 | -5 | 3 | -4 |
- Decreases in allowances due to derecognition | -1 | -1 | -20 | -22 |
-2 | -6 | -17 | -25 | |
Impairment results not due to movements in allowances: | ||||
- Reversal of impairment due to cash flows received from past write-offs | - | - | -5 | -5 |
- Impairments due to write-offs | - | - | -5 | -5 |
- | - | -10 | -10 | |
Net impairment result on financial assets | -2 | -6 | -27 | -35 |
Movement in allowances for expected credit losses
2025 | ||||
|---|---|---|---|---|
Stage 1 | Stage 2 | Stage 3 | Total | |
Impairment results due to movements in allowances: | ||||
- Increases in allowances due to origination and acquisition | 1 | 0 | 12 | 13 |
- Changes in allowances due to changes in credit risk (net) | 1 | 14 | 33 | 48 |
- Decreases in allowances due to derecognition | 0 | -1 | -21 | -22 |
- Decreases in allowance due to write-offs | - | - | 0 | 0 |
Total movements in allowances | 2 | 13 | 24 | 39 |
2024 | ||||
|---|---|---|---|---|
Stage 1 | Stage 2 | Stage 3 | Total | |
- Increases in allowances due to origination and acquisition | 1 | 0 | 0 | 1 |
- Changes in allowances due to changes in credit risk (net) | -2 | -5 | 3 | -4 |
- Decreases in allowances due to derecognition | -1 | -1 | -23 | -25 |
- Decreases in allowance due to write-offs | - | - | -19 | -19 |
Total movements in allowances | -2 | -6 | -39 | -47 |
Note 38 provides an overview of the breakdown of financial assets subject to impairment into impairment stages.
32 Net impairment losses on joint ventures
2025 | 2024 | |
|---|---|---|
Impairment of joint ventures | 0 | 1 |
Reversal of impairment of joint ventures | -2 | - |
Total | -2 | 1 |
In 2025, impairments on BNG Gebiedsontwikkeling B.V. participations amounted EUR 0 million (2024: EUR 1 million). The reversal of the impairment is EUR 2 mln. All participations are valued on a going concern basis.
33 Contribution to resolution fund and bank levy
Contribution to resolution fund
The European resolution regime arising from the Bank Recovery and Resolution Directive entered into force on 1 January 2015. The expenses for the resolution fund are deductible for corporate income tax purposes. No contribution was done in 2024 and 2025 as the Single Resolution Funds reached its target at the end of 2023.
Bank levy
The expenses concerning the bank levy are not deductible for corporate income tax purposes. As a consequence, the effective tax burden exceeds the nominal tax rate in 2025 and 2024. BNG is due to pay the bank levy in October of every year, which for 2025 amounted to EUR 36 million (2024: EUR 31 million). The increase is caused by a higher balance sheet total as at 31 December 2024. The calculation of the levy is stated in note 32 of the Company financial statements.
34 Fees of independent auditors
The following audit fees were reported in the income statement:
(amounts in thousands of euros) | 2025 | 2024 |
|---|---|---|
Audit of the financial statements | 1,390 | 1,022 |
Other audit services | 331 | 245 |
Tax services | - | - |
Other non-audit services | - | - |
Total | 1,721 | 1,267 |
The fees listed above relate to the procedures applied to the Company and its consolidated group entities by accounting firms and external independent auditors as referred to in Section 1, subsection 1 of the Audit Firms Supervision Act (‘Wet toezicht accountantsorganisaties – Wta’).
In the case of BNG this is only applicable to Dutch based accounting firms (PwC the Netherlands accountants (‘PwC NL’), including its tax services and advisory groups) as BNG does not make use of foreign based accounting firms. The audit fees relate to the audit of the 2025 financial statements, regardless of whether the work was performed during the financial year.
Summary of services rendered by the independent auditor, in addition to the audit of the financial statements
Our independent auditor, PwC NL, has rendered, for the period to which our statutory audit relates, in addition to the audit of the statutory financial statements the following services to the company and its controlled entities:
Other audit services required by law or regulatory requirements
Statutory audits of controlled entities;
Review of interim financial statements;
Audit of the regulatory returns for the Dutch Central Bank;
Assurance engagement credit claims for the Dutch Central Bank.
Other audit services
Assurance engagement on the sustainability report;
Comfort letters on annual update of debt issuance prospectus and drawdowns under the debt issuance programme;
Assurance engagement on the Deposit Garantee Scheme requirements.
35 Breakdown of balance sheet value by remaining contractual maturity of financial instruments
31-12-2025 | ||||||
|---|---|---|---|---|---|---|
Due on demand | up to 3 months | 3 - 12 months | 1 - 5 years | over 5 years | Total | |
Cash and balances held with central banks | 131 | 1,700 | - | - | - | 1,831 |
Amounts due from banks | 2 | 7 | 80 | 339 | 276 | 704 |
Cash collateral posted | - | 3,721 | - | - | - | 3,721 |
Financial assets at fair value through the income statement | - | - | 82 | - | 203 | 285 |
Derivatives | - | 10 | 53 | 356 | 1,719 | 2,138 |
Financial assets at fair value through other comprehensive income | - | 131 | 229 | 6,393 | 5,042 | 11,795 |
Interest-bearing securities at amortised cost | - | 128 | 0 | 1,018 | 6,959 | 8,105 |
Loans and advances | 514 | 2,008 | 6,481 | 23,628 | 64,996 | 97,627 |
Value adjustments on loans in portfolio hedge accounting | - | 0 | -7 | -261 | -10,445 | -10,713 |
Current tax assets | - | - | - | - | - | - |
Other assets | - | 24 | - | - | - | 24 |
Total assets | 647 | 7,729 | 6,918 | 31,473 | 68,750 | 115,517 |
Amounts due to banks | - | 421 | - | 295 | 388 | 1,104 |
Cash collateral received | - | 710 | - | - | - | 710 |
Financial liabilities at fair value through the income statement | - | - | - | 61 | 171 | 232 |
Derivatives | - | 127 | 363 | 1,697 | 2,822 | 5,009 |
Debt securities | - | 3,931 | 9,483 | 39,082 | 41,884 | 94,380 |
Funds entrusted | 3,415 | 1,513 | 494 | 988 | 2,606 | 9,016 |
Subordinated debt | - | - | 10 | 11 | - | 21 |
Current tax liabilities | - | 30 | - | - | - | 30 |
Deferred tax liabilities | - | - | - | 1 | 2 | 3 |
Provisions | - | - | 16 | - | - | 16 |
Other liabilities | - | 61 | 7 | 11 | 101 | 180 |
Total liabilities | 3,415 | 6,793 | 10,373 | 42,146 | 47,974 | 110,701 |
31-12-2024 | ||||||
|---|---|---|---|---|---|---|
Due on demand | up to 3 months | 3 - 12 months | 1 - 5 years | over 5 years | Total | |
Cash and balances held with central banks | 424 | 6,201 | - | - | - | 6,625 |
Amounts due from banks | 2 | 19 | 76 | 344 | 363 | 804 |
Cash collateral posted | - | 3,545 | - | - | - | 3,545 |
Financial assets at fair value through the income statement | - | 11 | - | 84 | 662 | 757 |
Derivatives | - | 359 | 634 | 1,135 | 1,851 | 3,979 |
Financial assets at fair value through other comprehensive income | - | 109 | 432 | 4,602 | 6,179 | 11,322 |
Interest-bearing securities at amortised cost | - | 0 | 114 | 1,041 | 7,978 | 9,133 |
Loans and advances | 399 | 1,394 | 6,234 | 22,553 | 63,957 | 94,537 |
Value adjustments on loans in portfolio hedge accounting | - | -1 | -8 | -154 | -2,790 | -2,953 |
Current tax assets | - | 55 | 0 | - | - | 55 |
Other assets | - | 104 | - | - | - | 104 |
Total assets | 825 | 11,796 | 7,482 | 29,605 | 78,200 | 127,908 |
Amounts due to banks | 0 | 917 | - | 150 | 572 | 1,639 |
Cash collateral received | - | 1,533 | - | - | - | 1,533 |
Financial liabilities at fair value through the income statement | - | 22 | - | 67 | 165 | 254 |
Derivatives | - | 18 | 185 | 634 | 4,709 | 5,546 |
Debt securities | - | 8,692 | 12,673 | 38,229 | 43,789 | 103,383 |
Funds entrusted | 3,857 | 1,741 | 851 | 1,300 | 2,768 | 10,517 |
Subordinated debt | - | - | - | 19 | - | 19 |
Deferred tax liabilities | - | - | 2 | 8 | 29 | 39 |
Provisions | - | - | - | 4 | - | 4 |
Other liabilities | - | 88 | 8 | 26 | 108 | 230 |
Total liabilities | 3,857 | 13,011 | 13,719 | 40,437 | 52,140 | 123,164 |
36 Breakdown of financial instruments by category
31-12-2025 | ||||
|---|---|---|---|---|
Amortised cost | Fair value through profit or loss | Fair value through other comprehensive income | Total | |
Cash and balances held with central banks | 1,831 | - | - | 1,831 |
Amounts due from banks | 704 | - | - | 704 |
Cash collateral posted | 3,721 | - | - | 3,721 |
Financial assets at fair value through the income statement | - | 285 | - | 285 |
Derivatives | - | 2,138 | - | 2,138 |
Financial assets at fair value through other comprehensive income | - | - | 11,795 | 11,795 |
Interest-bearing securities at amortised cost | 8,105 | - | - | 8,105 |
Loans and advances | 97,627 | - | - | 97,627 |
Value adjustments on loans in portfolio hedge accounting | -10,713 | - | - | -10,713 |
Total assets | 101,275 | 2,423 | 11,795 | 115,493 |
Amounts due to banks | 1,104 | - | - | 1,104 |
Cash collateral received | 710 | - | - | 710 |
Financial liabilities at fair value through the income statement | - | 232 | - | 232 |
Derivatives | - | 5,009 | - | 5,009 |
Debt securities | 94,380 | - | - | 94,380 |
Funds entrusted | 9,016 | - | - | 9,016 |
Subordinated debt | 21 | - | - | 21 |
Total liabilities | 105,231 | 5,241 | - | 110,472 |
31-12-2024 | ||||
|---|---|---|---|---|
Amortised cost | Fair value through profit or loss | Fair value through other comprehensive income | Total | |
Cash and balances held with central banks | 6,625 | - | - | 6,625 |
Amounts due from banks | 804 | - | - | 804 |
Cash collateral posted | 3,545 | - | - | 3,545 |
Financial assets at fair value through the income statement | - | 757 | - | 757 |
Derivatives | - | 3,979 | - | 3,979 |
Financial assets at fair value through other comprehensive income | - | - | 11,322 | 11,322 |
Interest-bearing securities at amortised cost | 9,133 | - | - | 9,133 |
Loans and advances | 94,537 | - | - | 94,537 |
Value adjustments on loans in portfolio hedge accounting | -2,953 | - | - | -2,953 |
Total assets | 111,691 | 4,736 | 11,322 | 127,749 |
Amounts due to banks | 1,639 | - | - | 1,639 |
Cash collateral received | 1,533 | - | - | 1,533 |
Financial liabilities at fair value through the income statement | - | 254 | - | 254 |
Derivatives | - | 5,546 | - | 5,546 |
Debt securities | 103,383 | - | - | 103,383 |
Funds entrusted | 10,517 | - | - | 10,517 |
Subordinated debt | 19 | - | - | 19 |
Total liabilities | 117,091 | 5,800 | - | 122,891 |
37 Reconciliation of movements of liabilities to cash flows arising from financing activities
2025 | |||||
|---|---|---|---|---|---|
Financial liabilities at fair value through the income statement | Debt securities | Sub- ordinated debt | Additional Tier 1 capital | Total | |
Balance at 1 January 2025 | 254 | 103,383 | 19 | 309 | 103,965 |
Cash flows from financing activities | |||||
- Proceeds from financing activities | 10 | 315,887 | - | - | 315,897 |
- Repayments on financing activities | -6 | -320,836 | - | - | -320,842 |
- Interest and other cash flows | -21 | -1,778 | - | - | -1,799 |
- Compensation on Additional Tier 1 capital | - | - | - | -14 | -14 |
-17 | -6,727 | - | -14 | -6,758 | |
Non-cash changes | |||||
Unrealised results: | |||||
- Foreign exchange movement | -3 | -839 | - | - | -842 |
- Fair value changes | -10 | -4,006 | - | - | -4,016 |
Realised results | 8 | 2,569 | 2 | - | 2,579 |
Movement to Other liabilities (derecognised but not yet repaid) | - | 0 | - | - | - |
-5 | -2,276 | 2 | - | -2,279 | |
Compensation distributed from Retained earnings | 14 | 14 | |||
Balance at 31 December 2025 | 232 | 94,380 | 21 | 309 | 94,942 |
2024 | |||||
|---|---|---|---|---|---|
Financial liabilities at fair value through the income statement | Debt securities | Sub- ordinated debt | Additional Tier 1 capital | Total | |
Balance at 1 January 2024 | 260 | 93,039 | 18 | 309 | 93,626 |
Cash flows from financing activities | |||||
- Proceeds from financing activities | - | 342,715 | - | - | 342,715 |
- Repayments on financing activities | -1 | -337,080 | - | - | -337,081 |
- Interest and other cash flows | -6 | -1,456 | - | - | -1,462 |
- Compensation on Additional Tier 1 capital | - | - | - | -15 | -15 |
-7 | 4,179 | - | -15 | 4,157 | |
Non-cash changes | |||||
Unrealised results: | |||||
- Foreign exchange movement | -3 | 1,820 | - | - | 1,817 |
- Fair value changes | -5 | 1,825 | - | - | 1,820 |
Realised results | 9 | 2,520 | 1 | - | 2,530 |
Movement to Other liabilities (derecognised but not yet repaid) | - | - | - | - | - |
1 | 6,165 | 1 | - | 6,167 | |
Compensation distributed from Retained earnings | 15 | 15 | |||
Balance at 31 December 2024 | 254 | 103,383 | 19 | 309 | 103,965 |
38 Impairment of financial assets and off-balance sheet commitments
Breakdown of financial assets and off-balance sheet commitments into impairment stages
The following tables provide a breakdown of the financial assets subject to impairment and off-balance sheet commitments into the 3 impairment stages:
Stage 1: performing exposures without significant increase in credit risk (SICR) since initial recognition.
Stage 2: performing exposures with significant increase in credit risk since initial recognition.
Stage 3: non-performing exposures.
The allowance for credit loss for financial assets at fair value through other comprehensive income is included in the comprehensive income and not in the (net) carrying amount.
31-12-2025 | |||||||
|---|---|---|---|---|---|---|---|
Gross carrying amount | Allowance for credit loss | ||||||
Carrying amount | Performing | Non-performing | Performing | Non-performing | |||
Stage 1 | Stage 2 | Stage 3 | Stage 1 | Stage 2 | Stage 3 | ||
Financial assets subject to impairment | |||||||
Cash and balances held with central banks | 1,831 | 1,831 | - | - | - | - | - |
Amounts due from banks | 704 | 704 | - | - | 0 | - | - |
Cash collateral posted | 3,721 | 3,721 | - | - | - | - | - |
Financial assets at fair value through other comprehensive income | 11,795 | 11,795 | - | - | - | - | - |
Interest-bearing securities at amortised cost | 8,105 | 8,105 | - | - | 0 | - | - |
Loans and advances | 97,627 | 96,489 | 885 | 351 | -4 | -23 | -71 |
Total | 123,783 | 122,645 | 885 | 351 | -4 | -23 | -71 |
31-12-2024 | |||||||
|---|---|---|---|---|---|---|---|
Gross carrying amount | Allowance for credit loss | ||||||
Carrying amount | Performing | Non-performing | Performing | Non-performing | |||
Stage 1 | Stage 2 | Stage 3 | Stage 1 | Stage 2 | Stage 3 | ||
Financial assets subject to impairment | |||||||
Cash and balances held with central banks | 6,625 | 6,625 | - | - | - | - | - |
Amounts due from banks | 804 | 804 | - | - | 0 | - | - |
Cash collateral posted | 3,545 | 3,545 | - | - | - | - | - |
Financial assets at fair value through other comprehensive income | 11,322 | 11,322 | - | - | - | - | - |
Interest-bearing securities at amortised cost | 9,133 | 9,133 | - | - | 0 | - | - |
Loans and advances | 94,537 | 93,534 | 600 | 460 | -3 | -10 | -44 |
Total | 125,966 | 124,963 | 600 | 460 | -3 | -10 | -44 |
31-12-2025 | ||||||
|---|---|---|---|---|---|---|
Nominal amount | Provision | |||||
Performing | Non-performing | Performing | Non-performing | |||
Stage 1 | Stage 2 | Stage 3 | Stage 1 | Stage 2 | Stage 3 | |
Off-balance sheet commitments | ||||||
Contingent liabilities | 442 | 1 | 0 | 0 | 0 | - |
Revocable facilities | 5,117 | 63 | 23 | - | - | - |
Irrevocable facilities | 2,413 | 1 | 0 | 0 | 0 | - |
Total | 7,972 | 65 | 23 | 0 | 0 | - |
31-12-2024 | ||||||
|---|---|---|---|---|---|---|
Nominal amount | Provision | |||||
Performing | Non-performing | Performing | Non-performing | |||
Stage 1 | Stage 2 | Stage 3 | Stage 1 | Stage 2 | Stage 3 | |
Off-balance sheet commitments | ||||||
Contingent liabilities | 499 | 0 | 1 | - | - | -1 |
Revocable facilities | 5,296 | 72 | 14 | - | - | - |
Irrevocable facilities | 3,168 | 0 | 6 | - | - | - |
Total | 8,963 | 72 | 21 | - | - | -1 |
Movements in allowances and provisions for expected credit losses
The following table shows the movements in allowances for expected credit losses for financial assets and the provision for expected credit losses for off-balance sheet commitments.
2025 | ||||||
|---|---|---|---|---|---|---|
Opening balance | Increases due to origination and acqui- sition | Decrease due to derecog- nition repayments and disposals | Changes due to change in credit risk (net) | Decrease in allowance account due to write-offs | Closing balance | |
Allowances | ||||||
Cash and balances held with central banks | - | - | - | - | - | - |
Amounts due from banks | 0 | - | 0 | 0 | - | 0 |
Financial assets at fair value through other comprehensive income | 0 | 0 | 0 | 0 | - | 0 |
Interest-bearing securities at amortised cost | 0 | 0 | 0 | 0 | - | 0 |
Loans and advances | 57 | 13 | -20 | 48 | 0 | 98 |
57 | 13 | -20 | 48 | 0 | 98 | |
Provision | ||||||
Off-balance sheet commitments | 1 | 0 | -1 | 0 | - | 0 |
2024 | ||||||
|---|---|---|---|---|---|---|
Opening balance | Increases due to origination and acqui- sition | Decrease due to derecog- nition repayments and disposals | Changes due to change in credit risk (net) | Decrease in allowance account due to write-offs | Closing balance | |
Allowances | ||||||
Cash and balances held with central banks | - | - | - | - | - | 0 |
Amounts due from banks | 0 | 0 | 0 | 0 | - | 0 |
Financial assets at fair value through other comprehensive income | 0 | 0 | 0 | 0 | - | 0 |
Interest-bearing securities at amortised cost | 1 | 0 | 0 | -1 | - | 0 |
Loans and advances | 99 | 0 | -25 | 2 | -19 | 57 |
100 | 0 | -25 | 1 | -19 | 57 | |
Provision | ||||||
Off-balance sheet commitments | 6 | 0 | 0 | -5 | - | 1 |
Modifications of contractual cash flows
There were no financial assets for which the contractual cash flows have been modified during 2025 while they had a loss allowance measured at an amount equal to lifetime expected credit loss (i.e. stage 2 or 3). No financial assets which were modified in previous reporting periods while they had a loss allowance measured at an amount equal to lifetime expected credit loss (stage 2 or 3) have been moved back to stage 1 during 2025.
Key inputs and assumptions
The Expected Credit Loss (ECL) of the financial asset is measured on either a 12-month or lifetime basis depending on whether a significant increase in credit risk has occurred. The total Expected Credit Loss is a discounted product of the Probability of Default (PD), Loss Given Default (LGD) and Exposure At Default (EAD).
Probability of default
PDs are used as a key component in the determination of ECLs and SICR. BNG has developed PD-models, largely based on expert judgements, for exposures for which no external rating is available. To ensure IFRS 9 compliance and so-called ‘point-in-time’ PDs, the bank developed overlay models that include Forward-Looking Information (FLI). For staging purposes, credit ratings are used which are adjusted for forward-looking information. BNG applies three internally developed scenarios based on economic forecasts which are consistent with inputs to other relevant estimates within the financial statements. The proposed macro economic forecasts are benchmarked with an external macro economic forecast to ensure the external validity of the scenarios. The scenarios are approved in the Asset and Liability Committee (ALCO). In doing so, BNG ensures that the PDs are reasonable and supportable.
Loss given default
Because of its low default credit portfolio and the lack of historical internal LGD data, BNG is not able to create LGD models. Therefore, BNG applies a basic flat LGD approach, with four different LGD percentages for its entire exposure:
0% for exposures granted to or guaranteed by (Dutch) central or regional governments;
10% for government bonds issued by central or regional governments in the EU;
35% for exposure without a guarantee of a central or regional government and senior unsecured bonds; and
75% for subordinated loans.
Exposure at default
The EAD for loans and for interest-bearing securities (excluding securitisations) is based on contractual repayments owed by the obligor over a 12-month or lifetime period. Voluntary repayments or early redemptions are not taken into account, as these are historically infrequent. For securitisations, the future contractual repayments are based on estimated Constant Prepayment Rates which are derived from external sources. In case of committed (off-balance sheet) facilities, the maximum exposure is adjusted in order to reflect the expected drawdown behaviour for either a 12-month or lifetime period (in accordance with the impairment stage).
Significant increase in credit risk
BNG applies the Point-in-Time PD, which is adjusted for forward-looking information, as an input parameter for the assessment of significant changes in credit risk since recognition. In addition, the bank uses forbearance measures as well as a 30-day past-due period as backstop criteria to determine a significant increase in credit risk. On the other hand, the bank also applies a low credit risk exemption for monitoring significant changes in credit risk since recognition. In this case, an impairment is measured using the 12-month ECL, without determining if a significant increase in credit risk has occurred.
Part of the Project FInance portfolio has increased due to an overlay and moved to stage 2. For the impairment a lifetime ECL is calculated.
BNG will consider financial assets with an investment grade rating to be of ‘low credit risk’. For bonds, BNG considers a BBB- or higher to be an investment grade. With regards to loans, the bank uses its internal counterparty credit rating to determine whether it is investment grade. Internal counterparty credit ratings are derived from a number of market sector specific internal rating models, which have been externally validated.
BNG applies an expert judgement approach when determining the stage 3 impairment figures. The approach is performed on an instrument level by the Financial Restructuring & Recovery department.
Forward-looking macro economic information
Historical analyses are performed to identify the key macro economic variables, which are provided by Moody's Analytics. In 2025 the macro economic factors applied in determining the probability of default for securitisations are the purchasing power parity conversion factor to official exchange ratio, the unemployment rate, and the real net exports of goods and services. For government bonds, the representative credit default swap is used. For products that do not fall under either securitisations or government bonds, the non-accelerating inflation rate of unemployment, the interest rate on 30-year government bonds, and the compensation of employees are applied.
Impact of inflation
The impact of high inflation and increased economic uncertainty is reflected in the decrease of domestic spending and use of consumable goods. In 2025 there were no significant events related to inflation in the sectors in which the bank operates or to individual clients relating to BNG’s client portfolio. However, the bank closely monitors the impact of inflation, in particular the healthcare and energy sectors receive additional attention.
Impact of climate-related matters
BNG has started to incorporate ESG credit risks in the internal control and risk management framework. To identify the material sectors for monitoring purposes, the bank is conducting an analysis per sector in which it operates, to define the material ESG-related credit risks. So far, the analysis demonstrates that most ESG-related credit risks are related to emissions and energy. BNG has not identified material impairment indications with respect to ESG risks. However, the bank has improved the model, and includes climate-related risks in the ECL calculation in the last quarter of 2025.
Government Bonds | ||
|---|---|---|
Macro economic variable | Horizon as at 31-12-2025 | Horizon as at 31-12-2024 |
Average CDS spread of 5 European governments | 3 years | 3 years |
Scenario | Weighting as at 31-12-2025 | Weighting as at 31-12-2024 |
Base scenario | 46% | 46% |
Upward scenario | 27% | 27% |
Downward scenario | 27% | 27% |
Securitisations | ||
|---|---|---|
Macro economic variable | Horizon as at 31-12-2025 | Horizon as at 31-12-2024 |
Purchasing power parity conversion factor to official exchange ratio (Eurozone) | 3 years | 3 years |
Unemployment Rate (Eurozone) | 3 years | 3 years |
Real net exports of goods and services (Eurozone) | 3 years | 3 years |
Scenario | Weighting as at 31-12-2025 | Weighting as at 31-12-2024 |
Base scenario | 46% | 46% |
Upward scenario | 27% | 27% |
Downward scenario | 27% | 27% |
Lending | ||
|---|---|---|
Macro economic variable | Horizon as at 31-12-2025 | Horizon as at 31-12-2024 |
Non-accelerating inflation rate of unemployment (NL) | 3 years | 3 years |
Interest rate on government bonds 30y (NL) | 3 years | 3 years |
Compensation of employees (NL) | 3 years | 3 years |
Scenario | Weighting as at 31-12-2025 | Weighting as at 31-12-2024 |
Base scenario | 46% | 46% |
Upward scenario | 27% | 27% |
Downward scenario | 27% | 27% |
Non-performing exposures
BNG applies the following criteria to designate exposures as non-performing:
BNG considers that the obligor is unlikely to pay its credit obligations to the bank; and
the obligor is past due 90 days or more on any material credit obligation to the bank.
The bank employs the following indicators for ‘Unlikeliness to pay’:
the obligor’s source of income is considered insufficient to meet its payment obligations;
there are indications that future cash flows are under pressure;
the obligor’s debt ratio has increased significantly;
one or more covenants have been breached;
BNG has called upon a guarantee or seized collateral;
significant delayed payments to other creditors (recorded in a register);
there is a crisis in the obligor’s market sector, in which the obligor is considered to be a weak party;
the obligor can no longer be active in its market sector as a result of its financial difficulties; and
another creditor has filed for the obligor’s bankruptcy.
Sensitivity analysis of credit loss allowances
In order to measure the sensitivity of the credit loss allowances to changes in the input factors, different scenarios are determined to (re)calculate the size of the credit loss allowances.
Scenario A:
In scenario A, the credit rating of all individual exposures subject to impairment are downgraded by 1 notch (e.g. from AAA to AA+). These (lower) credit ratings, as well as the accompanying PDs, are then applied in the staging assessment and the calculation of the credit loss allowances. As a result, a portion of the exposures migrated from stage 1 to stage 2. The EADs and LGDs are unchanged compared with the base line calculation.
Scenario B:
In scenario B, the exposures which normally have an LGD of 0% are assigned a 10% LGD. The LGD of exposures that are normally assigned a 10%, 35% or 75% LGD remain unchanged. The EADs, credit ratings and PDs are also unchanged compared with the base line calculation.
Scenario C:
In scenario C, the calculation of the credit loss allowances is performed using ‘Through-the-Cycle’ PDs rather than Point-in-Time PDs. In other words, PDs without incorporation of forward-looking macro economic information are used in the calculation. The EADs, credit ratings, stage levels and LGDs are unchanged compared with the base line calculation.
As per 31 December 2025 three different scenarios are used to calculate the sensitivity (in millions of euros) of the total credit loss allowances and are stated below.
31-12-2025 | ||||
|---|---|---|---|---|
Actual Balance | Scenario A | Scenario B | Scenario C | |
Allowances | ||||
Cash and balances held with central banks | - | - | - | - |
Amounts due from banks | 0 | 0 | 0 | 0 |
Financial assets at fair value through other comprehensive income | 0 | 0 | 0 | 0 |
Interest-bearing securities at amortised cost | 0 | 1 | 1 | 1 |
Loans and advances | 98 | 119 | 109 | 110 |
98 | 120 | 110 | 111 | |
Provision | ||||
Off-balance sheet commitments | 0 | 1 | 0 | 0 |
31-12-2024 | ||||
|---|---|---|---|---|
Actual Balance | Scenario A | Scenario B | Scenario C | |
Allowances | ||||
Cash and balances held with central banks | - | - | - | - |
Amounts due from banks | 0 | 0 | 0 | 0 |
Financial assets at fair value through other comprehensive income | 0 | 0 | 0 | 0 |
Interest-bearing securities at amortised cost | 0 | 1 | 0 | 1 |
Loans and advances | 57 | 69 | 67 | 62 |
57 | 70 | 67 | 63 | |
Provision | ||||
Off-balance sheet commitments | 1 | 2 | 2 | 1 |
Hedging of risks with derivatives
BNG applies economic hedging in order to mitigate foreign exchange risks and keep interest rate risks at a desired level. To this end, the bank has put in place a system of limits and procedures that is strictly adhered to and is monitored on a daily basis. Foreign exchange and interest rate risks are hedged with derivatives. The treatment of derivatives and hedged items in the balance sheet and income statement is such that they are aligned as much as possible with the actual economic hedging. For accounting purposes, BNG processes this hedging relationship under IFRS by applying micro and portfolio fair value hedging, as well as cash flow hedging. The Accounting principles for the consolidated financial statements section describes the conditions that need to be met before these forms of hedge accounting can be applied.
Micro fair value hedge accounting (MH) is applied to individual transactions involved in an economic hedge relationship to offset interest rate risks and foreign exchange risks . This form of hedging is applied to fixed rate loans, fixed rate interest-bearing securities, debt securities issued and funds entrusted with a maturity over one year. The foreign exchange risks and interest rate risks are hedged by means of (cross-currency) interest rate swaps. The issues are fully offset against the derivatives so that, on a net basis, the fixed coupons of the issues are converted into variable interest amounts in euros. Both the issues and the accompanying derivatives can contain structures, such as options, which are also fully offset. The revaluation effect of hedged MH transactions with regard to fair value hedging is accounted for in the same balance sheet item as the hedged items.
BNG applies (micro) cash flow hedge accounting to virtually all long-term funding transactions in foreign currencies with a floating coupon in order to protect the bank’s result against possible variability in future cash flows due to exchange rate fluctuations.
The bank applies cross currency swaps to hedge the foreign currency risk of the credit spread of fixed foreign currency transactions, and applies cash flow hedge accounting to these transactions. With the exception of voluntary early redemption of funding in foreign currencies or an immediate and complete withdrawal from the banking business, there are no circumstances under which these revaluations can lead to a realised result.
The cross currency basis swap spread is an important building block of the value of cross-currency (interest rate) swaps. The fluctuations of this basis spread can never be part of the hedge relationship. If micro hedging is applied the fluctuations of this basis spread are separated as ‘cost of hedging’ reserve within equity.
In portfolio fair value hedge accounting (PH), the interest rate risks of a group of transactions in euro are hedged by means of a group of derivatives. The hedging relationship is constructed and controlled at an aggregate level, thus precluding relationships with individual transactions. Within BNG, portfolio hedging, like micro hedging, has been highly effective. Any ineffectiveness that occurs is recognised in the income statement.
The effective part of PH is accounted for in the balance sheet item Value adjustments on loans in portfolio hedge accounting.
Although BNG uses derivatives for economic hedging purposes, it is not possible in all cases to include these in a hedge accounting relationship, as permitted by IFRS. In principle all derivatives that are not involved in a hedge accounting relationship are to economically hedge a financial instrument which is also recognised at fair value through the income statement. Consequently, in total, the volatility of the result due to interest rate and foreign exchange risks is limited.
The following table shows the maturity profile as at 31 December 2025 of all derivatives based on their notional amounts.
31-12-2025 | 31-12-2024 | |||||||
|---|---|---|---|---|---|---|---|---|
Up to 1 year | 1 to 5 years | Over 5 years | Total | Up to 1 year | 1 to 5 years | Over 5 years | Total | |
Derivatives involved in portfolio hedge accounting | ||||||||
Interest rate swaps | 10,533 | 85,030 | 107,640 | 203,203 | 6,485 | 31,885 | 106,271 | 144,641 |
Derivatives involved in micro hedge accounting | ||||||||
Interest rate swaps | 5,698 | 33,062 | 56,687 | 95,447 | 7,407 | 26,917 | 59,878 | 94,202 |
Cross-currency swaps | 8,930 | 16,764 | 6,233 | 31,927 | 5,919 | 20,350 | 6,080 | 32,349 |
Derivatives not involved in hedge accounting | ||||||||
Interest rate swaps | 1,346 | 195 | 375 | 1,916 | 13,541 | 212 | 524 | 14,277 |
Cross-currency swaps | 66 | 162 | 36 | 264 | 9 | 226 | 239 | 474 |
FX-swaps | 733 | - | - | 733 | 8,266 | - | - | 8,266 |
Other derivatives | 339 | 1,018 | 705 | 2,062 | 910 | 1,570 | 449 | 2,929 |
Total | 27,645 | 136,231 | 171,676 | 335,552 | 42,537 | 81,160 | 173,441 | 297,138 |
The following table shows the total notional amounts of the derivatives in relation to the fair value.
31-12-2025 | 31-12-2024 | |||
|---|---|---|---|---|
Notional amount | Fair value | Notional amount | Fair value | |
Derivatives involved in portfolio hedge accounting | ||||
Interest rate swaps | 128,611 | 4,082 | 123,972 | 5,772 |
Derivatives involved in micro hedge accounting | ||||
Interest rate swaps | 48,672 | -2,675 | 87,904 | -4,403 |
Cross-currency swaps | 6,360 | 704 | 23,480 | 2,149 |
Derivatives not involved in hedge accounting | ||||
Interest rate swaps | 1,121 | 21 | 13,341 | 11 |
Cross-currency swaps | 110 | 2 | 229 | 40 |
FX-swaps | 412 | 2 | 8,179 | 400 |
Other derivatives | 502 | 2 | 459 | 10 |
Total derivatives stated as assets | 185,788 | 2,138 | 257,564 | 3,979 |
Derivatives involved in portfolio hedge accounting | ||||
Interest rate swaps | 74,592 | -1,866 | 20,669 | 3,699 |
Derivatives involved in micro hedge accounting | ||||
Interest rate swaps | 46,775 | 4,291 | 6,298 | 364 |
Cross-currency swaps | 25,567 | 2,536 | 8,869 | 1,205 |
Derivatives not involved in hedge accounting | ||||
Interest rate swaps | 795 | 5 | 936 | 107 |
Cross-currency swaps | 154 | 18 | 245 | 123 |
FX-swaps | 321 | 3 | 87 | 3 |
Other derivatives | 1,560 | 22 | 2,470 | 45 |
Total derivatives stated as liabilities | 149,764 | 5,009 | 39,574 | 5,546 |
BNG receives collateral from counterparties with respect to credit risk on derivatives. As at 31 December 2025, this collateral amounted to EUR 710 million (2024: EUR 1,533 million), all in cash.
With regard to derivatives, BNG received EUR 5,958 million in collateral in 2025 (2024: provided EUR 8,249 million), of which EUR 2,344 million in cash (2024: provided EUR 1,973 million) and EUR 3,505 million in interest-bearing securities (2024: provided EUR 6,276 million).
Fair value hedge accounting
The following table shows the changes in fair value of the hedged items and the hedging instruments due to fair value hedge accounting in the reporting period, used as the basis for recognising ineffectiveness.
31-12-2025 | |||||
|---|---|---|---|---|---|
Gross carrying amount | Accumulated amount | Gains/Losses attri-butable | Gains/Losses attri-butable | Hedge ineffect-iveness | |
Fair value hedges | |||||
Micro fair value hedges (hedged items stated as assets) | |||||
Fixed rate bonds in Financial assets at fair value through the income statement | 11,643 | -290 | -442 | 423 | -19 |
Fixed rate bonds in Interest-bearing securities at amortised cost | 3,373 | -817 | -521 | 510 | -11 |
Fixed rate bonds in Loans and advances | 9 | 0 | 0 | 0 | 0 |
15,025 | -1,107 | -963 | 933 | -30 | |
Micro fair value hedges (hedged items stated as liabilities) | |||||
Fixed rate loans in Amounts due to banks | -683 | 21 | 18 | -18 | 0 |
Fixed rate bonds in Debt securities | -92,199 | 5,706 | 3,692 | -3,628 | 64 |
Fixed rate loans in Funds entrusted | -2,878 | 278 | 226 | -226 | 0 |
-95,760 | 6,005 | 3,936 | -3,872 | 64 | |
Total micro fair value hedges | -80,735 | 4,898 | 2,973 | -2,939 | 34 |
Portfolio fair value hedges (hedged items stated as assets) | |||||
Fixed rate loans in Amounts due to banks | 35 | -2 | -1 | 1 | 0 |
Fixed rate bonds in Financial assets at fair value through the income statement | 152 | 4 | -2 | -2 | -4 |
Fixed rate bonds in Interest-bearing securities at amortised cost | 1,736 | -70 | -51 | 51 | 0 |
Fixed rate loans in Loans and advances | 92,525 | -10,641 | -7,706 | 7,632 | -74 |
Total portfolio fair value hedges | 94,448 | -10,709 | -7,760 | 7,682 | -78 |
Total fair value hedges | 13,713 | -5,811 | -4,787 | 4,743 | -44 |
31-12-2024 | |||||
|---|---|---|---|---|---|
Gross carrying amount | Accumulated amount | Gains/Losses attri-butable | Gains/Losses attri-butable | Hedge ineffect-iveness | |
Fair value hedges | |||||
Micro fair value hedges (hedged items stated as assets) | |||||
Fixed rate bonds in Financial assets at fair value through the income statement | 11,159 | 91 | 210 | -221 | -11 |
Fixed rate bonds in Interest-bearing securities at amortised cost | 3,554 | -359 | -11 | 19 | 8 |
14,713 | -268 | 199 | -202 | -3 | |
Micro fair value hedges (hedged items stated as liabilities) | |||||
Fixed rate loans in Amounts due to banks | -722 | 3 | -11 | 11 | 0 |
Fixed rate bonds in Debt securities | -91,781 | 4,924 | -2,806 | 2,764 | -42 |
Fixed rate loans in Funds entrusted | -3,258 | 62 | -54 | 53 | -1 |
-95,761 | 4,989 | -2,871 | 2,828 | -43 | |
Total micro fair value hedges | -81,048 | 4,721 | -2,672 | 2,626 | -46 |
Portfolio fair value hedges (hedged items stated as assets) | |||||
Fixed rate loans in Amounts due to banks | 40 | -2 | 1 | -1 | 0 |
Fixed rate bonds in Financial assets at fair value through the income statement | 163 | 6 | 1 | 4 | 5 |
Fixed rate bonds in Interest-bearing securities at amortised cost | 1,700 | -47 | 33 | -33 | 0 |
Fixed rate loans in Loans and advances | 89,545 | -2,903 | 2,036 | -2,002 | 34 |
Total portfolio fair value hedges | 91,448 | -2,946 | 2,071 | -2,032 | 39 |
Total fair value hedges | 10,400 | 1,775 | -601 | 594 | -7 |
Cash flow hedge accounting
The following table shows the notional amount and the changes in fair value of the hedging instruments, as well as the gross carrying amounts of the hedged items involved in micro cash flow hedge accounting in the reporting period, used as the basis for recognising ineffectiveness.
31-12-2025 | Notional amount of hedging instruments | Gross carrying amount of hedging items | Changes in fair value of hedging | Reclassified as interest result calculated using the effective interest method | ||
|---|---|---|---|---|---|---|
Assets | Liabilities | Effective portion | Hedge ineffectiveness | |||
Cash flow hedges | ||||||
Micro cash flow hedges | ||||||
Cross currency swaps | 1,268 | 11 | -1,296 | -2 | 0 | -35 |
Total cash flow hedges | 1,268 | 11 | -1,296 | -2 | 0 | -35 |
31-12-2024 | Notional amount of hedging instruments | Gross carrying amount of hedging items | Changes in fair value of hedging | Reclassified as interest result calculated using the effective interest method | ||
|---|---|---|---|---|---|---|
Assets | Liabilities | Effective portion | Hedge ineffectiveness | |||
Cash flow hedges | ||||||
Micro cash flow hedges | ||||||
Cross currency swaps | 1,352 | 15 | -1,615 | -8 | 1 | -39 |
Total cash flow hedges | 1,352 | 15 | -1,615 | -8 | 1 | -39 |
Foreign exchange rates
The following table shows the weighted average FX rates for the major currencies of the final exchange of cross-currency swaps involved in a micro cash flow hedge accounting relationship as at 31 December 2025.
31-12-2025 | ||||
|---|---|---|---|---|
FX rate | up to 1 year | 1 to 5 years | over 5 years | Total |
USD to EUR | 0.95992 | 0.91635 | 1.08981 | 0.93653 |
GBP to EUR | 0.97869 | 0.92706 | 0.91895 | 0.95719 |
AUD to EUR | 0.85126 | 0.89360 | 0.91012 | 0.89729 |
CHF to EUR | n/a | 1.17636 | 1.07695 | 1.12355 |
31-12-2024 | ||||
|---|---|---|---|---|
FX rate | up to 1 year | 1 to 5 years | over 5 years | Total |
USD to EUR | 1.10669 | 1.07857 | 1.09819 | 1.08297 |
GBP to EUR | 0.86197 | 1.32208 | 0.97991 | 1.05036 |
AUD to EUR | 0.89816 | 0.92968 | 0.95370 | 0.93362 |
CHF to EUR | 1.66171 | 1.11665 | 1.21333 | 1.32376 |
Fair value of financial instruments
The fair value is the price (not adjusted for transaction costs) which, regardless of the intention or capability, would be received if an asset was sold or the price which would be paid if a liability was transferred in an orderly transaction between market participants at the measurement date under the current market conditions. The assumption is that the valuation is viewed from the perspective of market participants, whereby only the specific characteristics and limitations of the financial instrument are taken into consideration.
A distinction is made between three levels of fair value, with the nature of the input factors and their significance for the total valuation being decisive for the correct classification in the hierarchy.
Fair value hierarchy
Level 1: valuation based on (unadjusted) quoted market prices of the instrument itself or, if unavailable, of identical instruments, in an active market. A financial instrument is regarded as quoted in an active market if the quoted price is regularly available, and if these prices reflect current and regularly occurring arm’s length market transactions. The quoted market prices for financial assets and liabilities are based on mid-market prices.
Level 2: valuation based on a valuation technique using directly/indirectly observable market data other than quoted market prices as used at Level 1. This category includes instruments with a valuation that uses quoted prices in an active market for comparable instruments, quoted prices for identical or comparable instruments in markets deemed to be less than active or other valuation techniques whereby all significant input variables are directly or indirectly observable from market data.
Level 3: valuation based on valuation techniques that make significant use of input data which are not publicly observable in the market. This category includes instruments with a valuation technique that uses input variables that are not based on observable market data and whereby the non-observable market data significantly influence the valuation of the instrument. This category also includes the instruments valued in accordance with the quoted prices for comparable instruments, whereby significant not publicly observable changes or presumptions are necessary for expressing the differences between the instruments.
Where possible, BNG uses quoted market prices (Level 1). Quoted market prices are based on bid prices (for financial assets) and ask prices (for financial liabilities). Using mid-market prices is permitted if the market risk of the financial assets and liabilities is offset. BNG uses mid-market prices on the reporting date for valuation purposes.
In many cases, the bank is reliant on theoretical valuations (Level 2). In such cases, the fair value is determined on the basis of valuation models and techniques that are customarily used in the financial sector. These are mostly models based on net present value calculations and option pricing models. The input for these models is based on direct or indirect objectively observable input data such as market prices, forward pricing, market-based yield curves for discounting, correlations, volatilities, cross-currency basis spreads, counterparty credit worthiness and other factors, estimates and assumptions which market parties would use to determine the price. The bank uses so-called spread curves to determine the fair value of financial instruments that involve credit and liquidity risk and for which a theoretical valuation is required. These spread curves are constructed on the basis of the relevant interest rate curve and a spread for credit and liquidity risk. The credit risk spread is dependent on the credit worthiness of the debtor, taking into account the collateral received, guarantees and maturities. The liquidity risk spread depends on the degree of marketability of the instrument. The risk profiles of individual clients and financial instruments are assessed at least once per quarter. If necessary, the credit-risk spread will be adjusted.
In determining the fair value of derivative transactions, a credit value adjustment (CVA) and a debit valuation adjustment (DVA) are applied to all derivative transactions with all clients and financial counterparties with which the bank does not have an agreement for the daily exchange of collateral. CVA and DVA are also applied to all derivative transactions with clients or counterparties with which the bank has an agreement for the daily exchange of collateral but where significant thresholds are applicable in determining the collateral amount.
The bank applies a spread over the relevant swap curve to determine its own credit risk: the ‘own credit adjustment (OCA)’. The OCA only relates to instruments included under Financial liabilities at fair value through the income statement.
Insofar as financial instruments have the character of a forward contract, official forward prices are used, including forward yield curves and forward exchange rates. In the case of complex instruments, the constituent parts of the instrument are measured separately on the basis of the above techniques and models. The fair value of the entire instrument is determined as the sum of the fair values of its constituent parts. BNG applies only recurring fair values, which are measured on an ongoing basis for processing in the financial position at the end of each reporting period.
31-12-2025 | 31-12-2024 | |||
|---|---|---|---|---|
Balance sheet-value | Fair value | Balance sheet-value | Fair value | |
Cash and balances held with central banks | 1,831 | 1,831 | 6,625 | 6,625 |
Amounts due from banks | 704 | 719 | 804 | 825 |
Cash collateral posted | 3,721 | 3,721 | 3,545 | 3,545 |
Financial assets at fair value through the income statement | 285 | 285 | 757 | 757 |
Derivatives | 2,138 | 2,138 | 3,979 | 3,979 |
Financial assets at fair value through other comprehensive income | 11,795 | 11,795 | 11,322 | 11,322 |
Interest-bearing securities at amortised cost | 8,105 | 8,088 | 9,133 | 8,901 |
Loans and advances | 97,627 | 85,983 | 94,537 | 88,342 |
Total financial assets | 126,206 | 114,560 | 130,702 | 124,296 |
Amounts due to banks | 1,104 | 1,090 | 1,639 | 1,616 |
Cash collateral received | 710 | 710 | 1,533 | 1,533 |
Financial liabilities at fair value through the income statement | 232 | 232 | 254 | 254 |
Derivatives | 5,009 | 5,009 | 5,546 | 5,546 |
Debt securities | 94,380 | 93,859 | 103,383 | 101,738 |
Funds entrusted | 9,016 | 8,895 | 10,517 | 10,365 |
Subordinated debt | 21 | 21 | 19 | 21 |
Total financial liabilities | 110,472 | 109,816 | 122,891 | 121,073 |
When effecting a transaction, the fair value hierarchy is determined on the basis of the relevant characteristics of the valuation, with the nature of the input factors and their significance for the total valuation being decisive for the classification. The classification takes place on the basis of the lowest input level that is significant for the fair value in the transaction as a whole.
Significance is assessed by determining the influence of non-observable input factors on the outcome of the total valuation, with due regard for the range of possible alternative assumptions concerning those non-observable input factors. Each quarter, the classification of each transaction is assessed and adjusted where necessary.
The following table provides an overview of the fair value hierarchy for transactions recognised at fair value.
31-12-2025 | ||||
|---|---|---|---|---|
Level 1 | Level 2 | Level 3 | Total | |
Financial assets at fair value through the income statement | 0 | 277 | 8 | 285 |
Derivatives | - | 2,138 | - | 2,138 |
Financial assets at fair value through other comprehensive income | 11,716 | 79 | - | 11,795 |
Total financial assets | 11,716 | 2,494 | 8 | 14,218 |
Financial liabilities at fair value through the income statement | - | 232 | - | 232 |
Derivatives | - | 5,009 | - | 5,009 |
Total financial liabilities | 0 | 5,241 | - | 5,241 |
31-12-2024 | ||||
|---|---|---|---|---|
Level 1 | Level 2 | Level 3 | Total | |
Financial assets at fair value through the income statement | 57 | 692 | 8 | 757 |
Derivatives | - | 3,979 | - | 3,979 |
Financial assets at fair value through other comprehensive income | 11,243 | 79 | - | 11,322 |
Total financial assets | 11,300 | 4,750 | 8 | 16,058 |
Financial liabilities at fair value through the income statement | 12 | 242 | - | 254 |
Derivatives | - | 5,546 | - | 5,546 |
Total financial liabilities | 12 | 5,788 | - | 5,800 |
As per 31 december 2025 one asset is stated under Level 3, this is a subordinated loan where the interest rate risk has been hedged with a swap. This is a structured interest-bearing security that is rarely traded in the market. Therefore, the observable market data available for similar securities is not fully representative of the current fair value. The fair value of this transaction is determined on the basis of public market data that is adjusted using significant input variables not publicly observable in the market.
2025 | 2024 | |
|---|---|---|
Level 3 Fair value | ||
Balance as at 1 January | 8 | 9 |
Gains/losses in the income statement | 0 | 0 |
Gains/losses in the comprehensive income statements | - | - |
Purchases, sales, issues and settlements | 0 | -1 |
Transfers in or out Level 3 fair value hierarchy | - | - |
Balance as at 31 december | 8 | 8 |
Fair value hierarchy of amortised cost transactions
The table below provides an overview of the way in which the fair value is determined for transactions recognised at amortised cost in the balance sheet on the basis of the hierarchical classification referred to above.
31-12-2025 | ||||
|---|---|---|---|---|
Level 1 | Level 2 | Level 3 | Total | |
Cash and balances held with central banks | 1,831 | - | - | 1,831 |
Amounts due from banks | 2 | 717 | - | 719 |
Cash collateral posted | - | 3,721 | - | 3,721 |
Interest-bearing securities at amortised cost | 3,381 | 4,492 | 215 | 8,088 |
Loans and advances | 514 | 78,332 | 7,137 | 85,983 |
Total financial assets | 5,728 | 87,262 | 7,352 | 100,342 |
Amounts due to banks | 0 | 1,090 | - | 1,090 |
Cash collateral received | - | 710 | - | 710 |
Debt securities | 76,721 | 17,138 | - | 93,859 |
Funds entrusted | 3,423 | 5,186 | 286 | 8,895 |
Subordinated debt | - | 21 | - | 21 |
Total financial liabilities | 80,144 | 24,145 | 286 | 104,575 |
31-12-2024 | ||||
|---|---|---|---|---|
Level 1 | Level 2 | Level 3 | Total | |
Cash and balances held with central banks | 6,625 | - | - | 6,625 |
Amounts due from banks | 2 | 823 | - | 825 |
Cash collateral posted | - | 3,545 | - | 3,545 |
Interest-bearing securities at amortised cost | 3,332 | 5,336 | 233 | 8,901 |
Loans and advances | 399 | 80,611 | 7,332 | 88,342 |
Total financial assets | 10,358 | 90,315 | 7,565 | 108,238 |
Amounts due to banks | 0 | 1,616 | - | 1,616 |
Cash collateral received | - | 1,533 | - | 1,533 |
Debt securities | 86,527 | 15,211 | - | 101,738 |
Funds entrusted | 3,857 | 6,133 | 375 | 10,365 |
Subordinated debt | - | 21 | - | 21 |
Total financial liabilities | 90,384 | 24,514 | 375 | 115,273 |
The financial assets at amortised cost under Level 3 mainly relate to loans and advances subject to solvency requirements to BNG’s statutory market parties. Loans and advances to statutory counterparties under government guarantees are included in Level 2, on account of the strong correlation with bonds issued by the Dutch State. The financial liabilities at amortised cost under Level 1 mainly consist of tradable benchmark bonds issued by BNG (Debt securities item).
Risk section
Institutional risk management approach
The process of accepting and controlling risks is inherent to the day-to-day operations of any bank. In order to conduct its operations, a bank must accept a certain amount of credit, market, liquidity and operational risk. This section provides an overview of the main characteristics of the risk profile of BNG and only covers the risk management practices that directly impact the financial statements.
BNG is operating in a highly complex environment and is subject to national and international rules and regulations. Although the bank spends significant effort to ensure compliance to all relevant rules and regulations, the implementation process is prone to human errors that cannot be completely prevented.
Credit risk
Credit risk
Credit risk is defined as the risk of losses in earnings or capital resulting from the potential risk that a borrower or a counterparty will fail to meet its obligations in accordance with agreed terms. It includes counterparty risk, settlement risk and concentration risk. The bank is working on integrating climate-related risks within the credit risk framework. Currently a method is developed. This has limited impact on the current financial statements.
Total credit risk exposure
The total gross exposure value for credit risk consists of the total balance sheet value of the assets, adjusted for the balance sheet value of derivatives, cash collateral posted for either derivative transactions or secured financing transactions and receivables related to Settle to Market (STM) derivative contracts under the Amounts due from banks item. The gross exposure value for off-balance sheet commitments is included, as well as the exposure value for counterparty credit risk (divided into derivative and secured financing transactions). The table below provides insight into the total gross credit risk exposure value.
31-12-2025 | 31-12-2024 | |
|---|---|---|
Balance sheet total | 115,564 | 127,941 |
-/- Derivatives | -2,138 | -3,979 |
-/- Cash collateral posted | -3,721 | -3,545 |
Total on-balance sheet exposure | 109,705 | 120,417 |
Total off-balance sheet exposure | 8,060 | 9,058 |
Exposure value for derivatives | 1,868 | 2,283 |
Exposure value for secured financing transactions | 155 | 42 |
Total counterparty credit risk exposure | 2,024 | 2,325 |
Total gross exposure | 119,789 | 131,800 |
As at 31 December 2025, the balance sheet value of the loans granted to or guaranteed by public authorities, the WSW Housing guarantee fund and the WfZ Healthcare guarantee fund in the Loans and advances balance sheet item totalled EUR 89.0 billion (2024: EUR 85.7 billion). The contingent liabilities and the irrevocable facilities are explained in the section ‘Off-balance sheet positions’. Section 'Encumbered financial assets and liabilities' indicates which parts of the financial assets are not freely disposable.
The calculation of the market value of financial assets and financial liabilities at fair value through the income statement includes a credit and liquidity risk spread. Changes in value due to credit-risk and liquidity-risk fluctuations are derived from changes in these spreads. The risk profiles of individual customers and financial instruments are periodically assessed. If necessary, the credit-risk spread is adjusted for the purpose of valuation.
Cumulative changes in the market value of financial assets at fair value through the income statement as a result of adjusted credit and liquidity risk spreads totalled EUR 119 million negative (2024: EUR 116 million negative). The decrease is mainly attributable to the disposal of 4 (Inflation-Linked Bonds) investment which had a cumulative negative impact of EUR 71 million (2024: EUR 59 million negative). Cumulative changes in the market value of financial liabilities at fair value through the income statement as a result of adjusted credit and liquidity risk spreads totalled EUR 19 million positive (2024: EUR 28 million positive) and amounted to EUR 9 million negative for 2025 (2024: EUR 14 million positive). Financial liabilities at fair value through the income statement are recognised on the relevant funding curve including a mark-up for ‘own credit risk’ in the accounts.
Counterparty risk
The bank is exposed to counterparty risk in relation to public sector entities (loans and advances), financial counterparties (derivatives) and issuers of interest-bearing securities in which the bank has invested. BNG applies the following credit risk mitigation measures:
Guarantees received from a central or local authority or by the guarantee funds WSW (Social Housing) and WfZ (Healthcare). Because loans subject to solvency requirements are often extended under partial of full guarantees or suretyships, the loan remains partly or fully zero-risk-weighted on balance for BNG (see the section on statutory market parties).
Other forms of security such as pledges and mortgages are used to minimise possible losses due to credit risks. The potential risk-reducing effect, however, is not used in the calculation of the regulatory capital requirement.
Bilateral netting and collateral agreements based on a daily collateral exchange with financial counterparties, also the section on financial counterparties.
Statutory market parties
The bank’s Articles of Association restrict lending to parties subject to some form of government involvement. As a result, the credit portfolio is largely comprised of zero-risk-weighted loans and advances provided to or guaranteed by the Dutch government.
Lending is subject to initial and periodic credit assessment. This contains a detailed assessment of the credit worthiness of the client concerned, based in part on the bank’s own internal rating model. Additionally, the bank has an internal risk assessment process for tailored transactions that includes operational risk elements. Moreover, the bank uses extensive qualitative product descriptions, in which the appropriateness of the product for different types of clients is made explicit.
Credit risk models
Most of BNG’s clients are not rated by external rating agencies, such as Moody’s, Fitch or S&P. The bank applies internally developed rating models to assess credit worthiness of clients. These expert models are sector specific and subject to periodic review and validation in accordance with the banks’ model governance policy. These models are not applied for capital calculations under Pillar I, where the bank uses the Standardised approach.
The significance of the internal ratings is the following:
Internal rating | Description |
|---|---|
0 | Zero risk-weighted lending. |
1 through 11 | The credit risk is deemed acceptable. A regular annual review is performed. |
12 through 13 | Watch list: there is an increased credit risk. A review takes place at least twice a year. |
14 through 16 | Financial restructuring and recovering department: there is an increased credit risk. At least three times a year, a report on these debtors is submitted to the Executive Board. |
17 through 21 | Financial restructuring and recovering department: there is an increased credit risk and/or the debtor repeatedly fails to fulfil the payment obligations and/or there is no expectation of continuity. At least three times a year, a report on these debtors is submitted to the Executive Board. |
Forborne exposures
Forbearance concerns credit agreements for which the credit conditions have been amended in the debtor’s favour as a result of the debtor’s precarious financial position, so as to enable it to fulfil its obligations.
31-12-2025 | ||||
|---|---|---|---|---|
Total exposure | Of which: Forborne | in % of total | ||
Gross of impairment | Net of impairment | |||
Financial assets (excl. derivatives) | ||||
Cash and balances held with central banks | 1,831 | - | - | 0.0% |
Amounts due from banks | 704 | - | - | 0.0% |
Cash collateral posted | 3,721 | - | - | 0.0% |
Financial assets at fair value through the income statement | 285 | - | - | 0.0% |
Financial assets at fair value through other comprehensive income | 11,795 | - | - | 0.0% |
Interest-bearing securities at amortised cost | 8,105 | - | - | 0.0% |
Loans and advances | 97,627 | 232 | 209 | 0.2% |
124,068 | 232 | 209 | 0.2% | |
Off-balance sheet commitments | ||||
Contingent liabilities | 442 | - | - | 0.0% |
Revocable facilities | 5,204 | 30 | 30 | 0.6% |
Irrevocable facilities | 2,414 | - | - | 0.0% |
8,060 | 30 | 30 | 0.4% | |
31-12-2024 | ||||
|---|---|---|---|---|
Total exposure | Of which: Forborne | in % of total | ||
Gross of impairment | Net of impairment | |||
Financial assets (excl. derivatives) | ||||
Cash and balances held with central banks | 6,625 | - | - | 0.0% |
Amounts due from banks | 804 | - | - | 0.0% |
Cash collateral posted | 3,545 | - | - | 0.0% |
Financial assets at fair value through the income statement | 757 | - | - | 0.0% |
Financial assets at fair value through other comprehensive income | 11,322 | - | - | 0.0% |
Interest-bearing securities at amortised cost | 9,133 | - | - | 0.0% |
Loans and advances | 94,537 | 346 | 318 | 0.4% |
126,723 | 346 | 318 | 0.3% | |
Off-balance sheet commitments | ||||
Contingent liabilities | 501 | - | - | 0.0% |
Revocable facilities | 5,383 | 15 | 15 | 0.3% |
Irrevocable facilities | 3,174 | 6 | 6 | 0.2% |
9,058 | 21 | 21 | 0.2% | |
The financial assets of which contractual terms have been changed as a result of the debtor’s unfavourable financial position amounted to EUR 232 million as at 31 December 2025 (year-end 2024: EUR 346 million). The increase is entirely due to the newly recorded debtors. The share of forborne exposure in the total portfolio is 0.2% (year-end 2024: 0.3%) and concerns 8 debtors (year-end 2024: 12 debtors). Forbearance is used as a backstop indicator in the impairment staging assessment, as a result of which all forborne exposures are classified in impairment stage 2.
Non-performing exposures
An exposure classified as non-performing can once again be regarded as performing if all of the following conditions are met:
The debtor once again complies with all contractual terms (no default);
The debtor’s situation has improved to the extent that the debtor is able to meet payment obligations according to an existing or adjusted payment profile (‘likely to pay’); and
The debtor has no payment arrears exceeding 90 days.
The tables below provide insight into the total exposure in financial assets (excluding derivatives) and off-balance sheet commitments, indicating which portions have been classified as non-performing.
31-12-2025 | ||||
|---|---|---|---|---|
Total exposure | Of which: Non-performing | in % of total | ||
Gross of impairment | Net of impairment | |||
Financial assets (excl. derivatives) | ||||
Cash and balances held with central banks | 1,831 | - | - | 0.0% |
Amounts due from banks | 704 | - | - | 0.0% |
Cash collateral posted | 3,721 | - | - | 0.0% |
Financial assets at fair value through the income statement | 285 | - | - | 0.0% |
Financial assets at fair value through other comprehensive income | 11,795 | - | - | 0.0% |
Interest-bearing securities at amortised cost | 8,105 | - | - | 0.0% |
Loans and advances | 97,627 | 351 | 280 | 0.4% |
124,068 | 351 | 280 | 0.3% | |
Off-balance sheet commitments | ||||
Contingent liabilities | 442 | 23 | 23 | 5.2% |
Revocable facilities | 5,204 | 0 | 0 | 0.0% |
Irrevocable facilities | 2,414 | 0 | 0 | 0.0% |
8,060 | 23 | 23 | 0.3% | |
31-12-2024 | ||||
|---|---|---|---|---|
Total exposure | Of which: Non-performing | in % of total | ||
Gross of impairment | Net of impairment | |||
Financial assets (excl. derivatives) | ||||
Cash and balances held with central banks | 6,625 | - | - | 0.0% |
Amounts due from banks | 804 | - | - | 0.0% |
Cash collateral posted | 3,545 | - | - | 0.0% |
Financial assets at fair value through the income statement | 757 | - | - | 0.0% |
Financial assets at fair value through other comprehensive income | 11,322 | - | - | 0.0% |
Interest-bearing securities at amortised cost | 9,133 | - | - | 0.0% |
Loans and advances | 94,537 | 460 | 416 | 0.5% |
126,723 | 460 | 416 | 0.4% | |
Off-balance sheet commitments | ||||
Contingent liabilities | 501 | 1 | 0 | 0.2% |
Revocable facilities | 5,383 | 14 | 14 | 0.3% |
Irrevocable facilities | 3,174 | 6 | 6 | 0.2% |
9,058 | 21 | 20 | 0.2% | |
On-balance non-performing exposure totalled EUR 351 million as at 31 December 2025 (year-end 2024: EUR 460 million). The decrease of this exposure in 2025 is mainly caused by the settlement of two obligors in Stage 3. The total non-performing exposure remains low in relation to the total exposure of the portfolio of BNG. At year-end 2025 the share of non-performing exposure in the total portfolio is 0.3% (year-end 2024: 0.4%) and concerns 30 debtors (year-end 2024: 21 debtors). BNG received EUR 154 million of government guarantees (2024: EUR 279 million) with respect to non-performing exposures.
The following table shows the development of non-performing exposures.
2025 | 2024 | |
|---|---|---|
Total non-performing exposure as at 1 January | 460 | 598 |
Change in existing non-performing exposures | -21 | 1 |
Shift from performing to non-performing exposure | 81 | 65 |
Shift from non-performing to performing exposure | -108 | -138 |
Repayments on and settlement of non-performing exposure | -61 | -48 |
Write-off | - | -18 |
Total non-performing exposure as at 31 December | 351 | 460 |
Maturity analysis of performing past due exposures
The following table comprises past due exposures that are not included in impairment stage 3 under IFRS 9.
31-12-2025 | 31-12-2024 | |
|---|---|---|
Less than 31 days | 2 | 101 |
31 through 60 days | - | - |
61 through 90 days | - | - |
Over 90 days | - | - |
Closing balance | 2 | 101 |
Impairments
The impairments of financial assets are explained in note 31.
External rating
BNG uses the external ratings awarded by rating agencies, specifically S&P, Moody’s, Fitch and DBRS. In determining the capital requirement, the bank uses the ratings of these four agencies if such ratings are available. The ratings relate either to the counterparty or specifically to a securities purchased.
Financial counterparties
The market risks associated with loans to clients are mitigated primarily through derivative transactions with financial counterparties. The bank only conducts business with financial counterparties that have been rated by an external agency. Financial counterparties are periodically assessed for credit worthiness. If necessary, the limit on the maximum exposure to such a counterparty is re-adjusted accordingly.
31-12-2025 | 31-12-2024 | |||
|---|---|---|---|---|
Exposure values for derivatives | Exposure value | Risk-weighted exposure amount | Exposure value | Risk-weighted exposure amount |
Regional governments or local authorities | 55 | 167 | - | |
Public sector entities | 0 | 1 | 0 | |
Institutions | 893 | 186 | 1,208 | 310 |
Corporates | 920 | 287 | 907 | 384 |
Total | 1,868 | 473 | 2,283 | 694 |
In order to reduce credit risk, netting agreements are in place with financial counterparties with which BNG actively enters into derivatives transactions or (reverse) repos. In addition, collateral agreements are concluded. These ensure that market value developments are mitigated on a daily basis by collateral. The agreements are updated where necessary in response to changing market circumstances, market practices and regulatory changes. The following table shows the gross positions before balance sheet netting and if the collateral agreements were taken into account.
31-12-2025 | |||
|---|---|---|---|
Derivatives (stated as assets) | Derivatives (stated as liabilities) | Net | |
Netting of financial assets and financial liabilities (derivatives) | |||
Gross value of financial assets and liabilities before balance sheet netting | 15,977 | -18,848 | -2,871 |
Gross value of the financial assets and liabilities to be netted | -13,839 | 13,839 | 0 |
Balance sheet value of financial assets and liabilities (after netting) | 2,138 | -5,009 | -2,871 |
Value of financial netting instrument that does not comply with IAS 32 (netting of derivatives with the same counterparty) for netting purposes | -1,351 | 1,351 | 0 |
Exposure before collateral | 787 | -3,658 | -2,871 |
Value of financial collateral that does not comply with IAS 32 for netting purposes | -710 | 3,721 | 3,011 |
Net exposure | 77 | 63 | 140 |
31-12-2024 | |||
|---|---|---|---|
Derivatives (stated as assets) | Derivatives (stated as liabilities) | Net | |
Netting of financial assets and financial liabilities (derivatives) | |||
Gross value of financial assets and liabilities before balance sheet netting | 14,874 | -16,441 | -1,567 |
Gross value of the financial assets and liabilities to be netted | -10,895 | 10,895 | 0 |
Balance sheet value of financial assets and liabilities (after netting) | 3,979 | -5,546 | -1,567 |
Value of financial netting instrument that does not comply with IAS 32 (netting of derivatives with the same counterparty) for netting purposes | -2,111 | 2,111 | 0 |
Exposure before collateral | 1,868 | -3,435 | -1,567 |
Value of financial collateral that does not comply with IAS 32 for netting purposes | -1,533 | 3,545 | 2,012 |
Net exposure | 335 | 110 | 445 |
At year-end 2025, the collateral posted for derivative transactions amounted to EUR 3.6 billion (2024: EUR 4.1 billion). The deterioration of BNG’s rating by three notches would not increase this amount (2024: EUR nil). The strength of the bank’s liquidity position is sufficient to absorb fluctuations in collateral obligations.
31-12-2025 | 31-12-2024 | |||
|---|---|---|---|---|
Reverse repos (assets) | Repos (liabilities) | Reverse repos (assets) | Repos (liabilities) | |
Netting of reverse repo and repo agreements subject to enforceable master netting agreements | ||||
Gross balance sheet value before balance sheet netting | 2,485 | -2,485 | 2,112 | -2,110 |
Balance sheet netting of reverse repo and repo agreements | -2,485 | 2,485 | -2,110 | 2,110 |
Net balance sheet value of financial assets and liabilities | 0 | 0 | 2 | 0 |
Investments in interest-bearing securities (IBS)
BNG’s IBS portfolio is held predominantly for liquidity management purposes. The portfolio is composed of high-quality bonds, the majority of which are accepted as collateral by the ECB. BNG’s total IBS portfolio can be subdivided into a liquidity portfolio and an Asset & Liability Management (ALM) portfolio. The liquidity portfolio consists exclusively of highly negotiable securities and is subdivided according to the various LCR levels. The ALM portfolio is subdivided according to type of security. Each month, the development of the portfolio is reported to and evaluated by the Investment Committee. Using factors such as external ratings and – in part – internal ratings, the bank monitors the development on an individual basis. All assets within these portfolios undergo an impairment analysis twice a year. Asset backed securities (including RMBS) are subject to a due diligence review process.
The amounts shown below per rating category are remaining principal amounts in millions of euros. The total balance sheet value is also shown in the final column.
31-12-2025 | |||||||
|---|---|---|---|---|---|---|---|
AAA | AA | A | BBB | Non-invest- ment grade | Total nominal value | Total balance sheet value | |
Liquidity portfolio | |||||||
Level I – Government/ Supranational | 5,934 | 2,430 | 1,250 | 46 | - | 9,660 | 9,410 |
Level I B – Covered bonds | 3,428 | - | - | - | - | 3,428 | 3,459 |
Level II A – Government/ Supranational | - | - | - | - | - | 0 | 0 |
Level II A – Covered bonds | 165 | - | - | - | - | 165 | 169 |
Level II B – RMBS | 1,276 | - | - | - | - | 1,276 | 1,283 |
10,803 | 2,430 | 1,250 | 46 | - | 14,529 | 14,321 | |
ALM portfolio | |||||||
Bonds | 2,575 | 53 | 1,099 | - | - | 3,727 | 3,263 |
RMBS-NHG | 1,455 | 32 | 74 | - | - | 1,561 | 1,564 |
Medium Term Notes (MTN) | - | 15 | 102 | - | - | 117 | 120 |
RMBS | 54 | 9 | 8 | - | - | 71 | 71 |
ABS | 18 | - | 13 | 48 | - | 79 | 79 |
Other | - | 528 | - | 113 | - | 641 | 564 |
4,102 | 637 | 1,296 | 161 | - | 6,196 | 5,661 | |
Total | 14,905 | 3,067 | 2,546 | 207 | - | 20,725 | 19,982 |
31-12-2024 | |||||||
|---|---|---|---|---|---|---|---|
AAA | AA | A | BBB | Non-invest- ment grade | Total nominal value | Total balance sheet value | |
Liquidity portfolio | |||||||
Level I – Government/ Supranational | 5,237 | 3,311 | 1,268 | 46 | - | 9,862 | 9,774 |
Level I B – Covered bonds | 2,587 | - | - | - | - | 2,587 | 2,611 |
Level II A – Government/ Supranational | - | 60 | - | - | - | 60 | 56 |
Level II A – Covered bonds | 205 | - | - | - | - | 205 | 209 |
Level II B – RMBS | 1,375 | - | - | - | - | 1,375 | 1,390 |
9,404 | 3,371 | 1,268 | 46 | - | 14,089 | 14,040 | |
ALM portfolio1 | |||||||
Bonds | 2,497 | 348 | 530 | - | - | 3,375 | 3,388 |
RMBS-NHG | 2,159 | 37 | 82 | - | - | 2,278 | 2,283 |
Medium Term Notes (MTN) | - | 15 | 94 | - | - | 109 | 115 |
RMBS | 22 | 69 | 21 | - | - | 112 | 114 |
ABS | 26 | - | - | 68 | - | 94 | 94 |
Other | - | 536 | 143 | 358 | - | 1,037 | 937 |
4,704 | 1,005 | 870 | 426 | - | 7,005 | 6,931 | |
Total | 14,108 | 4,376 | 2,138 | 472 | - | 21,094 | 20,971 |
- Category 'other' is specified further comparable figure have been update accordingly.
The liquidity portfolio improved in quality (AAA and AA) mainly due to investments in Government bonds with a better rating.
Transfer of financial assets without derecognition
At year-end 2025 BNG has transferred EUR 2,774 million in interest-bearing securities in repurchase transactions without derecognition (2024: EUR 2,669 million). At year-end 2025, BNG has no financial assets in its portfolio that were transferred and derecognised and in which it has a continuing involvement. Financial assets are not removed from the balance sheet if BNG retains the credit risks and the rights to the underlying cash flows.
Concentration risk
Regarding concentration risk, the bank differentiates between:
country risk with a distinction between domestic and foreign risk;
sector risk; and
risk for individual parties with a distinction between clients and financial counterparties.
Sector specific policies, annual internal targets and maximum exposure amounts on individual counterparties are applied to manage the concentration risks on sectors and individual parties. A considerable portion of the total outstanding exposures is indirectly related to public sector property. However, these risks are generally mitigated by government guarantees on lending and by the WSW and WfZ guarantee funds. BNG received EUR 57 billion of government guarantees (2024: EUR 56 billion). These guarantees result in a concentration risk in relation to public authorities and guarantee funds. The guarantee funds are guaranteed by the central government via backstop constructions, which, in the end, creates an exposure to the Dutch State. The concentration of this risk is high, but inherent to BNG’s business model.
The bank is exposed to foreign country risk as a result of transactions with financial counterparties to hedge market risks arising from lending and funding activities, as a result of its liquidity portfolio and, to a limited extent, in the context of lending and investments in the public sector abroad.
The bank invests in foreign securities for its liquidity portfolio because the vast majority of its loan portfolio already relates to the Netherlands. Foreign lending is in most cases also directly or indirectly guaranteed by the relevant governments.
All foreign exposures fall within limits set for each country. These limits mainly depend on the perceived credit quality of the country in question. Moreover, a general limit of 15% of the balance sheet total applies to foreign exposures excluding derivatives, collateral and short term loans and current account balances due from banks.
Long-term foreign exposure
The following tables provide an overview of long-term foreign exposures. Derivative transactions and short-term transactions (including cash collateral with banks in particular) have not been included. The amounts shown are remaining principal amounts in millions of euros. Part of the exposure in Luxembourg and the full exposure in the United States are reclassified under Multilateral development banks since 2024.
31-12-2025 | |||||||
|---|---|---|---|---|---|---|---|
AAA | AA | A | BBB | Non-invest- ment grade | Total nominal value | Total balance sheet value | |
Supranational institutions | 4,551 | - | - | - | - | 4,551 | 4,132 |
Multilateral development banks | 397 | - | - | - | - | 397 | 385 |
Austria | 79 | 1,189 | - | - | - | 1,268 | 1,228 |
Belgium | - | 712 | - | 64 | - | 776 | 788 |
Denmark | 96 | - | - | - | - | 96 | 89 |
Finland | - | 499 | - | - | - | 499 | 478 |
France | 903 | - | - | - | - | 903 | 921 |
Germany | 1,245 | 178 | 37 | - | - | 1,460 | 1,427 |
Italy | - | - | 13 | 39 | - | 52 | 53 |
Luxembourg | 631 | - | - | - | - | 631 | 587 |
Portugal | 9 | - | - | - | - | 9 | 9 |
Singapore | - | - | 130 | - | - | 130 | 130 |
Spain | 46 | 9 | 90 | 46 | - | 191 | 208 |
United Kingdom | 165 | 528 | - | 130 | 28 | 851 | 778 |
Total | 8,122 | 3,115 | 270 | 279 | 28 | 11,814 | 11,213 |
31-12-2024 | |||||||
|---|---|---|---|---|---|---|---|
AAA | AA | A | BBB | Non-invest- ment grade | Total nominal value | Total balance sheet value | |
Supranational institutions | 4,929 | - | - | - | - | 4,929 | 4,999 |
Multilateral development banks | 208 | - | - | - | - | 208 | 200 |
Austria | - | 1,227 | - | - | - | 1,227 | 1,185 |
Belgium | - | 657 | - | 69 | - | 726 | 750 |
Denmark | 36 | - | - | - | - | 36 | 35 |
Finland | - | 449 | - | - | - | 449 | 428 |
France | 741 | 1,008 | - | - | - | 1,749 | 1,775 |
Germany | 915 | 200 | 42 | - | - | 1,157 | 1,136 |
Italy | - | - | - | - | - | - | - |
Luxembourg | 384 | - | - | - | - | 384 | 346 |
Portugal | 11 | - | - | 56 | - | 67 | 67 |
Singapore | - | - | 149 | - | - | 149 | 149 |
Spain | 11 | 70 | 102 | 46 | - | 229 | 250 |
United Kingdom | 205 | 536 | 148 | 371 | 32 | 1,292 | 1,197 |
Total | 7,440 | 4,147 | 441 | 542 | 32 | 12,602 | 12,517 |
For a large part, the non-investment grade items (i.e. items with a rating below BBB-) consist of exposures in United Kingdom. The non-investment grade exposures in the United Kingdom concern a limited number of private project financing schemes in the areas of infrastructure, education, energy and healthcare. The total fair value of foreign non-investment grade exposures at 31 December 2025 amounted to EUR 26 million (year-end 2024: EUR 30 million).
Exposures divided to risk classes
The following tables provide an overview of all exposures subdivided to risk classes, either by internal- or external rating.
31-12-2025 | 31-12-2024 | |||||||
|---|---|---|---|---|---|---|---|---|
Loans and advances | On-balance exposures | On-balance exposures | ||||||
Performing | Non-performing | Total | Performing | Non-performing | Total | |||
Stage 1 | Stage 2 | Stage 3 | Stage 1 | Stage 2 | Stage 3 | |||
- Low risk | 88,812 | 22 | - | 88,834 | 85,683 | - | - | 85,683 |
- Medium risk | 148 | 191 | - | 339 | 254 | 59 | - | 313 |
- High risk | 27 | 171 | - | 198 | 1 | 226 | - | 227 |
- Non-performing | - | 4 | 154 | 158 | - | - | 279 | 279 |
- Not rated | - | - | - | - | - | - | - | - |
Total | 88,987 | 388 | 154 | 89,529 | 85,938 | 285 | 279 | 86,502 |
Loans and advances | On-balance exposures | On-balance exposures | ||||||
|---|---|---|---|---|---|---|---|---|
Performing | Non-performing | Total | Performing | Non-performing | Total | |||
Stage 1 | Stage 2 | Stage 3 | Stage 1 | Stage 2 | Stage 3 | |||
- Low risk | 7,458 | 129 | - | 7,587 | 7,571 | 107 | - | 7,678 |
- Medium risk | 18 | 135 | - | 153 | 8 | 78 | - | 86 |
- High risk | 26 | 233 | - | 259 | 13 | 120 | - | 133 |
- Non-performing | - | - | 197 | 197 | - | - | 135 | 135 |
- Not rated | - | - | - | - | - | 2 | - | 2 |
Total | 7,502 | 497 | 197 | 8,196 | 7,592 | 307 | 135 | 8,034 |
31-12-2025 | 31-12-2024 | |||||||
|---|---|---|---|---|---|---|---|---|
Interest-bearing securities | On-balance exposures | On-balance exposures | ||||||
Performing | Non-performing | Total | Performing | Non-performing | Total | |||
Stage 1 | Stage 2 | Stage 3 | Stage 1 | Stage 2 | Stage 3 | |||
- Low risk | 19,901 | - | - | 19,901 | 20,455 | - | - | 20,455 |
- Medium risk | - | - | - | - | - | - | - | - |
- High risk | - | - | - | - | - | - | - | - |
- Non-performing | - | - | - | - | - | - | - | - |
- Not rated | - | - | - | - | - | - | - | - |
Total | 19,901 | - | - | 19,901 | 20,455 | - | - | 20,455 |
Risk classes | Ratings based on | |
|---|---|---|
Internal ratings | External rating | |
- Low risk | 1-11 | AAA - BBB |
- Medium risk | 12-13 | BB |
- High risk | 14-16 | B or lower |
- Non-performing | 17-21 | |
Individual statutory market parties
For non-zero risk weighted parties, the exposures have to adhere to the Large Exposure Regulation under CRR. The bank has a significantly more conservative approach regarding the maximum size of individual exposures. This further limitation takes into account the degree to which sectors are anchored in the public sector. The party’s individual rating is a further criterium for limit setting.
Individual financial counterparties
Transactions with financial counterparties primarily consist of interest rate and currency swaps undertaken to mitigate market risks. BNG sets requirements for the minimum ratings of the financial counterparties with which it is willing to transact, taking into account the nature of the business conducted with that party. This limits the number of available parties. As a consequence, the number of transactions with approved parties is high. Daily exchange of collateral helps to mitigate the credit risk with respect to derivatives. A bankruptcy of a counterparty would result in market risks as the market is subject to fluctuations while the derivatives need to be rearranged with another party. The Credit Committee limits and monitors positions with financial counterparties. BNG clears parts of its derivatives centrally via clearing houses through clearing members. This results inevitably in a shift in concentration risk from individual financial counterparties to the clearing members and the clearing houses.
The London Clearing House (LCH) is temporarily being exempted from changes in regulations resulting from Brexit. The exemption for the LCH to serve EU customers has been extended to June 2028. This means that cleared derivatives can remain with the LCH and that it is still possible to clear new swaps at the LCH. BNG currently uses both EUREX and the LCH to clear swaps. This way continuity and flexibility regarding central clearing is granted.
Market risk
Definitions
Market risk is defined as an existing or future threat to the institution’s capital and earnings as a result of market price fluctuations. It includes interest rate risk, foreign exchange risk, volatility risk, spread risk and index risk.
Interest rate risk
The bank’s most important interest rate risk is the ‘outright risk’ to the interest rate swap curve, which is determined excluding the impact of spreads. This means that changes in spreads such as credit spreads, CVA/DVA and cross currency basis spreads do not influence the interest rate risk position and hedging. There is no material presence of early redemption options in BNG’s regular loan portfolio. Likewise, there is no material exposure in mortgages and the bank does not attract savings from private individuals. Consequently, client behaviour is not modelled in the bank’s interest rate risk models.
The limits with respect to interest rate risk were not breached in 2025. In the bank’s opinion, its interest rate risk management was adequate, compliant with the regulatory standards and within the limits as defined in the bank’s risk appetite and risk policies. The table below outlines the Earnings-at-Risk (EaR) as per end of 2025 in a scenario with an instantaneous parallel shock of plus 162 basis points for the 1-year horizon. A 2-years horizon is added in 2025, as the impact on the longer term could be assessed. For the 2-year horizon, a scenario with a gradual, linearly increasing, parallel shock to a minimum of minus 168 basis points is used. Internal steering takes place mainly on a 1-year horizon. Usually, the most negative impact can be seen in the scenario with an instantaneous parallel shock of minus 168 basis points. The main reason for the switch in the 1-year scenario is the bank’s Euribor fixations structure in the banking book.
Earnings at risk | 2025 | 2024 |
|---|---|---|
(in millions of euros) | ||
Horizon | ||
1 year | -41 | -53 |
2 years | -62 | - |
Foreign exchange risk
The bank obtains a large portion of its funding in foreign currencies and is therefore exposed to foreign exchange fluctuations. However, according to the bank’s policy, foreign exchange risks are hedged in terms of notional amounts. Incidentally, foreign exchange positions may occur in certain cases where it is not cost-efficient to hedge the risk. The foreign exchange risk of these minor positions is monitored on a daily basis, subject to limits. During 2025 and 2024, these limits were not breached.
Volatility risk
In order to be able to manage its interest rate risk exposure in a flexible and cost efficient way, the bank allows itself a limited range for assuming volatility risk to support the interest rate position in the Treasury book. This range is limited and is monitored by the Risk Management department. During 2025, no additional volatility risk was assumed to support the active interest rate position. With regard to its other activities, BNG’s policy specifies that the volatility risks for new financial instruments should be hedged one-to-one. The resulting volatility risk is relatively small and is subject to monitoring by Risk Management.
Spread risk
The economic value of BNG’s equity is determined over its total portfolio of assets and liabilities. Both assets and liabilities are valued on the basis of an interest rate curve made up of market-based swap rates plus credit risk spreads. In case of interest rate swaps, the CVA risk (counterparty risk) and DVA risk (the bank’s own default risk) are included. Spread risk is not hedged by the bank. The impact of changes in these spreads is measured and monitored on a daily basis. For the fair value instruments affecting profit and loss or regulatory capital, a warning level on the credit spread stress testing outcomes has been set.
Index risk
The bank has inflation-linked instruments in its portfolio. The bank’s policy specifies that exposure to fluctuations in inflation risk should be hedged in full and it executes this policy. The inflation delta is monitored on a daily basis.
Liquidity and funding risk
Liquidity risk is defined as the existing or future threat to the institution’s capital and earnings due to the possibility that it will not be able at any moment to fulfil its payment obligations, without incurring any unacceptable costs or losses. The public sector consists largely of institutions with a long-term investment horizon. This means that assets frequently have long maturities, which can be in excess of 25 years. As BNG is not able to attract funding in large volumes for these maturities at acceptable prices, a limited funding mismatch is accepted. In order to manage this mismatch, also in times of stress, BNG holds sufficient liquidity and capital buffers.
Liquidity risk
BNG wants to provide a stable presence in the capital markets, because the bank wants to continue to meet the demand for credit even in difficult times. It also pursues a prudent liquidity policy to ensure that it can meet its obligations at all times. In this context, ongoing access to the money and capital markets is essential, along with the ongoing maintenance of attractive, varied and sufficiently large issuance programmes for investors. In addition, buffers are required in order to have access to liquidity in times of stress. One such buffer is formed by assets held explicitly for liquidity purposes, known as the liquidity portfolio. The management of the size and composition of this portfolio is one of the liquidity measures to comply with the requirement under the CRR to have an Liquidity Coverage Ratio of at least 100%. BNG also holds an ample quantity of collateral with the ECB, which enables it to obtain short-term funding immediately. Since most of the bank’s assets could serve as collateral at the ECB, this collateral may be further extended in the event of prolonged stress. The size of both buffers is tested in the liquidity stress tests, which are monitored on a monthly basis. Furthermore, the funding plan and corresponding planned liquidity gap is tested in an adverse stress scenario for the Liquidity Coverage Ratio and Net Stable Funding Ratio. The bank considers its liquidity management to have been adequate in 2025 and that the strength of the bank’s liquidity position is both amply sufficient and in compliance with the regulatory standards and limits set by the ALCO. As at end of 2025, the Liquidity Coverage Ratio amounted to 159% (2024: 217%) and the Net Stable Funding Ratio ratio amounted to 143% (2024: 139%).
Funding risk
BNG distinguishes between short-term and long-term funding. The majority of funding is from international capital markets. The bank maintains a number of programmes that enables it to have access to funding at all times at competitive levels. The bank pursues proactive investor relations which supports these efforts. The bank has a funding plan, in which the desired funding mix is described in more detail. Part of the funding plan is the annual issuance in benchmark size to maintain a ‘BNG curve’ in the market. These large-scale issues ensure that the bank has a high profile among institutional investors, allowing it to retain access to investors even in times of market stress. The actual realisation of this funding mix is monitored and evaluated by the ALCO.
Maturity analysis of financial assets and liabilities on the basis of the remaining contractual period
The amounts featured in the table below represent the non-discounted future cash flows of financial assets and liabilities. Because these amounts are non-discounted, these are different to the amounts in the balance sheet. For the maturity analysis of issued guarantees and irrevocable commitments, see the ‘Off-balance sheet positions’ section.
31-12-2025 | |||||
|---|---|---|---|---|---|
Up to 3 months | 3 - 12 months | 1 - 5 years | over 5 years | Total | |
Cash and balances held with central banks | 1,842 | - | - | - | 1,842 |
Amounts due from banks | 14 | 98 | 405 | 327 | 844 |
Cash collateral posted | 3,721 | - | - | - | 3,721 |
Financial assets at fair value through the income statement | 2 | 90 | 28 | 252 | 372 |
Financial assets at fair value through other comprehensive income | -307 | 429 | 7,791 | 6,350 | 14,263 |
Interest-bearing securities at amortised cost | 458 | 735 | 3,252 | 8,001 | 12,446 |
Loans and advances | 2,887 | 8,371 | 30,785 | 84,690 | 126,733 |
Other assets | 24 | - | - | - | 24 |
Total financial assets (excluding derivatives) | 8,641 | 9,723 | 42,261 | 99,620 | 160,245 |
Amounts due to banks | -692 | -19 | -431 | -352 | -1,494 |
Cash collateral received | -710 | - | - | - | -710 |
Financial liabilities at fair value through the income statement | -2 | -3 | -88 | -209 | -302 |
Debt securities | -2,247 | -11,814 | -46,639 | -52,586 | -113,286 |
Funds entrusted | -4,942 | -576 | -1,297 | -5,314 | -12,129 |
Subordinated debt | - | -11 | -11 | - | -22 |
Other liabilities | -60 | - | - | - | -60 |
Current tax assets | -30 | - | - | - | -30 |
Total financial liabilities (excluding derivatives) | -8,683 | -12,423 | -48,466 | -58,461 | -128,033 |
Gross balanced derivatives | |||||
Assets amounts receivable | 1,229 | 4,139 | 15,945 | 25,124 | 46,437 |
Assets amounts payable | -1,182 | -4,647 | -16,315 | -20,459 | -42,603 |
Derivatives stated as assets | 47 | -508 | -370 | 4,665 | 3,834 |
Liabilities amounts receivable | 2,937 | 5,304 | 16,537 | 35,237 | 60,015 |
Liabilities amounts payable | -3,009 | -6,267 | -17,338 | -31,402 | -58,016 |
Derivatives stated as liabilities | -72 | -963 | -801 | 3,835 | 1,999 |
Grand total | -67 | -4,171 | -7,376 | 49,659 | 38,045 |
31-12-2024 | |||||
|---|---|---|---|---|---|
Up to 3 months | 3 - 12 months | 1 - 5 years | over 5 years | Total | |
Cash and balances held with central banks | 6,650 | - | - | - | 6,650 |
Amounts due from banks | 27 | 97 | 428 | 445 | 997 |
Cash collateral posted | 3,545 | - | - | - | 3,545 |
Financial assets at fair value through the income statement | 22 | 21 | 230 | 894 | 1,167 |
Financial assets at fair value through other comprehensive income | -5 | 624 | 5,743 | 7,780 | 14,142 |
Interest-bearing securities at amortised cost | 487 | 1,521 | 3,608 | 7,351 | 12,967 |
Loans and advances | 2,043 | 8,058 | 29,383 | 83,334 | 122,818 |
Current tax assets | 55 | - | - | - | 55 |
Other assets | 104 | - | - | - | 104 |
Total financial assets (excluding derivatives) | 12,928 | 10,321 | 39,392 | 99,804 | 162,445 |
Amounts due to banks | -936 | -19 | -283 | -533 | -1,771 |
Cash collateral received | -1,533 | - | - | - | -1,533 |
Financial liabilities at fair value through the income statement | -24 | -3 | -91 | -202 | -320 |
Debt securities | -5,594 | -14,543 | -45,518 | -53,803 | -119,458 |
Funds entrusted | -5,654 | -939 | -1,589 | -5,302 | -13,484 |
Subordinated debt | - | - | -22 | - | -22 |
Other liabilities | -88 | - | - | - | -88 |
Total financial liabilities (excluding derivatives) | -13,829 | -15,504 | -47,503 | -59,840 | -136,676 |
Gross balanced derivatives | |||||
Assets amounts receivable | 2,377 | 31,204 | 7,026 | 36,289 | 76,896 |
Assets amounts payable | -2,030 | -29,336 | -6,249 | -32,722 | -70,336 |
Derivatives stated as assets | 347 | 1,868 | 777 | 3,567 | 6,559 |
Liabilities amounts receivable | 1,097 | 6,211 | 2,305 | 10,234 | 19,847 |
Liabilities amounts payable | -1,198 | -7,736 | -2,678 | -14,232 | -25,844 |
Derivatives stated as liabilities | -101 | -1,525 | -373 | -3,998 | -5,997 |
Grand total | -655 | -4,840 | -7,707 | 39,533 | 26,331 |
Encumbered and unencumbered financial assets
Encumbered financial assets are not freely disposable to meet liquidity needs in the short term. The following table shows the balance-sheet values of the assets, broken down into encumbered (not freely available) and unencumbered (freely available) assets.
31-12-2025 | |||
|---|---|---|---|
Encumbered | Unencumbered | Total | |
Cash and balances held with central banks | - | 1,831 | 1,831 |
Amounts due from banks | - | 704 | 704 |
Cash collateral posted | 3,721 | - | 3,721 |
Financial assets at fair value through the income statement | - | 285 | 285 |
Derivatives | - | 2,138 | 2,138 |
Financial assets at fair value through other comprehensive income | 5,178 | 6,617 | 11,795 |
Interest-bearing at amortised cost | 2,406 | 5,699 | 8,105 |
Loans and advances | 3,665 | 93,962 | 97,627 |
Value adjustments on loans in portfolio hedge accounting | - | -10,713 | -10,713 |
Non-financial assets | - | 71 | 71 |
Total | 14,970 | 100,594 | 115,564 |
Average (total) in 2025 | 16,165 | 115,047 | 131,212 |
31-12-2024 | |||
|---|---|---|---|
Encumbered | Unencumbered | Total | |
Cash and balances held with central banks | - | 6,625 | 6,625 |
Amounts due from banks | - | 804 | 804 |
Cash collateral posted | 3,545 | - | 3,545 |
Financial assets at fair value through the income statement | - | 757 | 757 |
Derivatives | - | 3,979 | 3,979 |
Financial assets at fair value through other comprehensive income | 6,025 | 5,297 | 11,322 |
Interest-bearing at amortised cost | 2,411 | 6,722 | 9,133 |
Loans and advances | 3,805 | 90,732 | 94,537 |
Value adjustments on loans in portfolio hedge accounting | - | -2,953 | -2,953 |
Non-financial assets | - | 192 | 192 |
Total | 15,786 | 112,155 | 127,941 |
Average (total) in 2024 | 16,537 | 120,734 | 137,271 |
Capital and solvency
Definitions
Regulatory capital relates to the minimum capital requirements under the Capital Requirements Regulations (CRR) and Capital Requirements Directive IV (CRD IV). For regulatory purposes the capital requirement is based on the Pillar 1 requirement for the aggregated risk-weighted assets (RWA) for the three major risk types (credit, operational and market risk). This requirement is supplemented by the so-called combined buffer requirement (CBR) and a Pillar 2 requirement (P2R). The CBR consists of a capital conservation buffer, a systemic risk buffer, a countercyclical buffer and a systemic relevance buffer. The P2R is an institutional specific requirement stemming from the Supervisor Review and Evaluation Process (SREP) conducted by the supervisor. The P2R covers risks underestimated or not covered by Pillar 1. BNG employs the ‘Standardised Approach’ to calculate the RWAs.
In addition to the regulatory required capital BNG calculates economic capital (EC) for Pillar 2 purposes. Economic capital covers all risks in our risk taxonomy, for which capital is deemed to be the mitigating instrument to cover unexpected losses. It is used for internal risk measurement and management. It is the amount of capital the bank deems adequate to pursue its strategy and which achieve a sufficient level of protection against large unexpected losses that could result from extreme market conditions or events.
Governance
The Executive Board is responsible for determining the policy with respect to capital. This is laid down in a capital adequacy statement and management plan. The Executive Board is also responsible for the allocation of capital. Decision making is prepared by the Asset and Liability Committee (ALCO). This committee comprises representatives of all relevant stakeholders: the Executive Board, Public Finance, Treasury, Risk Management and Finance and Control.
Developments
As at December 2025, the fully CRR/CRD IV Common Equity Tier 1 (CET1), Tier 1 and total capital ratios were respectively 41.8%, 44.8% and 44.8%. All capital ratios were well above regulatory minimum requirements.
The impact of CRR3 is only related to the Corporate Specialised Lending and Secured by Mortgages. The impact on the risk weighted amount is limited.
The regulatory minimum requirements for BNG are shown in the table:
Capital Requirements | as of 1-1-2026 | as of 1-1-2025 |
|---|---|---|
Pillar 1 capital requirements | ||
Total own funds | 8.00% | 8.00% |
- of which Tier 1 | 6.00% | 6.00% |
- of which CET1 | 4.50% | 4.50% |
Pillar 2 capital requirements (P2R) | ||
Total own funds | 2.00% | 2.00% |
- of which Tier 1 | 1.50% | 1.50% |
- of which CET1 | 1.13% | 1.13% |
Total SREP capital requirements (TSCR) | ||
Total own funds | 10.00% | 10.00% |
- of which Tier 1 | 7.50% | 7.50% |
- of which CET1 | 5.63% | 5.63% |
Capital Conservation Buffer (CCB) | ||
Total own funds | 2.50% | 2.50% |
- of which Tier 1 | 2.50% | 2.50% |
- of which CET1 | 2.50% | 2.50% |
Other Systemically Important Institution Buffer (OSII Buffer) | ||
Total own funds | 0.25% | 0.25% |
- of which Tier 1 | 0.25% | 0.25% |
- of which CET1 | 0.25% | 0.25% |
Overall Capital Requirement (OCR) excluding Institution specific countercyclical capital buffer | ||
Total own funds | 12.75% | 12.75% |
- of which Tier 1 | 10.25% | 10.25% |
- of which CET1 | 8.38% | 8.38% |
Since 2019 the dividend distribution policy of BNG is to distribute 50% of net profit. BNG did not change this policy in 2025.
Capital management
The primary objective of the capital management strategy is to ensure that internal as well as external capital adequacy requirements are met at all times and sufficient capital is available to support the bank’s strategy.
The capital management strategy builds on the bank’s risk appetite and its business plans. Besides, expectations and requirements of external stakeholders (e.g. regulators, investors, rating agencies, shareholders), the bank’s capitalization relative to other financial institutions, market developments and the feasibility of capital management actions are taken into account. The capitalization policy is incorporated in the so-called Internal Capital Adequacy Assessment Process (ICAAP).
Key to this policy is the capital management plan, which determines the level and composition of the capital based on the risks to be insured by that capital. In the ICAAP, regulatory as well as economic capital is taken into account. As part of the ICAAP a number of stress scenarios is executed in order to determine the adequacy and robustness of the capitalization. Next to the level of capitalization, the ICAAP determines the allocation per relevant type of risk.
On an ongoing basis, capital adequacy is measured and monitored against target capital ratios. These target levels are derived from the bank’s risk appetite and strategy and quantified by the ICAAP. The allocation is derived from the ICAAP. This process ensures that the bank is operating in line with its risk appetite.
Capital structure
BNG’s capitalization is well above the capital requirements laid down in the CRR and CRD IV. The capital structure consists mainly of common equity. The other part consists of Additional Tier 1 instruments.
The following table shows the structure of the regulatory capital.
31-12-2025 | ||
|---|---|---|
Capital | IFRS Equity | |
Paid-up capital | 139 | 139 |
Share premium | 6 | 6 |
Retained earnings from previous years | 4,229 | 4,229 |
Unappropriated profit | 172 | |
Accumulated other comprehensive income | ||
- Cash flow hedge reserve | -13 | -13 |
- Cost of hedging | -2 | -2 |
- Own credit adjustment | 6 | 6 |
- Revaluation reserve | 17 | 17 |
Common equity Tier 1 (CET1) capital before regulatory adjustments | 4,382 | 4,554 |
Adjustments to CET1 capital as a result of prudential filters: | ||
- Distributable dividend (previous year) | - | |
- Cash flow hedge reserve | 13 | |
- Cumulative gains and losses arising from the bank’s own credit risk related to derivatives liabilities | -2 | |
- Own credit risk for Financial liabilities at fair value through the income statement | -6 | |
- Value adjustments due to the prudential valuation requirements | -11 | |
- Intangible assets | - | |
- Expected credit loss allowance of Financial assets at fair value through OCI | - | |
- Insufficient coverage for non-performing exposures | -4 | |
- CET1 deduction due to NPE coverage expectations | -34 | |
- CET1 deduction due to Trading book (temporary deduction) | -18 | |
CET1 capital | 4,320 | |
Additional Tier 1 capital | 309 | 309 |
Tier 1 capital | 4,629 | |
Total equity | 4,629 | 4,863 |
31-12-2024 | ||
|---|---|---|
Capital | IFRS Equity | |
Paid-up capital | 139 | 139 |
Share premium | 6 | 6 |
Retained earnings from previous years | 4,089 | 4,089 |
Unappropriated profit | 294 | |
Accumulated other comprehensive income | ||
- Cash flow hedge reserve | 9 | 9 |
- Cost of hedging | 94 | 94 |
- Own credit adjustment | 9 | 9 |
- Revaluation reserve | -172 | -172 |
Common equity Tier 1 (CET1) capital before regulatory adjustments | 4,174 | 4,468 |
Adjustments to CET1 capital as a result of prudential filters: | ||
- Distributable dividend (previous year) | - | |
- Cash flow hedge reserve | -9 | |
- Cumulative gains and losses arising from the bank’s own credit risk related to derivatives liabilities1 | 0 | |
- Own credit risk for Financial liabilities at fair value through the income statement1 | -9 | |
- Value adjustments due to the prudential valuation requirements | -5 | |
- Intangible assets | - | |
- Expected credit loss allowance of Financial assets at fair value through OCI | - | |
- Insufficient coverage for non-performing exposures | -2 | |
- CET1 deduction due to NPE coverage expectations | -9 | |
Deduction of capital for securitisation positions eligible as alternatives for a risk weight of 1250% | - | |
CET1 capital | 4,140 | |
Additional Tier 1 capital | 309 | 309 |
Tier 1 capital | 4,449 | |
Total equity | 4,449 | 4,777 |
- Figure is updated compared to last year.
Prudential filters
BNG applies the following prudential filters to the CET1 capital:
The cash flow hedge reserve is eliminated.
The benefits arising from own credit risk (DVA) in derivatives transactions are eliminated.
The benefits arising from own credit risk in relation to obligations classified as Financial liabilities at fair value through the income statement are eliminated.
Due to the regulations on prudent valuation, an adjustment is calculated in relation to the balance sheet valuation of assets and liabilities that are carried at fair value.
The investments in the development of software is activated and amortised over three years. After a correction for ‘deferred tax’, the total of these intangible assets is deducted.
The expected credit loss allowance of Financial assets at fair value through other comprehensive income.
For 2025 BNG applies a temporary deduction due to the Trading book, which includes client derivatives.
Adjustments in CRD IV/CRR transition phase
The portion of the revaluation reserve related to Financial assets at fair value through other comprehensive income are fully included in the CET1 capital in 2025 and 2024.
Additional Tier 1 capital
For a clarification, please refer to note 22 of the Notes to items of the consolidated financial statements.
Other notes
Related parties
Transactions with related parties
Transactions with related parties were made on terms equivalent to those that prevail in arm's length.
31-12-2025 | 31-12-2024 | |
|---|---|---|
State of the Netherlands | ||
Direct exposure in the form of purchased government securities | 1,547 | 1,241 |
Lending with direct guarantees from the State | 594 | 605 |
Lending with indirect guarantees from the State (WSW/WfZ) | 56,705 | 53,773 |
Subsidiaries | ||
Credit balances held by subsidiaries | 7 | 9 |
Joint ventures and joint operations | ||
Lending to joint ventures and joint operations | 14 | 32 |
Credit balances held by joint ventures and joint operations | 2 | 11 |
Off-balance sheet commitments to joint ventures and joint operations | 24 | 6 |
Entities with control, joint control or significant influence over BNG
The State of the Netherlands owns 50% of the shares and voting rights of BNG As the other half of the shares is divided between a large number of shareholders, the State of the Netherlands has de facto control over BNG. The holders of Additional Tier 1 capital do not fall within the definition of related parties, as they have no (joint) control or significant influence over BNG. BNG has direct exposure to the State of the Netherlands in the form of purchased, publicly tradable government securities. The bank also has a large portfolio of loans and advances with direct guarantees from the State, or with guarantees from the WSW (social housing) and WfZ (Healthcare) guarantee funds, for which the State of the Netherlands acts as a backstop.
Subsidiaries
This relates to the BNG subsidiary BNG Gebiedsontwikkeling B.V. which is included in the consolidation. BNG has intercompany transactions with this party, which consist of the issue of private loans and advances, credit balances held in current accounts and off-balance sheet commitments. All of these intercompany transactions are eliminated from the figures in and notes to the consolidated financial statements.
Joint ventures and joint operations
This relates to joint ventures and joint operations entered into by BNG Gebiedsontwikkeling B.V. A list of these parties is provided in a separate note in these financial statements. Transactions with these joint ventures consist of loans and advances, credit balances held in current accounts and off-balance sheet commitments (the undrawn portions of credit facilities).
Executive Committee members of the bank
BNG has not granted any loans, advance payments or guarantees to individual members of the Executive Committee or Supervisory Board of BNG.
BNG’s principal decision-making bodies
The most important decisions and acts of management are taken and carried out by the Executive Board. The policy pursued is assessed and supervised by the Supervisory Board.
Remuneration
Since 2020, BNG’s remuneration policy consists solely of fixed remuneration components. The total fixed remuneration, granted to ‘Identified Staff’, i.e. individuals with direct influence on the bank’s policy and risks, was EUR 6.9 million in 2025 (2024: EUR 6.2 million). The Identified Staff comprises of 40 individuals in 2025 (2024: 43).
The remuneration of the Identified Staff can be divided into three groups: Executive Committee, Senior management directly reporting to the Executive Committee and Other identified staff.
(amounts in thousands of euros) | 2025 | 2024 | ||
|---|---|---|---|---|
Fixed remuneration | One-off payment | Fixed remuneration | One-off payment | |
Executive Committee | 1,936 | 136 | 1,451 | - |
Senior management | 4,090 | 174 | 3,858 | - |
Other identified staff | 764 | - | 912 | - |
Total | 6,790 | 310 | 6,221 | - |
In addition, the bank pays a monthly employer’s pension contribution. Since 1 January 2015, pension accrual over salary in excess of EUR 100,000 is no longer possible under the current ABP pension plan. In 2025 this limit remained unchanged EUR 137,800 (2024: EUR 137,800). As a consequence of this cap for tax purposes and the lower pension accrual, BNG decided to compensate the employees concerned who were in the bank’s employment on 1 January 2015 for lower pension accrual. The compensation is fixed as per 1 january 2015 and will not change over the years.
Remuneration of the Executive Committee
The remuneration of the Executive Committee is based on the principles formulated in the Remuneration Policy, the highlights of which are included in the Report of the Supervisory Board. The complete Remuneration Policy is published on bngbank.nl. Since 2002, the fixed remuneration component has only been adjusted by the percentages set out in the general Collective Labour Agreement for the banking industry. As per 2021 no deferred variable remuneration have occurred. Management and staff do not own BNG shares or options and receive no additional remuneration through subsidiaries of the bank.
Remuneration awarded to Executive Committee members
(amounts in thousands of euros) | 2025 | 2024 | 2025 | 2024 | 2025 | 2024 | 2025 | 2024 |
|---|---|---|---|---|---|---|---|---|
Fixed remuneration | One-off payment | Pension contributions | Compensation for pension accrual over salary >100K | |||||
P. Risch CEO (from 1 October 2024) | 401 | 91 | - | - | 35 | 9 | - | - |
G.J. Salden CEO (until 1 June 2024) | - | 151 | - | - | - | 15 | - | - |
O.J. Labe CFO | 416 | 386 | - | - | 36 | 35 | 29 | 29 |
C.A.M. van Atteveldt CRO (until 1 March 2025) | 81 | 311 | - | - | 9 | 35 | - | - |
I.C.C. van Oostwaard CRO (from 1 March 2025) | 292 | - | - | - | 28 | - | - | - |
P.A. Nijsse CCO (from 1 May 2024) | 319 | 193 | - | - | 35 | 23 | - | - |
A. Arooni COO a.i. (from 10 March 2025) | 354 | - | - | - | - | - | - | - |
J. van Goudswaard COO (until 1 March 2025) | 44 | 290 | 136 | - | 17 | 34 | - | - |
Total | 1,907 | 1,422 | 136 | - | 160 | 151 | 29 | 29 |
The Chief Executive Officer (CEO), Chief Financial Officer (CFO) and Chief Risk Officer (CRO) are also members of the Executive Board. The Chief Commercial Officer (CCO) and Chief Operational Officer (COO) are not.
As Chair of the Executive Committee P. Risch received an allowance for business expenses of EUR 5,100 (2024 P. Risch EUR 1,275 and G.J. Salden: EUR 5,100). The maximum allowance for the other statutory members of the Executive Committee is EUR 3,900 in 2025 (2024: EUR 3,900).
Remuneration of the Supervisory Board
Effective from 1 January 2017 the remuneration of the Supervisory Board can increase by the same percentage as the increases under the Collective Labour Agreement for the banking industry. The remuneration policy for the Supervisory Board is directed towards market compatible remuneration that is irrespective of the company’s result. The total remuneration of the Supervisory Board increased with 2% in 2025 (2024: increase of 6%). The remuneration of the Supervisory Board members reflects the nature of the company, the envisaged quality of the Supervisory Board members, the required availability for the task at hand, as well as the time required and aspects of responsibility and liability. Supervisory Board members do not own BNG shares or options and receive no additional remuneration through subsidiaries of the bank.
Members of the Supervisory Board who were appointed or resigned during the financial year received pro rata remuneration. Members of the Audit Committee & Risk Committee, the Selection and Appointment Committee, the Remuneration Committee and the Market Strategy Committee received an additional allowance for these duties. Furthermore, the Chair of the Supervisory Board received an allowance in addition to the basic remuneration. These allowances are set out in the ‘Remuneration of Supervisory Board members’ statement. The Supervisory Board members received an expense allowance of EUR 1,258 (2024: EUR 1,226).
Members who served on one or more committees received an additional expense allowance per committee of EUR 585 (Audit Committee and Risk Committee) and EUR 351 (Remuneration Committee and Human Resource Committee), respectively.
The amounts presented in the following table are in thousands of euros. These figures include additional payments and expense allowances and exclude VAT.
Remuneration awarded to Supervisory Board members
(amounts in thousands of euros) | 2025 | 2024 |
|---|---|---|
H. Arendse, chair | 54 | 48 |
Ms. F. de Vries, vice-chair | 48 | 43 |
J.C.M. van Rutte (until 25 April 2024) | - | 13 |
Ms K.T. Bergstein | 48 | 46 |
J.B.S. Conijn (until 25 April 2024) | - | 15 |
Ms M. Elsinga (from 25 April 2024) | 36 | 26 |
Ms M.E.R. van Elst | 40 | 38 |
L.K. Geluk | 37 | 43 |
C. Korthout (from 25 April 2024) | 48 | 34 |
Total | 311 | 306 |
Off-balance sheet positions
Contingent assets
In the first half of 2023, BNG lost the court case concerning the TLTRO-III. In May of 2025, the court ruled against BNG in the appeal to this initial ruling. BNG has subsequently filed a cassation appeal with the Dutch Supreme Court challenging the decision. The appeal is pending.
Contingent liabilities
This includes all commitments arising from transactions for which the bank has issued guarantees on behalf of a third party. To a limited extent, these guarantees are covered by a counter guarantee from public authorities. These are mainly Letters of Credit with a remaining contractual maturity of more than five years. BNG records liabilities at the underlying principal amount that would need to be paid in the event of the borrower defaulting.
31-12-2025 | 31-12-2024 | |
|---|---|---|
Contingent liabilities | 442 | 501 |
Revocable facilities
This includes all commitments attributable to revocable current-account facilities.
31-12-2025 | 31-12-2024 | |
|---|---|---|
Revocable facilities | 5,204 | 5,383 |
Irrevocable facilities
This includes all irrevocable commitments which can lead to the granting of loans and advances, and is divided as follows:
31-12-2025 | 31-12-2024 | |
|---|---|---|
Outline agreements concerning the undrawn part of credit facilities | 1,731 | 1,695 |
Contracted loans and advances to be distributed in the future | 683 | 1,479 |
Total | 2,414 | 3,174 |
According to contract, these contracted loans and advances will be distributed as follows:
31-12-2025 | 31-12-2024 | |
|---|---|---|
Up to 3 months | 385 | 952 |
3 to 12 months | 164 | 274 |
1 to 5 years | 119 | 228 |
Over 5 years | 15 | 25 |
Total | 683 | 1,479 |
Nearly all these loans and advances have a contractual term to maturity of more than five years. The average interest rate is 2.64% (2024: 2.55%). BNG states these obligations at the underlying, not yet recorded, principal amount.
Encumbered financial assets and liabilities
A part of the financial assets and liabilities is encumbered because these assets serve to secure and act as collateral for money market transactions and lending transactions. The following table shows the nominal sheet values and the collateral values.
31-12-2025 | 31-12-2024 | |||
|---|---|---|---|---|
Nominal value | Collateral value | Nominal value | Collateral value | |
Type of collateral | ||||
Collateral pledged to the central bank | 52,229 | 33,785 | 52,968 | 34,208 |
Securities provided in derivatives transactions | 3,546 | 3,546 | 3,941 | 3,941 |
Cash deposited in relation to derivatives transactions | 3,585 | 3,590 | 3,473 | 3,470 |
Given as collateral | 59,360 | 40,921 | 60,382 | 41,619 |
Securities received in derivatives transactions | - | - | - | - |
Cash received in relation to derivatives transactions | 688 | 689 | 1,506 | 1,510 |
Received as collateral | 688 | 689 | 1,506 | 1,510 |
Total | 58,672 | 40,232 | 58,876 | 40,109 |
Of the total value of loans provided as collateral to the central bank, only a part has actually been used as collateral. At year-end 2025, the value of the collateral in use under the guarantee for clients’ collection files amounted to EUR 2,306 million (year-end 2024: EUR 2,422 million).
Liability of Board members
Members of the Executive and Supervisory Boards of the company are indemnified by the company against any personal liability, except in the case of deliberate intent or gross negligence. In addition, the company has taken out a directors’ liability insurance policy for members of the Executive and Supervisory Boards and employees acting on the company’s behalf as members of the Executive Board or Supervisory Board of the company’s subsidiary.
Proposed profit appropriation
Amounts in millions of euros
2025 | 2024 | |
|---|---|---|
Net profit | 172 | 294 |
Compensation on Additional Tier 1 capital | -14 | -15 |
Profit attributable to shareholders | 158 | 279 |
Appropriation of profit attributable to the bank’s shareholders is as follows: | ||
Appropriation to the 'Retained earnings' pursuant to Article 20(3) of the BNG Bank Articles of Association | 79 | 139 |
Dividend pursuant to Article 20(4) of the BNG Bank Articles of Association | 79 | 140 |
158 | 279 |
The profit appropriation is based on the total net profit for 2025. The proposed dividends have no consequences for tax purposes. The compensation takes into account the EUR 14 million already paid on the Additional Tier 1 capital in May 2025 charged to the Retained earnings.
Joint ventures
31-12-2025 | 31-12-2024 | |
|---|---|---|
Joint ventures entered into by BNG Gebiedsontwikkeling B.V. | ||
Joint development and allocation of land with public authorities, at own expense and risk. The parties involved in the joint ventures have an equal voting right, which means that no single party has control. | ||
CV Ontwikkelingsmaatschappij Zenkeldamshoek, Goor | 0% | 80% |
Zenkeldamshoek Beheer BV, Goor | 0% | 50% |
Development and allocation of land for industrial estates | ||
Ontwikkelingsmaatschappij 'Het Nieuwe Westland' CV, The Hague | 50% | 50% |
Ontwikkelingsmaatschappij 'Het Nieuwe Westland' BV, The Hague | 50% | 50% |
Development and allocation of land for residential construction | ||
Project Suijssenwaerde CV, The Hague | 0% | 80% |
Project Suijssenwaerde Beheer BV, The Hague | 50% | 50% |
Development and allocation of land for residential construction and recreational housing | ||
CV Bedrijvenpark Oostflakkee, The Hague | 80% | 80% |
Bedrijvenpark Oostflakkee Beheer BV, The Hague | 50% | 50% |
Development and allocation of land for industrial estates | ||
SGN Nieuw Rijsenhout CV, The Hague | 50% | 50% |
SGN Bestaand Rijsenhout Beheer BV, The Hague | 0% | 50% |
SGN Nieuw Rijsenhout Beheer BV, The Hague | 50% | 50% |
Stallingsbedrijf Glastuinbouw Nederland Groep BV, The Hague | 50% | 50% |
Development and allocation of land for glasshouse horticulture locations | ||
Ontwikkelmaatschappij Meerburg CV, Zoeterwoude | 0% | 50% |
Ontwikkelmaatschappij Meerburg Beheer BV, Zoeterwoude | 0% | 50% |
Development and allocation of land for residential construction, sports fields and office buildings | ||
De Jonge Voorn BV, Guisveld (Zaandam) | 0% | 80% |
De Jonge Voorn CV, Guisveld (Zaandam) | 0% | 80% |
Development and allocation of land for residential construction |
Summarised financial information
2025 | 2024 | |
|---|---|---|
Joint ventures entered into by BNG Gebiedsontwikkeling B.V. | ||
Balance sheet value of investment (note 10) | 5 | 16 |
Value of the share in: | ||
Total assets | 17 | 34 |
Total liabilities | 12 | 19 |
Income | 2 | 8 |
Result from continued operations | 2 | -1 |
Equity | 5 | 16 |
Comprehensive income | 5 | 16 |
BNG Gebiedsontwikkeling B.V. (a wholly-owned BNG subsidiary) invests in and develops land on its own account in collaboration with local authorities. This collaboration takes the form of a joint venture involving the use of limited partnerships. The risk incurred by BNG is the total amount of capital invested in the participating interest, increased by further future payments obligations and retained profits. At year-end 2025, this risk amounted to EUR 6 million of joint ventures (2024: joint ventures of EUR 16 million), none of this is related to future payment obligations (2024: EUR 0 million).
Involvement in non-consolidated structured entities
2025 | 2024 | |
|---|---|---|
Securitisations | ||
Scope | 17,149 | 18,758 |
Involvement in entity (balance sheet value/size in %) | 17% | 21% |
Balance sheet value of interest/investment: | ||
Interest-bearing securities at amortised cost (from note 7) | 2,997 | 3,880 |
Total balance sheet value | 2,997 | 3,880 |
Maximum exposure | 2,997 | 3,880 |
Ratio of balance sheet value vs maximum exposures | 1 | 1 |
Amount in revenue per type: | ||
Fund return | N/A | N/A |
Management fee | N/A | N/A |
Interest revenue | 98 | 174 |
Results from sales | 0 | 1 |
Total revenue | 98 | 175 |
Involvement in non-consolidated securitisation and covered bond programmes via structured entities
BNG has investments in securitised interest-bearing securities covered by additional security through non-consolidated structured entities. Mortgage portfolios serve as collateral for the securitisations and covered bonds. The funds funded by investors, including BNG, serve to finance the underlying mortgages. The structured entities are independent entities that do not carry out any activities other than managing investments and the associated money flows. Apart from its interest as an investor in interest-bearing securities, BNG has not financed these structured entities or supported them in any other way, nor does it have any intention to do so in the near future. The bank has not transferred any assets to these structured entities.
Events after the balance sheet date
There are no events after the balance sheet date to report that require adjustments to the figures or disclosure in the financial statements.
The Hague, 20 March 2026
Executive Board
Philippine Risch (CEO), statutory director
Olivier Labe (CFO), statutory director
Irene van Oostwaard (CRO), statutory director
Supervisory Board
Huub Arendse, Chair
Femke de Vries, Vice-chair
Karin Bergstein
Marlies van Elst
Marja Elsinga
Constant Korthout
Leonard Geluk
10.2 Company financial statements
Company balance sheet before profit appropriation | |||
|---|---|---|---|
Amounts in millions of euros | NOTE | 31-12-2025 | 31-12-2024 |
Assets | |||
Cash and balances held with central banks | 1,831 | 6,625 | |
Amounts due from banks | 704 | 804 | |
Cash collateral posted | 3,721 | 3,545 | |
Financial assets at fair value through the income statement | 285 | 757 | |
Derivatives | 2,138 | 3,979 | |
Financial assets at fair value through other comprehensive income | 11,795 | 11,322 | |
Interest-bearing securities at amortised cost | 8,105 | 9,133 | |
Loans and advances | 97,627 | 94,537 | |
Value adjustments on loans in portfolio hedge accounting | -10,713 | -2,953 | |
Participating interests | 12 | 25 | |
Property and equipment | 42 | 17 | |
Current tax assets | - | 55 | |
Other assets | 24 | 104 | |
Total assets | 115,571 | 127,950 | |
Liabilities | |||
Amounts due to banks | 1,104 | 1,639 | |
Cash collateral received | 710 | 1,533 | |
Financial liabilities at fair value through the income statement | 232 | 254 | |
Derivatives | 5,009 | 5,546 | |
Debt securities | 94,380 | 103,383 | |
Funds entrusted | 9,023 | 10,526 | |
Subordinated debts | 21 | 19 | |
Current tax liabilities | 30 | - | |
Deferred tax liabilities | 3 | 39 | |
Provisions | 16 | 4 | |
Other liabilities | 180 | 230 | |
Total liabilities | 110,708 | 123,173 | |
Equity | |||
Share capital | 139 | 139 | |
Share premium reserve | 6 | 6 | |
Legal reserves | |||
- Revaluation reserve | 17 | -172 | |
- Cash flow hedge reserve | -13 | 9 | |
- Reserve for fair value increases | 18 | 83 | |
Retained earnings | 4,211 | 4,006 | |
Own credit adjustment | 6 | 9 | |
Cost of hedging reserve | -2 | 94 | |
Net profit | 172 | 294 | |
Equity attributable to shareholders | 4,554 | 4,468 | |
Additional Tier 1 capital | 309 | 309 | |
Total equity | 4,863 | 4,777 | |
Total liabilities and equity | 115,571 | 127,950 |
Company income statement | |||
|---|---|---|---|
Amounts in millions of euros | NOTE | 31-12-2025 | 31-12-2024 |
- Interest revenue calculated using the effective interest method | 5,208 | 6,691 | |
- Other interest revenue | 240 | 255 | |
Total interest revenue | 5,448 | 6,946 | |
- Interest expenses calculated using the effective interest method | 4,901 | 6,348 | |
- Other interest expenses | 51 | 62 | |
Total interest expenses | 4,952 | 6,410 | |
Interest result | 496 | 536 | |
- Commission income | 25 | 34 | |
- Commission expenses | 2 | 4 | |
Commission result | 23 | 30 | |
Result on financial transactions | -31 | -15 | |
Results from participating interests | 1 | -1 | |
Other results | 0 | 0 | |
Total income | 489 | 550 | |
Staff costs | 118 | 100 | |
Other administrative expenses | 52 | 47 | |
Depreciation | 2 | 4 | |
Other operating expenses | 0 | 0 | |
Total operating expenses | 172 | 151 | |
Net impairment losses on financial assets | 41 | -35 | |
Net impairment losses on participating interests | 0 | - | |
Contribution to resolution fund | 0 | 0 | |
Bank Levy | 36 | 31 | |
Total other expenses | 77 | -4 | |
Profit before tax | 240 | 403 | |
Income tax expense | 68 | 109 | |
Net profit | 172 | 294 | |
- of which attributable to the holders of Additional Tier 1 capital | 14 | 15 | |
- of which attributable to shareholders | 158 | 279 |
The references refer to the notes to the company financial statements. The notes to the company financial statements are an integral part of the company financial statements.
When notes are not included in the company section of the financial statements, reference is made to the notes of the consolidated financial statements.
Company statement of comprehensive income | ||
|---|---|---|
Amounts in millions of euros. All figures in the statement are after taxation. | 31-12-2025 | 31-12-2024 |
Net profit | 172 | 294 |
Other comprehensive income | ||
Changes in cash flow hedge reserve: | ||
- Unrealised value changes | -22 | 3 |
- Realised value changes transferred to the income statement | 0 | 0 |
-22 | 3 | |
Changes in cost of hedging reserve | ||
- Unrealised value changes | -93 | 62 |
- Realised value changes transferred to the income statement | -3 | -9 |
-96 | 53 | |
Changes in the revaluation reserve for financial assets at fair value through other comprehensive income | ||
- Unrealised value changes | 177 | -181 |
- Realised value changes transferred to the income statement | 12 | 17 |
189 | -164 | |
Total recyclable results | 71 | -108 |
Non-recyclable results recognised directly in equity: | ||
- Change in fair value attributable to change in credit risk of financial liabilities designated at FVTPL | -3 | 5 |
Total non-recyclable results | -3 | 5 |
Total other comprehensive income | 68 | -103 |
Total | 240 | 191 |
- of which attributable to the holders of Additional Tier 1 capital | 14 | 15 |
- of which attributable to shareholders | 226 | 176 |
Company cash flow statement | ||
|---|---|---|
Amounts in millions of euros | 2025 | 2024 |
Cash flow from operating activities | ||
Profit before tax | 240 | 403 |
Adjusted for: | ||
- Depreciation | 2 | 4 |
- Impairments | 41 | -36 |
- Unrealised results through the income statement | 23 | -2 |
Changes in operating assets and liabilities: | ||
- Changes in Amounts due from and due to banks (not due on demand) | -431 | 491 |
- Changes in Cash collateral posted and received | 4381 | 1,736 |
- Changes in Loans and advances | -982 | -1,913 |
- Changes in Funds entrusted | -1526 | 681 |
- Changes in Derivatives | -369 | 273 |
- Corporate income tax paid | -43 | -88 |
- Other changes from operating activities | -36 | 284 |
Net cash flow from operating activities | 1,300 | 1,833 |
Cash flow from investing activities | ||
Investments and acquisitions pertaining to: | ||
- Financial assets at fair value through the income statement | -5 | -7 |
- Financial assets at fair value through other comprehensive income | -3,966 | -4,797 |
- Interest-bearing securities at amortised cost | -1,333 | -1,726 |
- Investments in subsidiaries and joint ventures | 15 | 12 |
- Property and equipment | -26 | -5 |
Disposals and redemptions pertaining to: | ||
- Financial assets at fair value through the income statement | 463 | 182 |
- Financial assets at fair value through other comprehensive income | 3,575 | 3,886 |
- Interest-bearing securities at amortised cost | 2,078 | 1,728 |
Net cash flow from investing activities | 801 | -727 |
Cash flow from financing activities | ||
Amounts received on account of: | ||
- Financial liabilities at fair value through the income statement | 10 | 52 |
- Debt securities | 315,933 | 342,743 |
Amounts paid on account of: | ||
- Financial liabilities at fair value through the income statement | -18 | -59 |
- Debt securities | -322,666 | -338,698 |
- Compensation on Additional Tier 1 capital | -14 | -15 |
- Dividend distribution to shareholders | -140 | -120 |
Net cash flow from financing activities | -6,895 | 3,903 |
Net change in cash and cash equivalents | -4,794 | 5,009 |
Cash and cash equivalents as at 1 January | 6,627 | 1,618 |
Cash and cash equivalents as at 31 December | 1,833 | 6,627 |
Cash and cash equivalents as at 31 December: | ||
- Cash and balances held with central banks | 1,831 | 6,625 |
- Cash equivalents in the Amount due from banks item | 2 | 2 |
- Cash equivalents in the Amount due to banks item | - | - |
1,833 | 6,627 | |
Notes to cash flow from operating activities | ||
Interest income received | 6,838 | 7,906 |
Interest expenses paid | -6,126 | -6,758 |
712 | 1,148 |
Company statement of changes in equity | ||||||||||||
|---|---|---|---|---|---|---|---|---|---|---|---|---|
Amounts in millions of euros. All figures in the statement are after taxation. | Share capital | Share premium reserve | Revaluation reserve | Cashflow hedge reserve | Reserve for fair value increase | Own credit adjustment | Cost of hedging reserve | Retained earnings | Unappropriated profit | Equity attributable to shareholders | Additional Tier 1 capital | Total |
Balance as at 01/01/2024 | 139 | 6 | -8 | 6 | 165 | 4 | 41 | 3,805 | 254 | 4,412 | 309 | 4,721 |
Total comprehensive income | - | - | -164 | 3 | - | 5 | 53 | - | 294 | 191 | - | 191 |
Transfer to reserve for fair value increases | - | - | - | - | -82 | - | - | 82 | - | - | - | - |
Dividend distribution to the bank's shareholders | - | - | - | - | - | - | - | -120 | - | -120 | - | -120 |
Compensation to holders of Additional Tier 1 capital | - | - | - | - | - | - | - | -15 | - | -15 | - | -15 |
Appropriation from previous year’s profit | - | - | - | - | - | - | - | 254 | -254 | - | - | - |
Balance as at 31/12/2024 | 139 | 6 | -172 | 9 | 83 | 9 | 94 | 4,006 | 294 | 4,468 | 309 | 4,777 |
Total comprehensive income | - | - | 189 | -22 | - | -3 | -96 | - | 172 | 240 | - | 240 |
Transfer to reserve for fair value increases | - | - | - | - | -65 | - | - | 65 | - | - | - | - |
Dividend distribution to the bank's shareholders | - | - | - | - | - | - | - | -140 | - | -140 | - | -140 |
Compensation to holders of Additional Tier 1 capital | - | - | - | - | - | - | - | -14 | - | -14 | - | -14 |
Appropriation from previous year’s profit | - | - | - | - | - | - | - | 294 | -294 | - | - | - |
Balance as at 31/12/2025 | 139 | 6 | 17 | -13 | 18 | 6 | -2 | 4,211 | 172 | 4,554 | 309 | 4,863 |
BNG has not recognised any results from minority interests in the equity which is attributable to third parties. With the exception of Additional Tier 1 capital, the entire equity is attributable to the shareholders.
Accounting principles for the company financial statements
The company financial statements are prepared in accordance with the International Financial Reporting Standards (IFRS) as issued by the International Accounting Standard Board (IASB) and adopted throughout the European Union (EU), and with Part 9, Book 2 of the Dutch Civil Code. The company financial statements are prepared in (millions of) euros, unless stated otherwise. The euro is used as the functional and reporting currency of BNG. As far as the financial accounting principles are concerned, reference is made, with the exception of the accounting principles mentioned below, to the notes to the accounting principles for the consolidated financial statements.
Participating interests
The balance sheet item Participating interests is stated according to the equity method.
Statutory reserve for fair value increases
Pursuant to Section 2:390 sub 1 of the Dutch Civil Code, for capital protection purposes a statutory reserve must be maintained at the expense of the freely distributable reserves (other reserves) or freely distributable profit (unappropriated profit) in relation to fair value increases of financial instruments stated as assets in the balance sheet for which there is no regular market quotation.
Notes to the company financial statements
Amounts in millions of euros.
1 Cash and balances held with central banks
31-12-2025 | 31-12-2024 | |
|---|---|---|
Cash on hand | 0 | 0 |
Current account balances with the central bank (due on demand) | 1,831 | 6,625 |
Total | 1,831 | 6,625 |
2 Amounts due from banks
The Amounts due from banks item includes all receivables from banks measured at amortised cost.
31-12-2025 | 31-12-2024 | |
|---|---|---|
Short-term loans and current account balances | 2 | 2 |
Long-term lending | 702 | 800 |
Repos | 0 | 2 |
Total | 704 | 804 |
3 Cash collateral posted
The cash collateral amounts of EUR 3,721 million (2024: EUR 3,545 million) is posted with third parties under credit support annexes in netting agreements and as such is not freely available to BNG.
4 Financial assets at fair value through the income statement
This item includes:
financial assets mandatorily measured at fair value through the income statement. This concerns financial assets that have failed to pass the SPPI test; and
financial assets designated as measured at fair value through the income statement.
31-12-2025 | 31-12-2024 | |
|---|---|---|
Mandatorily measured at fair value through the income statement | ||
Loans and advances | 29 | 31 |
Designated as measured at fair value through the income statement | ||
Loans and advances | 174 | 210 |
Interest-bearing securities | 82 | 516 |
Total | 285 | 757 |
The total redemption value of these loans and advances and interest bearing securities at year-end 2025 is EUR 285 million (2024: EUR 757 million).
5 Derivatives
This balance sheet item includes the derivatives with a positive fair value.
31-12-2025 | 31-12-2024 | |
|---|---|---|
Derivatives not involved in a hedge accounting relationship | 32 | 476 |
Derivatives involved in a portfolio hedge accounting relationship | 1,340 | 1,195 |
Derivatives involved in a micro hedge accounting relationship | 759 | 2,259 |
Receivables related to STM derivative contracts | 7 | 49 |
Total | 2,138 | 3,979 |
6 Financial assets at fair value through other comprehensive income
This includes purchased interest-bearing securities that are held within the Hold-to-Collect and Sell business model and for which the bank has not used the fair value option.
31-12-2025 | 31-12-2024 | |
|---|---|---|
Governments | 5,577 | 5,478 |
Supranational organisations | 2,148 | 2,556 |
Credit institutions | 4,070 | 2,908 |
Other institutions | - | 380 |
Total | 11,795 | 11,322 |
At year-end 2025, BNG had transferred EUR 321 million (2024: 325 million) of financial assets at fair value through other comprehensive income to repurchase transactions without derecognition.
7 Interest-bearing securities at amortised cost
This includes purchased interest-bearing securities that are held within the Hold-to-Collect business model and for which the bank has not used the fair value option.
31-12-2025 | 31-12-2024 | |
|---|---|---|
Governments | 1,282 | 1,299 |
Supranational organisations | 1,983 | 2,443 |
Other financial corporations | 3,313 | 4,145 |
Non-financial corporations | 1,527 | 1,246 |
Allowance for credit losses | -0 | -0 |
Total | 8,105 | 9,133 |
At year-end 2025, BNG had transferred EUR 2,088 million (2024: 2,374 million) of interest-bearing securities at amortised cost to repurchase transactions without derecognition.
8 Loans and advances
The Loans and advances item includes short-term and long-term loans to clients insofar as they pass the SPPI test, as well as current account debit balances held by clients. All positions are held within the Hold-to-Collect business model.
31-12-2025 | 31-12-2024 | |
|---|---|---|
Short-term loans and current account balances | 1,591 | 1,182 |
Long-term lending | 96,134 | 93,412 |
97,725 | 94,594 | |
Allowance for credit losses | -98 | -57 |
Total | 97,627 | 94,537 |
At year-end 2025, the collateral value of the portion of the loans and advances contributed as collateral to DNB amounted to EUR 33,8 billion (2024: EUR 32.2 billion).
9 Value adjustments on loans in portfolio hedge accounting
This refers to the value adjustments of the effective portion of the hedged interest rate risk of hedged assets involved in a portfolio hedge accounting relationship.
2025 | 2024 | |
|---|---|---|
Movements of value adjustments on loans in portfolio hedge accounting | ||
Opening balance | -2,953 | -5,037 |
Movements in the unrealised portion in the financial year | -8,220 | 1,719 |
Amortisation in the financial year | 461 | 352 |
Movements in the realised portion in the financial year | -1 | 13 |
Closing balance | -10,713 | -2,953 |
10 Participating interests
31-12-2025 | 31-12-2024 | 31-12-2025 | 31-12-2024 | |
|---|---|---|---|---|
Participating share | Balance sheet value | |||
Subsidiaries | ||||
BNG Gebiedsontwikkeling BV, The Hague | 100% | 100% | 12 | 25 |
For a description of the bank’s subsidiary and joint ventures, please refer to section 'Related parties' and to section 'Joint ventures', respectively, of the consolidated financial statements. For summarised financial information on joint ventures, refer to section ‘Summarised financial information’.
11 Property and equipment
2025 | 2024 | 2025 | 2024 | 2025 | 2024 | 2025 | 2024 | |
|---|---|---|---|---|---|---|---|---|
Property | Equipment | Right-of-use-asset | Total | |||||
Historical cost | ||||||||
Opening balance | 13 | 50 | 19 | 29 | 4 | 4 | 36 | 83 |
Investments | 26 | 5 | 0 | 1 | 1 | 0 | 27 | 6 |
Divestment | - | -42 | -13 | -11 | - | - | -13 | -53 |
Value as at 31 December | 39 | 13 | 6 | 19 | 5 | 4 | 50 | 36 |
Depreciation | ||||||||
Accumulated depreciation as at 1 January | - | 40 | 17 | 26 | 2 | 2 | 19 | 68 |
Depreciation during the year | - | 2 | 2 | 2 | 0 | 0 | 2 | 4 |
Divestments depreciation | - | -42 | -13 | -11 | - | - | -13 | -53 |
Accumulated depreciation as at 31 December | - | - | 6 | 17 | 2 | 2 | 8 | 19 |
Total | 39 | 13 | 0 | 2 | 3 | 2 | 42 | 17 |
Estimated useful life | |
|---|---|
Buildings | 30 years |
Technical installations | 15 years |
Machinery and inventory | 5 years |
Right-of-use asset | 1-5 years |
Hardware and software | 3 years |
No property or equipment is pledged as security of liabilities.
12 Other assets
The other assets at year-end 2025 of EUR 24 million (2024: EUR 104 million) primarily comprise amounts receivable from lending to clients and reconciling of prepaid license fees.
13 Amounts due to banks
31-12-2025 | 31-12-2024 | |
|---|---|---|
Current account balances | 0 | 0 |
Deposits | 420 | 917 |
Private loans | 683 | 722 |
Repos | 1 | - |
Total | 1,104 | 1,639 |
14 Cash collateral received
The cash collateral at year-end 2025 of EUR 710 million (2024: EUR 1,533 million) is received from third parties under netting agreements and as such is not freely available to BNG.
15 Financial liabilities at fair value through the income statement
This item includes debt securities and deposits designated as measured at fair value with changes in fair value recognised through the income statement.
31-12-2025 | 31-12-2024 | |
|---|---|---|
Debt securities | 225 | 238 |
Deposits | 7 | 16 |
Total | 232 | 254 |
The total redemption value of these debt securities and deposits at year-end 2025 is EUR 213 million (2024: EUR 219 million). The difference between the financial liability's carrying amount and the redemption value at year-end 2025 is EUR 19 million (2024: EUR 35 million). Financial liabilities are measured at fair value through the income statement on the relevant funding curve including a mark-up for own credit risk. The total change in value (before tax) was EUR 8 million positive (2024: EUR 12 million positive). Changes in fair value due to own credit risk are recognised through other comprehensive income. These changes are determined by comparing the valuation using the relevant funding curve including a mark-up for own credit risk and the valuation using the relevant funding curve without this mark-up.
16 Derivatives
This balance sheet item includes the derivatives with a negative fair value.
31-12-2025 | 31-12-2024 | |
|---|---|---|
Derivatives not involved in a hedge accounting relationship | 45 | 279 |
Payables related to STM derivative contracts | 14 | - |
Derivatives involved in a portfolio hedge accounting relationship | 1,764 | 3,698 |
Derivatives involved in a micro hedge accounting relationship | 3,186 | 1,569 |
Total | 5,009 | 5,546 |
17 Debt securities
This includes bonds and other issued debt securities with either fixed or variable interest rates. Any sold portion of an issue is deducted from the relevant bond.
31-12-2025 | 31-12-2024 | |
|---|---|---|
Bond loans | 91,984 | 91,844 |
Commercial Paper | 1,898 | 1,922 |
Privately placed debt securities | 498 | 9,617 |
Total | 94,380 | 103,383 |
18 Funds entrusted
31-12-2025 | 31-12-2024 | |
|---|---|---|
Current account balances | 3,422 | 3,866 |
Short-term deposits | 1,790 | 2,331 |
Long-term deposits | 3,811 | 4,329 |
Total | 9,023 | 10,526 |
19 Subordinated debt
31-12-2025 | 31-12-2024 | |
|---|---|---|
Subordinated debt | 21 | 19 |
Total | 21 | 19 |
20 Taxes
The bank has registered deferred tax liabilities for the actuarial results for the employee benefits provision, the revaluation reserve, the own credit adjustment, the compensation on Additional Tier 1 capital and for the cash flow hedge reserve, for which the movements are recognised through equity..
31-12-2025 | 31-12-2024 | |
|---|---|---|
Current tax liabilities/assets | -30 | 55 |
Deferred tax liabilities | -3 | -39 |
Total | -33 | 16 |
BNG and the Dutch tax authorities have concluded a bilateral agreement (‘vaststellingsovereenkomst’) on 14 February 2024 that the financial figures based on IFRS 9 can be applied for tax purposes for the period 2024-2026. The bilateral agreement applies to the BNG fiscal unit. Pursuant to the agreement, all financial instruments are stated – for both reporting and tax purposes – in accordance with the IFRS principles of valuation, with the exception of transactions classified as Financial assets at fair value through the income statement. All transactions within this category are valued for tax purposes at the lower of either the cost price or the market value. The result for tax purposes differs from the result for reporting purposes if, on balance, unrealised losses have arisen. If the revaluation reserve increases, the positive amount is added to the annual profit for tax purposes up to the level at which the cost price is reached.
The reconciliation between the effective tax rate and the nominal tax rate is as follows:
2025 | 2024 | |
|---|---|---|
Profit before tax | 240 | 403 |
Tax levied at the nominal tax rate | -62 | -104 |
Tax adjustment from previous years | 0 | 0 |
Participation exemption | 0 | 0 |
Deductible interest on Additional Tier 1 capital | 4 | 4 |
Non-deductible costs (bank levy and thin cap) | -10 | -9 |
Effective tax | -68 | -109 |
Nominal tax rate | 25.8% | 25.8% |
Effective tax rate | 28.2% | 27.0% |
2025 | ||||
|---|---|---|---|---|
Opening balance | Changes through equity | Changes through the income statement | Closing balance | |
Changes in deferred taxes | ||||
Revaluation reserve FVOCI | - | -6 | - | -6 |
Cash flow hedge reserve | -3 | 8 | - | 5 |
Own Credit Adjustment | -3 | 1 | - | -2 |
Cost of hedging | -33 | 33 | - | 0 |
Additional Tier 1 capital | -2 | - | 0 | -2 |
Employee benefits provision | 0 | - | 0 | 0 |
Property | 2 | - | - | 2 |
Total | -39 | 36 | 0 | -3 |
2024 | ||||
|---|---|---|---|---|
Opening balance | Changes through equity | Changes through the income statement | Closing balance | |
Changes in deferred taxes | ||||
Cash flow hedge reserve | -3 | 0 | - | -3 |
Own Credit Adjustment | -1 | -2 | - | -3 |
Cost of hedging | -14 | -19 | - | -33 |
Additional Tier 1 capital | -2 | 0 | 0 | -2 |
Employee benefits provision | 0 | - | 0 | 0 |
Property | 1 | 1 | - | 2 |
Total | -19 | -20 | 0 | -39 |
21 Provisions
The provisions consist of several elements: a restructuring provision, an employee benefit provision and other provisions.
In 2025 BNG announced a reorganisation related to the strategy 'Route naar Meer Meerwaarde' (‘Route to added value’) and, as a result, recognised a restructuring provision of EUR 15 million. The strategy 'Route to added value' aims to professionalize the organization and embed chain management. The main drivers of the resutructuring provision are the continued payment of wages for a period 6 months and a transition compensation acoording to the social arrangement.
The employee benefits provision comprises two components: a provision of EUR 0.5 million (2024: EUR 1 million) for interest rate discounts on mortgage loans granted to active and retired employees, and a provision of EUR 1 million (2024: EUR 1 million) for vitality leave. Both provisions are long‑term in nature. The bank no longer offers mortgage loans to employees. Other provisions are related to commitments and guarantees.
31-12-2025 | 31-12-2024 | |
|---|---|---|
Restructuring provision | 15 | 1 |
Employee benefits provision | 1 | 2 |
Other provisions | 0 | 1 |
Total | 16 | 4 |
The movements in the present value of the provisions in relation to restructuring provisions, the defined benefit obligations for the mortgage interest rate discount and the vitality leave provision are as follows:
2025 | 2024 | 2025 | 2024 | 2025 | 2024 | 2025 | 2024 | |
|---|---|---|---|---|---|---|---|---|
Restructuring provision | Employee benefits provision | Other provisions | Total | |||||
Provision as at 1 January | 1 | 10 | 2 | 3 | 1 | 6 | 4 | 19 |
Utilised | -1 | -9 | -1 | -1 | 0 | 0 | -2 | -10 |
Additions | 15 | - | 0 | 0 | 0 | 0 | 15 | 0 |
Releases | - | - | 0 | 0 | -1 | -5 | -1 | -5 |
Provision as at 31 December | 15 | 1 | 1 | 2 | 0 | 1 | 16 | 4 |
22 Other liabilities
31-12-2025 | 31-12-2024 | |
|---|---|---|
Amounts received in advance | 141 | 152 |
Other liabilities | 39 | 78 |
Total | 180 | 230 |
Amounts received in advance consists of a compensation for the lower return on cash collateral payments that has been received due to a discounting switch from EONIA to €STR that has taken place at clearing houses as part of the Interest Rate Benchmark Reform in 2020. This compensation is amortised over the weighted average of underlying derivatives at the moment of the switch. EUR 11 million will be amortised in the next year (2024: EUR 11 million).
The remaining other liabilities are mainly composed of amounts payable related to derivatives and other financial transactions which are settled in the next period.
23 Equity
Since BNG has no minority interests after consolidation, the entire consolidated equity, excluding Additional Tier 1 capital, is attributable to shareholders. The items included in equity are explained below.
31-12-2025 | 31-12-2024 | |
|---|---|---|
Share capital | 139 | 139 |
Share premium reserve | 6 | 6 |
Revaluation reserve | 17 | -172 |
Cash flow hedge reserve | -13 | 9 |
Own credit adjustment | 6 | 9 |
Cost of hedging | -2 | 94 |
Reserve for fair value increases | 18 | 83 |
Retained Earnings | 4,211 | 4,006 |
Unappropriated profit | 172 | 294 |
Equity attributable to shareholders | 4,554 | 4,468 |
Additional Tier 1 capital | 309 | 309 |
Total | 4,863 | 4,777 |
2025 | 2024 | |
|---|---|---|
Number of paid-up shares outstanding | 55,690,720 | 55,690,720 |
Proposed dividend per share in euros | 1.41 | 2.51 |
Proposed dividend pursuant to the Articles of Association | 79 | 140 |
The proposed dividend distribution for 2025 takes into account the EUR 79 million compensation (before tax) that has already been paid on the Additional Tier 1 capital in 2025. This payment was charged to the Retained earnings.
For the financial year 2024 a dividend of EUR 140 million was proposed to the General Meeting of Shareholders held in the first half of 2025 and is distributed to the bank's shareholders in April 2025.
Share capital
The authorised capital is divided into 100 million shares with a nominal value of EUR 2.50 each, of which 55,690,720 shares have been issued and fully paid up. The number of shares in circulation remained unchanged during the financial year. BNG and its subsidiaries hold no company shares.
None of the shares carry preferential rights, nor are they subject to restrictions. There are no options that can be exercised to obtain entitlement to the issue of shares.
Share premium reserve
There were no movements in 2025 and 2024.
Revaluation reserve
At year-end 2025 the revaluation reserve of EUR 17 million positive includes EUR 264 million negative (2024: 135 million negative) in unrealised value changes, excluding the value of the hedged part of the interest-rate risk of interest-bearing securities involved in hedge accounting, which are recognised in the Financial assets at fair value through other comprehensive income. The revaluation reserve has been adjusted for taxes. Upon the sale of these assets, the associated cumulative result recognised in equity is transferred to the income statement.
Cash flow hedge reserve
The effective portion of the unrealised changes in the value of derivatives involved in a cash flow hedge relationship, resulting from changes in the foreign exchange rates, are recognised in the cash flow hedge reserve. The cash flow hedge reserve is adjusted for taxes.
Own credit adjustment
The Own Credit Adjustment amounts to EUR 6 million net of taxes (2024: EUR 9 million). This adjustment relates to changes in credit risk of financial liabilities measured at fair value through the income statement.
Cost of hedging reserve
The cost of hedging reserve records movements in foreign currency basis spreads in cross currency swaps involved in hedge accounting and is amortised over the life of the hedge. The cumulative movements will reduce to nil by maturity of the hedging instrument.
Retained earnings
After determination of the appropriations of the distributable profit pursuant to the Articles of Association, the General Meeting of Shareholders decides which portion of the remaining profit is added to the Retained earnings. In 2025, the payment of a dividend of EUR 140 million (2024: EUR 120 million) was scheduled. EUR 14 million (before tax) was distributed to the holders of the Additional Tier 1 capital in 2025 (2024: EUR 15 million), charged to the Retained earnings.
Unappropriated profit
The balance sheet is prepared prior to profit appropriation. This item represents the total result achieved after deduction of corporate income tax.
Additional Tier 1 capital
As per 31 December 2025 the bank’s Additional Tier 1 capital amounts to EUR 309 million. The instruments are structured in line with CRR requirements and the EBA guidelines and qualify as additional Tier 1 capital. Additional Tier 1 capital concerns perpetual loans involving an annual non-cumulative discretionary payment on the outstanding principal amount, subject to temporary write-down in the event that the CET1 ratio falls below 5.125%. In case of write-down, this amount will be transferred to the retained earnings. Write-down from the Retained earnings can be reversed (write-up) under certain conditions at the moment that the trigger ratio is back above 5.125% again. BNG is entitled to distribute the interest payment on a discretionary basis in the form of a compensation charged to the retained earnings. The compensation is determined on the basis of the prevailing principal amount. The distributed compensation is deductible for corporate income tax. BNG has the unilateral contractual option to call the Additional Tier 1 capital issued. The tranches issued in 2016 (a nominal amount of EUR 309 million) can be redeemed every year from May 2022, in 2025 the bank chose not to redeem the tranche this year.
24 Interest result
Interest revenue calculated by using the effective interest method includes all positive interest results from both traditional financial instruments and derivatives involved in hedge accounting, including negative interest expenses on financial liabilities. In addition, other credit-related income received is included in this item. Interest revenues on assets that were subject to impairment are recognised on the original effective interest percentage, as long as the expected interest cash flows are received.
Interest expenses calculated by using the effective interest method include all negative interest results from both traditional financial instruments and derivatives involved in hedge accounting, including negative interest revenue on financial assets. The costs of borrowing as well as other interest-related charges are also recognised.
Other interest revenue and expenses consist mainly of interest results of derivatives not involved in hedge accounting and interest results of financial assets and liabilities measured at fair value.
2025 | 2024 | |||
|---|---|---|---|---|
Interest revenue | ||||
Interest revenue calculated by using the effective interest method: | ||||
- Financial assets at amortised cost | 3,009 | 3,425 | ||
- Financial assets at fair value through other comprehensive income | 287 | 251 | ||
- Derivatives involved in hedge accounting | 1,897 | 2,990 | ||
- Negative interest expenses on financial liabilities | 15 | 25 | ||
5,208 | 6,691 | |||
Other interest revenue: | ||||
- Financial assets designated at fair value through the income statement | 26 | 40 | ||
- Financial assets mandatory at fair value through the income statement | 1 | 1 | ||
- Derivatives not involved in hedge accounting | 200 | 201 | ||
- Other | 13 | 13 | ||
240 | 255 | |||
Total interest revenue | 5,448 | 6,946 | ||
Interest expenses | ||||
Interest expenses calculated by using the effective interest method: | ||||
- Financial liabilities at amortised cost | 3,059 | 3,177 | ||
- Derivatives involved in hedge accounting | 1,802 | 3,050 | ||
- Negative interest expenses on financial assets | 40 | 121 | ||
4,901 | 6,348 | |||
Other interest expenses | ||||
- Financial liabilities designated at fair value through the income statement | 8 | 9 | ||
- Derivatives not involved in hedge accounting | 33 | 43 | ||
- Other | 10 | 10 | ||
51 | 62 | |||
Total interest expenses | 4,952 | 6,410 | ||
Total interest result | 496 | 536 | ||
25 Commission result
Commission income
This item includes income from services provided to third parties.
2025 | 2024 | |
|---|---|---|
Income from loans and credit facilities | 16 | 24 |
Income from payment services | 9 | 10 |
Total | 25 | 34 |
Commission expenses
This item comprises expenses totalling EUR 2 million (2024: EUR 4 million) relating to services rendered by third parties in relation to loans, credit facilities and payment services.
26 Result on financial transactions
This item includes the result on financial transactions broken down into realised and unrealised market value adjustments.
2025 | 2024 | |||
|---|---|---|---|---|
Market value changes in financial assets at fair value through the income statement resulting from changes in credit and liquidity spreads, consisting of: | ||||
- Interest-bearing securities | 1 | 5 | ||
- Structured loans | 2 | -7 | ||
3 | -2 | |||
Result on hedge accounting | ||||
- Portfolio fair value hedge accounting | -78 | 39 | ||
- Micro fair value hedge accounting | 34 | -46 | ||
- Micro cash flow hedge accounting | 0 | 1 | ||
-44 | -6 | |||
Change in counterparty credit risk of derivatives (CVA/DVA) | 8 | -2 | ||
Realised sales and buy-out results | -6 | -18 | ||
Other market value changes | 8 | 13 | ||
Total | -31 | -15 | ||
The result from market value changes in financial assets at fair value through the income statement increased to EUR 3 million positive in 2025 (2024: EUR 2 million negative). Lower credit and liquidity spreads had a positive impact on the market value changes of interest-bearing securities compared to 2024.
The result on hedge accounting contains the fair value movements of the derivatives in hedge accounting relationships and the fair value movements of the hedged items. The result decreased to EUR 44 million negative in 2025 (2024: EUR 6 million negative). The result on hedge accounting is due to ineffectiveness of hedge relationships. This is due to increased long term interest rates, volatile foreign currencies, realised sales of interest-bearing securities.
The realised sales and buy-out results of EUR 6 million negative (2024: 18 million negative) are mainly due to on balance results on the sales of interest-bearing securities from the liquidity portfolio of the bank.
27 Results from participating interests
2025 | 2024 | |
|---|---|---|
Subsidiaries | 1 | -1 |
Total | 1 | -1 |
For a description of the bank’s joint ventures, please refer to section 'Joint ventures' in the consolidated financial statements.
28 Staff costs
2025 | 2024 | |
|---|---|---|
Wages and salaries | 51 | 48 |
Pension costs | 7 | 7 |
Social security costs | 6 | 5 |
Additions to the employee benefits provision | 0 | 0 |
External employees | 32 | 34 |
Other staff costs | 22 | 6 |
Total | 118 | 100 |
There was no variable remuneration of individual staff members in 2025 and 2024.
29 Other administrative expenses
These expenses include, among other things, outsourcing costs, maintenance costs of property and equipment, consultancy costs, training expenses and IT expenses. The total other administrative expenses for 2025 amounted to EUR 52 million (2024: EUR 47 million).
In conformity with Section 382a of Part 9, Book 2 of the Dutch Civil Code, a breakdown of the fees paid to the independent auditors for audits and audit-related and non-audit-related services is given in note 34 to the consolidated financial statements.
30 Depreciation
A breakdown of this item is included in the note on Property and equipment (note 11). In total, the depreciation charges amounted to EUR 2 million in 2025 (2024: EUR 4 million).
31 Impairments
The impairments in 2025 amounted to an expense of EUR 41 million in the income statement (2024: EUR 35 million profit).
2025 | ||||
|---|---|---|---|---|
Stage 1 | Stage 2 | Stage 3 | Total | |
Impairment results due to movements in allowances: | ||||
- Increases in allowances due to origination and acquisition | 1 | 0 | 12 | 13 |
- Changes in allowances due to changes in credit risk (net) | 1 | 14 | 33 | 48 |
- Decreases in allowances due to derecognition | 0 | -1 | -21 | -22 |
2 | 13 | 24 | 39 | |
Impairment results not due to movements in allowances: | ||||
- Impairment result due to closings (no write-off) | - | - | 1 | 1 |
- Reversal of impairment due to cash flows received from past write-offs | - | - | 0 | 0 |
- | - | 1 | 1 | |
Net impairment result on financial assets | 2 | 13 | 25 | 40 |
2024 | ||||
|---|---|---|---|---|
Stage 1 | Stage 2 | Stage 3 | Total | |
Impairment results due to movements in allowances: | ||||
- Increases in allowances due to origination and acquisition | 1 | 0 | 0 | 1 |
- Changes in allowances due to changes in credit risk (net) | -2 | -5 | 3 | -4 |
- Decreases in allowances due to derecognition | -1 | -1 | -20 | -22 |
-2 | -6 | -17 | -25 | |
Impairment results not due to movements in allowances: | ||||
- Reversal of impairment due to cash flows received from past write-offs | - | - | -5 | -5 |
- Impairments due to write-offs | - | - | -5 | -5 |
- | - | -10 | -10 | |
Net impairment result on financial assets | -2 | -6 | -27 | -35 |
Movement in allowances for expected credit losses
2025 | ||||
|---|---|---|---|---|
Stage 1 | Stage 2 | Stage 3 | Total | |
- Increases in allowances due to origination and acquisition | 1 | 0 | 12 | 13 |
- Changes in allowances due to changes in credit risk (net) | 1 | 14 | 33 | 48 |
- Decreases in allowances due to derecognition | 0 | -1 | -21 | -22 |
- Decreases in allowance due to write-offs | - | - | - | - |
Total movements in allowances | 2 | 13 | 24 | 39 |
2024 | ||||
|---|---|---|---|---|
Stage 1 | Stage 2 | Stage 3 | Total | |
- Increases in allowances due to origination and acquisition | 1 | 0 | 0 | 1 |
- Changes in allowances due to changes in credit risk (net) | -2 | -5 | 3 | -4 |
- Decreases in allowances due to derecognition | -1 | -1 | -24 | -26 |
- Decreases in allowance due to write-offs | - | - | -9 | -9 |
Total movements in allowances | -2 | -6 | -30 | -38 |
Note 33 provides an overview of the breakdown of financial assets subject to impairment into impairment stages, as well as details on the movement in the allowance for expected credit losses in 2025.
The changes in the incurred loss provision are included in the Loans and advances item (Note 8).
32 Contribution to resolution fund and bank levy
Contribution to resolution fund
The European resolution regime arising from the Bank Recovery and Resolution Directive entered into force on 1 January 2015. The expenses for the resolution fund are deductible for corporate income tax purposes. No contribution was done in 2024 and 2025 as the Single Resolution Funds reached its target at the end of 2023.
Bank levy
The expenses concerning the bank levy are not deductible for corporate income tax purposes. As a consequence, the effective tax burden exceeds the nominal tax rate in 2025 and 2024. BNG is due to pay the bank levy in October of every year, which for 2025 amounted to EUR 36 million (2024: EUR 31 million). The increase is caused by a higher tax percentage and a higher balance sheet total as at 31 December 2024.
2025 | 2024 | |
|---|---|---|
The bank levy is calculated as follows: | basis 2024 | basis 2023 |
Balance sheet total | 127,941 | 115,541 |
Less: Tier 1 capital | 4,449 | 4,406 |
Less: Deposits covered by the deposit-guarantee scheme | 55 | 50 |
Taxable base | 123,437 | 111,085 |
Less: Efficiency exemption | 23,500 | 23,500 |
Taxable base | 99,937 | 87,585 |
Total sum of debts with a maturity of less than one year | 30,587 | 25,753 |
Total sum of all debts, according to the balance sheet | 123,164 | 110,819 |
Bank levy on short-term debt | 14 | 12 |
Bank levy on long-term debt | 22 | 19 |
Total calculated/due | 36 | 31 |
33 Impairment of financial assets and off-balance sheet commitments
Breakdown of financial assets and off-balance sheet commitments into impairment stages
The following tables provide a breakdown of the financial assets subject to impairment and off-balance sheet commitments into the 3 impairment stages:
Stage 1: performing exposures without significant increase in credit risk (SICR) since initial recognition.
Stage 2: performing exposures with significant increase in credit risk since initial recognition.
Stage 3: non-performing exposures.
31-12-2025 | |||||||
|---|---|---|---|---|---|---|---|
Gross carrying amount | Allowance for credit loss | ||||||
Carrying amount | Performing | Non-performing | Performing | Non-performing | |||
Stage 1 | Stage 2 | Stage 3 | Stage 1 | Stage 2 | Stage 3 | ||
Cash and balances held with central banks | 1,831 | 1,831 | - | - | - | - | - |
Amounts due from banks | 704 | 704 | - | - | 0 | - | - |
Cash collateral posted | 3,721 | 3,721 | - | - | - | - | - |
Financial assets at fair value through Other comprehensive income | 11,795 | 11,795 | - | - | - | - | - |
Interest-bearing securities at amortised cost | 8,105 | 8,105 | - | - | 0 | - | - |
Loans and advances | 97,627 | 96,489 | 885 | 351 | -4 | -23 | -71 |
Total | 123,783 | 122,645 | 885 | 351 | -4 | -23 | -71 |
31-12-2024 | |||||||
|---|---|---|---|---|---|---|---|
Gross carrying amount | Allowance for credit loss | ||||||
Carrying amount | Performing | Non-performing | Performing | Non-performing | |||
Stage 1 | Stage 2 | Stage 3 | Stage 1 | Stage 2 | Stage 3 | ||
Cash and balances held with central banks | 6,625 | 6,625 | - | - | - | - | - |
Amounts due from banks | 804 | 804 | - | - | 0 | - | - |
Cash collateral posted | 3,545 | 3,545 | - | - | - | - | - |
Financial assets at fair value through Other comprehensive income | 11,322 | 11,322 | - | - | - | - | - |
Interest-bearing securities at amortised cost | 9,133 | 9,133 | - | - | 0 | - | - |
Loans and advances | 94,537 | 93,534 | 600 | 460 | -3 | -10 | -44 |
Total | 125,966 | 124,963 | 600 | 460 | -3 | -10 | -44 |
31-12-2025 | ||||||
|---|---|---|---|---|---|---|
Nominal amount | Provision | |||||
Performing | Non-performing | Performing | Non-performing | |||
Stage 1 | Stage 2 | Stage 3 | Stage 1 | Stage 2 | Stage 3 | |
Off-balance sheet commitments | ||||||
Contingent liabilities | 442 | 1 | 0 | 0 | 0 | - |
Revocable facilities | 5,117 | 63 | 22 | - | - | - |
Irrevocable facilities | 2,413 | 1 | 0 | 0 | 0 | - |
Total | 7,972 | 65 | 22 | 0 | 0 | - |
31-12-2024 | ||||||
|---|---|---|---|---|---|---|
Nominal amount | Provision | |||||
Performing | Non-performing | Performing | Non-performing | |||
Stage 1 | Stage 2 | Stage 3 | Stage 1 | Stage 2 | Stage 3 | |
Off-balance sheet commitments | ||||||
Contingent liabilities | 499 | 0 | 1 | - | - | -1 |
Revocable facilities | 5,296 | 72 | 14 | - | - | - |
Irrevocable facilities | 3,168 | 0 | 6 | - | - | - |
Total | 8,963 | 72 | 21 | - | - | -1 |
Movements in allowances and provisions for expected credit losses
The following table shows the movements in allowances for expected credit losses for financial assets and the provision for expected credit losses for off-balance sheet commitments.
2025 | ||||||
|---|---|---|---|---|---|---|
Opening balance | Increases due to origination and acquisition | Decrease due to derecognition repayments and disposals | Changes due to change in credit risk (net) | Decrease in allowance account due to write-offs | Closing balance | |
Allowances | ||||||
Cash and balances held with central banks | - | - | - | - | - | - |
Amounts due from banks | 0 | - | 0 | 0 | - | 0 |
Financial assets at fair value through other comprehensive income | 0 | 0 | 0 | 0 | - | 0 |
Interest-bearing securities at amortised cost | 0 | 0 | 0 | 0 | - | 0 |
Loans and advances | 57 | 13 | -20 | 48 | 0 | 98 |
57 | 13 | -20 | 48 | 0 | 98 | |
Provision | ||||||
Off-balance sheet commitments | 1 | 0 | -1 | 0 | - | 0 |
2024 | ||||||
|---|---|---|---|---|---|---|
Opening balance | Increases due to origination and acquisition | Decrease due to derecognition repayments and disposals | Changes due to change in credit risk (net) | Decrease in allowance account due to write-offs | Closing balance | |
Allowances | ||||||
Cash and balances held with central banks | - | - | - | - | - | - |
Amounts due from banks | 0 | 0 | 0 | 0 | - | 0 |
Financial assets at fair value through other comprehensive income | 0 | 0 | 0 | 0 | - | 0 |
Interest-bearing securities at amortised cost | 1 | 0 | 0 | -1 | - | 0 |
Loans and advances | 89 | 0 | -25 | 2 | -9 | 57 |
90 | 0 | -25 | 1 | -9 | 57 | |
Provision | ||||||
Off-balance sheet commitments | 6 | 0 | 0 | -5 | - | 1 |
For the details on other items, please refer to the notes to the consolidated financial statements.
Events after the balance sheet date
There are no events after the balance sheet date to report that require adjustments to the figures or disclosure in the financial statements.
The Hague, 20 March 2026
Executive Board
Philippine Risch (CEO), statutory director
Olivier Labe (CFO), statutory director
Irene van Oostwaard (CRO), statutory director
Supervisory Board
Huub Arendse, Chair
Femke de Vries, Vice-chair
Karin Bergstein
Marja Elsinga
Marlies van Elst
Leonard Geluk
Constant Korthout
10.3 Other information
Independent auditor’s report
To: the general meeting and the supervisory board of BNG Bank N.V.
Report on the financial statements 2025
Our opinion
In our opinion, the financial statements of BNG Bank N.V. (‘the Company’) give a true and fair view of the financial position of the Company and the Group (the Company together with its subsidiary) as at 31 December 2025, and of its result and its cash flows for the year then ended in accordance with IFRS Accounting Standards as adopted by the European Union (‘EU’) and with Part 9 of Book 2 of the Dutch Civil Code.
What we have audited
We have audited the accompanying financial statements 2025 of BNG Bank N.V., 's-Gravenhage. The financial statements comprise the consolidated financial statements of the Group and the company financial statements.
The financial statements comprise:
the consolidated and company balance sheet as at 31 December 2025;
the following statements for 2025: the consolidated and company income statement, the consolidated and company statements of comprehensive income, changes in equity and cash flows; and
the notes to the financial statements, including material accounting policy information and other explanatory information.
The financial reporting framework applied in the preparation of the financial statements is IFRS Accounting Standards as adopted by the EU and the relevant provisions of Part 9 of Book 2 of the Dutch Civil Code.
The basis for our opinion
We conducted our audit in accordance with Dutch law, including the Dutch Standards on Auditing. We have further described our responsibilities under those standards in the section ‘Our responsibilities for the audit of the financial statements’ of our report.
We believe that the audit evidence we have obtained is sufficient and appropriate to provide a basis for our opinion.
Independence
We are independent of BNG Bank N.V. in accordance with the European Union Regulation on specific requirements regarding statutory audit of public-interest entities, the ‘Wet toezicht accountantsorganisaties’ (Wta, Audit firms supervision act), the ‘Verordening inzake de onafhankelijkheid van accountants bij assuranceopdrachten’ (ViO, Code of Ethics for Professional Accountants, a regulation with respect to independence) and other relevant independence regulations in the Netherlands. Furthermore, we have complied with the ‘Verordening gedrags- en beroepsregels accountants’ (VGBA, Dutch Code of Ethics).
Our audit approach
We designed our audit procedures with respect to the key audit matters, fraud and going concern, and the matters resulting from that, in the context of our audit of the financial statements as a whole and in forming our opinion thereon. Therefore, we do not provide separate opinions or conclusions on information in support of our opinion, such as our findings and observations related to individual key audit matters and the audit approach to address fraud risk and going concern.
Overview and context
BNG Bank N.V. is a credit institution licensed in the Netherlands. Its main activity is providing financing to the Dutch public sector and semi-public domain. The Group is comprised of one component and therefore we considered our group audit scope and approach as set out in the section ‘The scope of our group audit’.
As part of designing our audit, we determined materiality and assessed the risks of material misstatement in the financial statements. In particular, we considered where the executive board made important judgements, for example, in respect of significant accounting estimates that involved making assumptions and considering future events that are inherently uncertain. In these considerations, we paid attention to, amongst others, the assumptions underlying the physical and transition risk related to climate change.
In the section ‘Accounting estimates and judgements’ of the financial statements, the Company describes the areas of judgement in applying accounting policies and the key sources of estimation uncertainty. Given the significant estimation uncertainty and the related higher inherent risks of material misstatement in the impairment of loans and advances and the valuation of complex financial instruments, we considered these matters as key audit matters as set out in the section ‘Key audit matters’ of this report.
The reliability of information processing is significant to the company’s operational, regulatory and financial reporting processes. We identified a key audit matter relating to the design and effectiveness of IT general controls due to ongoing IT projects as well as deficiencies identified in certain IT general controls, specifically relating to access management (including privileged access rights), change management, and IT security controls, for which remedial control actions were performed by management.
The Company assessed the possible effects of climate change and its plans to meet the net zero commitments on its financial position, refer to sections ‘1.5 Stakeholder engagement and value creation and ‘2 Building social and green added value in the annual report. The Company concluded that climate change mainly impacts credit risk. We discussed the Company’s assessment and governance thereof with the executive board and audit committee and evaluated the potential impact on the financial position including underlying assumptions and estimates applied in connection with the impairment of loans and advances. The expected effects of climate change are not considered a separate key audit matter, but we took this into account as part of the key audit matter on impairment of loans and advances.
Other areas of focus that were not considered to be key audit matters were revenue recognition, compliance with laws and regulations, hedge accounting, and the restructuring provision. Though these are areas of focus in our audit, they were not the matters of most significance in the audit of the financial statements of the current period.
We ensured that the audit team included the appropriate skills and competences which are needed for the audit of a bank. We therefore included experts and specialists in the areas of amongst others IT and valuation in our team.
The outline of our audit approach was as follows:
Materiality: overall materiality: €16.5 million (2024: €20.1 million);
Audit scope: we used our professional judgement to determine overall materiality. As a basis for our judgement, we used 5% of average profit before tax over 2023, 2024 and 2025. We decided to use the average of three years due to the decrease in profit before tax in 2025;
Key audit matters:
Impairment of loans and advances;
Valuation of complex financial instruments; and
Design and effectiveness of IT general controls.
Materiality
The scope of our audit was influenced by the application of materiality, which is further explained in the section ‘Our responsibilities for the audit of the financial statements’.
Based on our professional judgement we determined certain quantitative thresholds for materiality, including the overall materiality for the financial statements as a whole as set out in the table below. These, together with qualitative considerations, helped us to determine the nature, timing and extent of our audit procedures on the individual financial statement line items and disclosures and to evaluate the effect of identified misstatements, both individually and in aggregate, on the financial statements as a whole and on our opinion.
Overall group materiality: €16.5 million (2024: €20.1 million).
Basis for determining materiality: We used our professional judgement to determine overall materiality. As a basis for our judgement, we used 5% of average profit before tax over 2023, 2024 and 2025. We decided to use the average of three years due to the decrease in profit before tax in 2025.
Rationale for benchmark applied: We used profit before tax as the primary benchmark, a generally accepted auditing practice, based on our analysis of the common information needs of the users of the financial statements. On this basis, we believe that profit before tax is the most relevant metric for the financial performance of the Company.
We also take misstatements and/or possible misstatements into account that, in our judgement, are material for qualitative reasons.
We agreed with the supervisory board that we would report to them any misstatement identified during our audit above €0.8 million (2024: €1 million) as well as misstatements below that amount that, in our view, warranted reporting for qualitative reasons.
The scope of our group audit
BNG Bank N.V. is the parent company of BNG Gebiedsontwikkeling B.V. as its 100% subsidiary. The financial information of this group is included in the consolidated financial statements of BNG Bank N.V.
We are responsible for the identification and assessment of the risks of material misstatement of the financial statements of the group, including those with respect to the consolidation process. Based on our risk assessment, we tailored the scope of our audit to ensure that we, in aggregate, performed sufficient work on the financial statements to enable us to provide an opinion on the financial statements as a whole.
The group engagement team performed the audit work on the group consolidation and financial statement disclosures.
The Company has outsourced a part of its IT activities to a service organisation. In our assessment of the IT landscape, we made use of the ISAE 3402 type 2 report of the service organisation. We held a planning meeting with the ISAE 3402 service provider’s auditor, discussed progress and interim findings of the audit and, finally, evaluated the ISAE 3402 type 2 assurance report once it was finalised. Based on these procedures performed, we conclude that in the context of our audit of the financial statements of BNG Bank N.V., we could rely on the ISAE 3402 type 2 assurance report of this service organisation.
By performing the procedures outlined above, we have been able to obtain sufficient and appropriate audit evidence on the Group’s financial information, to provide a basis for our opinion on the financial statements.
Audit approach fraud risks
We identified and assessed the risks of material misstatements in the financial statements due to fraud. During our audit we obtained an understanding of the Company and its environment and the components of the internal control system. This included the executive board’s risk assessment process, the executive board’s process for responding to the risks of fraud and monitoring the internal control system and how the supervisory board exercised oversight, as well as the outcomes. We refer to section '5.2 Compliance' of the annual report for management’s fraud risk assessment.
We evaluated the design and implementation of relevant aspects of the internal control system with respect to the risks of material misstatements due to fraud and in particular the fraud risk assessment, as well as the code of conduct, whistleblower procedures, and incident registration. We evaluated the design and the implementation and, where considered appropriate, tested the operating effectiveness of internal controls designed to mitigate fraud risks.
We performed inquiries with a selection of members of the executive board to evaluate their fraud awareness, the internal control environment in relation to fraud, the ‘tone at the top’ and entity-level controls.
We asked members of the executive board as well as internal audit, legal and compliance departments and the supervisory board whether they were aware of any actual or suspected fraud. This did not result in signals of actual or suspected fraud that may lead to a material misstatement.
As part of our process of identifying fraud risks, we evaluated fraud risk factors with respect to financial reporting fraud, misappropriation of assets and bribery and corruption. We evaluated whether these factors indicate that a risk of material misstatement due to fraud is present.
We identified the following fraud risks and performed the following specific procedures:
Identified fraud risks | Our audit work and observations |
|---|---|
The risk of management override of controls | We evaluated the design and implementation of the internal control system in the processes of generating and processing journal entries, making estimates, and monitoring projects. We also paid specific attention to the access safeguards in the environment and the possibility that this will lead to violations of the segregation of duties. |
The risk of fraud in revenue recognition for the unrealised results of the valuation of the complex financial instruments | We performed procedures to address this risk, including evaluation of the design and effectiveness of relevant internal controls and testing the appropriateness of the valuation methodologies, inputs and assumptions applied in the valuation of financial instruments. We refer to the key audit matter ‘valuation of financial instruments’ for more information on our audit work performed and observations. |
We incorporated an element of unpredictability in our audit. We reviewed lawyer’s letters and correspondence with regulators. During the audit, we remained alert to indications of fraud. Furthermore, we considered the outcome of our other audit procedures and evaluated whether any findings were indicative of fraud.
Audit approach with respect to non-compliance with laws and regulations
There is an industry risk that emerging compliance areas have not been identified and/or addressed by the executive board for financial statement purposes. This includes the consideration whether there is a need for the recognition of a provision or a contingent liability disclosure on the future outcome of legal or regulatory processes. The primary responsibility for the prevention and the detection of non-compliance with laws and regulations lies with the executive board with the oversight of thesupervisory board.
The objectives of our audit with respect to non-compliance with laws and regulations are:
to identify and assess the risk of material misstatement of the financial statements due to non‑compliance with laws and regulations; and
to obtain reasonable assurance that the financial statements, taken as a whole, are free from material misstatement, whether due to fraud or error when considering the applicable legal and regulatory framework.
In line with Dutch Standard 250, we made in our audit approach a distinction between those laws and regulations that:
have a direct effect on the determination of material amounts and disclosures in the financial statements. For this category, we obtained amongst others audit evidence regarding compliance with the provision of those laws and regulations; and
do not have a direct effect on the determination of material amounts and disclosures in the financial statements, but where compliance may be fundamental to the operating aspects of the business. Those include amongst others the Group’s ability to continue its business or to avoid material penalties (e.g. Anti-money laundering and anti-terrorist financing act (‘Wwft’)). For this category, we inquired with members of the executive board, the supervisory board and the compliance department as to whether the Group is compliant with such laws and regulations and inspected correspondence, if any, with relevant licensing and regulatory authorities.
Audit approach going concern
As disclosed in the sections ‘Critical accounting principles applied for valuation and the determination of the result’, 'Liquidity and funding risk' and 'Capital and solvency' of the financial statements, the executive board performed its assessment of the Company’s ability to continue as a going concern for at least 12 months from the date of preparation of the financial statements and has not identified events or conditions that may cast significant doubt on the Company’s ability to continue as a going concern (hereafter: going-concern risks).
Our procedures to evaluate the executive board’s going-concern assessment included, amongst others:
considering whether the executive board’s going-concern assessment included all relevant information of which we were aware as a result of our audit and inquiring with the executive board regarding the executive board’s most important assumptions underlying its going-concern assessment;
understanding the Group’s medium-term plan including the Group’s funding plan, specifically for the next twelve months;
understanding and evaluating the Group’s stress testing of liquidity and regulatory capital requirements, including severity of the stress scenarios that were applied;
analysing whether the current and the required financing has been secured to enable the continuation of the entirety of the entity’s operations, including compliance with relevant covenants; and
performing inquiries of the executive board as to its knowledge of going-concern risks beyond the period of the executive board’s assessment.
Based on our procedures performed and evidence obtained, we concluded that the executive board’s use of the going-concern basis of accounting is appropriate, and that no material uncertainty exists related to events or conditions that may cast significant doubt on the entity’s ability to continue as a going concern.
Key audit matters
Key audit matters are those matters that, in our professional judgement, were of most significance in the audit of the financial statements. We have communicated the key audit matters to the supervisory board. The key audit matters are not a comprehensive reflection of all matters identified by our audit and that we discussed. In this section, we described the key audit matters and included a summary of the audit procedures we performed on those matters.
Key audit matter | Our audit work and observations |
|---|---|
Impairment of loans and advances | Control design and operating effectiveness |
Refer to the accounting principle ‘Impairment of financial assets’, note 31 ‘impairment’ and note 38 ‘Impairment of financial assets and off-balance sheet commitments’ in the consolidated financial statements. | We evaluated the design and tested the operating effectiveness of relevant controls including: |
Valuation of complex financial instruments | Control design and operating effectiveness |
Refer to the accounting policy ‘fair value of financial instruments’ and the disclosure note ‘fair value of financial instruments’ in the consolidated financial statements. | We assessed the design and tested the operating effectiveness of internal controls over the valuation process including management’s validation of applied models, selection of assumptions and controls over data inputs including trade execution and security set-up within the administration systems. |
Design and effectiveness of IT general controls | |
Refer to the section ‘5.4 IT and cybersecurity’ of the annual report. | We focused on the ITGCs to the extent relevant for the purpose of our audit of the financial statements. Our procedures included evaluating and testing the design and operating effectiveness of certain controls over the continued integrity of the IT systems, focusing on: |
Report on the other information included in the annual report
The annual report contains other information. This includes all information in the annual report in addition to the financial statements and our auditor’s report thereon.
Based on the procedures performed as set out below, we conclude that the other information:
is consistent with the financial statements and does not contain material misstatements; and
contains all the information regarding the directors’ report and the other information that is required by Part 9 of Book 2 of the Dutch Civil Code.
We have read the other information. Based on our knowledge and the understanding obtained in our audit of the financial statements or otherwise, we have considered whether the other information contains material misstatements.
By performing our procedures, we comply with the requirements of Part 9 of Book 2 and section 2:135b subsection 7 of the Dutch Civil Code and the Dutch Standard 720. The scope of such procedures was substantially less than the scope of those procedures performed in our audit of the financial statements.
The executive board are responsible for the preparation of the other information, including the directors’ report and the other information in accordance with Part 9 of Book 2 of the Dutch Civil Code.
Report on other legal and regulatory requirements and ESEF
Our appointment
We were appointed as auditors of BNG Bank N.V. on 28 November 2014 by the supervisory board. This followed the passing of a resolution by the shareholders at the annual general meeting held on 23 April 2015. Our appointment has been renewed annually by shareholders and now represents a total period of uninterrupted engagement of 10 years.
European Single Electronic Format (ESEF)
BNG Bank N.V. has prepared the annual report in ESEF. The requirements for this are set out in the Delegated Regulation (EU) 2019/815 with regard to regulatory technical standards on the specification of a single electronic reporting format (hereinafter: the RTS on ESEF).
In our opinion, the annual report prepared in XHTML format, including the marked-up consolidated financial statements, as included in the reporting package by BNG Bank N.V., complies in all material respects with the RTS on ESEF.
The executive board is responsible for preparing the annual report, including the financial statements in accordance with the RTS on ESEF, whereby the executive board combines the various components into a single reporting package.
Our responsibility is to obtain reasonable assurance for our opinion whether the annual report in this reporting package complies with the RTS on ESEF.
We performed our examination in accordance with Dutch law, including Dutch Standard 3950N ‘Assuranceopdrachten inzake het voldoen aan de criteria voor het opstellen van een digitaal verantwoordingsdocument’ (assurance engagements relating to compliance with criteria for digital reporting).
Our examination included amongst others:
Obtaining an understanding of the entity’s financial reporting process, including the preparation of the reporting package.
Identifying and assessing the risks that the annual report does not comply in all material respects with the RTS on ESEF and designing and performing further assurance procedures responsive to those risks to provide a basis for our opinion, including:
obtaining the reporting package and performing validations to determine whether the reporting package containing the Inline XBRL instance document and the XBRL extension taxonomy files have been prepared in accordance with the technical specifications as included in the RTS on ESEF;
examining the information related to the consolidated financial statements in the reporting package to determine whether all required mark-ups have been applied and whether these are in accordance with the RTS on ESEF.
No prohibited non-audit services
To the best of our knowledge and belief, we have not provided prohibited non-audit services as referred to in article 5(1) of the European Regulation on specific requirements regarding statutory audit of public-interest entities.
Services rendered
The services, in addition to the audit, that we have provided to the Company for the period to which our statutory audit relates, are disclosed in note 34 to the financial statements.
Responsibilities for the financial statements and the audit
Responsibilities of the executive board and the supervisory board for the financial statements
The executive board is responsible for:
the preparation and fair presentation of the financial statements in accordance with IFRS Accounting Standards as adopted by the EU and Part 9 of Book 2 of the Dutch Civil Code; and for
such internal control as the executive board determines is necessary to enable the preparation of the financial statements that are free from material misstatement, whether due to fraud or error.
In preparing the financial statements, the executive board is responsible for assessing the Company’s ability to continue as a going concern. Based on the financial reporting frameworks mentioned, the executive board should prepare the financial statements using the going-concern basis of accounting unless the executive board either intends to liquidate the Company or to cease operations or has no realistic alternative but to do so. The executive board should disclose in the financial statements any event and circumstances that may cast significant doubt on the Company’s ability to continue as a going concern.
The supervisory board is responsible for overseeing the Company’s financial reporting process.
Our responsibilities for the audit of the financial statements
Our responsibility is to plan and perform an audit engagement in a manner that allows us to obtain sufficient and appropriate audit evidence to provide a basis for our opinion. Our objectives are to obtain reasonable assurance about whether the financial statements as a whole are free from material misstatement, whether due to fraud or error and to issue an auditor’s report that includes our opinion. Reasonable assurance is a high but not absolute level of assurance and is not a guarantee that an audit conducted in accordance with the Dutch Standards on Auditing will always detect a material misstatement when it exists. Misstatements may arise due to fraud or error. They are considered material if, individually or in the aggregate, they could reasonably be expected to influence the economic decisions of users taken on the basis of the financial statements.
Materiality affects the nature, timing and extent of our audit procedures and the evaluation of the effect of identified misstatements on our opinion.
We have exercised professional judgement and have maintained professional scepticism throughout the audit in accordance with Dutch Standards on Auditing, ethical requirements and independence requirements. Our audit consisted, among other things of the following:
Identifying and assessing the risks of material misstatement of the financial statements, whether due to fraud or error, designing and performing audit procedures responsive to those risks, and obtaining audit evidence that is sufficient and appropriate to provide a basis for our opinion. The risk of not detecting a material misstatement resulting from fraud is higher than for one resulting from error, as fraud may involve collusion, forgery, intentional omissions, misrepresentations, or intentional override of internal control.
Obtaining an understanding of internal control relevant to the audit in order to design audit procedures that are appropriate in the circumstances, but not for the purpose of expressing an opinion on the effectiveness of the Company’s internal control.
Evaluating the appropriateness of accounting policies used and the reasonableness of accounting estimates and related disclosures made by the executive board.
Concluding on the appropriateness of the executive board’s use of the going-concern basis of accounting, and based on the audit evidence obtained, concluding whether a material uncertainty exists related to events and/or conditions that may cast significant doubt on the Company’s ability to continue as a going concern. If we conclude that a material uncertainty exists, we are required to draw attention in our auditor’s report to the related disclosures in the financial statements or, if such disclosures are inadequate, to modify our opinion. Our conclusions are based on the audit evidence obtained up to the date of our auditor’s report and are made in the context of our opinion on the financial statements as a whole. However, future events or conditions may cause the Company to cease to continue as a going concern.
Evaluating the overall presentation, structure and content of the financial statements, including the disclosures, and evaluating whether the financial statements represent the underlying transactions and events in a manner that achieves fair presentation.
We are responsible for planning and performing the group audit to obtain sufficient appropriate audit evidence regarding the financial information of the entities within the group as a basis for forming an opinion on the financial statements.
We communicate with the supervisory board and audit committee regarding, among other matters, the planned scope and timing of the audit and significant audit findings, including any significant deficiencies in internal control that we identify during our audit. In this respect, we also issue an additional report to the audit committee in accordance with article 11 of the EU Regulation on specific requirements regarding statutory audit of public-interest entities. The information included in this additional report is consistent with our audit opinion in this auditor’s report.
We provide the supervisory board with a statement that we have complied with relevant ethical requirements regarding independence, and to communicate with them all relationships and other matters that may reasonably be thought to bear on our independence, and where applicable, related actions taken to eliminate threats or safeguards applied.
From the matters communicated with the supervisory board, we determine those matters that were of most significance in the audit of the financial statements of the current period and are therefore the key audit matters. We describe these matters in our auditor’s report unless law or regulation precludes public disclosure about the matter or when, in extremely rare circumstances, we determine that a matter should not be communicated in our report because the adverse consequences of doing so would reasonably be expected to outweigh the public interest benefits of such communication.
Amsterdam, 20 March 2026
PricewaterhouseCoopers Accountants N.V.
Original has been signed by M.S. de Bruin RA
Assurance report of the independent auditor
To: the executive board and the supervisory board van BNG Bank N.V.
Assurance report with limited assurance on the sustainability information 2025
Our conclusion
Based on our procedures performed and the assurance information obtained, nothing has come to our attention that causes us to believe that the sustainability information included in the Annual report 2025 of BNG Bank N.V. (the Company) does not present fairly, in all material respects:
the policy with regard to sustainability; and
the business operations, events and achievements in that area for the year ended 31 December 2025, in accordance with the Sustainability Reporting Standards of the Global Reporting Initiative (GRI) and the applied supplemental reporting criteria as included in the section ‘Reporting criteria’ of our report.
What we have reviewed
We have reviewed the sustainability information, included in the following sections of the Annual report 2025 for 2025 (hereafter: the sustainability information):
1. Bank of added value
1.1 Social progress
1.3 Strategy
1.5 Stakeholder engagement and value creation
2. Jointly creating environmental and social added value
3.1 Solid foundation in money and capital markets
4. CO2e-emissions
5.1 Employees
9.1 Reporting principles
Claims made in the paragraphs of the annual report referenced above that are non-financial by nature and that are not in the scope of the audit of the financial statements.
Targets and achievements:
Scoring percentage of long term lending volume in client sectors Public Sector, Healthcare and Education
BNG's share in new lending to housing associations in the past year
Financed emissions, scope 1 and 2
Male/female ratio, senior management
Male/female ratio, all staff
Sickness absense rate;
This review is aimed at obtaining a limited level of assurance.
The basis for our conclusion
We conducted our review in accordance with Dutch law, including Dutch Standard 3810N ‘Assuranceopdrachten inzake duurzaamheidsverslaggeving’ (assurance engagements relating to sustainability reporting), which is a specific Dutch Standard that is based on the International Standard on Assurance Engagements (ISAE) 3000 ‘Assurance engagements other than audits or reviews of historical financial information’. Our responsibilities under this standard are further described in the section ‘Our responsibilities for the review of the sustainability information’ of our report.
We believe that the assurance evidence we have obtained is sufficient and appropriate to provide a basis for our conclusion.
Independence and quality management
We are independent of BNG Bank N.V. in accordance with the ‘Verordening inzake de onafhankelijkheid van accountants bij assuranceopdrachten’ (ViO - Code of ethics for professional accountants, a regulation with respect to independence). Furthermore, we have complied with the ‘Verordening gedrags- en beroepsregels accountants’ (VGBA - Dutch Code of ethics for professional accountants, a regulation with respect to rules of professional conduct).
PwC applies the applicable quality management requirements pursuant to the ‘Nadere voorschriften kwaliteitsmanagement’ (NVKM, regulations for quality management) and the International Standard on Quality Management (ISQM) 1, and accordingly maintains a comprehensive system of quality management including documented policies and procedures regarding compliance with ethical requirements, professional standards and other relevant legal and regulatory requirements.
Reporting criteria
The reporting criteria applied for the preparation of the sustainability information are the Sustainability Reporting Standards of the Global Reporting Initiative (GRI) and the applied supplemental reporting criteria as disclosed in section 9.1 'Reporting principles', section 9.2 'Supplementary information on material topics' and section 9.3 'Glossary' of the Annual report 2025.
The sustainability information is prepared in accordance with the GRI Standards. The GRI Standards applied are listed in the GRI Content Index, as published on the company’s website.
The absence of an established practice on which to draw, to evaluate and measure the sustainability information allows for different, but acceptable, measurement techniques and can affect comparability between entities, and over time.
Consequently, the sustainability information needs to be read and understood together with the reporting criteria applied.
Emphasis of matter
We draw attention to the section 'CO2e emissions associated with the Company's loan portfolio and 'Development in CO2e emissions associated with loan portfolio' in section 4 'CO2e emissions' in the sustainability information, which describes the quantitative metrics and monetary amounts for the calculated CO2e emissions related to the Company's loan portfolio (the financed emissions) that are subject to a high level of measurement uncertainty and discloses information about the sources of measurement uncertainty and the assumptions, approximations and judgements the Company has made in measuring these, in compliance with the applied supplemental reporting criteria, as disclosed in section 9.1 ‘Reporting principles’, section 9.2 paragraph ‘Supplementary information on material topics’ and ‘9.3 Glossary’ of the annual report. Our conclusion is not modified in respect of this matter.
Limitations to the scope of our review
The sustainability information includes prospective information such as expectations on ambitions, strategy, plans, expectations, and estimates and risk assessments. Inherent to this prospective information, the actual future results are uncertain, and are likely to differ from these expectations. These differences may be material. We do not provide any assurance on the assumptions and achievability of prospective information.
In the sustainability information references are made to external sources or websites. The information on these external sources or websites is not part of the sustainability information reviewed by us. We therefore do not provide assurance on this information.
The quantification of Greenhouse Gas emissions is subject to inherent limitations because of evolving methods and knowledge underlying emissions factors and other assumptions, including for those sourced from third parties.
Responsibilities regarding the sustainability information and the related review
Responsibilities of the executive board and the supervisory board for the sustainability information
The executive board of BNG Bank N.V. is responsible for the preparation and fair presentation of the sustainability information in accordance with the reporting criteria as included in section ‘Reporting criteria’, including applying the reporting criteria, the identification of stakeholders and the definition of material matters. The executive board is also responsible for selecting and applying the reporting criteria and for determining that these reporting criteria are suitable for the legitimate information needs of the intended stakeholders, considering applicable law and regulations related to reporting. The choices made by the executive board regarding the scope of the sustainability information and the reporting policy are summarised in section 9.1 'Reporting principles' of the Annual report 2025.
Furthermore, the executive board is responsible for such internal control as the executive board determines is necessary to enable the preparation of the sustainability information that is free from material misstatement, whether due to fraud or error.
The supervisory board is responsible for overseeing the Company’s reporting process on the sustainability information.
Our responsibilities for the review of the sustainability information
Our responsibility is to plan and perform the review engagement in a manner that allows us to obtain sufficient and appropriate assurance evidence to provide a basis for our conclusion.
Our objectives are to obtain a limited level of assurance, as appropriate, about whether the sustainability information is free from material misstatements and to issue a limited assurance conclusion in our report. The procedures vary in nature and timing from, and are less in extent than for, a reasonable assurance engagement. The level of assurance obtained in a review (limited assurance) is therefore substantially less than the assurance obtained in an audit (reasonable assurance) in relation to both the risk assessment procedures, including an understanding of internal control, and the procedures performed in response to the assessed risks.
Procedures performed
We have exercised professional judgement and have maintained professional skepticism throughout the review, in accordance with the Dutch Standard 3810N, ethical requirements and independence requirements. Our procedures included, amongst other things of the following:
Performing an analysis of the external environment and obtaining an understanding of relevant sustainability themes and issues and the characteristics of the company.
Evaluating the appropriateness of the reporting criteria applied, their consistent application and related disclosures in the sustainability information. This includes the evaluation of the company’s materiality assessment and the reasonableness of estimates made by the executive board.
Through inquiries, obtaining a general understanding of the control environment, the reporting processes, and the information systems and the entity’s risk assessment process relevant to the preparation of the sustainability information, without obtaining assurance evidence about the implementation or testing the operating effectiveness of controls.
Identifying areas of the sustainability information where misleading or unbalanced information or a material misstatement, whether due to fraud or error, is likely to arise. Designing and performing further assurance procedures aimed at determining the plausibility of the sustainability information responsive to this risk analysis. These procedures consisted among others of:
Inquiring of management (and/or relevant staff) at corporate (and business/division/cluster/local) level responsible for the sustainability strategy, policy and results.
Inquiring of relevant staff responsible for providing the information for, carrying out internal control procedures on, and consolidating the data in the sustainability information.
Obtaining assurance evidence that the sustainability information reconciles to underlying records of the company.
Reviewing, on a sample basis, relevant internal and external documentation.
Taking into account the data and trends in the sustainability information.
With regards to the calculated CO2e emissions related to the Company’s loan portfolio (the financed emissions) as at 31 December 2024 based on the PCAF-methodology we have performed assurance procedures on the application of the methodology, not on the actual emissions itself. Review procedures performed include:
Assessed the reasonableness of the scope of the measurement and the suitability of the methodology chosen;
Interviewed the management expert of the Company for a key understanding of the calculated CO2e emissions of the loan portfolio;
Reviewed the final report of the measurement containing a description of the calculation models, assumptions used and the outcome(s) of the calculated CO2 emissions;
Obtaining a key understanding of the calculation model;
Reviewed calculations to determine information as included in the Sustainability Statements could be based on assumptions and sources from third parties that include information about, among others, value chain and information collected from actors in the value chain, when appropriate;
Tested the relevant assumptions on suitability, reasonableness, completeness and relevance. We have not performed procedures on the content of these assumptions and these external sources, other than evaluating the suitability and plausibility of these assumptions and sources from third parties used;
Reconciling a sample of emissions factors, sector related emission data, modelled data and client data to the external sources; and
Reconciling the loan portfolio balance as at 31 December 2024 to the underlying financial administration.
Reconciling the relevant financial information to the financial statements.
Considering the consistency of the sustainability information with information in the annual report, which is not included in the scope of our review.
Considering the overall presentation, structure and balanced content of the sustainability information.
Considering whether the sustainability information as a whole, including the sustainability matters and disclosures, is clearly and adequately disclosed in accordance with the applicable reporting criteria.
We communicate with the supervisory board regarding, among other matters, the planned scope and timing of the review and significant findings that we identify during our review.
Amsterdam, 20 March 2026
PricewaterhouseCoopers Accountants N.V.
Original has been signed by M.S. de Bruin RA
Stipulations of the articles of association concerning profit appropriation
Article 20
Profits shall be distributed after adoption by the general meeting of shareholders of the annual accounts showing that this is permissible.
The company may make payments to the shareholders from the profits available for distribution only in so far as its equity capital exceeds the amounts of the paid-up part of the capital plus the reserves which have to be kept by law.
Subject to the prior approval of the Supervisory Board, the Board shall be authorised to add all or part of the profits to the general reserve. Any profits remaining thereafter shall be put at the disposal of the general meeting.
The general meeting may distribute a profit from a reserve available for distribution exclusively on the basis of a proposal submitted by the Board and approved by the Supervisory Board.
Objectives as defined in the Articles of Association
Object
Article 2
The object of the company shall be to conduct the business of banker on behalf of public authorities.
In the context of its object as referred to in paragraph 1 the company shall engage, inter alia, in taking in and lending moneys, granting credits in other ways, providing guarantees, arranging the flow of payments, conducting foreign exchange transactions, acting as adviser and broker in the issue of and trade in securities, and keeping, managing and administering securities and other assets for third parties, as well as to incorporate and to participate in other enterprises and/or legal persons, whose object is connected with or conducive to any of the foregoing. The company shall be empowered to perform all acts which may be directly or indirectly conducive to its object.
The term public authorities as referred to in paragraph 1 means:
municipalities and other legal persons in the Netherlands under public law as referred to in Article 1, paragraphs 1 and 2, of Book 2 of the Civil Code;
the European Communities and other bodies possessing legal personality to which part of the function of the European Communities has been entrusted pursuant to the treaties establishing the European Communities;
Member States of the European Communities and other bodies possessing legal personality to which part of the administrative function of such a Member State has been entrusted pursuant to the law of that Member State;
legal persons under private law;
half or more of whose managing directors are appointed directly or indirectly by one or more of the bodies referred to in a, b and c of this paragraph; and/or
half or more of whose share capital is provided directly or indirectly by one or more of the bodies referred to in a, b and c; and/or
half or more of the income side of whose operating budget is provided or secured directly or indirectly by one or more of the bodies referred to in a, b and c on the basis of a scheme, bye-law or law adopted by one or more of such bodies; and/or
whose operating budget is adopted or approved directly or indirectly by one or more of the bodies referred to in a, b and c on the basis of a scheme, bye-law or law adopted by one or more of such bodies; and/or
whose obligations towards the company are guaranteed directly or indirectly by one or more of the bodies referred to in a, b and c or will be guaranteed pursuant to a scheme, bye-law or law adopted by one or more of such bodies, for which purpose obligations include non-guaranteed obligations resulting from prefinancing or other financing which, after novation, will create obligations that will be guaranteed by one or more of such bodies pursuant to a scheme, bye-law or law adopted by one or more of such bodies; and/or
who execute a part of the governmental function pursuant to a scheme, bye-law or law adapted by one or more of the bodies referred to in a, b and c.
Colophon
Editorial: BNG and RRED Communications
Design- and publication software: Tangelo Software B.V.
Design: Public Cinema
March 2026
BNG Bank N.V.
P.O. Box 30305
2500 GH The Hague
The Netherlands
+31 (0)70 - 3750 750
bngbank.com
BNG is a trade name of BNG Bank N.V., with its registered office in The Hague, The Netherlands, and registered with the Dutch Chamber of Commerce under number 27008387.